Article

Dynamic Impact and Vibration Response Analysis of Steel–UHPC Composite Containment Under Aircraft Impact

Nuclear and Radiation Safety Center, Ministry of Ecology and Environment, Beijing 100082, China
*
Author to whom correspondence should be addressed.
Buildings 2025, 15(17), 3130; https://doi.org/10.3390/buildings15173130
Submission received: 8 August 2025 / Revised: 27 August 2025 / Accepted: 28 August 2025 / Published: 1 September 2025

Abstract

The growing concerns over nuclear power plant safety in the wake of extreme impact events have highlighted the need for containment structures with superior resistance to large commercial aircraft strikes. Conventional reinforced concrete containment has shown limitations in withstanding high-mass and high-velocity impacts, posing potential risks to structural integrity and operational safety. Addressing this challenge, this study focuses on the dynamic impact resistance and vibration behavior of steel–ultra-high-performance concrete (S-UHPC) composite containment, aiming to enhance nuclear facility resilience under beyond-design-basis aircraft impact scenarios. Validated finite element models in LS-DYNA were developed to simulate impacts from four representative large commercial aircraft types, considering variations in wall and steel plate thicknesses, UHPC grades, and soil–structure interaction conditions. Unlike existing studies that often focus on isolated parameters, this work conducts a systematic parametric analysis integrating multiple aircraft types, structural configurations, and foundation conditions, providing comprehensive insights into both global deformation and high-frequency vibration behavior. Comparative analyses with conventional reinforced concrete containment were performed, and floor response spectra were evaluated to quantify high-frequency vibration characteristics under different site conditions. The results show that S-UHPC containment reduces peak displacement by up to ~24% compared to reinforced concrete of the same thickness while effectively localizing core damage without through-thickness failure. In addition, aircraft impacts predominantly excite 90–125 Hz vibrations, with soft soil conditions amplifying acceleration responses by more than four times, underscoring the necessity of site-specific dynamic analysis in nuclear containment and equipment design.

1. Introduction

The terrorist attacks of 11 September 2001 raised substantial public concern about the deliberate impact of large commercial aircraft on critical infrastructure such as nuclear power plants (NPPs). In response, extensive research has been conducted by industry and academia to assess and enhance the impact resistance of NPP containment structures. In 2009, the U.S. Nuclear Regulatory Commission required that new NPP containments explicitly consider the effects of a large commercial aircraft impact. Similarly, China’s nuclear safety regulation HAF102 [1] specifies that, where site conditions make a malicious commercial aircraft impact plausible, such an impact shall be assessed as a beyond-design-basis event (BDBE). A corresponding technical policy was developed to guide assessment and regulatory review.
Reinforced concrete (RC) has long been the conventional choice for protective systems, and assessment methodologies are available in standards such as NEI 07-13 [2] and the Chinese technical policy. However, with increasing aircraft mass and impact velocities, conventional RC has exhibited limitations under extreme loading, prompting the exploration of alternatives with superior impact resistance. Steel plate–concrete (SC) composite walls—consisting of concrete infill sandwiched between two steel faceplates interconnected by tie-bars and shear studs—have emerged as promising candidates due to their superior performance under impulsive and impact loads (e.g., aircraft/missile impact and blast) [3,4,5]. In addition, the steel plates can serve as prefabricated formwork, facilitating modular construction and improving site productivity [6]. Representative studies include Sadiq et al. [7], who numerically compared RC and SC panels under full-scale aircraft impact and reported lower residual velocities and impact forces in SC; Kim et al. [8], who performed ten large-scale impact tests to investigate local resistance and failure of SC and RC walls (with SC outperforming RC of the same thickness and reinforcement due to the rear steel plate); and Liu and Han [9], who used LS-DYNA to analyze an SC shield building struck by a Boeing 767-200ER and concluded that SC can effectively prevent perforation. Their study highlighted the significant influences of impact velocity, aircraft mass, impact angle, tie-bar diameter, and steel plate thickness on structural deformation.
Ultra-high-performance concrete (UHPC) features high strength and enhanced durability [10,11,12] and is increasingly adopted as the core material in SC-type composite systems, as illustrated in Figure 1. Owing to its superior mechanical properties and dense microstructure, UHPC enables thinner and lighter modules that can sustain severe mechanical and environmental demands over the service life of NPPs [13,14,15,16,17]. Experimental and numerical studies on UHPC under high-velocity impact have expanded rapidly. For example, Riedel et al. [18] showed that UHPC reduces penetration depth and mitigates backside scabbing through fiber-bridging effects; Zhang et al. [19] performed aircraft engine–missile impact tests on UHP-SFRC/UHPC panels and evaluated local damage modes, panel deformations, and residual missile velocities; and Liu et al. [20] reviewed UHPC performance under high-velocity projectile impact, noting that many empirical penetration formulas tend to be non-conservative. Beyond material-level evidence, research on steel–UHPC (S-UHPC) composite systems has focused mainly on beams and slabs under static or small-scale dynamic loading. Lin et al. [21] highlighted the importance of interface connections for composite action in S-UHPC beams, while recent tests on double steel plate–UHPC sandwich slabs under low-velocity impact further underline connector and interface roles in failure-mode transitions [22]. Historical full-scale testing also indicates that F-4 Phantom impact at 215 m/s produces engine-dominated, short-duration high-frequency pulses that promote local punching and backside damage in concrete [23].
However, systematic studies on full-scale S-UHPC containment structures subjected to realistic large commercial aircraft impact remain sparse, and key aspects—such as aircraft-type diversity, impact velocity, variability in UHPC strength, and soil–structure interaction (SSI)—have been considered only to a limited extent. To address these gaps, this study systematically investigates the dynamic response and performance of S-UHPC containments under realistic aircraft impact scenarios using detailed finite element (FE) analyses in LS-DYNA. We evaluate impacts from four representative aircraft types: Airbus A340-300, Boeing 767-200, Airbus A380, and Boeing 747-400. First, detailed FE models of the aircraft and the S-UHPC containment are established and validated against published data. Then, missile–target interaction methods are applied to analyze structural responses across varying impact scenarios. For comparison, steel plate–concrete (SC) containments with conventional concrete cores are also studied. The critical parameters examined include impact velocity, UHPC core thickness and strength, steel plate thickness, and tie-bar spacing. We compare and discuss results such as global deformation, UHPC damage patterns, and steel plate stresses. Finally, the vibration response of the S-UHPC containment is analyzed considering SSI under realistic impact conditions. The soil conditions correspond to standardized site profiles for AP1000 plant designs [24], and recent reviews on SSI for nuclear facilities provide methodological guidance relevant to the modeling choices adopted herein [25]. This study aims to provide practical insights for the design and engineering application of S-UHPC containment systems in modern nuclear facilities.

2. FE Models of the Aircraft, S-UHPC Containment, and Validations

2.1. Aircraft

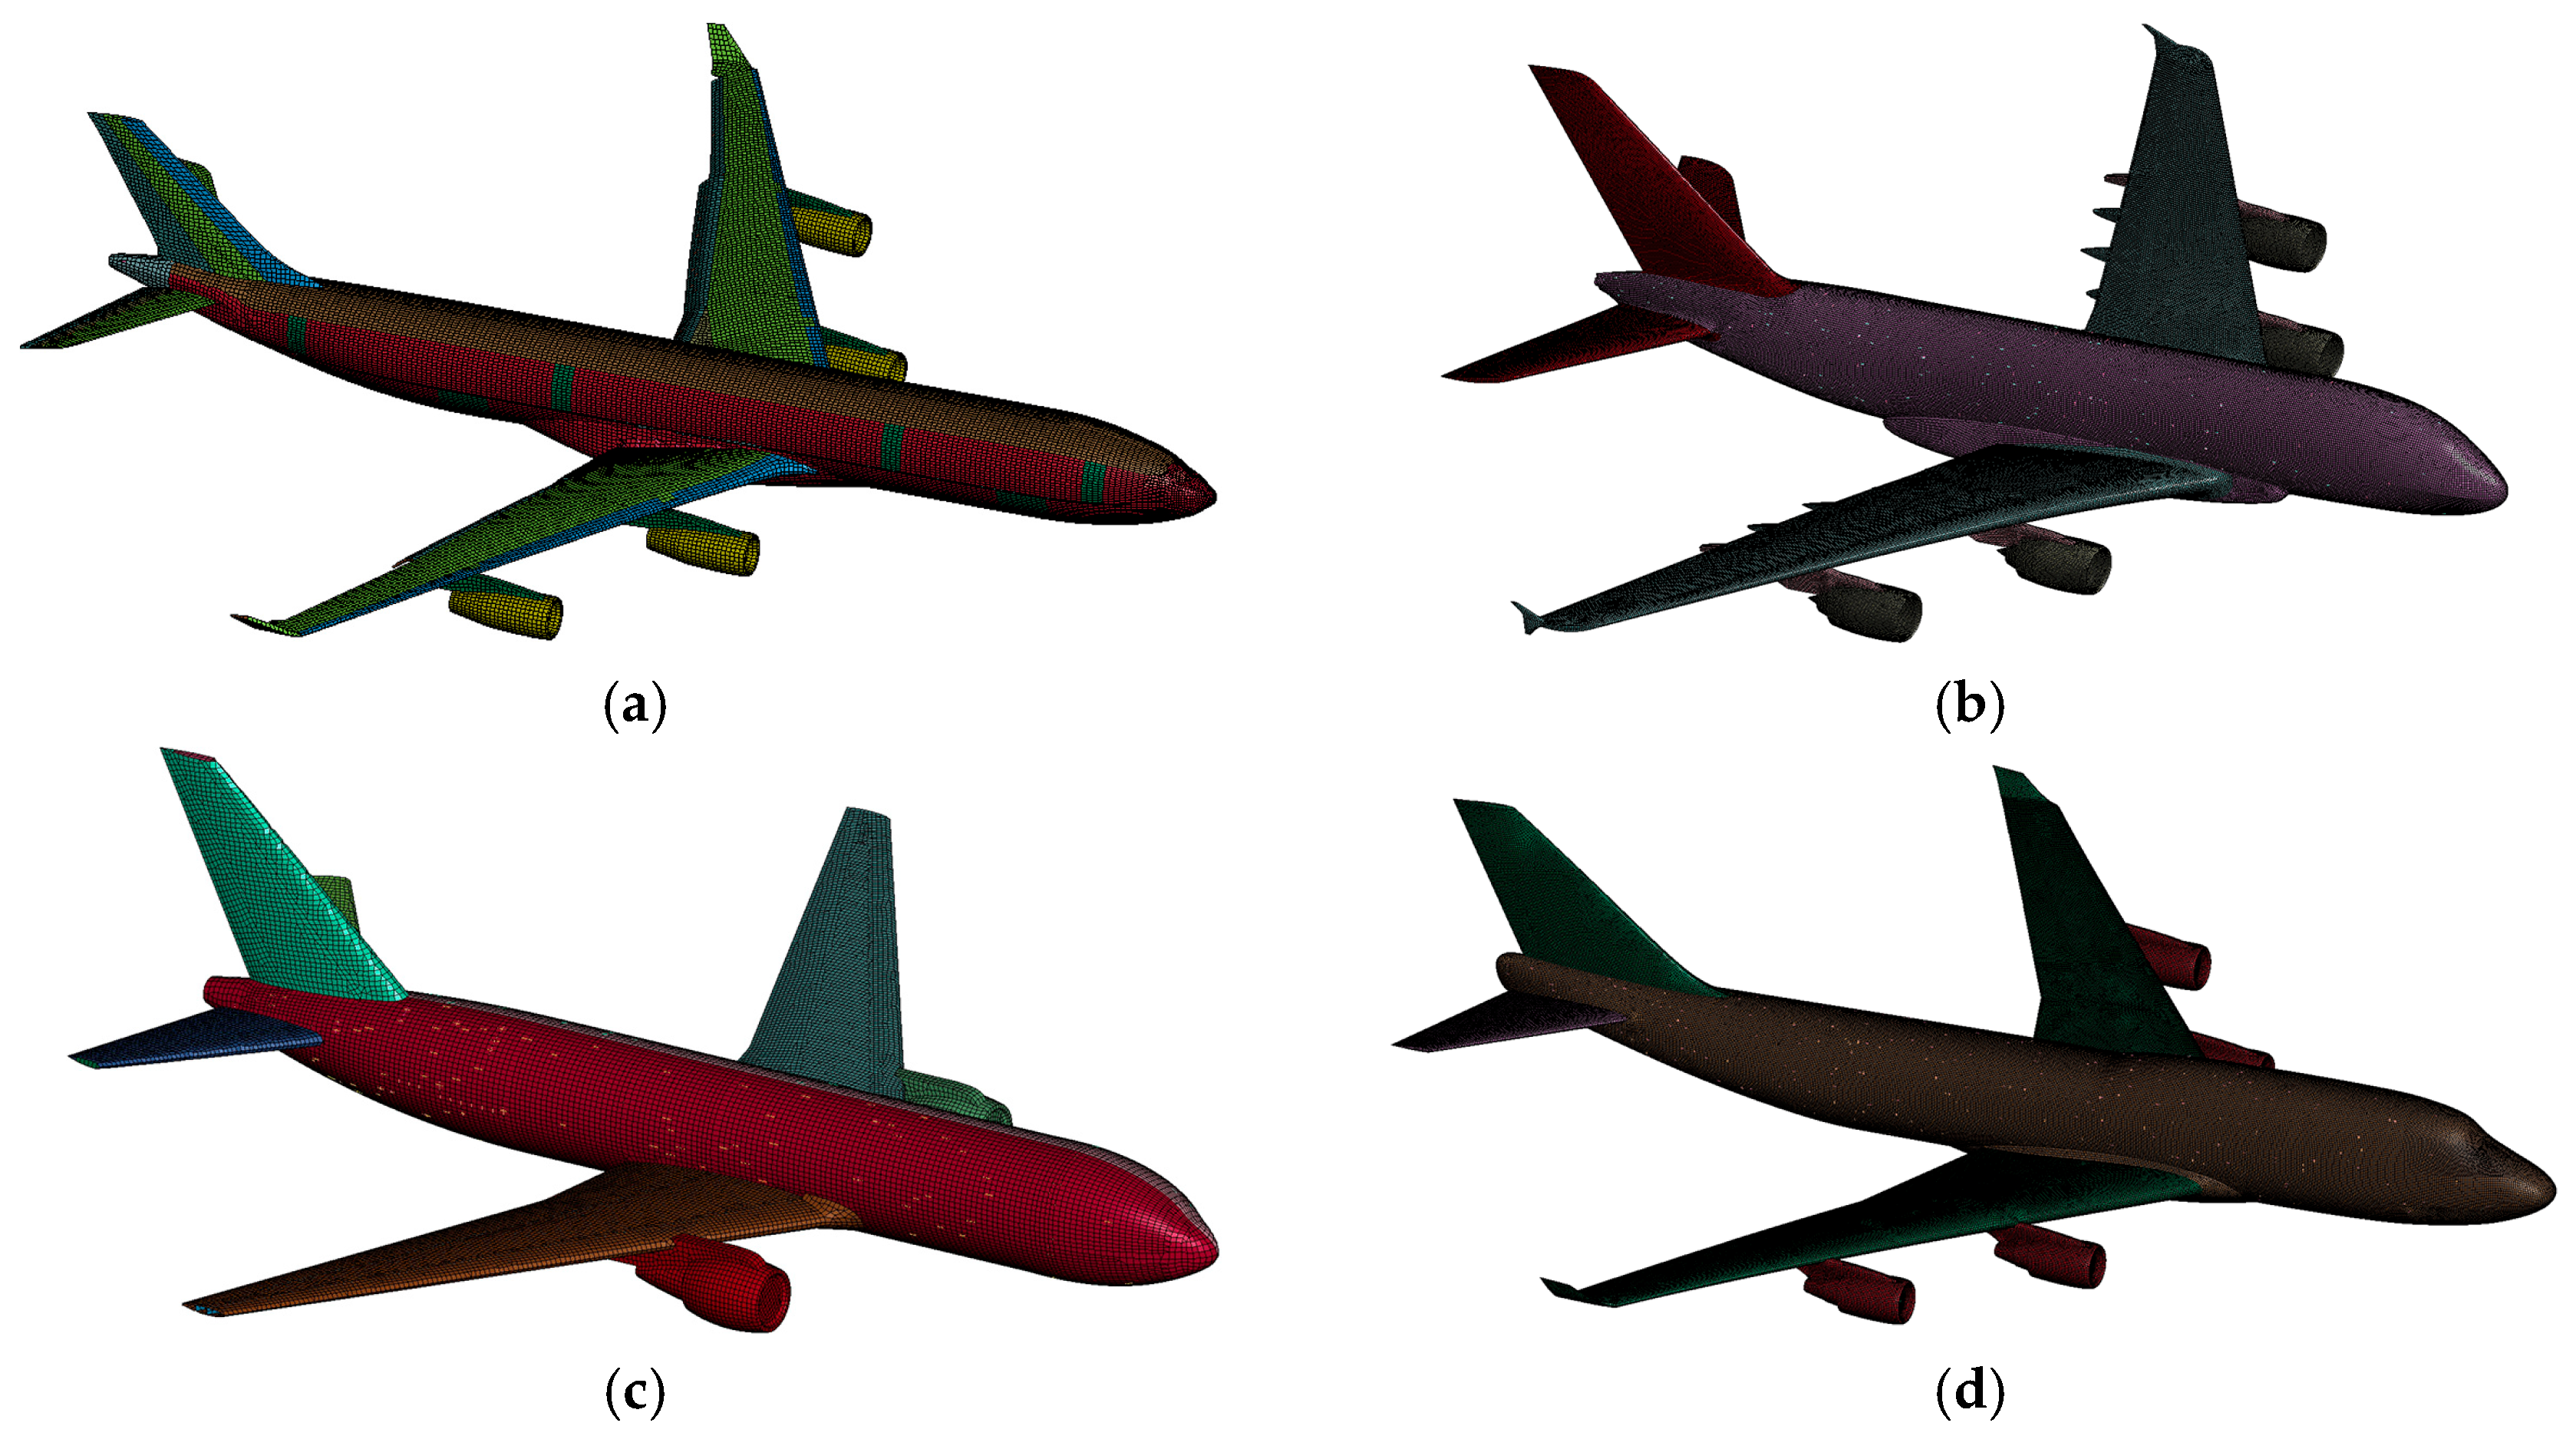
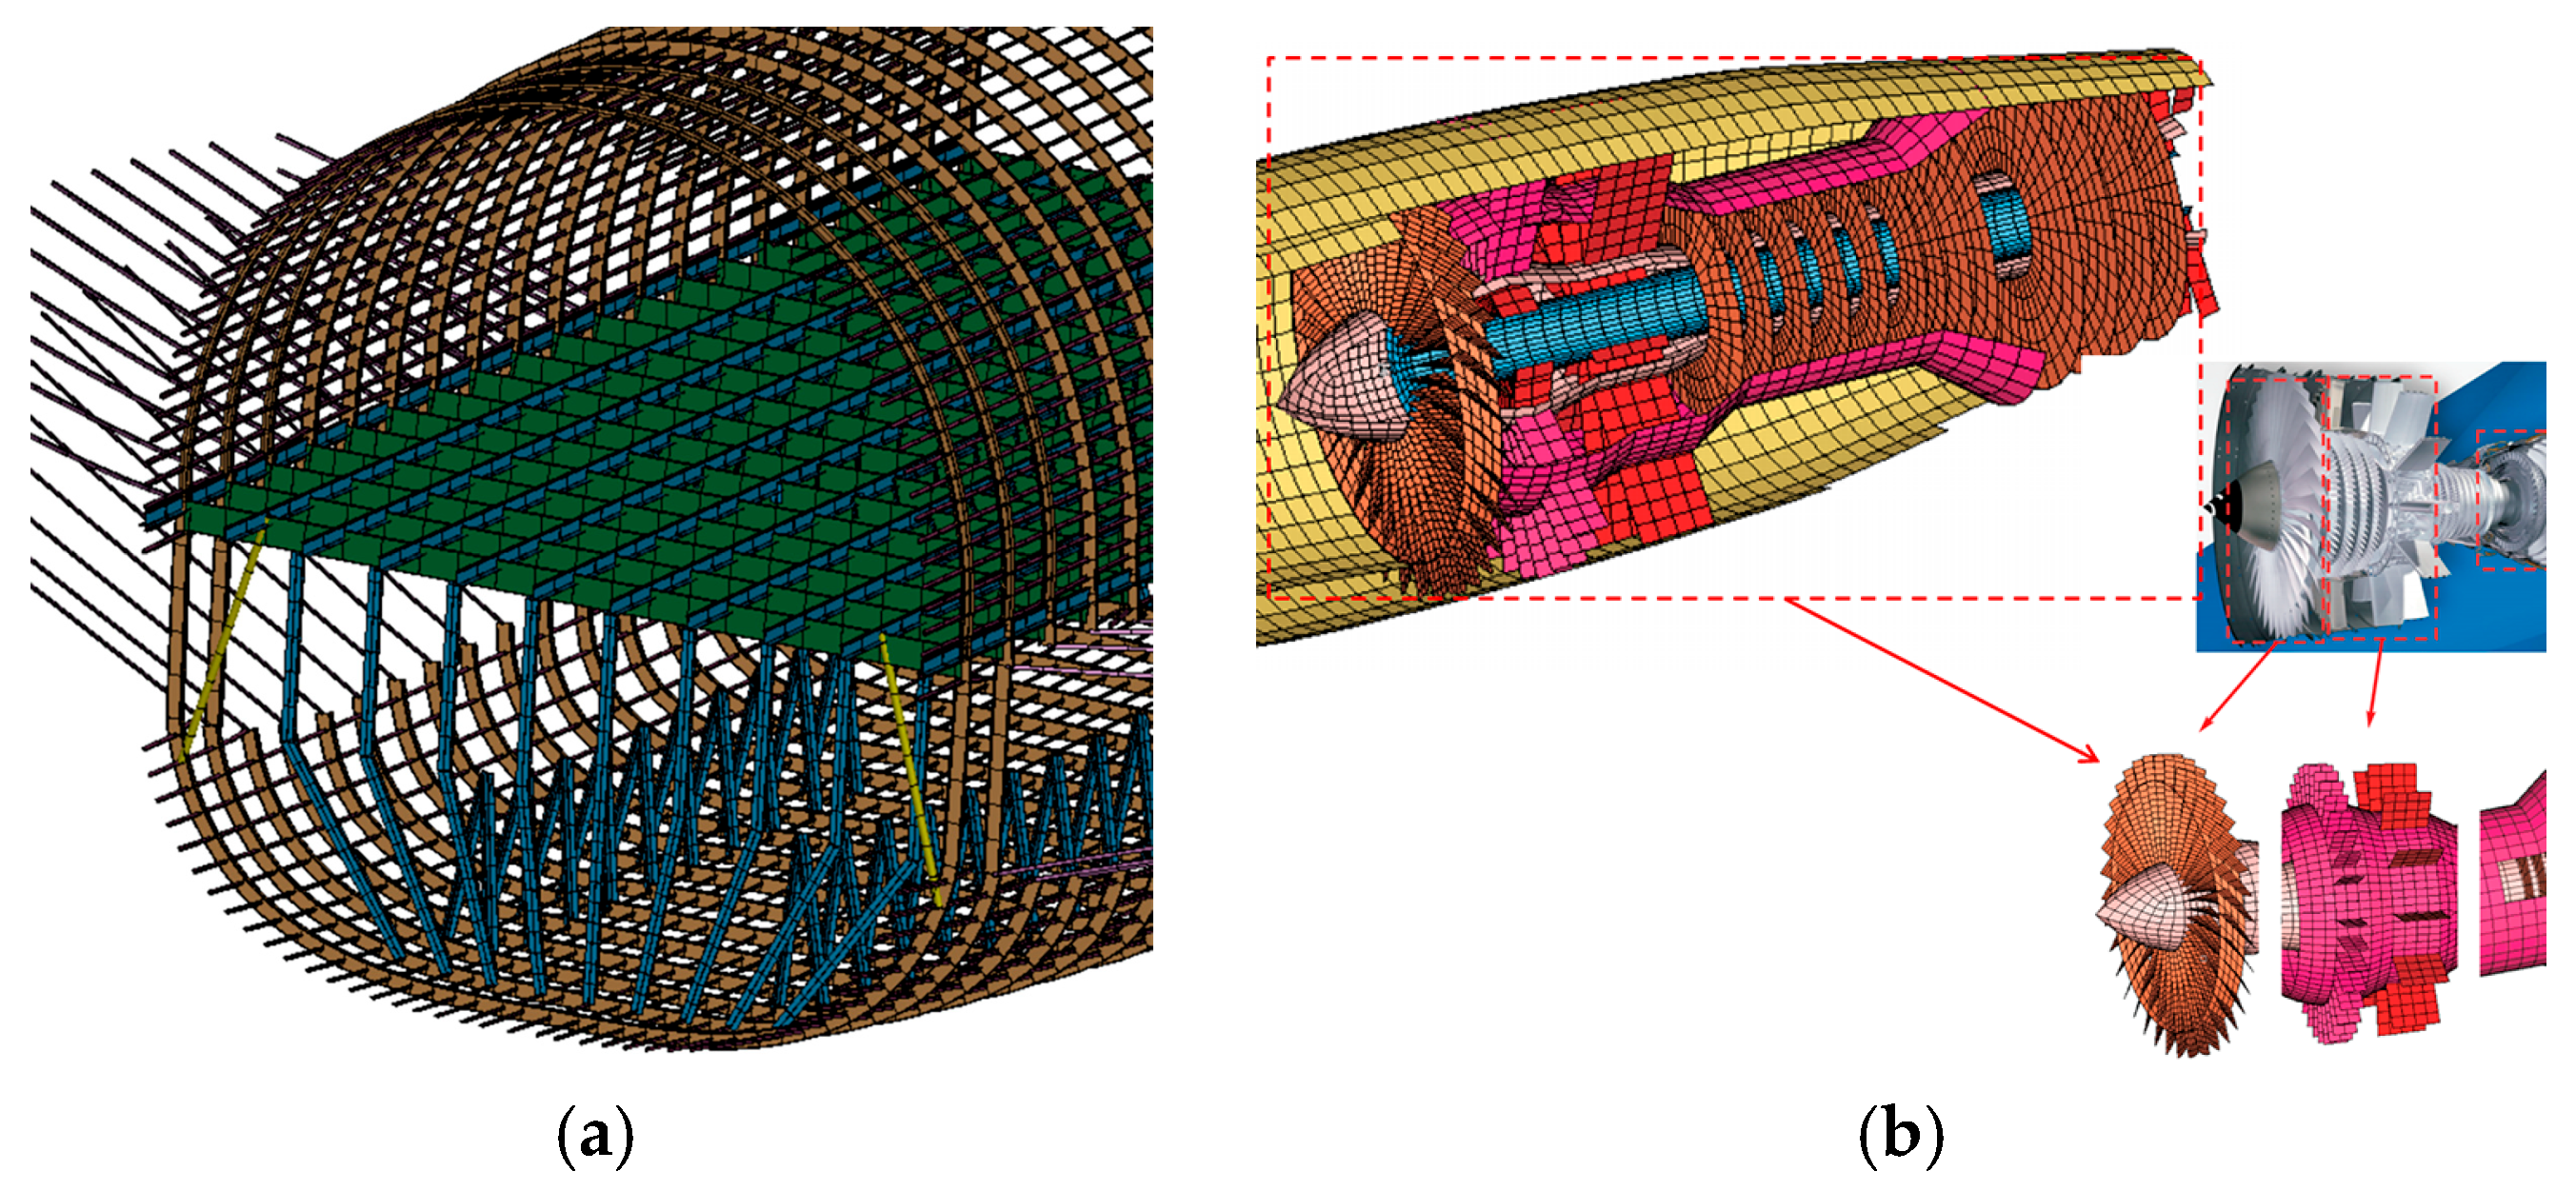
For the safety assessment of S-UHPC containment structures subjected to large commercial aircraft impacts, four representative commercial aircraft types were considered: Airbus A340-300, Airbus A380, Boeing 767-200, and Boeing 747-400. These aircraft were selected due to their diverse weights, sizes, and historical significance in previous nuclear plant safety assessments. The basic parameters of these aircraft are listed in Table 1, and the detailed finite element (FE) models are presented in Figure 2; for the A340-300, representative internal structures (e.g., fuselage frames and engines) are further illustrated in Figure 3. The internal structures of the other aircraft were modeled similarly to the A340-300 due to structural similarities and data availability. Regarding the element types employed, beam elements were used for structural members, such as main girders, ribs, and stringers, while shell elements were utilized to model aircraft skin, floor, and engine components. Additionally, fuel, seat equipment, personnel baggage, and other payloads were simulated using the ELEMENT_MASS elements available in LS-DYNA [26]. The material constitutive models of MAT JOHNSON COOK and MAT PLASTIC KINEMATIC were adopted for the shell elements and beam elements of the aircraft FE model. The Johnson–Cook model is described by the following Equation [27]:
σ = A + B ε ¯ p n 1 + C ln ε ¯ · ε ˙ 0 1 T T r o o m T m e l t T r o o m m
where σ is the equivalent flow stress, ε ¯ p is the equivalent plastic strain, ε ¯ · is the equivalent plastic strain rate, ε ˙ 0 is the reference equivalent plastic strain rate (typically defined as 1.0 s−1 or 1 × 10⁻³ s−1), T is the material temperature, T r o o m is the room temperature, and T m e l t is the melting temperature. The constants A, B, C, n, and m were determined experimentally. In this study, the temperature effect was neglected, and the material temperature was assumed to remain constant at room temperature.
Johnson and Cook [27] proposed a cumulative damage fracture model to describe material degradation and failure under dynamic loading by defining the strain at fracture as a function of strain rate, temperature, and pressure. The fracture strain is expressed by Equation (2), and the cumulative damage criterion is defined by Equation (3):
ε f = D 1 + D 2 exp D 3 σ m σ e f f 1 + D 4 ln ε ¯ · ε ˙ 0 1 + D 5 T T r o o m T m e l t T r o o m
D = Δ ε ¯ p ε f
where ε f is the fracture strain, σ m is the mean normal stress, σ e f f is the effective stress, D 1 to D 5 are five failure parameters, and D is the failure indicator; failure occurs when D = 1. The incremental effective plastic strain Δ ε ¯ p and associated calculation parameters are summarized in Table 2 [28]. The main girders, ribs, and stringers modeled using beam elements adopted the MAT_PLASTIC_KINEMATIC constitutive model. Strain rate effects were accounted for using the Cowper–Symonds model [29], with the dynamic yield stress expressed by the following equation:
σ y d = σ y 1 + ε · C 1 / P
where σ y d is the dynamic yield stress, σ y is the static yield stress, and P and C are material constants. The values of P and C were taken from the LS-DYNA Keyword User’s Manual [26] and are consistent with the material data in [30]. The effective plastic strain limit for element erosion (Fs) was taken from [28]. Additionally, the values for static yield stress σ y and the tangent modulus were adopted from [30].
Table 2. Material parameters for shell elements.
MaterialAluminumSteel
Density (kg/m3)28007830
Young’s modulus (MPa)71,900210,000
Shear modulus (MPa)27,80077,000
Poisson’s ratio0.330.3
A (MPa)369350
B (MPa)684275
N0.730.36
C0.00830.022
M1.71
D1 0.130.05
D2 0.133.44
D3 −1.5−2.12
D4 0.0110.002
D5 00.61
The material parameters used in the FE simulations are summarized in Table 3 (base elastic–plastic properties from [30]; Johnson–Cook strength and fracture parameters from [27]).
Table 3. Material parameters for beam elements.
MaterialAluminumSteel
Density (kg/m3)28007830
Young’s modulus (MPa)71,900210,000
Poisson’s ratio0.330.3
Yield stress (MPa)503400
Tangent modulus (MPa)6901050
C4040
p55
FS0.050.1
Source/References: Static yield stress and tangent modulus from [30]; Cowper–Symonds rate coefficients C, p from [26,30]; element erosion strain limit Fs from [28].
In order to verify the accuracy and rationality of the developed aircraft finite element (FE) models, the impact forces obtained from numerical simulations of aircraft impact on a rigid target were compared to theoretical results calculated using the Riera method. Riera [31] presented the force–time history of the aircraft impact force function by summing the crushing strength of the aircraft and impulse conservation principles derived from the momentum principle. The basic assumptions of the Riera method are as follows: (1) the target is rigid; (2) the length of the aircraft is normal to the target; (3) the aircraft is divided into two distinct regions: an uncrushed region and a crushed region; (4) all crushing takes place within a local region adjacent to the rigid target; and (5) the local crushing resistance is represented by a rigid–plastic surrogate (no hardening). The general expression proposed by Riera for computing the impact force on a rigid target is given by:
F ( t ) = P c ( x ) + α r μ ( x ) ( d x / d t ) 2
where x ( t ) is the crushed length of the aircraft, defined as the distance from the original aircraft nose to the current crushing front at time t , P c ( x ) is the static crushing force at the location x , α r is an experimentally determined coefficient, and μ ( x ) is the mass per unit length at location x . The Riera methodology was validated against full-scale test data involving an F-4 Phantom military aircraft impacting a rigid reinforced concrete reaction block [23], and the coefficient, α r , was determined to be α r = 0.9 . However, determining the exact crushing force P c ( x ) for different aircraft types is inherently challenging due to variability in structural properties. Considering the difficulties in determining P c ( x ) , Lee et al. [32] proposed a simplified Riera method, neglecting the crushing force, thus setting α r = 1 . This simplification is justified by the observation that aircraft impacts on rigid structures typically exhibit “soft impact” characteristics, where the crushing force contributes approximately 7% to 10% of the total impact force [32,33]. The simplified Riera method is expressed as follows and was adopted in subsequent analyses of this study:
F ( t ) μ ( x ) ( d x / d t ) 2
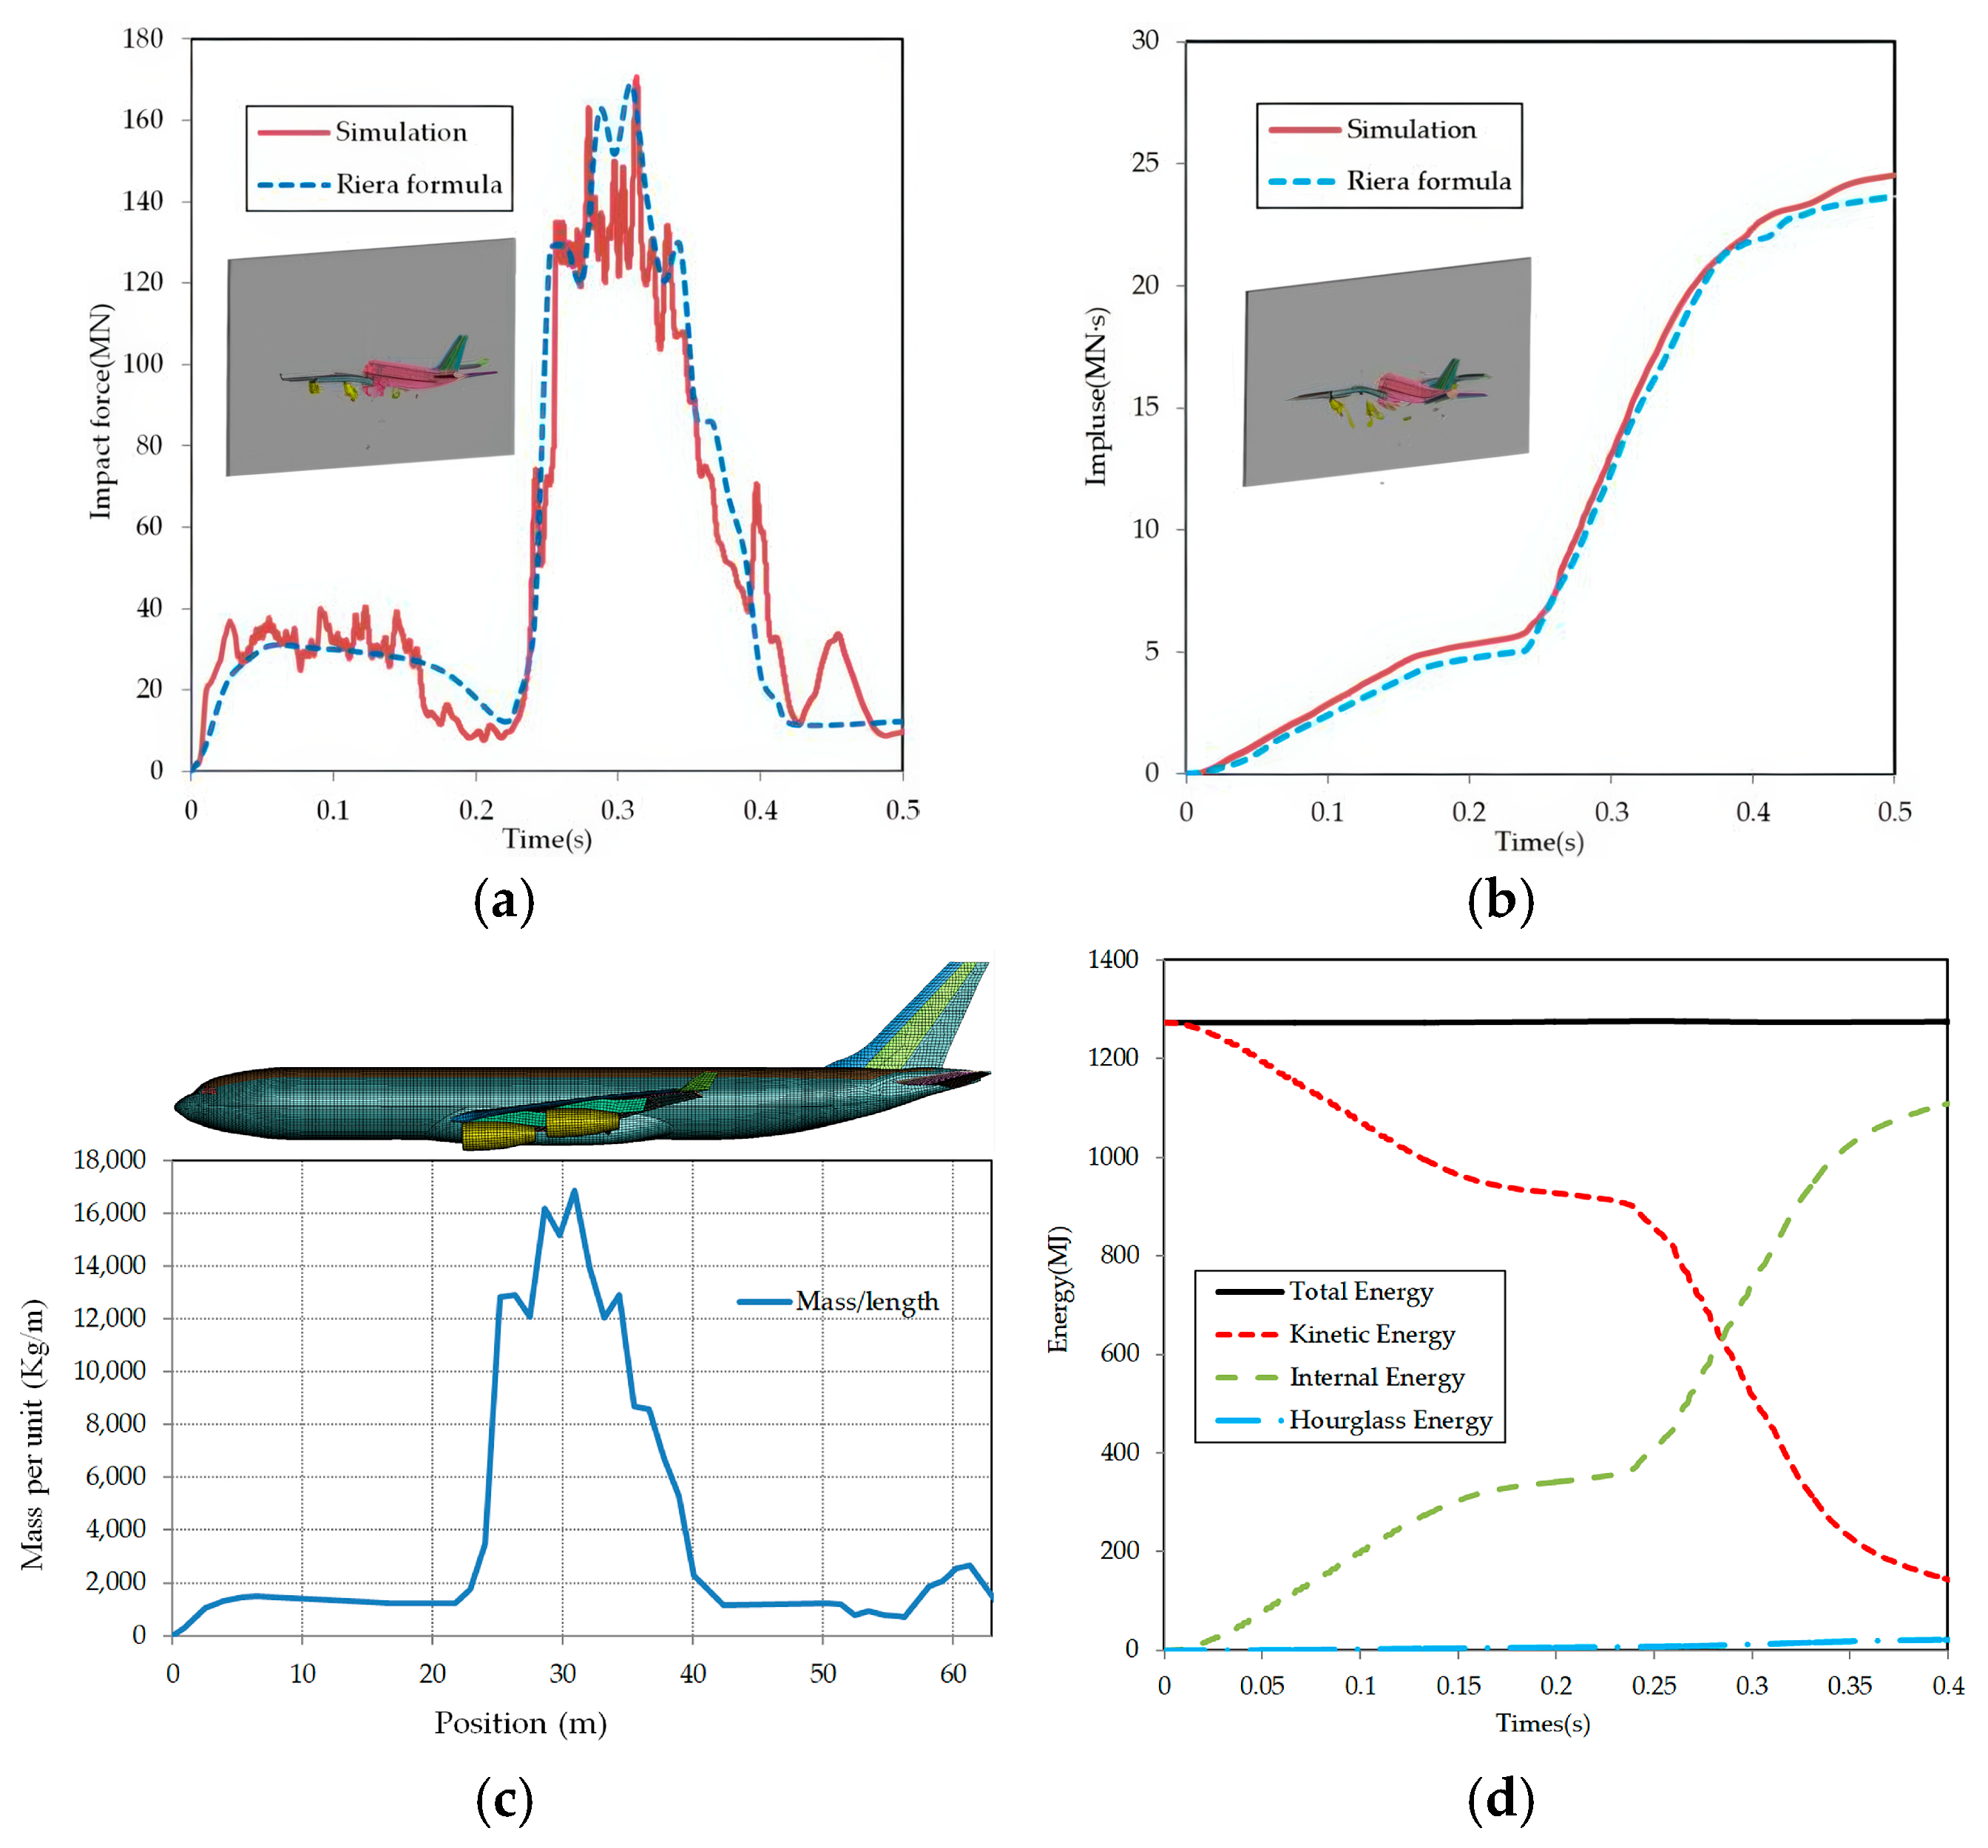
A comparison of the impact forces computed using the simplified Riera method and those obtained from numerical simulations for the A340-300 aircraft impacting a rigid target at a velocity of 100 m/s is shown in Figure 4a. The duration, peak values, and overall profiles of the impact force–time history curves from the simplified Riera method and the numerical simulations show good agreement. Furthermore, as illustrated in Figure 4b, the total impulse calculated by the simplified Riera method closely matches the simulation results. Quantitatively, the differences between the numerical and theoretical results in terms of peak force and impulse were less than 5%. These comparative analyses confirm that the aircraft FE models developed in this study are reasonable and can reliably simulate the dynamic behavior of aircraft impacts.
To aid verification and reproducibility, we include the A340-300 mass per unit length distribution μ(x) (Figure 4c), which is consistent with the discretized masses of the fuselage/wing/engines and is used both to generate the Riera load and to set up the rigid target baseline. We also report an energy balance history for the A340-300 rigid target impact at 100 m/s (Figure 4d), showing nearly constant total energy, monotonic kinetic energy decay with corresponding internal energy growth, and hourglass energy below 5% of the total throughout. Together with the <5% differences in peak force and total impulse between the Riera prediction and our FE model, these checks demonstrate a consistent mass basis and the numerical robustness of the aircraft model under the rigid target benchmark.

2.2. S-UHPC Containment

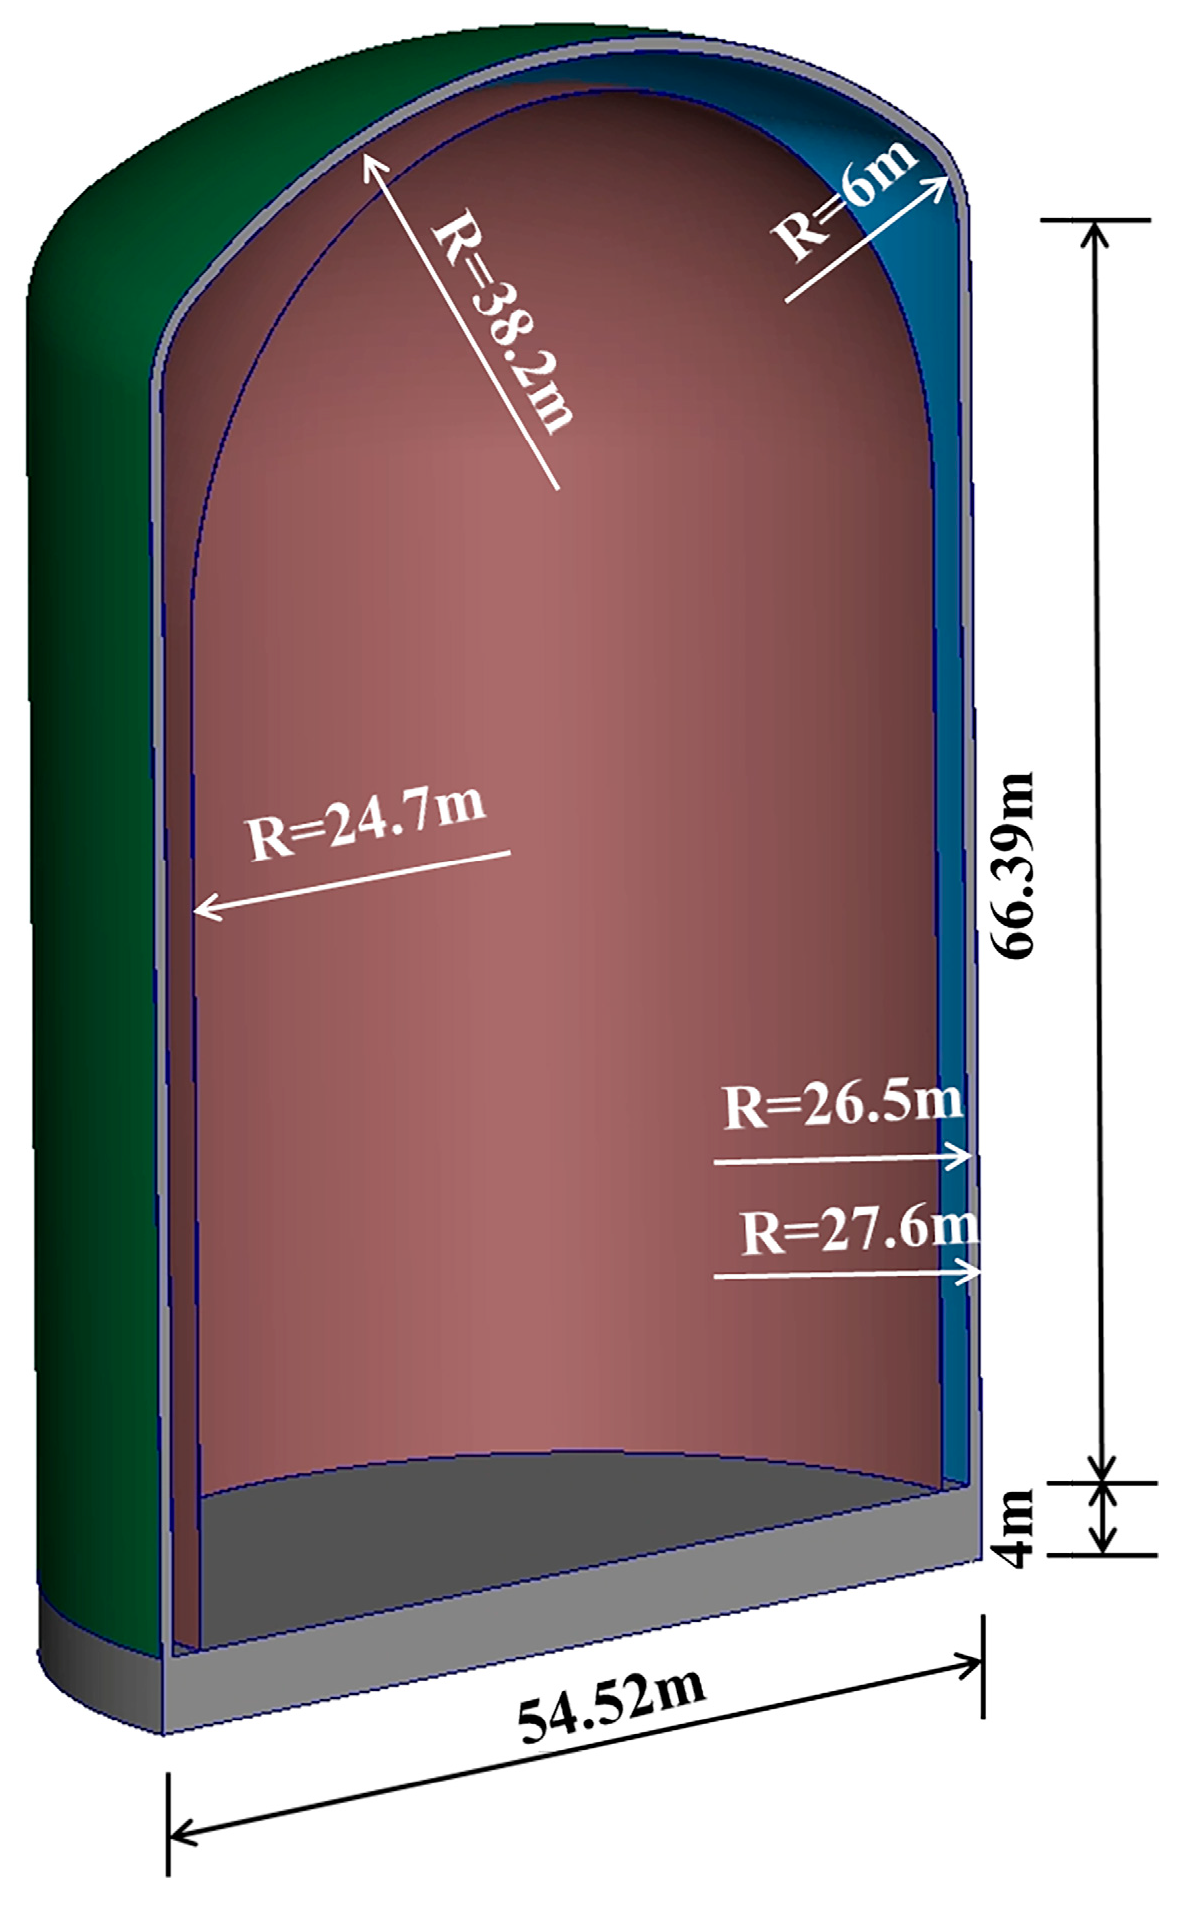
The geometrical dimensions of the S-UHPC containment structure used in this paper are as follows: The total height is 84.64 m, the inner diameter and height of the cylinder are 53 m and 58.4 m, respectively, and the thickness of the inner and outer steel plates is 20 mm. Three different containment wall thicknesses (1.1 m, 0.8 m, and 0.6 m) were evaluated separately to investigate their influence on impact resistance. Additionally, an internal steel containment model was constructed to assess the floor response spectrum. Concrete was modeled using the solid element Solid164, divided into four layers along the thickness direction to enhance the accuracy of stress distribution and damage representation. The steel plates and the internal steel containment structure were modeled using the shell element Shell163. The geometrical dimensions of the S-UHPC containment structure used in this study are detailed in Figure 5, which presents the structural layout and key dimensions of the double-shell configuration. The total height of the outer containment cylinder is 66.39 m, with an internal diameter of 53 m and a cylindrical height of 58.4 m. Both the inner and outer steel plates are 20 mm thick. A total of 222,080 solid elements and 108,864 shell elements were employed in the containment FE model. The geometric characteristics and design parameters of the containment model closely follow those of typical pressurized water reactor (PWR) containment structures, such as CAP1400 designs, providing relevant engineering applicability [34]. Regarding the contact interactions, *CONTACT_AUTOMATIC_NODES_TO_SURFACE was utilized for the contact between the aircraft structural elements (floor beams, frames, and stringers) and the containment surface; *CONTACT_AUTOMATIC_SURFACE_TO_SURFACE was defined for interactions between the containment surface and other parts of the aircraft; and *CONTACT_AUTOMATIC_SINGLE_SURFACE was applied for self-contact within both the aircraft and the containment structure. In these contact definitions, FS (static friction coefficient) and FD (dynamic friction coefficient) were both set as 0.1, and SFS (scale factor on default slave penalty stiffness) and SFM (scale factor on default master penalty stiffness) were set as 1. The soft constraint option (SOFT = 1) was selected to enhance the numerical stability and accuracy, especially considering large differences in elastic moduli and mesh densities between contact surfaces.
A segment-based automatic contact was used between aircraft components and the containment surfaces. A constant Coulomb coefficient, μ = 0.10 (static and kinetic), was assigned for steel–steel and steel–concrete pairs to represent short-duration, high-pressure sliding in which normal crushing governs the load transfer, consistent with common practice for impact simulations. The penalty stiffness was chosen to suppress numerical interpenetration and chatter while avoiding excessive stiffness that would unduly reduce the stable time step; the hourglass-to-total energy ratio remained <5%, and contact force–time histories were smooth. The same μ and penalty settings were used unchanged in the validation cases of Section 2.3, where the simulated force/impulse and deformation histories closely match published tests/benchmarks, supporting these choices.
The damage and evolution behavior of concrete under dynamic loads, such as impact or explosive loading, involves complex deformation and failure processes. Therefore, a precise constitutive model is crucial. To accurately represent the dynamic behavior of UHPC under high strain rates and large deformations, the Holmquist–Johnson–Cook (HJC) model was adopted. This model, initially proposed by Holmquist et al. [35], is an extension of the Johnson–Cook formulation. Key parameters and the constitutive framework of this model are presented schematically in Figure 6. The normalized equivalent stress σ* is defined as follows:
σ * = A ( 1 D ) + B P * N 1 + C ln ( ε · * ) S max
σ * = σ / f c ; P * = P / f c ; ε · * = ε · / ε · 0
where P* denotes the normalized hydrostatic pressure, P signifies the actual hydrostatic pressure, the damage parameter D ranges from 0 to 1, the dimensionless strain rate is indicated by ε · * , and the actual strain rate is represented by ε · , with a reference strain rate of ε · 0 = 1 s−1. The material parameters include A (normalized cohesive strength), B (normalized pressure hardening coefficient), N (pressure hardening exponent), and C (strain rate coefficient). The variable Smax, shown in Figure 6a, illustrates the normalized maximum strength, and fc is the quasi-static uniaxial compressive strength.
Damage accumulation due to both the equivalent plastic strain increment Δ ε p and the plastic volumetric strain increment Δ μ p is defined as:
D = Δ ε p + Δ μ p ε p f + μ p f
The fracture strain ε p f and fracture volumetric strain μ p f are calculated as:
ε p f + μ p f = D 1 ( P * + T * ) D 2 ; T * = T / f c
Equations (7)–(10) follow the Holmquist–Johnson–Cook (HJC) concrete model as originally formulated in [34], and the UHPC parameters used herein are adopted from Wan et al. [36], where T is the maximum tensile hydrostatic pressure the material can endure. Damage parameters D1, D2, and EFMIN are crucial constants in controlling damage evolution, as depicted in Figure 6b.
The hydrostatic pressure–volume relationship is segmented into three distinct regions (Figure 6c). The first region (linear elastic) occurs when μμc, where μ is the volumetric strain and μc is the crushing volumetric strain. Pc is the crushing pressure at μc, and Ke represents the elastic bulk modulus. The second region, identified as the transition region, occurs when μc μμpl. In this region, μpl refers to the locking volumetric strain, and Pl is the locking pressure at μpl. The third region describes the behavior of fully dense material and occurs when μpl μ, with K1, K2, and K3 as constants. The pressure–volume response is given by:
P = K e μ , μ μ c P c + K c μ μ c , μ c μ μ p l P l + K 1 μ ¯ K 2 μ ¯ 2 + K 3 μ ¯ 3 , μ p l < μ
K e = P c / μ c ; K c = P l P c / μ p l μ c ; μ ¯ = μ μ p l / 1 + μ p l
Material parameters required by the HJC model include basic parameters (density, shear modulus, f c , and T ), limit surface parameters (A, B, N, and Smax), equation of state parameters (K1, K2, K3, Pc, μc, Pl, and μpl), damage parameters (D1, D2, and EFMIN), and the rate effect parameter (C). These parameters were calibrated by Wan et al. [36] through comprehensive tests including triaxial, SHPB, uniaxial loading, and Hugoniot experiments, providing reliable input for numerical simulations.
The parameters used for UHPC and metal components (steel plates, studs, and tie-bars) are detailed in Table 4 and Table 5, respectively. The boundary conditions included fixed translational degrees of freedom at the raft foundation bottom. For soil–structure interaction (SSI) considerations, the Drucker–Prager model was employed, and artificial nonreflecting boundaries (Perfectly Matched Layer, PML) were applied on soil boundaries to simulate infinite half-space conditions accurately.
The simulation conditions investigated in this study, including aircraft type, impact velocity, containment thickness, UHPC strength, and soil conditions, are depicted in Figure 7, aiming to provide comprehensive guidance for designing impact-resistant S-UHPC containment structures in nuclear power plants.
Although real containment structures typically include penetrations such as personnel access hatches, equipment hatches, and piping passages, these features were not explicitly modeled in this study. This modeling simplification is supported by the NEI 07-13 guideline, which recognizes that the probability of an aircraft impact directly targeting such openings is extremely low. Specifically, NEI 07-13 notes that hatches have been examined as potential aircraft impact targets and were excluded based on the following: (1) the small size of hatches compared to the aircraft fuselage; (2) limited pilot targeting accuracy at high velocities; and (3) historical experience showing that off-center impacts on reinforced openings and surrounding wall areas do not dominate structural failure modes. Therefore, this study focuses on the global structural response and conservatively assumes impacts on the solid containment wall regions, without modeling the openings.
Service-stage note on repeated/long-term actions: In addition to single-event aircraft impact, repeated drop-weight tests on UHPC panels have shown higher blow counts to cracking/failure and sustained crack-bridging, indicative of reduced damage accumulation per hit [37]; complementary ballistic experiments further confirm the high penetration resistance of UHPC plates [38]. For S-UHPC systems, long-term reliability is governed predominantly by faceplate–core interface and connector performance under cyclic/fatigue actions; therefore, connector detailing, vibration/fatigue tolerance, and routine inspection of weld quality and interface gaps should be considered in engineering practice [39,40].
Service-stage role of connector spacing: Beyond single-event aircraft impact, stud (and tie-bar) spacing governs long-term composite action, fatigue life, and slip control in S-UHPC sandwich walls. Closer spacing enhances interface shear transfer and composite action [18], reduces stress range in individual connectors, limits cyclic slip and gap propagation, and delays the degradation of faceplate–core interaction; conversely, excessive spacing increases connector stress amplitudes and concentrates prying near discontinuities, increasing the likelihood of fatigue crack initiation and propagation [39,40]. For safety-class structures, design and operations should specify workmanship/inspection requirements (e.g., weld integrity and headed-stud embedment/layout checks) and verify serviceability under expected vibration regimes. Equations (7)–(10) follow the HJC concrete model. Material constant sets for UHPC (HJC) and for metallic parts (JC and, where applicable, Cowper–Symonds rate effects) were taken from published calibrations and datasets; the specific sources for each set are stated in the captions of Table 2, Table 3 and Table 4.

2.3. Model Validation

The validation of finite element (FE) models is essential for ensuring the accuracy and reliability of numerical analyses, although it has often been neglected in previous studies. Considering the complexity and large scale of S-UHPC containment structures, performing full-scale prototype tests is extremely difficult in practice. Consequently, validating the numerical model based on available scaled tests or related experiments is a critical step for this study. Due to the limited availability of direct experimental data on full-scale S-UHPC containment structures subjected to aircraft impacts, this paper utilizes existing experimental results of UHPC panels and Steel–Normal Reinforced Concrete (S-NRC) panels under impact loading to indirectly validate the numerical methods and material models adopted.

2.3.1. Validation of UHPC

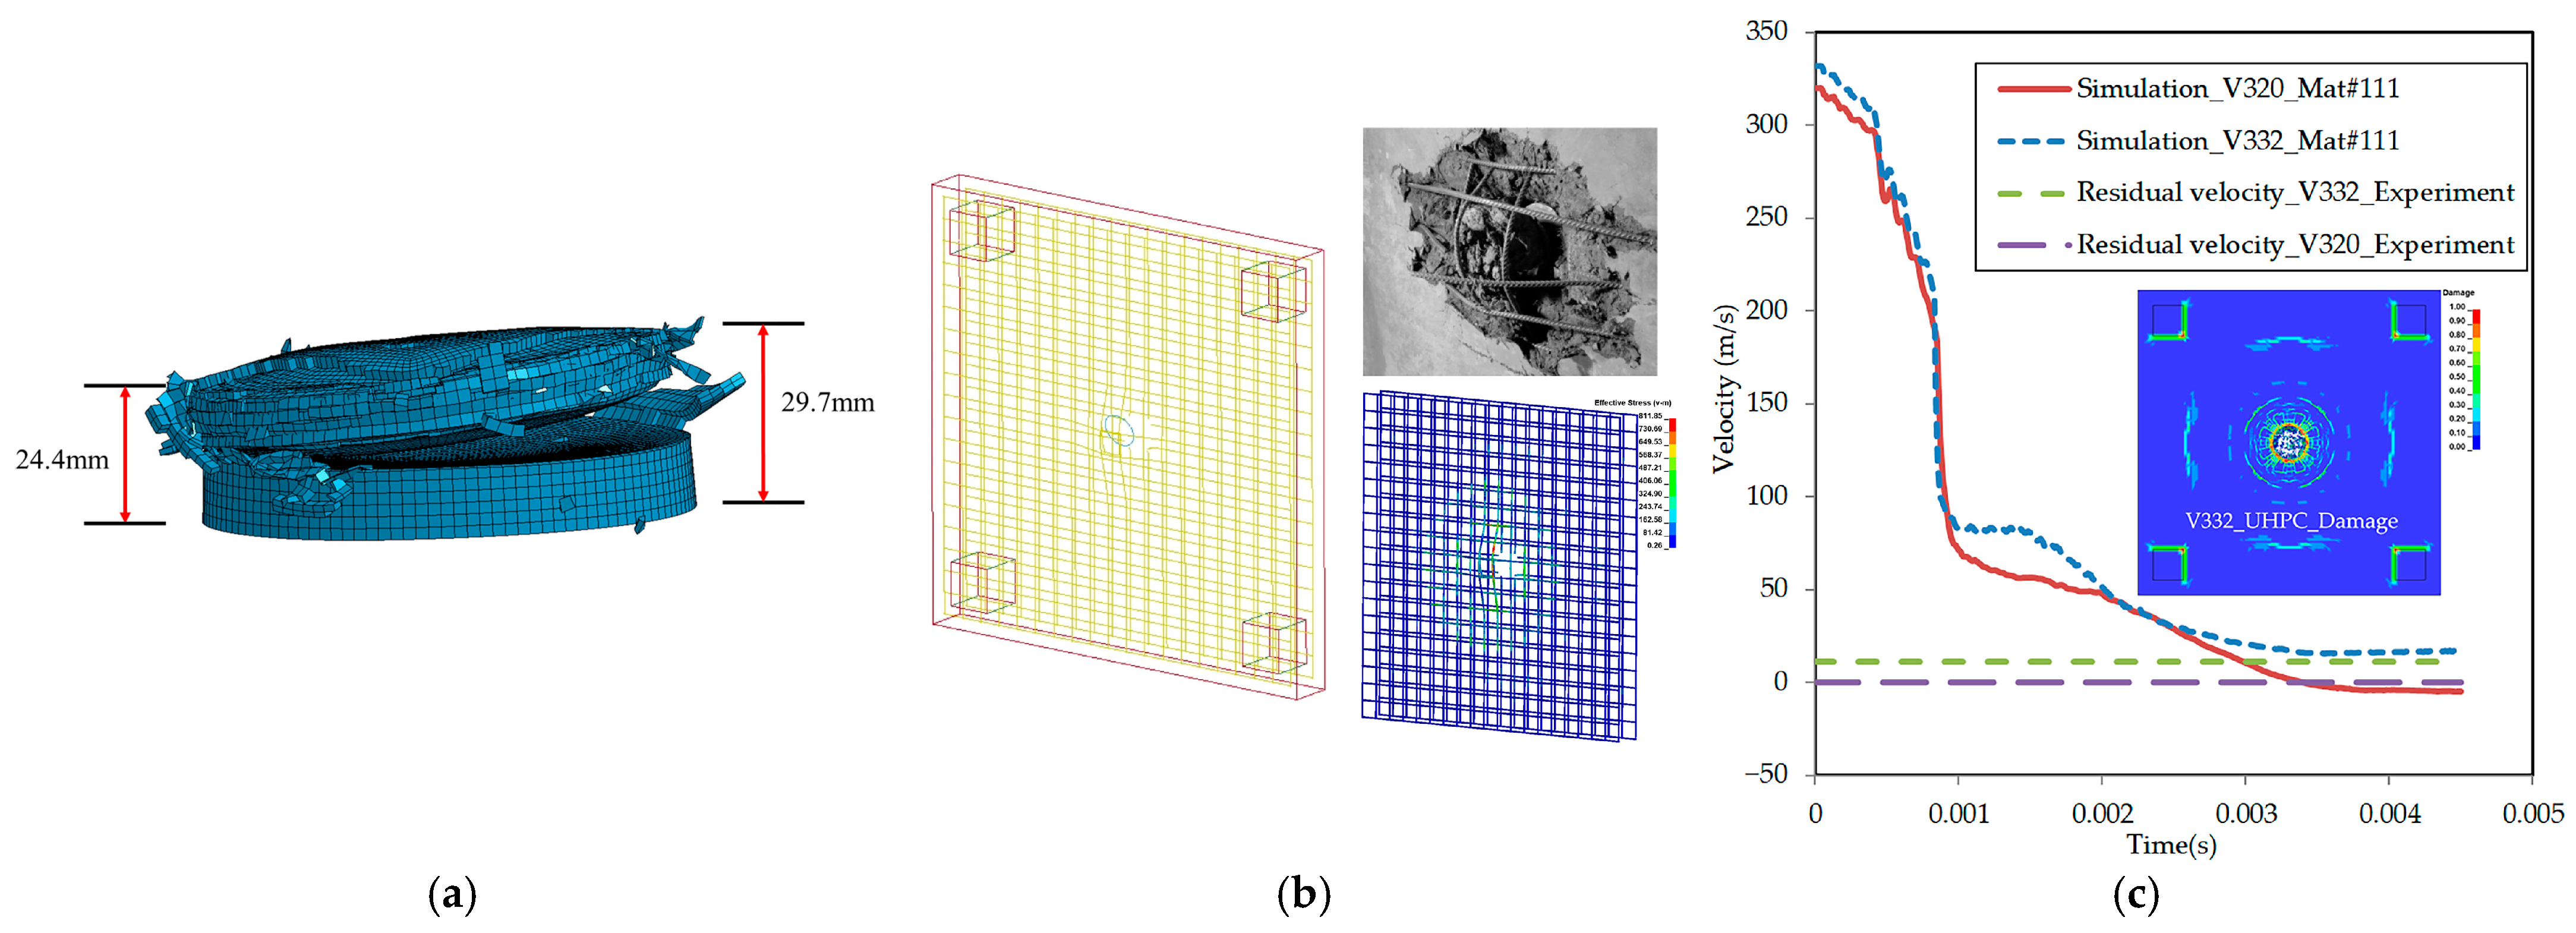
Riedel conducted six scaled aircraft engine impact tests on reinforced UHPC panels. The compressive strength of the UHPC panels ranged between 172.1 MPa and 196 MPa, the elastic modulus was approximately 55,000 MPa, the panel thickness was 100 mm, and the reinforcement ratio was 0.475%. The aircraft engine model was scaled at 1:10, and impact velocities included 194.7 m/s, 248.9 m/s, 258.7 m/s, 320.0 m/s, 332.0 m/s, and 368.6 m/s. Penetration occurred at an impact velocity of 320.0 m/s. In the FE simulations presented herein, the HJC constitutive model was employed for UHPC, and reinforcement bars were embedded within the concrete matrix using the keyword *CONSTRAINED_LAGRANGE_IN_SOLID. FE models of the scaled aircraft engine and UHPC panels are illustrated in Figure 8. Figure 9 compares the front and rear surface damage patterns from numerical simulations and experimental results at the impact velocity of 320.0 m/s. The numerical simulation slightly overestimated the damaged area on the front surface, whereas the predicted damage pattern and extent on the rear surface showed excellent agreement with the experimental results.
Figure 10a illustrates the deformation of the aircraft engine post-impact; the calculated deformation of the engine was approximately 27.1 mm, showing an error of about 3.2% compared to the experimental deformation of 28 mm. The deformation patterns at the rear face of the UHPC panel are compared to the experimental observations in Figure 10b. The velocity–time history curves of the aircraft engine from the simulations are shown in Figure 10c. Overall, the numerical results closely match the experimental observations, validating the use of the HJC constitutive model for UHPC in dynamic impact simulations.

2.3.2. Validation of S-NRC

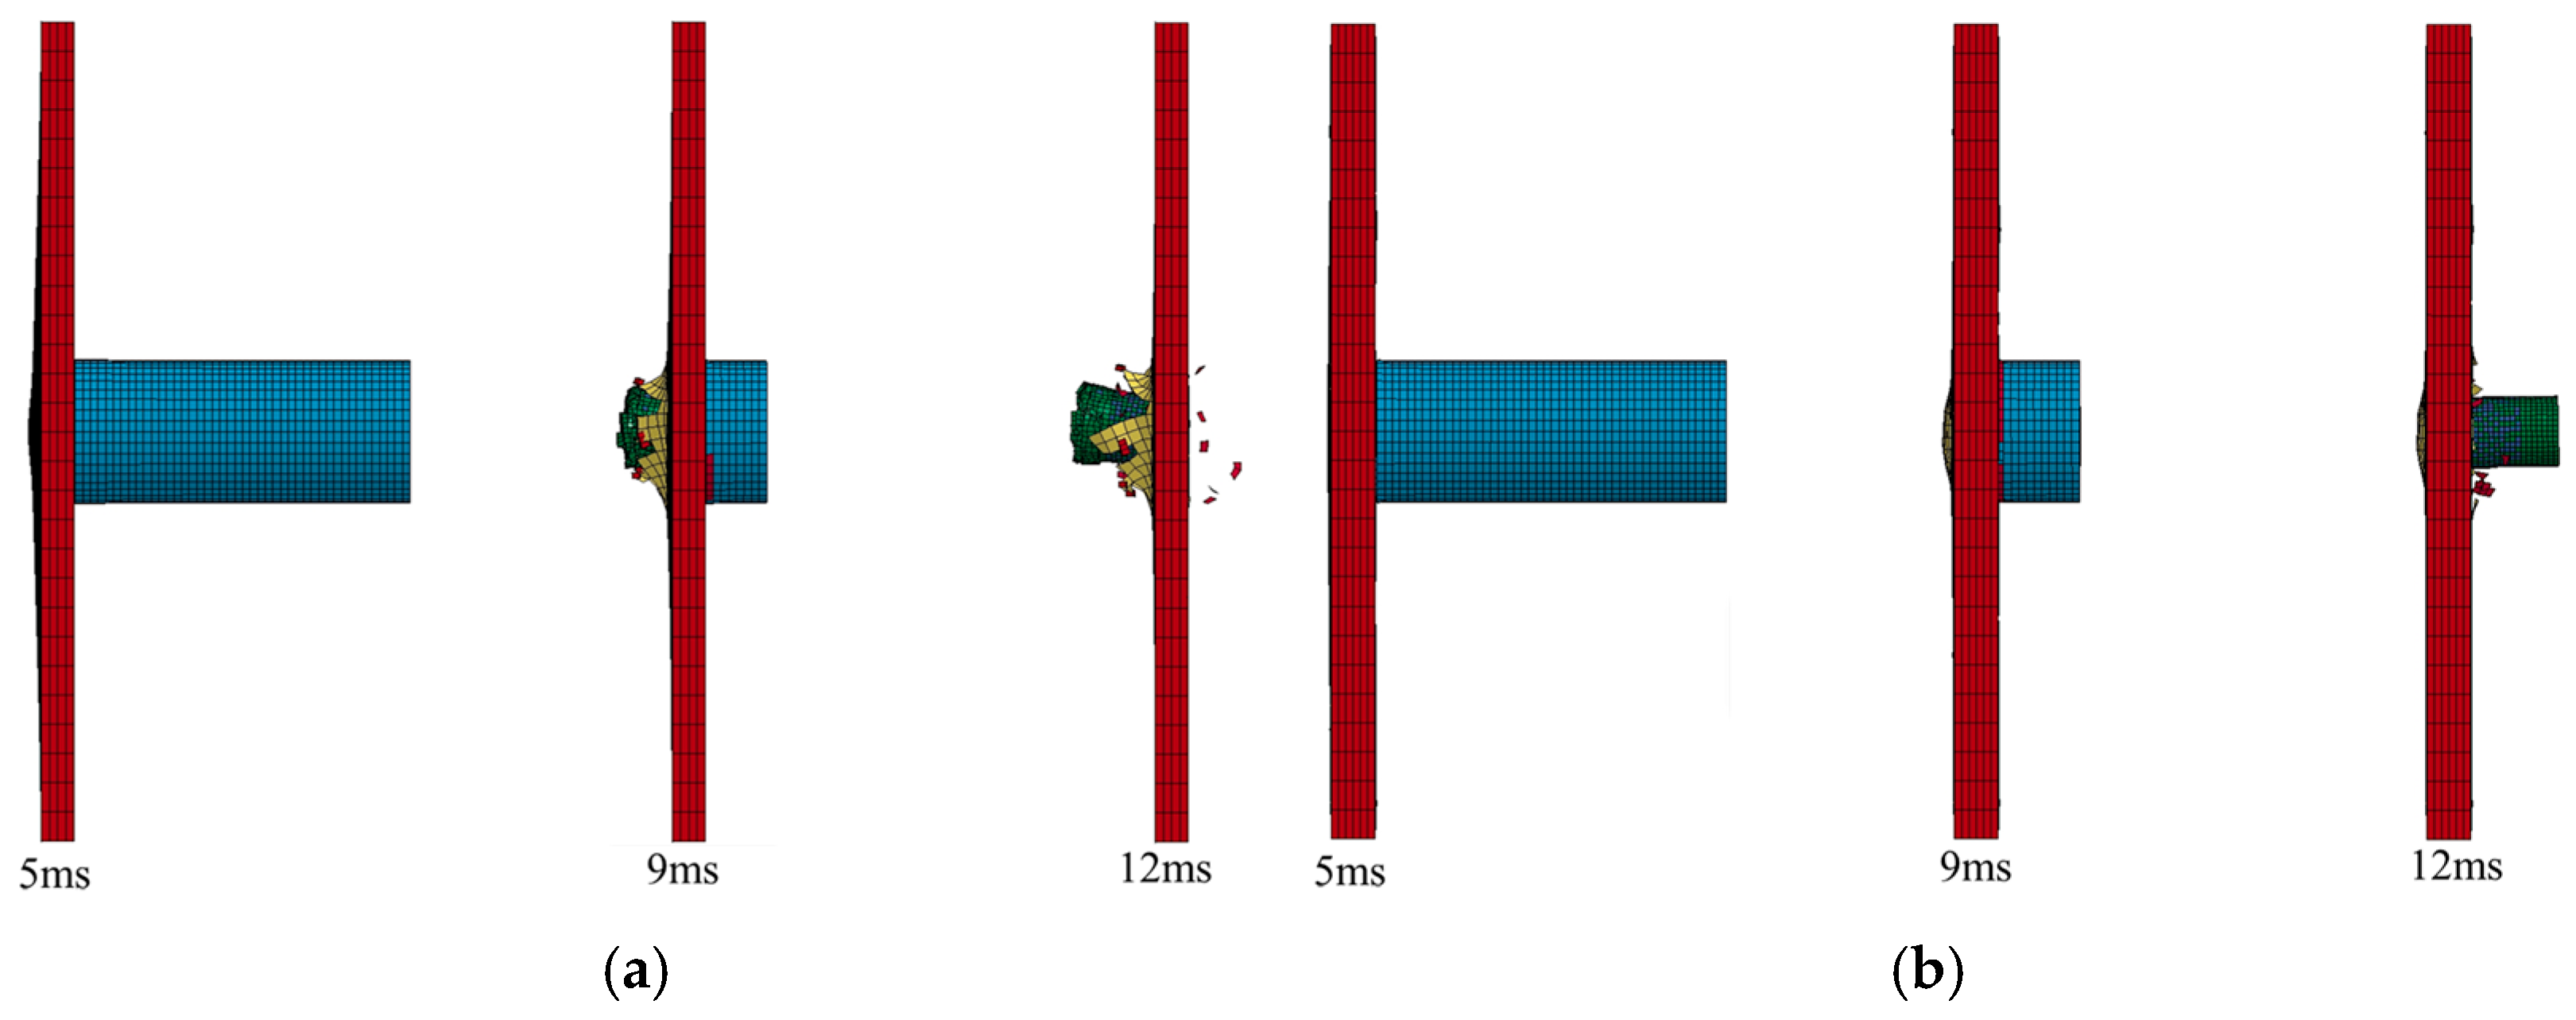
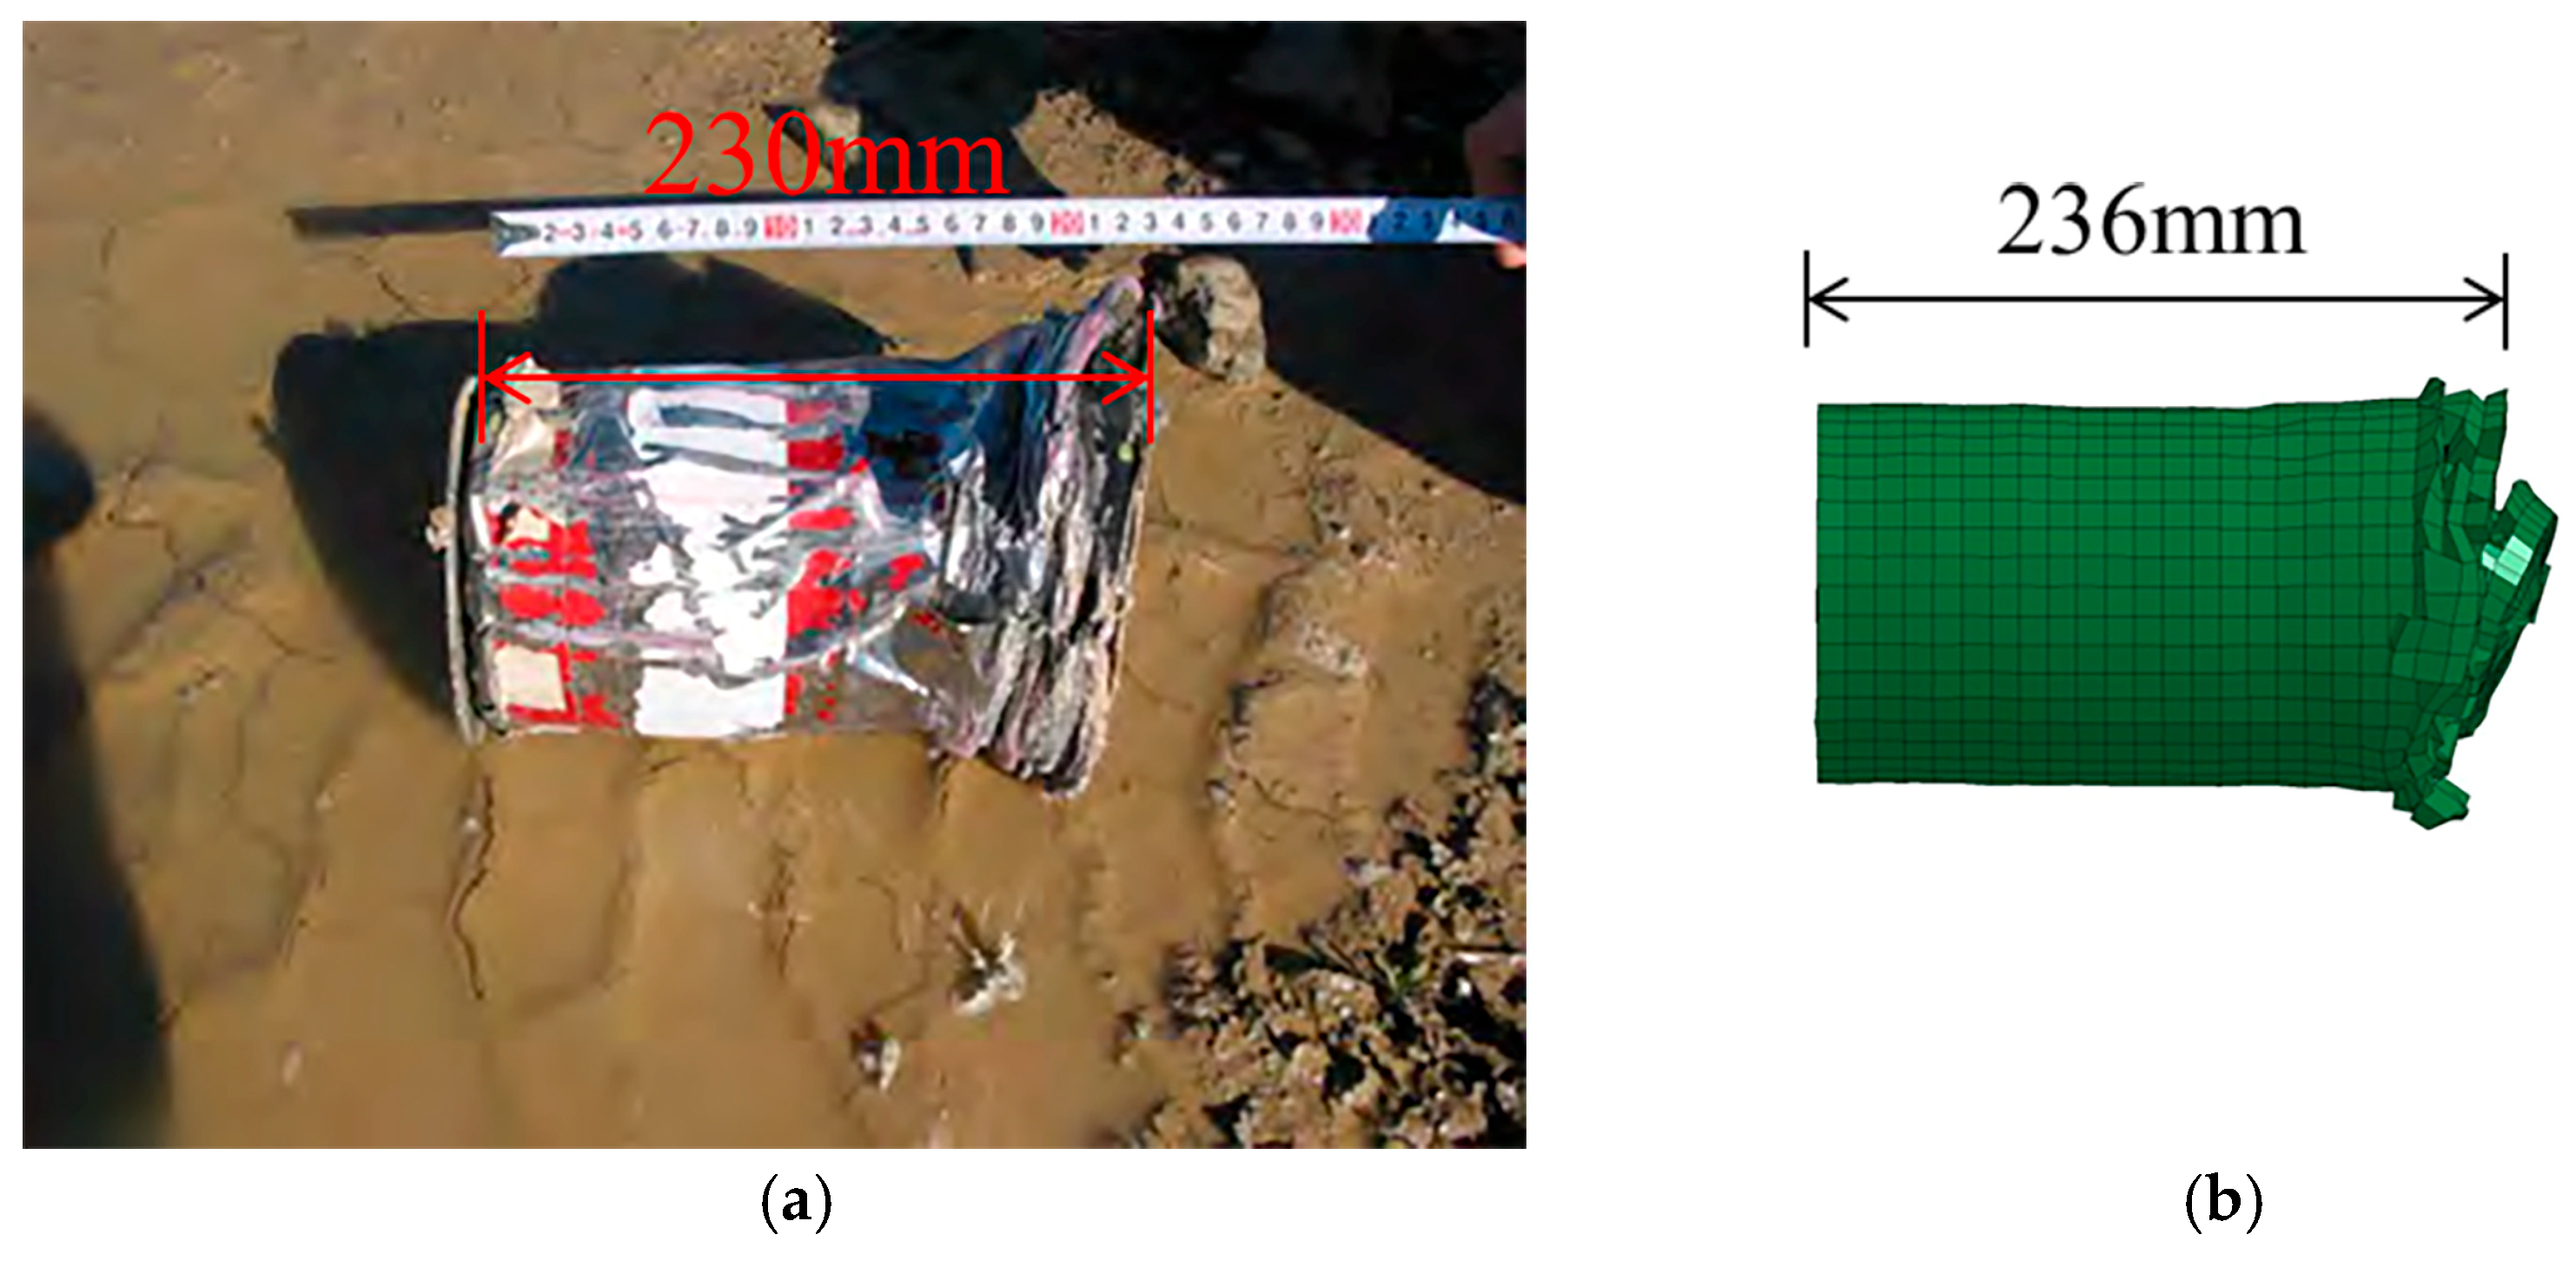
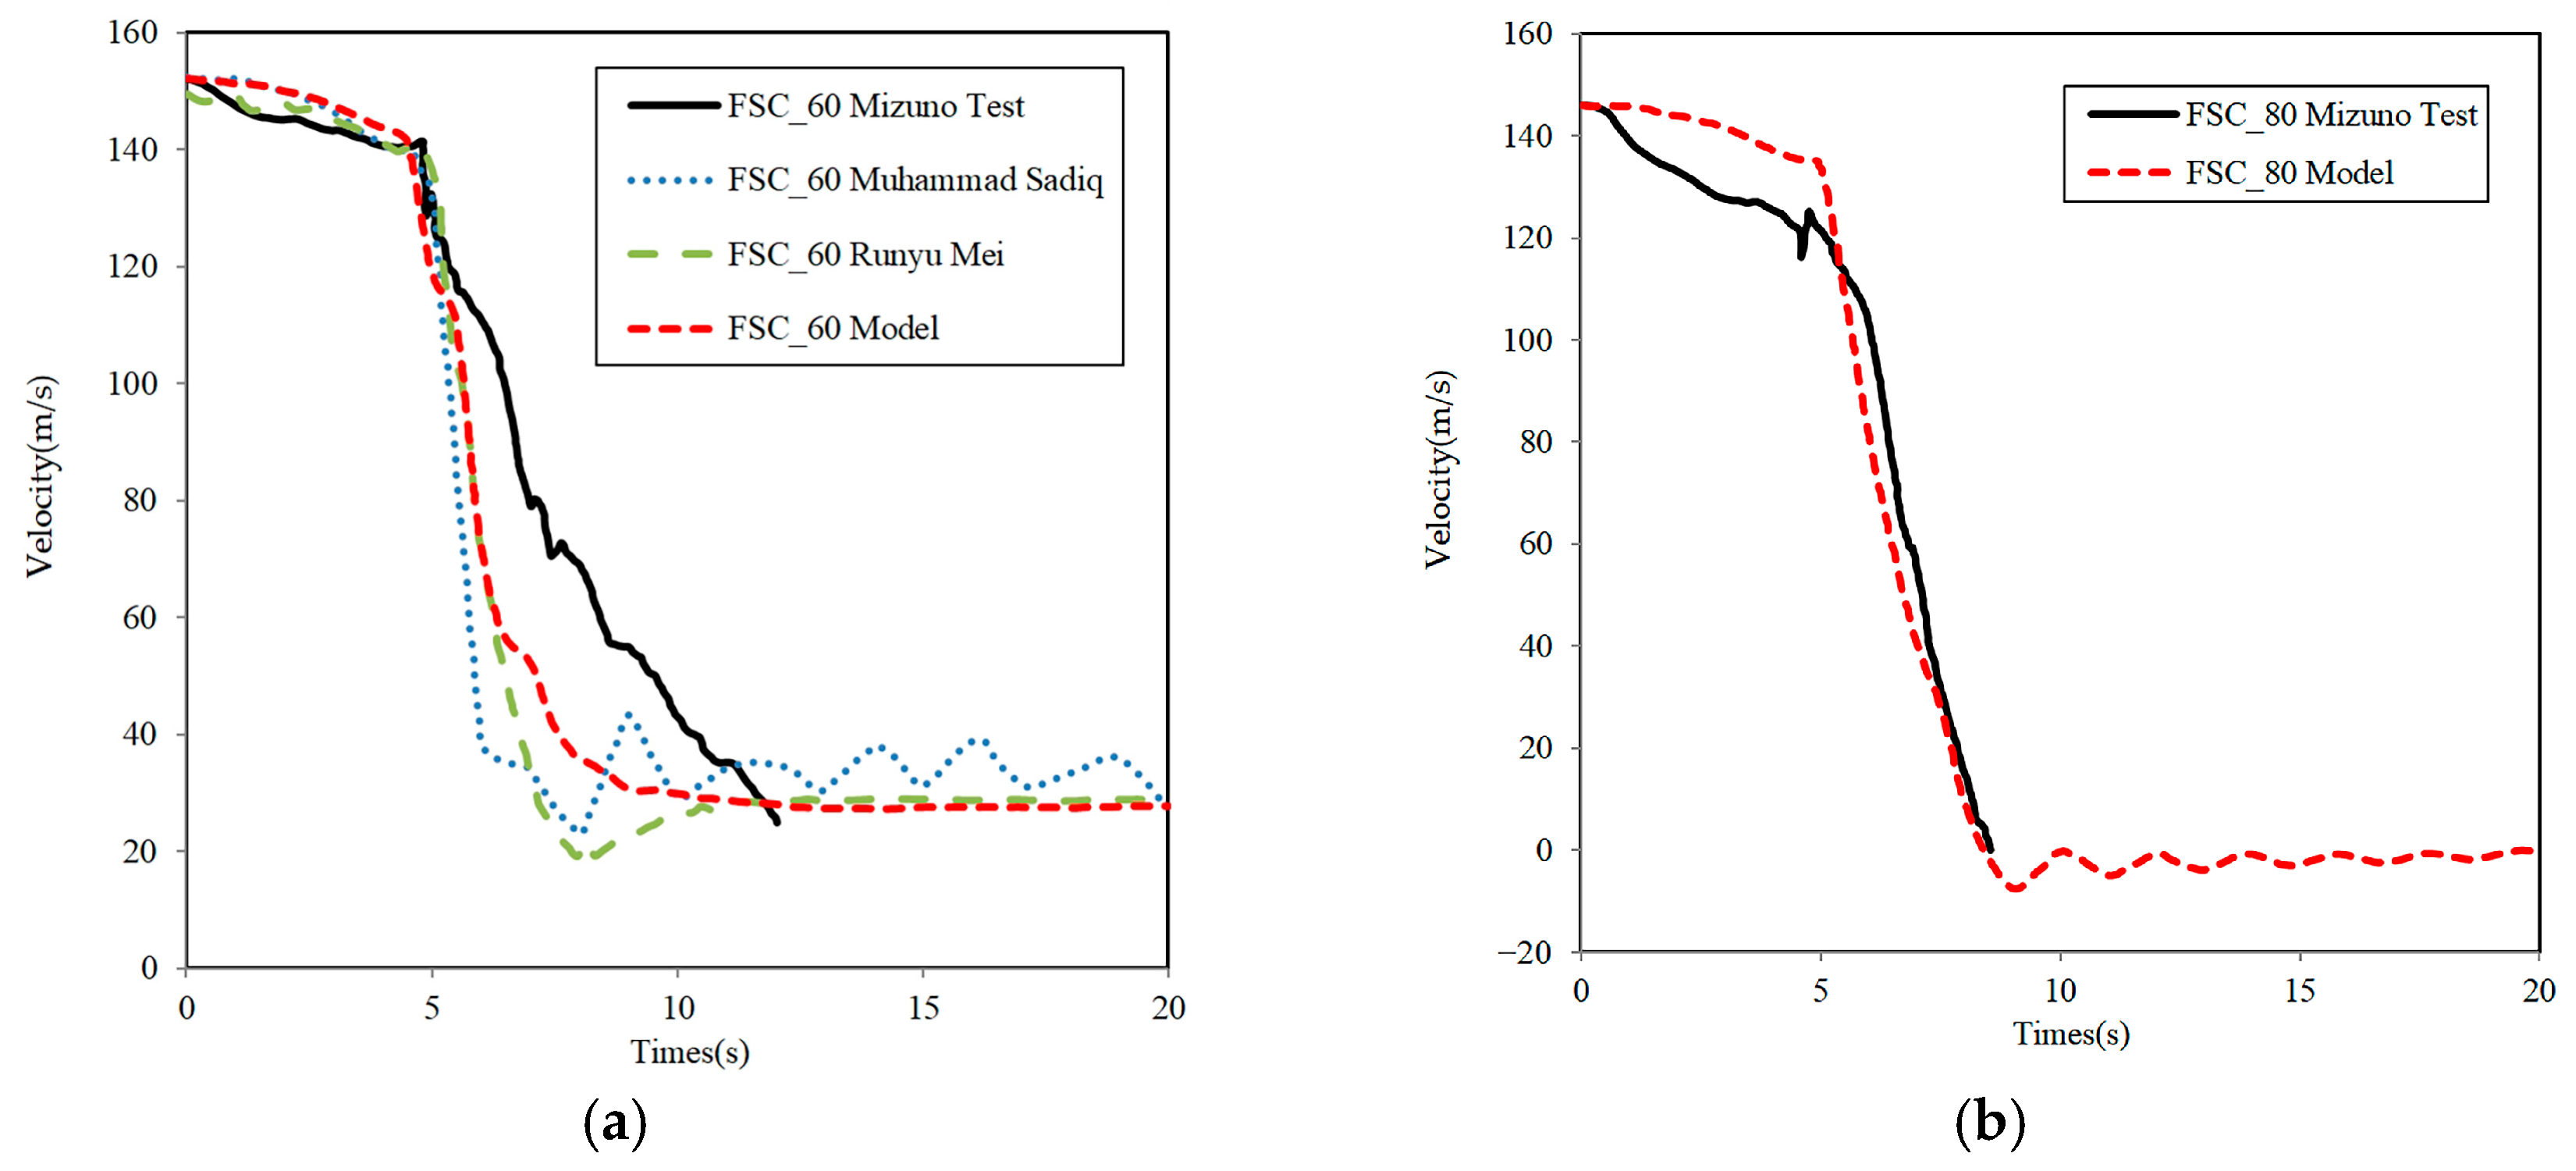
To further validate the numerical modeling approach, impact experiments conducted by Mizuno et al. [41], involving a 1:7.5-scale aircraft impacting steel-plate–normal-reinforced-concrete (S-NRC) panels (RC panels with a front steel faceplate), were simulated. The FE model of the scaled aircraft is presented in Figure 11. Two panel thicknesses (60 mm and 80 mm) were tested at measured impact velocities of 152 m/s and 146 m/s, respectively. Figure 12 depicts the fracture process of the scaled aircraft impacting the FSC60 and FSC80 panels. Post-impact deformation damage of the aircraft engine against the FSC80 panel is presented in Figure 13. Numerical simulation results indicate an engine deformation length of 236 mm, closely matching the experimentally observed length of approximately 230 mm, with a relative error of about 2.6%. The velocity–time history curves of the aircraft engine impacting FSC60 and FSC80 panels are illustrated in Figure 14. The numerical velocity–time history curves closely correspond to the experimental data and previously published numerical results by Sadiq et al. [7] and Mei et al. [42]. Consequently, the validation analyses demonstrate that the adopted concrete constitutive model parameters and simulation methodologies are robust and appropriate for accurately predicting the structural response of concrete-based protective structures subjected to high-velocity aircraft impacts.

2.4. Sensitivity Analysis of FE Modeling

2.4.1. Mesh Sensitivity Analysis

To ensure the accuracy and convergence of numerical analyses, a mesh sensitivity study was conducted. Three different mesh sizes (400 mm, 600 mm, and 800 mm) at the impact region of the cylindrical containment wall were evaluated. All simulations were performed under identical conditions: an A340-300 aircraft impacting at a velocity of 150 m/s, with a containment thickness of 1.1 m, UHPC core grade of C150, and impact location at the mid-height of the cylindrical section. The displacement–time histories at the impact location for different mesh sizes are compared in Figure 15a. The peak absolute displacements were 143.34 mm for the 400 mm mesh, 137.83 mm for the 600 mm mesh, and 126.80 mm for the 800 mm mesh. These results indicate that refining the mesh from 800 mm to 600 mm improved the accuracy of peak displacement prediction by approximately 8.71%, while further refinement to 400 mm resulted in only a minor increase of 4%. Therefore, the 600 mm mesh was adopted in subsequent analyses as a balanced choice between numerical accuracy and computational cost.
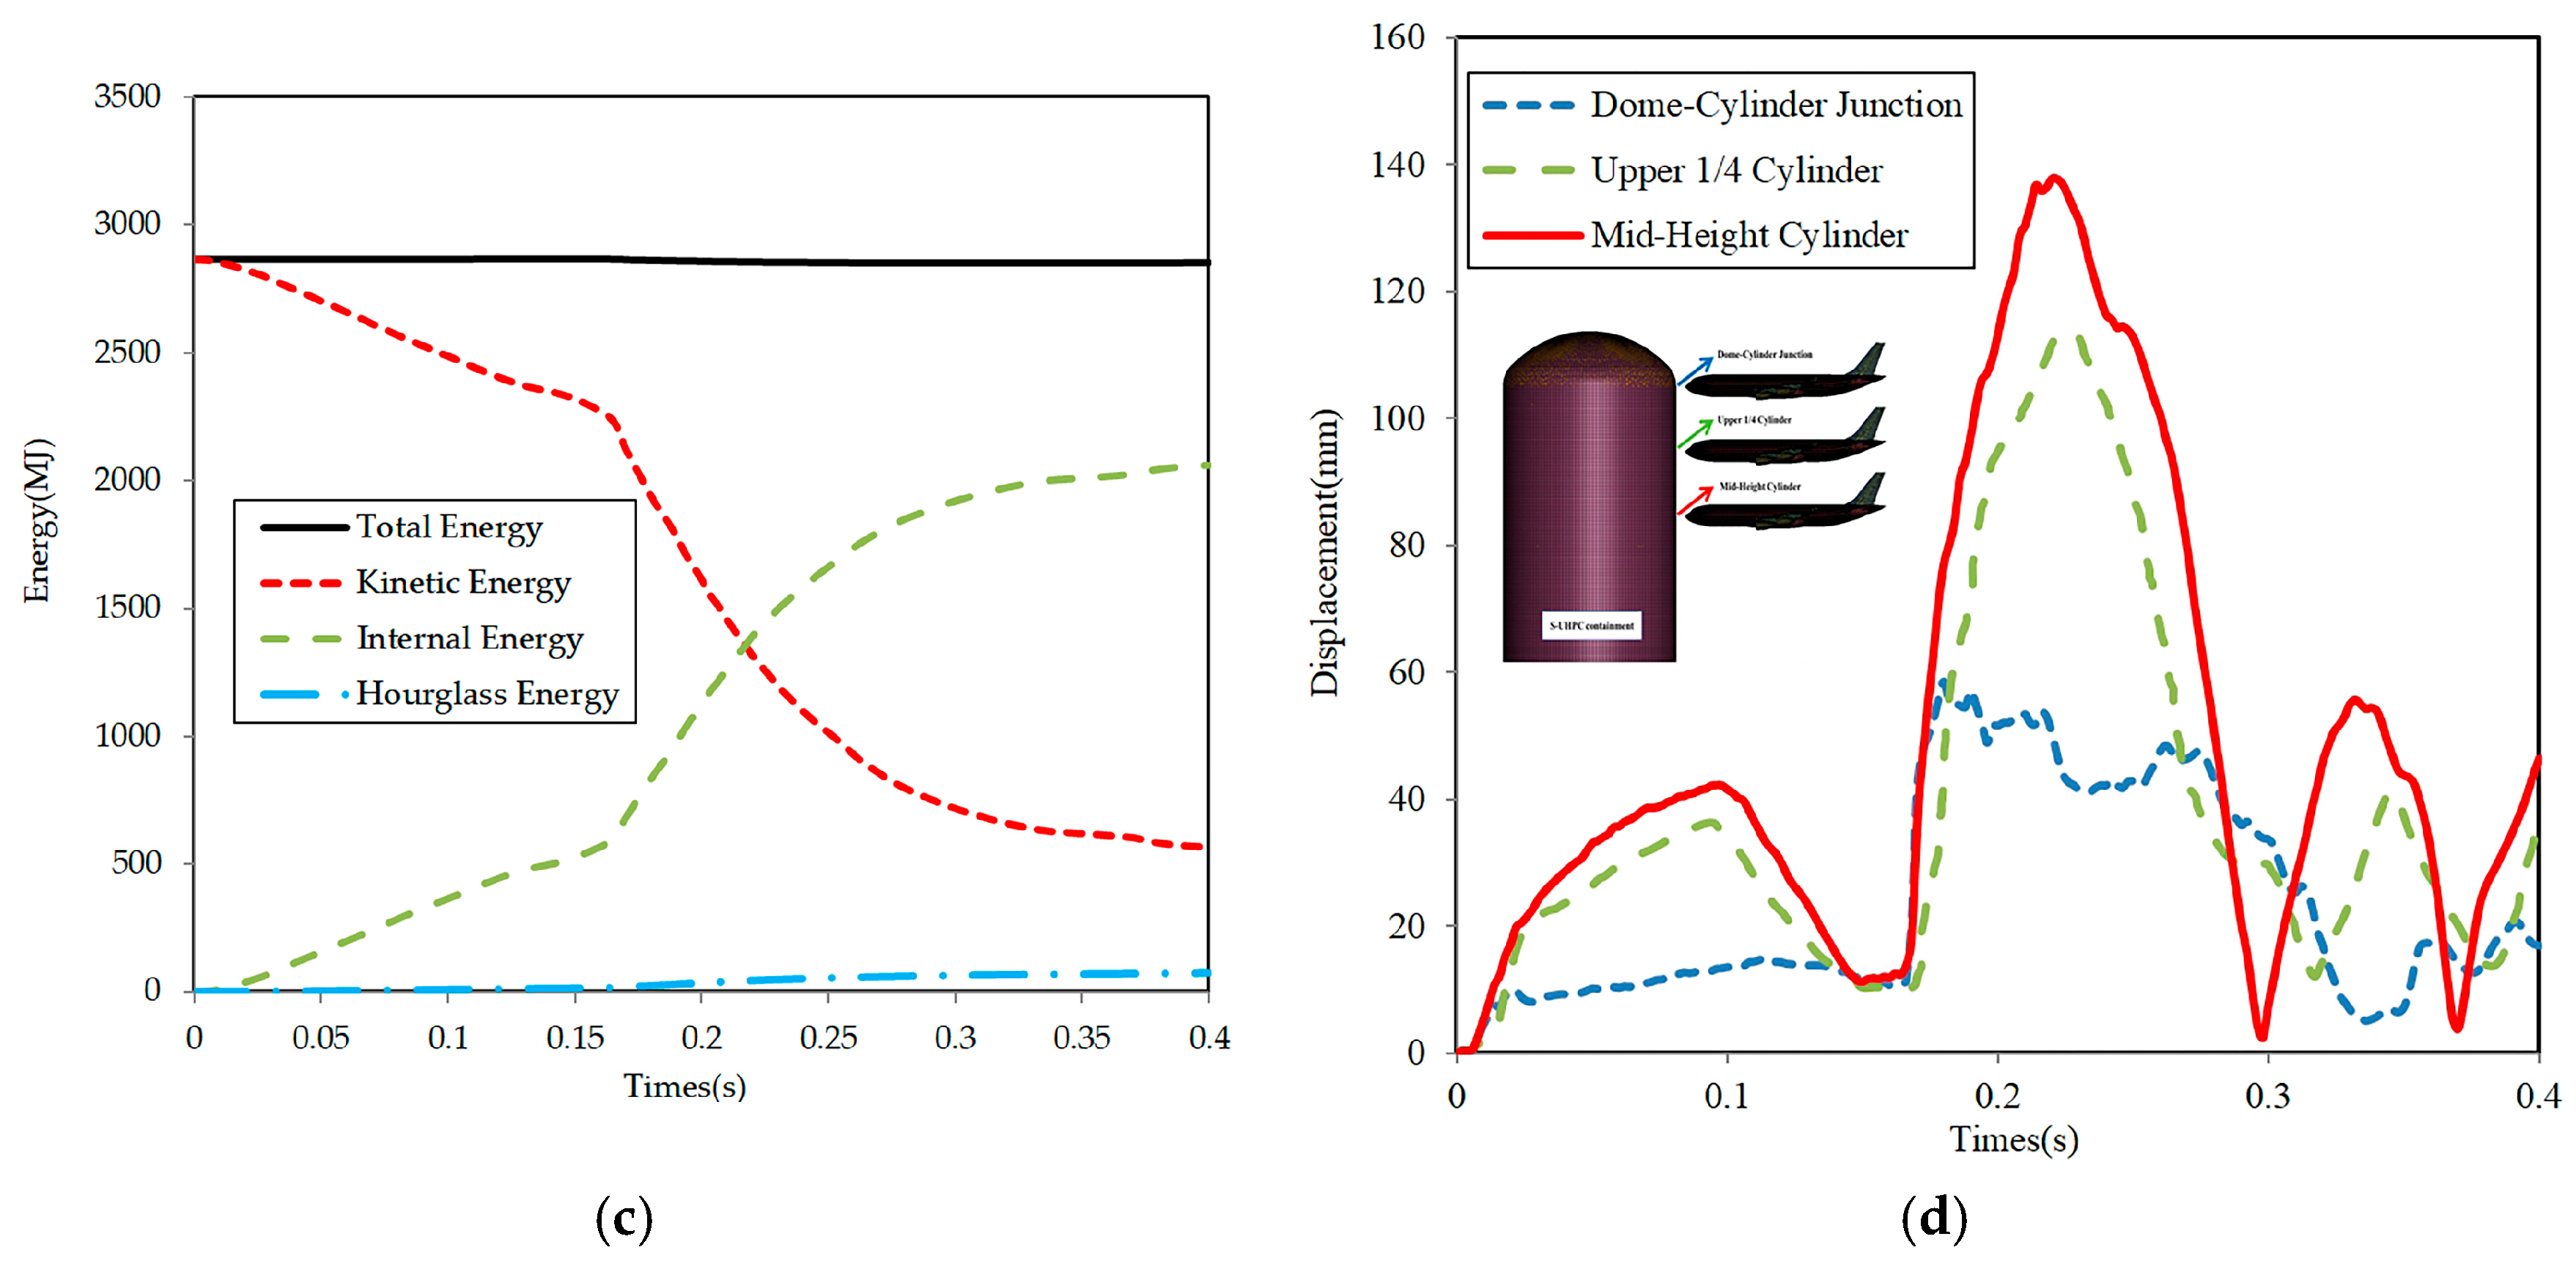
Beyond peak metrics, Figure 15b plots residual time histories relative to the finest mesh (Δ = 400 mm): the Δ = 600 mm and 800 mm traces are linearly interpolated onto the 400 mm time vector, and u Δ ( t ) u 400 ( t ) is shown over the common window, yielding RMS errors of 3.75% (600 mm) and 13.09% (800 mm). The peak displacements are 143.34 (400 mm), 137.83 (600 mm, 3.85%), and 126.80 (800 mm, 11.54%). A three-mesh Richardson/GCI estimate gives an apparent order p ≈ 1.71, extrapolated peak u e x t ≈ 148.85, and a Grid Convergence Index for the fine–medium pair (GCI_{21}, Δ = 400/600 mm) of ≈ 4.81%. We adopted acceptance thresholds of ≤5% for the global QoI and ≤5% for representative local QoIs (e.g., peak faceplate von Mises stress, UHPC maximum principal stress near the impact zone, connector peak force). Under this criterion, Δ = 600 mm is mesh-adequate for the reported responses. As shown in Figure 15c, the total energy remains nearly constant (<1% variation), kinetic energy transfers to internal energy, as expected, and the hourglass-to-total energy ratio peaks at 2.6% (average of 1.28%), indicating stable explicit integration and adequate hourglass control.

2.4.2. Impact Location Sensitivity Analysis

Three representative impact locations were considered to identify the most conservative scenario: the dome–cylinder junction, the upper quarter height of the cylindrical containment, and the mid-height of the cylindrical containment. All simulations adopted the 600 mm mesh, A340-300 aircraft, UHPC grade C150, 1.1 m thickness, and 150 m/s impact velocity.
The displacement–time histories at these three impact locations are presented in Figure 15b. The maximum displacement at the mid-height cylindrical position (137.83 mm) was notably higher than the dome–cylinder junction (58.55 mm) and upper quarter cylindrical position (113.59 mm). This clearly indicates that impacts at the cylindrical mid-height location yield the most conservative structural response. Hence, subsequent analyses were conducted with impacts targeted at the cylindrical mid-height location.

3. Impact Response and Sensitivity Analysis

To comprehensively investigate the dynamic response and impact resistance of S-UHPC containment structures subjected to large commercial aircraft impacts, sensitivity analyses were systematically conducted in this section, considering variations in aircraft types, impact velocities, containment thicknesses, UHPC strength grades (including comparisons with conventional concrete), stud diameters, and steel plate thicknesses.

3.1. Sensitivity Analysis of Different Aircraft Types

To clarify the influence of different aircraft models on the impact response of the S-UHPC containment structure, this subsection investigates four representative large commercial aircraft: Airbus A340-300, Airbus A380, Boeing 767-200, and Boeing 747-400. The containment wall thickness is uniformly set to 800 mm, the UHPC core grade is C150, and the impact location is fixed at the mid-height of the cylindrical section. Aircraft impact velocities are considered at 100 m/s, 150 m/s, and 200 m/s to analyze the combined effects of aircraft types and impact velocities on structural responses.
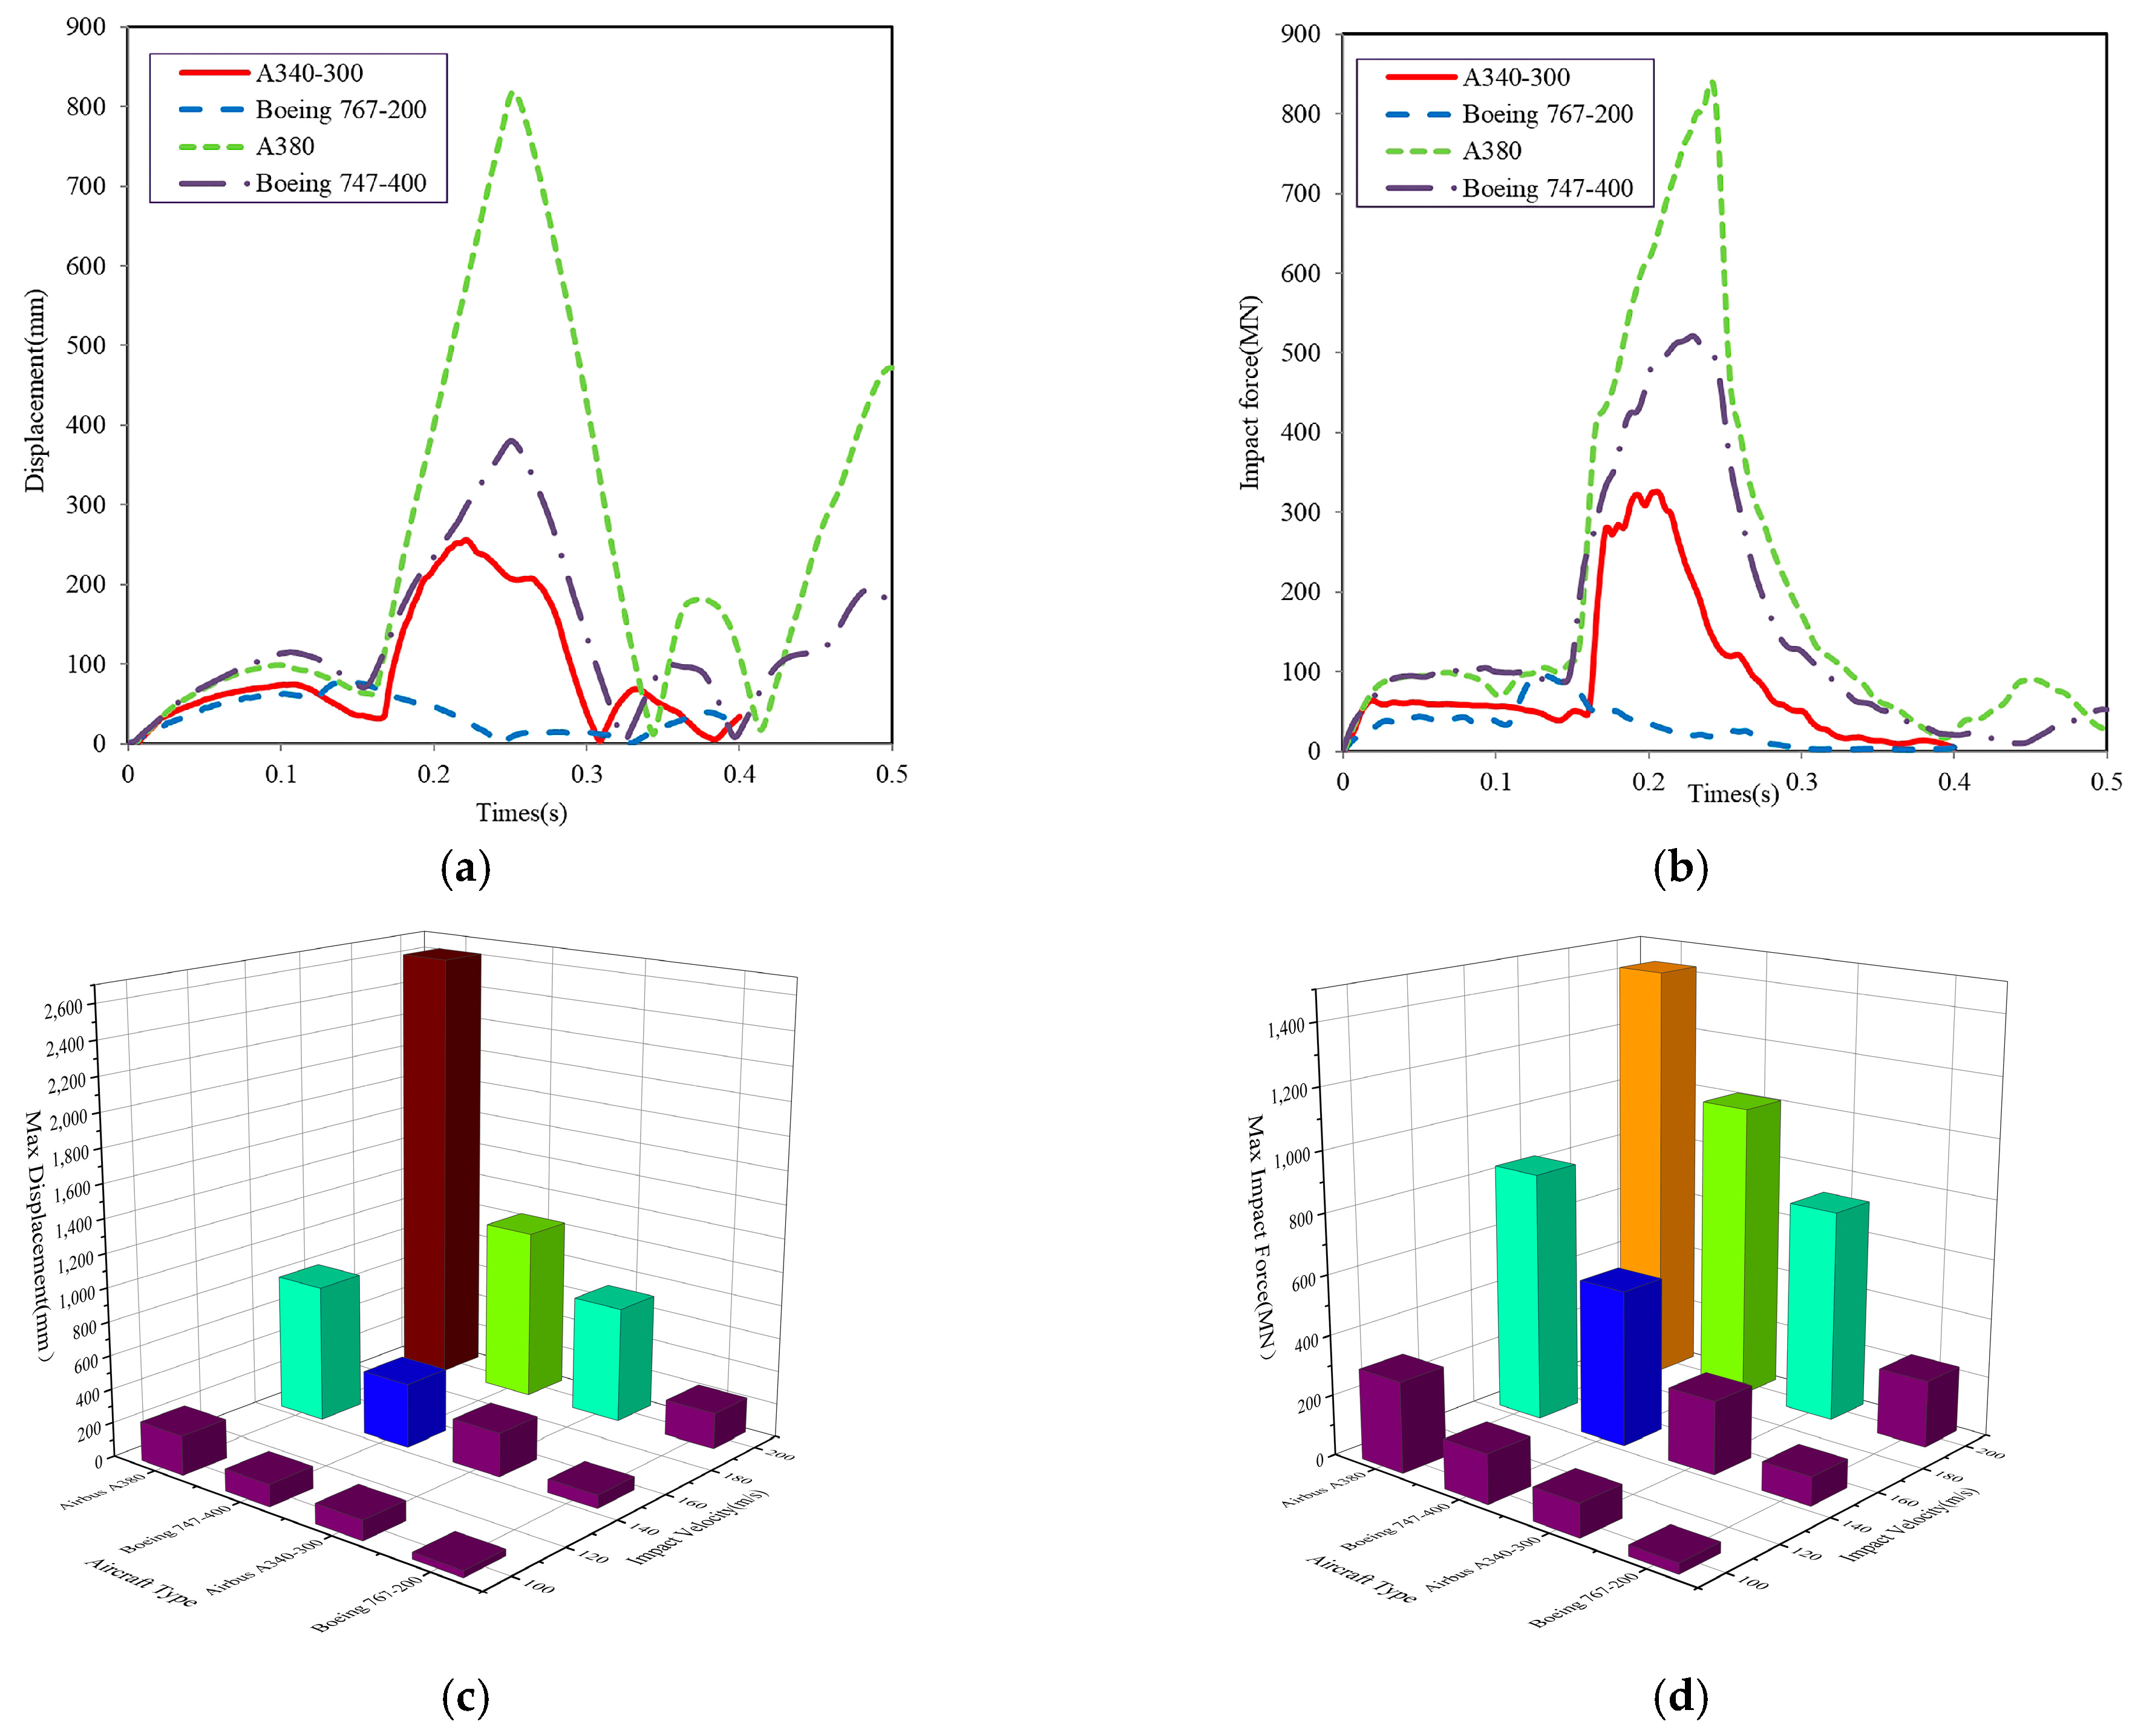
Figure 16a shows the displacement–time histories at the impact location for four aircraft types impacting the containment structure at 150 m/s: Airbus A340-300, Airbus A380, Boeing 747-400, and Boeing 767-200. Structural deformation increases rapidly after the initial contact and reaches its peak between approximately 0.14 s and 0.25 s. Among the four aircraft, the Airbus A380 induces the most severe deformation, with a peak displacement of 818.65 mm at 0.252 s, followed by the B747-400 (380.28 mm at 0.25 s), the A340-300 (255.61 mm at 0.222 s), and the B767-200 (78.44 mm at 0.142 s). The timing of these peak responses corresponds closely with the moment when each aircraft’s main mass components—particularly the wings and engine–fuel tank assemblies—collide with the containment structure. Minor post-peak rebounds are observed in some cases, indicating partial recovery of the S-UHPC containment wall due to its high stiffness and ductility. Figure 16b presents the corresponding impact force–time histories. The peak forces also occur at distinct times across aircraft types, generally between 0.13 s and 0.24 s. These peak values align with the impact of high-mass sections such as the central fuselage and engine regions. The A380 again produces the largest peak impact force, reaching 839.55 MN at 0.24 s, followed by the B747-400 (521.13 MN at 0.228 s), A340-300 (325.89 MN at 0.206 s), and B767-200 (95.16 MN at 0.13 s). The force–time curves display multi-peak patterns. Typically, the initial peak corresponds to the cockpit impact, while subsequent dominant peaks are caused by heavier structures like the wings and fuel tanks. These findings emphasize that the aircraft’s mass distribution plays a decisive role in determining the severity and timing of structural responses.
To further visualize the dynamic process of the impact, Figure 16e–h display sequential snapshots of the A340-300 aircraft striking the steel–UHPC containment wall at 150 m/s, captured at 0.1 s, 0.2 s, 0.3 s, and 0.4 s, respectively. At 0.1 s, the aircraft nose initiates contact with the containment, triggering localized crushing. By 0.2 s, the front fuselage and engine region exhibit severe damage with clear fragmentation. At 0.3 s, the main wings and fuel tank areas engage the wall, leading to widespread deformation and debris ejection. At 0.4 s, the tail section continues forward under inertia, colliding with the already deformed region and further exacerbating structural breakup. This sequence illustrates a progressive crushing process and energy dissipation mechanism, consistent with the mass distribution along the aircraft’s longitudinal axis.
Figure 16c,d provide 3D bar charts summarizing the relationships among aircraft types, impact velocities (100, 150, and 200 m/s), and their corresponding peak impact forces and maximum displacements. The structural response exhibits pronounced nonlinear growth with increasing impact velocity. The A380 consistently generates the highest response across all velocity levels. At 150 m/s, it produces a peak impact force of approximately 840 MN and a displacement of 818.65 mm. In comparison, the B767-200 yields only 95 MN and 78.44 mm, respectively. These disparities are largely due to significant differences in aircraft mass and dimensions.
Taking the A340-300 as a representative case, increasing the impact velocity from 100 m/s to 200 m/s raises the peak impact force from 110.49 MN to 716.99 MN and the maximum displacement from 116.83 mm to 695.46 mm. Similar trends are observed across the other aircraft models. The findings confirm that the peak impact force approximately follows a quadratic relationship with impact velocity, underscoring the high sensitivity of structural response to velocity variations. These results support the necessity of considering extreme high-speed impact scenarios in containment design and nuclear safety evaluations.

3.2. Sensitivity Analysis of Impact Velocity

To evaluate the influence of impact velocity on structural response, three scenarios involving an A340-300 aircraft impacting at velocities of 100 m/s, 150 m/s, and 200 m/s were compared. The containment wall thickness was fixed at 800 mm, the UHPC core had a strength grade of C150, and the impact occurred at the mid-height of the cylindrical section.
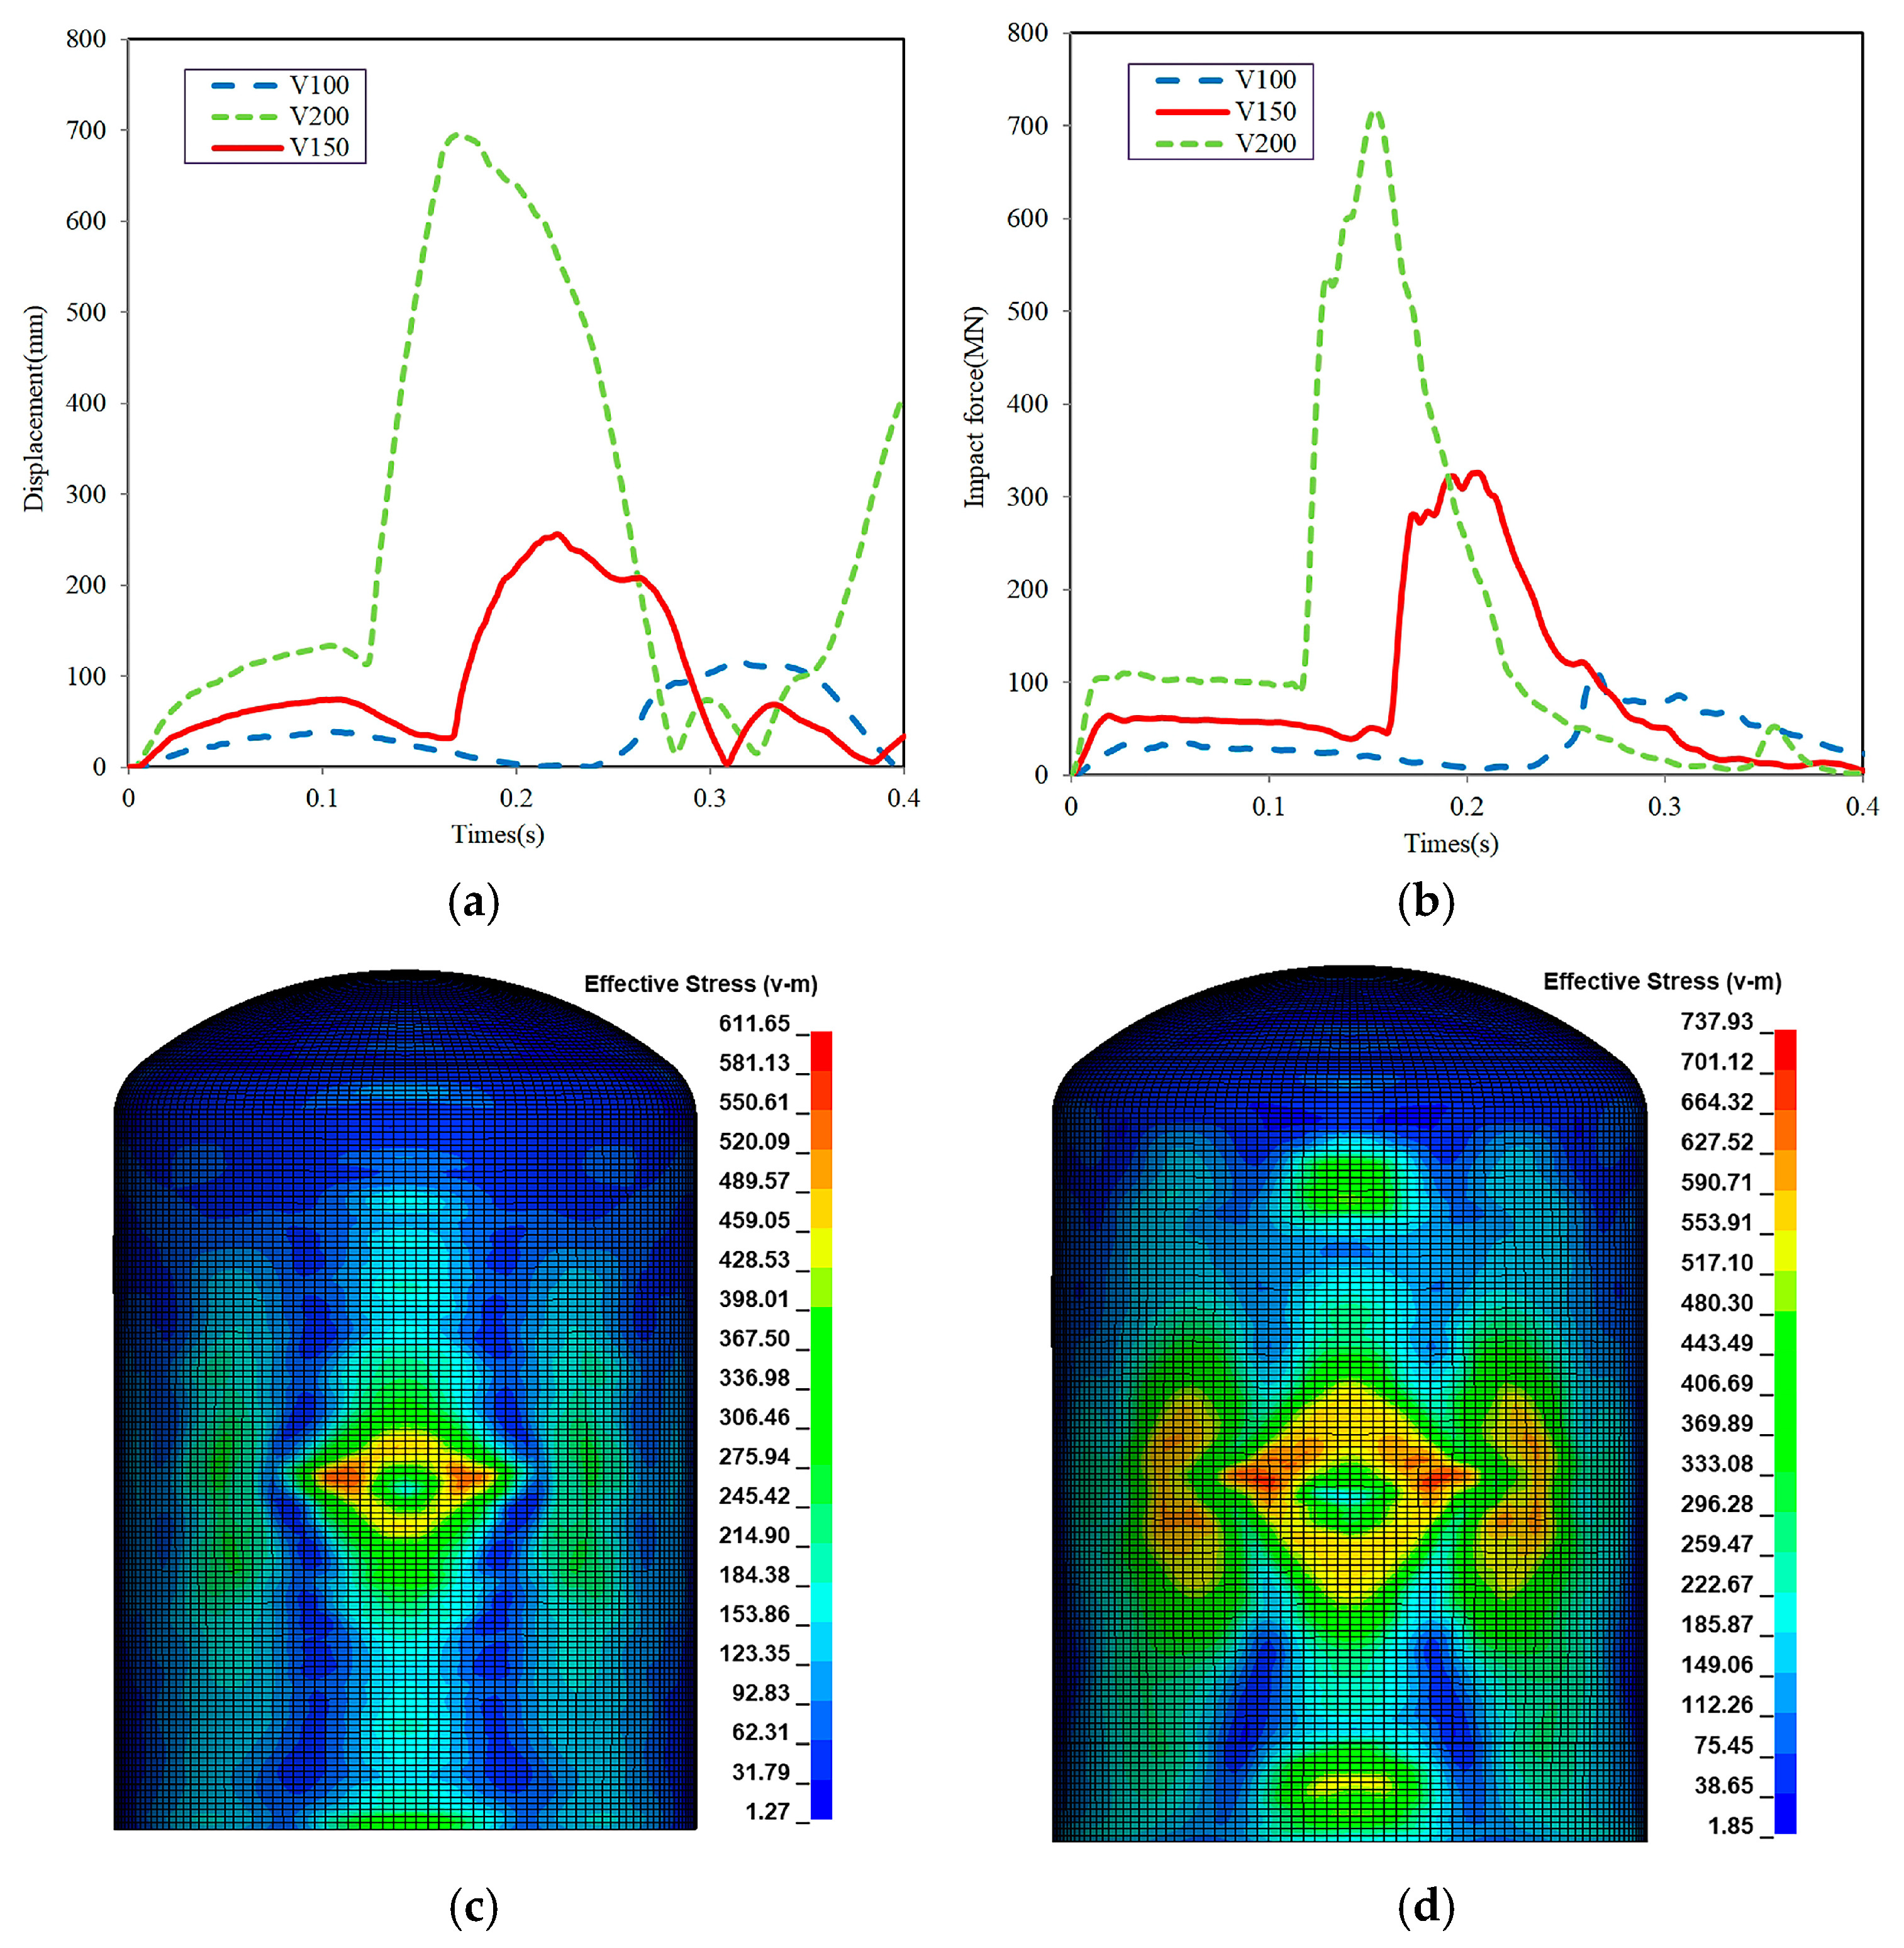
Figure 17a presents displacement–time histories at the containment impact location under varying impact velocities (100 m/s, 150 m/s, and 200 m/s). Structural deformation increases substantially as impact velocity rises, with peak displacement occurring earlier at higher velocities. Specifically, the peak displacement at 100 m/s is approximately 116.83 mm at 0.312 s, increasing significantly to 255.61 mm at 150 m/s (occurring at 0.222 s) and surging dramatically to 695.46 mm at 200 m/s (at 0.170 s). This clearly demonstrates that higher impact velocities markedly intensify structural deformation and accelerate the response. Correspondingly, Figure 17b illustrates impact force–time histories, similarly reflecting substantial increments in peak impact force and earlier peak occurrences with higher velocities. The peak force at 100 m/s is 110.49 MN (0.264 s), escalating to 325.89 MN at 150 m/s (0.206 s), and further dramatically increasing to 716.99 MN at 200 m/s (0.154 s). Moreover, the increasingly prominent multi-peak nature of impact force curves at higher velocities underscores the intensified interactions of heavy mass zones (wings, engines, and fuel tanks) of the aircraft during high-speed impacts.
Figure 17c,d display the von Mises stress contours of the outer steel plate at peak impact force under 150 m/s and 200 m/s, respectively. In both cases, a distinct elliptical region of stress concentration is observed around the impact area. As the velocity increases, the peak stress rises from approximately 612 MPa to 738 MPa, and the high-stress zones expand in both radial and axial directions. This suggests more severe local stress states under higher impact velocities, potentially increasing the risk of local failure.
In summary, the impact velocity significantly affects the structural response, leading to nonlinear increases in displacement and impact force, earlier peak occurrences, and higher local stress levels. These amplification effects under high-speed impacts should be fully considered in the structural design and assessment.

3.3. Sensitivity Analysis of Containment Thickness and Material Type

To assess the effect of containment wall thickness and material type on impact response, this section examines both the variation in S-UHPC wall thickness (600 mm, 800 mm, and 1100 mm) under a 150 m/s impact and a material comparison between S-UHPC and conventional steel-reinforced ordinary concrete under a 200 m/s impact. The ordinary concrete wall adopts a typical containment thickness of 1100 mm, while the S-UHPC wall is 800 mm thick.
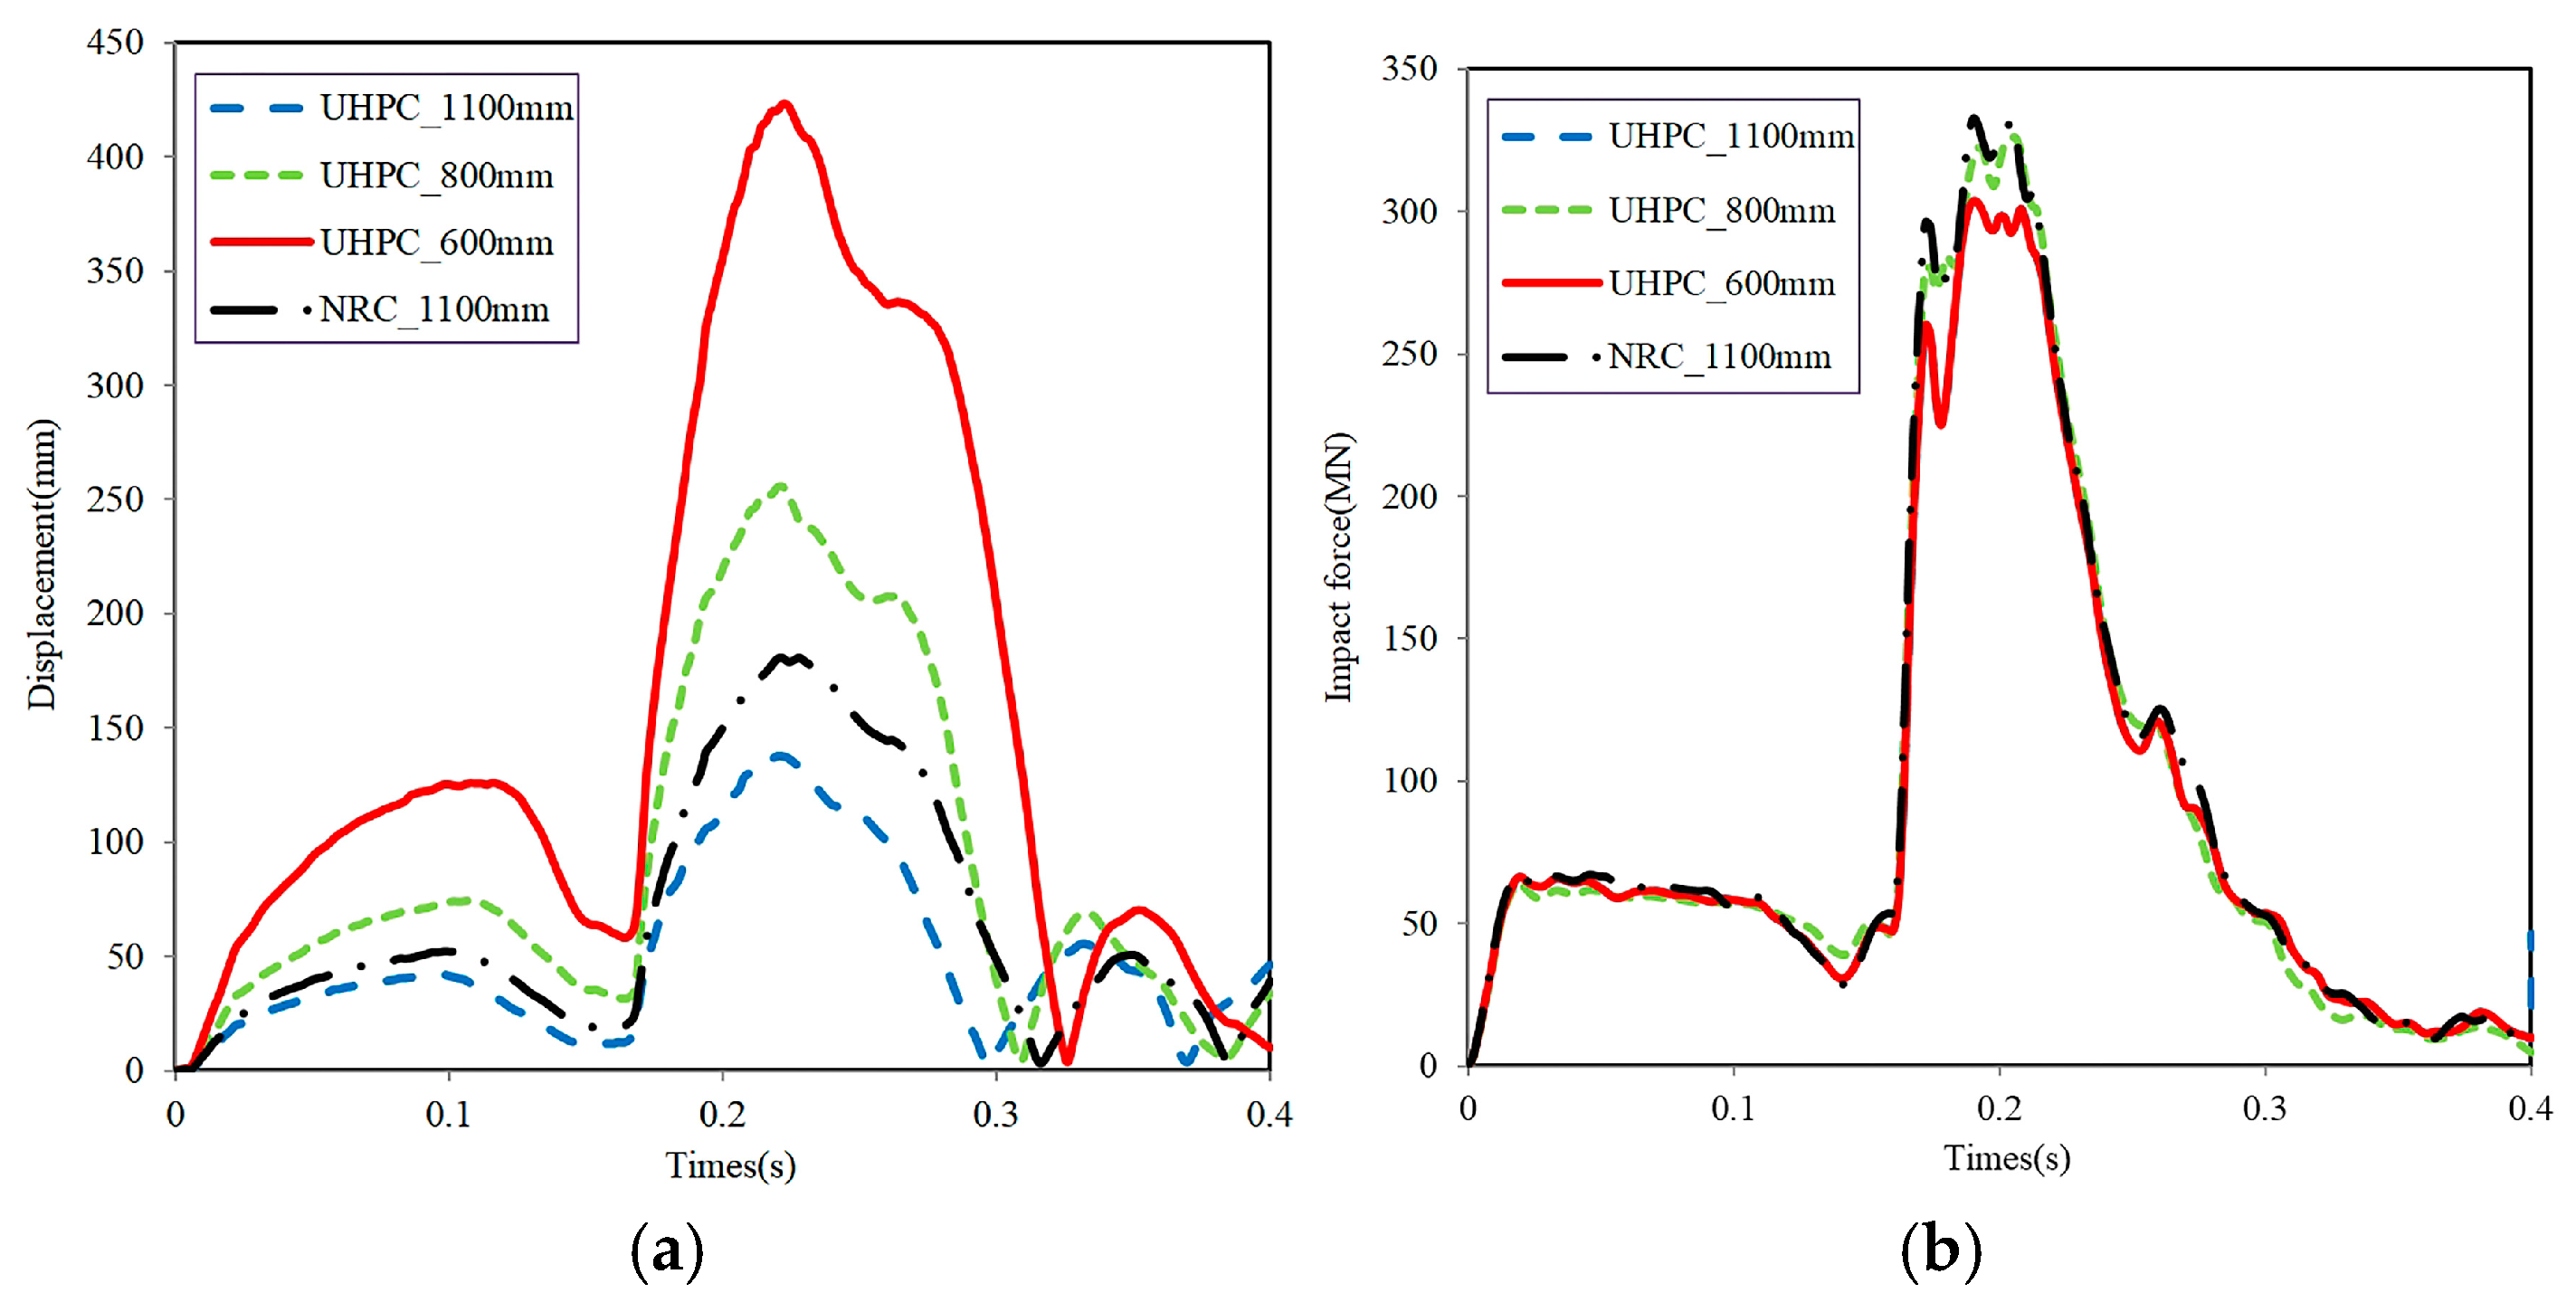
Figure 18a,b illustrate the displacement and impact force–time histories under different wall thicknesses and material types. As shown in the summary table, under a 150 m/s impact, the peak displacement of S-UHPC structures decreases significantly with increasing thickness—from 423.2 mm at 600 mm to 255.6 mm at 800 mm and down to 137.8 mm at 1100 mm—highlighting the critical role of thickness in controlling deformation. Importantly, for the same 1100 mm thickness, the conventional normal concrete (NRC) structure exhibits a peak displacement of 180.8 mm, which is higher than that of the 1100 mm S-UHPC (137.8 mm), suggesting improved stiffness and deformation resistance offered by UHPC under identical geometry. Impact force data in Figure 18b shows that peak forces remain in the range of 303–333 MN across all cases. The NRC case produces the highest peak force (332.7 MN), while the 800 mm S-UHPC structure—despite its reduced thickness—achieves a comparable peak force of 325.9 MN, indicating strong load resistance. Taken together, these results confirm that increasing the thickness helps mitigate deformation, and S-UHPC structures exhibit superior impact resistance and faster response compared to normal concrete structures at equal thickness.
Figure 18c,d show the damage distribution in the UHPC core and the von Mises stress of the outer steel plate for an 800 mm S-UHPC containment subjected to a 200 m/s impact. The UHPC damage is highly localized near the impact region, with a peak damage index of approximately 0.89. No through-thickness failure is observed, and the damage zone remains compact, indicating effective damage control under high-velocity loading. The corresponding steel plate stress distribution shows a peak von Mises stress around 738 MPa, concentrated near the lateral zones of impact, with no signs of structural instability or yielding.
Figure 18e,f illustrate the response of a 1100 mm steel–normal concrete (NRC) containment under the same 200 m/s impact condition. The NRC core exhibits significantly more extensive damage, with a peak damage index reaching 1.0 and widespread through-thickness cracking. The damage zone expands both axially and radially, exhibiting typical brittle failure characteristics. The steel plate experiences a peak von Mises stress of 915 MPa—higher than that of the S-UHPC case—and the stress field is more dispersed, indicating more intense localized deformation and potential yielding.
This comparison reveals that, under extreme impact velocity, the 800 mm S-UHPC structure demonstrates a more confined and less severe core damage region, along with a more stable stress distribution in the steel plate, compared to the thicker 1100 mm NRC structure. These observations highlight the S-UHPC’s improved ability to maintain global integrity and mitigate local damage, even at a reduced wall thickness.

3.4. Sensitivity Analysis of UHPC Strength Grade

To evaluate the influence of UHPC compressive strength on impact response, three strength grades—C120, C150, and C180—were analyzed under a 150 m/s impact, with a wall thickness of 800 mm. The impact occurred at the mid-height of the cylindrical section, and the impacting aircraft was the A340-300.
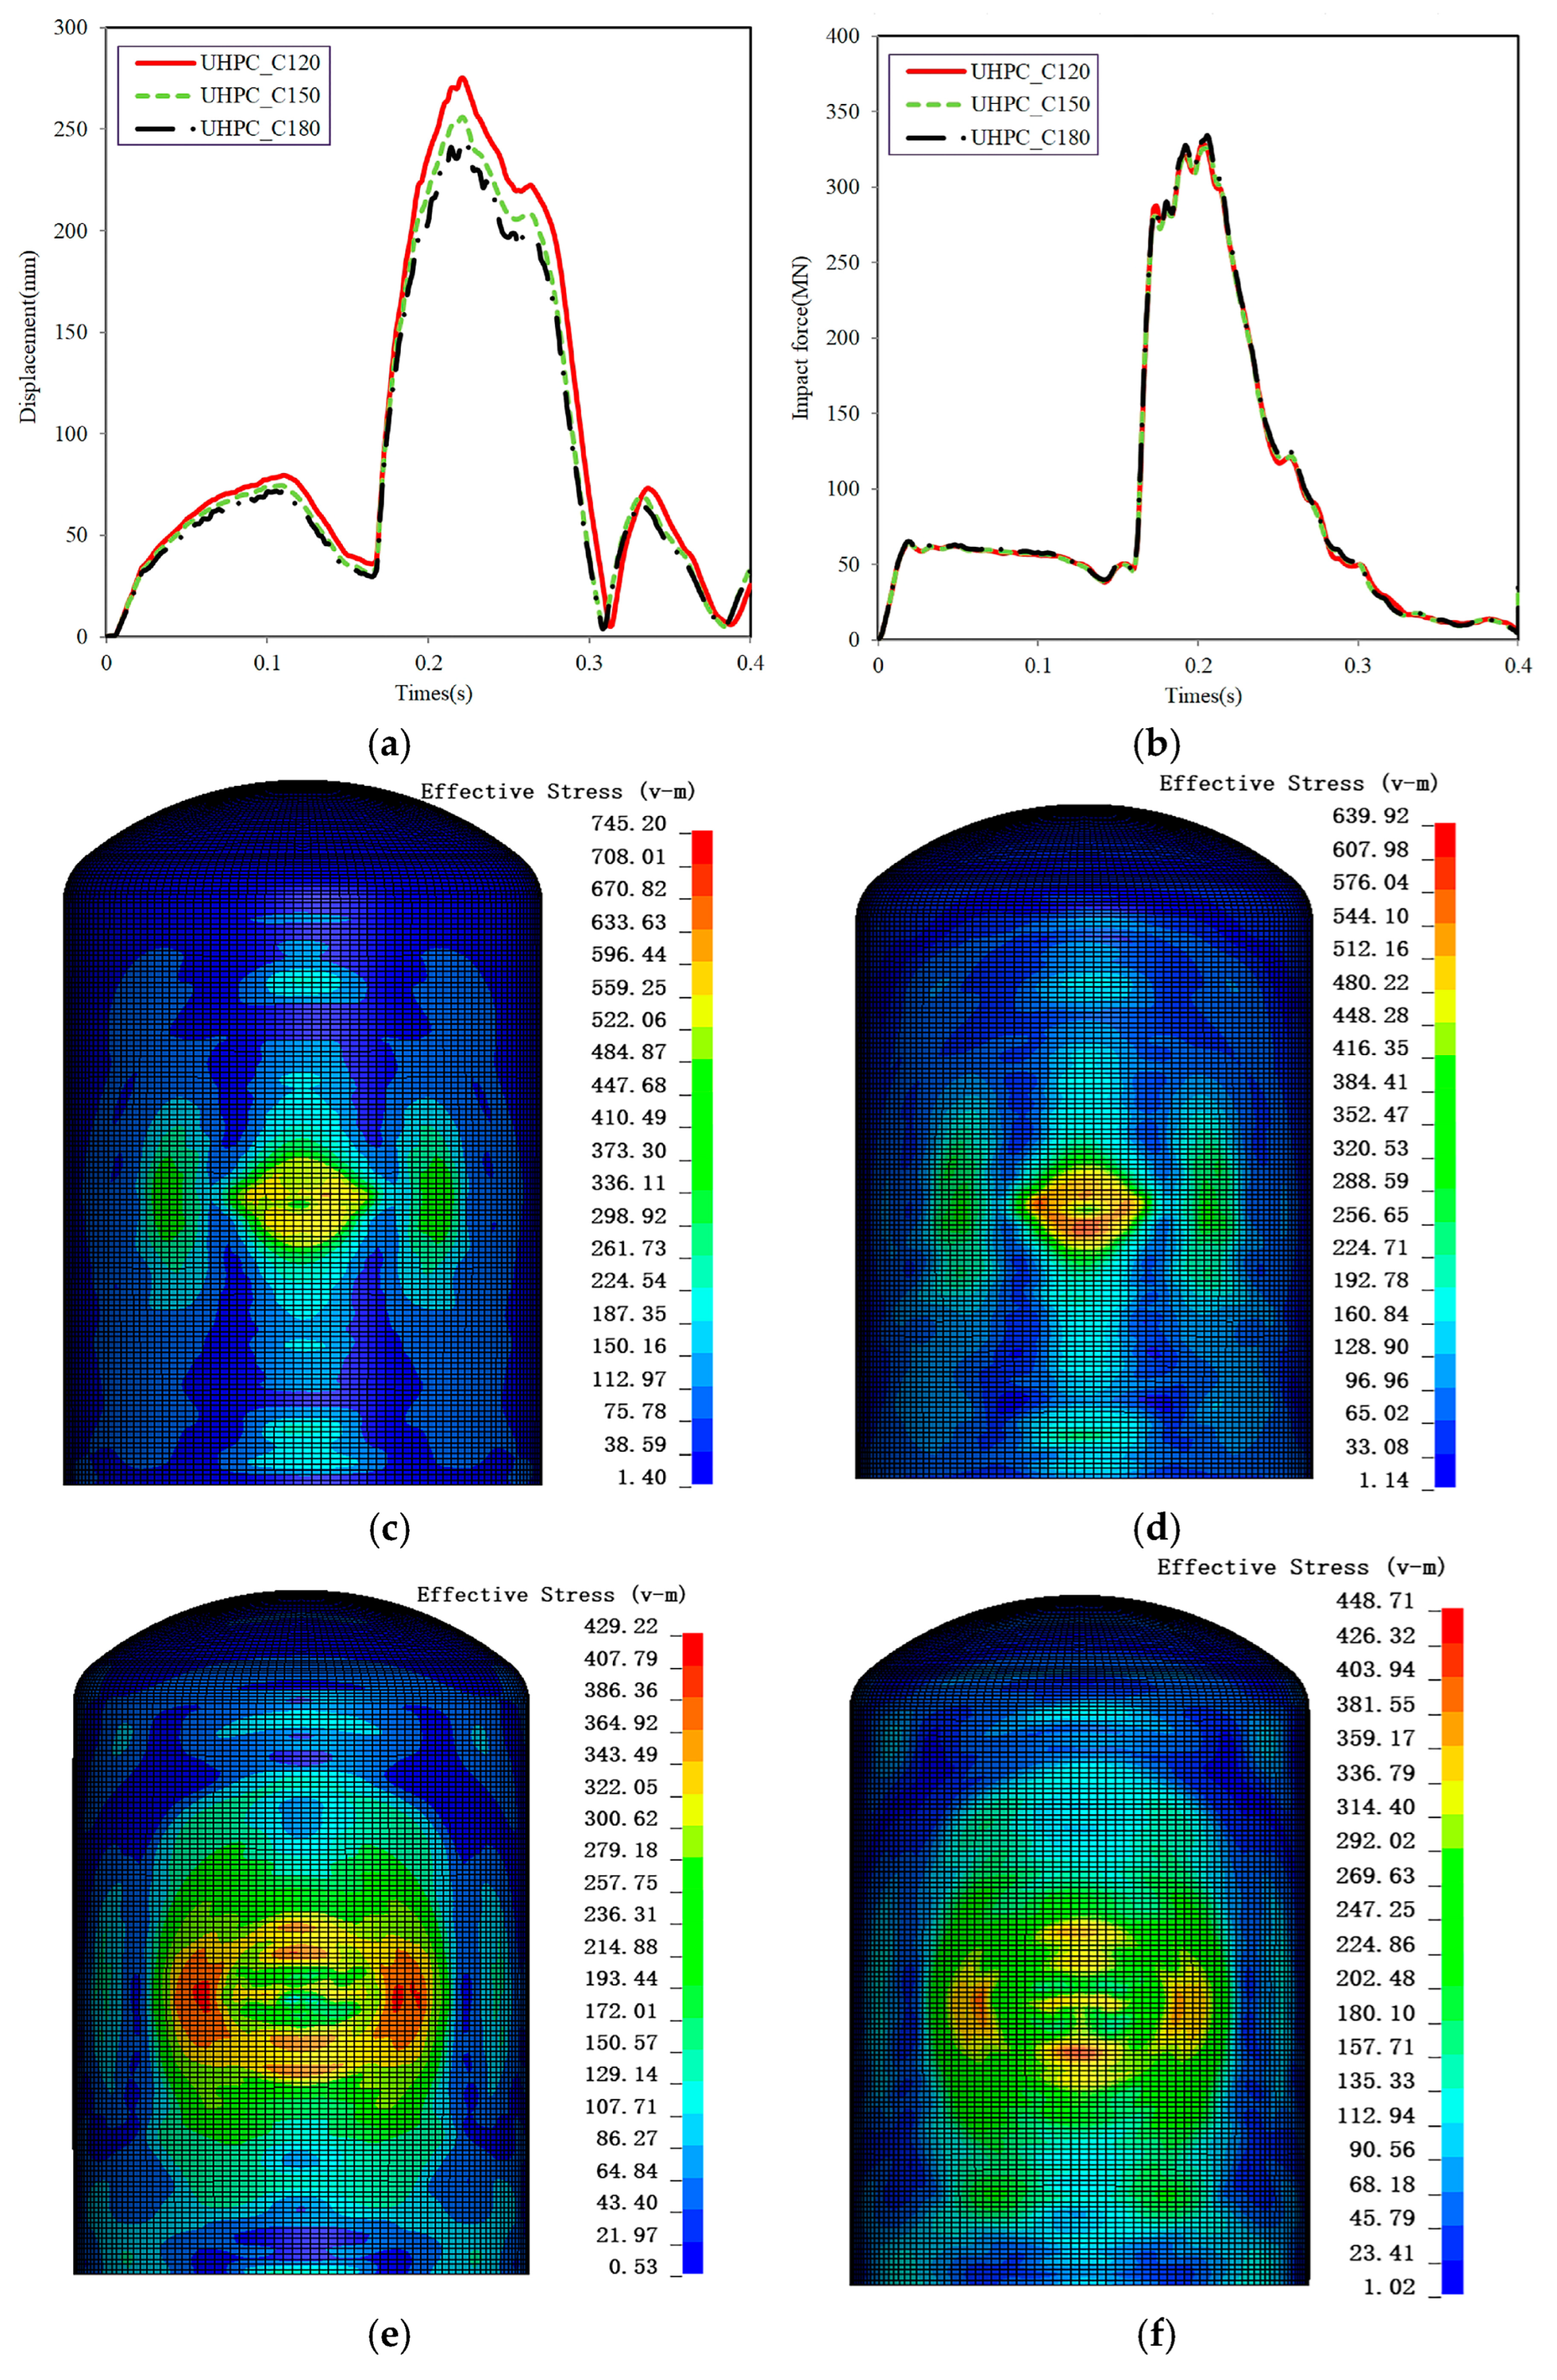
Figure 19a shows the displacement–time histories at the impact location for different UHPC grades. As the strength increased from C120 to C180, the peak displacement decreased moderately: from 274.9 mm (C120) to 255.6 mm (C150) and 243.3 mm (C180). All peak displacements occurred around 0.22 s. These results suggest that increasing UHPC strength has a marginal effect in reducing structural deformation under impact. Figure 19b presents the corresponding impact force–time histories. The peak forces—328.2 MN (C120), 325.9 MN (C150), and 334.0 MN (C180)—are very close, all occurring around 0.204 s. The overall curve shapes are similar, indicating that UHPC grade has a limited influence on force transmission and peak magnitude in this scenario.
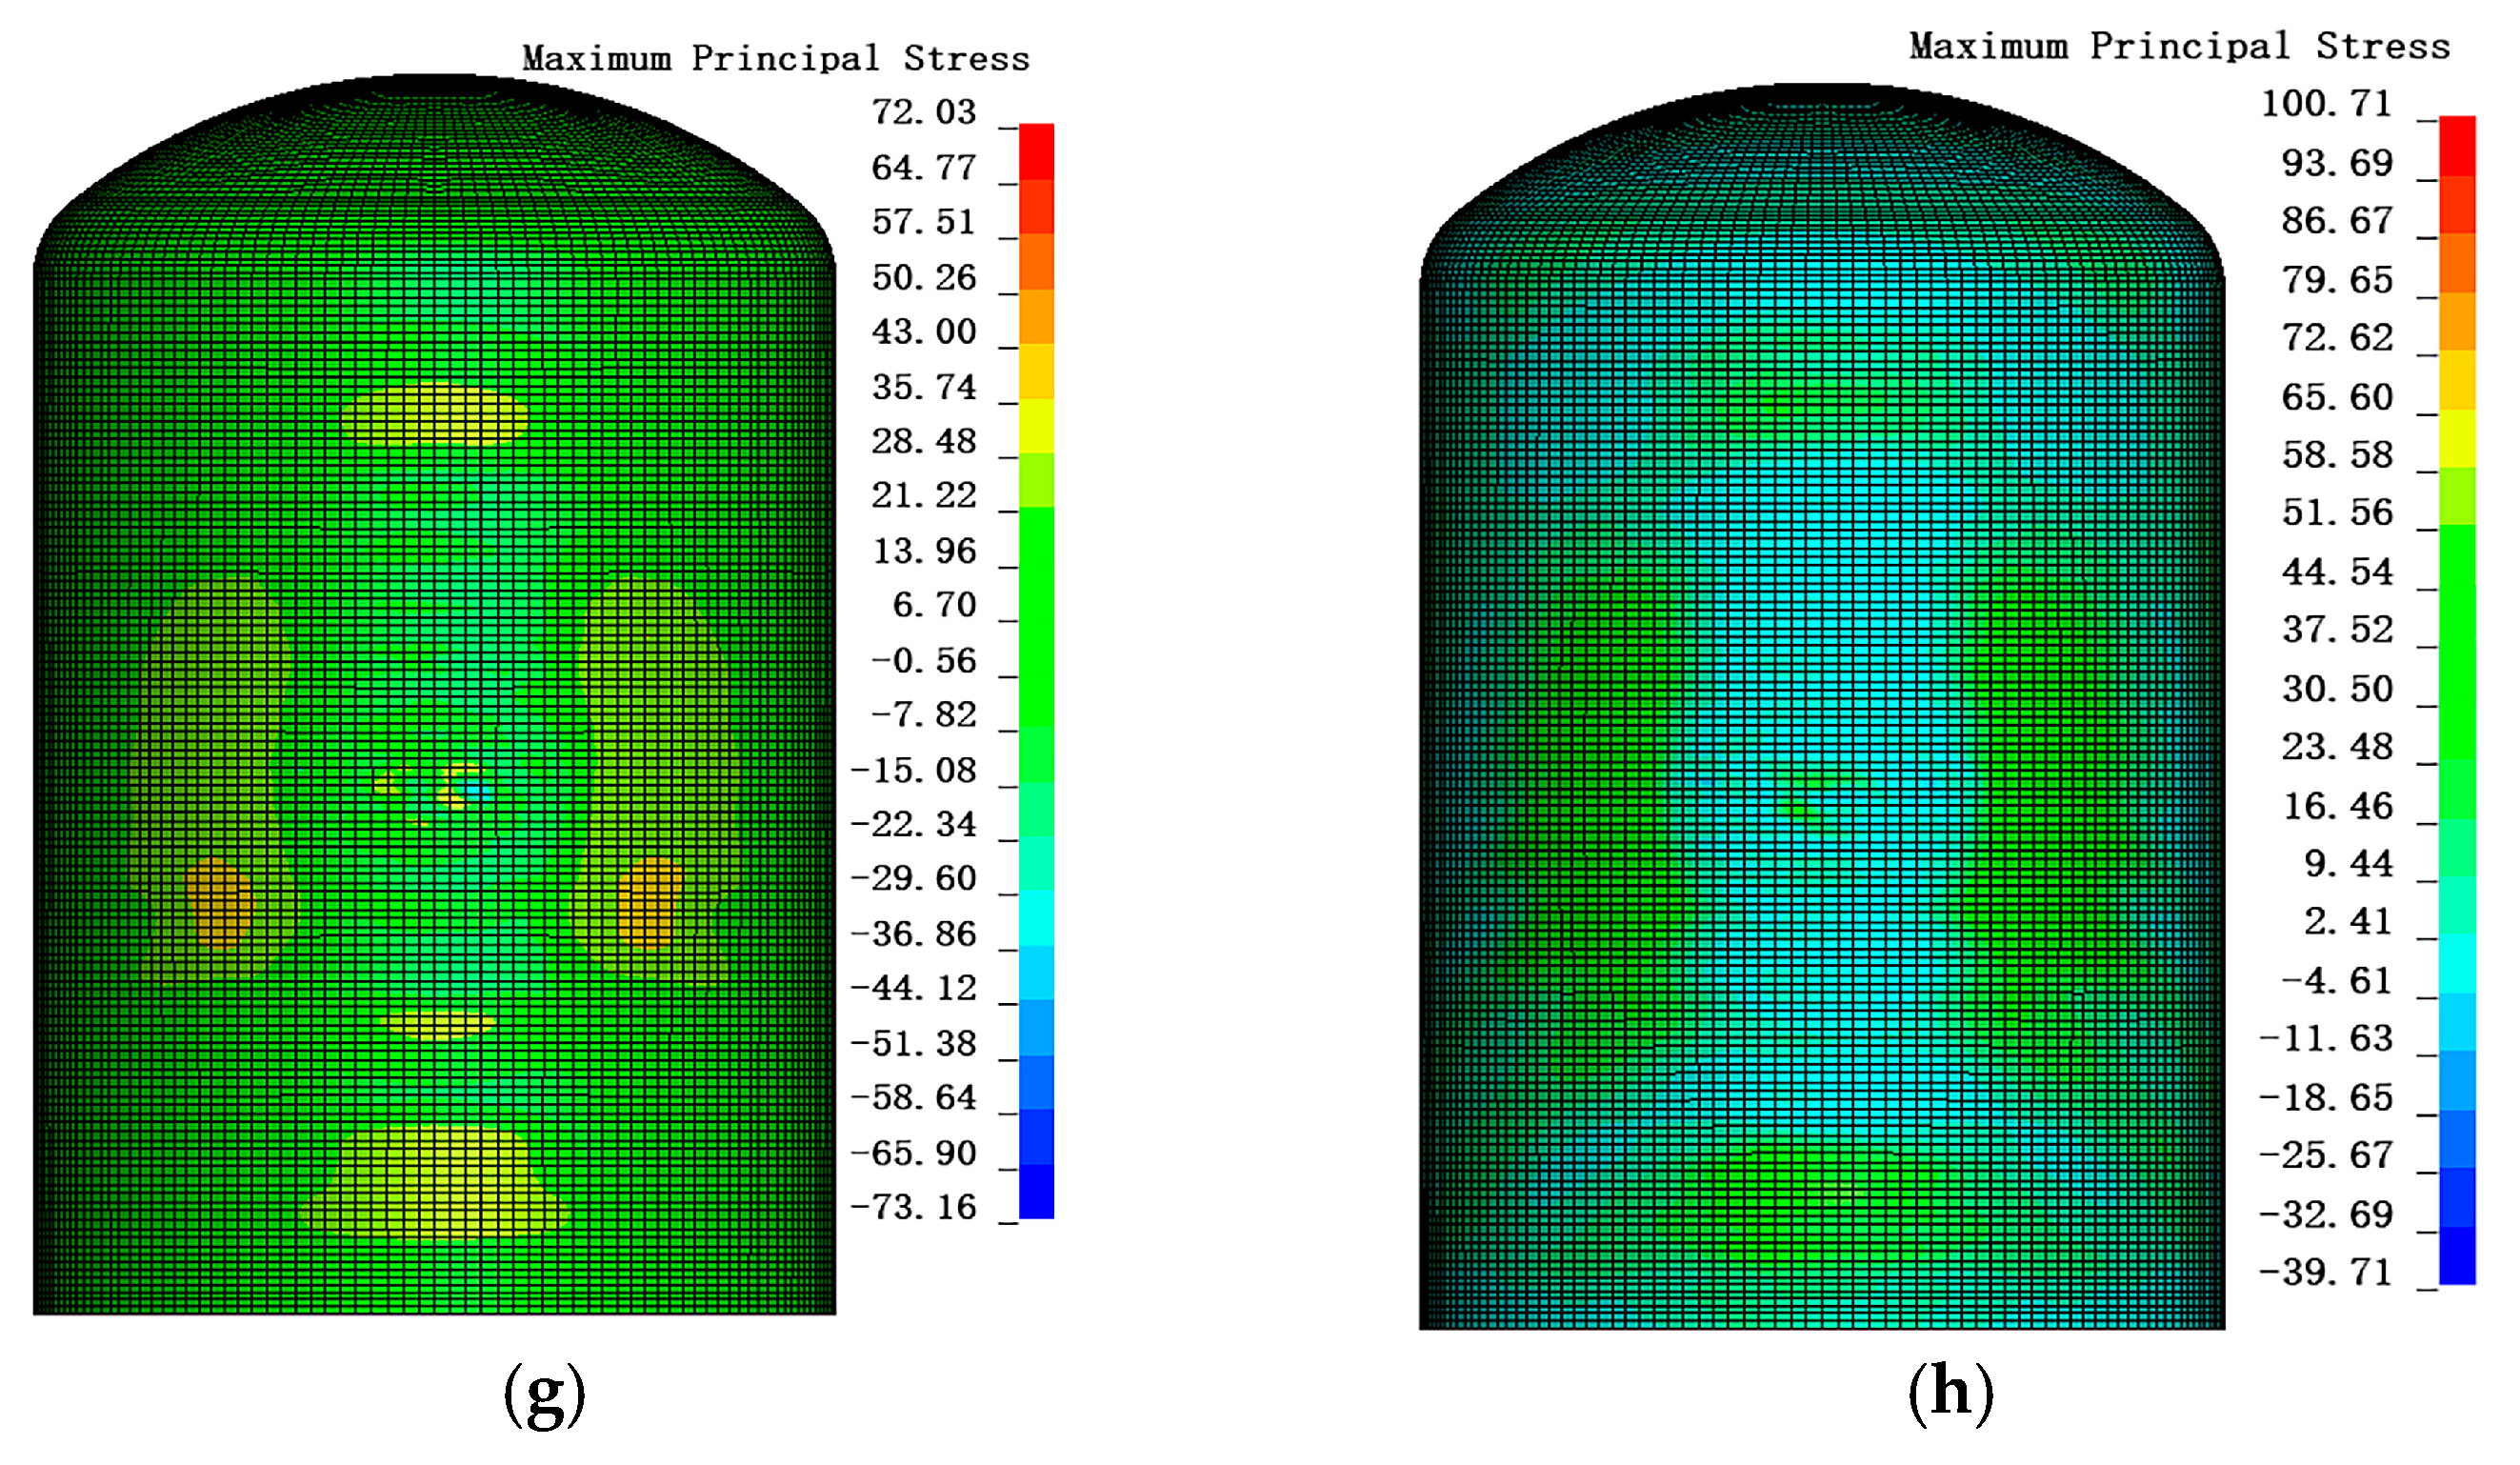
To visualize the grade effect at the governing instant, Figure 19c–h present stress contours at the peak contact force–time tpeak for the baseline case (A340-300, 150 m/s, 800 mm mesh): von Mises stress in the outer and inner steel faceplates and maximum principal stress in the UHPC core (compression negative), comparing C120 and C180. The steel faceplates exhibit similar high-stress patterns across grades, whereas the UHPC core remains under confined compression with only a localized concentration near the impact footprint. This similarity in stress fields is consistent with the limited variations observed in global metrics among the grades.
In summary, increasing UHPC strength within the range of C120 to C180 slightly improves deformation performance but has a limited effect on impact force response. This reflects the dominance of geometric stiffness and global dynamic response in such impact events and suggests that material strength enhancements should be considered in conjunction with other structural parameters.
Note: While the present sensitivity results show limited influence of compressive grade on single-event global responses, repeated-impact/fatigue studies indicate that interface and connector performance predominantly governs long-term damage accumulation in S-UHPC systems [39,40].

3.5. Sensitivity Analysis of Stud Spacing

In S-UHPC containment structures, shear studs serve as the primary load transfer mechanism between the steel plate and the UHPC core. Their spatial arrangement may affect the composite structural behavior under dynamic loading. This subsection compares structural responses under different stud spacings (5 mm, 10 mm, 15 mm, and 20 mm), as well as a no-stud case, under a 150 m/s impact with 800 mm wall thickness. The impact location is at the cylindrical mid-height, with an A340-300 aircraft.
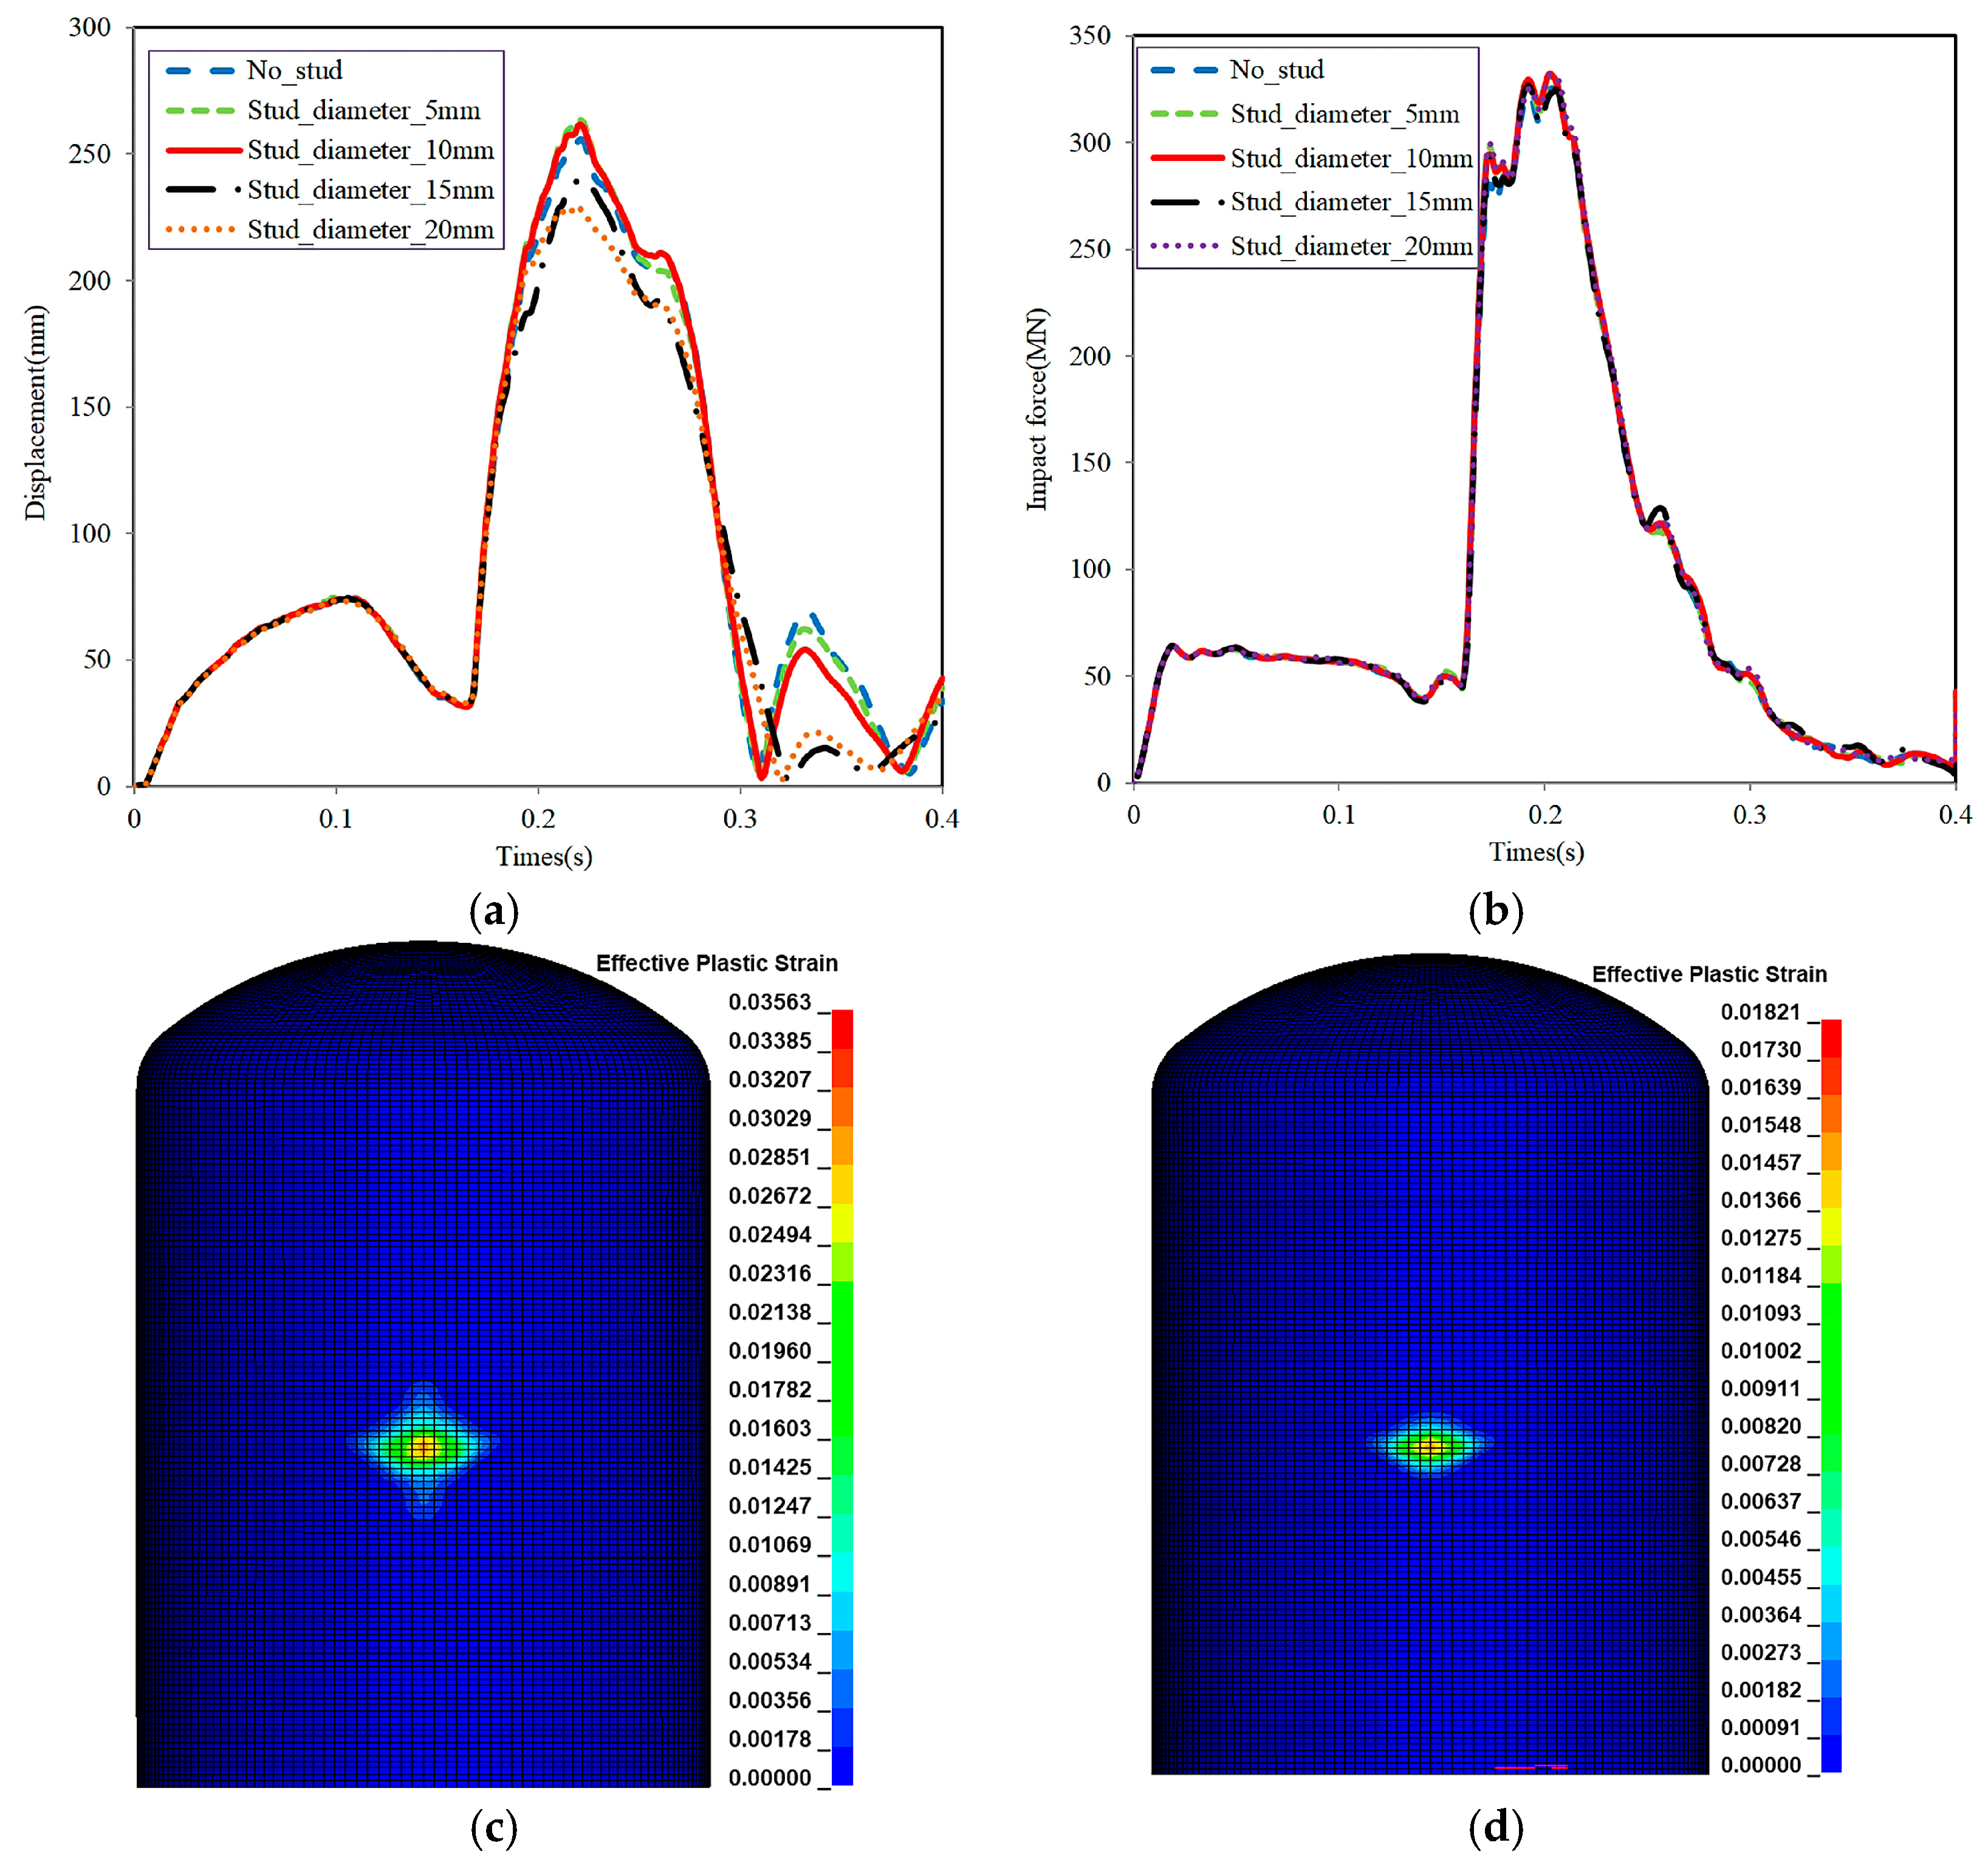
Figure 20a illustrates displacement–time histories at the impact location for varying stud spacings. Compared to the no-stud case (255.6 mm), displacement slightly increases with 5 mm and 10 mm spacing (263.3 mm and 261.5 mm, respectively) but then decreases with wider spacings: 240.8 mm at 15 mm and 228.9 mm at 20 mm. Peak displacements occur around 0.22 s in all cases. Figure 20b presents the corresponding impact force–time histories. The peak forces vary narrowly between 325 and 332 MN. Spacings of 5 mm, 10 mm, and 20 mm show slightly higher forces (around 331–332 MN), while the no-stud case registers 325.9 MN. The impact-force peaks occur at t ≈ 0.202 s across all stud spacings. Force–time peaks are concentrated near 0.202 s.
In summary, stud spacing has a limited influence on the peak impact force but a more notable and non-monotonic effect on structural deformation. The reduction in displacement at larger spacings may be due to the release of local constraints, allowing broader energy dissipation. Conversely, denser stud configurations enhance interfacial coupling, potentially inducing localized stiffness and concentrated deformation. Further analysis involving local stress or damage development would be required to clarify this mechanism.
Note: While the present cases quantify single-event impact responses versus spacing, long-term structural integrity is predominantly controlled by interface/connector performance; accordingly, closer stud spacing generally improves fatigue/slip resistance, subject to constructability and congestion limits [39,40].

3.6. Sensitivity Analysis of Steel Plate Thickness

As the first defensive layer of the S-UHPC containment, the thickness of the outer steel plate critically influences local yielding and strain distribution. This subsection analyzes the structural response for steel plate thicknesses of 5 mm, 10 mm, 15 mm, and 20 mm, under a 150 m/s aircraft impact (UHPC thickness fixed at 800 mm).
Figure 21a shows that increasing plate thickness significantly reduces maximum displacement—from 359.96 mm (5 mm) to 312.47 mm (10 mm), 284.15 mm (15 mm), and 255.61 mm (20 mm). Thicker plates improve structural stiffness and deformation control. Figure 21b illustrates that the peak impact forces remain within 325–332 MN, with only minor variation across cases. The influence of steel thickness on impact force is thus relatively limited, while its effect on displacement is pronounced.
Figure 21c,d show the effective plastic strain contours for 5 mm and 20 mm steel plates, respectively. In the 5 mm case, strain concentration is clearly observed, with a peak value of 0.0356 and a wider spread, indicating significant local yielding. In contrast, the 20 mm case exhibits a lower peak strain of 0.0182, with a more confined strain zone, reflecting better energy dissipation and reduced localized deformation.
These results confirm that increasing the steel plate thickness is effective in limiting both global deformation and localized yielding and should be considered in critical impact-prone areas for improved structural protection.
Practical note on cost-effectiveness and constructability: Compared to RC/SC solutions, S-UHPC permits thinner wall sections and modular erection because the steel faceplates serve as stay-in-place formwork, reducing temporary works and field labor and helping to shorten schedules [6]. Although UHPC carries a higher unit material cost, its enhanced durability—documented by low permeability and improved long-term performance—can reduce maintenance interventions over the service life [10,13,16]. In layouts constrained by thickness or in areas sensitive to a high-frequency response, the modular S-UHPC solution can provide functional and schedule benefits that offset part of the material premium [18]. Consequently, the overall cost-effectiveness is project-specific and should be assessed via whole-life costing that accounts for construction logistics, quality assurance, and performance requirements.
The present trends are consistent with prior experimental and numerical evidence on RC/SC/S-UHPC systems. First, for the same wall thickness, SC-type walls exhibit lower residual velocity and smaller local penetration than RC, consistent with large-/full-scale findings and perforation prevention criteria [3,4,7,8]. Building on that, the S-UHPC containment here further localizes damage without through-thickness failure, in agreement with UHPC panel/slab impact observations and recent syntheses [18,19,20,21,22]. Second, increasing the steel plate thickness reduces global displacement and peak plastic strain, with only minor changes in peak force, echoing impact resistance guidance for SC/S-UHPC walls [4,8]. Third, for a single-event aircraft impact, the global response shows limited sensitivity to the UHPC compressive grade, whereas UHPC benefits are most evident in local damage metrics—a pattern summarized in recent UHPC impact reviews [20]. These agreements support the generality of our conclusions across aircraft types and parameter ranges.

4. Vibration Response Analysis

4.1. Modeling Strategy and Monitoring Scheme

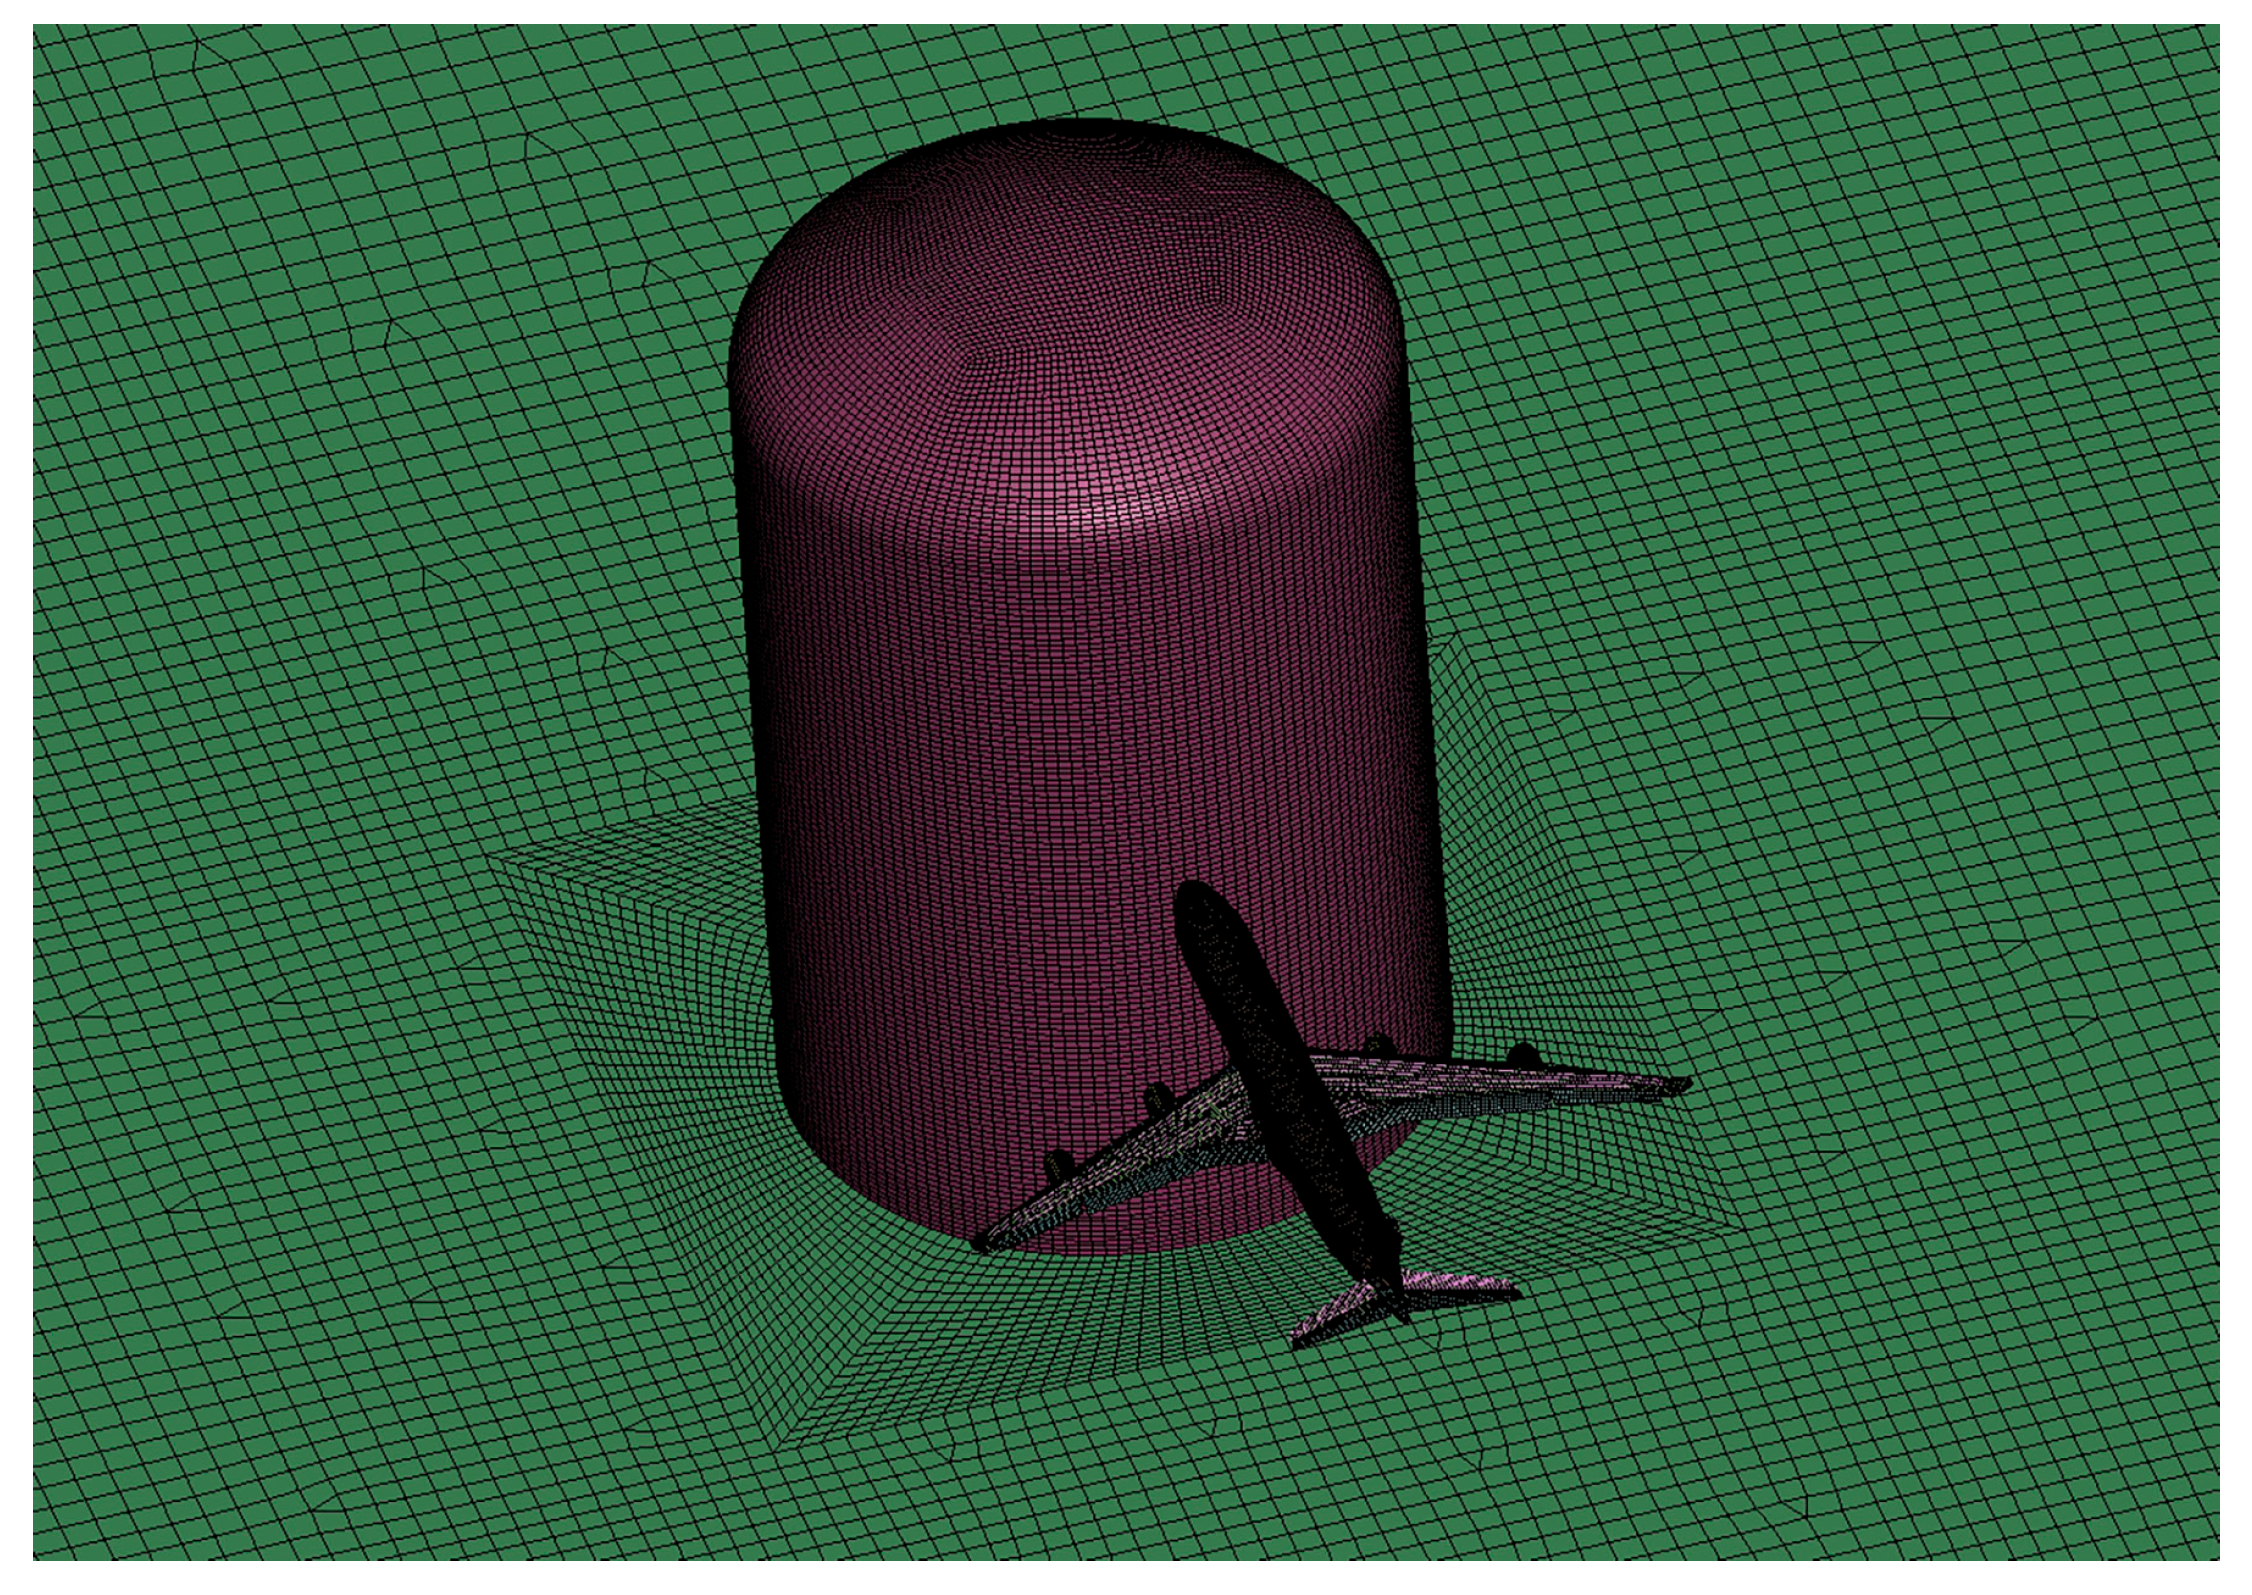
A comprehensive finite element (FE) model was developed to investigate the vibration response of the S–UHPC containment structure subjected to aircraft impact. The model includes the double-shell containment structure, a full-scale Airbus A340-300 aircraft, and a soil domain representing various site conditions. The aircraft impacts the outer cylindrical shell horizontally in the X-direction. Two impact velocities, 100 m/s and 150 m/s, were considered to assess the influence of impact severity on the vibration response. Representative local mesh details are shown in Figure 22, while the global configuration of the model is presented in Figure 23.
The soil–structure–aircraft system was discretized using 8-node solid elements for the soil and containment core and shell elements for outer containment plates. The soil and structural components were connected using common nodes to ensure full compatibility of stress and displacement transmission. To prevent artificial wave reflections, a five-layer Perfectly Matched Layer (PML) was implemented at the lateral and bottom boundaries of the soil domain.
The soil domain spans approximately 380 m × 380 m in-plane with a depth of 60 m, providing sufficient coverage for wave propagation. The mesh size is gradually refined from 4 m at the boundary to 600 mm near the basemat and containment interface to capture high-frequency dynamic effects.
The soil behavior was modeled using the Drucker–Prager constitutive model. Six AP1000 site classes were considered, with soil parameters taken from the Chinese national standard [43], and the site profiles/classification adopted from Tuñón-Sanjur et al. [24]. The site types are described as follows:
Hard Rock: Represents the upper-bound rock case with a shear wave velocity exceeding 8000 ft/s (2438.4 m/s).
Firm Rock: Uniform shear wave velocity of 3500 ft/s (1066.8 m/s) throughout the 120 ft (36.576 m) soil column.
Soft Rock: Increases linearly from 2400 ft/s (731.5 m/s) at the surface to 3200 ft/s (975.4 m/s) at a depth of 240 ft (73.15 m), with base rock assumed at a 120 ft depth.
Upper-Bound Soft-to-Medium Soil: The site is characterized by a ground surface shear wave velocity of 1414 ft/s (430.99 m/s), which increases in a parabolic manner to 3,394 ft/s (1034.49 m/s) at a depth of 240 ft (73.15 m). The base rock is located at 120 ft (36.58 m), and the water table is assumed to be at a grade level. The initial shear modulus profile is defined as double that of the Soft-to-Medium Soil type to represent an upper-bound stiffness condition for transitional soils.
Soft-to-Medium Soil: This profile starts with a shear wave velocity of 1000 ft/s (304.80 m/s) at the ground surface, increasing parabolically to 2400 ft/s (731.52 m/s) at a depth of 240 ft (73.15 m). The bedrock is assumed to occur at a depth of 240ft (73.15 m), with groundwater located at the surface. This site represents a transitional soil condition with moderate stiffness and nonlinear dynamic properties.
Soft Soil: This is a relatively uniform and weak site; the shear wave velocity begins at 1000 ft/s (304.80 m/s) at the surface and increases linearly to 1200 ft/s (365.76 m/s) at a depth of 240 ft (73.15 m). The rock interface lies at 120 ft (36.58 m), and the groundwater is assumed to be at grade level(at grade). The linear profile reflects the gradual change in stiffness typically found in very soft surface layers.
The physical and mechanical parameters of all site types are summarized in Table 6.
To extract dynamic responses, five monitoring points were placed at critical structural locations, as shown in Figure 24:
Point A: Center of the basemat;
Point B: Apex of the inner containment dome;
Point C: Mid-height of the inner cylindrical shell (impact side);
Point D: 1/4-height of the inner shell (impact side);
Point E: 3/4-height of the inner shell (impact side).
At each point, both horizontal (X-direction) and vertical (Z-direction) acceleration time histories were recorded and processed into floor response spectra (FRS) to assess frequency-dependent vibrational behavior. The selected locations allow for a comprehensive evaluation of vibratory transmission across the height of the containment system under impulsive aircraft loading.
In the soil–structure interaction (SSI) setup, proportional (Rayleigh) damping is applied to the coupled model, with a target damping ratio of 5%. The coefficients are evaluated between the first dominant SSI mode of the assembled system and a conservative upper reference of 180 Hz, which brackets the observed 90–125 Hz response band, which brackets the observed 90–125 Hz response band and provides headroom while avoiding undue attenuation of impact-driven high-frequency content [44,45]. The soil mesh uses elements of ≈0.5–0.6 m in the basemat/containment vicinity and gradually transitions to ≈3–4 m toward the far field, consistent with wavelength-oriented sizing based on the site-dependent shear wave speeds listed in Table 6 [45]. For the unbounded domain, five-layer PMLs are placed on the lateral and bottom truncation faces, the PML thickness is taken as a fraction of the wavelength in the low-frequency range relevant for far-field absorption, and the attenuation profile is ramped across layers to suppress back-reflections over typical incidence angles. Published demonstrations—e.g., Lamb-type internal-source tests and mixed-mesh validations—document low artificial reflectivity for comparable configurations, supporting the present PML and grading choices [44,46].

4.2. Floor Response Spectrum Analysis Under Various Soil Conditions

To generate the floor response spectra, we processed the computed acceleration histories at the monitoring points with a standard single-degree-of-freedom (SDOF) oscillator procedure using 5% critical damping. The oscillators span 1–200 Hz with logarithmic sampling, and for each frequency, we retained the peak absolute acceleration over the impact duration; the spectra shown are therefore peak (envelope) responses. The records were detrended to zero mean, and no additional smoothing was applied. To evaluate the dynamic response of the containment structure under aircraft impact, floor response spectra (FRS) were extracted from five critical monitoring points to examine the frequency domain behavior across various soil conditions. The spectral values, expressed in m/s2, were obtained by applying a Fourier transform to the acceleration time histories. The impact scenario involves an A340-300 aircraft striking an 800 mm thick C150 S-UHPC containment at 150 m/s, with six AP1000-standard soil profiles considered.
To maintain clarity and focus, only two representative monitoring points are selected for presentation: Point A (center of the basemat) and Point C (mid-height of the inner containment shell). These points represent typical response zones near the foundation and mid-containment and exhibit the most pronounced variations in spectral response across different soil conditions. Other points, such as B, D, and E, demonstrate similar patterns and are thus omitted for brevity.
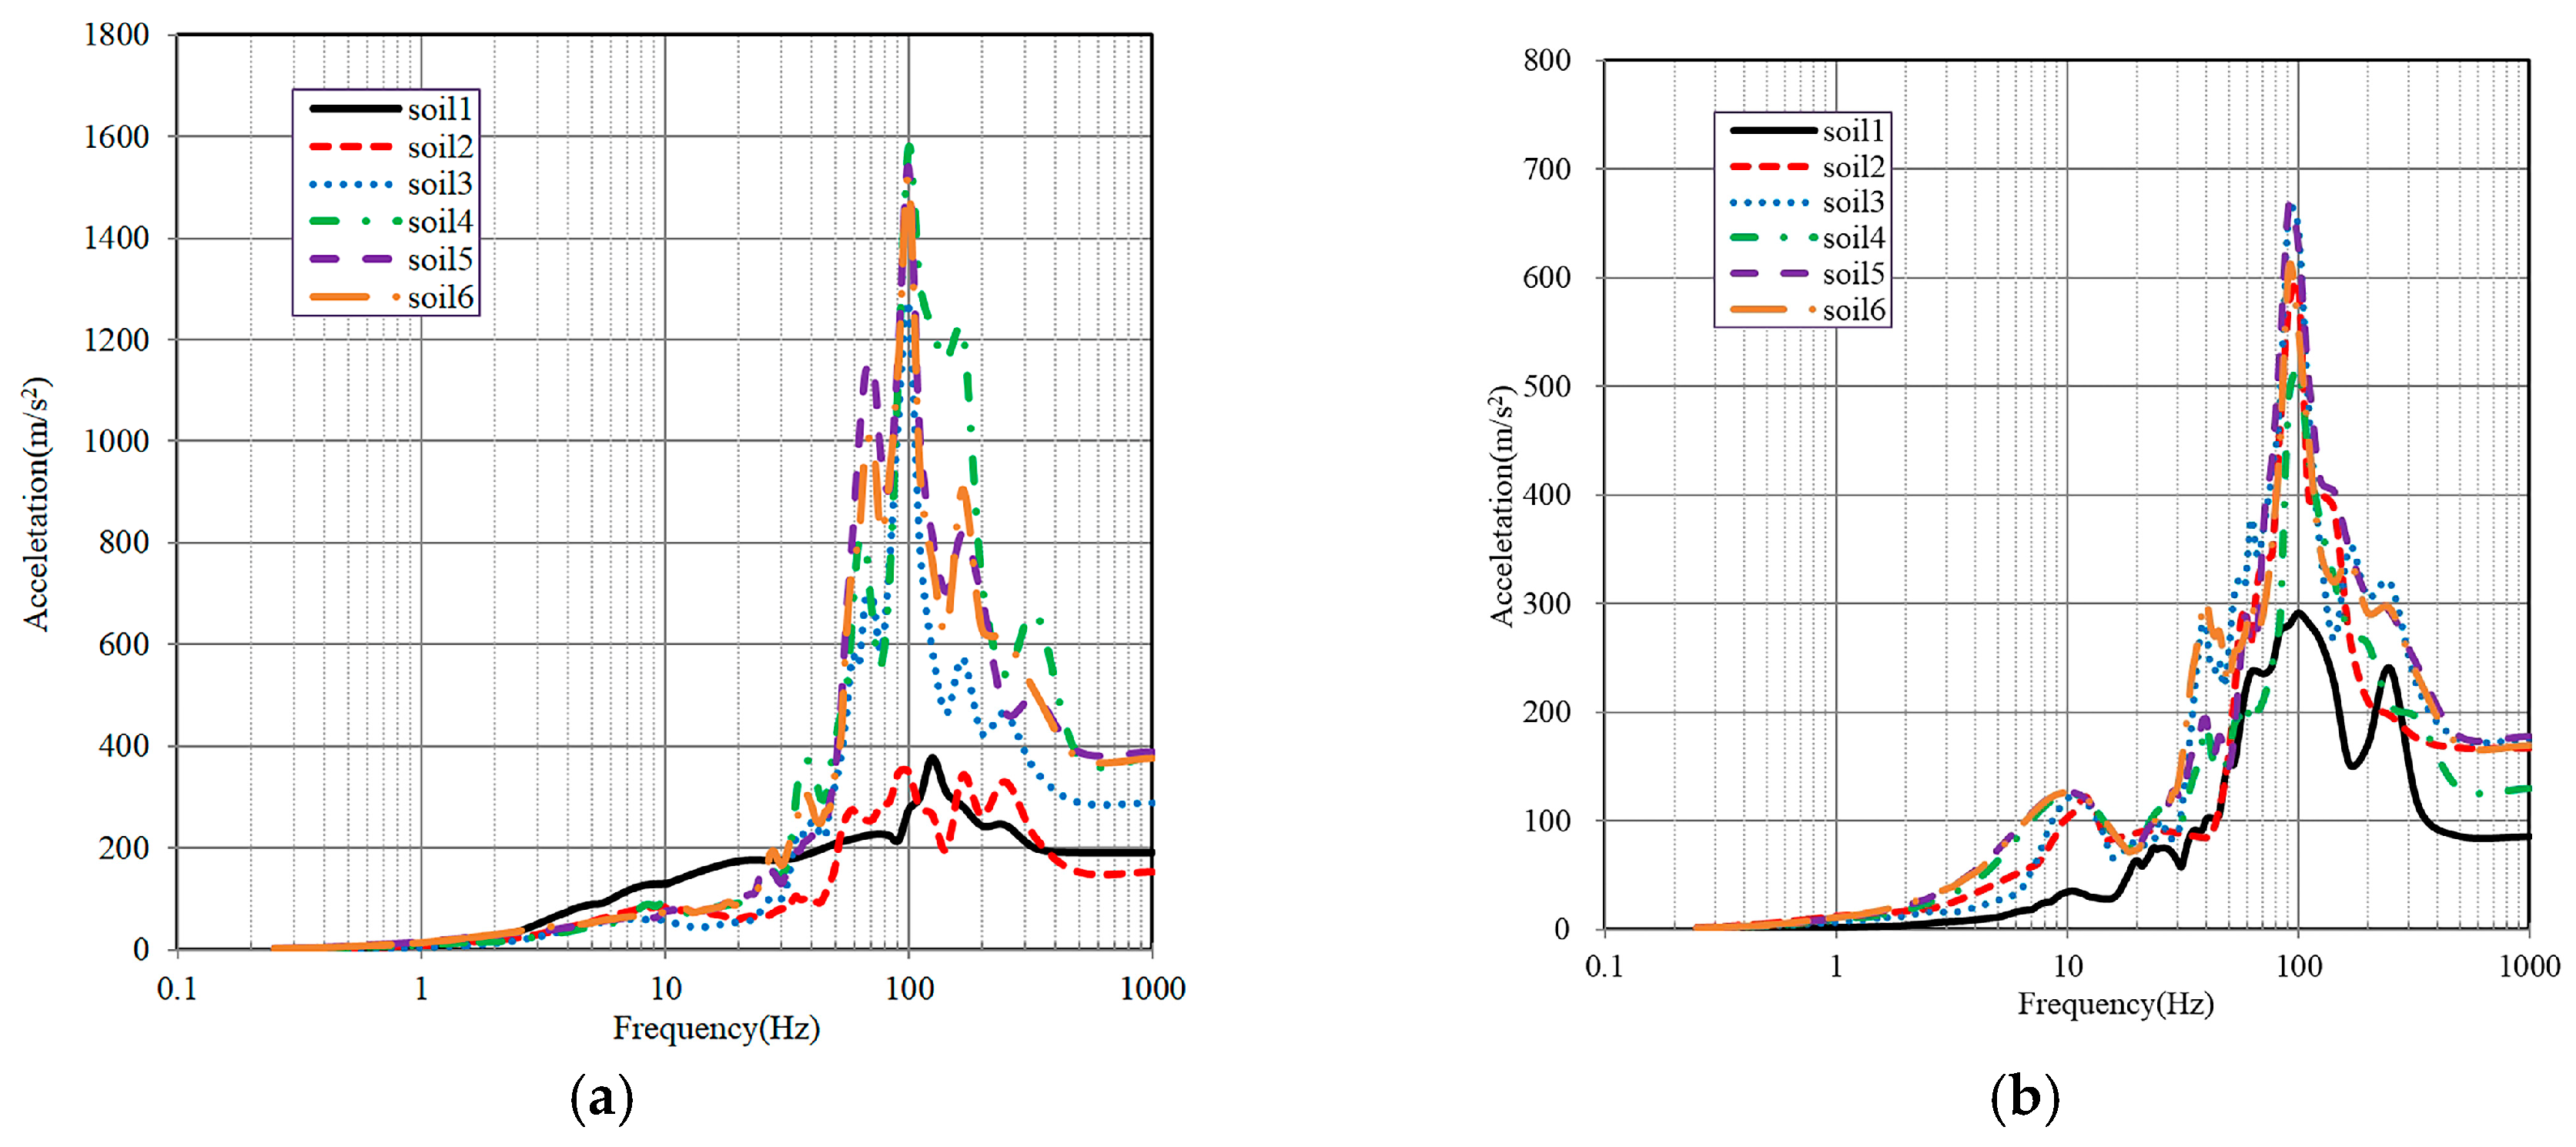
Figure 25a illustrates the spectral characteristics at Point A in the X-direction. The structural response induced by aircraft impact is clearly dominated by high-frequency components, with dominant peaks in the 90–125 Hz range. Under hard rock conditions (Soil1), the dominant peak occurs at 125 Hz with a maximum acceleration of 377.25 m/s2. In contrast, under soft soils (Soil4 and Soil6), the dominant frequency decreases to 100 Hz, while the peak accelerations rise sharply to 1539.11 m/s2 and 1517.35 m/s2, respectively, representing more than a four-fold increase. This frequency downshift and amplitude amplification behavior highlights the role of foundation flexibility in enhancing high-frequency transmission and increasing the response magnitude. Mechanistically, amplification on soft soil arises from lower shear wave impedance (Z = ρVs) and weaker radiation damping; soil–structure interaction (SSI) also lengthens the effective period, bringing dominant modes closer to the excitation band and thereby elevating spectral amplitudes in the 90–125 Hz range, especially at the basemat, where foundation compliance is highest.
Figure 25b shows the Z-direction spectral response at Point C. Although the dominant frequency remains approximately 90–100 Hz across soil conditions, the spectral amplitude varies significantly. Peak acceleration increases from 291.47 m/s2 under Soil1 to 666.80 m/s2 and 609.23 m/s2 under Soil4 and Soil6, respectively, an increase exceeding 110%. This amplitude escalation under soft soil conditions is consistent with the lower Z = ρVs, diminished radiation damping, and the SSI-induced period shift noted above, indicating that vertical responses can also be strongly amplified as site stiffness decreases.
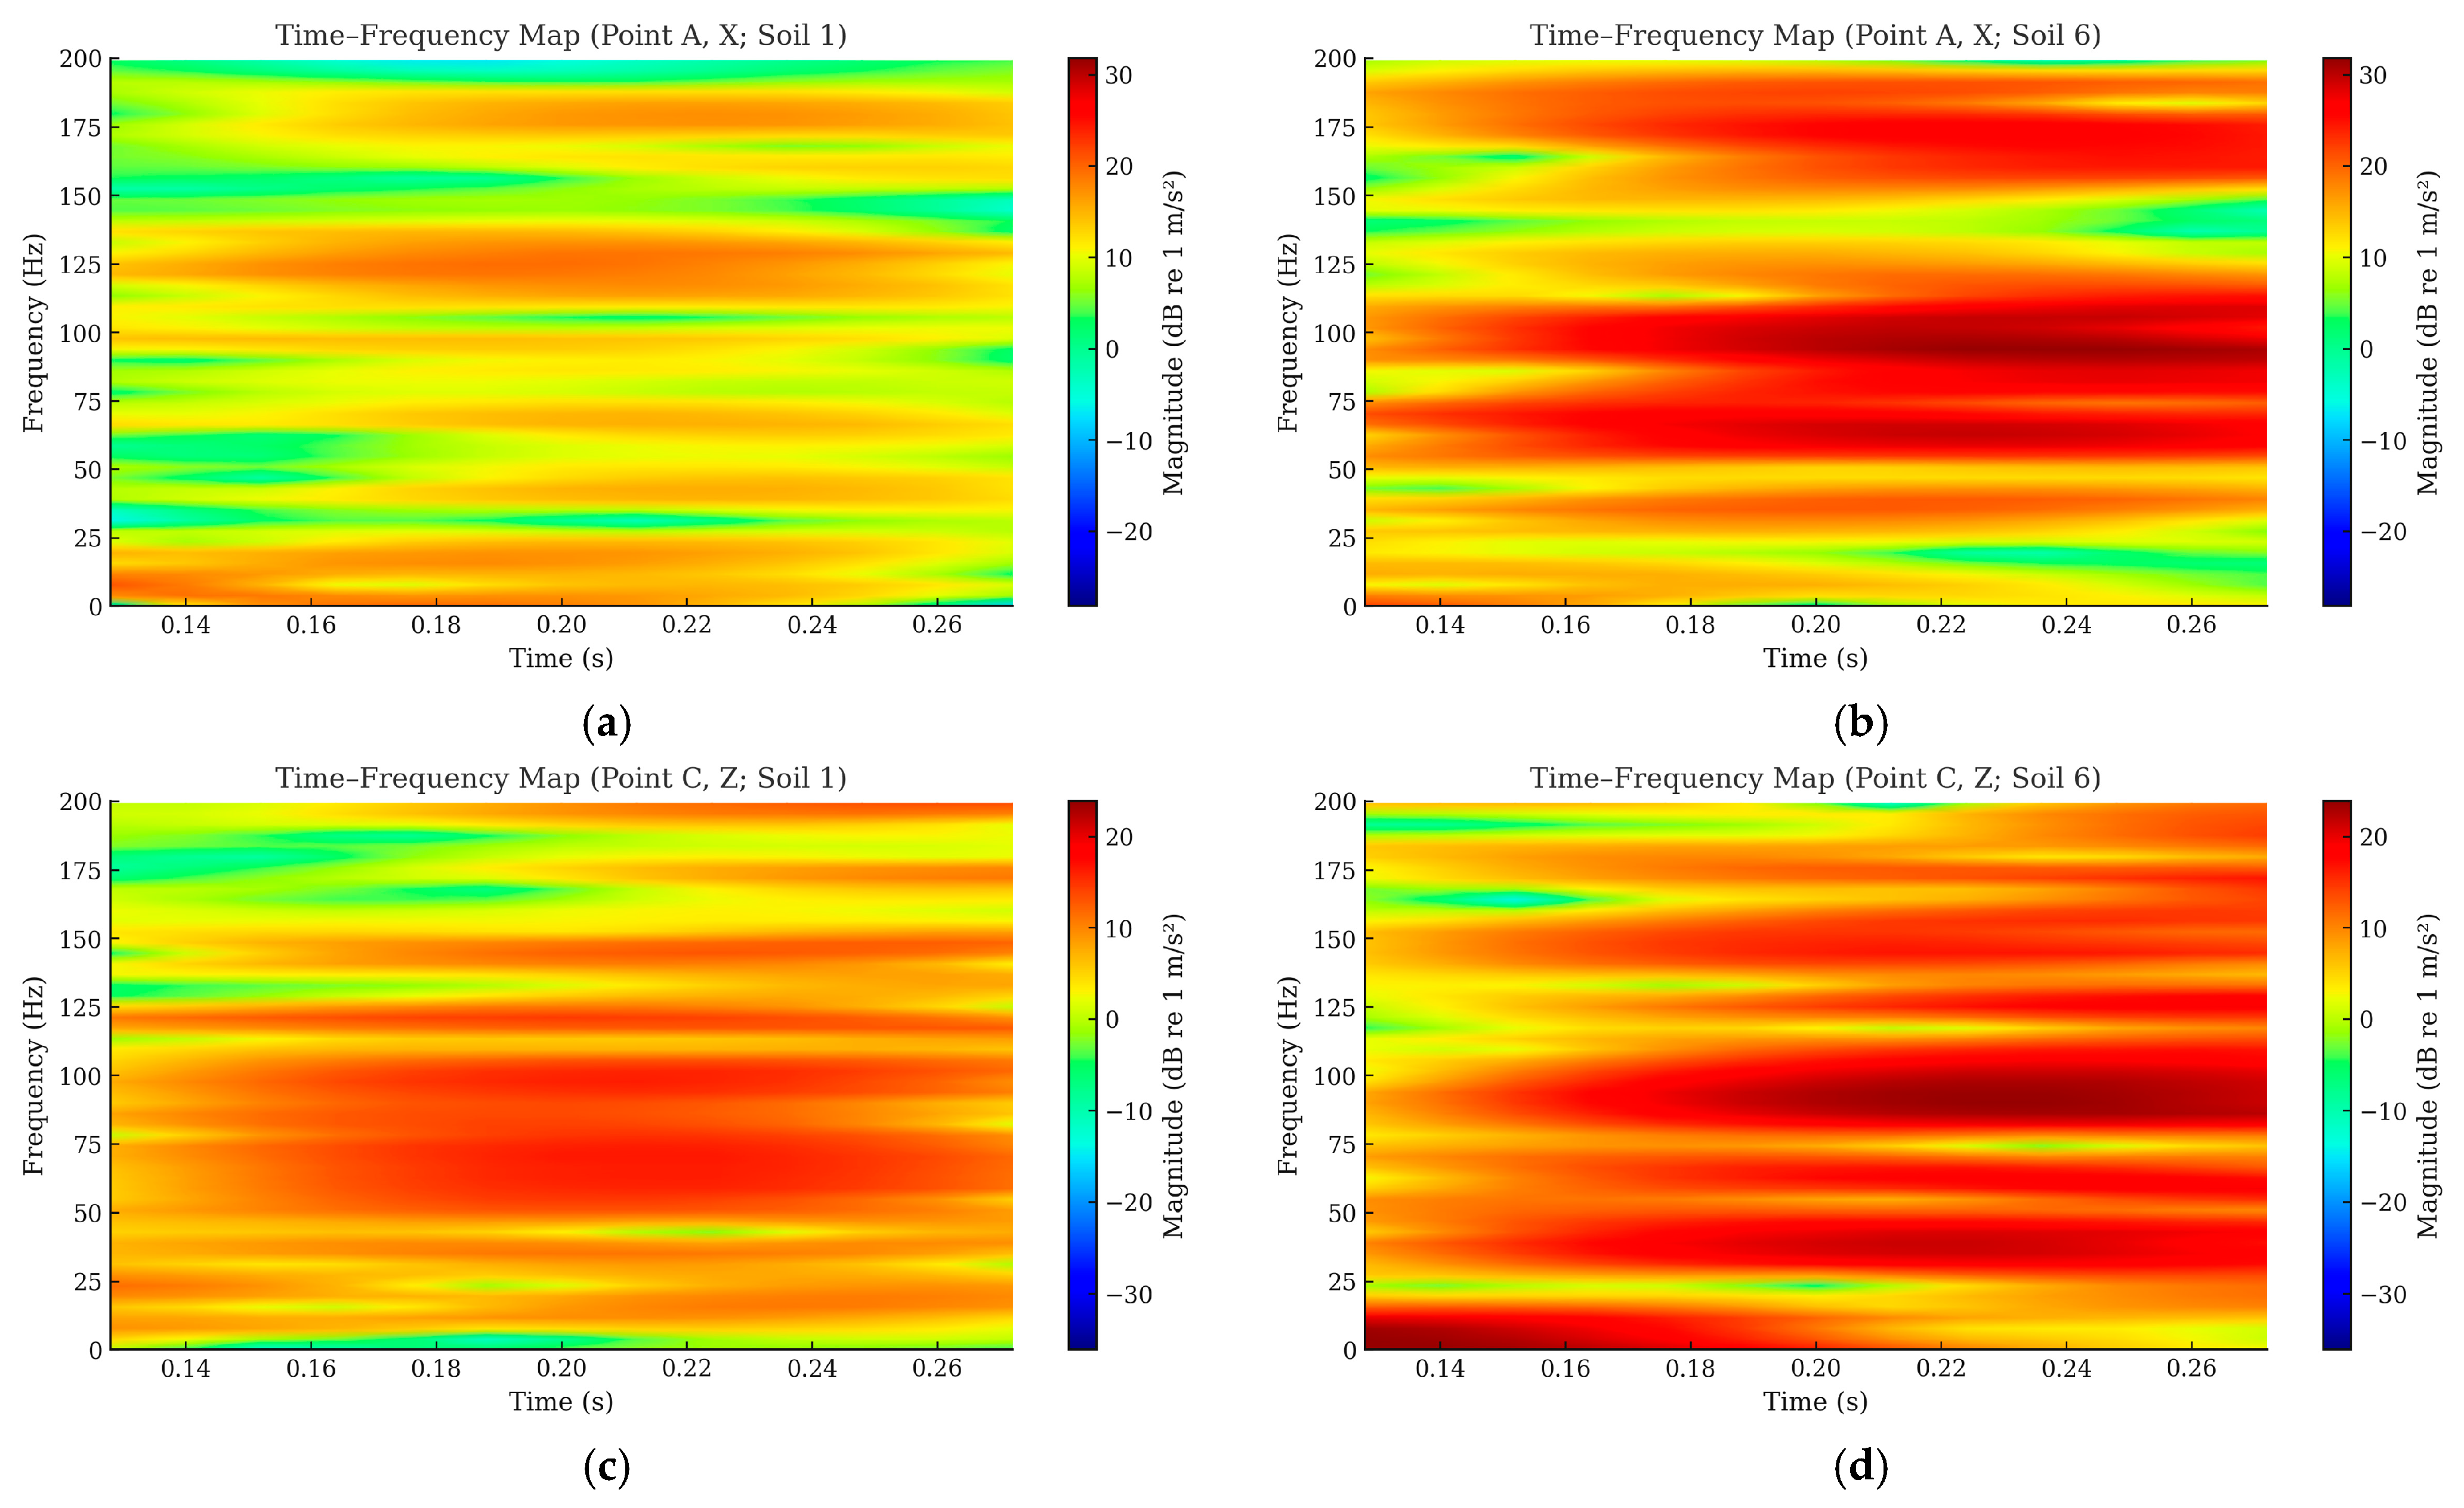
To expose the transient evolution after impact, we computed time–frequency maps for Point A (X) and Point C (Z) under Soil1/Soil6 using STFT (Hann window ≈ 0.08 s; 95% overlap), restricted to 0~200 Hz with amplitudes in dB (re 1 m/s2). Figure 26 presents the time–frequency spectrograms for Point A (X) and Point C (Z) under Soil1 and Soil6. For comparability, each monitoring point pair shares a common color scale and a common time window—the intersection of valid spectrogram frames (here 0.128–0.272s)—which avoids pre-window blank segments caused by short-window effects. The maps show a dominant 90–125 Hz band emerging immediately after impact; relative to hard rock, soft soil exhibits stronger and slightly longer-lasting energy in this band, with a mild low-frequency tail. This is fully consistent with the higher FRS peaks for soft soil reported earlier in Section 4.2. The time–frequency view thus confirms SSI-driven amplification and the persistence of high-frequency content, informing equipment screening and qualification.
In summary, aircraft impact leads to pronounced high-frequency (90–125 Hz) and high-magnitude spectral responses, with strong sensitivity to site stiffness, especially at the basemat and the mid-height regions of the containment. These observations underscore a mechanism-based trend: softer sites reduce impedance and radiation damping while shifting system periods, which aligns structural modes with the impact-induced high-frequency content. Consequently, soft-soil amplification should be explicitly considered in the impact-resistant design and qualification of containment structures and equipment (e.g., anchorage systems, supports, and component-level FRS envelopes).
Comparison to the previous literature (vibration/SSI): These spectral features are consistent with SSI-based vibration analyses for Gen-III NPPs under aircraft-type impulsive loading, which report high-frequency dominance (≈50–300 Hz) and substantially larger basemat spectra on softer sites; our 90–125 Hz peaks fall within this reported band [24,25,47]. Consistently, SSI studies also indicate that greater foundation embedment mitigates basemat FRS demands; thus, the soft-site amplification observed here would be further reduced in more deeply embedded configurations [47].

4.3. Influence of Impact Velocity on Floor Response Spectra

To further investigate the influence of impact velocity on the dynamic response of the containment structure, this section compares the floor response spectra generated by an A340-300 aircraft impacting an 800 mm thick C150 S-UHPC containment at two velocities: 100 m/s and 150 m/s.
To highlight the modulation effect of impact velocity on spectral response, Soft Rock (Soil3) and Upper-Bound Soft-to-Medium Soil (Soil5) were selected as representative soil conditions. These two cases represent medium-stiff and upper-bound flexible sites, respectively, and exhibit distinct response characteristics that effectively capture the influence of velocity variation in the frequency domain. Spectral responses were evaluated at two critical points: Point A (X-direction at basemat center) and Point C (Z-direction at the mid-height of the inner containment shell).
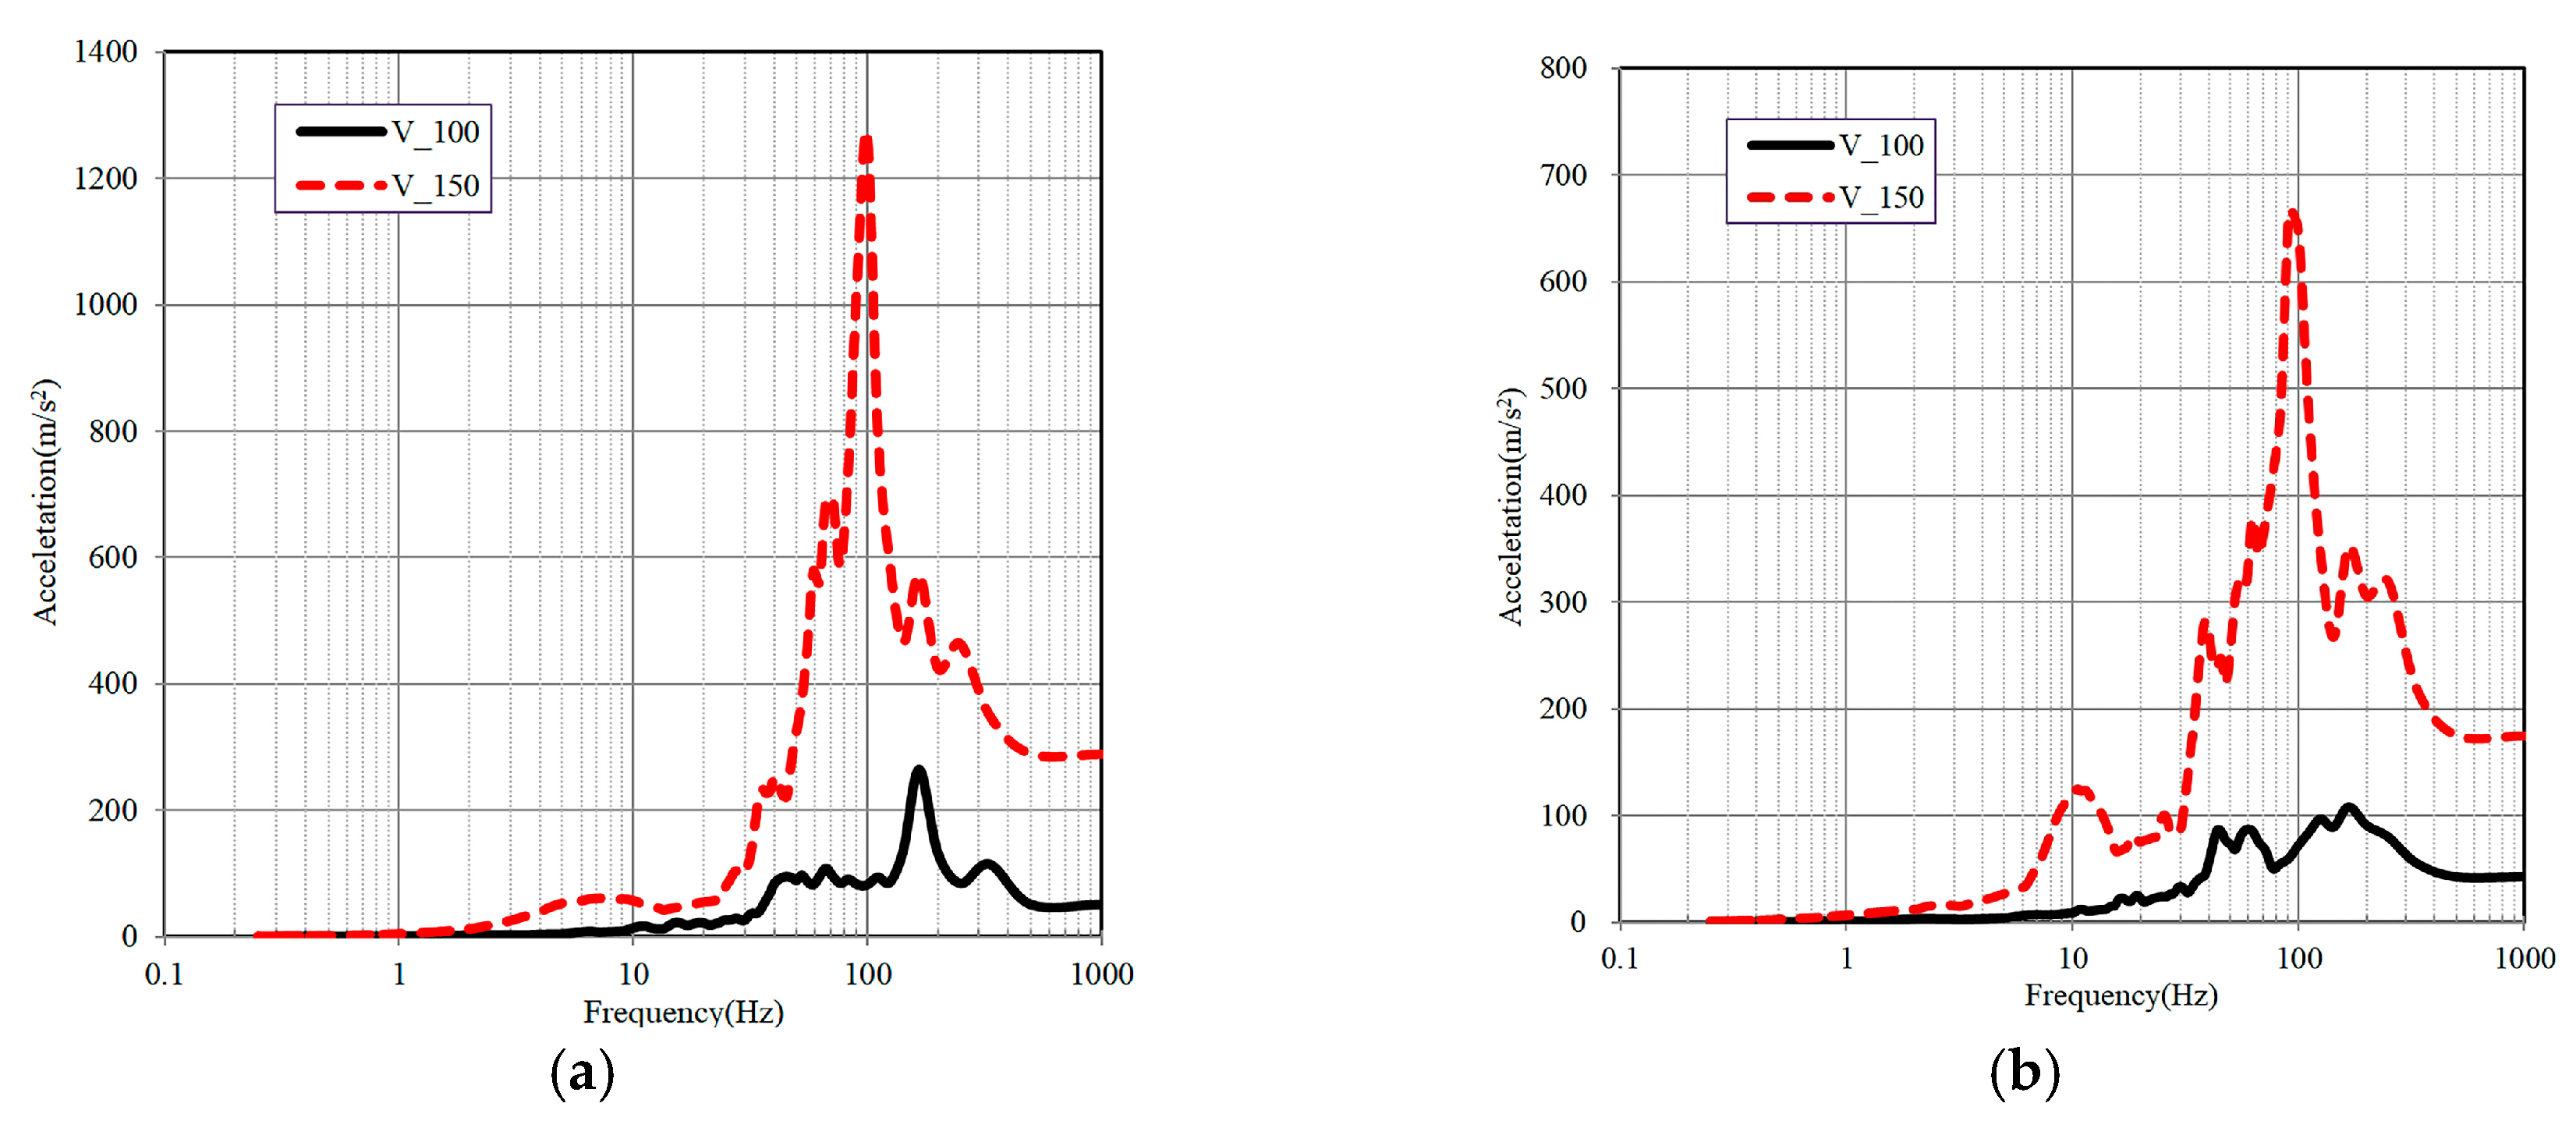
Figure 27 presents the comparison results under both velocity conditions. Under Soft Rock (Soil3), the dominant frequency at Point A decreases from 166.67 Hz to 100.00 Hz, while the peak spectral acceleration increases from 264.58 m/s2 to 1269.53 m/s2, representing an increase of approximately 380%. At Point C, the frequency drops from 166.67 Hz to 90.91 Hz, and the acceleration rises from 108.28 m/s2 to 665.00 m/s2, representing an increase of 514%. These results indicate that higher impact velocities not only amplify the structural response intensity but also shift the dominant frequency toward the lower range.
Similar trends are observed under Soil5 (UBSM Soil) conditions. At Point A, the spectral amplitude increases from 380.55 m/s2 to 1539.11 m/s2 (a 304% increase), while the dominant frequency drops from 166.67 Hz to 100.00 Hz. At Point C, the acceleration increases from 225.51 m/s2 to 666.80 m/s2, and the frequency drops from 200.00 Hz to 90.91 Hz, representing a 54% reduction. These results confirm that the influence of impact velocity is especially pronounced in flexible foundations, producing both strong spectral amplification and a downward frequency shift.
With the exception of Soil2 (Firm Rock), all other soil types exhibit similar trends, namely, increased spectral amplitudes and reduced dominant frequencies with higher impact velocities. This low-frequency amplification is particularly evident in soft soils, underscoring that impact velocity is a critical driver of structural vibration response.
In summary, impact velocity plays a decisive role in determining the frequency domain behavior of the structure. As velocity increases, the floor response spectra exhibit significant amplification and a shift toward lower dominant frequencies. These effects are particularly important for structures founded on soft soils and must be considered in shock-resistant design for nuclear containment systems.

4.4. Influence of Structural Type on Impact-Induced Vibration Response

To clarify the effect of structural type on dynamic responses induced by aircraft impact, this section compares the floor response spectra of two containment configurations impacted by an aircraft at a velocity of 100 m/s: an 800 mm thick S-UHPC (C150) containment, and an 1100 mm thick steel–normal concrete (C50) containment. The spectral responses were extracted at Point A (X-direction) and Point C (Z-direction), representing foundation-level and upper-structure vibration characteristics, respectively. Two representative soil conditions were selected for the analysis: hard rock (Soil1) and Soft-to-Medium Soil (Soil5).
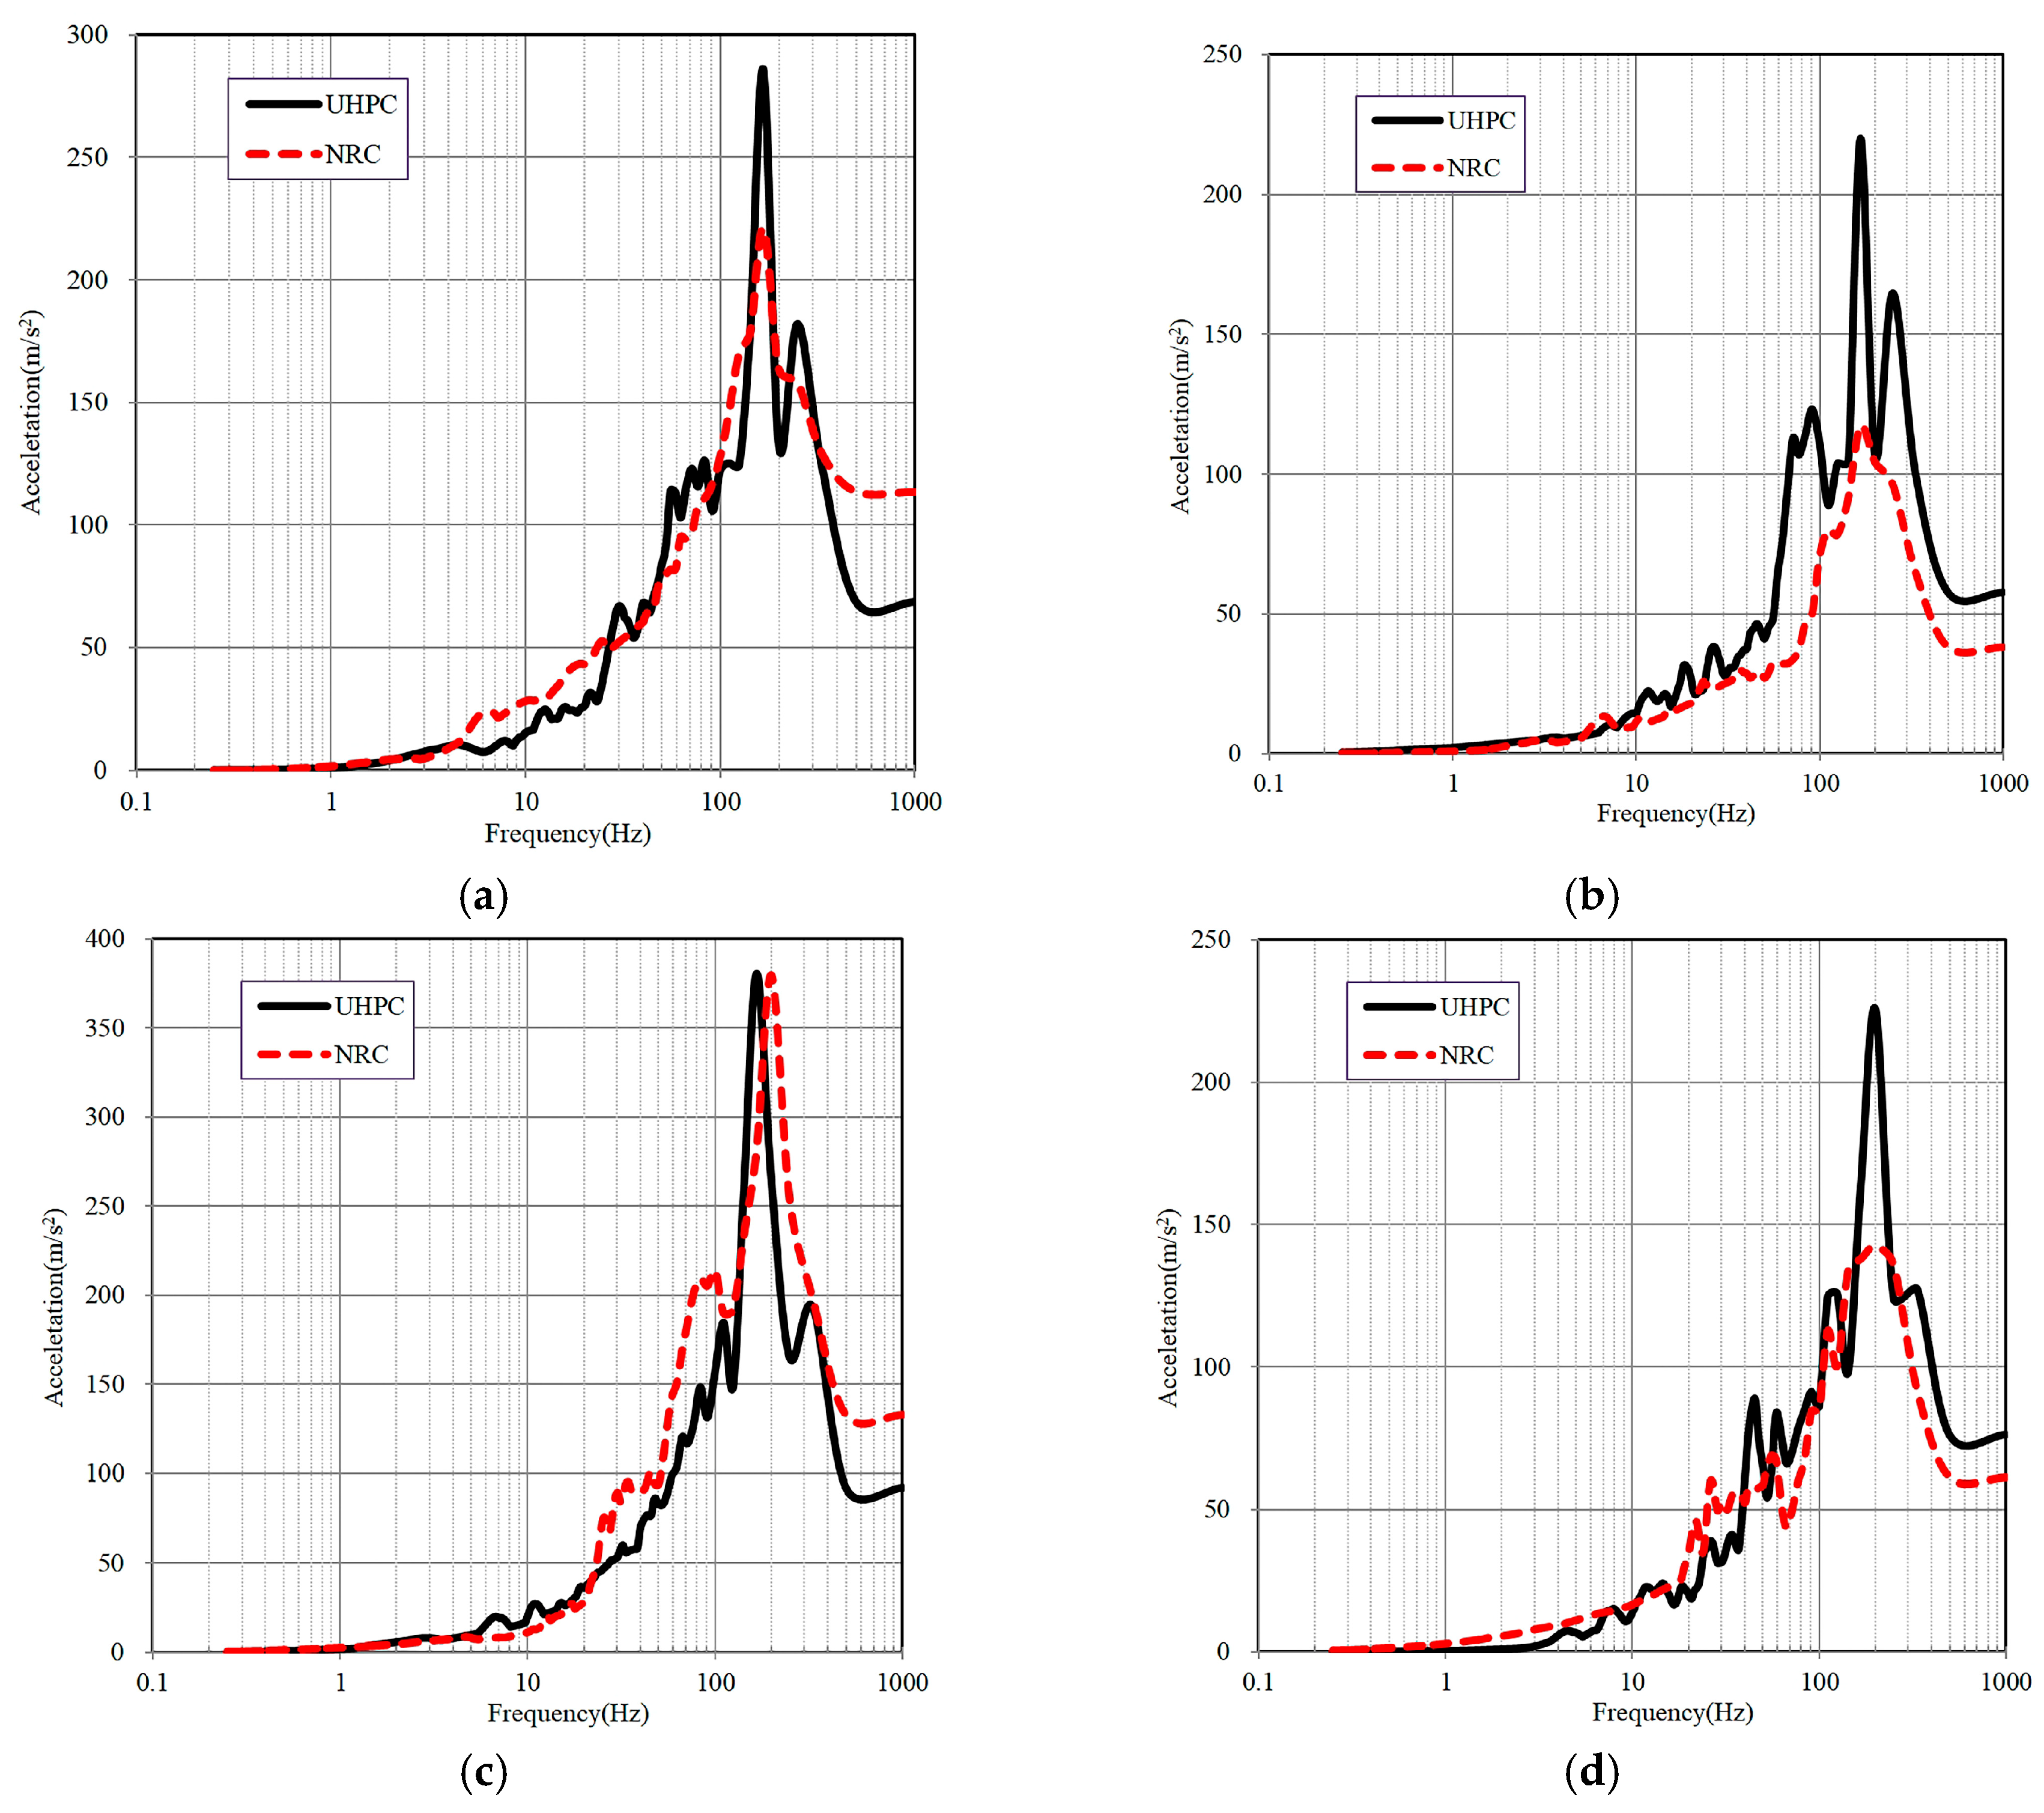
Figure 28 presents the floor response spectra comparisons for these two structural types. Under Soil1 conditions, despite its reduced thickness, the S-UHPC structure exhibited higher peak acceleration at Point A (285.64 m/s2) compared to the normal concrete structure (221.12 m/s2), representing an increase of approximately 29%. At Point C, the peak acceleration for the S-UHPC structure was also significantly higher (219.89 m/s2 compared to 117.32 m/s2), representing an increase of 87%. This indicates that the high strength and stiffness characteristics of UHPC lead to more pronounced localized responses under rigid foundation conditions, even when the structural thickness is reduced.
Under Soil5, the acceleration peak values for the two structures were similar at Point A (380.55 m/s2 for UHPC vs. 379.62 m/s2 for concrete). However, at Point C, the S-UHPC structure demonstrated a substantially higher peak acceleration (225.51 m/s2) compared to the concrete structure (142.45 m/s2), representing an increase of approximately 58%. This result suggests that the thinner cross-sectional thickness of the S-UHPC structure may lead to reduced local stiffness under flexible foundation conditions, thereby intensifying the local high-frequency vibration response.
The above analyses demonstrate that structural type, encompassing both material properties and structural thickness, significantly influences the vibration response induced by impact. Although the high-performance UHPC exhibits clear advantages in material properties, structural thickness must be adequately considered in flexible soil conditions to prevent excessive local amplification of vibration responses. Therefore, in practical engineering design, it is necessary to comprehensively evaluate the choice of material type and structural thickness based on soil conditions and structural functionality, thereby optimizing impact resistance performance.

5. Conclusions

This study numerically investigated the dynamic impact resistance and vibration response of steel–ultra-high-performance concrete (S-UHPC) nuclear containment structures under large commercial aircraft impact, using validated LS-DYNA finite element models. Four representative aircraft types, various wall and steel plate thicknesses, UHPC grades, and soil–structure interaction conditions were analyzed. Comparative simulations with conventional reinforced concrete containment were performed, and floor response spectra were evaluated to quantify high-frequency vibration characteristics.
(1)
Steel–UHPC nuclear containment structures exhibit up to ~24% lower peak displacement than conventional reinforced concrete at the same wall thickness, demonstrating superior global impact resistance and deformation control under large aircraft impact.
(2)
UHPC cores in S-UHPC containment localize damage effectively without through-thickness failure, even at a reduced wall thickness, enabling material savings while maintaining safety margins.
(3)
Aircraft impact excites dominant high-frequency vibrations (90–125 Hz), and soft soil conditions amplify acceleration responses by more than four times, highlighting the critical role of site-specific dynamic analysis in containment and equipment design.
(4)
Increasing wall and steel plate thickness significantly reduces global deformation and local yielding without substantially altering the peak impact force, providing an effective design strategy for enhancing impact resilience.

Author Contributions

Conceptualization, G.R. and R.P.; methodology, G.R. and R.P.; software, G.R.; validation, F.S.; formal analysis, G.R. and G.Z.; investigation, G.R. and F.S.; resources, G.R.; data curation, G.R.; writing—original draft preparation, G.R.; writing—review and editing, R.P., F.S. and G.Z.; visualization, G.R. and G.Z.; project administration, R.P. and F.S.; funding acquisition, G.R. All authors have read and agreed to the published version of the manuscript.

Funding

This research was funded by the National Science and Technology Major Project of China, grant No. 2011ZX06002-10.

Data Availability Statement

The original contributions presented in this study are included in the article; further inquiries can be directed to the corresponding author.

Conflicts of Interest

The authors declare no conflicts of interest.

Abbreviations

The following abbreviations are used in this manuscript:
S-UHPCsteel–ultra-high-performance concrete
NPPsnuclear power plants
BDBEbeyond-design-basis event
SCsteel plate–concrete
UHPCultra-high-performance concrete
HVPIhigh-velocity projectile impact
SSIsoil–structure interaction
FEfinite element
PWRpressurized water reactor
HJCHolmquist–Johnson–Cook
S-NRCSteel–Normal Reinforced Concrete
PMLPerfectly Matched Layer

References

  1. National Nuclear Safety Administration. Design Safety Regulations for Nuclear Power Plants; HAF102; National Nuclear Safety Administration: Beijing, China, 2016.
  2. NEI 07-13; Methodology for Performing Aircraft Impact Assessments for New Plant Designs. Nuclear Energy Institute: Washington, DC, USA, 2009.
  3. Sadiq, M.; Yun, Z.X.; Rong, P. Simulation analysis of impact tests of steel plate reinforced concrete and reinforced concrete slabs against aircraft impact and its validation with experimental results. Nucl. Eng. Des. 2014, 273, 653–667. [Google Scholar] [CrossRef]
  4. Bruhl, J.C.; Varma, A.H.; Johnson, W.H. Design of composite SC walls to prevent perforation from missile impact. Int. J. Impact. Eng. 2015, 75, 75–87. [Google Scholar] [CrossRef]
  5. Ren, G.; Pan, R.; Sun, F.; Li, L. Sensitivity Analysis on the Blast Resistance of Steel Concrete Structure Wall Based on CONWEP. In Proceedings of the 2021 28th International Conference on Nuclear Engineering, Virtual, 4–6 August 2021; American Society of Mechanical Engineers: New York, NY, USA, 2021; p. V003T12A022. [Google Scholar]
  6. Varma, A.H.; Shafaei, S.; Klemencic, R. Steel modules of composite plate shear walls: Behavior, stability, and design. Thin Wall Struct. 2019, 145, 106384. [Google Scholar] [CrossRef]
  7. Sadiq, M.; Khaliq, W.; Ilyas, M.; Khushnood, R.A.; Khan, S.A.; Rong, P. Analysis of full-scale aircraft impact to reinforced concrete and steel plate reinforced concrete multiple barriers protecting nuclear power plants. Structures 2020, 27, 732–746. [Google Scholar] [CrossRef]
  8. Kim, K.; Lee, K.; Shin, J.; Lee, J.; Varma, A. A study on the resistance of SC walls subjected to missile impact using large-scale impact tests. Int. J. Impact Eng. 2020, 139, 103507. [Google Scholar] [CrossRef]
  9. Liu, J.; Han, P. Numerical Analyses of a Shield Building Subjected to a Large Commercial Aircraft Impact. Shock Vib. 2018, 2018, 7854969. [Google Scholar] [CrossRef]
  10. Russell, H.G.; Graybeal, B.A.; Russell, H.G. Ultra-High Performance Concrete: A State-of-the-Art Report for the Bridge Community; Rep. No. FHWA-HRT-13-060.; Office of Infrastructure Research and Development, Federal Highway Administration: McLean, VA, USA, 2013. [Google Scholar]
  11. Graybeal, B.A. Characterization of the Behavior of Ultra-High Performance Concrete. Ph.D. Thesis, University of Maryland, College Park, MD, USA, 2005. [Google Scholar]
  12. Sawab, J.; Lim, I.; Mo, Y.-L.; Li, M.; Wang, H.; Guimaraes, M. Ultra-High-Performance Concrete and Advanced Manufacturing Methods for Modular Construction; Rep. No.13-5282; University of Houston: Houston, TX, USA, 2016. [Google Scholar]
  13. Magureanu, C.; Sosa, I.; Negrutiu, C.; Heghes, B. Mechanical Properties and Durability of Ultra-High-Performance Concrete. ACI Mater. J. 2012, 109, 177–184. [Google Scholar]
  14. Graybeal, B.; Tanesi, J. Durability of an Ultrahigh-Performance Concrete. J. Mater. Civil. Eng. 2007, 19, 848–854. [Google Scholar] [CrossRef]
  15. Hanifehzadeh, M.; Ebad Sichani, M.; Gencturk, B.; Padgett, J.E. Destructive and non-destructive evaluation of reinforced concrete dry casks affected by alkali-silica reactivity damage. Struct. Infrastruct. E. 2019, 15, 1404–1418. [Google Scholar] [CrossRef]
  16. Graybeal, B. Ultra-High Performance Concrete; Rep. No. FHWAHRT-11-038; Federal Highway Administration: Washington, DC, USA, 2011. [Google Scholar]
  17. Ning, H.; Ren, H.; Wang, W.; Nie, X. Impact Resistance of Ultra-High-Performance Concrete Composite Structures. Materials 2023, 16, 7456. [Google Scholar] [CrossRef]
  18. Riedel, W.; Nöldgen, M.; Straßburger, E.; Thoma, K.; Fehling, E. Local damage to Ultra High Performance Concrete structures caused by an impact of aircraft engine missiles. Nucl. Eng. Des. 2010, 240, 2633–2642. [Google Scholar] [CrossRef]
  19. Wang, Z.; Yan, J.; Lin, Y.; Fan, F.; Yang, Y. Mechanical properties of steel-UHPC-steel slabs under concentrated loads considering composite action. Eng. Struct. 2020, 222, 111095. [Google Scholar] [CrossRef]
  20. Liu, J.; Li, J.; Fang, J.; Su, Y.; Wu, C. Ultra-high performance concrete targets against high velocity projectile impact—A-state-of-the-art review. Int. J. Impact Eng. 2022, 160, 104080. [Google Scholar] [CrossRef]
  21. Lin, Y.; Yan, J.; Cao, Z.; Zeng, X.; Fan, F.; Zou, C. Ultimate strength behaviour of S-UHPC-S and SCS sandwich beams under shear loads. J. Constr. Steel Res. 2018, 149, 195–206. [Google Scholar] [CrossRef]
  22. Wang, Z.; Yan, J.; Lin, Y.; Fan, F.; Sun, M. Experimental and analytical study on the double steel plates-UHPC sandwich slabs under low-velocity impact. Thin Wall Struct. 2023, 184, 110548. [Google Scholar] [CrossRef]
  23. Sugano, T.; Tsubota, H.; Kasai, Y. Full-scale aircraft impact test for evaluation of impact force. Nucl. Eng. Des. 1993, 140, 373–385. [Google Scholar] [CrossRef]
  24. Tuñón-Sanjur, L.; Orr, R.S.; Tinic, S.; Ruiz, D.P. Finite element modeling of the AP1000 nuclear island for seismic analyses at generic soil and rock sites. Nucl. Eng. Des. 2007, 237, 1474–1485. [Google Scholar] [CrossRef]
  25. Islam, M.R.; Turja, S.D.; Van Nguyen, D.; Forcellini, D.; Kim, D. Seismic Soil-Structure Interaction in Nuclear Power Plants: An extensive review. Results Eng. 2024, 23, 102694. [Google Scholar] [CrossRef]
  26. Hallquist, J.O. LS-DYNA Keyword User’s Manual R8; Livermore Software Technology Corporation: Livermore, CA, USA, 2014. [Google Scholar]
  27. Johnson, G.R.; Cook, W.H. Fracture characteristics of three metals subjected to various strains, strain rates, temperatures and pressures. Eng. Fract. Mech. 1985, 21, 31–48. [Google Scholar] [CrossRef]
  28. Karim, M.R.; Fatt, M.S.H. Impact of the Boeing 767 Aircraft into the World Trade Center. J. Eng. Mech. 2005, 131, 1066–1072. [Google Scholar] [CrossRef]
  29. Cowper, G.R.; Symonds, P.S. Strain-Hardening and Strain-Rate Effects in the Impact Loading of Cantilever Beams; Technical Report No. 28; Division of Applied Mathematics, Brown University: Providence, RI, USA, 1957. [Google Scholar]
  30. Brown, W.F., Jr.; Mindlin, H.; Ho, C.Y. (Eds.) Aerospace Structural Metals Handbook: CINDAS/USAF CRDA Handbooks Operation; Purdue University: West Lafayette, IN, USA, 1997. [Google Scholar]
  31. Riera, J.D. On the stress analysis of structures subjected to aircraft impact forces. Nucl. Eng. Des. 1968, 8, 415–426. [Google Scholar] [CrossRef]
  32. Lee, K.; Jung, J.-W.; Hong, J.-W. Advanced aircraft analysis of an F-4 Phantom on a reinforced concrete building. Nucl. Eng. Des. 2014, 273, 505–528. [Google Scholar] [CrossRef]
  33. IAEA. Safety Aspects of Nuclear Power Plants in Human Induced External Events: Assessment of Structures; Safety Reports Series No.87; IAEA: Vienna, Austria, 2018. [Google Scholar]
  34. Li, F.; Chen, G. Nonlinear Seismic Response Characteristics of CAP1400 Nuclear Island Structure on Soft Rock Sites. Sci. Technol. Nucl. Install. 2020, 2020, 8867026. [Google Scholar] [CrossRef]
  35. Hohnquist, T.; Johnson, G.; Cook, W. A Computational Constitutive Model for Concrete Subjected to Large Strains, High Strain Rates and High Pressures. In Proceedings of the 14th International Symposium on Ballistics, Quebec City, QC, Canada, 26–29 September 1993; American Defense Preparedness Association: Arlington, VA, USA, 1993; pp. 591–600. [Google Scholar]
  36. Wan, W.; Yang, J.; Xu, G.; Liu, Y. Determination and evaluation of Holmquist-Johnson-Cook constitutive model parameters for ultra-high-performance concrete with steel fibers. Int. J. Impact Eng. 2021, 156, 103966. [Google Scholar] [CrossRef]
  37. Liu, Y.; Wei, Y. Drop-weight impact resistance of ultrahigh-performance concrete and the corresponding statistical analysis. J. Mater. Civ. Eng. 2022, 34, 04021409. [Google Scholar] [CrossRef]
  38. Das, N.; Nanthagopalan, P. Ballistic impact resistance of ultra-high-performance concrete (UHPC): A comprehensive experimental investigation and parametric analysis. Int. J. Impact Eng. 2024, 187, 104912. [Google Scholar] [CrossRef]
  39. Wei, C.; Zhang, Q.; Zhou, Y.; Cheng, Z.; Li, M.; Cui, C. Static and fatigue behaviors of short stud connectors embedded in ultra-high performance concrete. Eng. Struct. 2022, 273, 114888. [Google Scholar] [CrossRef]
  40. Zhang, X.; Yang, X.; Li, C.; Xu, F.; Wang, G. Friction affected fatigue behavior of steel-UHPC composite structures and the fatigue crack growth in studs. Int. J. Fatigue 2023, 177, 107949. [Google Scholar] [CrossRef]
  41. Mizuno, J.; Koshika, N.; Sawamoto, Y.; Niwa, N.; Yamashita, T.; Suzuki, A. Investigation on impact resistance of steel plate reinforced concrete barriers against aircraft impact Part 1: Test program and results. In Proceedings of the 18th International Conference on Structural Mechanics in Reactor Technology, Beijing, China, 7–12 August 2005; pp. 2566–2579. [Google Scholar]
  42. Mei, R.; Li, J.; Lin, G.; Pan, R.; Zhu, X. Evaluation of the vibration response of third generation nuclear power plants with isolation technology under large commercial aircraft impact. Prog. Nucl. Energy 2020, 120, 103230. [Google Scholar] [CrossRef]
  43. GB 50218-2014; Code for Classification of Rock Mass. Ministry of Housing and Urban-Rural Development of the People’s Republic of China: Beijing, China, 2014.
  44. Asgari, A.; Ahmadtabar Sorkhi, S.F. Wind turbine performance under multi-hazard loads: Wave, wind, and earthquake effects on liquefiable soil. Results Eng. 2025, 26, 104647. [Google Scholar] [CrossRef]
  45. American Society of Civil Engineers. Seismic Analysis of Safety-Related Nuclear Structures; American Society of Civil Engineers: Reston, VA, USA, 2017. [Google Scholar]
  46. Ansys, I. LS-DYNA Help: Perfectly Matched Layer (PML) Absorbing Boundary for SSI Applications. Available online: https://lsdyna.ansys.com/pml/#results (accessed on 27 August 2025).
  47. Choi, Y.; Ju, H.; Jung, H.-J. Floor Response Spectrum of Nuclear Power Plant Structure Considering Soil-Structure Interaction. In Vibration Engineering for a Sustainable Future: Experiments, Materials and Signal Processing; Springer: Berlin/Heidelberg, Germany, 2021; Volume 2, pp. 161–166. [Google Scholar]
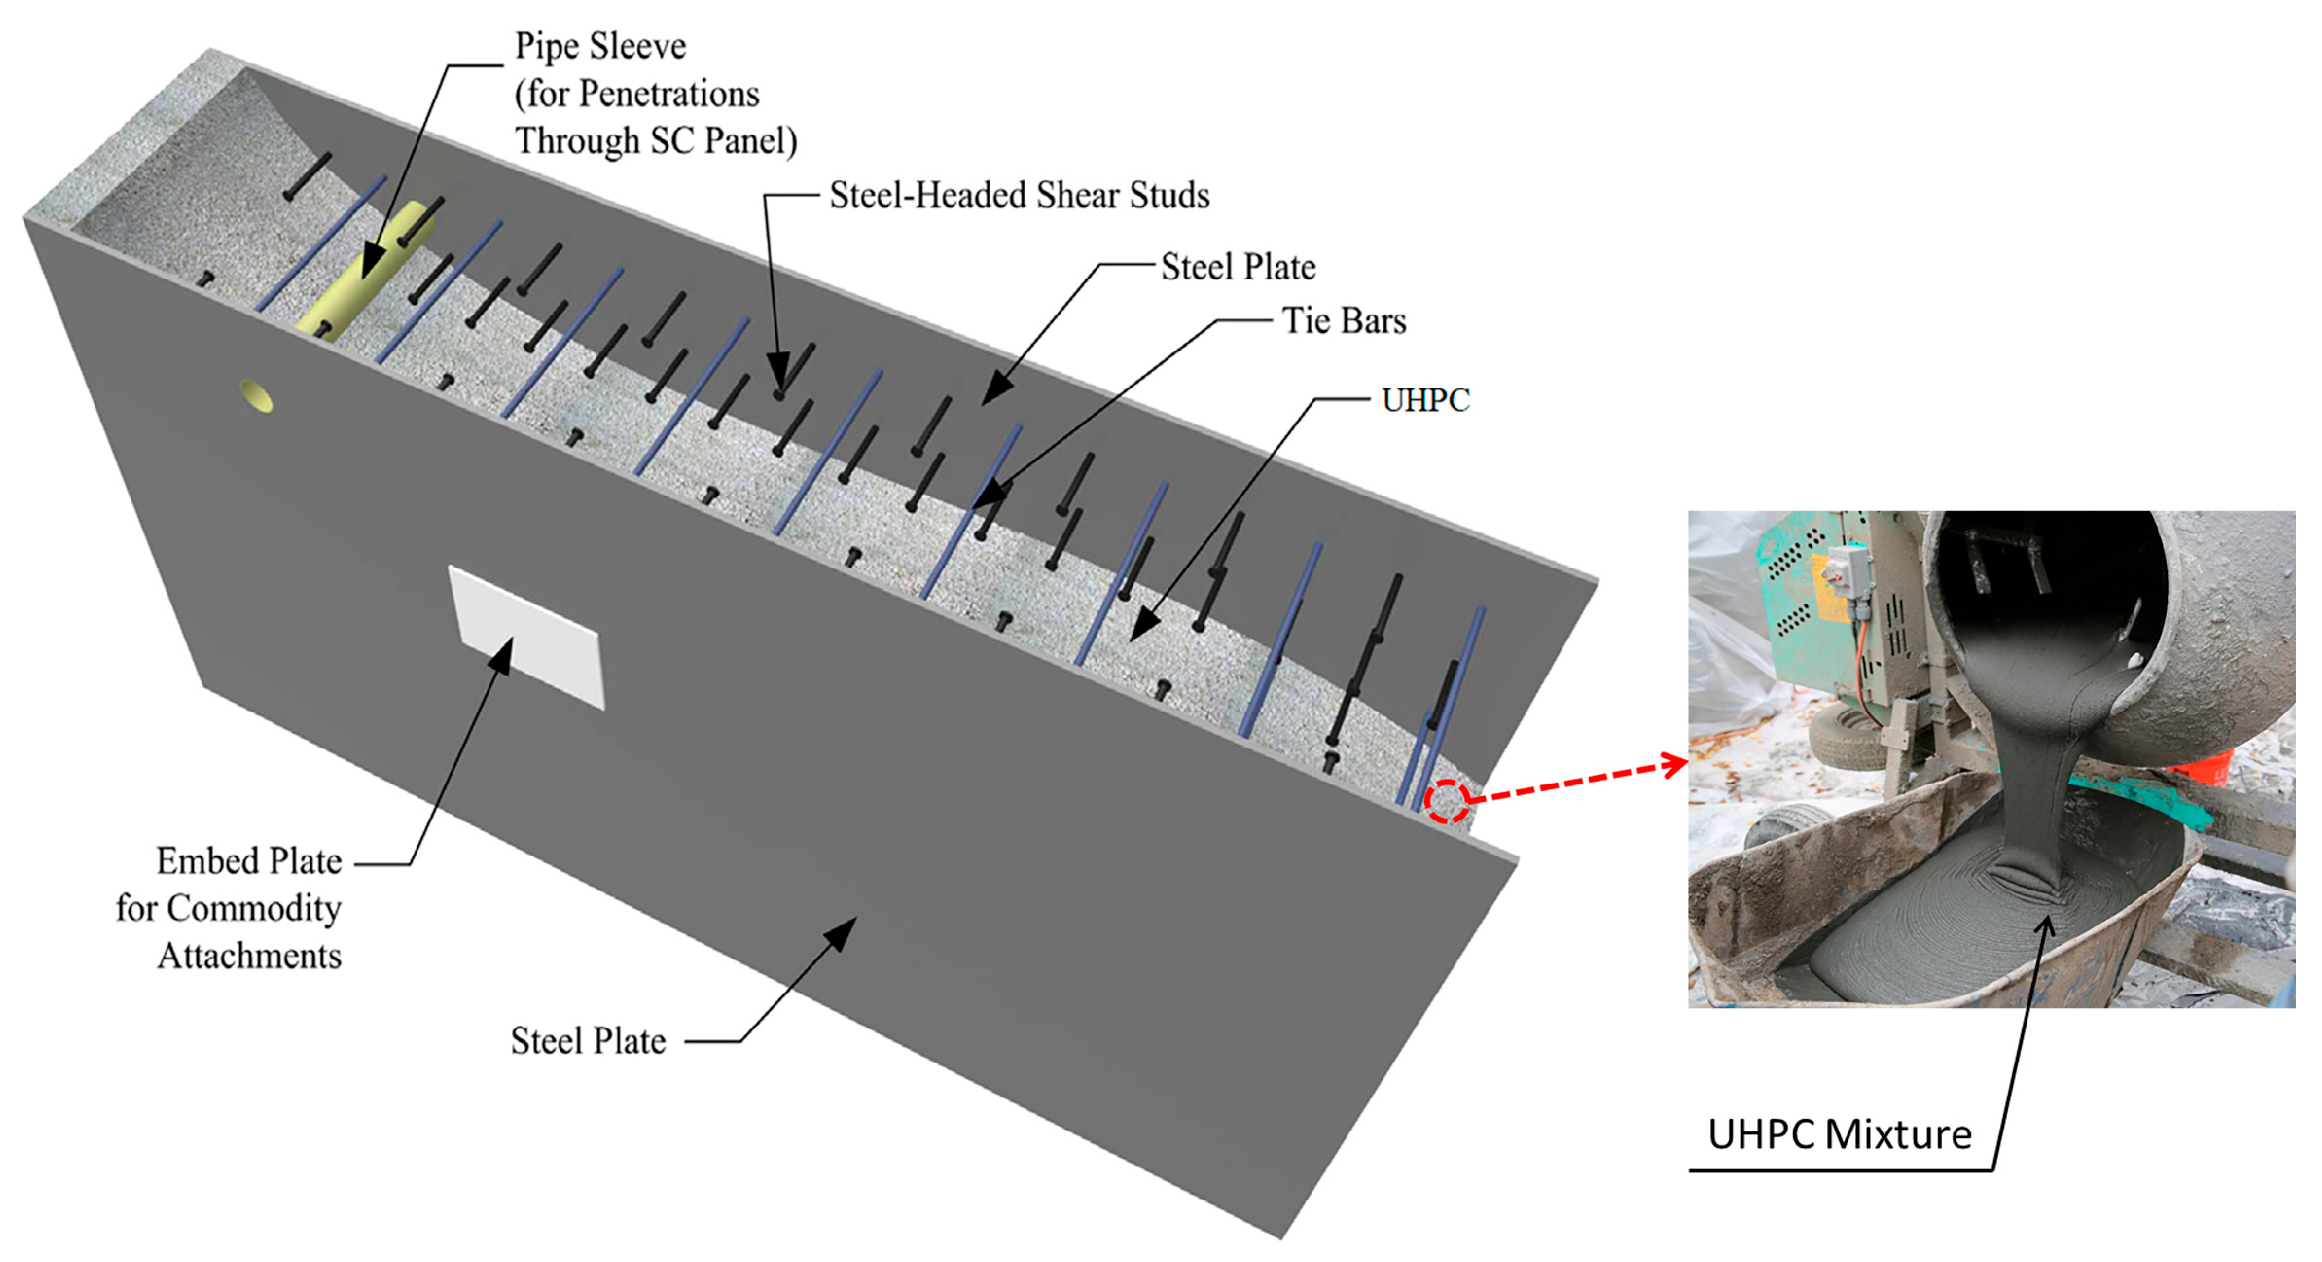
Figure 1. S-UHPC sandwich structure.
Buildings 15 03130 g001
Figure 2. FEM model of aircraft: (a) A340-300; (b) A380; (c) B767-200; and (d) B747-400.
Buildings 15 03130 g002
Figure 3. FEM model of A340-300 aircraft components: (a) fuselage frame and (b) engine.
Buildings 15 03130 g003
Figure 4. (a) Comparison of the total impact force of A340-300 (V = 100 m/s). (b) Comparison of the total impulse of A340-300 (V = 100 m/s). (c) Mass per unit length μ(x) of the A340-300. (d) Energy balance for the rigid target case: total, kinetic, internal, and hourglass energies vs. time.
Buildings 15 03130 g004
Figure 5. Geometrical configuration and key dimensions of the S-UHPC containment structure.
Buildings 15 03130 g005
Figure 6. (a) Constitutive model of JHC concrete. (b) Damage model of JHC concrete. (c) Three-segment empirical EOS for JHC concrete.
Buildings 15 03130 g006
Figure 7. Setting of simulated working conditions.
Buildings 15 03130 g007
Figure 8. FEM of the engine and UHPC panel.
Buildings 15 03130 g008
Figure 9. (a) Comparison of the front damage of the UHPC panel to the experimental results. (b) Comparison of the rear damage of the UHPC panel to the experimental results.
Buildings 15 03130 g009
Figure 10. (a) Deformation diagram of the engine after crushing. (b) Deformation of the rear of the UHPC panel. (c) Time histories of the engine velocity.
Buildings 15 03130 g010
Figure 11. FEM model of the 1/7.5-scale aircraft (units: mm).
Buildings 15 03130 g011
Figure 12. (a) Fracture process of the aircraft model and FSC60 panel. (b) Fracture process of the aircraft model and FSC80 panel.
Buildings 15 03130 g012
Figure 13. (a) Engine damage in the FSC 80 panel impact test. (b) Engine damage in FSC80 panel impact analysis.
Buildings 15 03130 g013
Figure 14. (a) Velocity changes of the engine impacting the FSC60 plate. (b) Velocity changes of the engine impacting the FSC80 plate.
Buildings 15 03130 g014
Figure 15. (a) Displacement–time histories at the aircraft impact location under three mesh sizes (short edge: 400 mm, 600 mm, and 800 mm). (b) Residual time histories of the impact point displacement relative to the finest mesh (Δ= 400 mm). (c) Energy balance for Δ= 600 mm. (d) Displacement–time histories at three impact locations: dome–cylinder junction, upper 1/4 of the cylinder, and mid-height of the cylinder.
Buildings 15 03130 g015aBuildings 15 03130 g015b
Figure 16. (a) Displacement–time histories at the impact location for different aircraft types at 150 m/s. (b) Impact force–time histories for different aircraft types at 150 m/s. (c) Relationship between aircraft type, impact velocity, and peak displacement. (d) Relationship between aircraft type, impact velocity, and peak impact force. (eh) A340-300 impact snapshots at 0.1–0.4 s.
Buildings 15 03130 g016aBuildings 15 03130 g016b
Figure 17. (a) Displacement–time histories at the impact location under different impact velocities. (b) Impact force–time histories under different impact velocities. (c) Von Mises stress distribution of the outer steel plate at peak impact force (150 m/s). (d) Von Mises stress distribution of the outer steel plate at peak impact force (200 m/s).
Buildings 15 03130 g017
Figure 18. (a) Displacement–time histories under different wall thicknesses (150 m/s). (b) Impact force–time histories under different wall thicknesses (150 m/s). (c) UHPC damage distribution in 800 mm S-UHPC at 200 m/s impact. (d) Von Mises stress in a steel plate of 800 mm S-UHPC at 200 m/s. (e) Damage distribution in 1100 mm NRC at 200 m/s impact. (f) Von Mises stress in a steel plate of 1100 mm NRC at 200 m/s.
Buildings 15 03130 g018aBuildings 15 03130 g018b
Figure 19. (a) Displacement–time histories under different UHPC strength grades (150 m/s). (b) Impact force–time histories under different UHPC strength grades (150 m/s). (c,d) Outer faceplate, von Mises stress (MPa) at tpeak: C120 and C180. (e,f) Inner faceplate, von Mises stress (MPa) at tpeak: C120 and C180. (g,h) UHPC core, maximum principal stress (MPa; compression negative) at tpeak: C120 and C180.
Buildings 15 03130 g019aBuildings 15 03130 g019b
Figure 20. (a) Displacement–time histories under different stud spacings (150 m/s). (b) Impact force–time histories under different stud spacings (150 m/s).
Buildings 15 03130 g020
Figure 21. (a) Displacement–time histories under different steel thicknesses (150 m/s). (b) Impact force–time histories under different steel thicknesses (150 m/s). (c) Effective plastic strain distribution for a 5 mm steel plate. (d) Effective plastic strain distribution for a 20 mm steel plate.
Buildings 15 03130 g021
Figure 22. Local mesh refinement near containment–soil interface.
Buildings 15 03130 g022
Figure 23. Global FE model of aircraft impact scenario.
Buildings 15 03130 g023
Figure 24. Layout of vibration monitoring points.
Buildings 15 03130 g024
Figure 25. Floor response spectra at representative monitoring points under various soil conditions: (a) Point A—basemat center, X-direction. (b) Point C—mid-height of inner containment, Z-direction.
Buildings 15 03130 g025
Figure 26. Time–frequency maps at two monitoring points for Soil1 (hard rock) and Soil6 (soft soil): (a) Point A, X-direction, Soil1; (b) Point A, X-direction, Soil6; (c) Point C, Z-direction, Soil1; and (d) Point C, Z-direction, Soil6.
Buildings 15 03130 g026
Figure 27. Comparison of floor response spectra under different impact velocities: (a) Soil3—Point A in the X-direction (basemat center); (b) Soil3—Point C in the Z-direction (mid-height of inner containment); (c) Soil5—Point A in the X-direction (basemat center); and (d) Soil5—Point C in the Z-direction (mid-height of inner containment).
Buildings 15 03130 g027aBuildings 15 03130 g027b
Figure 28. Comparison of floor response spectra for different structural types under impact velocity of 100 m/s: (a) Soil1, Point A in the X-direction (basemat center); (b) Soil1, Point C in the Z-direction (mid-height of inner containment); (c) Soil5, Point A in the X-direction (basemat center); and (d) Soil5, Point C in the Z-direction (mid-height of inner containment).
Buildings 15 03130 g028
Table 1. Parameters of four commercial aircraft.
AircraftMaximum Takeoff Weight (t)Wing Span (m)Total Length (m)Number of Passengers
A340-30024360.363.6295
A38056079.872.8555
B767-20040064.470.6181
B747-40011347.648.5416
Table 4. Material parameters for UHPC.
MaterialC120C150C180
ρ 0 (kg/m3)260026002600
f c (MPa)120150180
G (GPa)19.5520.8322.92
T (MPa)11.213.315.0
A0.30.30.3
B1.811.811.81
C0.0190.0190.019
N0.810.810.81
SMAX (MPa)3.53.53.5
D10.0450.0500.061
D21.01.01.0
EFMIN0.0110.0120.016
Pc (MPa)405060
μc0.001440.00180.0021
Pl (GPa) 3.633.633.63
μpl0.1170.1170.117
K1 (GPa)101.2101.2101.2
K2 (GPa)−199.5−199.5−199.5
K3 (GPa)329.2329.2329.2
Source/References: HJC formulation from [35]; UHPC parameter values adopted from Wan et al. [36].
Table 5. Material parameters for metal components.
MaterialSteel PlateStud/Tie-BarInternal Containment
Density (kg/m3)780078007800
Young’s modulus (MPa)21,00020,00021,000
Poisson’s ratio0.30.30.3
Yield stress (MPa)412335500
Tangent modulus (MPa)850085008500
C40//
p5//
FS0.40.10.5
Source/References: Steel plate and internal component properties from [30]; Cowper–Symonds rate coefficients (where applicable) from [26,30]; erosion/ductility limit parameters consistent with [28] and the modeling practice in Section 2.
Table 6. Mechanical parameters of six typical site conditions.
CaseTypeShear Wave Velocity
(m/s)
Shear Modulus
(GPa)
Density
(kg/m3)
Poisson’s
Ratio
Internal Friction
Angle (°)
Cohesion
(kPa)
Soil1Hard Rock243815.75126500.2602100
Soil2Firm Rock10672.84625000.340850
Soil3Soft Rock7321.25923500.3230430
Soil4Soft-to-Medium Soil4310.32120000.352530
Soil5Upper-Bound Soft-to-Medium Soil3050.16120000.3616.724
Soil6Soft Soil3050.16120000.3616.724
Source/References: Site profiles and Vs/ρ from [24]; representative ranges of internal friction angle (φ) and cohesion (c) consistent with the Chinese national standard “Classification of Rock Mass” [43].
Disclaimer/Publisher’s Note: The statements, opinions and data contained in all publications are solely those of the individual author(s) and contributor(s) and not of MDPI and/or the editor(s). MDPI and/or the editor(s) disclaim responsibility for any injury to people or property resulting from any ideas, methods, instructions or products referred to in the content.