Exploring Urban Spatial Quality Through Street View Imagery and Human Perception Analysis
Abstract
1. Introduction
- (1)
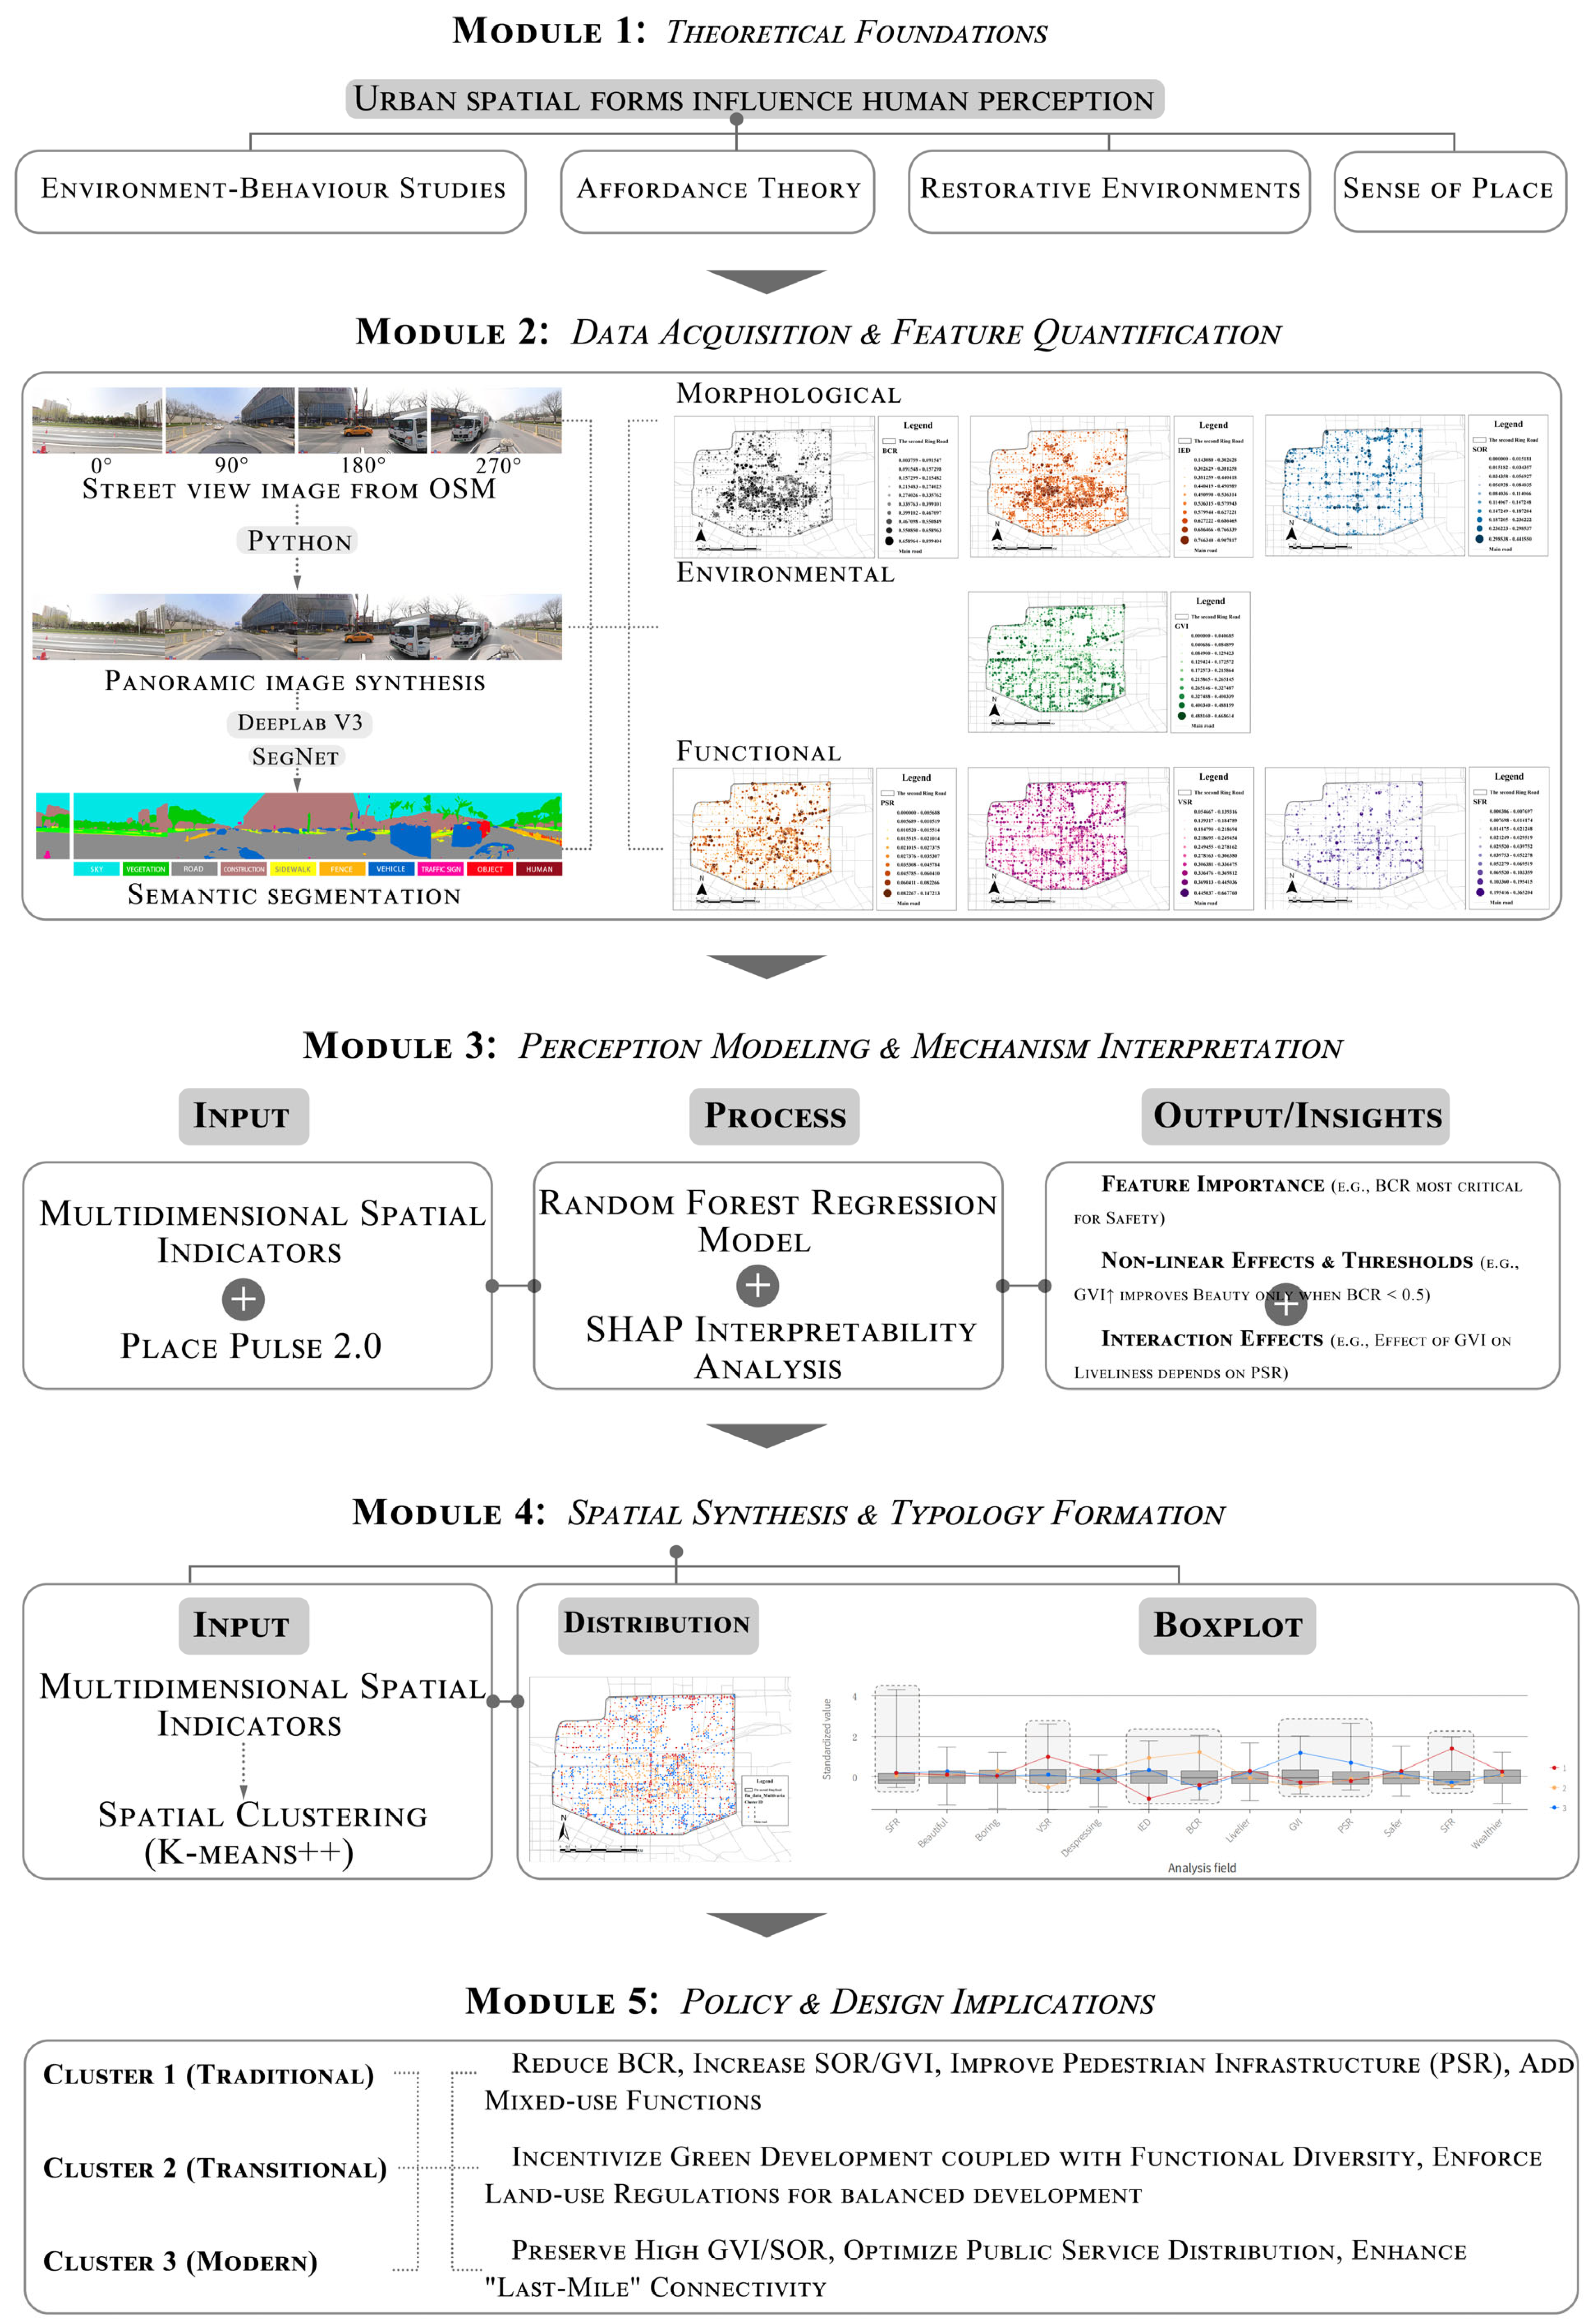
- Theoretical: Proposing and validating a non-linear explanatory framework for urban spatial perception that moves beyond simple correlations to reveal the synergistic and threshold effects between multidimensional features.
- (2)
- Methodological: Developing an integrated analytical pipeline that innovatively couples deep learning-based semantic segmentation with Explainable AI techniques (SHAP) and spatial clustering to enhance the interpretability and spatial explicitness of perception modeling.
- (3)
- Data: Demonstrating the value of multi-source heterogeneous data fusion and quantitatively linking street-view-derived spatial indicators with large-scale human perception scores for a comprehensive human-scale quality assessment.
- (4)
- Policy Relevance: Generating actionable, spatially explicit intelligence by identifying distinct urban spatial typologies with specific perceptual signatures, thereby providing an evidence-based foundation for targeted urban renewal and design strategies, particularly in dense urban settings.
2. Literature Review
3. Materials and Methods
3.1. Study Area and Data Sources
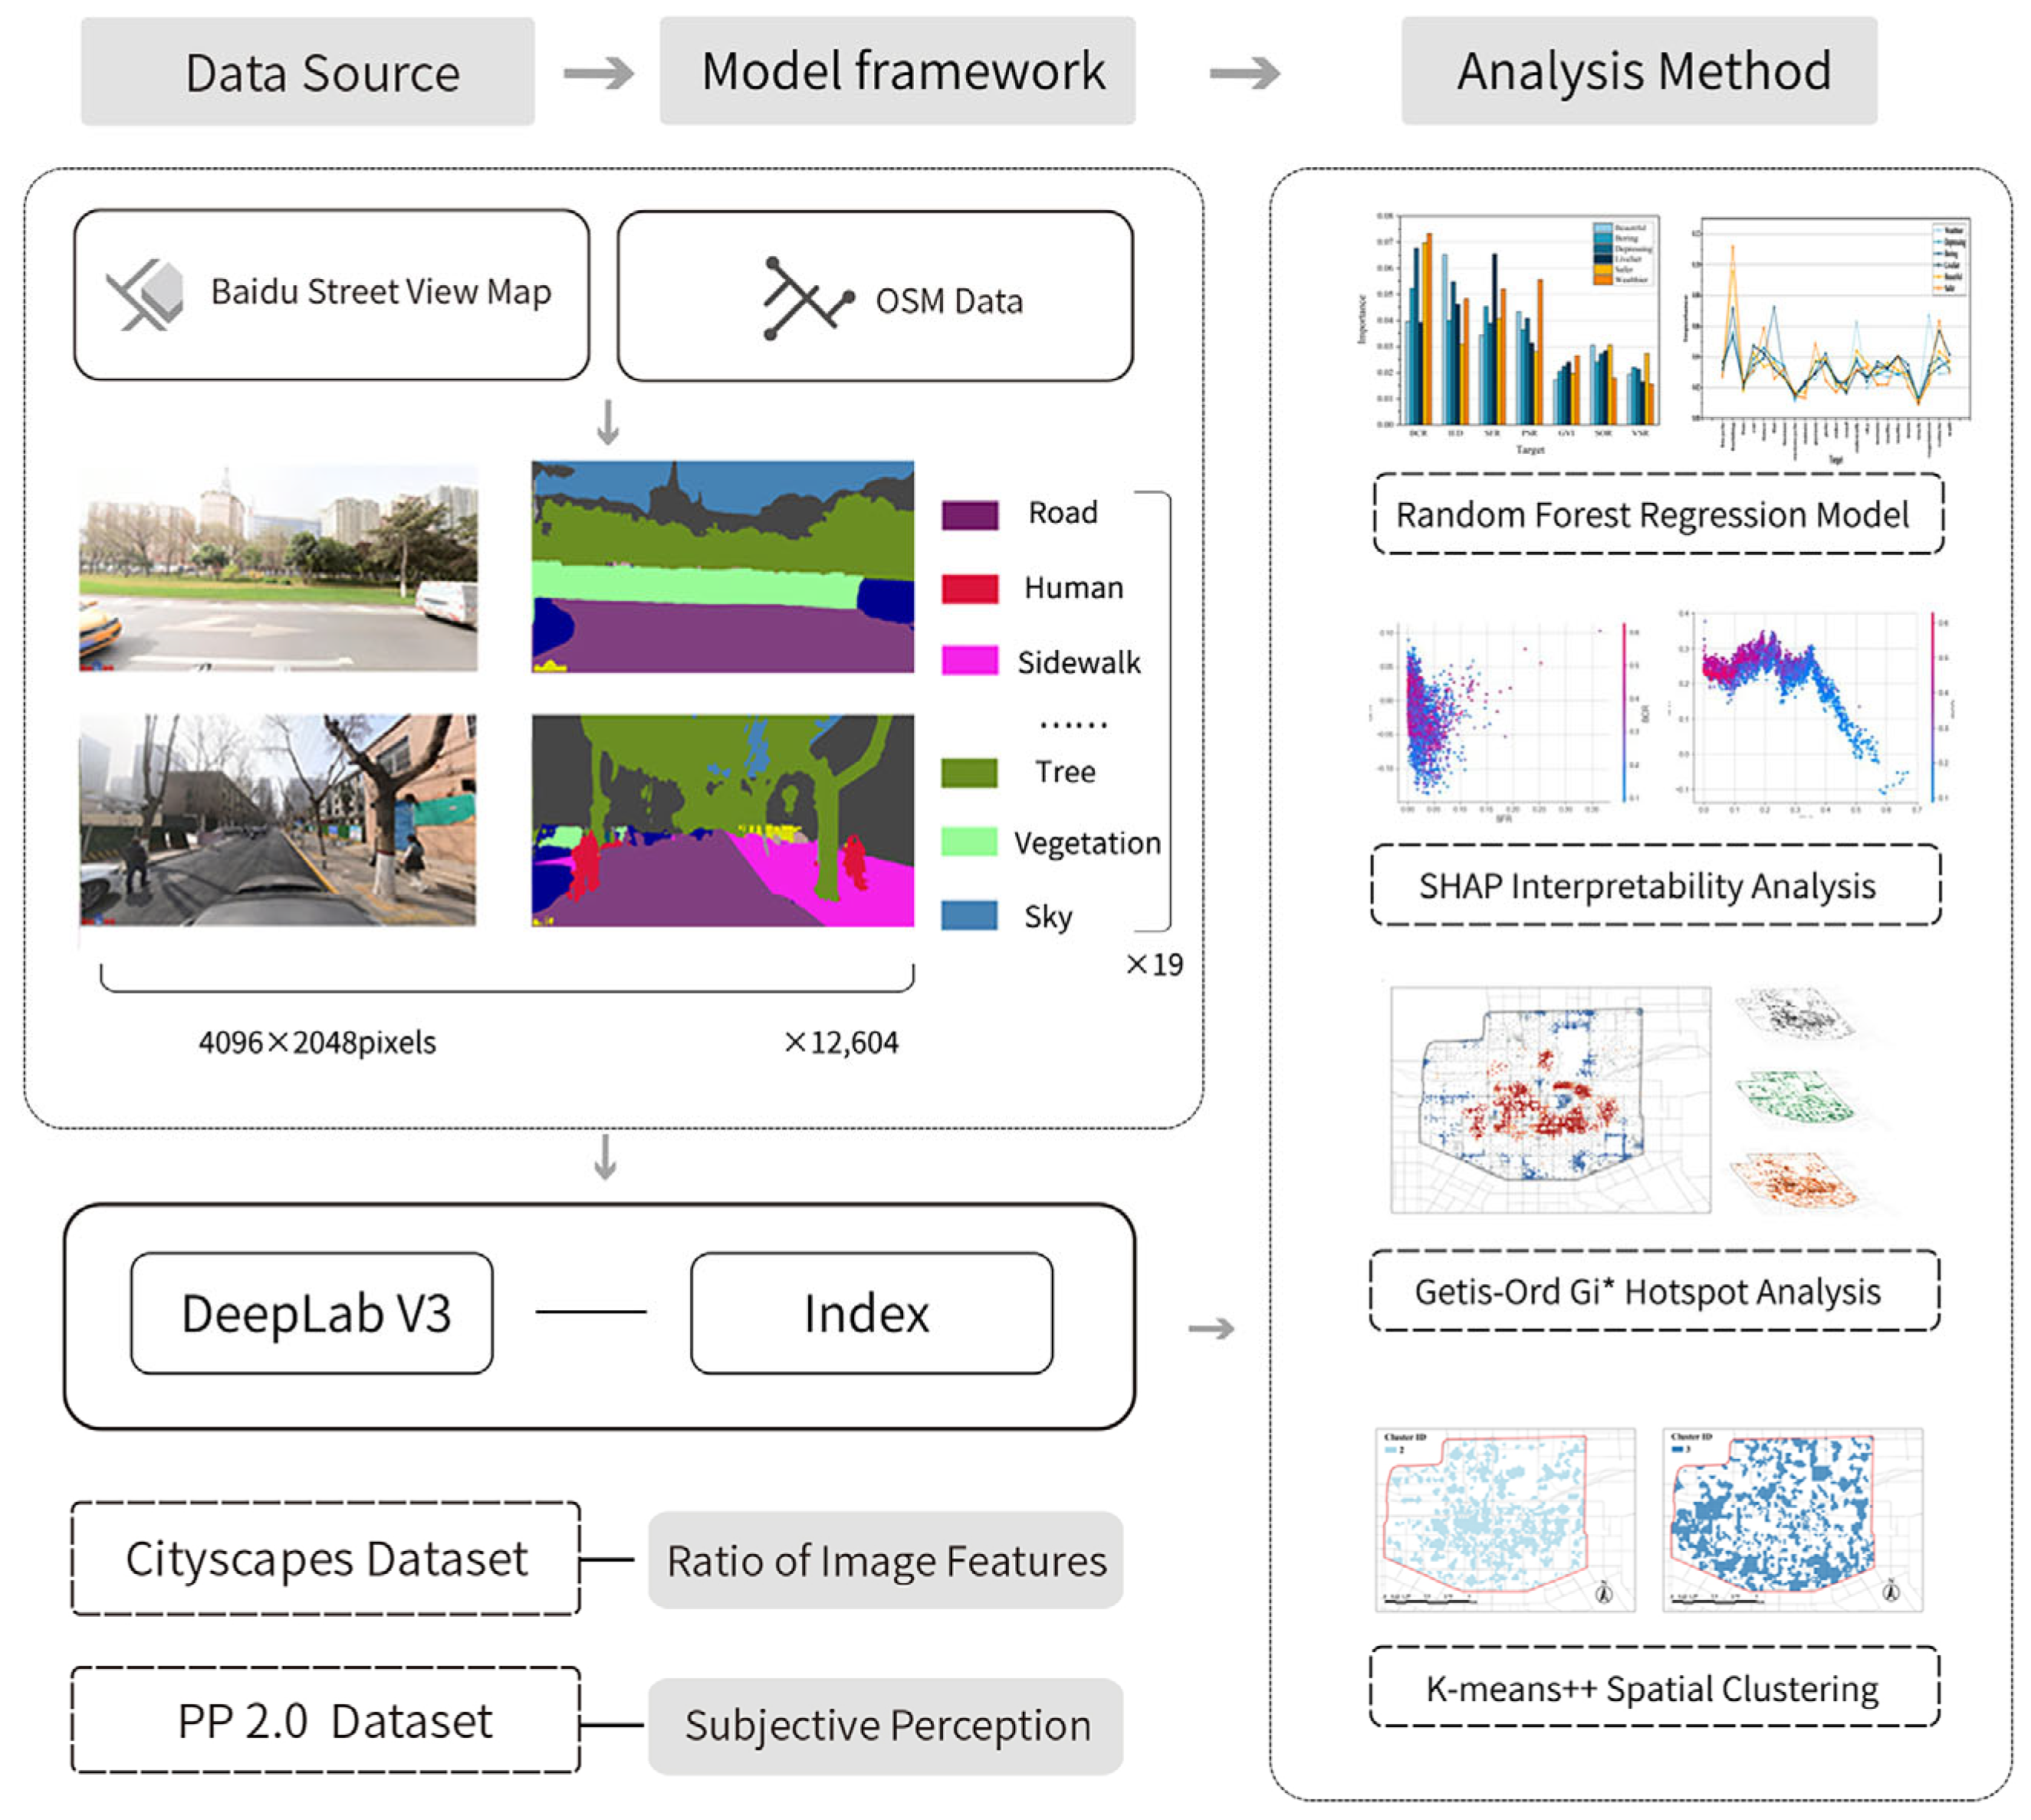
3.2. Model Training Process
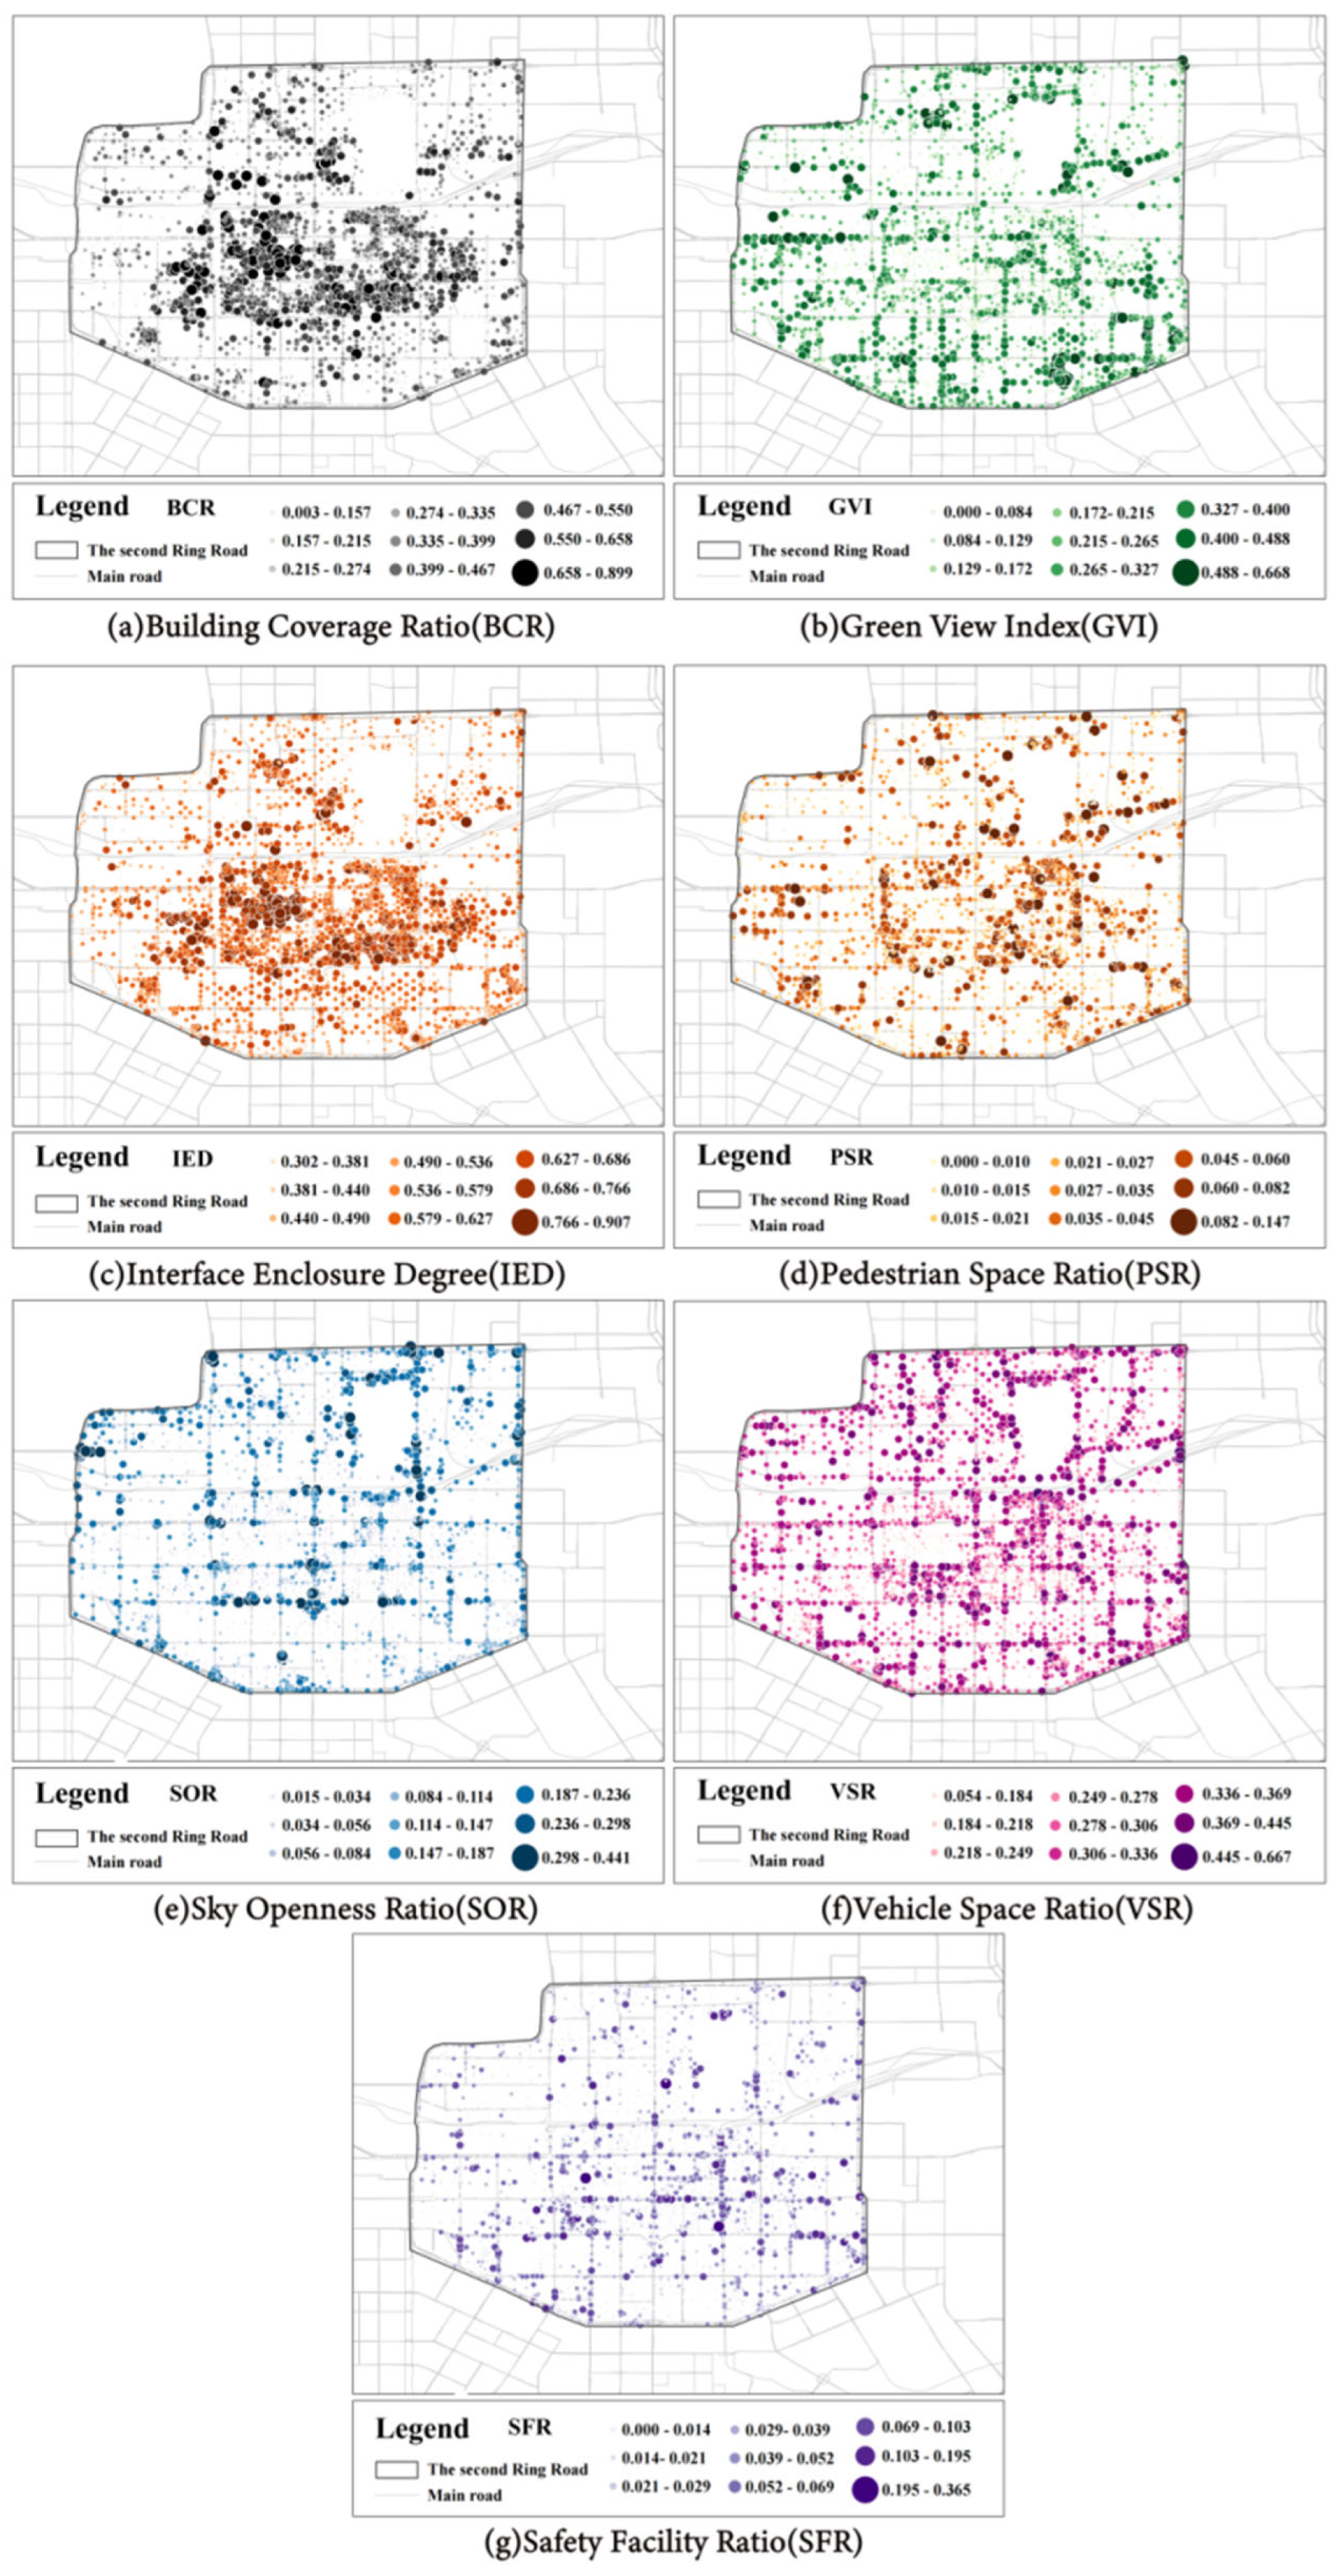
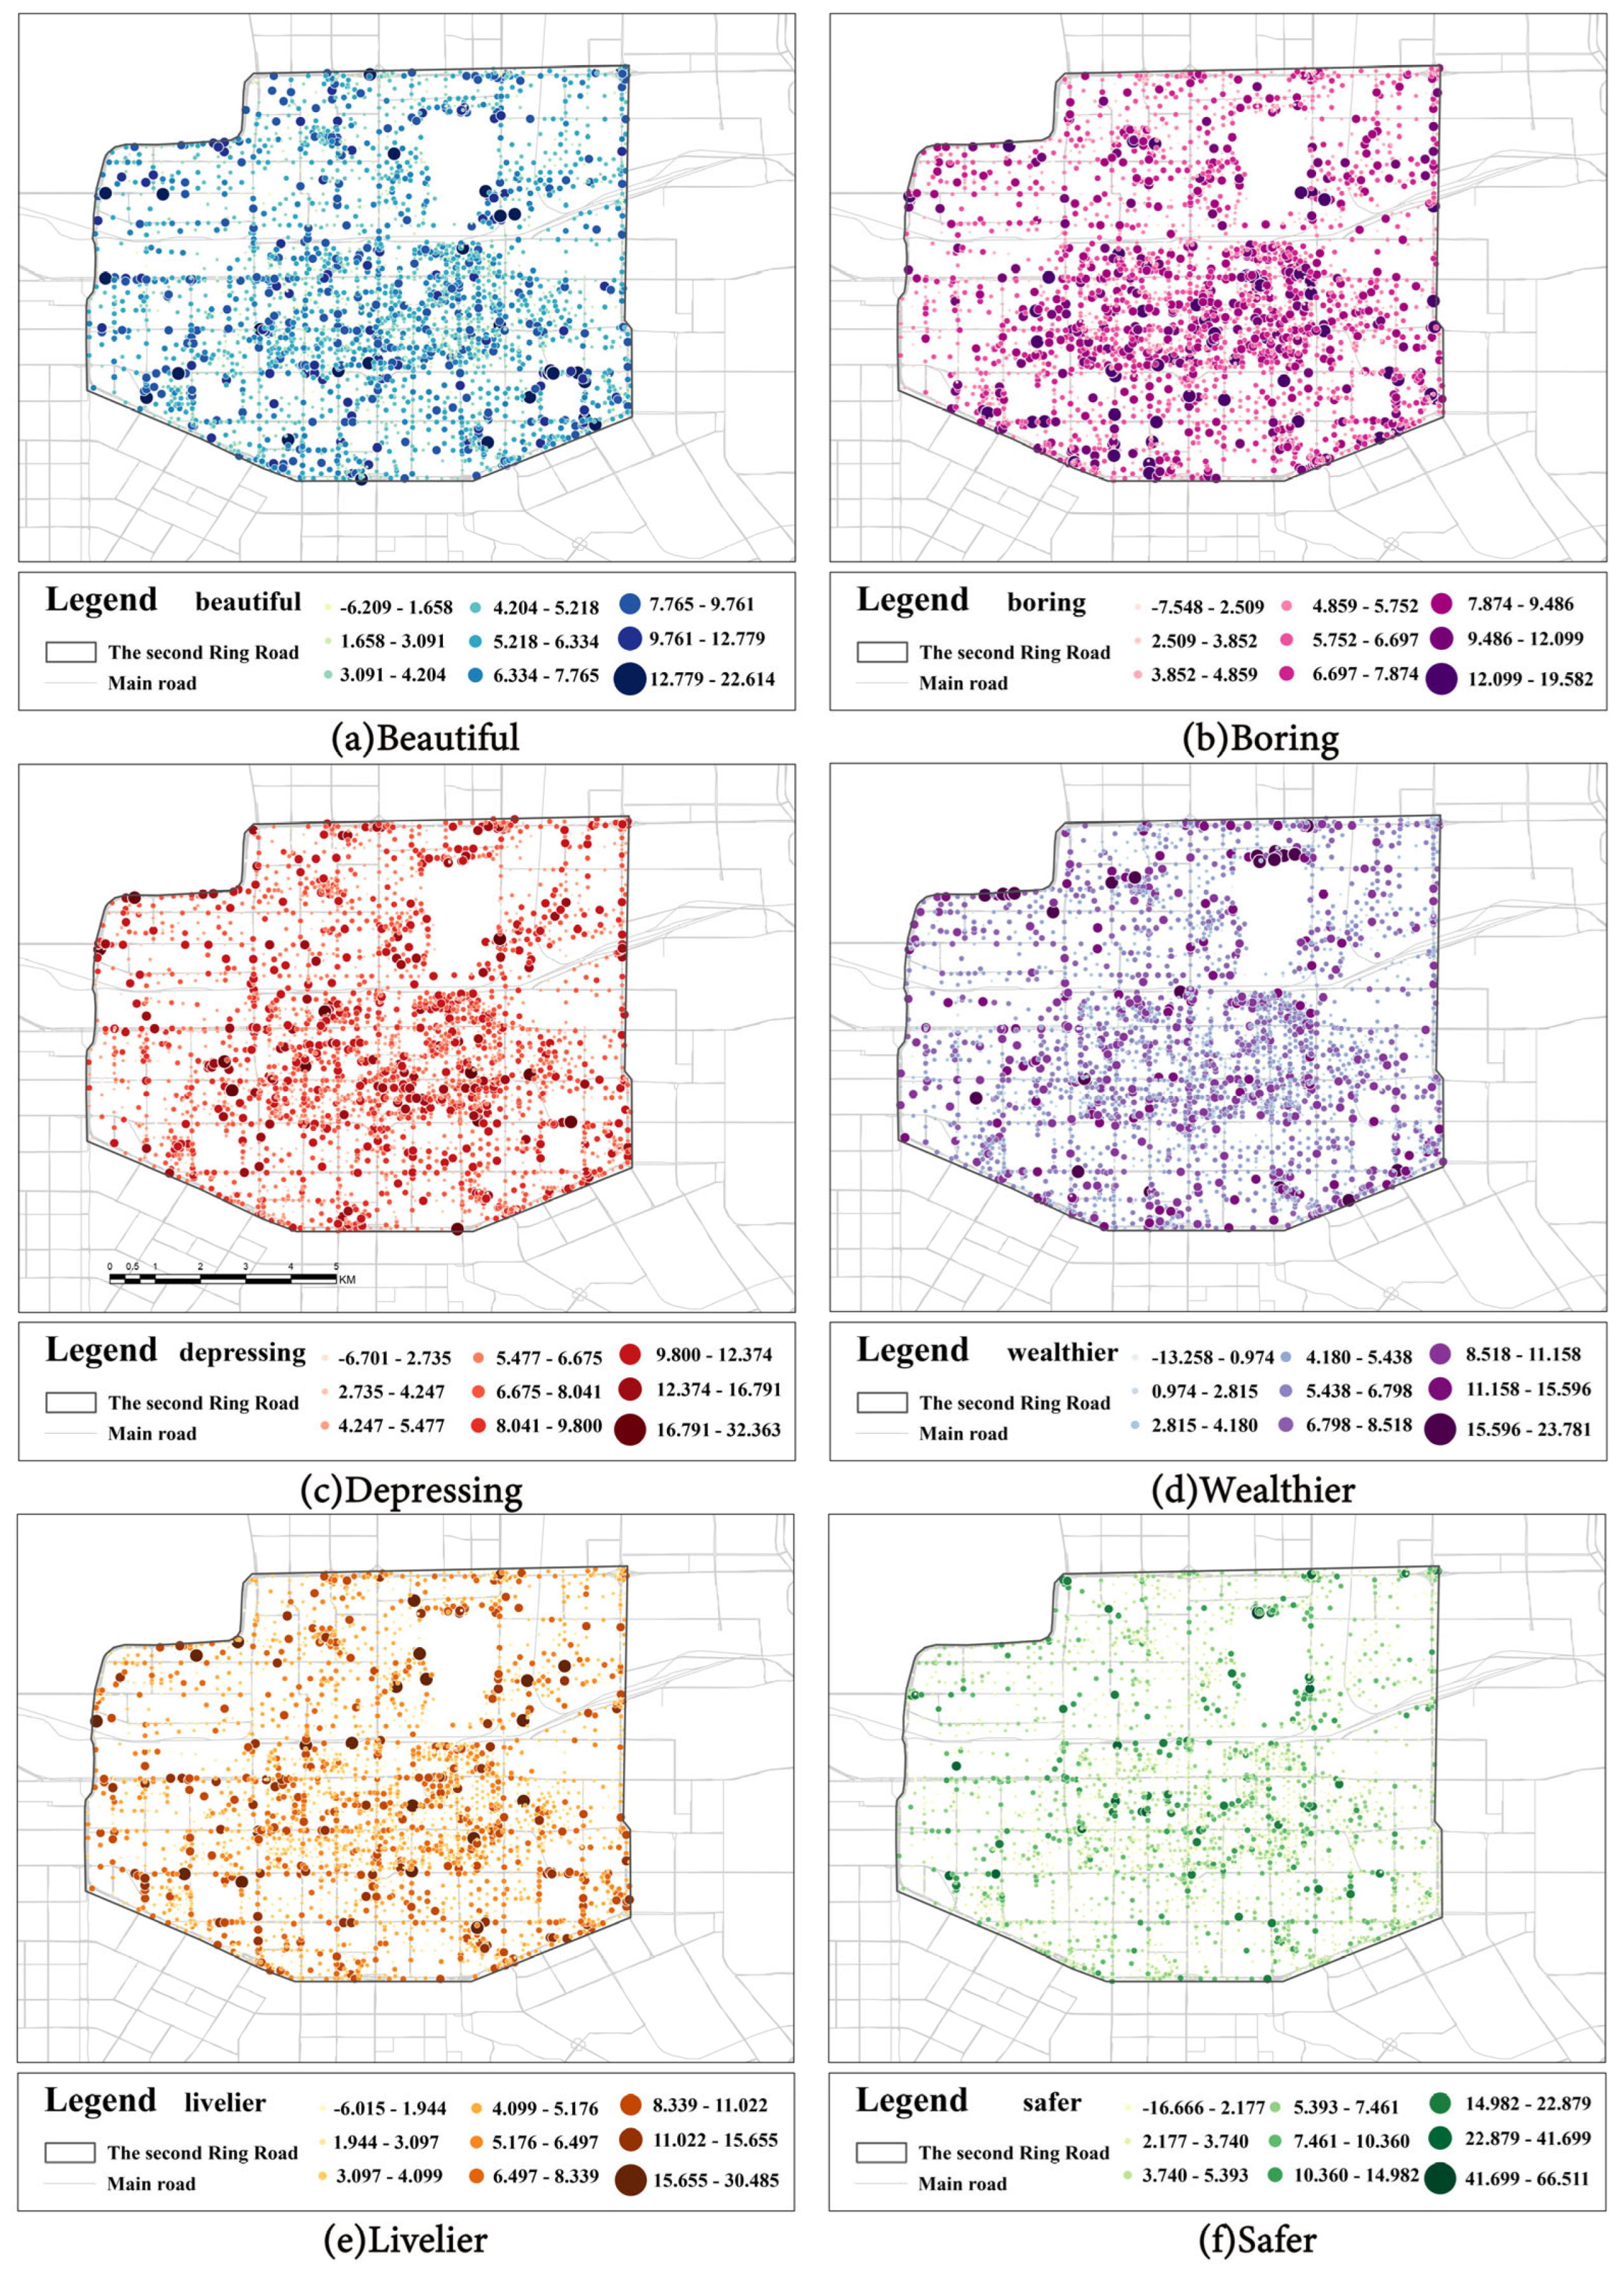
- Building Coverage Ratio (BCR): proportion of image pixels occupied by buildings,
- Sky Openness Ratio (SOR): proportion of sky pixels,
- Interface Enclosure Degree (IED): proportion of continuous building facades,
- Green View Index (GVI): proportion of vegetation pixels,
- Sky Openness Ratio (SOR): proportion of sky pixels,
- Pedestrian Space Ratio (PSR): proportion of pedestrian pixels,
- Vehicle Space Ratio (VSR): proportion of vehicle pixels.
3.3. Construction of Urban Spatial Feature System and Multi-Source Data Integration
3.4. Data Analysis Methods
4. Results
4.1. Semantic Segmentation Results and Spatial Distribution of Quality Indicators
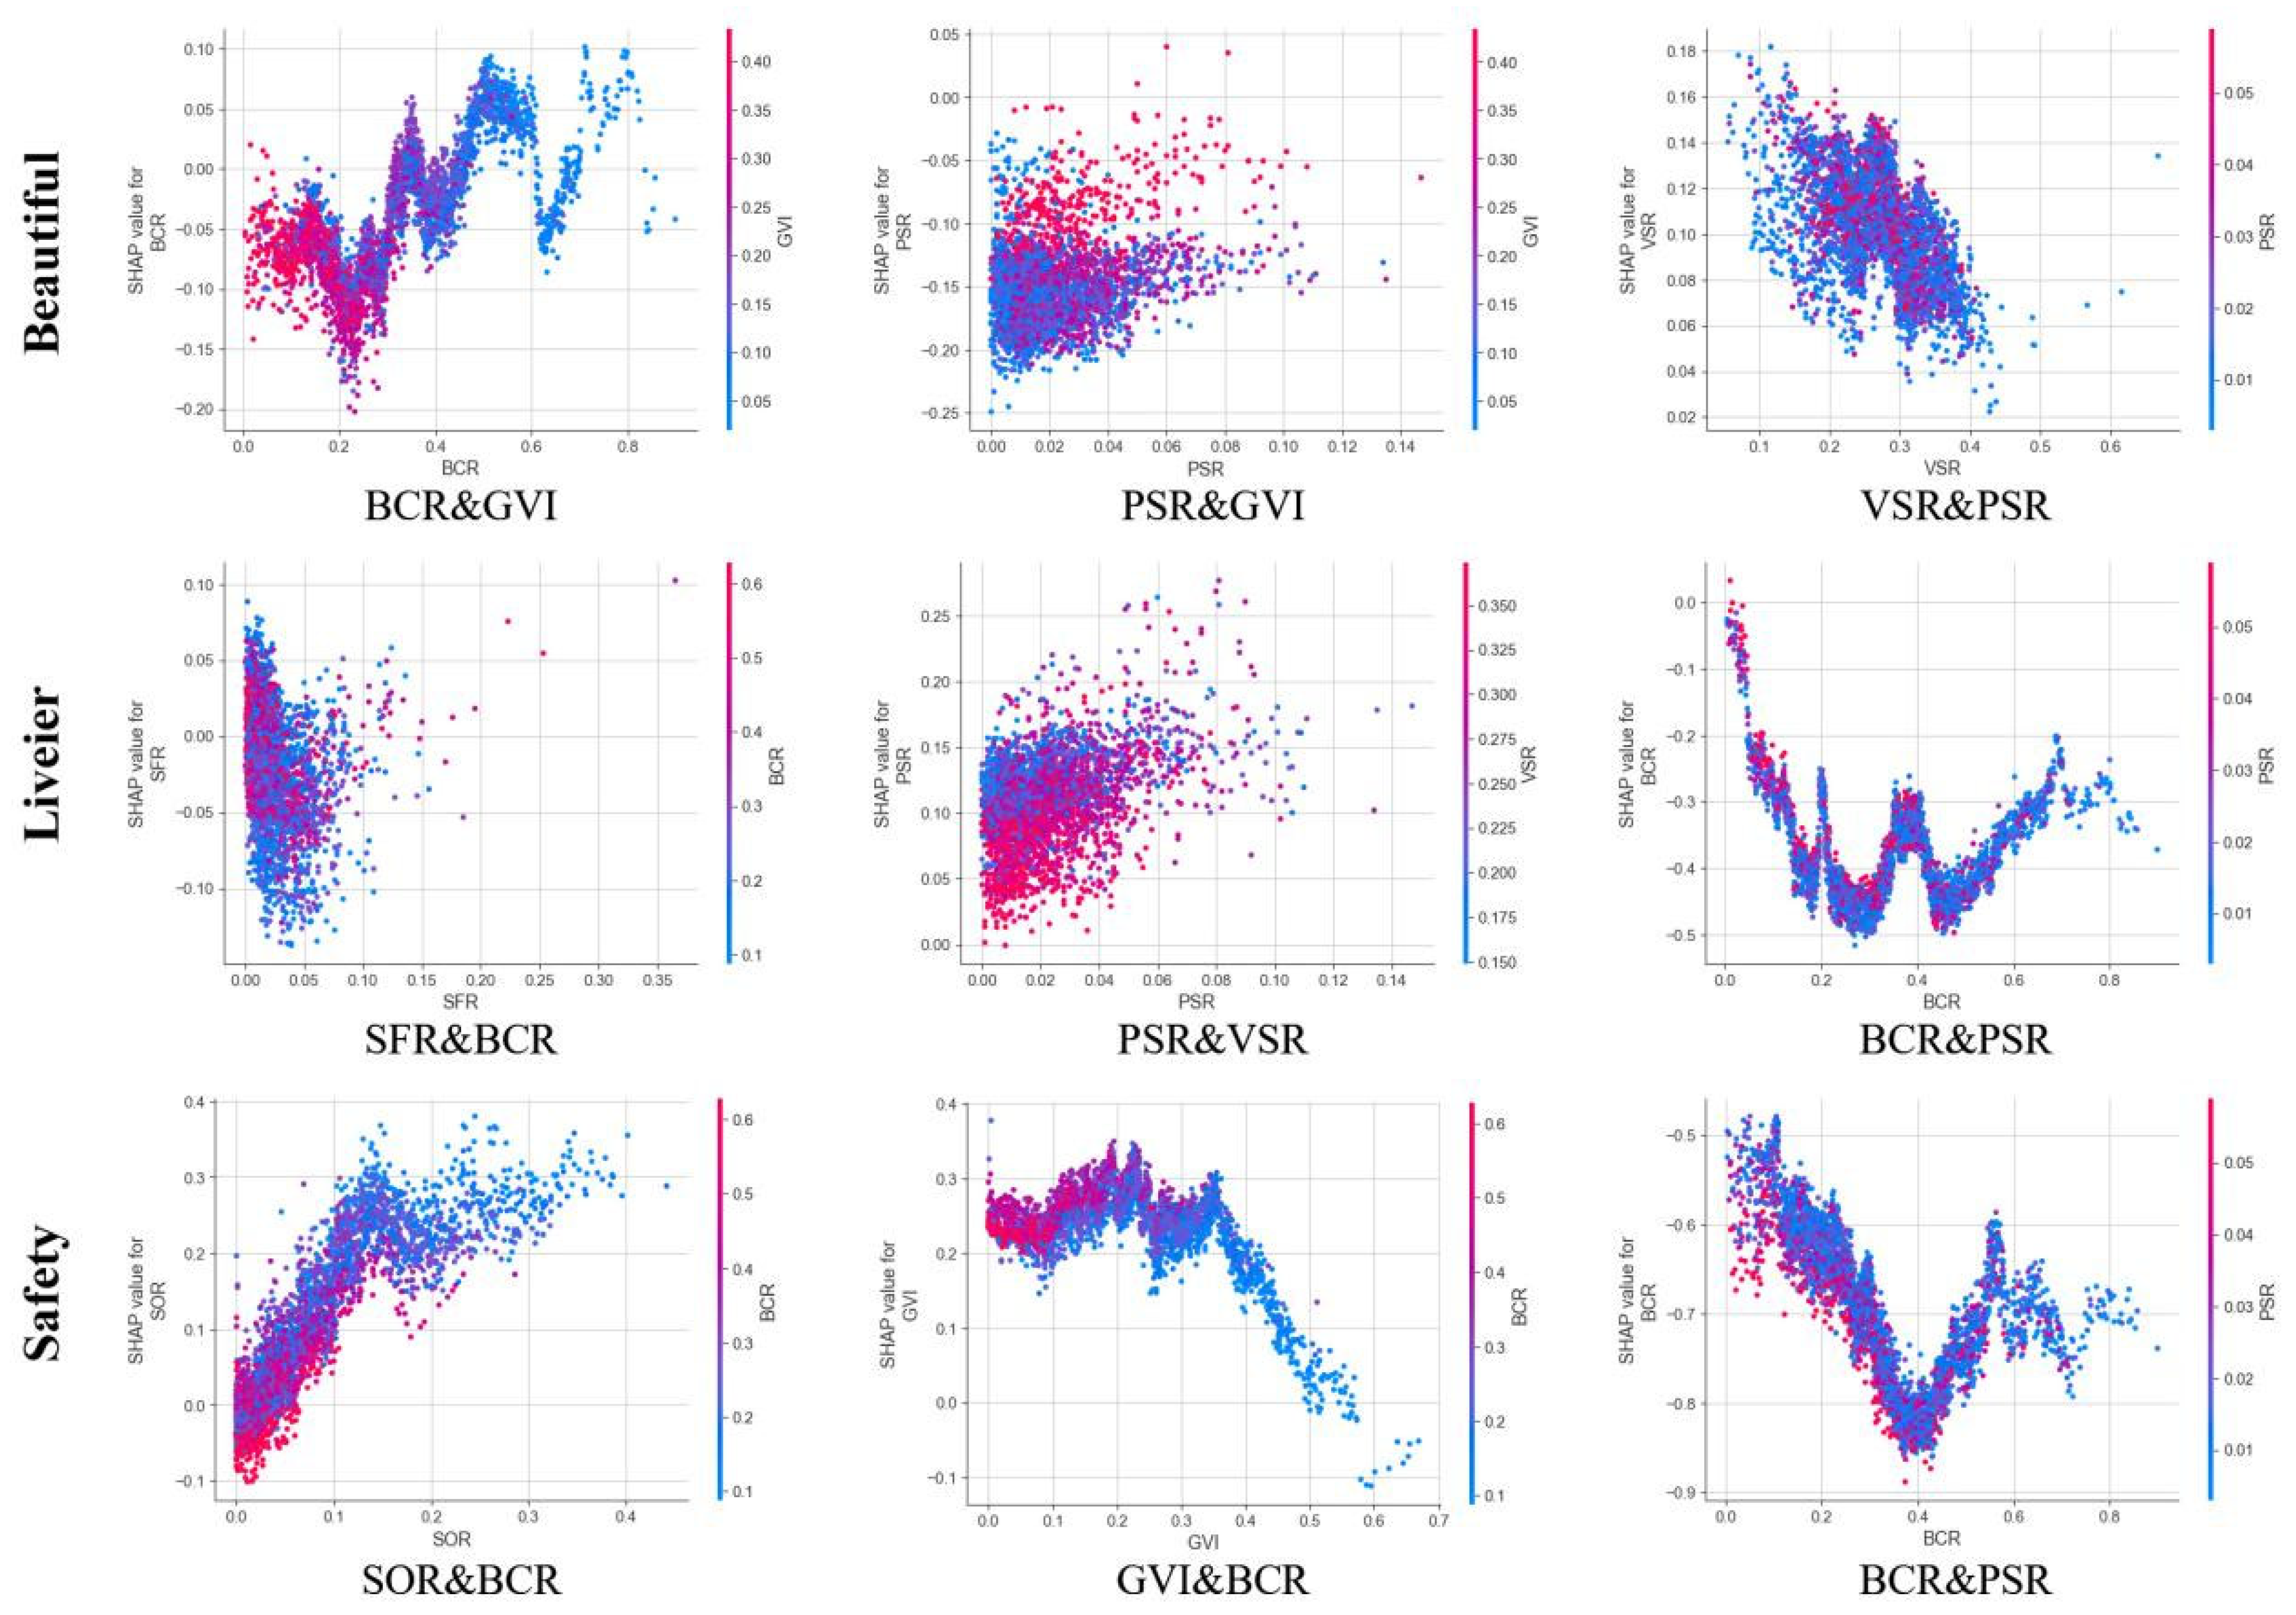
4.2. Subjective Perception Modeling and Feature Contribution Analysis
4.3. Analysis of Spatial Hotspot Distribution Patterns
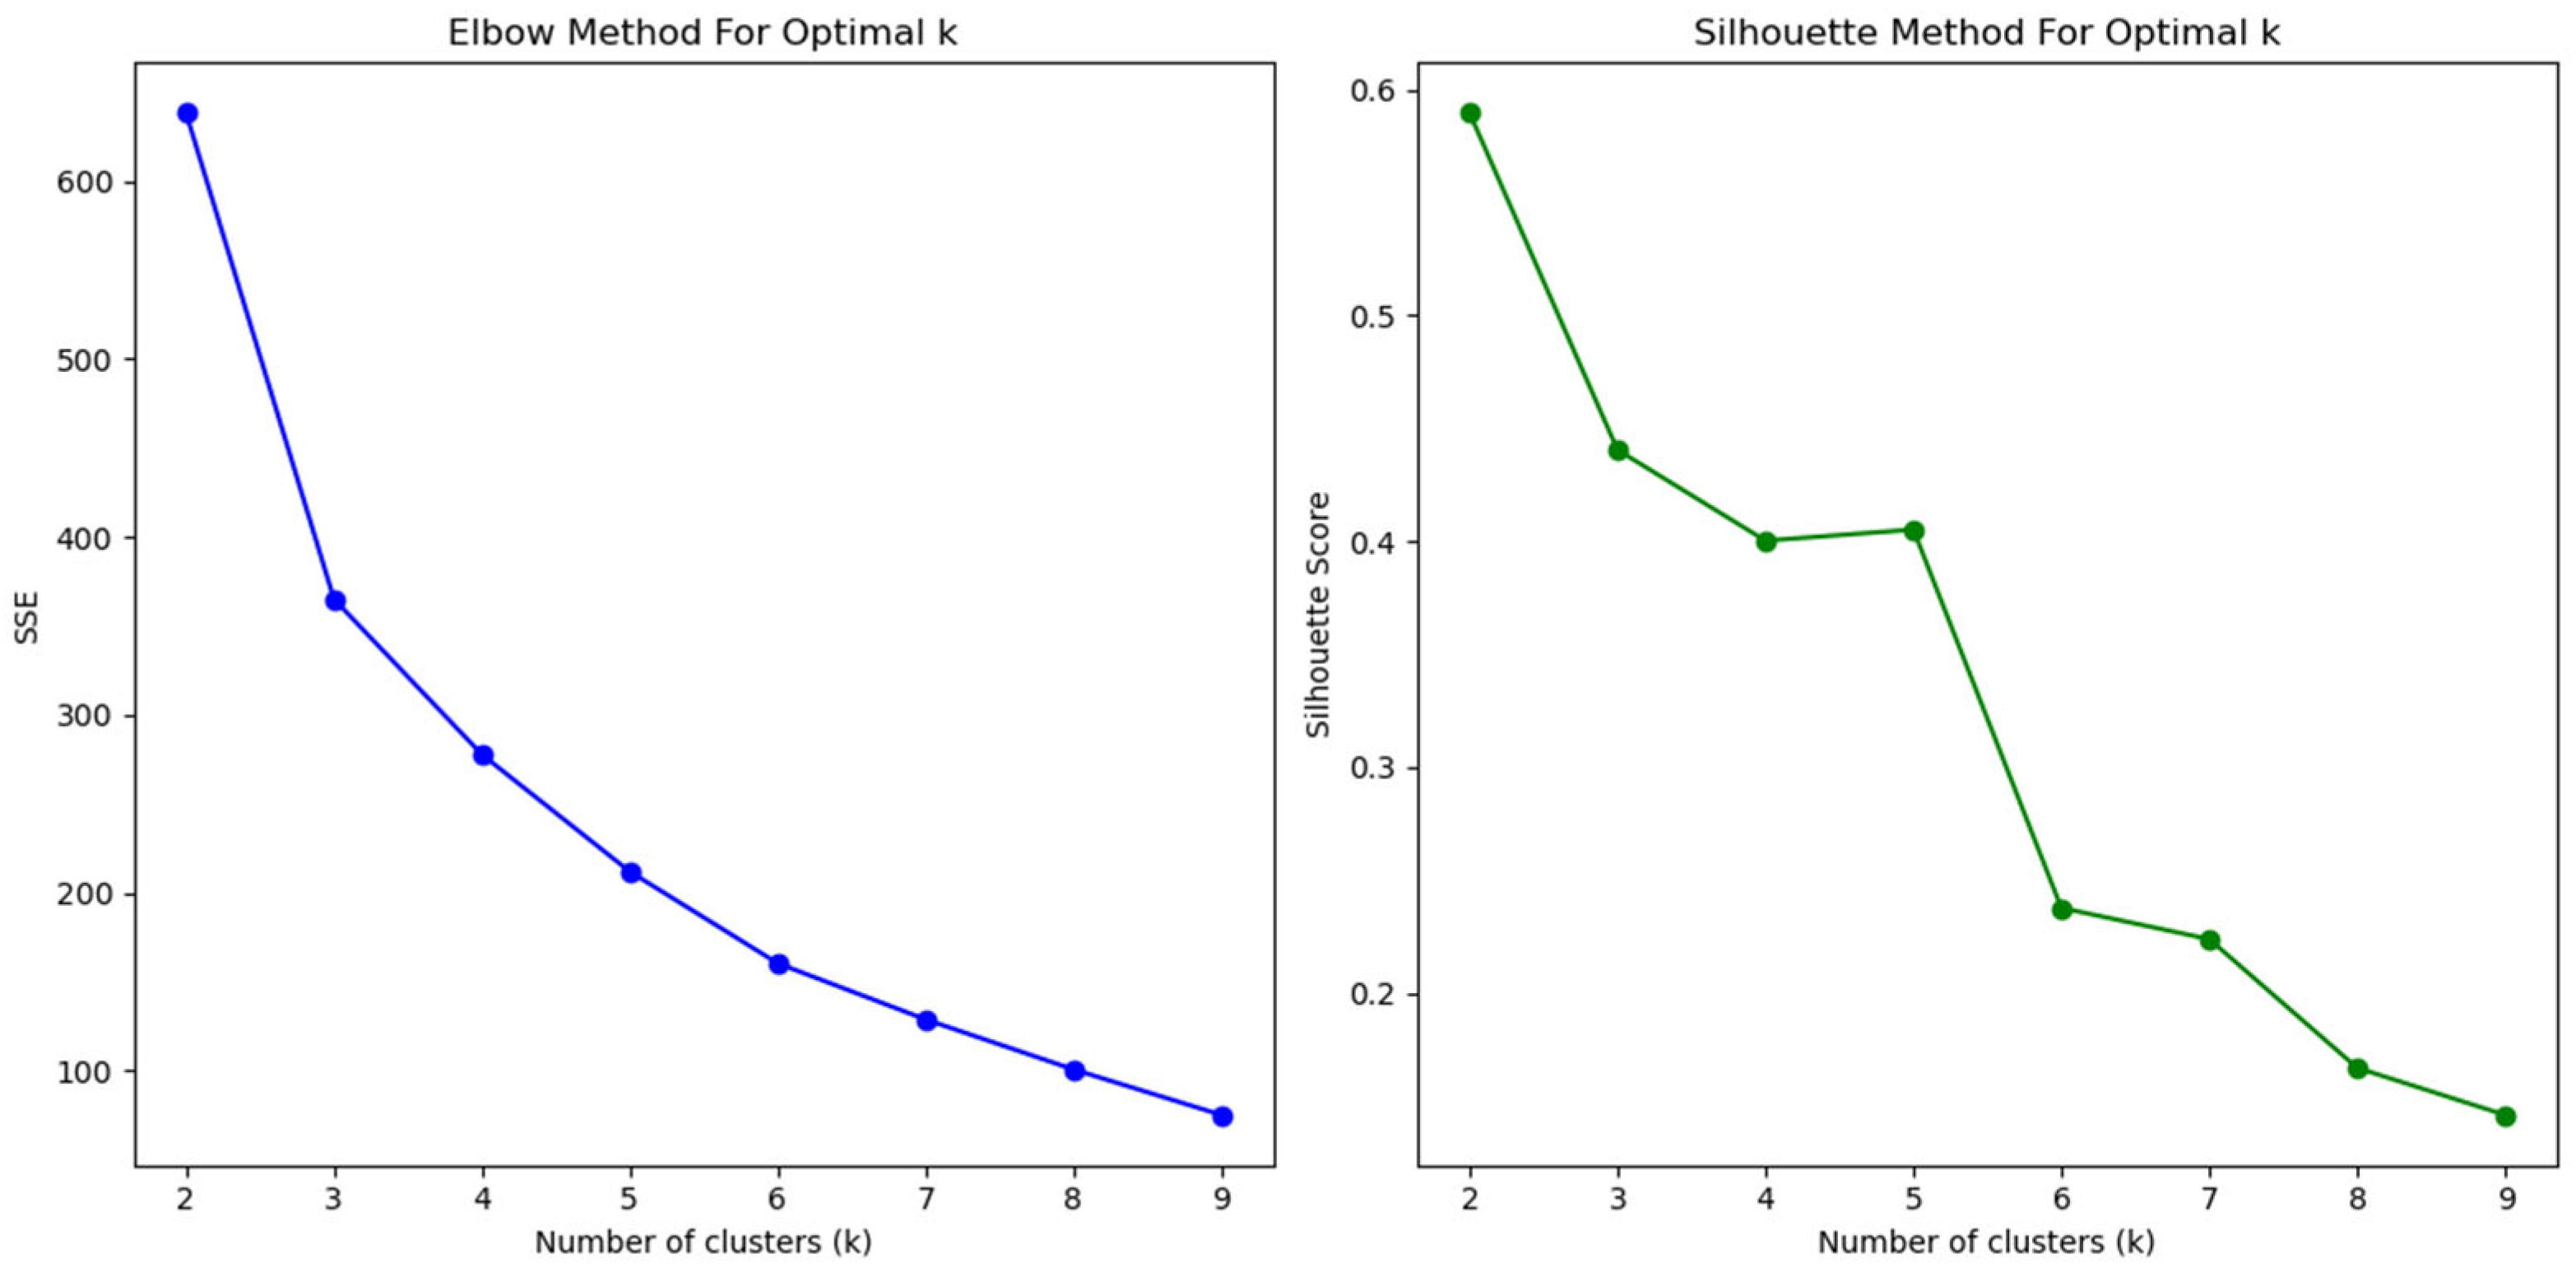
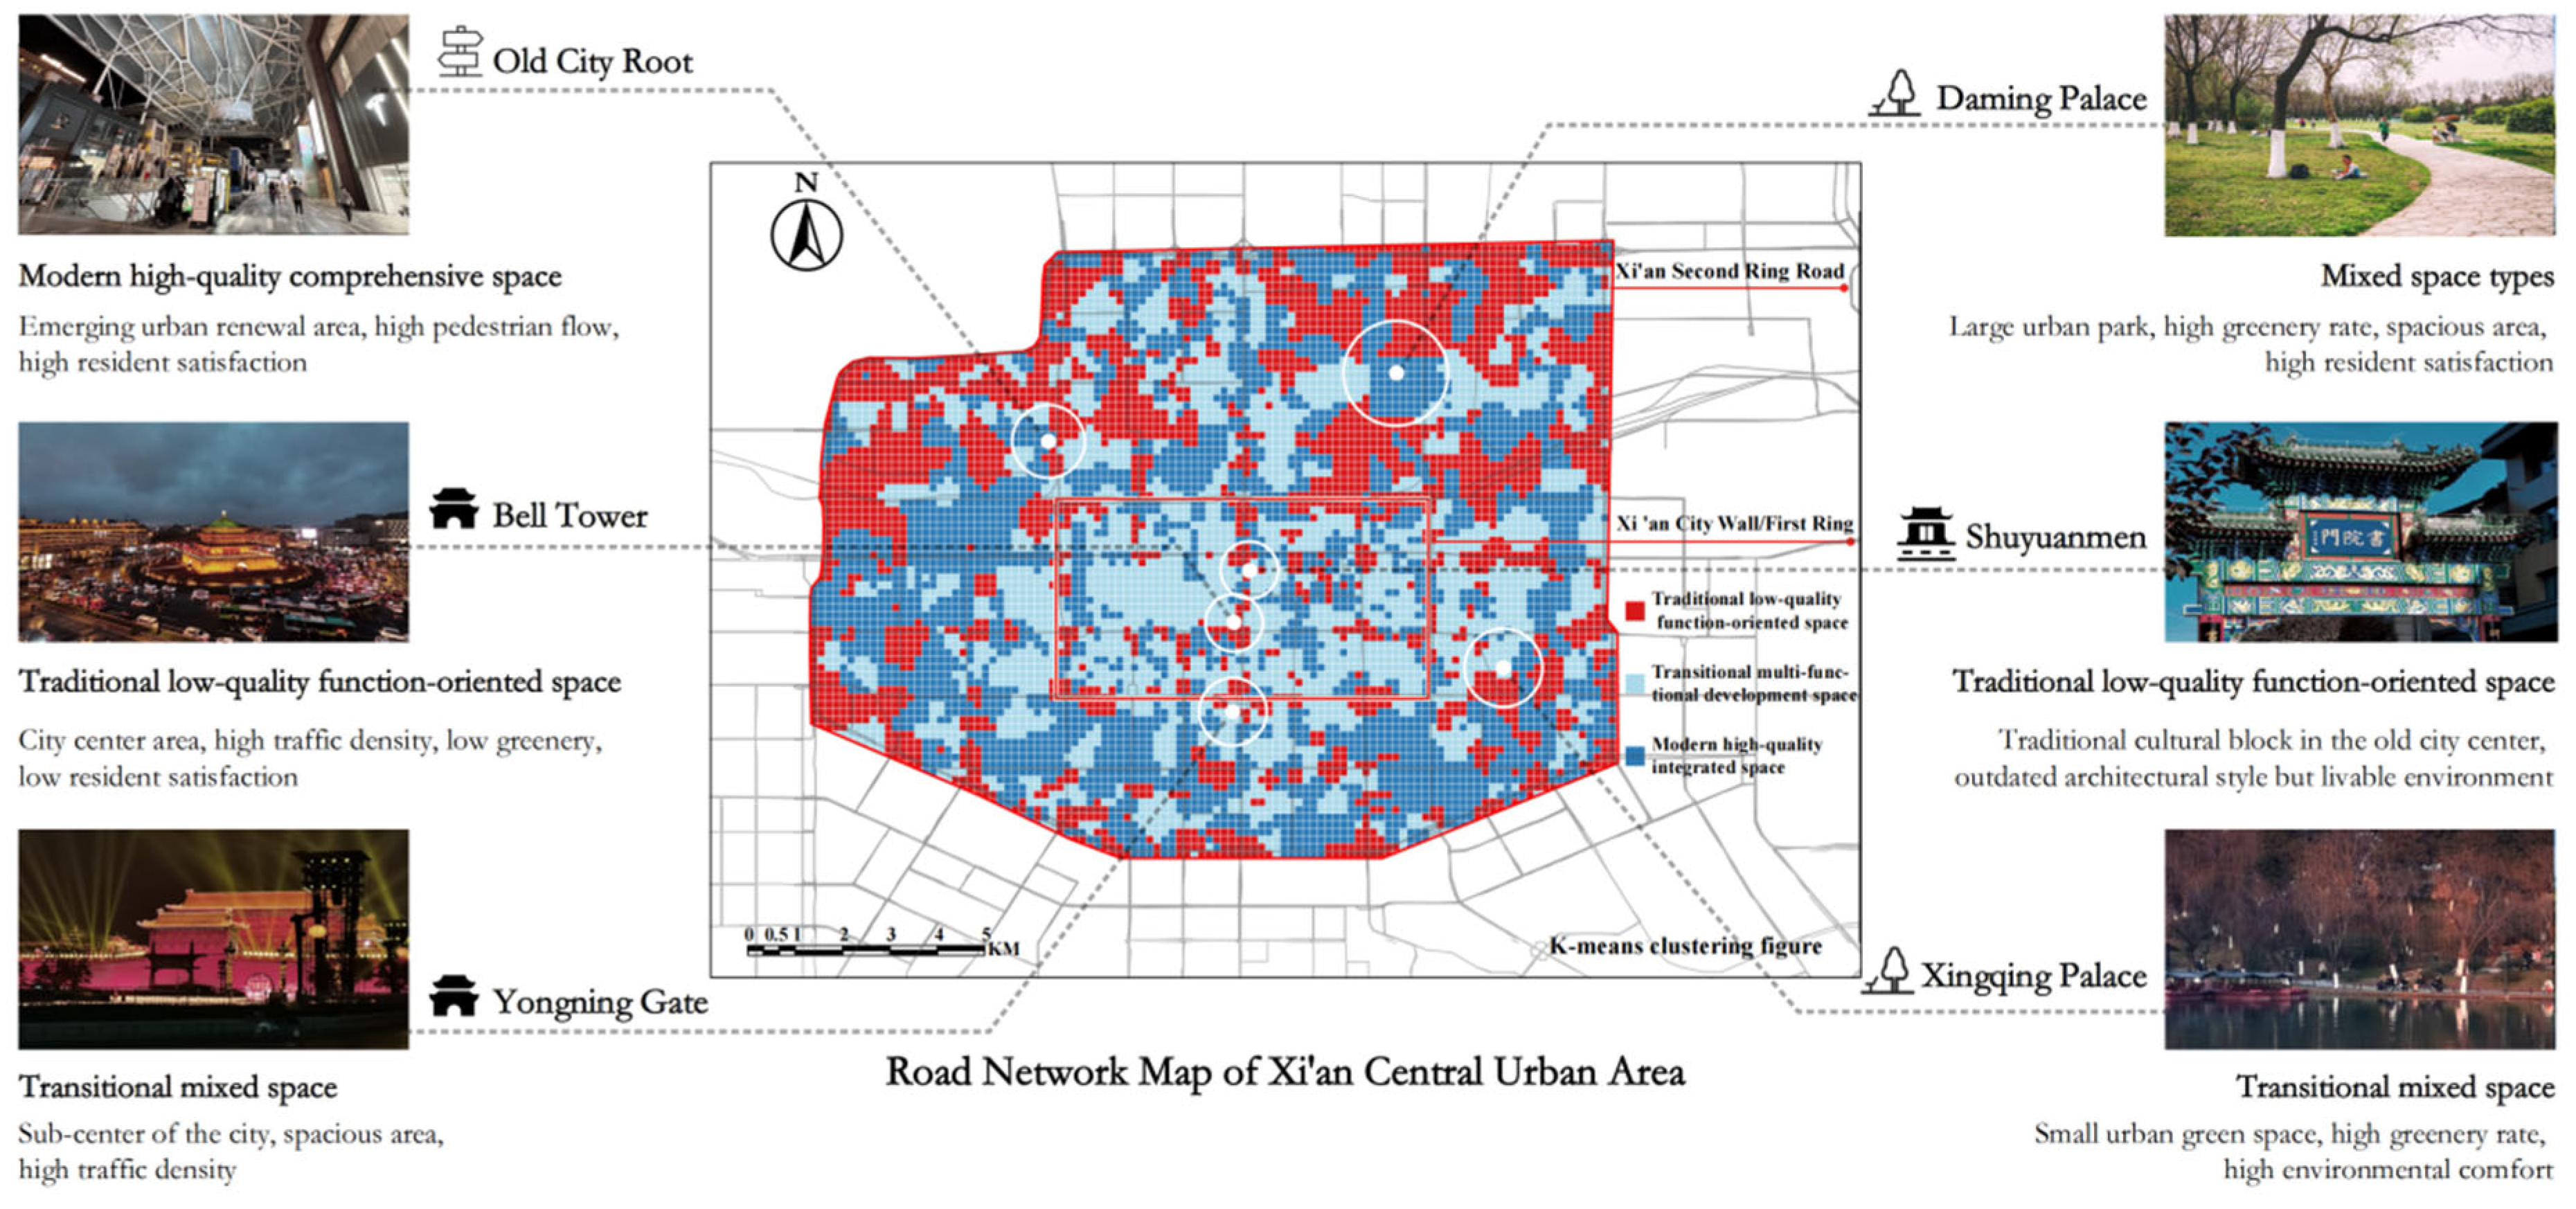
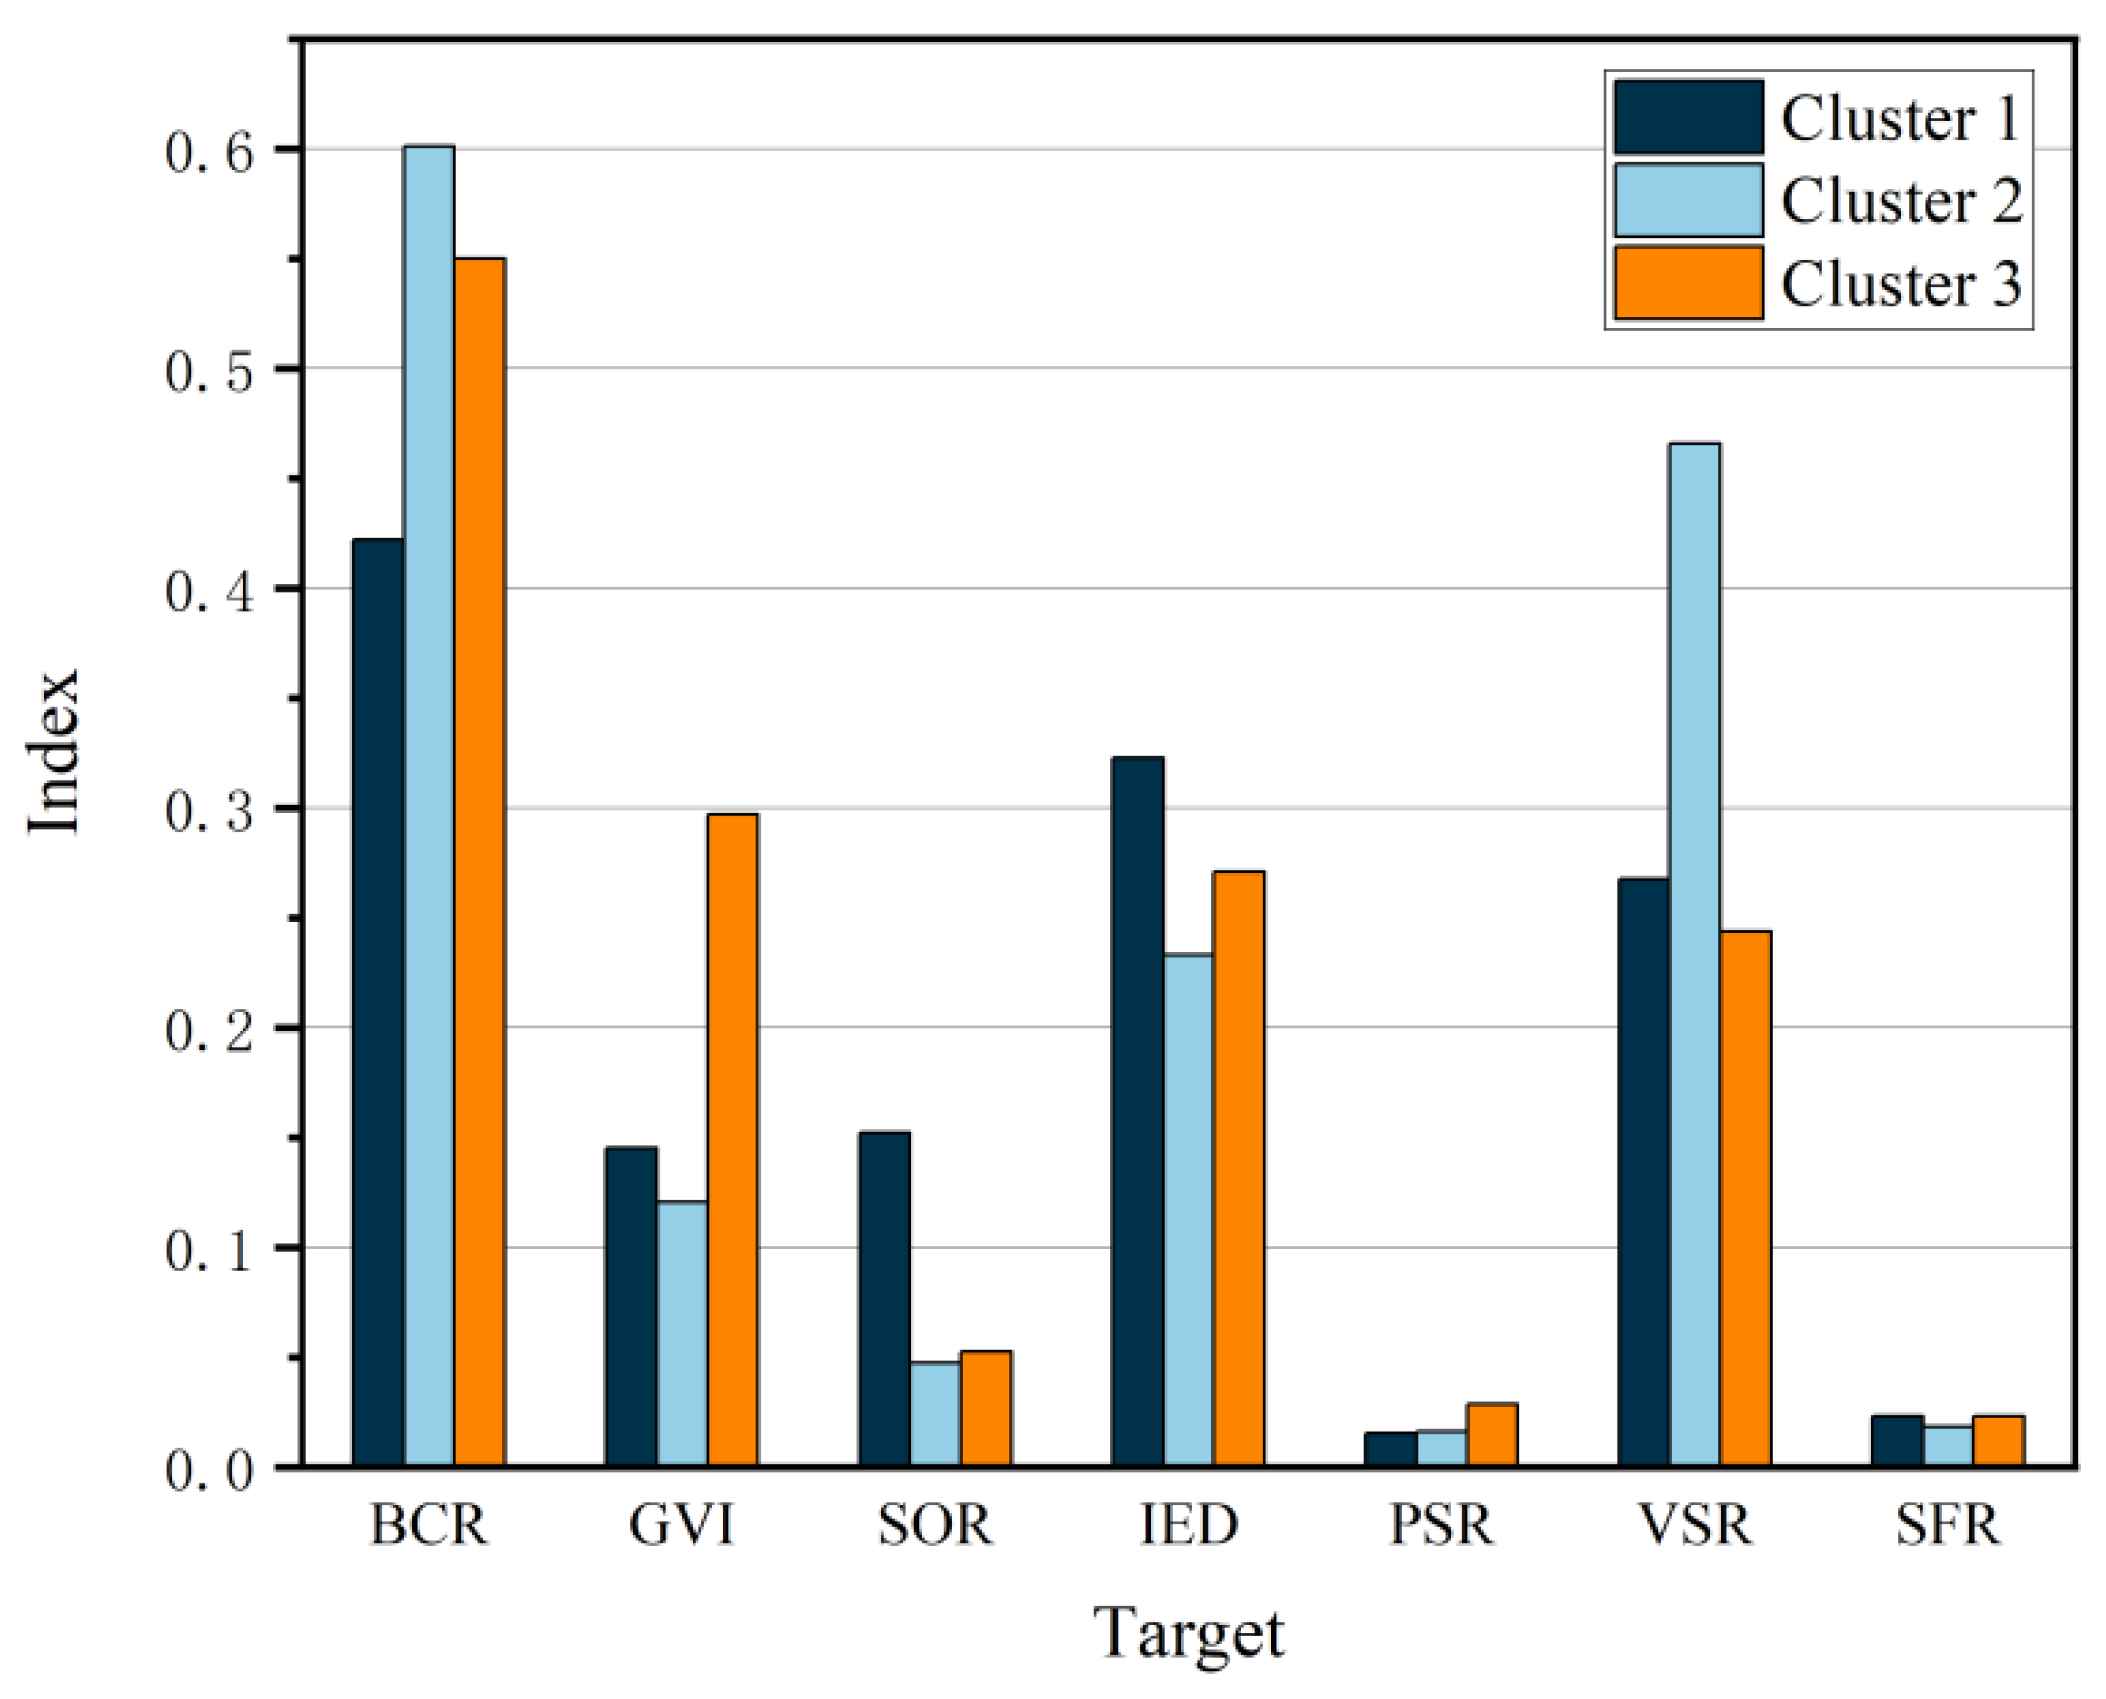
4.4. K-Means Clustering for Type Identification and Spatial Distribution
5. Discussion
5.1. Spatial Drivers of Perception
5.2. Robustness, Typologies, and Policy Scenarios
5.3. Design and Equity Implications
6. Conclusions
Author Contributions
Funding
Data Availability Statement
Conflicts of Interest
References
- Xu, G.; Zhou, Z.; Jiao, L.; Zhao, R. Compact Urban Form and Expansion Pattern Slow Down the Decline in Urban Densities: A Global Perspective. Land Use Policy 2020, 94, 104563. [Google Scholar] [CrossRef]
- Dong, H.; Fujita, T.; Geng, Y.; Dong, L.; Ohnishi, S.; Sun, L.; Dou, Y.; Fujii, M. A Review on Eco-City Evaluation Methods and Highlights for Integration. Ecol. Indic. 2016, 60, 1184–1191. [Google Scholar] [CrossRef]
- Jian, I.Y.; Luo, J.; Chan, E.H.W. Spatial Justice in Public Open Space Planning: Accessibility and Inclusivity. Habitat Int. 2020, 97, 102122. [Google Scholar] [CrossRef]
- Gifford, R. Environmental Psychology Matters. Annu. Rev. Psychol. 2014, 65, 541–579. [Google Scholar] [CrossRef] [PubMed]
- Biljecki, F.; Ito, K. Street View Imagery in Urban Analytics and GIS: A Review. Landsc. Urban Plan. 2021, 215, 104217. [Google Scholar] [CrossRef]
- Zhang, J.; Yu, Z.; Li, Y.; Wang, X. Uncovering Bias in Objective Mapping and Subjective Perception of Urban Building Functionality: A Machine Learning Approach to Urban Spatial Perception. Land 2023, 12, 1322. [Google Scholar] [CrossRef]
- Li, X.; Lv, Z.; Zheng, Z.; Zhong, C.; Hijazi, I.H.; Cheng, S. Assessment of Lively Street Network Based on Geographic Information System and Space Syntax. Multimed. Tools Appl. 2017, 76, 17801–17819. [Google Scholar] [CrossRef]
- Kabisch, N.; Haase, D. Green Spaces of European Cities Revisited for 1990–2006. Landsc. Urban Plan. 2013, 110, 113–122. [Google Scholar] [CrossRef]
- Ren, J.; Wang, Y.; Liu, Q.; Liu, Y. Numerical Study of Three Ventilation Strategies in a prefabricated COVID-19 inpatient ward. Build. Environ. 2021, 188, 107467. [Google Scholar] [CrossRef]
- Lowe, D.G. Distinctive Image Features from Scale-Invariant Keypoints. Int. J. Comput. Vis. 2004, 60, 91–110. [Google Scholar] [CrossRef]
- Chen, L.-C.; Papandreou, G.; Kokkinos, I.; Murphy, K.; Yuille, A.L. DeepLab: Semantic Image Segmentation with Deep Convolutional Nets, Atrous Convolution, and Fully Connected CRFs. IEEE Trans. Pattern Anal. Mach. Intell. 2018, 40, 834–848. [Google Scholar] [CrossRef]
- Zhao, H.; Shi, J.; Qi, X.; Wang, X.; Jia, J. Pyramid Scene Parsing Network. In Proceedings of the 2017 IEEE Conference on Computer Vision and Pattern Recognition (CVPR), Honolulu, HI, USA, 21–26 July 2017; pp. 6230–6239. [Google Scholar]
- Sun, H.; Xu, H.; He, H.; Wei, Q.; Yan, Y.; Chen, Z.; Li, X.; Zheng, J.; Li, T. A Spatial Analysis of Urban Streets under Deep Learning Based on Street View Imagery: Quantifying Perceptual and Elemental Perceptual Relationships. Sustainability 2023, 15, 14798. [Google Scholar] [CrossRef]
- Wang, F.; Gu, N. Exploring the Spatio-Temporal Characteristics and Driving Factors of Urban Expansion in Xi’an during 1930–2014. Int. J. Urban Sci. 2023, 27, 39–64. [Google Scholar] [CrossRef]
- Gibson, J.J. The Ecological Approach to Visual Perception; Houghton Mifflin: Boston, MA, USA, 1979. [Google Scholar]
- Kaplan, S. The Restorative Benefits of Nature: Toward an Integrative Framework. J. Environ. Psychol. 1995, 15, 169–182. [Google Scholar] [CrossRef]
- Hartig, T.; Mang, M.; Evans, G.W. Restorative Effects of Natural Environment Experiences. Environ. Behav. 1991, 23, 3–26. [Google Scholar] [CrossRef]
- Tuan, Y.-F. Space and Place: The Perspective of Experience; University of Minnesota Press: Minneapolis, MI, USA, 1977. [Google Scholar]
- Li, J.; Koohsari, M.J.; Zhao, J.; Kaczynski, A.T.; McCormack, G.R.; Oka, K.; Nakaya, T.; Tanimoto, R.; Watanabe, R.; Hanibuchi, T. The Impact of Objective Urban Features on Perception of Neighbourhood Environments. Sci. Rep. 2025, 15, 30322. [Google Scholar] [CrossRef] [PubMed]
- Naik, N.; Kominers, S.D.; Raskar, R.; Glaeser, E.L.; Hidalgo, C.A. Computer Vision Uncovers Predictors of Physical Urban Change. Proc. Natl. Acad. Sci. USA 2017, 114, 7571–7576. [Google Scholar] [CrossRef] [PubMed]
- Li, X.; Zhang, C.; Li, W.; Kuzovkina, Y.A.; Weiner, D. Who Lives in Greener Neighborhoods? The Distribution of Street Greenery and Its Association with Residents’ Socioeconomic Conditions in Hartford, Connecticut, USA. Urban For. Urban Green. 2015, 14, 751–759. [Google Scholar] [CrossRef]
- Jain, A.K. Data Clustering: 50 Years beyond K-Means. Pattern Recognit. Lett. 2010, 31, 651–666. [Google Scholar] [CrossRef]
- Seiferling, I.; Naik, N.; Ratti, C.; Proulx, R. Green Streets—Quantifying and Mapping Urban Trees with Street-Level Imagery and Computer Vision. Landsc. Urban Plan. 2017, 165, 93–101. [Google Scholar] [CrossRef]
- Ryo, M.; Rillig, M.C. Statistically Reinforced Machine Learning for Nonlinear Patterns and Variable Interactions. Ecosphere 2017, 8, e01976. [Google Scholar] [CrossRef]
- Huo, K.; Qin, R.; Zhao, J.; Ma, X. Long-term Tracking of Urban Structure and Analysis of Its Impact on Urban Heat Stress: A Case Study of Xi’an, China. Ecol. Indic. 2025, 174, 113418. [Google Scholar] [CrossRef]
- Lundberg, S.M.; Lee, S.-I. A Unified Approach to Interpreting Model Predictions. In Proceedings of the Advances in Neural Information Processing Systems, Long Beach, CA, USA, 4–9 December 2017; Curran Associates, Inc.: Red Hook, NY, USA, 2017; Volume 30. [Google Scholar]
- Muller, E.; Gemmell, E.; Choudhury, I.; Nathvani, R.; Metzler, A.B.; Bennett, J.; Denton, E.; Flaxman, S.; Ezzati, M. City-Wide Perceptions of Neighbourhood Quality Using Street View Images. arXiv 2022, arXiv:2211.12139. [Google Scholar] [CrossRef]
- Yu, Y.; Yu, Z.; Shi, X.; Wan, R.; Wang, B.; Zhang, J. Towards Transparent Urban Perception: A Concept-Driven Framework with Visual Foundation Models. ISPRS Int. J. Geo-Inf. 2025, 14, 315. [Google Scholar] [CrossRef]
- Wang, L.; Han, X.; He, J.; Jung, T. Measuring Residents’ Perceptions of City Streets to Inform Better Street Planning through Deep Learning and Space Syntax. ISPRS J. Photogramm. Remote Sens. 2022, 190, 215–230. [Google Scholar] [CrossRef]
- Zeng, Q.; Gong, Z.; Wu, S.; Zhuang, C.; Li, S. Measuring Cyclists’ Subjective Perceptions of the Street Riding Environment Using K-Means SMOTE-RF Model and Street View Imagery. Int. J. Appl. Earth Obs. Geoinf. 2024, 128, 103739. [Google Scholar] [CrossRef]
- Yin, H.; Xiao, R.; Fei, X.; Zhang, Z.; Gao, Z.; Wan, Y.; Tan, W.; Jiang, X.; Cao, W.; Guo, Y. Analyzing “Economy-Society-Environment” Sustainability from the Perspective of Urban Spatial Structure: A Case Study of the Yangtze River Delta Urban Agglomeration. Sustain. Cities Soc. 2023, 96, 104691. [Google Scholar] [CrossRef]
- Angelo, H. Added Value? Denaturalizing the “Good” of Urban Greening. Geogr. Compass 2019, 13, e12459. [Google Scholar] [CrossRef]
- Ma, Z. Deep Exploration of Street View Features for Identifying Urban Vitality: A Case Study of Qingdao City. Int. J. Appl. Earth Obs. Geoinf. 2023, 123, 103476. [Google Scholar] [CrossRef]
- Mushkani, R.; Berard, H.; Ammar, T.; Koseki, S. Public Perceptions of Montréal’s Streets: Implications for Inclusive Public Space Making and Management. J. Urban Manag. 2025; in press. [Google Scholar] [CrossRef]
- Schneider, A.; Chang, C.; Paulsen, K. The Changing Spatial Form of Cities in Western China. Landsc. Urban Plan. 2015, 135, 40–61. [Google Scholar] [CrossRef]
- Sánchez, I.A.V.; Labib, S.M. Accessing Eye-Level Greenness Visibility from Open-Source Street View Images: A Methodological Development and Implementation in Multi-City and Multi-Country Contexts. Sustain. Cities Soc. 2024, 103, 105262. [Google Scholar] [CrossRef]
- Teeuwen, R.; Milias, V.; Bozzon, A.; Psyllidis, A. How Well Do NDVI and OpenStreetMap Data Capture People’s Visual Perceptions of Urban Greenspace? Landsc. Urban Plan. 2024, 245, 105009. [Google Scholar] [CrossRef]
- Chen, L.-C.; Zhu, Y.; Papandreou, G.; Schroff, F.; Adam, H. Encoder-Decoder with Atrous Separable Convolution for Semantic Image Segmentation. In Proceedings of the Computer Vision—ECCV, Munich, Germany, 8–14 September 2018; Springer: Cham, Switzerland, 2018; pp. 833–851. [Google Scholar]
- Zhang, F.; Zhou, B.; Liu, L.; Liu, Y.; Fung, H.H.; Lin, H.; Ratti, C. Measuring human perceptions of a large-scale urban region using machine learning. Landsc. Urban Plan. 2018, 180, 148–160. [Google Scholar] [CrossRef]
- Yao, Y.; Liang, Z.; Yuan, Z.; Liu, P.; Bie, Y.; Zhang, J.; Wang, R.; Wang, J.; Guan, Q. A Human-Machine Adversarial Scoring Framework for Urban Perception Assessment Using Street-View Images. Int. J. Geogr. Inf. Sci. 2019, 33, 2363–2384. [Google Scholar] [CrossRef]
- Ma, X.; Ma, C.; Wu, C.; Xi, Y.; Yang, R.; Peng, N.; Zhang, C.; Ren, F. Measuring Human Perceptions of Streetscapes to Better Inform Urban Renewal: A Perspective of Scene Semantic Parsing. Cities 2021, 110, 103086. [Google Scholar] [CrossRef]
- Lei, Y.; Xu, Y.; Liu, X.; Long, Y. Measuring Street Quality from a Human Perspective Using Street View Images, Deep Learning and Space Syntax: Evidence from Shanghai and Chengdu, China. Buildings 2024, 14, 1847. [Google Scholar] [CrossRef]
- Long, Y.; Jiao, S.; Yu, Y.; Xiao, K. An Analysis of Spatial Vitality Distribution and Formation Mechanisms in Historical Urban Areas Based on Multi-Source Big Data: A Case Study of Changsha. Front. Archit. Res. 2025; in press. [Google Scholar] [CrossRef]
- Xi, Y.; Hou, Q.; Duan, Y.; Lei, K.; Wu, Y.; Cheng, Q. Exploring the Spatiotemporal Effects of the Built Environment on the Nonlinear Impacts of Metro Ridership: Evidence from Xi’an, China. ISPRS Int. J. Geo-Inf. 2024, 13, 105. [Google Scholar] [CrossRef]
- Li, Z. Extracting Spatial Effects from Machine Learning Model Using Local Interpretation Method: An Example of SHAP and XGBoost. Comput. Environ. Urban Syst. 2022, 96, 101845. [Google Scholar] [CrossRef]
- Liu, K.; Zhou, D.; Qi, Y.; Zhang, M.; Ren, Y.; Wei, Y.; Wang, J. Exploring the Complex Effects and Their Spatial Associations of the Built Environment on the Vitality of Community Life Circles Using an eXtreme Gradient Boosting–SHapley Additive exPlanations Approach: A Case Study of Xi’an. Buildings 2025, 15, 1372. [Google Scholar] [CrossRef]
- Getis–Ord Statistics, Wikipedia. 2024. Available online: https://en.wikipedia.org/w/index.php?title=Getis%E2%80%93Ord_statistics&oldid=1222989590 (accessed on 27 April 2025).
- Liu, L.; Tu, Y.; Sun, M.; Lyu, H.; Wang, P.; He, J. Spatial Quality Measurement and Characterization of Daily High-Frequency Pedestrian Streets in Xi’an City. Land 2024, 13, 885. [Google Scholar] [CrossRef]
- Zhong, T.; Ye, C.; Wang, Z.; Tang, G.; Zhang, W.; Ye, Y. City-Scale Mapping of Urban Façade Color Using Street-View Imagery. Remote Sens. 2021, 13, 1591. [Google Scholar] [CrossRef]
- Zhang, Z.; Zhang, M.; Song, X.; Li, Z. Image-Based Machine Learning and Cluster Analysis for Urban Road Network: Employing Orange for Codeless Visual Programming. Geo-Spat. Inf. Sci. 2025, 28, 1298–1315. [Google Scholar] [CrossRef]
- Ruan, Y.; Zhang, X.; Wang, J.; Liu, N. Understanding the Role of Urban Block Morphology in Innovation Vitality through Explainable Machine Learning. Sci. Rep. 2025, 15, 21337. [Google Scholar] [CrossRef]





| Region/Type | Example References | Key Themes | Relevance to This Study | Morphological/Cultural Differences Discussion |
|---|---|---|---|---|
| Asia/China (Focal Region) | [14] Wang & Gu (2023); [25] Huo et al. (2025); | Spatiotemporal expansion of Xi’an; Thermal environment; | Core case study and ontological research. Provides local empirical evidence, methodological reference, and a direct baseline for comparison. | High-density historical core vs. modern ecological new districts. Discusses the unique challenge of balancing heritage preservation, high-density development, and ecological needs within limited space, reflecting typical contradictions in Asian high-density cities. |
| Europe (Medium Coverage) | [5] Biljecki & Ito (2021); [8] Kabisch & Haase (2013); [23] Seiferling et al. (2017) | Street view imagery in GIS review; 3D city models; Green space evolution; Street greenery quantification | Provides theoretical frameworks, indicator origins (GVI), and methodological reflection (e.g., model Level of Detail). | Macro green space planning tradition vs. micro streetscape perception. European research often stems from a long Green City tradition; metrics like SVF and GVI provide standard references, but their urban forms are generally lower-density, highlighting the particularity of Xi’an’s high-density context. |
| North America/Global (High Coverage) | [20] Naik et al. (2017)—Place Pulse; [26] Lundberg & Lee (2017)—SHAP; [4] Gifford (2014)—EBS; [16] Kaplan (1995)—ART; [21] Li et al. (2015)—Hartford; [34] Mushkani et al. (2025)—Montréal | Global crowdsourced perception datasets; Explainable AI frameworks; Environmental psychology and restorative environment theory; Environmental justice; Socio-demographic heterogeneity in perception | Provides foundational theories (EBS, ART), core data sources (Place Pulse), key tools (SHAP), and international case comparisons (social equity, group differences). | Perceptual universals and variations across cultural diversity. North American research reveals universal patterns and profound socioeconomic disparities. Highlights that findings require bias correction for cross-cultural application, not direct transfer. |
| Classic Theory and Others (Foundational Support) | [15] Gibson (1979)—Affordance; [18] Tuan (1977)—Sense of Place; [19] Li et al. (2025)—Japan Study; [28] Yu et al. (2025)—Transparent VFM | Affordance Theory; Sense of Place; Destination diversity in Japanese cities; Transparent urban perception frameworks | Provides meta-theoretical support, neighboring Asian case studies, and methodological frontier comparison. | Theoretical universality and cultural specificity. Classic theories provide globally applicable analytical lenses. Japanese research, as a cultural neighbor, may show different key factors compared to the West, providing a bridge for understanding cultural specificity. Latest research pushes the field towards interpretability. |
| Objective Index | Objective Indicator | Associated Perception | Mathematical Formula | Interpretation |
|---|---|---|---|---|
| Morphological parameter | Building Coverage Ratio (BCR) | Beautiful, Comfortable | High density may feel oppressive; moderate improves convenience | |
| Sky Openness Ratio (SOR) | Beautiful, Comfortable | Enhances visibility, openness, and spatial comfort | ||
| Interface Enclosure Degree (IED) | Safe, Convenient | Strengthens safety and spatial continuity | ||
| Environmental parameter | Green View Index (GVI) | Beautiful, Comfortable, affective | Enhances aesthetics and emotional identity | |
| Safety Facility Ratio (SFR) | Safe, Convenient | Improves security and spatial comfort | ||
| Functional parameter | Pedestrian Space Ratio (PSR) | Convenient, Accessible | Supports walkability and pedestrian comfort | |
| Vehicle Space Ratio (VSR) | Convenient, Accessible, Place identity | Enhances connectivity and urban spatial legibility |
| Feature | Beautiful | Boring | Depressing | Livelier | Safer | Wealthier | Average |
|---|---|---|---|---|---|---|---|
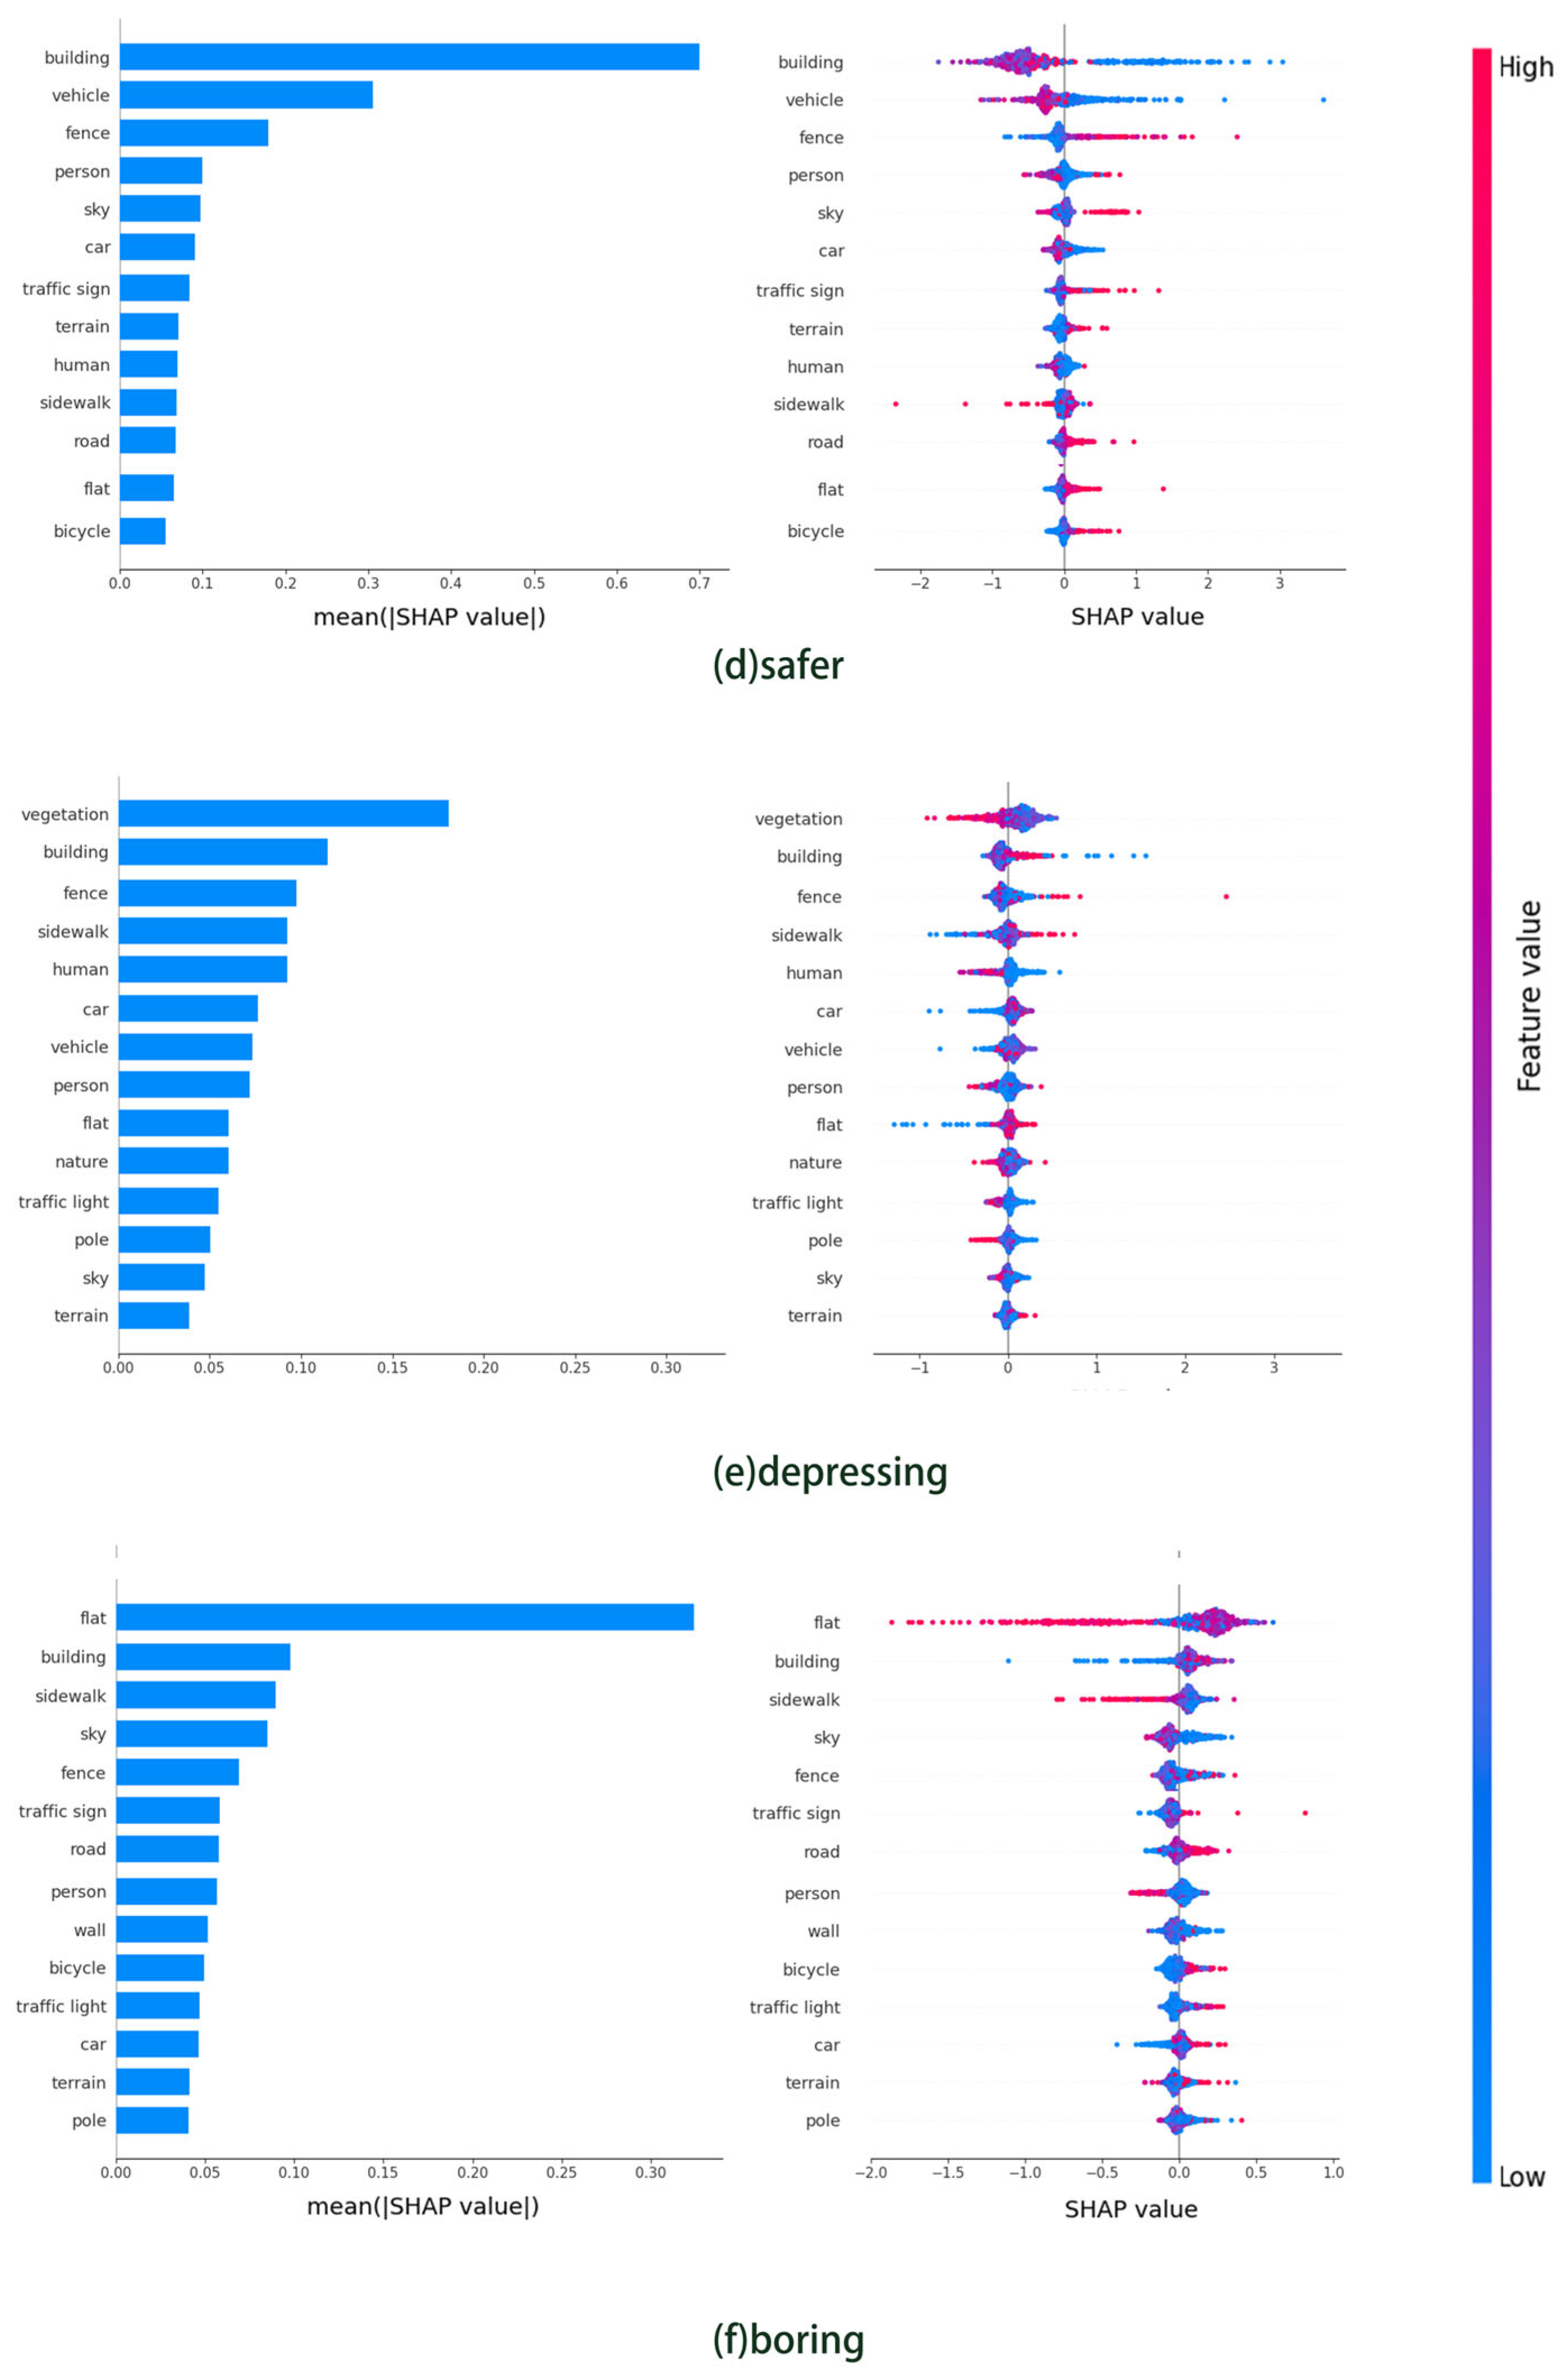
| building | 0.0955 | 0.0723 | 0.0680 | 0.0715 | 0.1120 | 0.0733 | 0.082 |
| sidewalk | 0.0440 | 0.0523 | 0.0549 | 0.0568 | 0.0635 | 0.0631 | 0.056 |
| vehicle | 0.0437 | 0.0452 | 0.0459 | 0.0472 | 0.0589 | 0.0550 | 0.049 |
| car | 0.0427 | 0.0407 | 0.0389 | 0.0427 | 0.0407 | 0.0520 | 0.043 |
| pole | 0.0387 | 0.0389 | 0.0388 | 0.0405 | 0.0333 | 0.0411 | 0.039 |
| person | 0.0374 | 0.0374 | 0.0386 | 0.0393 | 0.0320 | 0.0386 | 0.037 |
| wall | 0.0370 | 0.0370 | 0.0385 | 0.0368 | 0.0311 | 0.0360 | 0.036 |
| flat | 0.0362 | 0.0368 | 0.0367 | 0.0338 | 0.0310 | 0.0351 | 0.035 |
| traffic light | 0.0360 | 0.0367 | 0.0362 | 0.0325 | 0.0310 | 0.0303 | 0.034 |
| sky | 0.0355 | 0.0366 | 0.0341 | 0.0324 | 0.0308 | 0.0299 | 0.033 |
| fence | 0.0335 | 0.0346 | 0.0321 | 0.0314 | 0.0280 | 0.0289 | 0.031 |
| traffic sign | 0.0313 | 0.0335 | 0.0318 | 0.0310 | 0.0274 | 0.0285 | 0.031 |
| terrain | 0.0297 | 0.0304 | 0.0309 | 0.0290 | 0.0257 | 0.0270 | 0.028 |
| bicycle | 0.0283 | 0.0281 | 0.0288 | 0.0284 | 0.0256 | 0.0266 | 0.028 |
| train | 0.0280 | 0.0273 | 0.0288 | 0.0278 | 0.0251 | 0.0258 | 0.027 |
| human | 0.0259 | 0.0240 | 0.0274 | 0.0271 | 0.0245 | 0.0255 | 0.026 |
| rider | 0.0227 | 0.0238 | 0.0270 | 0.0261 | 0.0240 | 0.0247 | 0.025 |
| vegetation | 0.0222 | 0.0235 | 0.0245 | 0.0260 | 0.0220 | 0.0211 | 0.023 |
| road | 0.0185 | 0.0227 | 0.0225 | 0.0235 | 0.0207 | 0.0196 | 0.021 |
| bus | 0.0177 | 0.0220 | 0.0223 | 0.0193 | 0.0197 | 0.0180 | 0.020 |
| motorcycle | 0.0171 | 0.0205 | 0.0215 | 0.0164 | 0.0152 | 0.0155 | 0.018 |
| nature | 0.0168 | 0.0155 | 0.0139 | 0.0149 | 0.0132 | 0.0111 | 0.014 |
| truck | 0.0118 | 0.0116 | 0.0129 | 0.0109 | 0.0089 | 0.0110 | 0.011 |
| Target | BCR | IED | SFR | PSR | GVI | SOR | VSR |
|---|---|---|---|---|---|---|---|
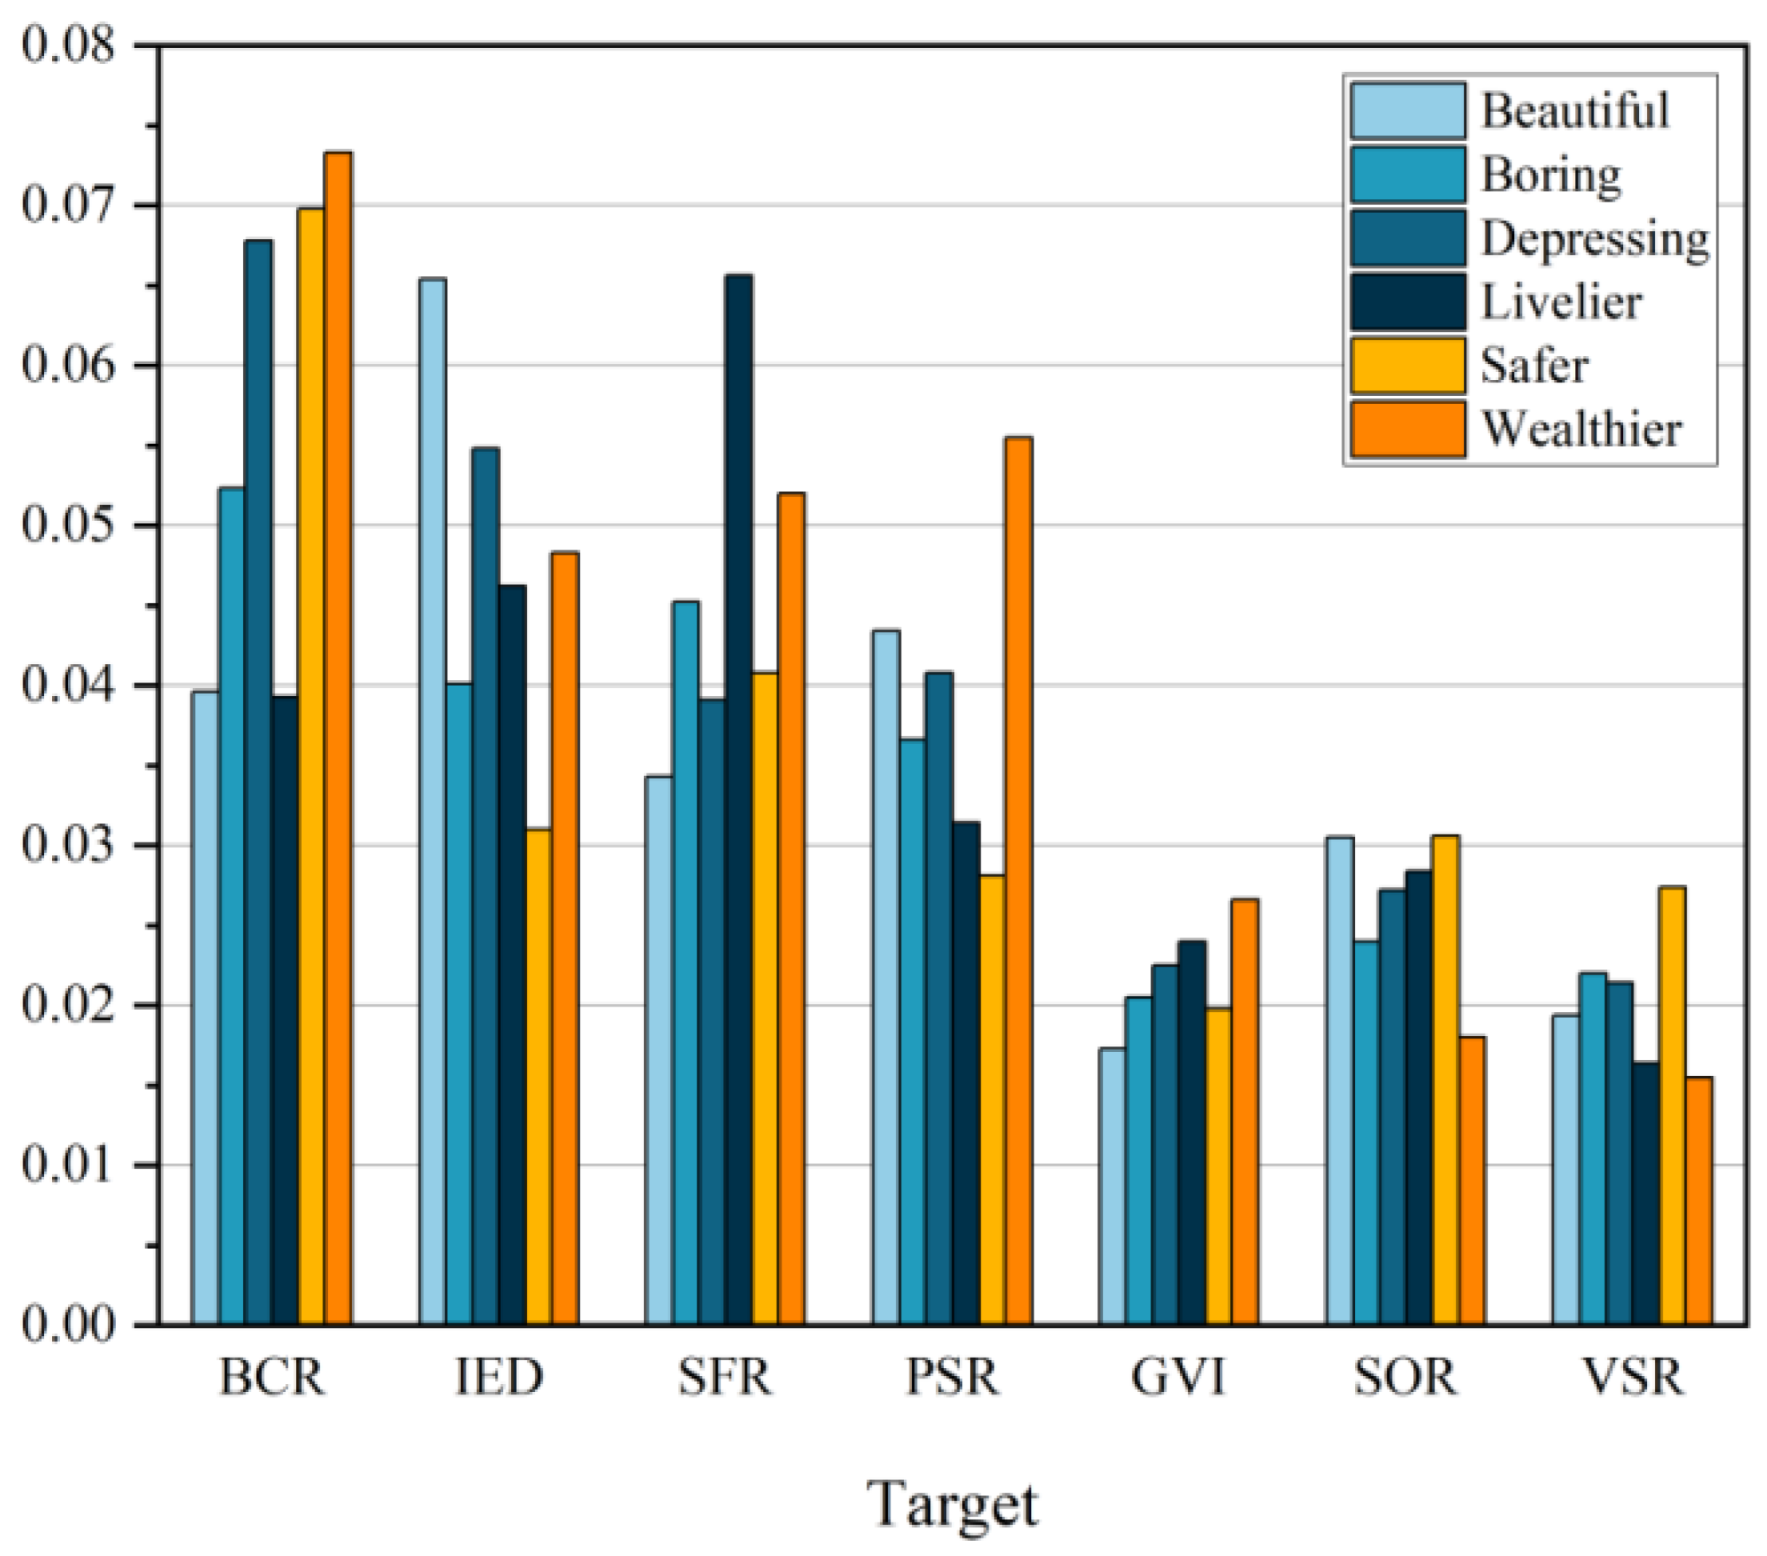
| beautiful | −0.0009 | −0.0193 | −0.0038 | 0.0026 | −0.0055 | −0.0152 | −0.0007 |
| boring | 0.0142 | 0.0147 | −0.0001 | −0.0140 | −0.0004 | −0.0076 | −0.0085 |
| depressing | −0.0121 | 0.0162 | −0.0026 | 0.0066 | −0.0233 | 0.0037 | 0.0083 |
| livelier | 0.0163 | 0.0125 | 0.0149 | 0.0047 | 0.0042 | 0.0101 | 0.0084 |
| safer | −0.0182 | 0.0012 | 0.0044 | 0.0112 | 0.0235 | 0.0367 | −0.0118 |
| wealthier | 0.0227 | −0.0228 | −0.0049 | 0.0102 | −0.0085 | −0.0015 | −0.0260 |
| Target | MAE | MSE |
|---|---|---|
| beautiful | 1.577171985581062 | 4.608631015381684 |
| boring | 1.7231578518686848 | 5.6779611167127255 |
| depressing | 1.9649958693466718 | 6.511114209166368 |
| livelier | 1.8208642307392076 | 7.483464521643784 |
| safer | 2.0946684365119177 | 8.637644445137152 |
| wealthier | 2.0070083518613786 | 7.343163736267139 |
Disclaimer/Publisher’s Note: The statements, opinions and data contained in all publications are solely those of the individual author(s) and contributor(s) and not of MDPI and/or the editor(s). MDPI and/or the editor(s) disclaim responsibility for any injury to people or property resulting from any ideas, methods, instructions or products referred to in the content. |
© 2025 by the authors. Licensee MDPI, Basel, Switzerland. This article is an open access article distributed under the terms and conditions of the Creative Commons Attribution (CC BY) license (https://creativecommons.org/licenses/by/4.0/).
Share and Cite
Li, Y.; Lu, J.; Meng, Y.; Luo, Y.; Ren, J. Exploring Urban Spatial Quality Through Street View Imagery and Human Perception Analysis. Buildings 2025, 15, 3116. https://doi.org/10.3390/buildings15173116
Li Y, Lu J, Meng Y, Luo Y, Ren J. Exploring Urban Spatial Quality Through Street View Imagery and Human Perception Analysis. Buildings. 2025; 15(17):3116. https://doi.org/10.3390/buildings15173116
Chicago/Turabian StyleLi, Yonghao, Jialin Lu, Yuan Meng, Yiwen Luo, and Juan Ren. 2025. "Exploring Urban Spatial Quality Through Street View Imagery and Human Perception Analysis" Buildings 15, no. 17: 3116. https://doi.org/10.3390/buildings15173116
APA StyleLi, Y., Lu, J., Meng, Y., Luo, Y., & Ren, J. (2025). Exploring Urban Spatial Quality Through Street View Imagery and Human Perception Analysis. Buildings, 15(17), 3116. https://doi.org/10.3390/buildings15173116


