Solar PV Potential Assessment of Urban Typical Blocks via Spatial Morphological Quantification and Numerical Simulation: A Case Study of Jinan, China
Abstract
1. Introduction
1.1. Background of the Study
1.2. Related Work
1.3. Aims and Originality
- To introduce a multi-indicator spatial morphology quantification approach by applying PCA and clustering algorithms to 749 urban blocks, thereby extracting key morphological indicators and establishing a systematic and replicable method for identifying representative block types.
- To conduct rooftop PV potential simulations on representative blocks using parametric modeling and high-efficiency simulation tools, and to propose a rapid assessment framework applicable at the urban block scale.
- To evaluate the applicability of various PV materials across different block types and propose material selection and deployment strategies based on specific design needs.
- To develop regression models between morphological parameters and PV potential, enabling fast estimation and scalable application of solar potential in urban contexts.
2. Methods
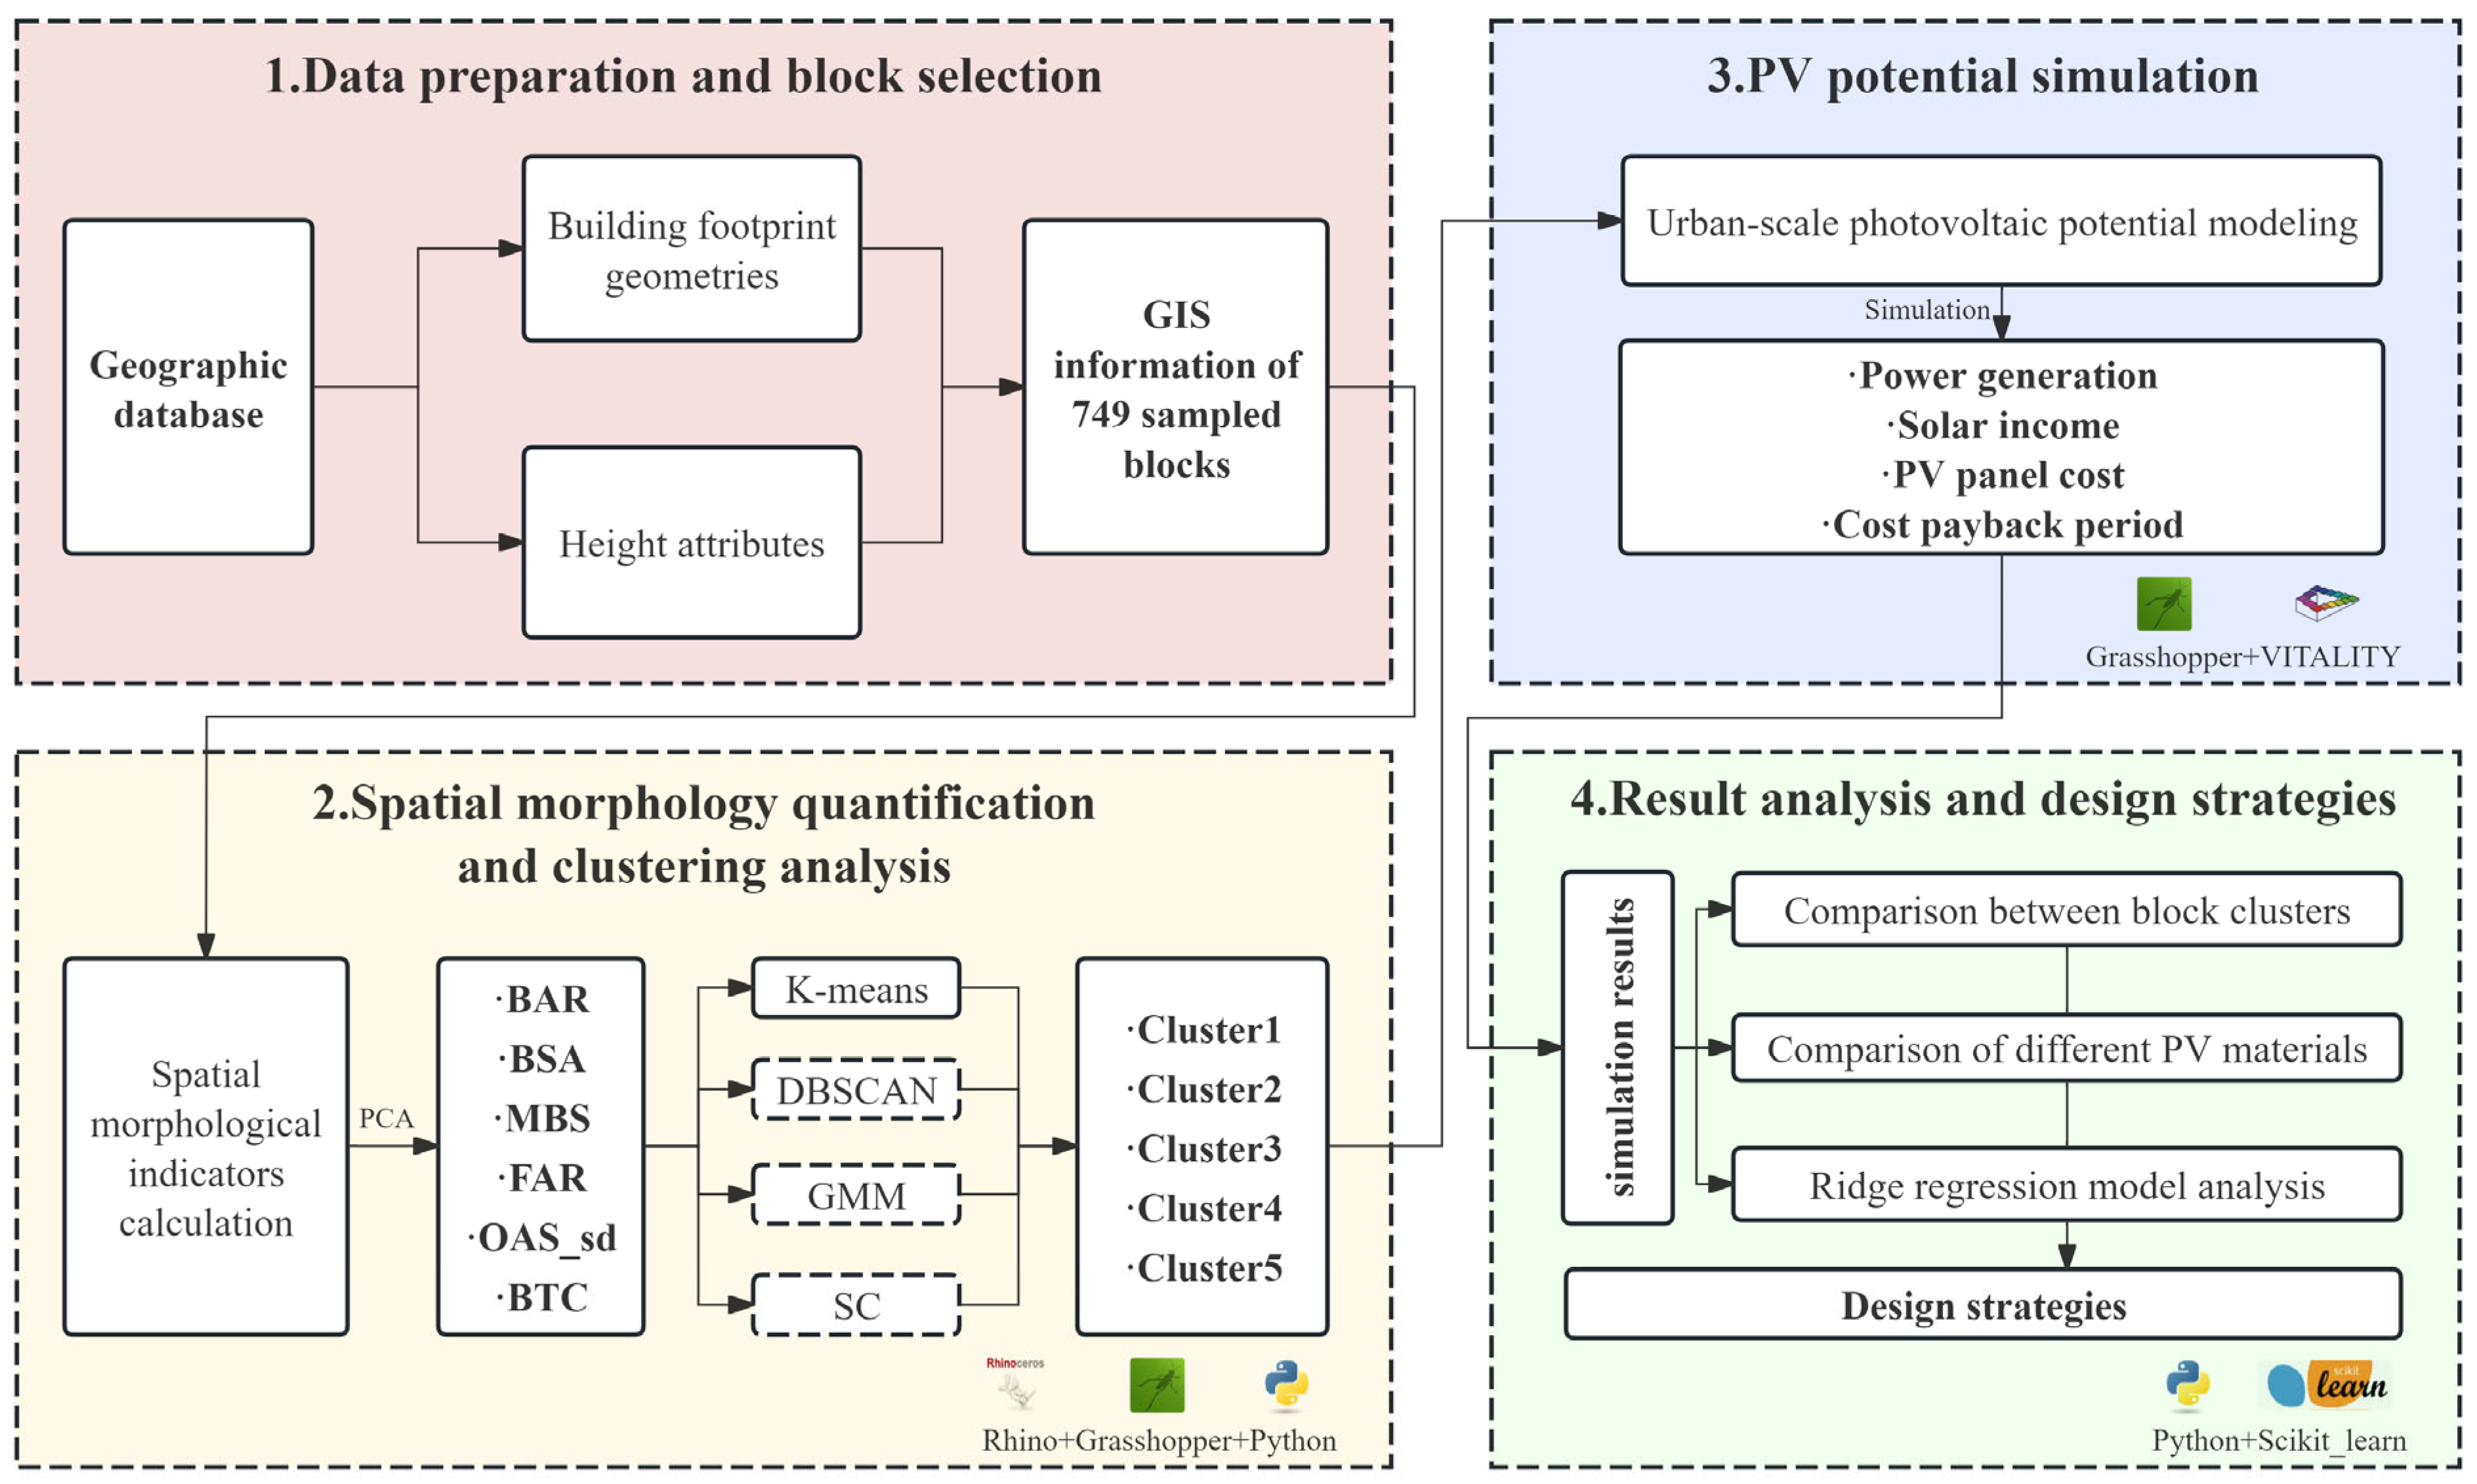
2.1. Overview of the Workflow
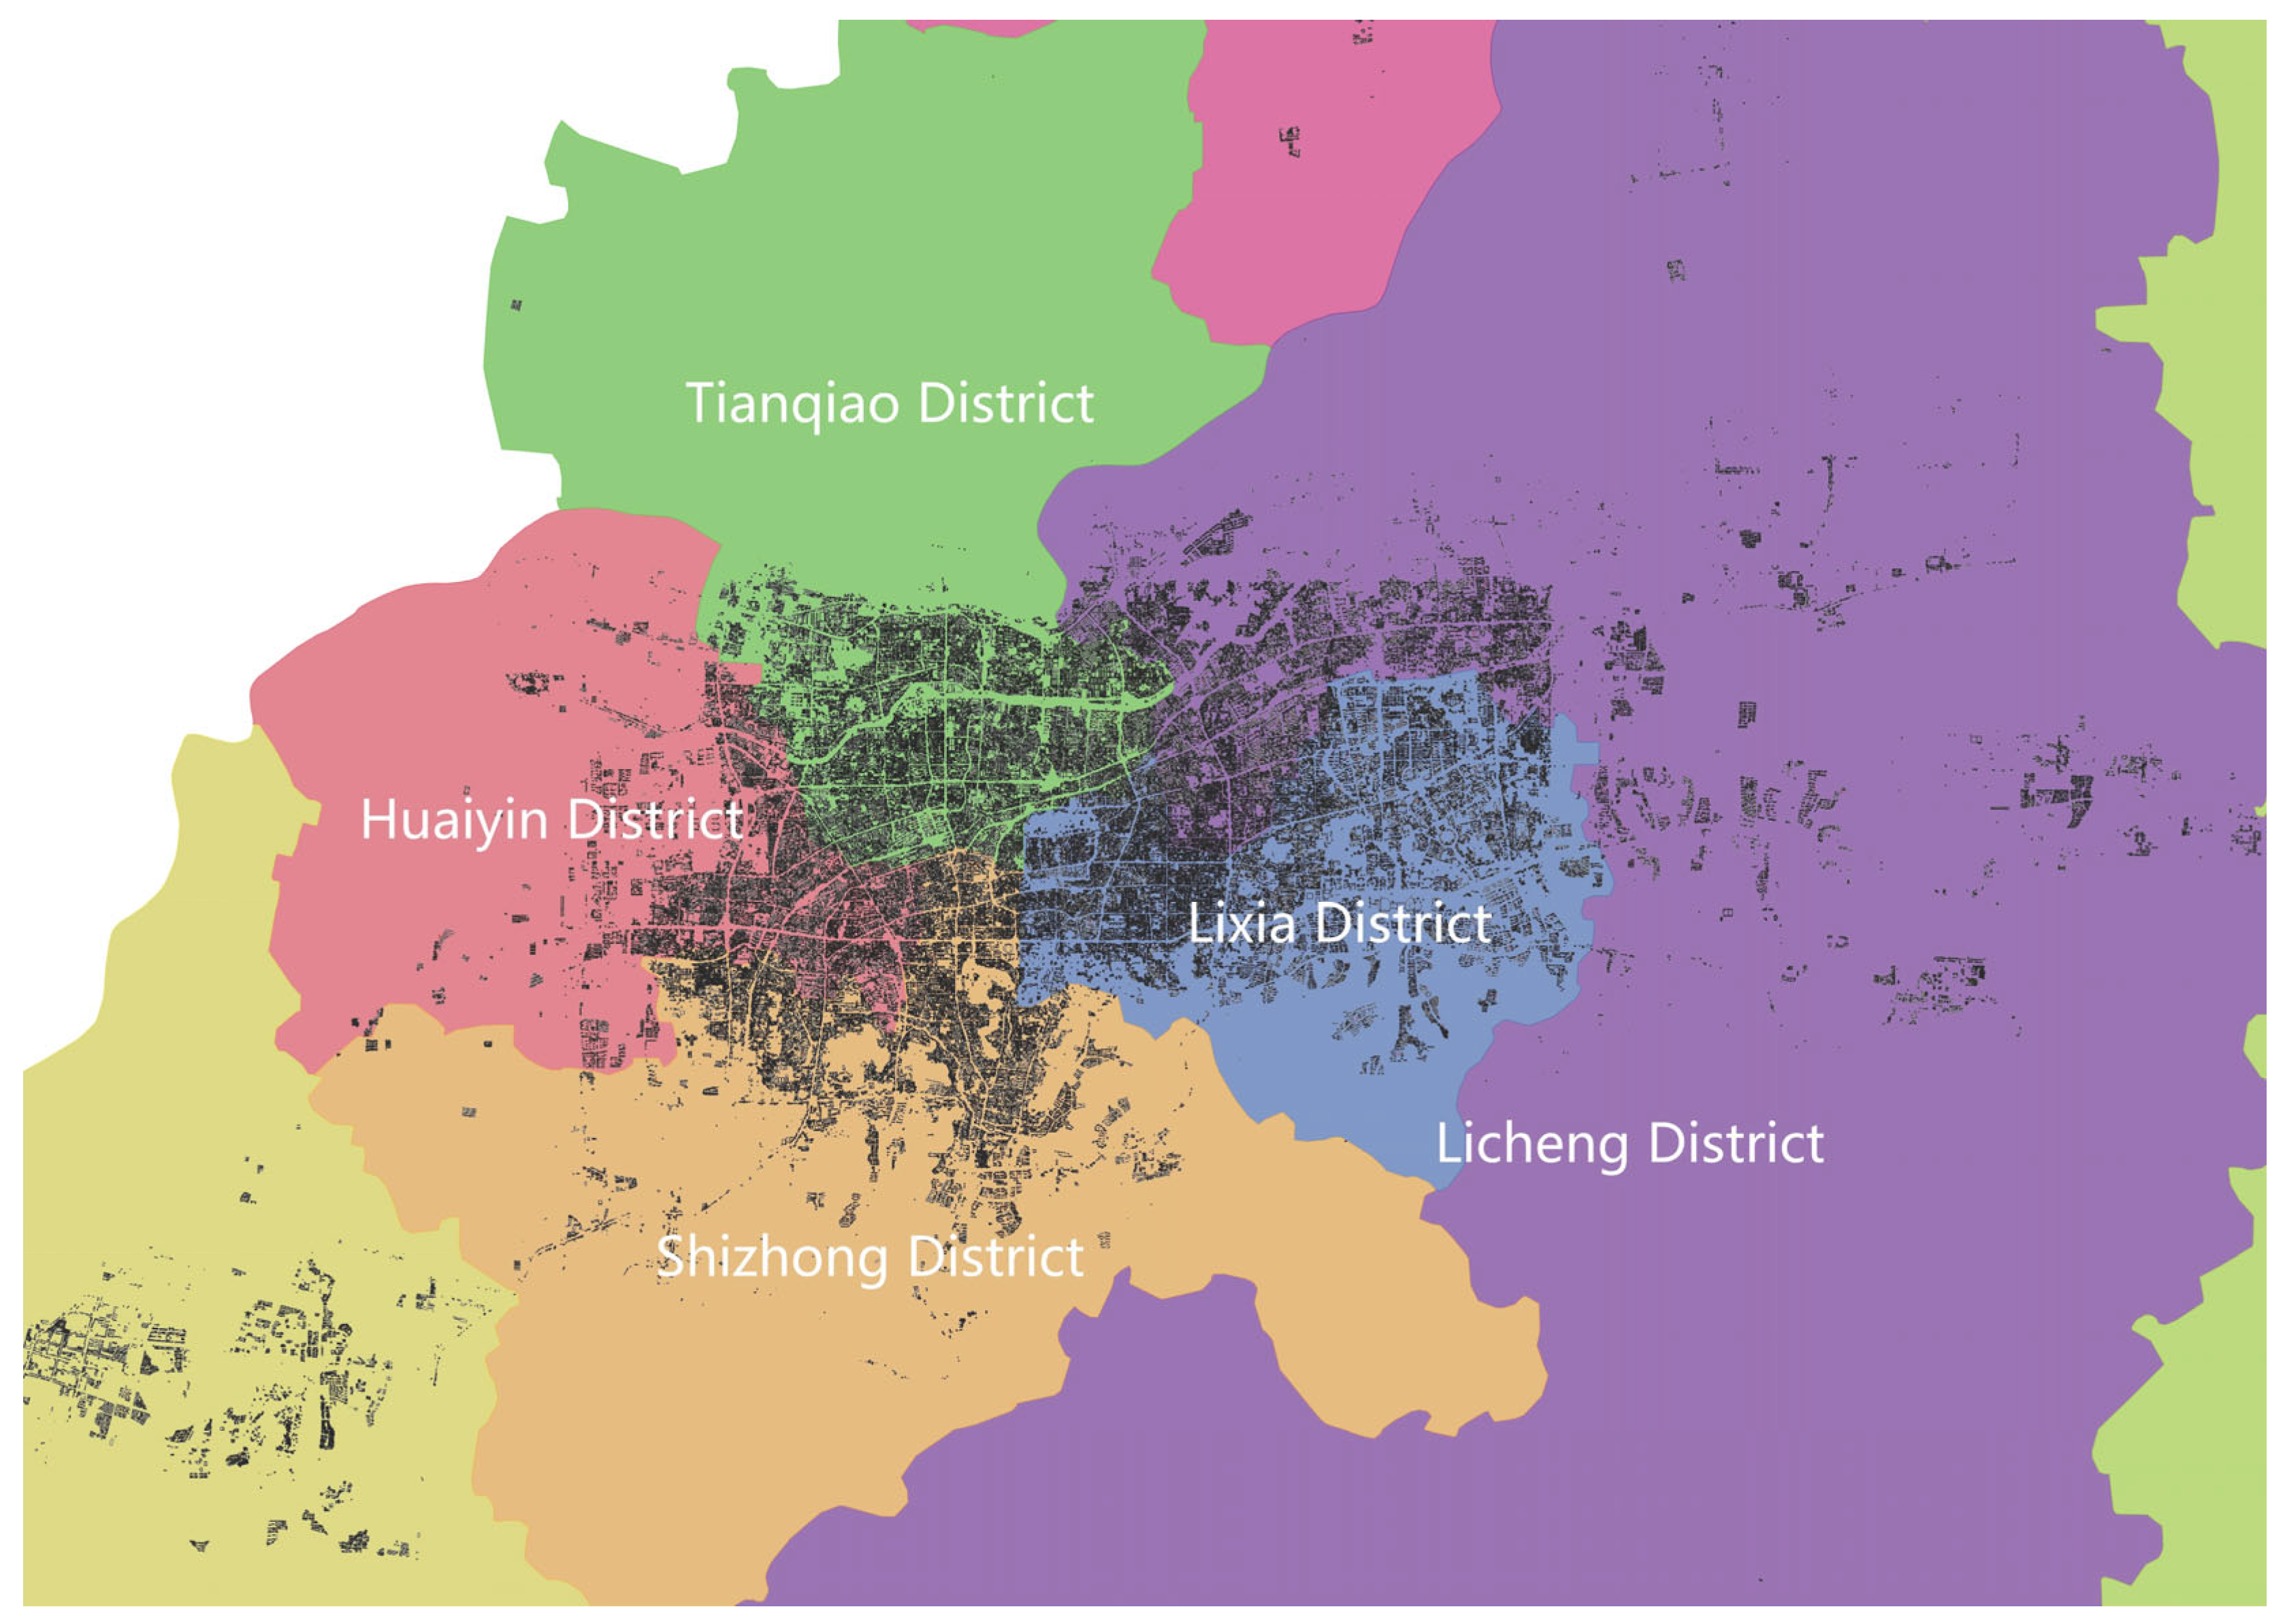
2.2. Data Preparation and Block Selection
2.3. Quantification of Urban Morphology Indicators
2.4. Morphological Clustering Framework
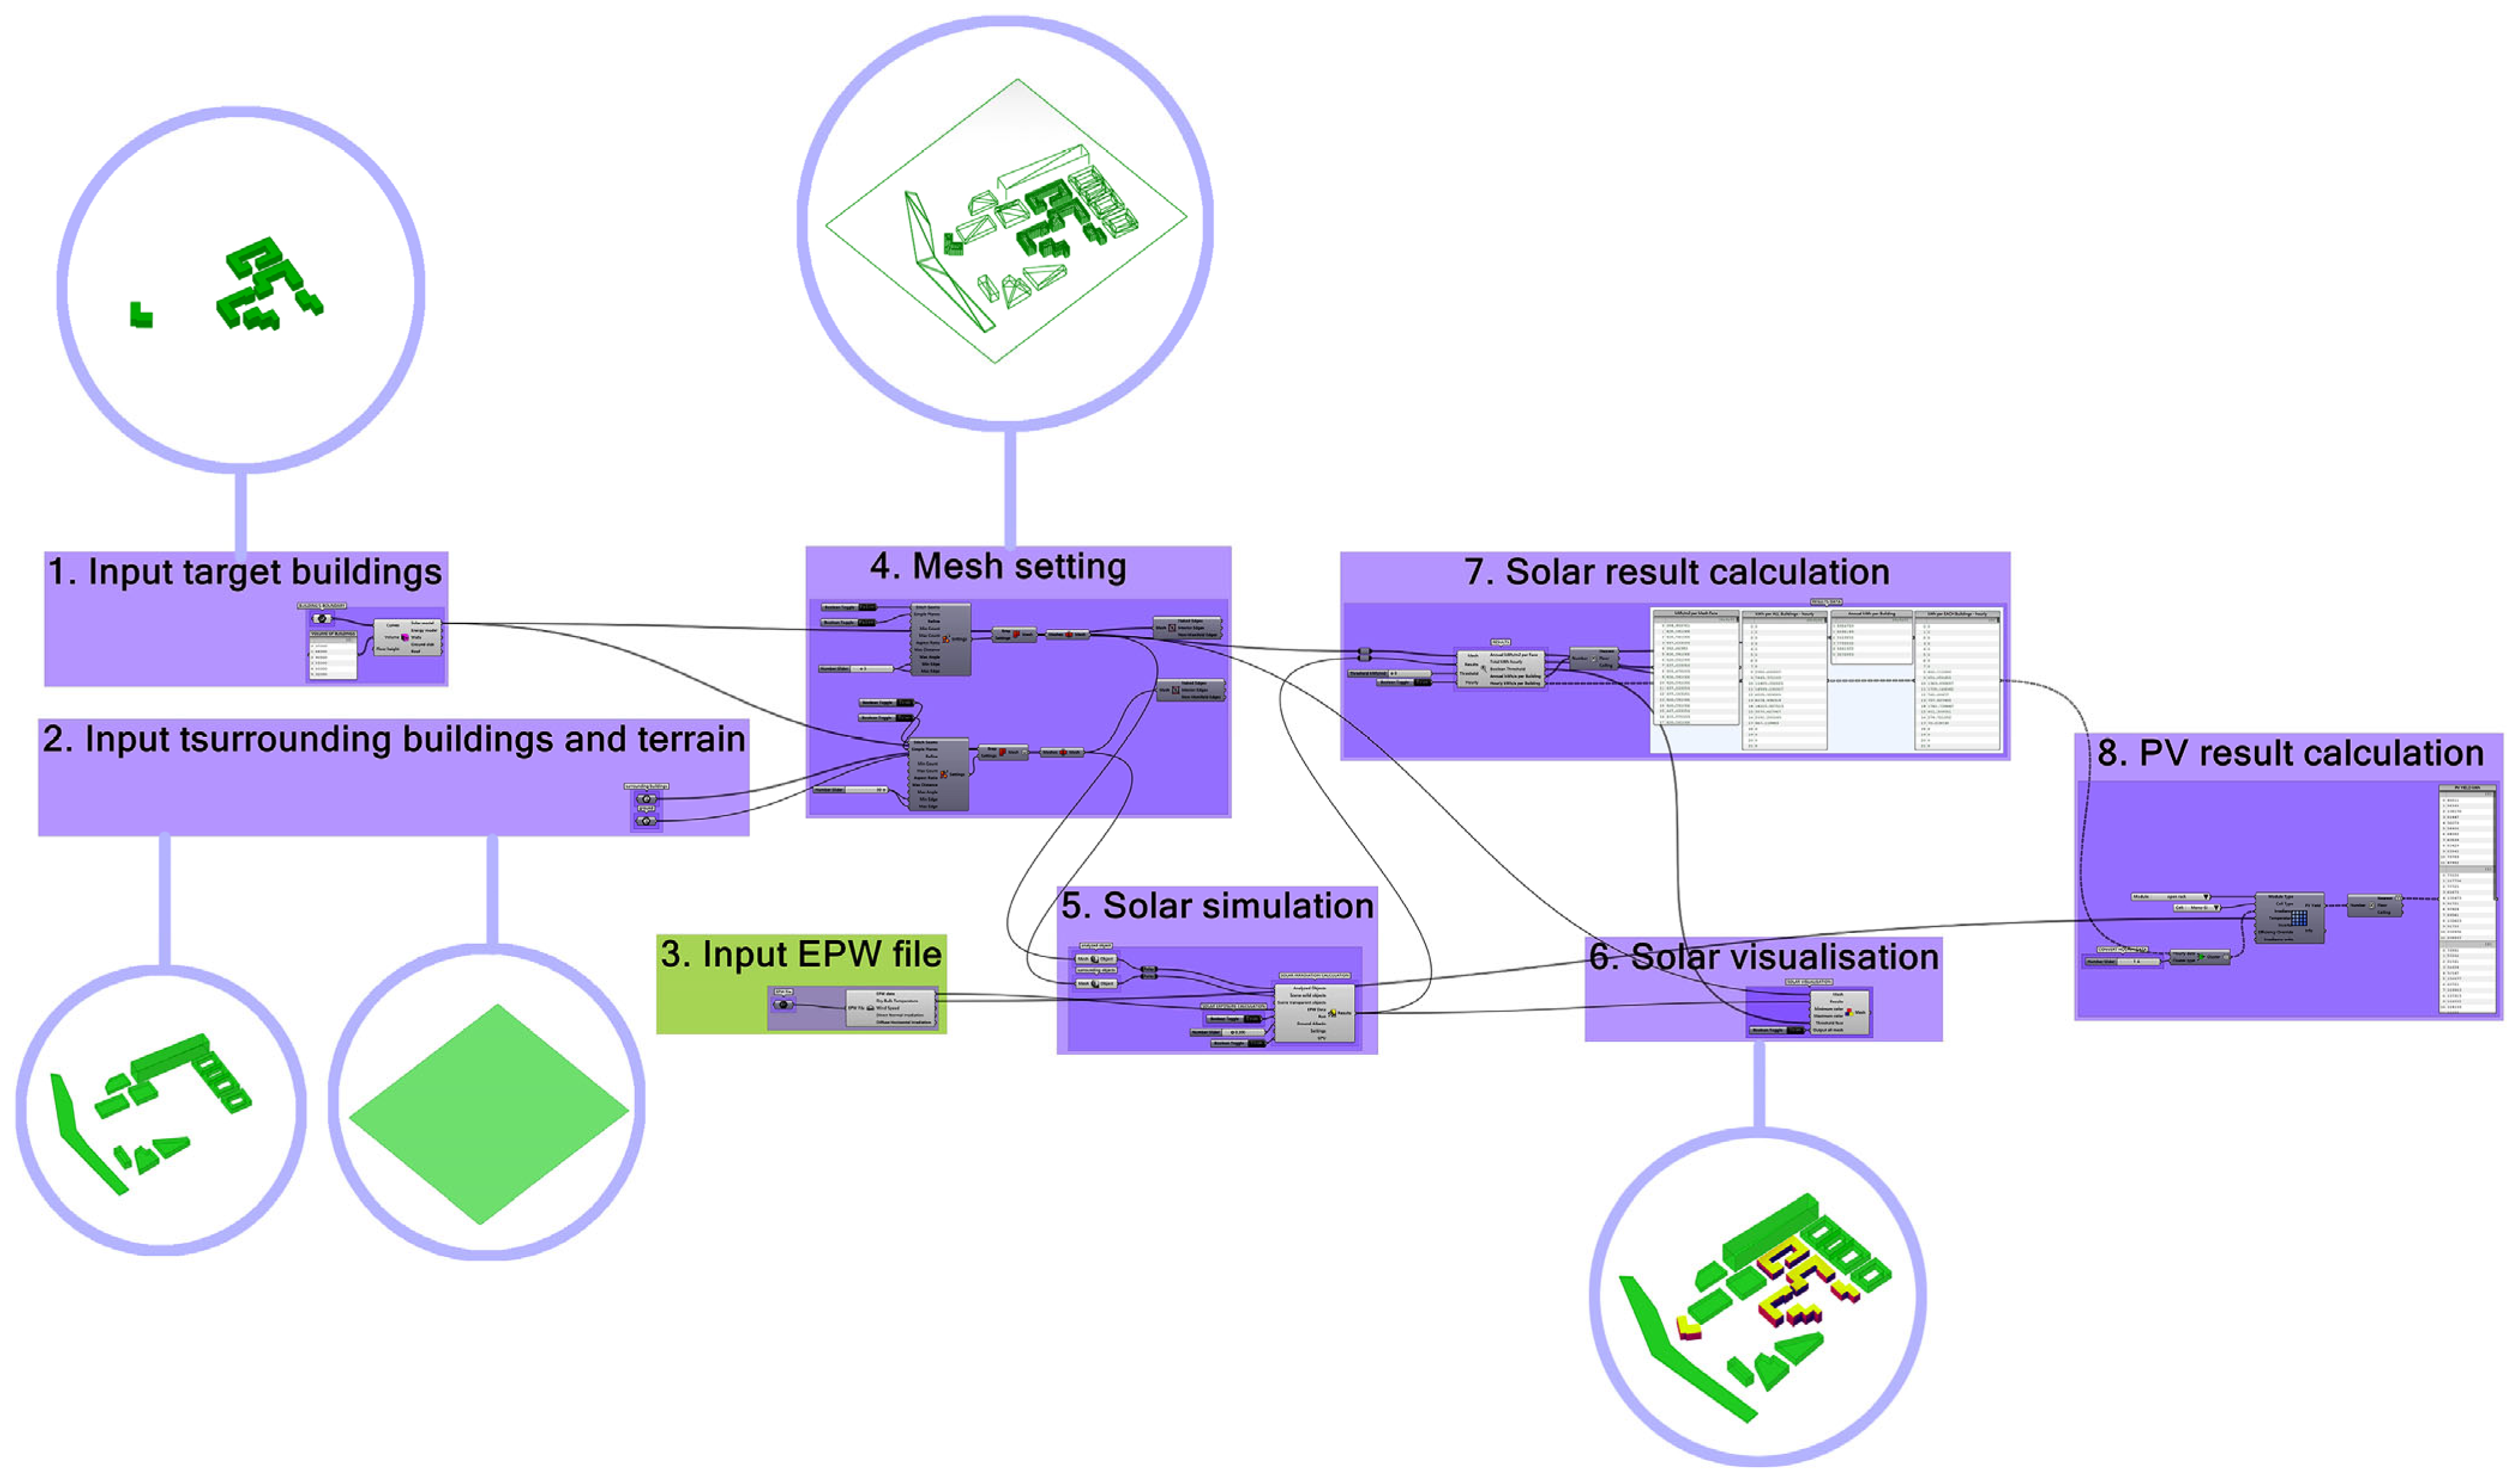
2.5. Urban-Scale PV Potential Modeling
3. Results
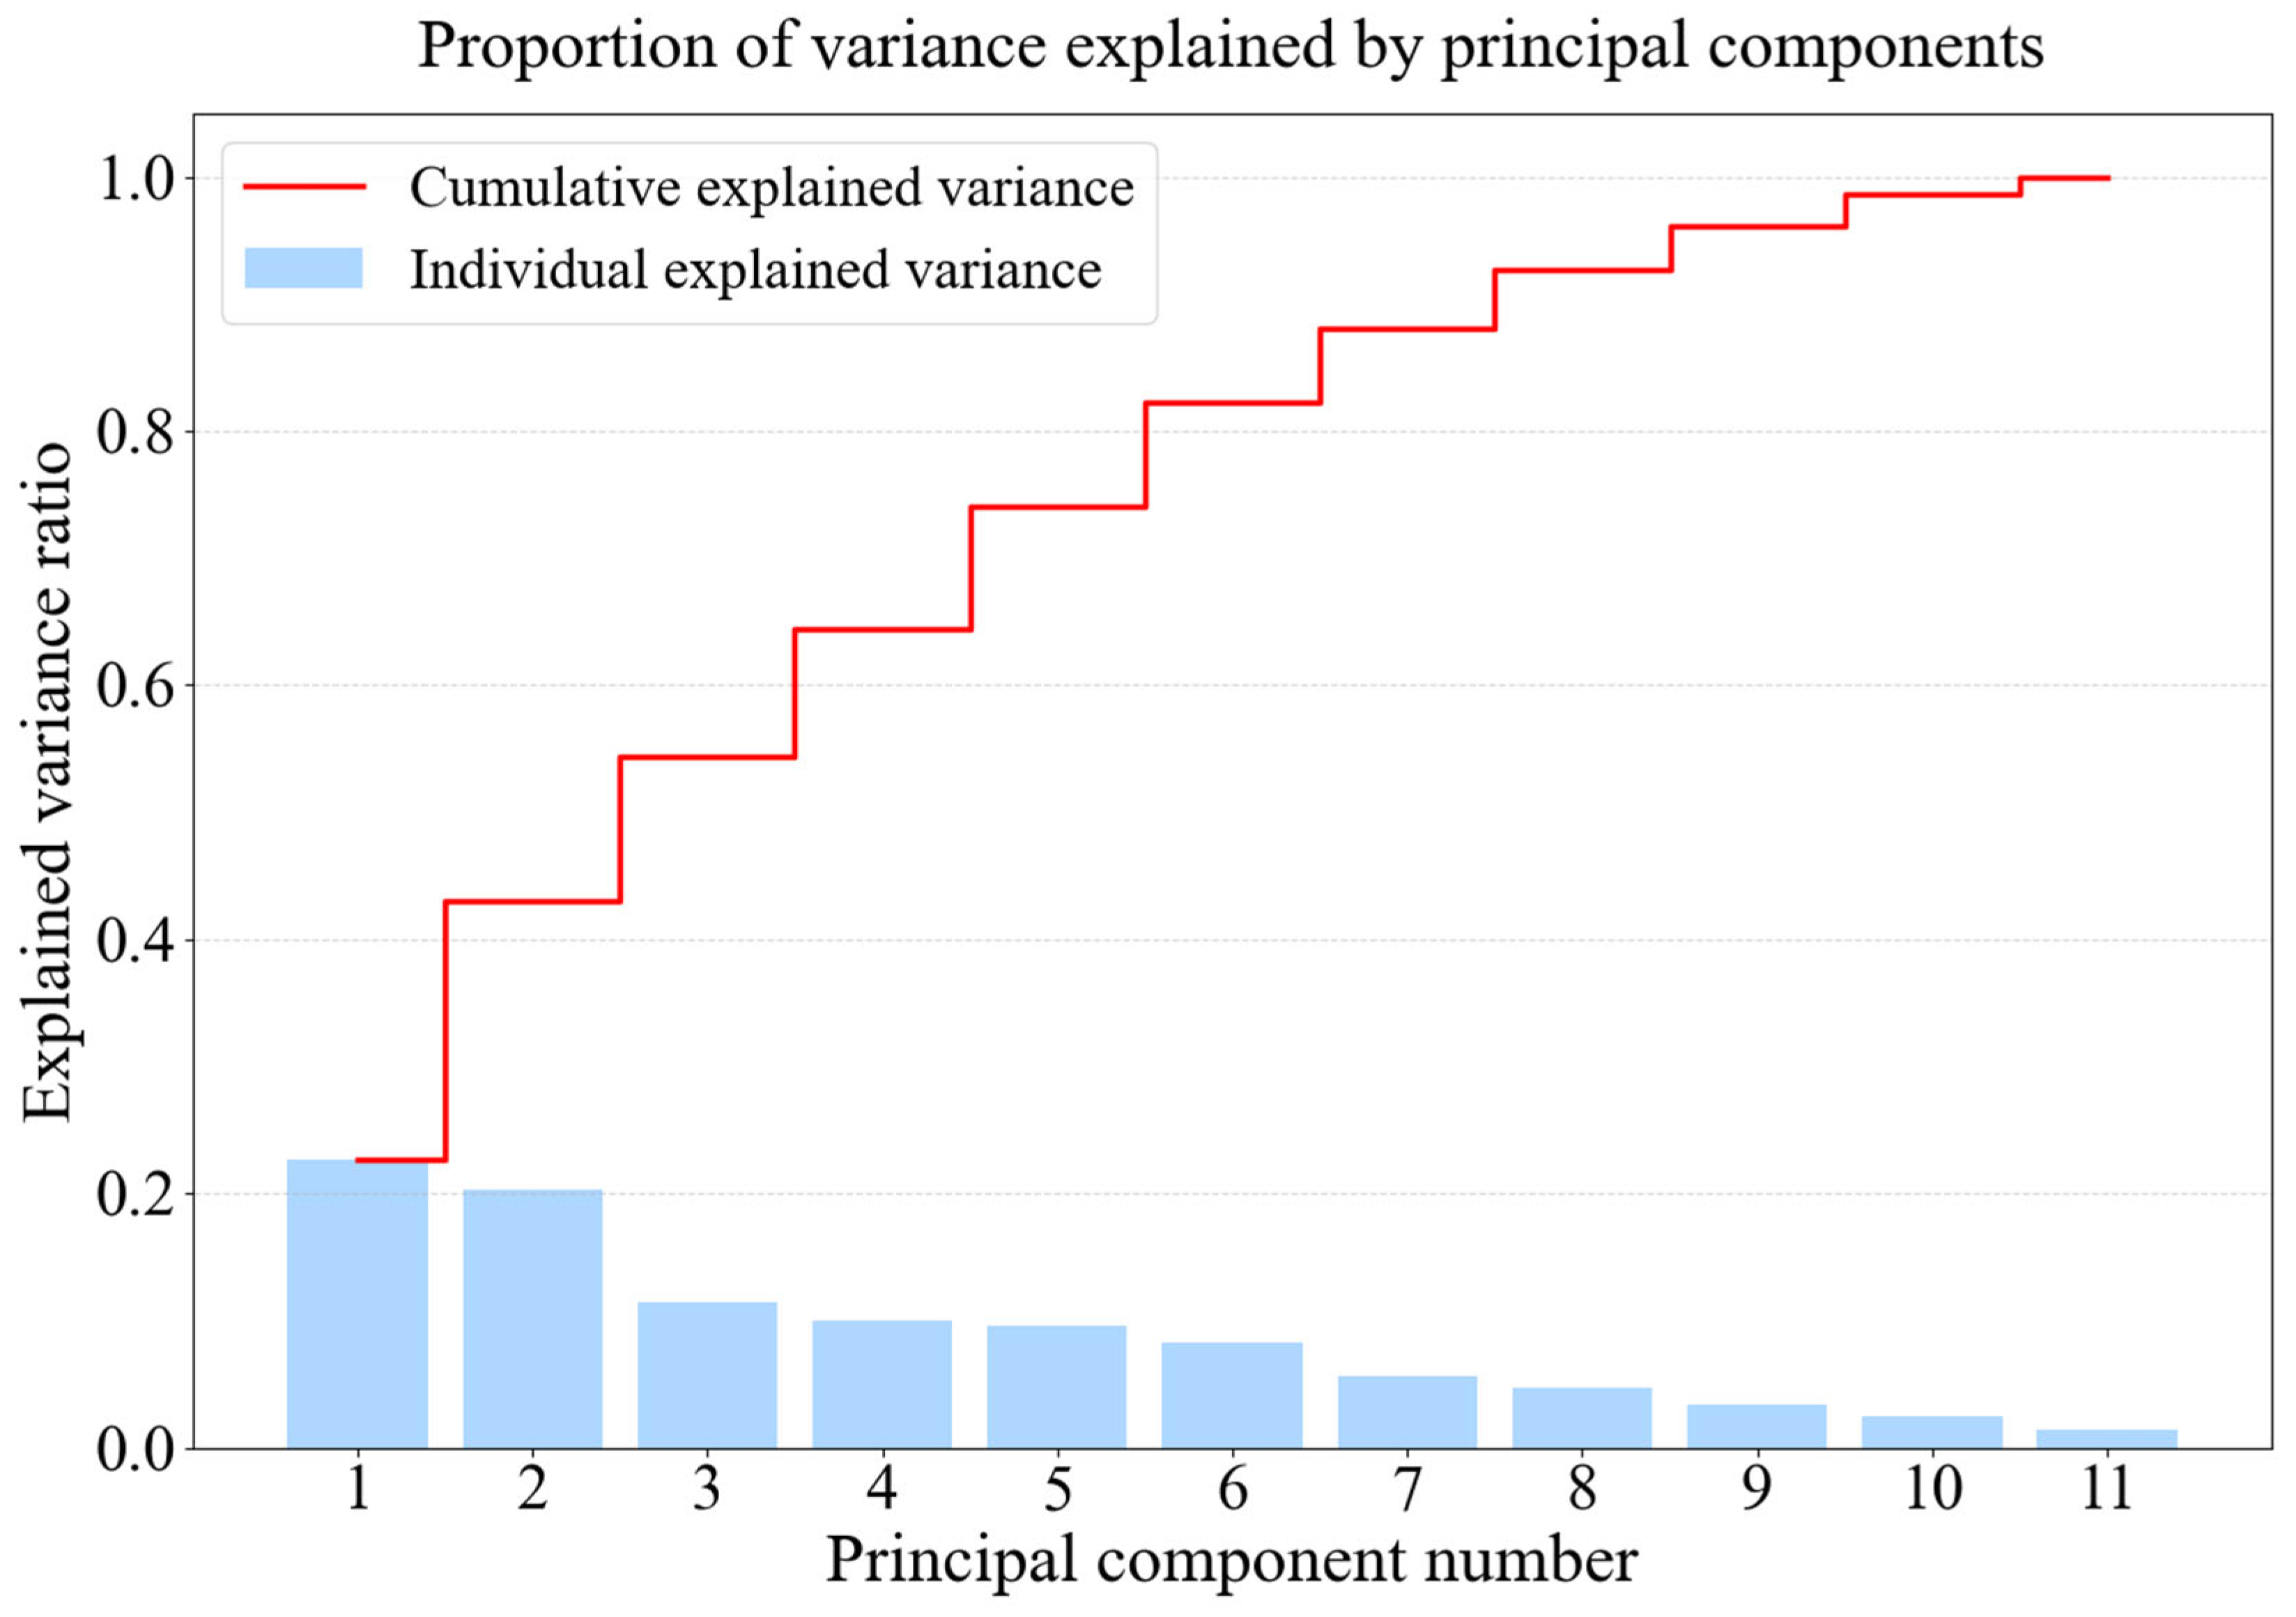
3.1. Morphology Indicators Selection
3.2. Morphology Clustering
3.3. Block PV Power Result
3.4. Regression Predict Model
4. Discussion
4.1. Impacts of Seasonal Generation Patterns on Urban PV Utilization
4.2. Spatial Distribution and Morphological Characteristics of Block Clusters
4.3. Applicability of the Framework to Diverse Urban Typologies
4.4. Limitations and Future Work
5. Conclusions
- (1)
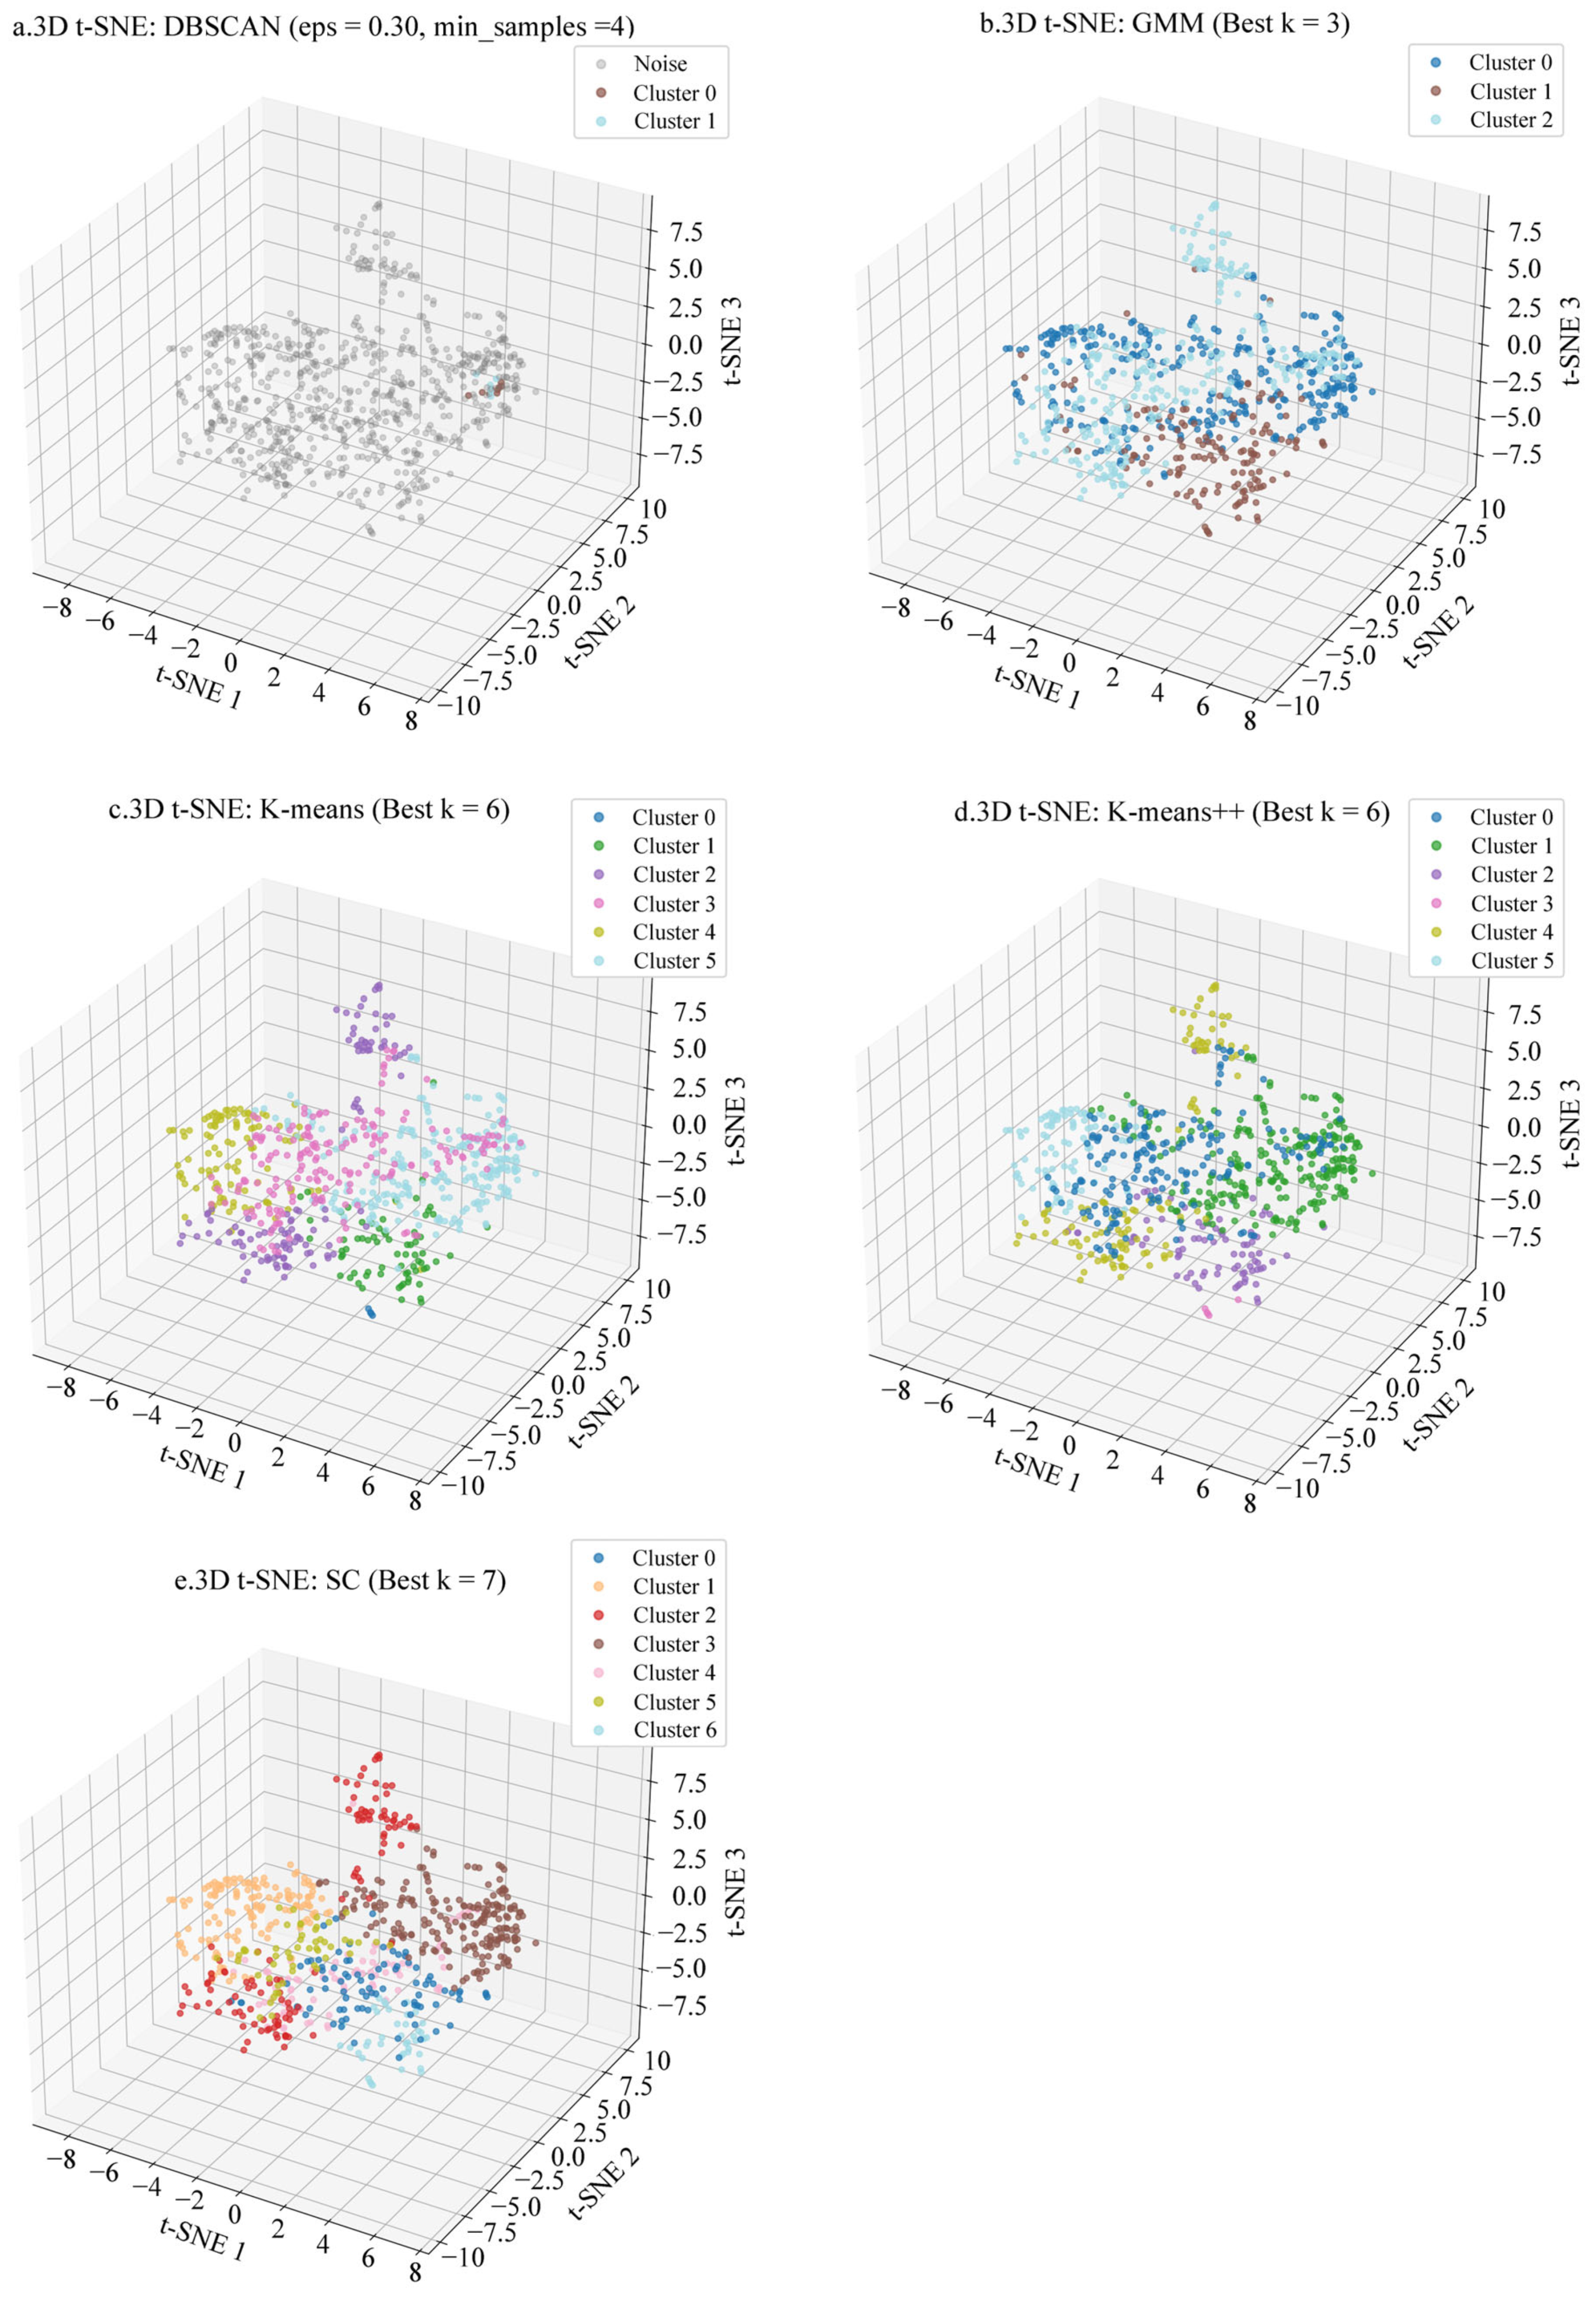
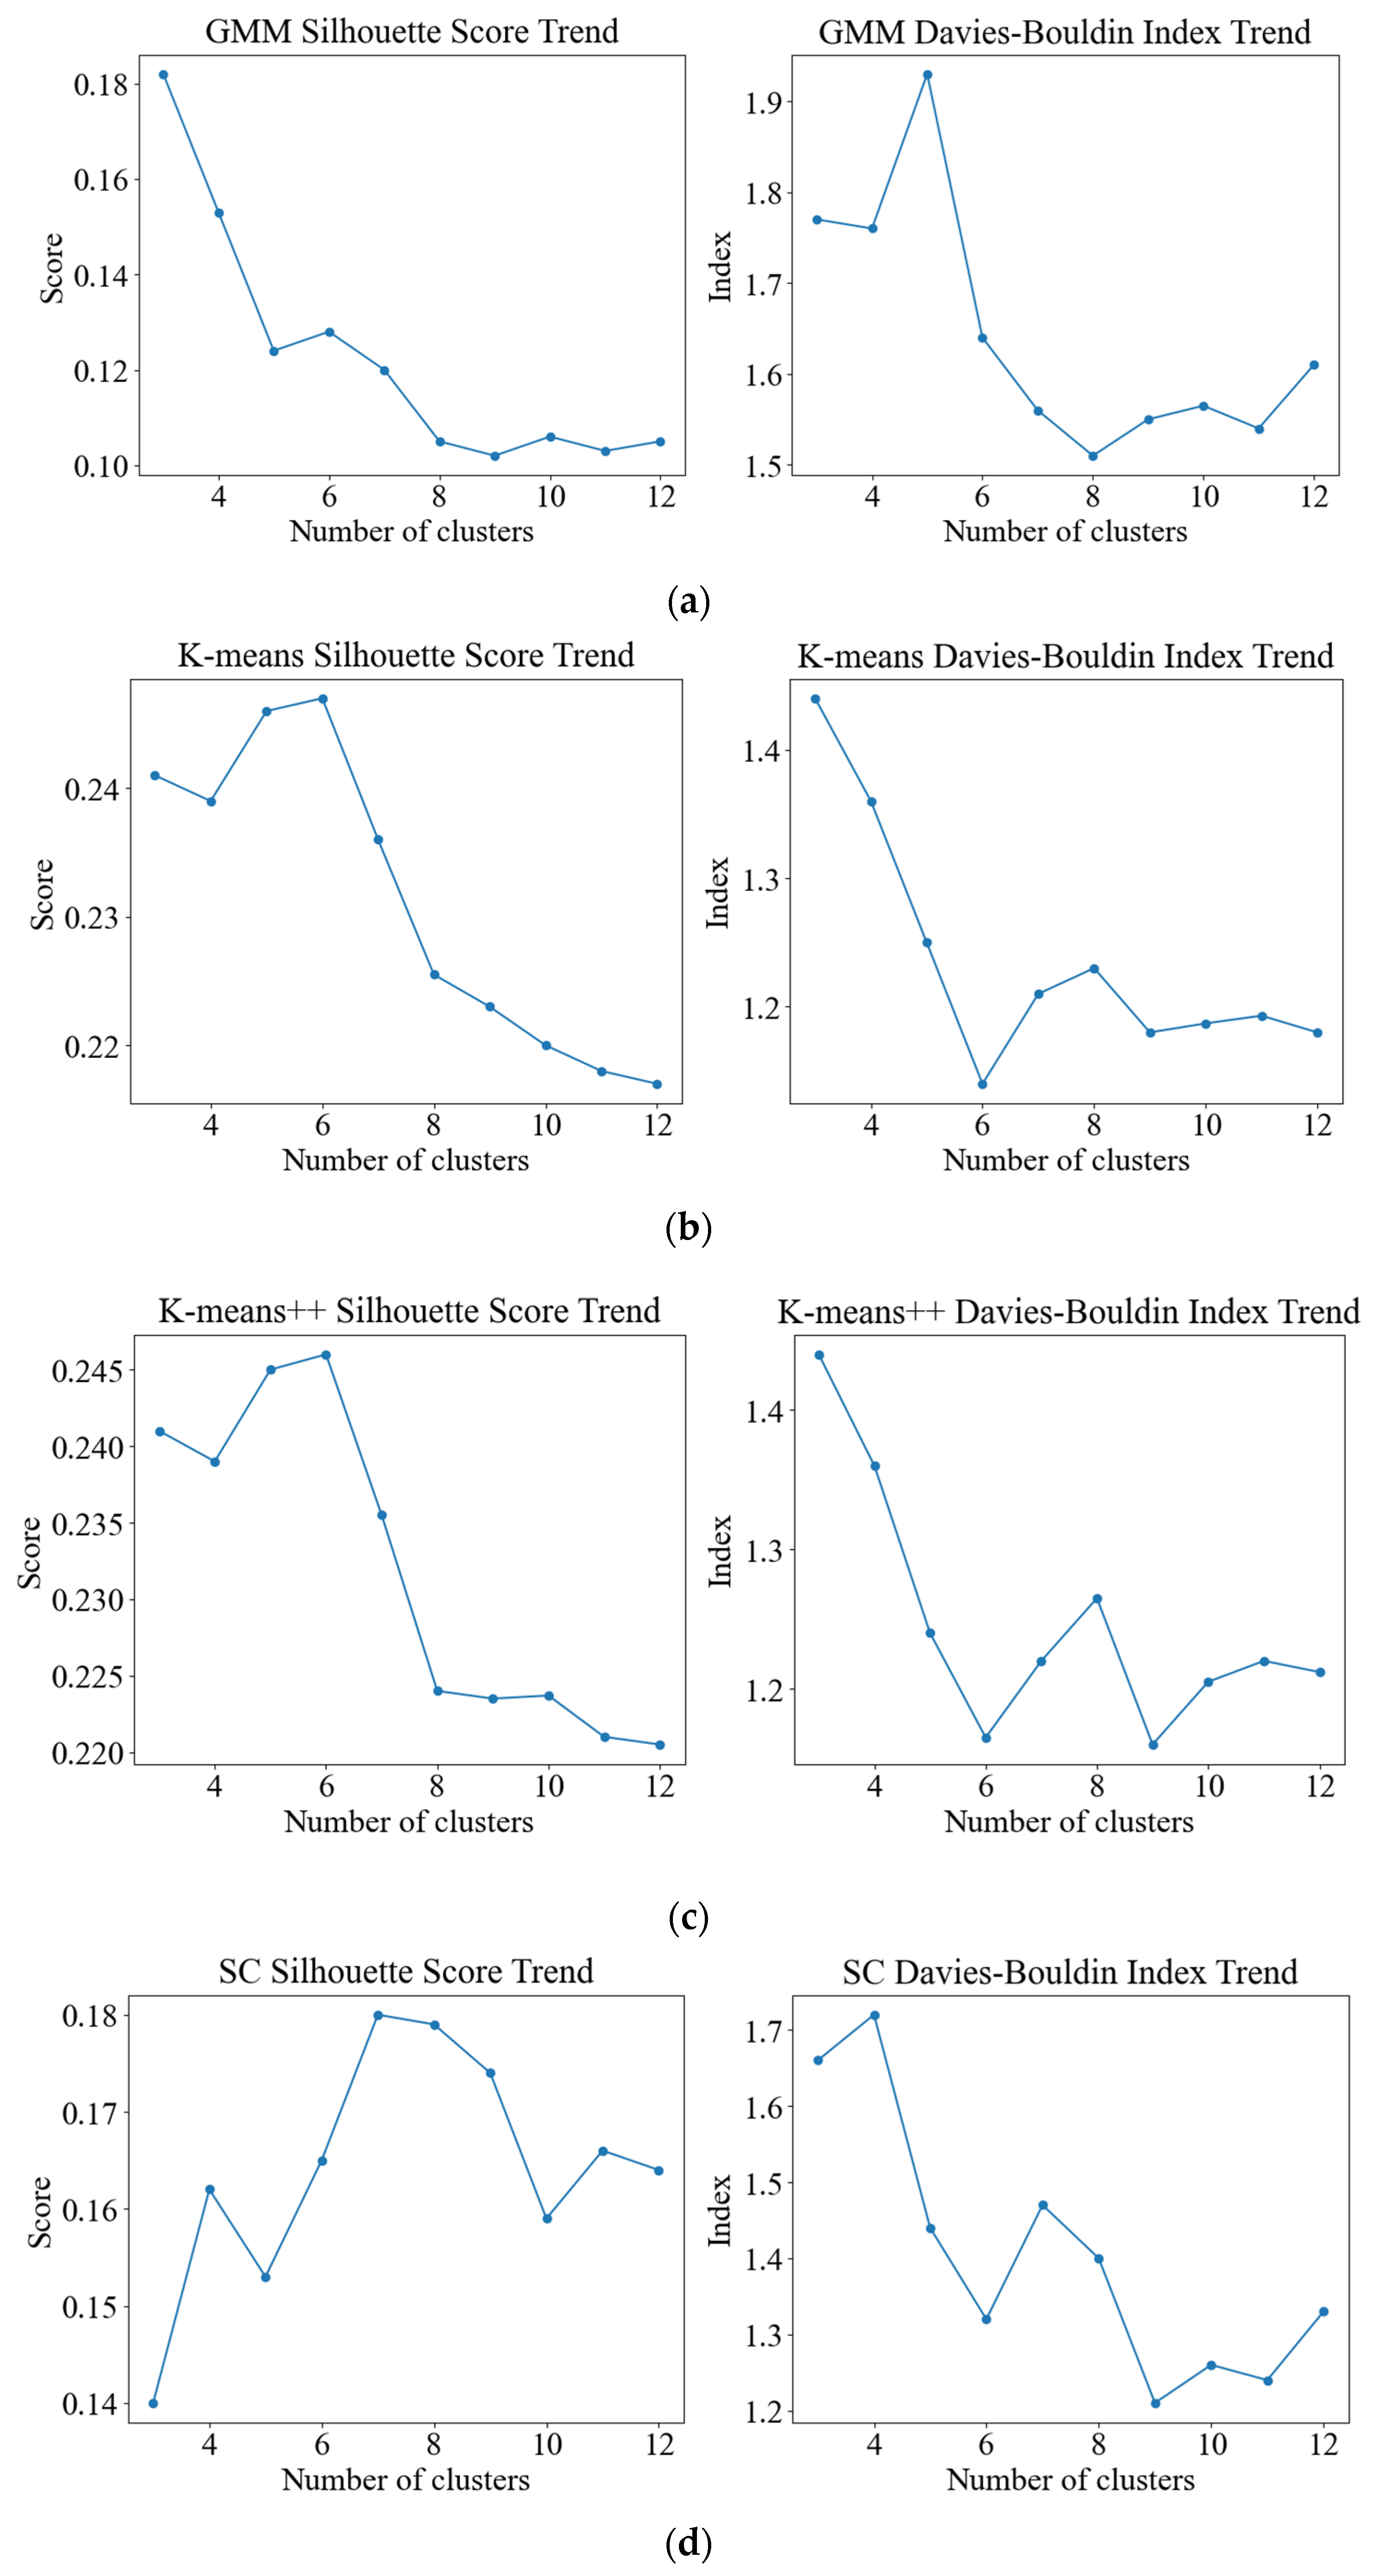
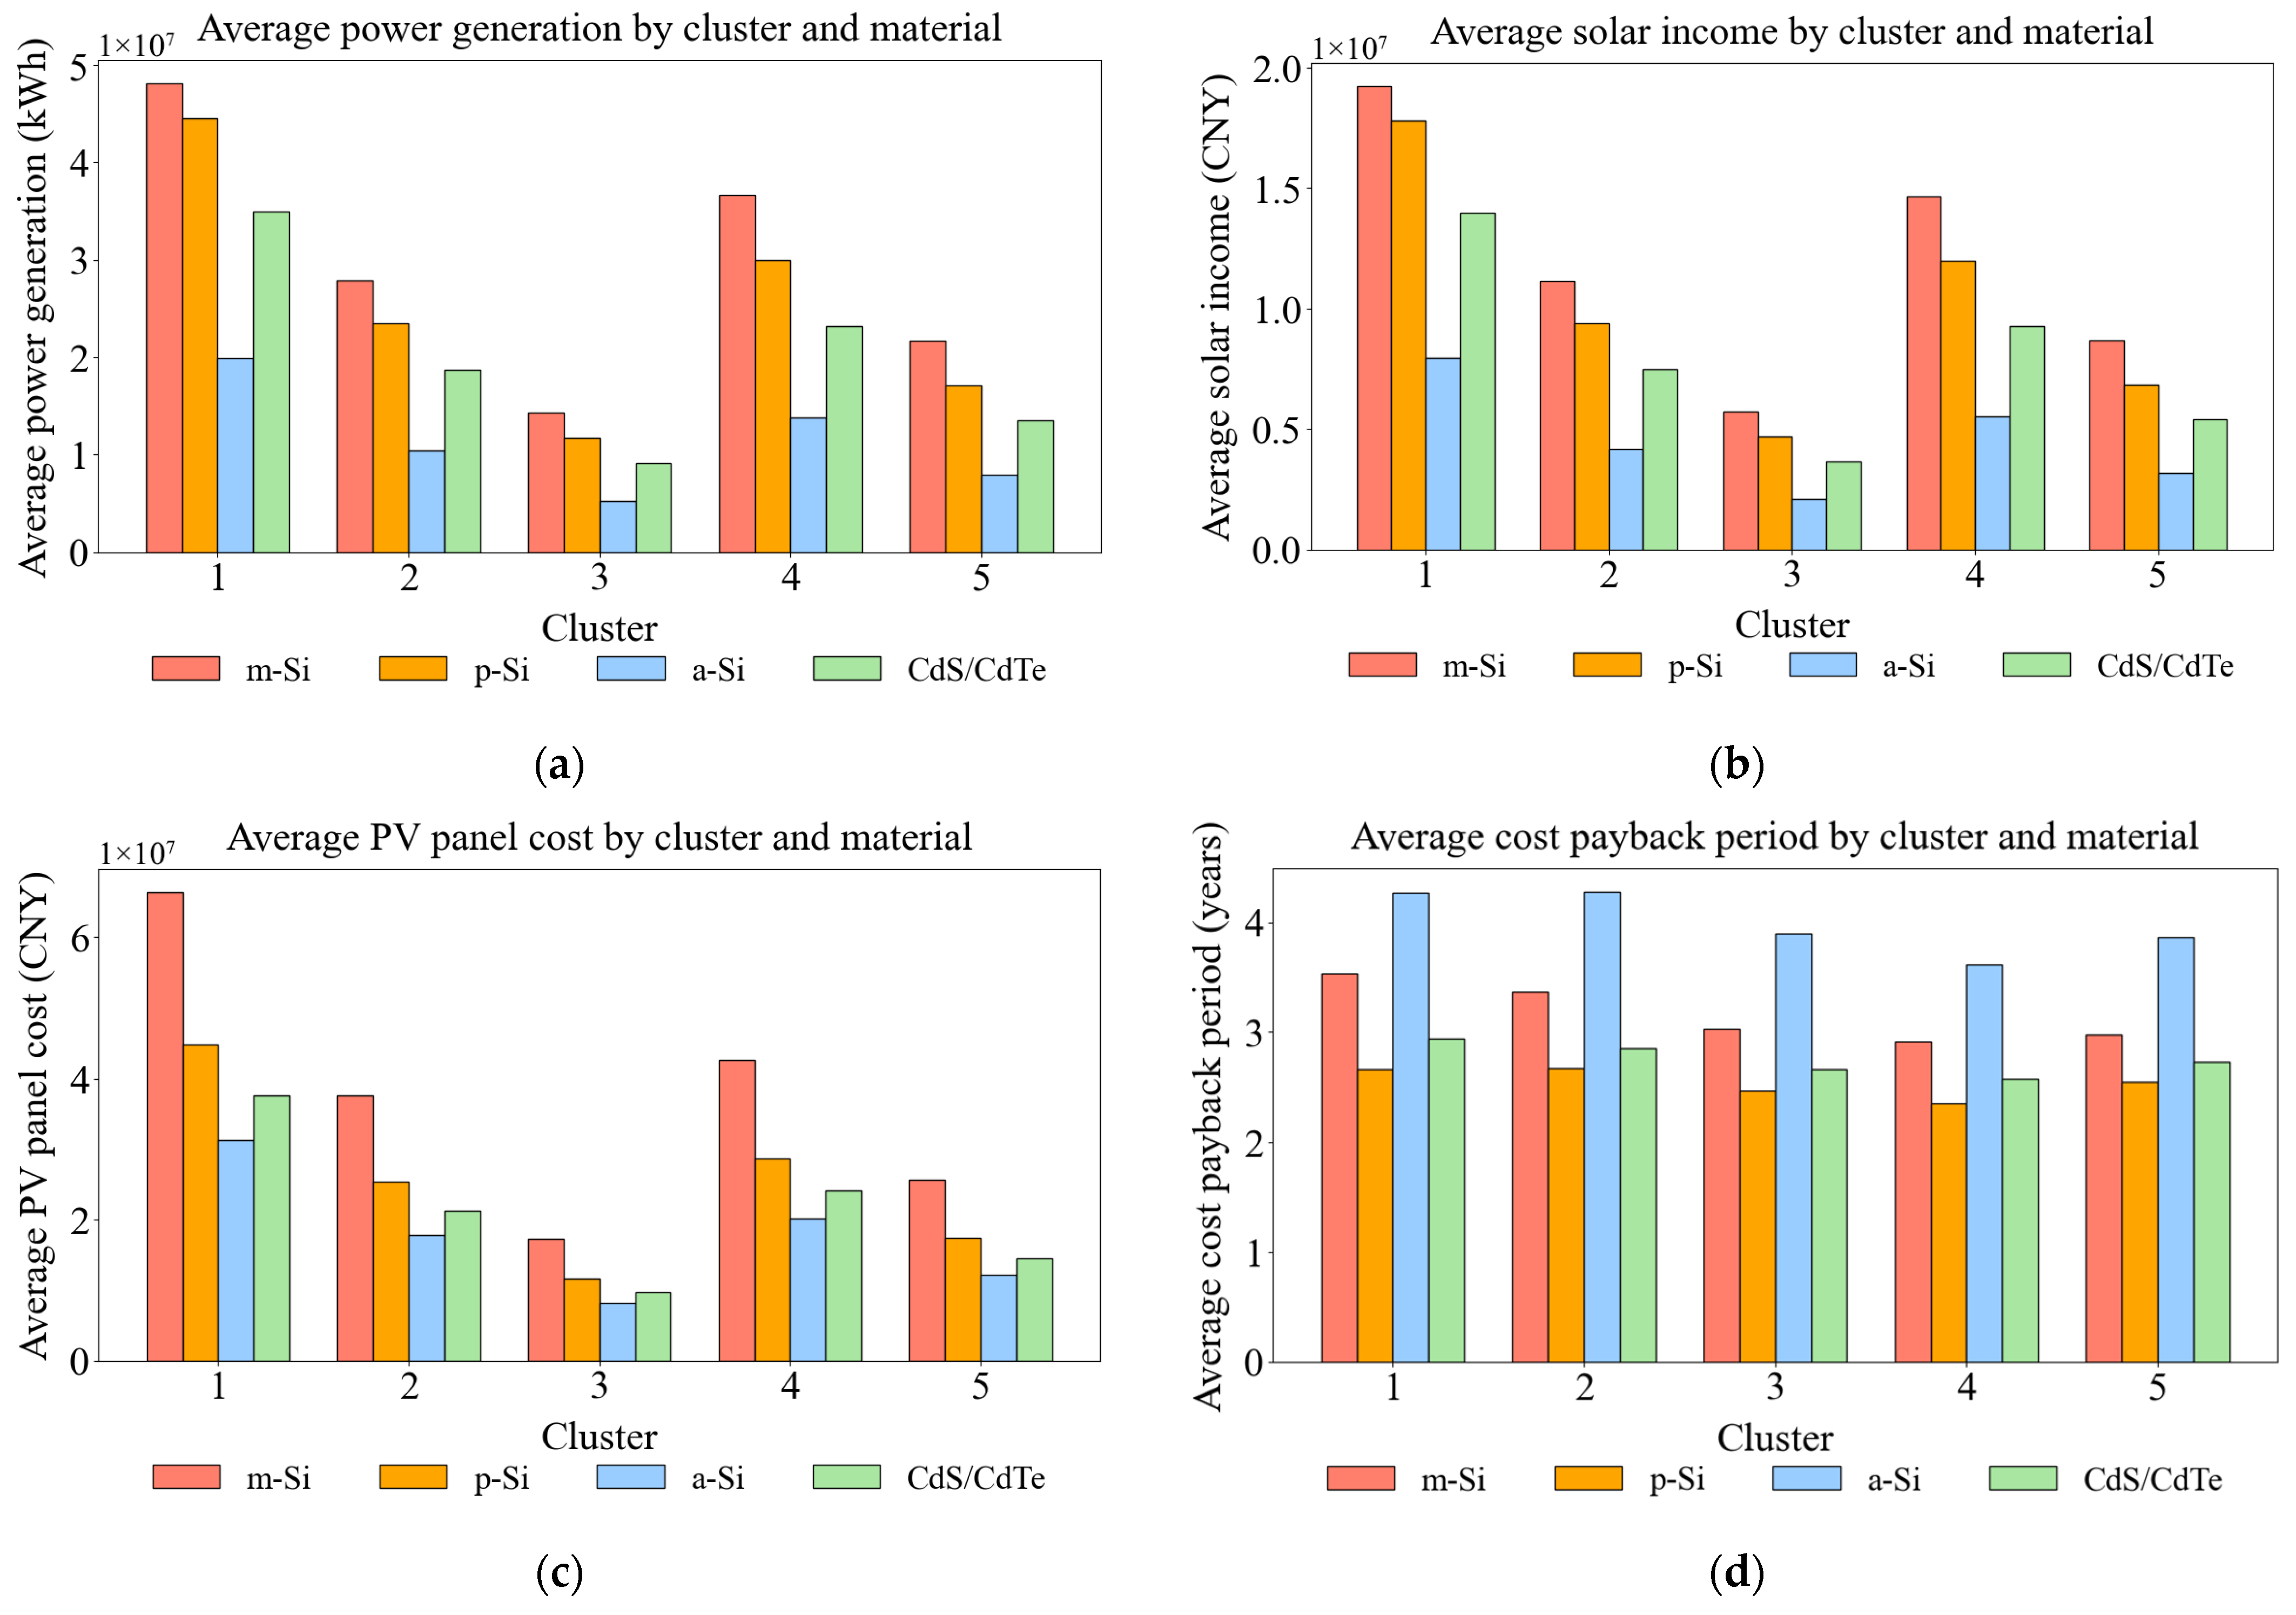
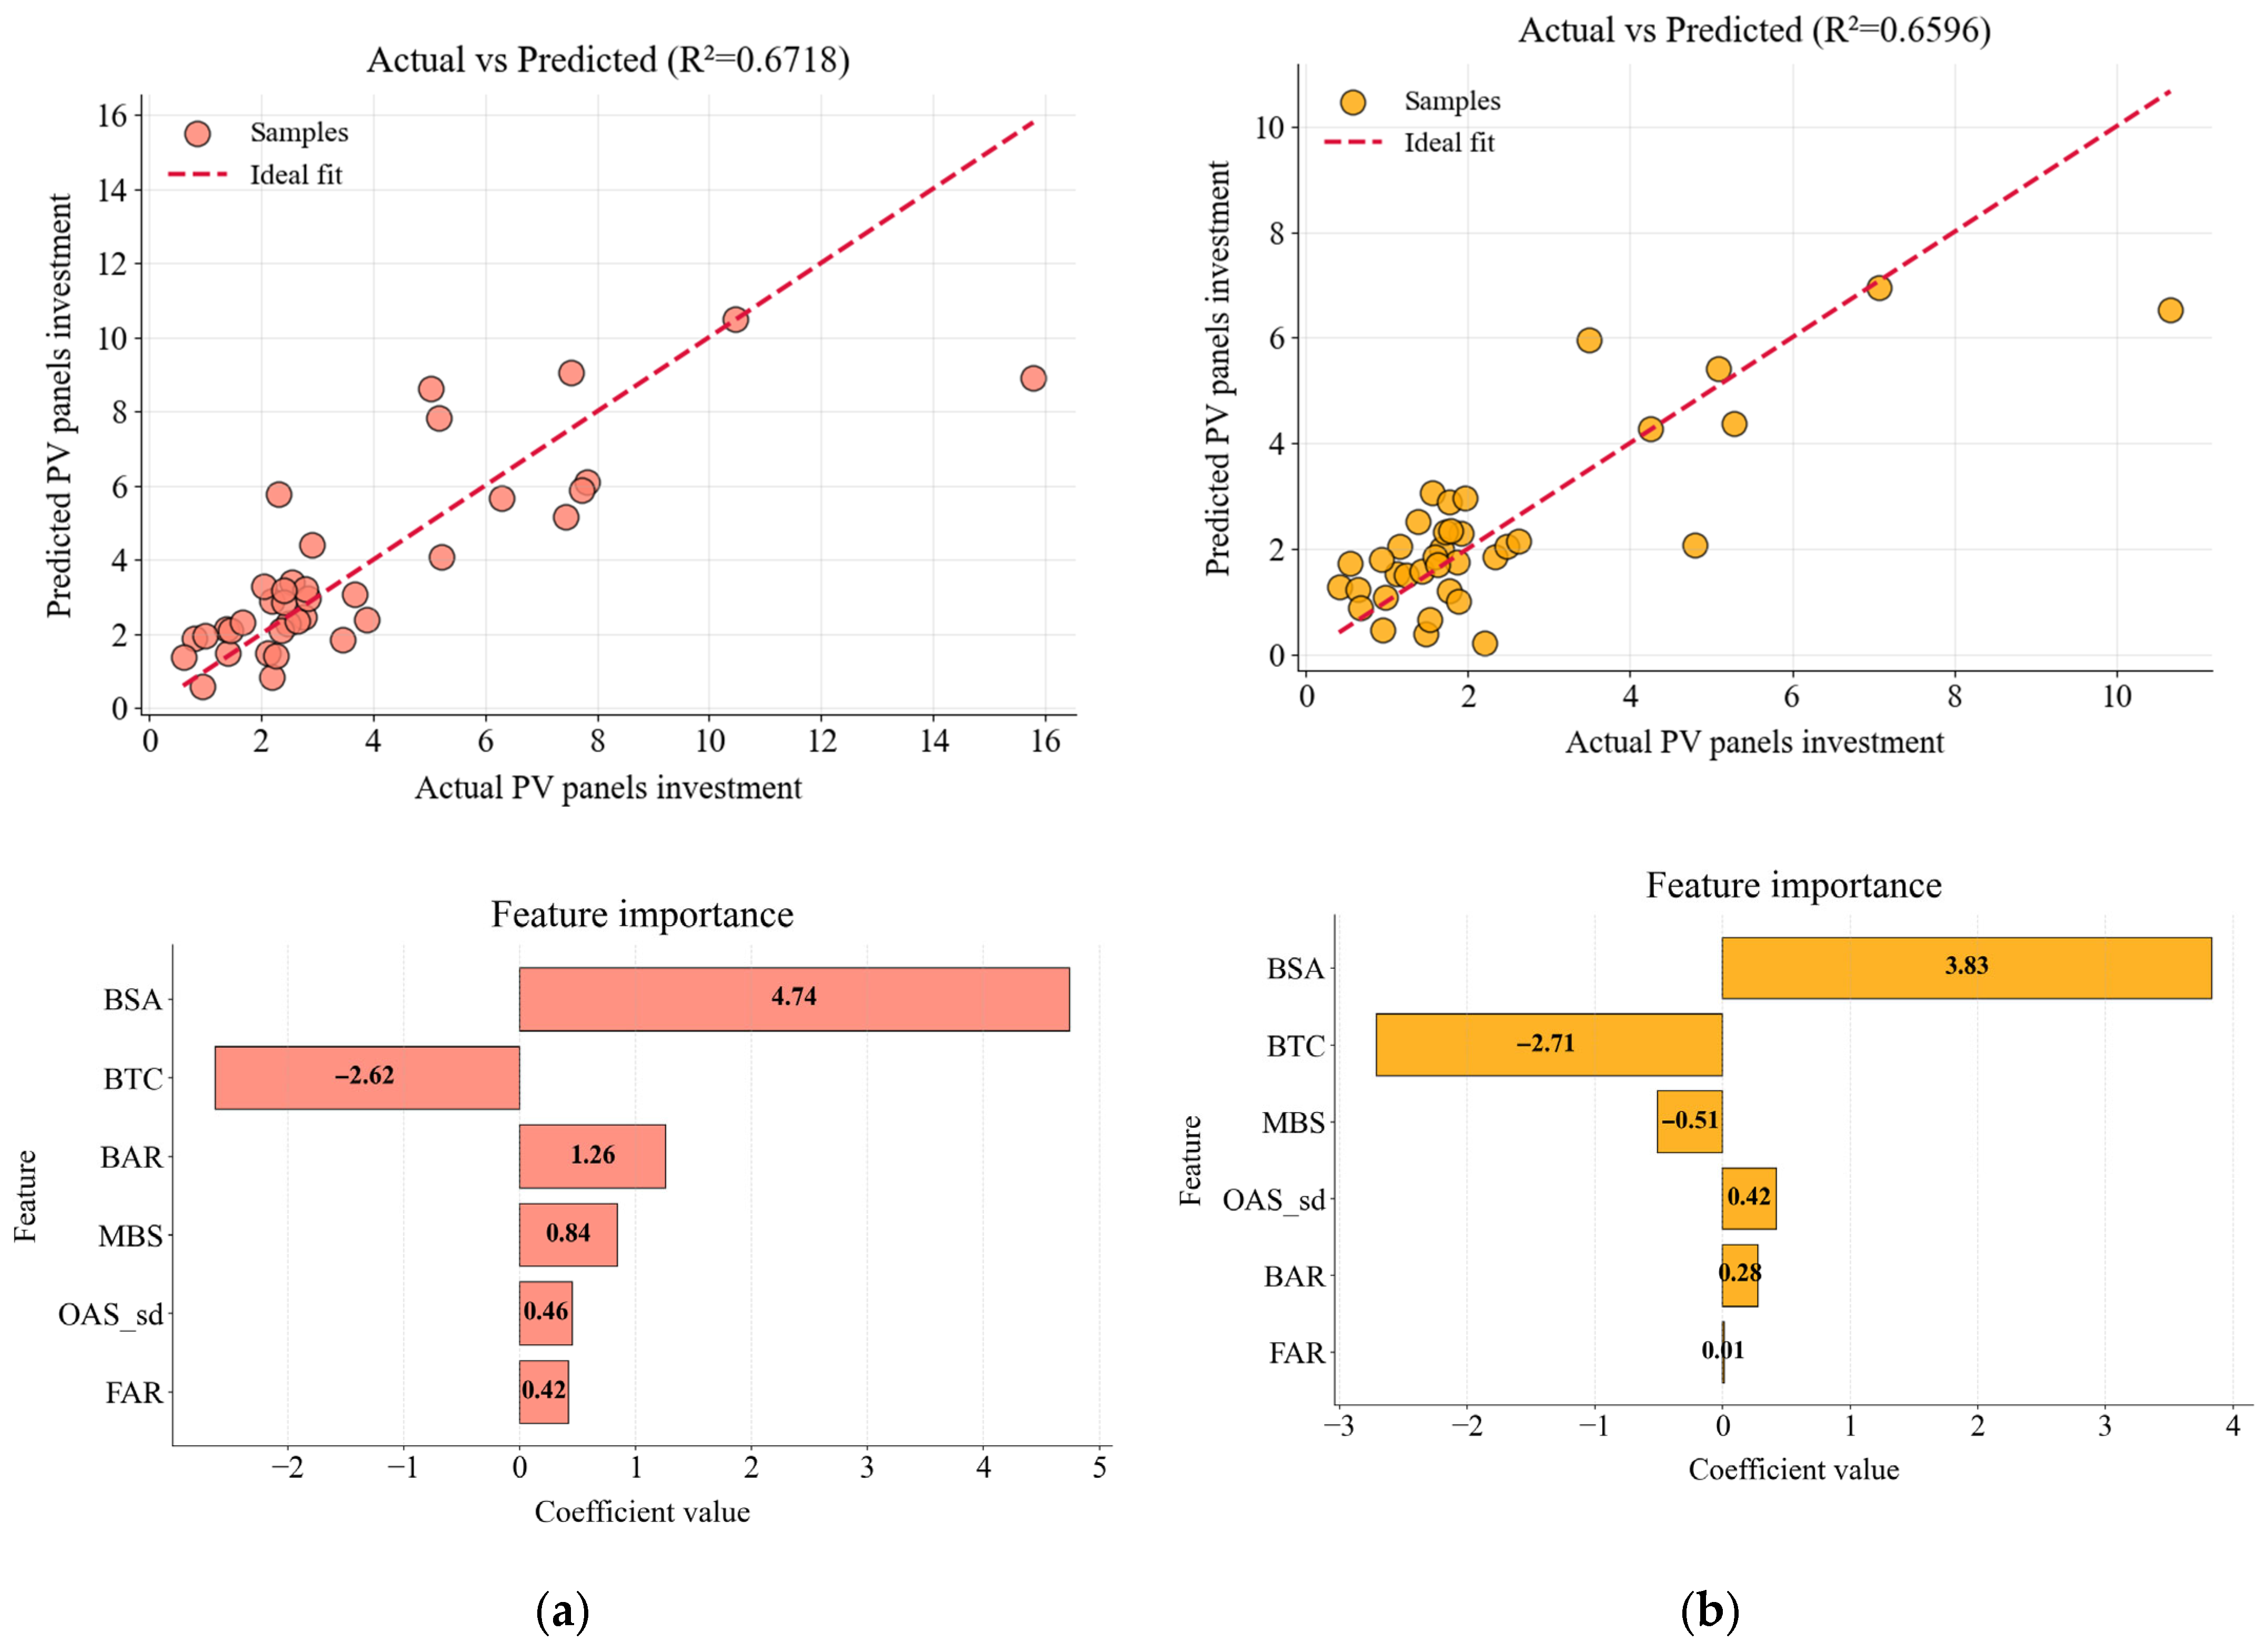
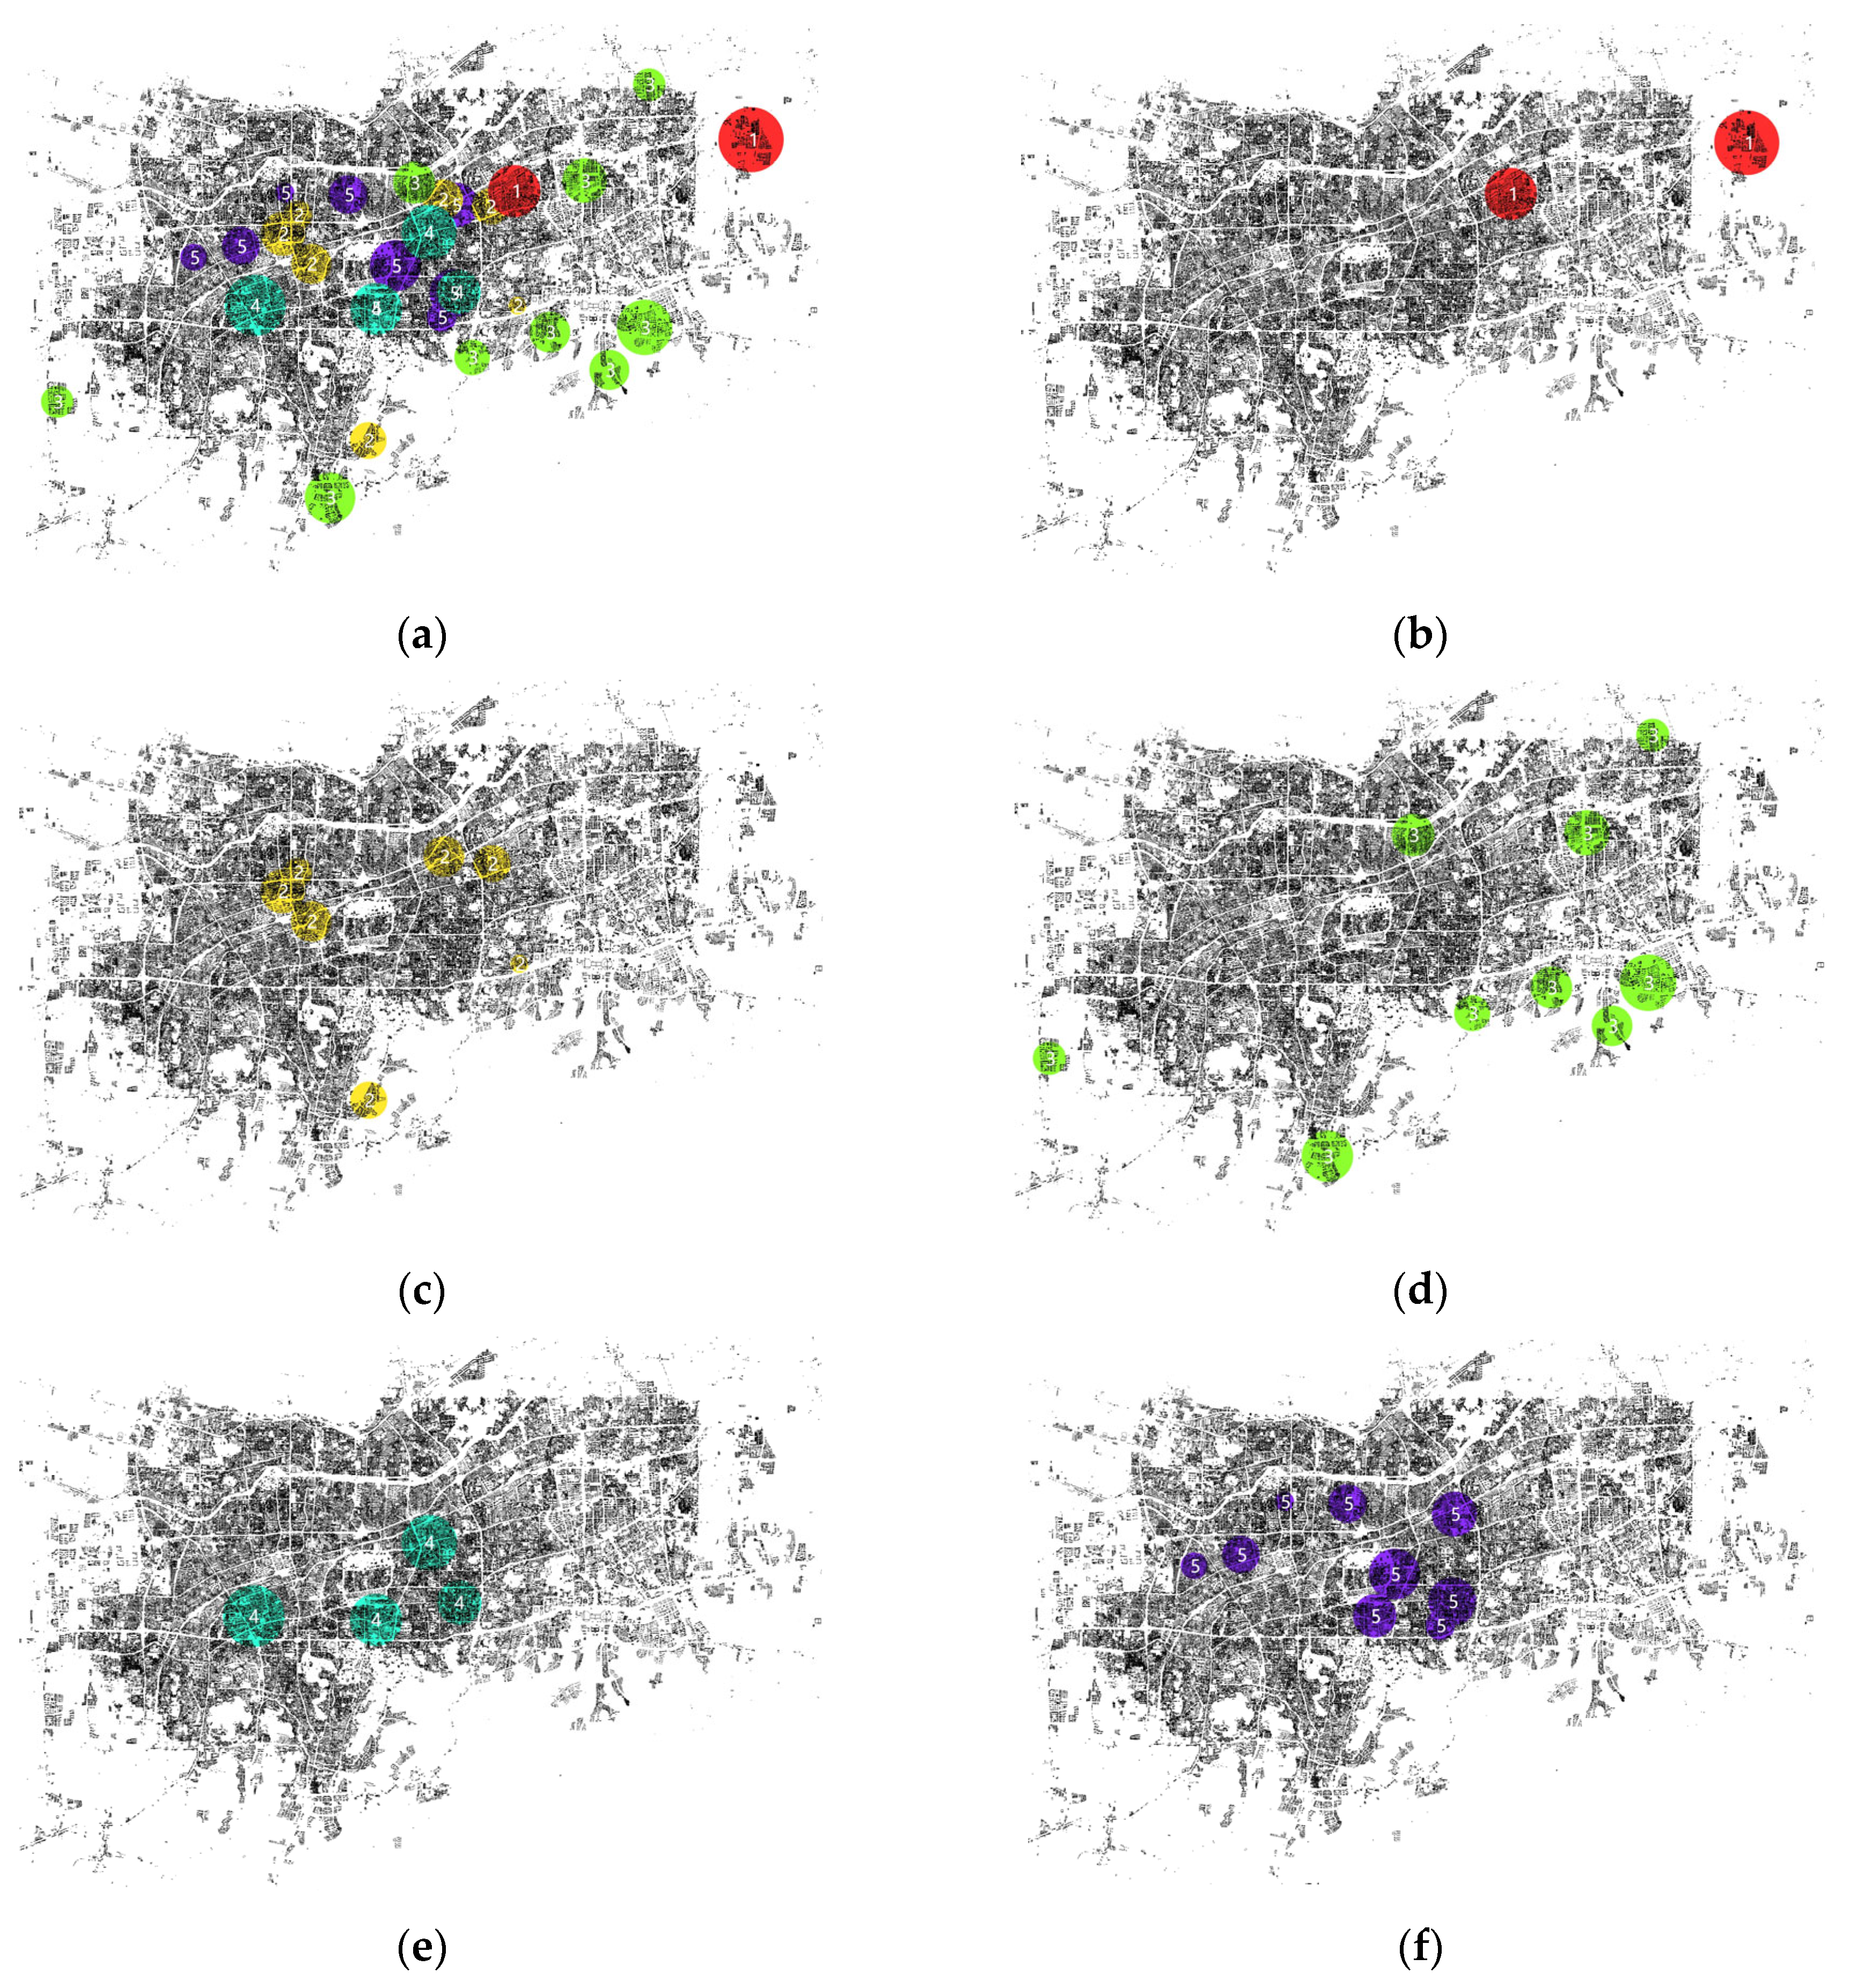
- Block differences: Six key morphological indicators effectively characterized block features, and clustering divided the samples into five typical types. Significant differences in PV potential were observed among different block types. Cluster 1 achieved the highest annual generation (61.76% above the average) but required 75.08% higher investment with a payback period of 3.54 years. Clusters 4 and 5 generated moderate output and achieved the shortest payback periods (2.91–2.97 years), showing better coordination between energy and economic performance.
- (2)
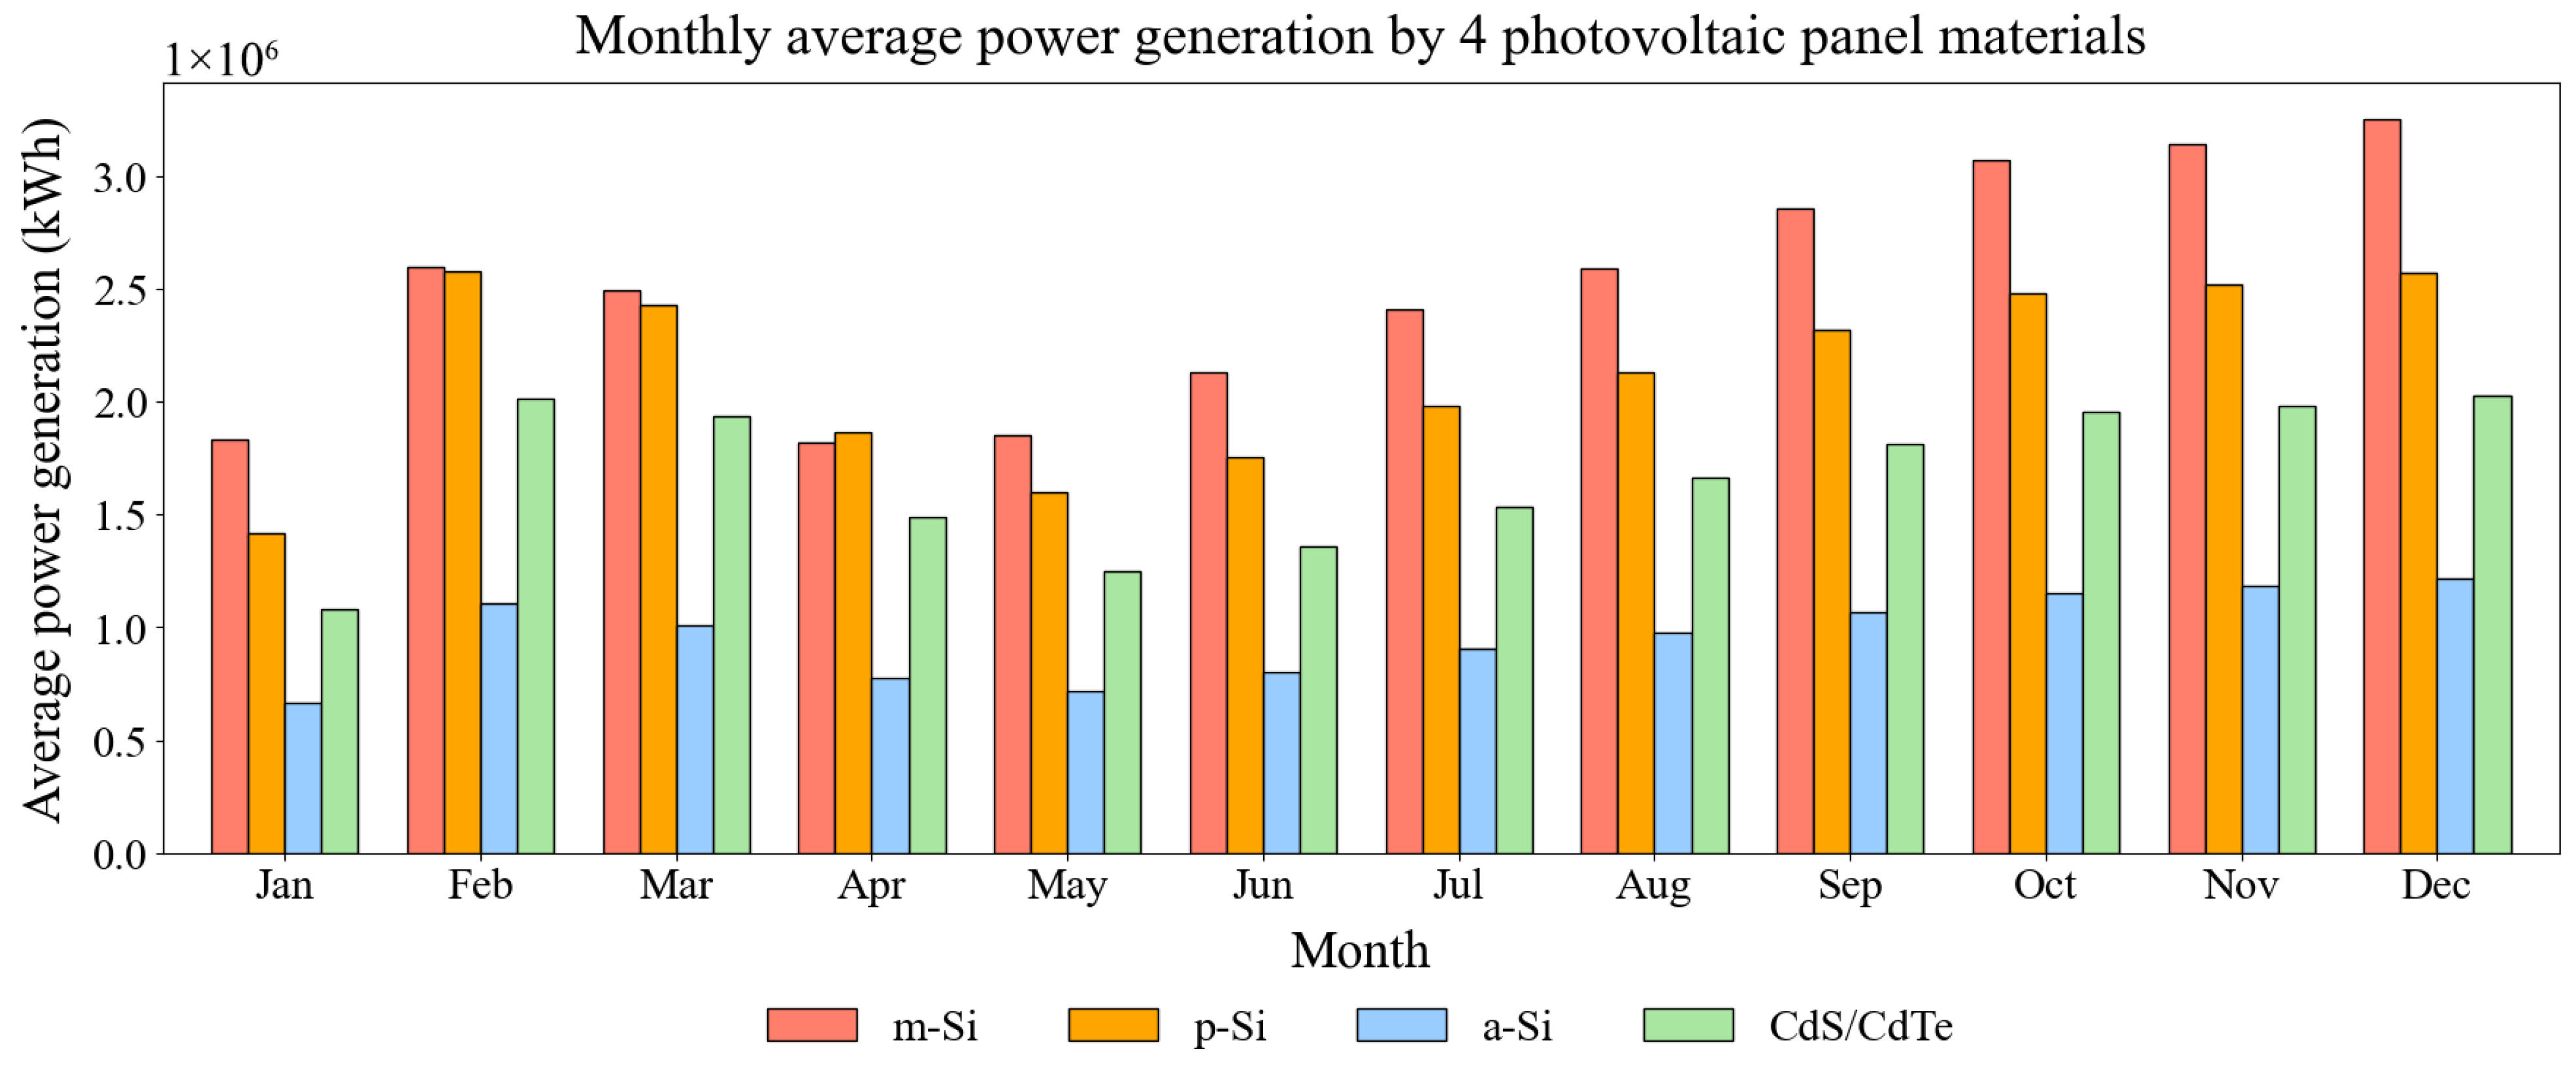
- Material selection: In terms of materials, m-Si is most suitable for scenarios pursuing maximum energy yield, while p-Si produced slightly lower output but reduced costs by 32.43% and shortened the payback period by 19.58%, making it more suitable for investment-sensitive projects.
- (3)
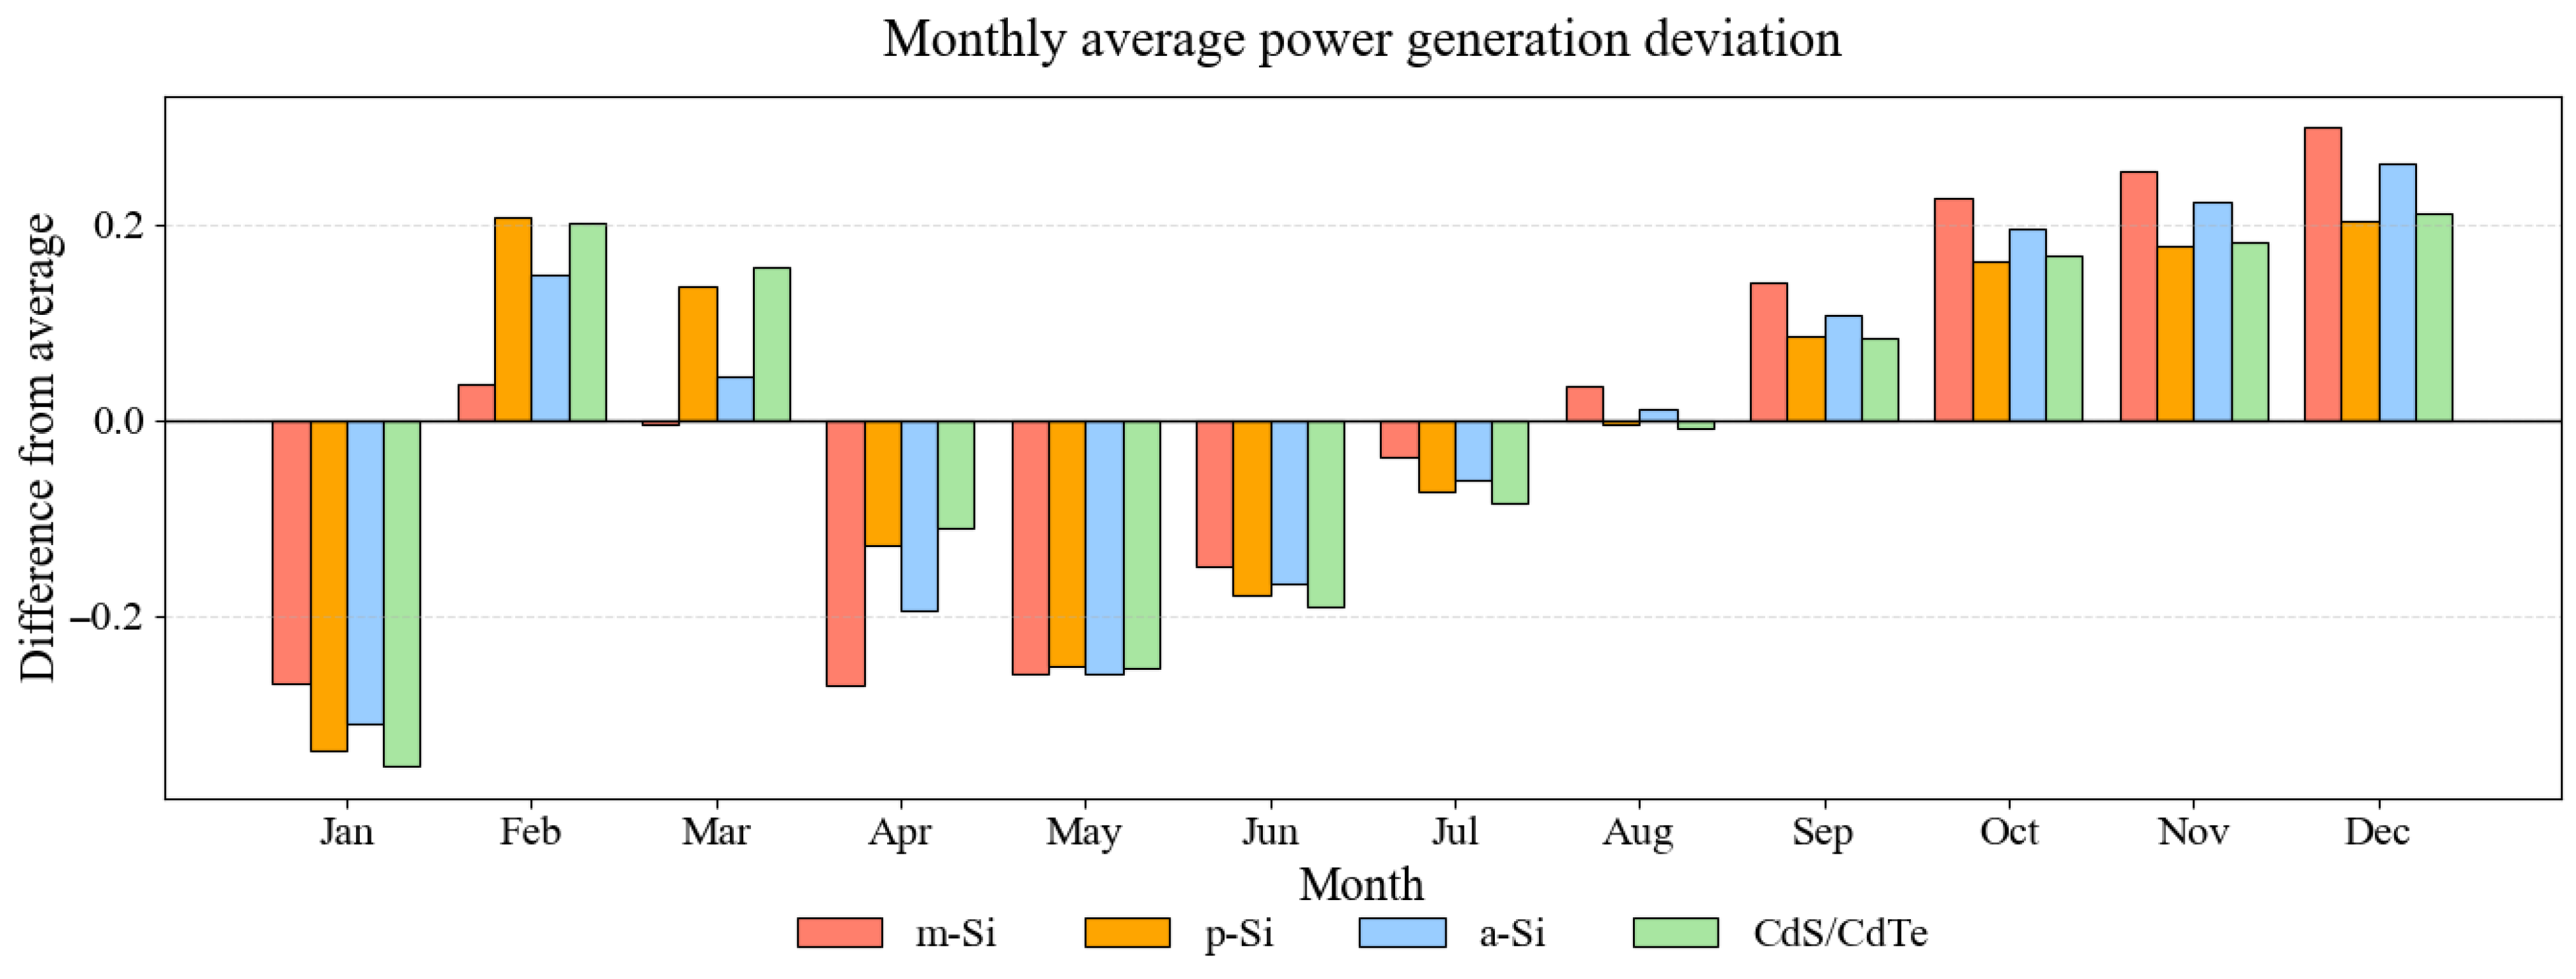
- Seasonal patterns: PV generation showed two peak periods throughout the year, namely February–March and September–December. These critical months should be the focus of grid operation and maintenance to ensure stable PV supply in cities.
- (4)
- Policy implications: The proposed assessment framework is applicable to the Jinan case and shows potential for application in other cities. With appropriate adjustment of local climate data, morphological indicators, and market conditions, it may serve as a reference for planners and contribute to urban energy transition and sustainable development.
Author Contributions
Funding
Data Availability Statement
Conflicts of Interest
Abbreviations
| PV | Photovoltaic |
| m-Si | Monocrystalline silicon |
| p-Si | Polycrystalline silicon |
| a-Si | Amorphous silicon |
| CdS/CdTe | Cadmium sulfide/cadmium telluride |
| TMY | Typical meteorological year |
| PCA | Principal component analysis |
| GMM | Gaussian mixture model |
| DBSCAN | Density-based cluster algorithm |
| SC | Spectral clustering |
| PR | Performance ratio |
| Building area | |
| Standard deviation of building area | |
| Building shape coefficient | |
| Minimum building spacing | |
| Building-to-center distance | |
| Standard deviation of building-to-center distance | |
| Building height | |
| Standard deviation of building height | |
| Orientation angle to south | |
| Standard deviation of orientation angle to south | |
| Building area ratio | |
| Floor area ratio | |
| Block site area | |
| Building number |
References
- Luo, Y.; He, J. Evaluating the heat island effect in a planned residential area using planning indicators. J. Build. Eng. 2021, 43, 102473. [Google Scholar] [CrossRef]
- Hassan, A.M.; Elmokadem, A.A.; Megahed, N.A.; Abo Eleinen, O.M. Urban morphology as a passive strategy in promoting outdoor air quality. J. Build. Eng. 2020, 29, 101204. [Google Scholar] [CrossRef]
- Wang, W.; Cheng, X.; Dai, M. Strategies for sustainable urban development and morphological optimization of street canyons: Measurement and simulation of PM2.5 at different points and heights. Sustain. Cities Soc. 2022, 87, 104191. [Google Scholar] [CrossRef]
- Wang, R.; Lu, S.; Feng, W. A novel improved model for building energy consumption prediction based on model integration. Appl. Energy 2020, 262, 114561. [Google Scholar] [CrossRef]
- Xu, X.; Ou, J.; Liu, P.; Liu, X.; Zhang, H. Investigating the impacts of three-dimensional spatial structures on CO2 emissions at the urban scale. Sci. Total Environ. 2021, 762, 143096. [Google Scholar] [CrossRef]
- Ascione, F.; Bianco, N.; De Stasio, C.; Mauro, G.M.; Vanoli, G.P. A new methodology for cost-optimal analysis by means of the multi-objective optimization of building energy performance. Energy Build. 2015, 88, 78–90. [Google Scholar] [CrossRef]
- Sarralde, J.J.; Quinn, D.J.; Wiesmann, D.; Steemers, K. Solar energy and urban morphology: Scenarios for increasing the renewable energy potential of neighbourhoods in London. Renew. Energy 2015, 73, 10–17. [Google Scholar] [CrossRef]
- Sanaieian, H.; Tenpierik, M.; Van Den Linden, K.; Seraj, F.M.; Shemrani, S.M.M. Review of the Impact of Urban Block Form on Thermal Performance, Solar Access and Ventilation. Renew. Sustain. Energy Rev. 2014, 38, 551–560. [Google Scholar] [CrossRef]
- Park, S.R.; Pandey, A.K.; Tyagi, V.V.; Tyagi, S.K. Energy and Exergy Analysis of Typical Renewable Energy Systems. Renew. Sustain. Energy Rev. 2014, 30, 105–123. [Google Scholar] [CrossRef]
- Ayadi, O.; Shadid, R.; Bani-Abdullah, A.; Alrbai, M.; Abu-Mualla, M.; Balah, N. Experimental comparison between Monocrystalline, Polycrystalline, and Thin-film solar systems under sunny climatic conditions. Energy Rep. 2022, 8, 218–230. [Google Scholar] [CrossRef]
- Xu, H.; Chen, H.; Zhou, X.; Wu, Y.; Liu, Y. Research on the relationship between urban morphology and air temperature based on mobile measurement: A case study in Wuhan, China. Urban Clim. 2020, 34, 100671. [Google Scholar] [CrossRef]
- Ichinose, T.; Lei, L.; Lin, Y. Impacts of shading effect from nearby buildings on heating and cooling energy consumption in hot summer and cold winter zone of China. Energy Build. 2017, 136, 199–210. [Google Scholar] [CrossRef]
- Bian, C.; Cheung, K.L.; Chen, X.; Lee, C.C. Integrating microclimate modelling with building energy simulation and solar photovoltaic potential estimation: The parametric analysis and optimization of urban design. Appl. Energy 2025, 380, 125062. [Google Scholar] [CrossRef]
- Tevis, R.; Schuster, N.; Evans, F.; Himmler, R.; Gheewala, S.H. A multi-scenario life cycle impact comparison of operational energy supply techniques for an office building in Thailand. Energy Build. 2019, 190, 172–182. [Google Scholar] [CrossRef]
- Deltenre, Q.; De Troyer, T.; Runacres, M.C. Performance assessment of hybrid PV-wind systems on high-rise rooftops in the Brussels-Capital Region. Energy Build. 2020, 224, 110137. [Google Scholar] [CrossRef]
- Lim, J.W.; Kim, H. Predicting the energy, economic, and environmental performance of next-generation photovoltaic technologies in residential buildings. Appl. Energy 2025, 390, 125895. [Google Scholar] [CrossRef]
- Bakmohammadi, P.; Narjabadifam, N.; Jamshidi, M.; Gül, M. A holistic framework to optimize embedding PV systems into building façades. Appl. Energy 2025, 382, 125288. [Google Scholar] [CrossRef]
- Tian, J.; Ooka, R. Prediction of building-scale solar energy potential in urban environment based on parametric modelling and machine learning algorithms. Sustain. Cities Soc. 2025, 119, 106057. [Google Scholar] [CrossRef]
- Xu, S.; Jiang, H.; Xiong, F.; Zhang, C.; Xie, M.; Li, Z. Evaluation for block-scale solar energy potential of industrial block and optimization of application strategies: A case study of Wuhan, China. Sustain. Cities Soc. 2021, 72, 103000. [Google Scholar] [CrossRef]
- Xie, M.; Wang, M.; Zhong, H.; Li, X.; Li, B.; Mendis, T.; Xu, S. The impact of urban morphology on the building energy consumption and solar energy generation potential of university dormitory blocks. Sustain. Cities Soc. 2023, 96, 104644. [Google Scholar] [CrossRef]
- Liu, K.; Xu, X.; Zhang, R.; Kong, L.; Wang, W.; Deng, W. Impact of urban form on building energy consumption and solar energy potential: A case study of residential blocks in Jianhu, China. Energy Build. 2023, 280, 112727. [Google Scholar] [CrossRef]
- Yang, Y.; Hsieh, C.-M.; Wu, X.-Y. How the urban morphology affects the suitable solar energy techniques and performance: A block-scale study based on the typological method in Macau. Sol. Energy 2024, 275, 112620. [Google Scholar] [CrossRef]
- Tang, H.; Chai, X.; Jing, W.; Li, Y.; Li, C. Assessment of photovoltaic power generation and radiative cooling potentials in old residential districts: A case study of Shenzhen. Energy Build. 2024, 319, 114493. [Google Scholar] [CrossRef]
- Tang, H.; Chai, X.; Chen, J.; Wan, Y.; Wang, Y.; Wan, W.; Li, C. Assessment of BIPV power generation potential at the city scale based on local climate zones: Combining physical simulation, machine learning and 3D building models. Renew. Energy 2025, 244, 122688. [Google Scholar] [CrossRef]
- Li, G.; Chen, Y.; He, Q.; Wang, M.; Liu, H.; Xu, S. The comprehensive impact of urban morphology on the photovoltaic power generation potential of block-scale office buildings: Real blocks and design benchmarks. Sol. Energy 2025, 287, 113248. [Google Scholar] [CrossRef]
- Li, X.; Cheng, S.; Lv, Z.; Song, H.; Jia, T.; Lu, N. Data analytics of urban fabric metrics for smart cities. Future Gener. Comput. Syst. 2020, 107, 871–882. [Google Scholar] [CrossRef]
- Pigliautile, I.; Pisello, A.L. Environmental data clustering analysis through wearable sensing techniques: New bottom-up process aimed to identify intra-urban granular morphologies from pedestrian transects. Build. Environ. 2020, 171, 106641. [Google Scholar] [CrossRef]
- Shen, P.; Wang, M.; Liu, J.; Ji, Y. Hourly air temperature projection in future urban area by coupling climate change and urban heat island effect. Energy Build. 2023, 279, 112676. [Google Scholar] [CrossRef]
- Qu, B.; Ma, J. From blocks to cities: Morphology structure rooted in 3D patterns and forming clusters at the block level. Front. Archit. Res. 2023, 12, 1127–1143. [Google Scholar] [CrossRef]
- Wu, Y.; Chen, H. The diffusion of traffic pollutants in different residential blocks based on spatial morphological clustering. Build. Environ. 2023, 228, 109860. [Google Scholar] [CrossRef]
- Xu, S.; Sang, M.; Xie, M.; Xiong, F.; Mendis, T.; Xiang, X. Influence of urban morphological factors on building energy consumption combined with photovoltaic potential: A case study of residential blocks in central China. Build. Simul. 2023, 16, 1777–1792. [Google Scholar] [CrossRef]
- Liu, J.; Deguchi, A. The mechanism of block form diversification in urban morphological transformation: Case study of grid blocks in Beijing, China. Front. Archit. Res. 2024, 13, 928–943. [Google Scholar] [CrossRef]
- Xijing, S.; Luyun, L.; Pei, Y.; Cunyou, C.; Minhuan, Z. Morphological spatial clustering of high-density central areas and their coupling relationship with thermal environment—A case study of the wuyi road hatchback in changsha. Int. J. Biometeorol. 2024, 68, 1483–1496. [Google Scholar] [CrossRef]
- Zhu, S.; Yan, Y.; Zhao, B.; Wang, H. Assessing the impact of adjacent urban morphology on street temperature: A multisource analysis using random forest and SHAP. Build. Environ. 2025, 267, 112326. [Google Scholar] [CrossRef]
- Ha, Y.; Kim, H. COVID-19 and urban vitality: The association between built environment elements and changes in local points of interest using social media data in South Korea. Sustain. Cities Soc. 2025, 123, 106271. [Google Scholar] [CrossRef]
- Karlı, M.; Terzi, F. Modelling the energy footprint of urban form in Istanbul: A big data and machine learning approach. Energy Build. 2025, 333, 115495. [Google Scholar] [CrossRef]
- Zhang, J.; Xu, L.; Shabunko, V.; Tay, S.E.R.; Sun, H.; Lau, S.S.Y.; Reindl, T. Impact of urban block typology on building solar potential and energy use efficiency in tropical high-density city. Appl. Energy 2019, 240, 513–533. [Google Scholar] [CrossRef]
- Rosado, P.J.; Ban-Weiss, G.; Mohegh, A.; Levinson, R.M. Influence of street setbacks on solar reflection and air cooling by reflective streets in urban canyons. Sol. Energy 2017, 144, 144–157. [Google Scholar] [CrossRef]
- Yang, F.; Qian, F.; Lau, S.S.Y. Urban form and density as indicators for summertime outdoor ventilation potential: A case study on high-rise housing in Shanghai. Build. Environ. 2013, 70, 122–137. [Google Scholar] [CrossRef]
- Morganti, M.; Salvati, A.; Coch, H.; Cecere, C. Urban Morphology Indicators for Solar Energy Analysis. Energy Procedia 2017, 134, 807–814. [Google Scholar] [CrossRef]
- Ma, R.; Li, X.; Chen, J. An elastic urban morpho-blocks (EUM) modeling method for urban building morphological analysis and feature clustering. Build. Environ. 2021, 192, 107646. [Google Scholar] [CrossRef]
- Zhang, L.; Wen, J. A systematic feature selection procedure for short-term data-driven building energy forecasting model development. Energy Build. 2019, 183, 428–442. [Google Scholar] [CrossRef]
- Yuan, L.; Tang, S.; Zhang, J.; Wan, Y.; Huang, Z.; Tian, M. Investigating the nonlinear relationship between urban morphology and PM2.5 in perspective of urban development zoning. Urban Clim. 2025, 62, 102510. [Google Scholar] [CrossRef]
- Du, P.; Li, F.; Shao, J. Multi-agent reinforcement learning clustering algorithm based on silhouette coefficient. Neurocomputing 2024, 596, 127901. [Google Scholar] [CrossRef]
- Ros, F.; Riad, R.; Guillaume, S. PDBI: A partitioning Davies-Bouldin index for clustering evaluation. Neurocomputing 2023, 528, 178–199. [Google Scholar] [CrossRef]
- Perez, R.; Seals, R.; Michalsky, J. All-Weather Model for Sky Luminance Distribution—Preliminary Configuration and Validation. Sol. Energy 1993, 50, 235–245. [Google Scholar] [CrossRef]
- ASTM E1918-06(2015); Standard Test Method for Measuring Solar Reflectance of Horizontal and Low-Sloped Surfaces in the Field. ASTM International: West Conshohocken, PA, USA, 2015.
- Reindl, D.T.; Beckman, W.A.; Duffie, J.A. Evaluation of Hourly Tilted Surface Radiation Models. Sol. Energy 1990, 45, 9–17. [Google Scholar] [CrossRef]
- ASTM E490-00a(2019); Standard Solar Constant and Zero Air Mass Solar Spectral Irradiance Tables. ASTM International: West Conshohocken, PA, USA, 2019.
- GB 50797-2012; Code for Design of Photovoltaic Power Stations. Ministry of Housing and Urban-Rural Development of the People’s Republic of China, General Administration of Quality Supervision, Inspection and Quarantine: Beijing, China, 2012.
- GB/T 51368-2019; Technical Standard for Application of Building Integrated Photovoltaic. Ministry of Housing and Urban-Rural Development of the People’s Republic of China: Beijing, China, 2019.
- Natanian, J.; Wortmann, T. Simplified evaluation metrics for generative energy-driven urban design: A morphological study of residential blocks in Tel Aviv. Energy Build. 2021, 240, 110916. [Google Scholar] [CrossRef]
- Kumar, M.; Kumar, A. Performance assessment and degradation analysis of solar photovoltaic technologies: A review. Renew. Sustain. Energy Rev. 2017, 78, 554–587. [Google Scholar] [CrossRef]
- Liu, Y.; Singleton, A.; Arribas-bel, D.; Chen, M. Identifying and understanding road-constrained areas of interest (AOIs) through spatiotemporal taxi GPS data: A case study in New York City. Comput. Environ. Urban Syst. 2021, 86, 101592. [Google Scholar] [CrossRef]
- Zheng, H.; Yuan, P.F. A generative architectural and urban design method through artificial neural networks. Build. Environ. 2021, 205, 108178. [Google Scholar] [CrossRef]
- Beauchemin, M. On affinity matrix normalization for graph cuts and spectral clustering. Pattern Recognit. Lett. 2015, 68, 90–96. [Google Scholar] [CrossRef]
- van der Maaten, L.J.P.; Hinton, G.E. Visualizing Data Using t-SNE. J. Mach. Learn. Res. 2008, 9, 2579–2605. [Google Scholar]
- Zheng, Y.; Ge, Y.; Muhsen, S.; Wang, S.; Elkamchouchi, D.H.; Ali, E.; Ali, H.E. New ridge regression, artificial neural networks and support vector machine for wind speed prediction. Adv. Eng. Softw. 2023, 179, 103426. [Google Scholar] [CrossRef]






| Authors | Study Area | Research Direction | Performance Evaluation | Research Methods | Morphological Indicators |
|---|---|---|---|---|---|
| This work | Jinan, China | Solar PV potential | PV power generation, Solar income, PV panel cost, PV payback period | Principal component analysis (PCA), Gaussian mixture model (GMM), Density-based cluster algorithm (DBSCAN), Spectral clustering (SC), K-means | Building area ratio (BAR), Block site area (BSA), Minimum spacing between buildings (MBS), Floor area ratio (FAR), Standard deviation of average orientation angle of buildings to the south (OASsd), Average building-to-block-center distance (BTC) |
| [26] | Wuhan, China | Urban texture recognition | - | PCA,K-means | BSA, FAR, Average building area (BA), Standard deviation of BA (BAsd), Building coverage ratio (Rbc), Average building height (BH), Number of buildings (BN), Building compactness (BC), Fineness, Cohesion |
| [27] | Crete, Greece; Gubbio, Italy; New York, USA | Urban microclimate | Environmental indicators | K-means | FAR, BH, Sky-view-factor (SVF), Aspect ratio |
| [28] | Shenzhen, China | Urban microclimate | Heating degree days, Cooling degree days | PCA, GMM | BSA, BH, Characteristic length, Block site perimeter, Building volume, Building surface area |
| [29] | Nanjing, Shanghai, Hangzhou, Suzhou, China | Urban socioeconomic level | City ranking, Gross domestic product | T-distributed stochastic neighbor embedding | Vertical spatial density, Boundary complexity, Scale diversity, Building type uncertainty, Building mass dispersion |
| [30] | Wuhan, China | Urban traffic pollution | Pollutant concentration, Fluxes, Pollution removal | PCA,K-means | FAR, BH, Rbc, BAsd, BTC, MBS, Standard deviation of BH (BHsd), Block shape factor (Fblock), Average windward area ratio (WD) |
| [31] | Wuhan, China | Urban energy consumption | Energy use intensity (EUI), PV-adjusted energy use intensity (EUI-PV), PV substitution rate (PSR) | K-means | FAR, BH, Fblock, SVF, Building density (D), Block length, Block width, Block orientation, Height-to-width ratio |
| [32] | Beijing, China | Urban morphology analysis | Trends of morphological indicators | Ward’s hierarchical clustering | FAR, BSA, Fblock, Rbc, BAsd, Network density, Plot shape regularity |
| [33] | Changsha, China | Urban thermal environment | Mean air temperature | K-means | D, Fblock, FAR, BH, WD, SVF, Green space ratio (GCR), Impervious surface ratio, Building height otherness, Points of interest (POI) |
| [34] | Nanjing, China | Urban thermal environment | Land surface temperature | K-means | BH, D, GCR |
| [35] | Seoul, Republic of Korea | Urban vitality assessment | POI | DBSCAN | Density, Land use, Street connectivity, Public transportation |
| [36] | Istanbul, Turkey | Urban energy consumption | EUI | K-means | BC, BA, FAR, Total floor area, Building elongation ratio, Open space ratio, Average distance to neighboring buildings |
| District | Location Within Urban Core | Area (km2) | Population (Year) | Key Functional Attributes |
|---|---|---|---|---|
| Lixia | Eastern core, adjacent to Licheng (E/N), Shizhong (S), Tianqiao (W) | 100.89 | 0.82 million (2020) | Economic & cultural epicenter; Provincial government seat |
| Shizhong | South-central core; borders Lixia (E/N), Changqing (SW), Huaiyin (W) | 281.49 | 0.91 million (2022) | Historic urban center with conserved traditional blocks |
| Huaiyin | Western core; connects Shizhong (E/S), borders Qihe County across Yellow River (W) | 151.48 | 0.69 million (2022) | Emerging high-rise development zone |
| Tianqiao | Northern core: links Shizhong/Huaiyin (S), spans Yellow River (N) | 261.92 | 0.73 million (2024) | Hybrid industrial-commercial cluster |
| Licheng | Eastern periphery; adjoins Lixia (W), Zhangqiu District (E) | 1301.32 | 1.13 million (2024) | Dominant emerging residential-commercial expansion area |
| Nomenclature | Formula | Describe | Unit |
|---|---|---|---|
| building. is the number of buildings in the block. | |||
| is the average building area in the block. | |||
| building. building. | None | ||
| is the minimum spacing value between a single building and all its adjacent buildings. | m | ||
| building to the block center. | m | ||
| is the average distance from buildings within the block to the block center. | m | ||
| building. | m | ||
| the average height of buildings in the block. | m | ||
| building and true north. | ° | ||
| is the average angle between the main facades of buildings and true north. | ° | ||
| is the block site area. | None | ||
| is the floor height of buildings, set at 3 m. | None | ||
| None | None | ||
| None | None | None |
| Algorithm | Type | Key Mechanism | Limitations |
|---|---|---|---|
| K-means | Centroid-based | Optimized centroid initialization via seeding | Spherical cluster assumption |
| GMM (Gaussian mixture model) | Probabilistic | Expectation-Maximization fitting of Gaussian distributions | Requires predefined component count |
| DBSCAN Density-based cluster algorithm | Density-based | Eps-neighborhood connectivity with noise filtering | Sensitive to density parameters |
| SC Spectral clustering | Graph-based | Laplacian eigen-decomposition for manifold separation | Computational complexity |
| Module Type | Installation Cost (¥/m2) | Cost Benchmark (¥/m2) | Threshold Irradiance (W/m2) | Irradiance Benchmark (W/m2) | (%) | Benchmark (%) |
|---|---|---|---|---|---|---|
| m-Si | 1050–1500 | 1275 | 100 | 100 | 18–24 | 22 |
| p-Si | 400–600 | 500 | 120 | 120 | 15-20 | 17 |
| a-Si | 140–560 | 350 | 50–100 | 75 | 6–10 | 8 |
| CdS/CdTe | 250–300 | 275 | 50–80 | 65 | 9–16 | 13 |
Disclaimer/Publisher’s Note: The statements, opinions and data contained in all publications are solely those of the individual author(s) and contributor(s) and not of MDPI and/or the editor(s). MDPI and/or the editor(s) disclaim responsibility for any injury to people or property resulting from any ideas, methods, instructions or products referred to in the content. |
© 2025 by the authors. Licensee MDPI, Basel, Switzerland. This article is an open access article distributed under the terms and conditions of the Creative Commons Attribution (CC BY) license (https://creativecommons.org/licenses/by/4.0/).
Share and Cite
Cui, Y.; Zhang, H.; Cai, H. Solar PV Potential Assessment of Urban Typical Blocks via Spatial Morphological Quantification and Numerical Simulation: A Case Study of Jinan, China. Buildings 2025, 15, 3115. https://doi.org/10.3390/buildings15173115
Cui Y, Zhang H, Cai H. Solar PV Potential Assessment of Urban Typical Blocks via Spatial Morphological Quantification and Numerical Simulation: A Case Study of Jinan, China. Buildings. 2025; 15(17):3115. https://doi.org/10.3390/buildings15173115
Chicago/Turabian StyleCui, Yanqiu, Hangyue Zhang, and Hongbin Cai. 2025. "Solar PV Potential Assessment of Urban Typical Blocks via Spatial Morphological Quantification and Numerical Simulation: A Case Study of Jinan, China" Buildings 15, no. 17: 3115. https://doi.org/10.3390/buildings15173115
APA StyleCui, Y., Zhang, H., & Cai, H. (2025). Solar PV Potential Assessment of Urban Typical Blocks via Spatial Morphological Quantification and Numerical Simulation: A Case Study of Jinan, China. Buildings, 15(17), 3115. https://doi.org/10.3390/buildings15173115


