The Functional Transformation of Green Belts: Research on Spatial Spillover of Recreational Services in Shanghai’s Ecological Park Belt
Abstract
1. Introduction
2. Data
2.1. Study Area
2.2. Data Collection
2.2.1. Data Sources
2.2.2. Recreation Service Evaluation
3. Research Method
3.1. Identification of Recreation Service Core Areas
3.2. Spillover Effects Analysis
3.2.1. Spatial Autocorrelation Analysis
3.2.2. Spatial Econometric Models
4. Results
4.1. Evolution of Recreational Service Supply and the Scope of the Core Area
4.1.1. Evolution of Recreational Service Supply and Its Growth Rate
- (1)
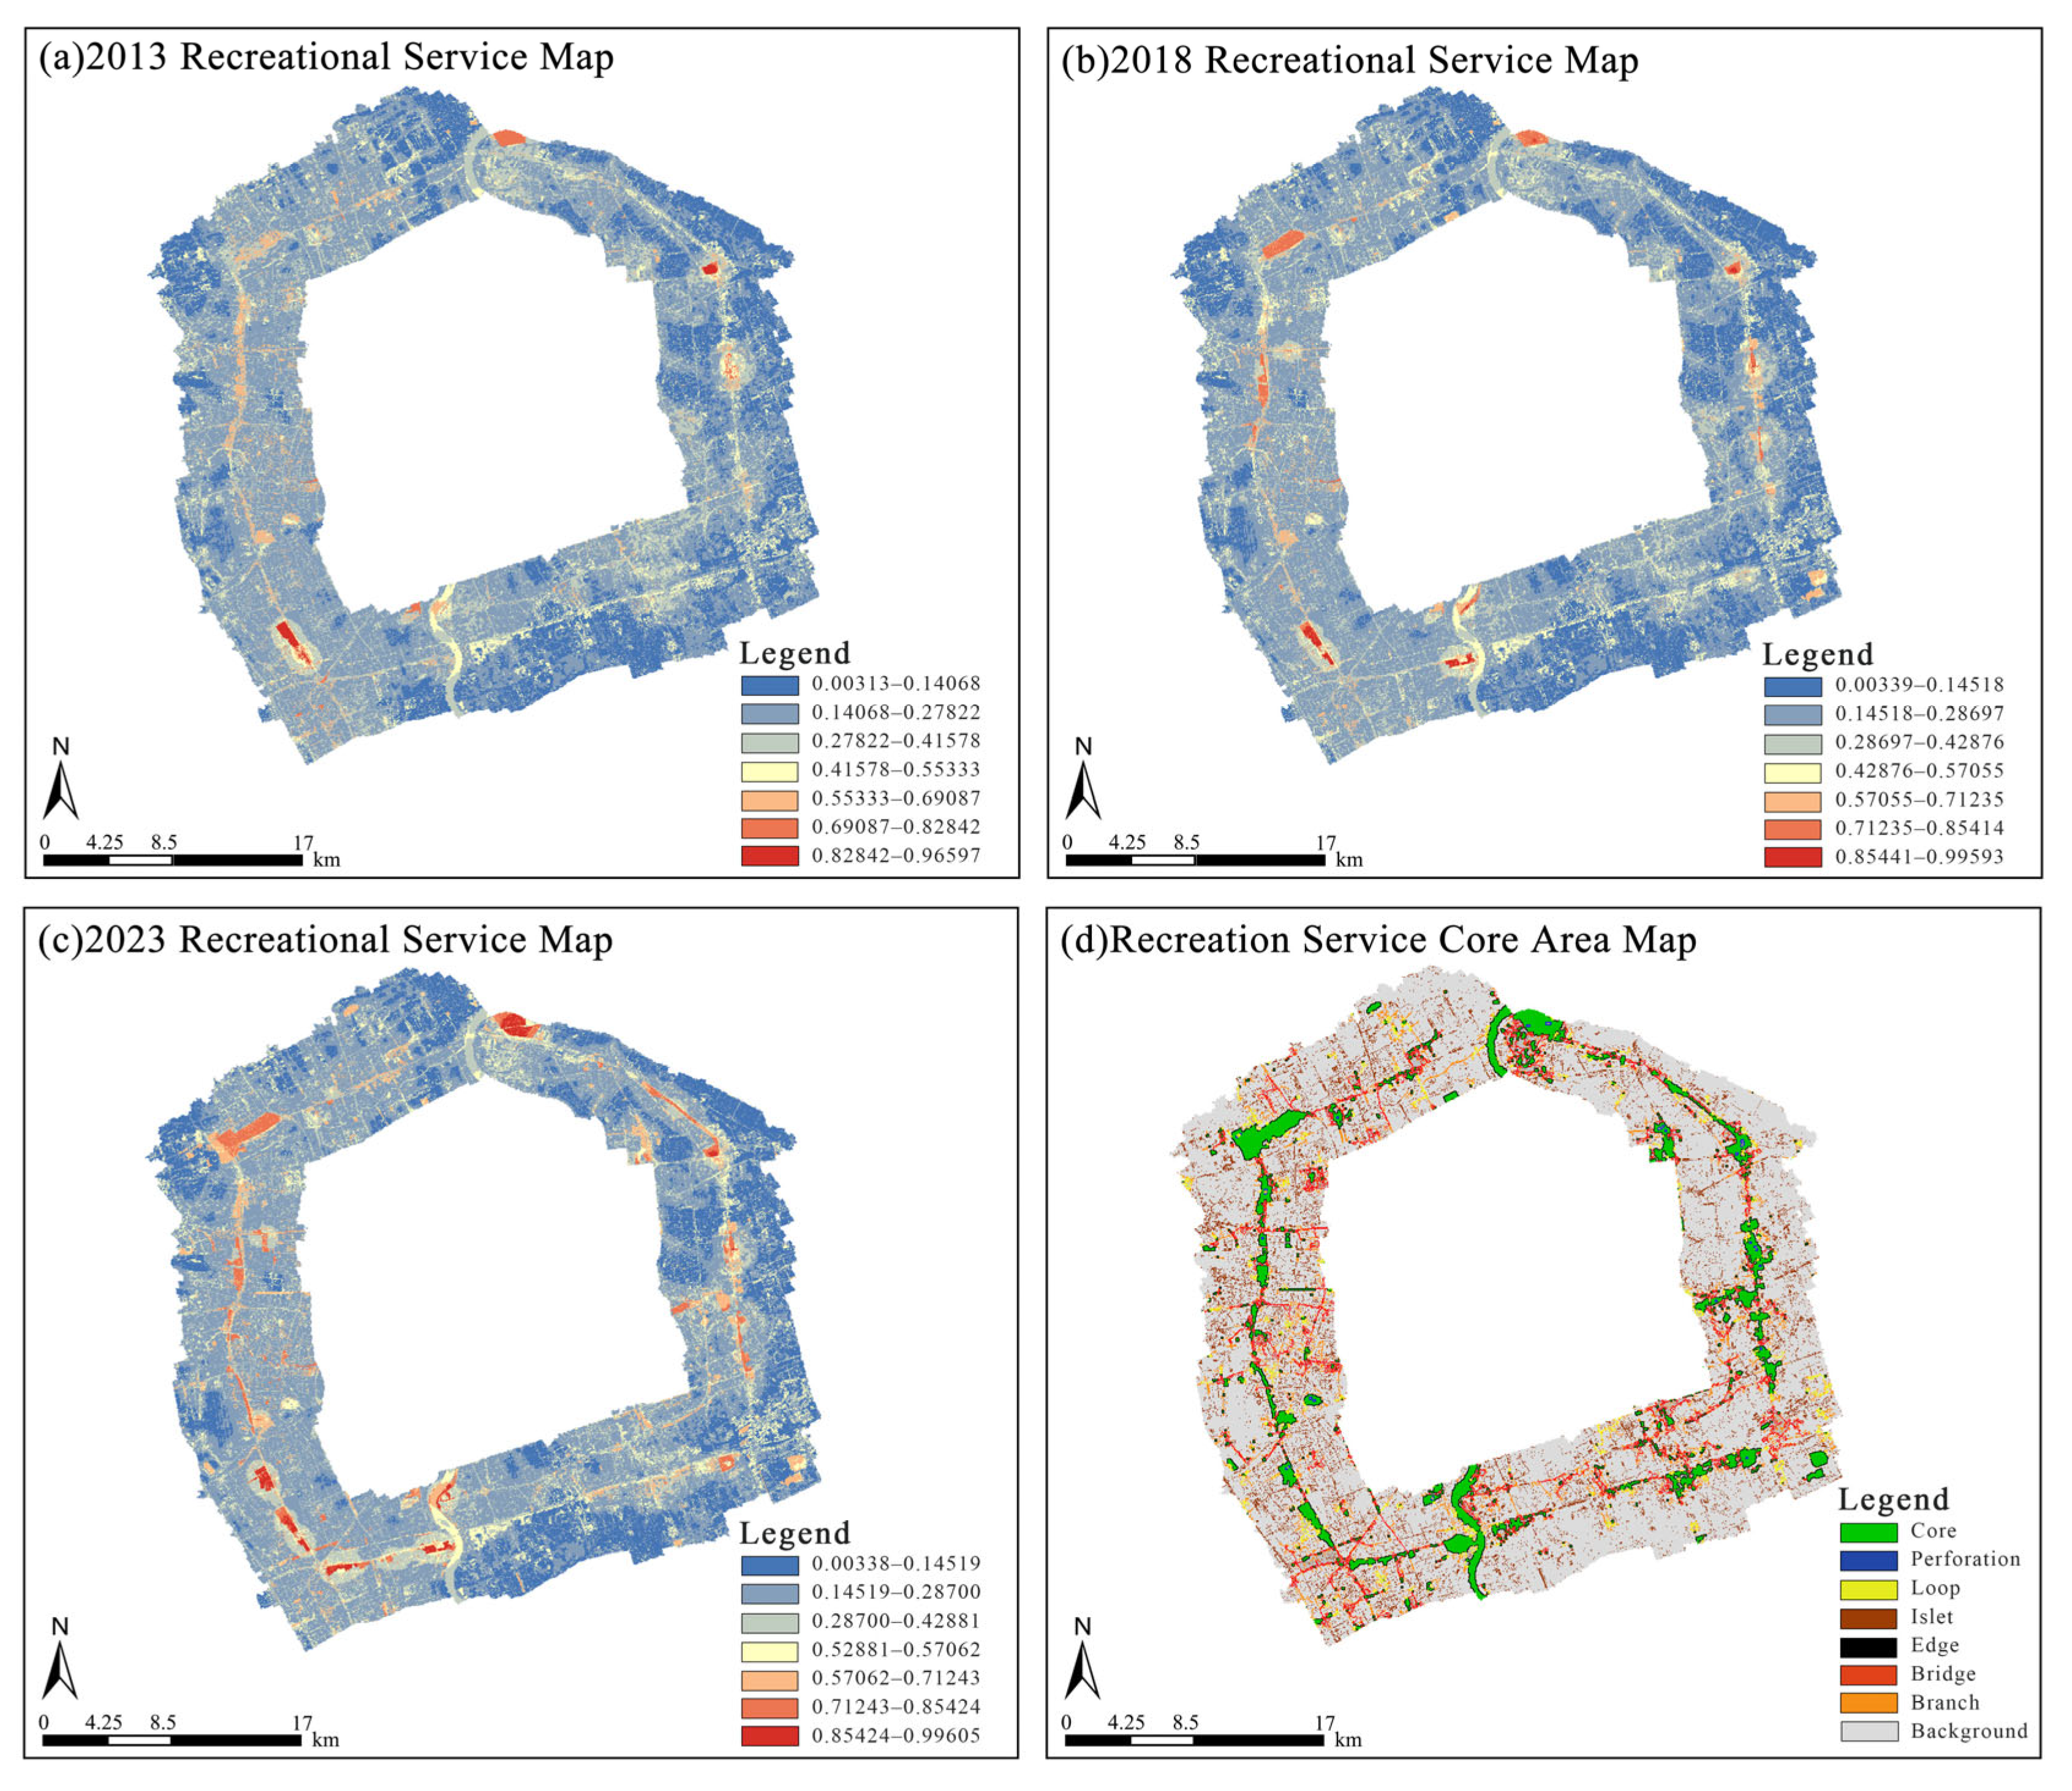
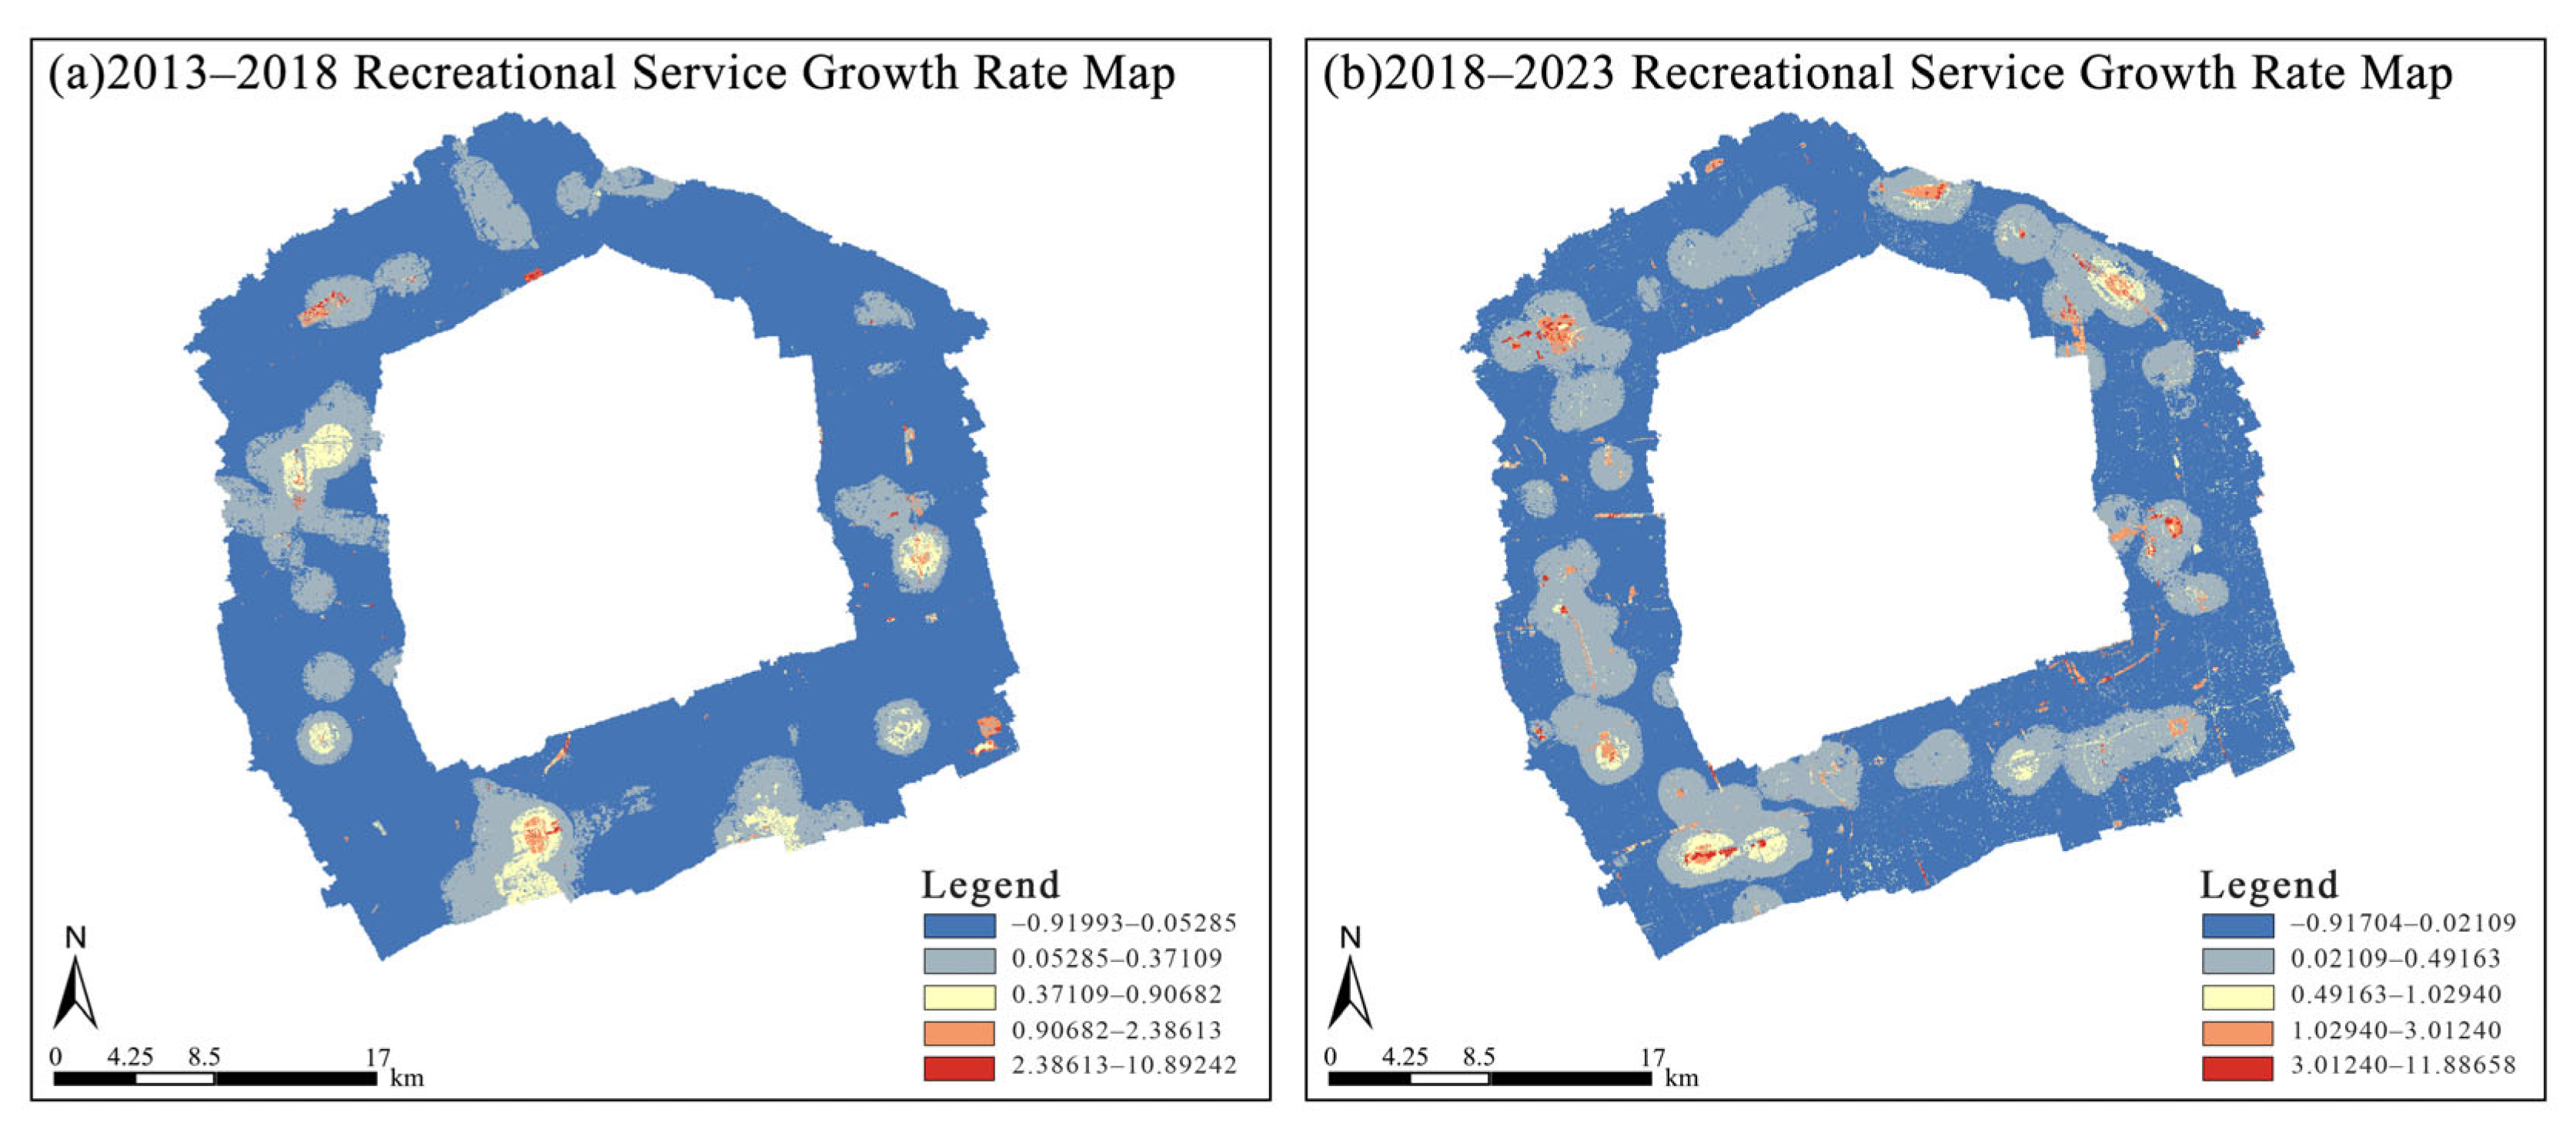
- During the implementation of green belt ecological projects, recreational services in the outer-ring area showed higher levels in the west than east, with significantly better performance along the belt than surrounding areas, exhibiting scattered growth. In 2013, the average service level was 0.234, with few and dispersed parks along the belt. High-value clusters concentrated in the southwest and northeast, while the western section, benefiting from proximity to sub-centers and metro stations, demonstrated more continuous and superior services. By 2018, the green belt was nearly connected, with ecological projects largely completed. The average service level rose to 0.243, representing a relative increase of 3.85% compared to the previous period This improvement was supported by the addition of 15 new parks and expansions, such as Gucun Park, which helped form a preliminary ecological park belt structure. The western area, intersecting with the Huangpu River waterfront green belt, emerged as a strong growth cluster, while the southeastern section showed limited improvement;
- (2)
- 2018–2023: From 2018 to 2023, the enhancement of green belt services and initiation of the ecological park belt construction led to widespread improvements in recreational services along the belt, with continuous high-value areas. By 2023, the average recreational service level reached 0.264, marking a relative increase of 8.64% from 2018. High-growth areas clustered in the southwestern section of the ecological park belt, where the elongated Meilong Ecological Park and Xuhui Riverfrond Green Space formed growth corridors through continuous development, achieving local growth rates exceeding 10%, while newly built parks like Mianqing Park in the southeast jointly boosted recreational services in the southern belt. Meanwhile, newly constructed parks and the Outer Ring Canal Green belt in the northeast connected previously isolated high-value areas, forming additional growth corridors.
4.1.2. Recreational Service Core Area
4.2. Spillover Effects of Recreational Services
4.2.1. Spatial Correlation Analysis Results
4.2.2. Spillover Effect Analysis Results
- (1)
- The core areas of recreational services in the ecological park belt can drive coordinated development in other regions through spillovers of service level improvements. The SLM analysis showed ρ > 0 (ρ = 0.347, p < 0.001), indicating excellent model fit and strong explanatory power. Significant positive correlations in growth rates were observed among adjacent data belts within 2 km of core areas (including the cores themselves), confirming that high-value areas can achieve spillovers through recreational service growth. The SEM results showed λ > 0 (λ = 0.582, p < 0.001) and provided additional evidence of significant spillover effects;
- (2)
- The explanatory variable coefficient was 6.078 (p = 0.000), meaning each unit increase in initial recreational service level corresponded to an average 6.078-unit increase in current growth rate. This suggests that areas with better recreational service foundations demonstrate stronger growth performance during construction and renewal phases against the backdrop of overall regional recreational level improvement.
4.2.3. Spillover Distance Boundary
4.3. Spillover Effects and Boundaries of Specific Parks
- (a)
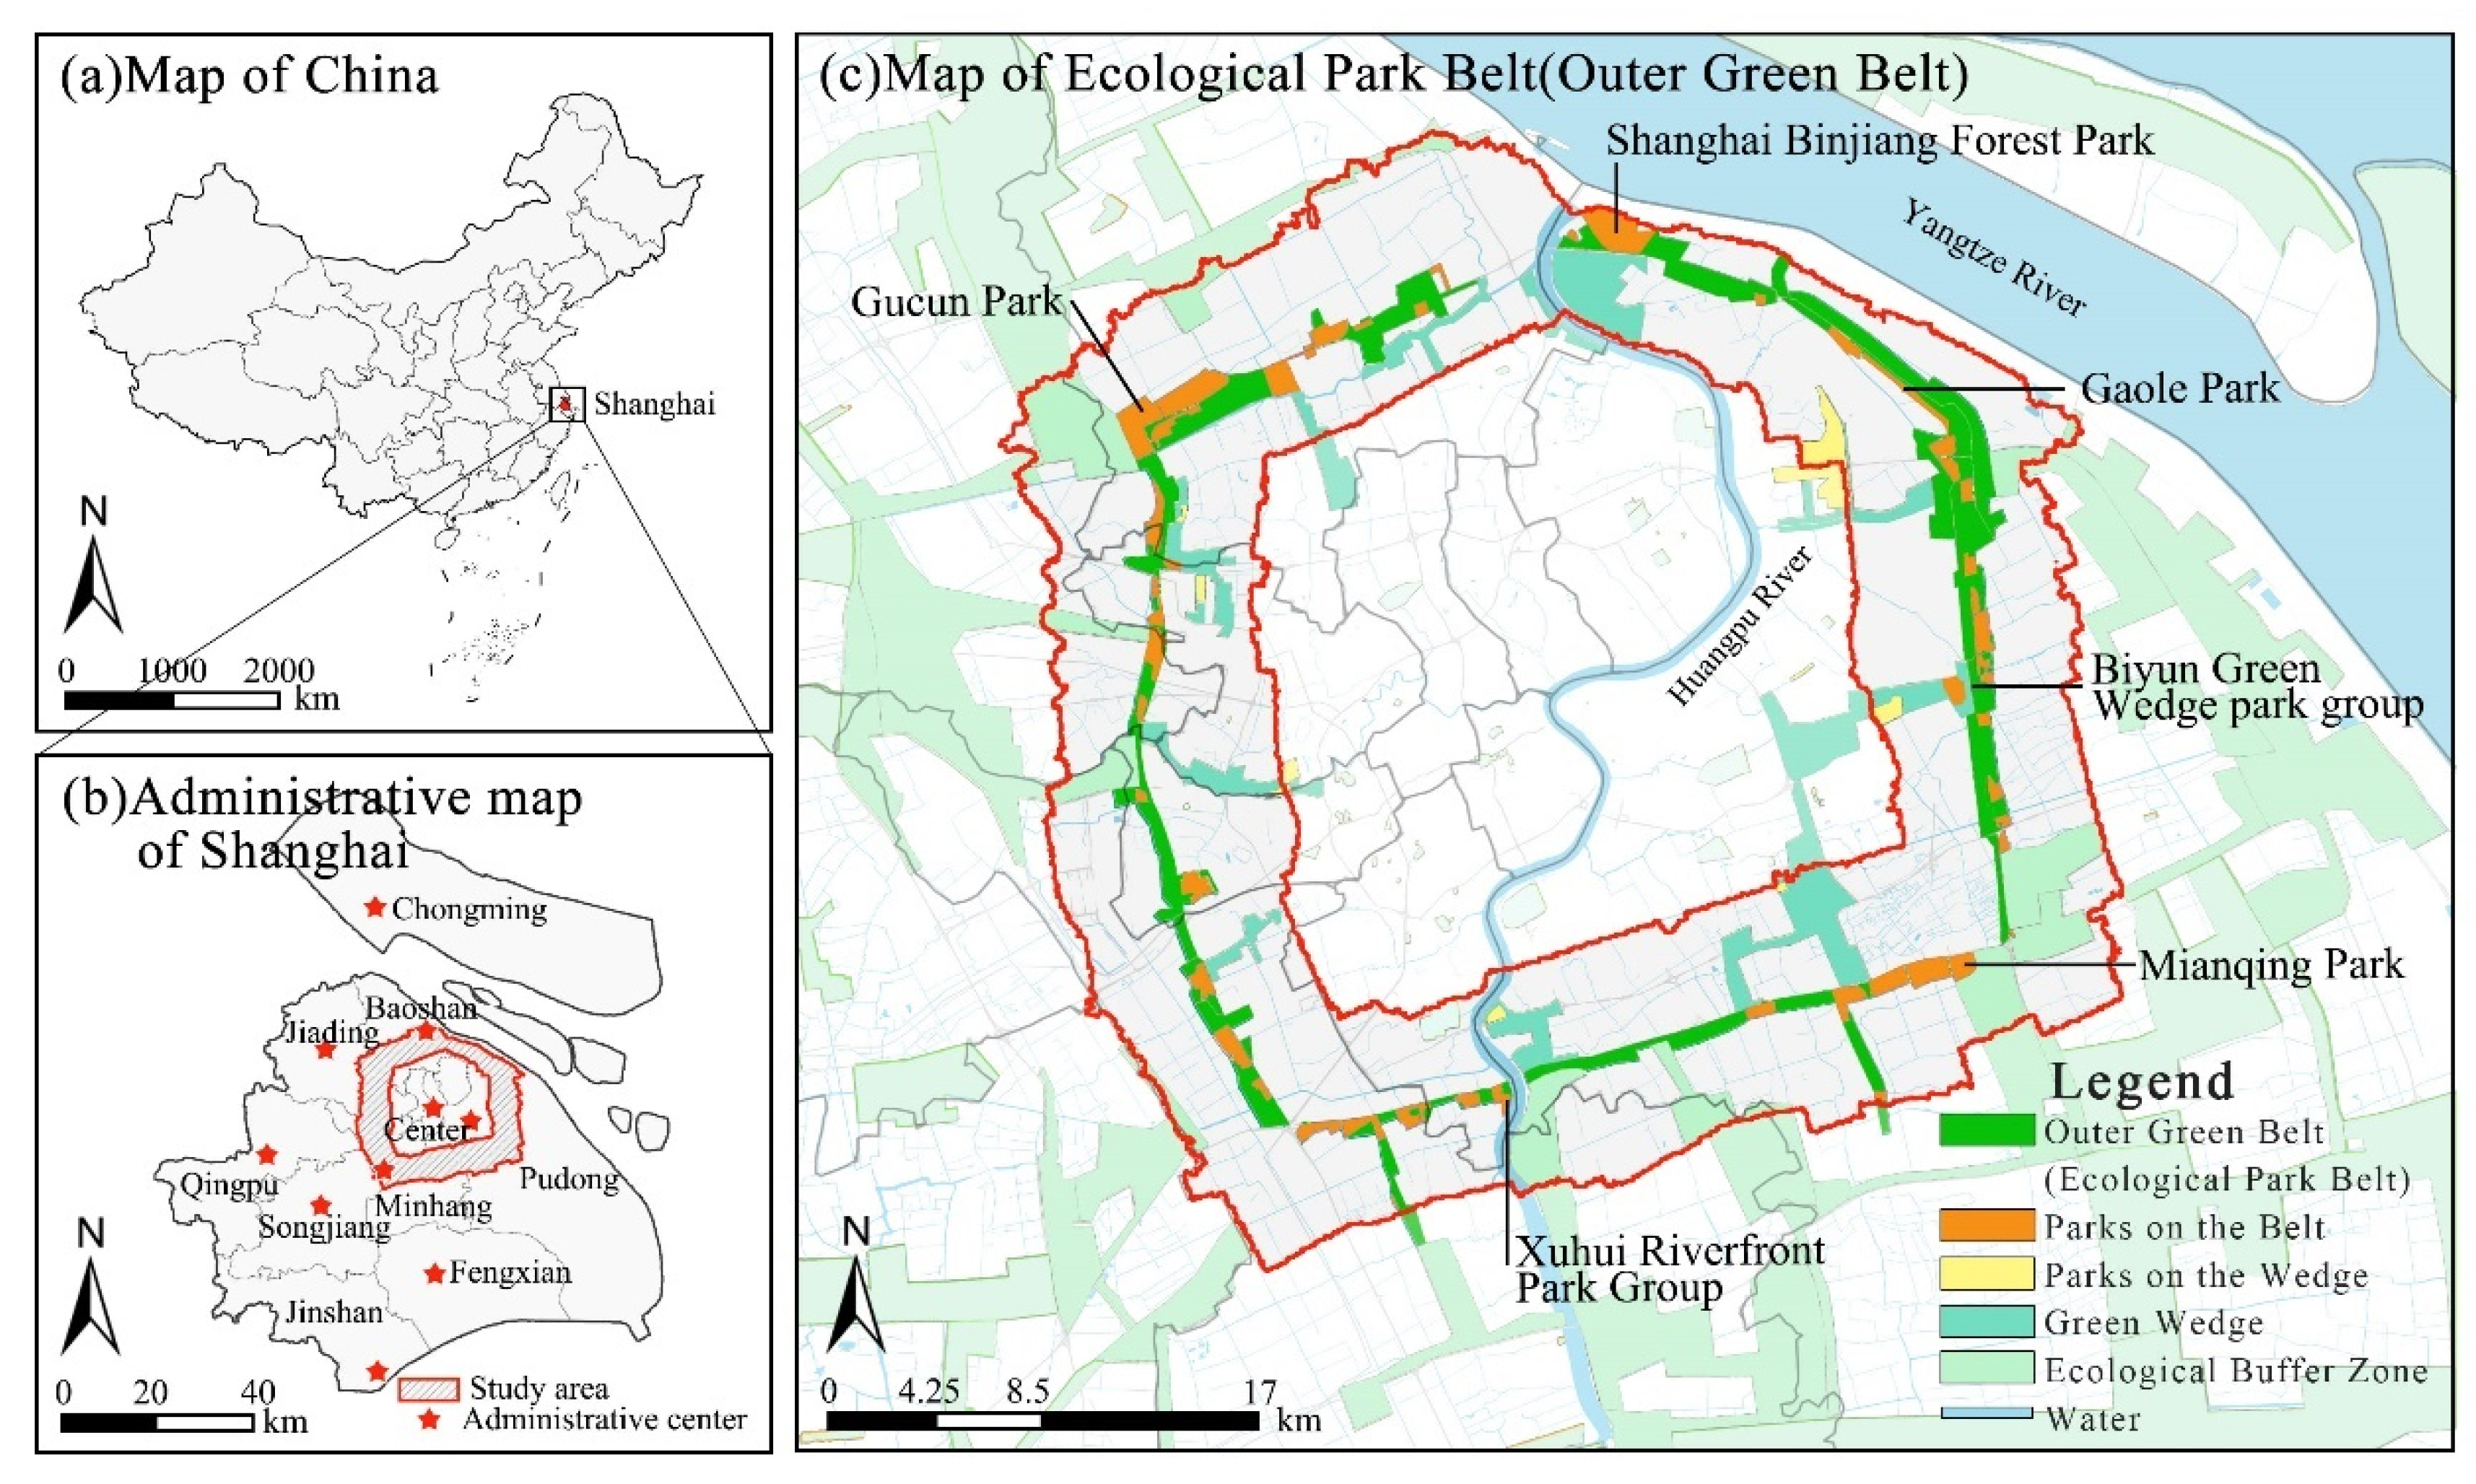
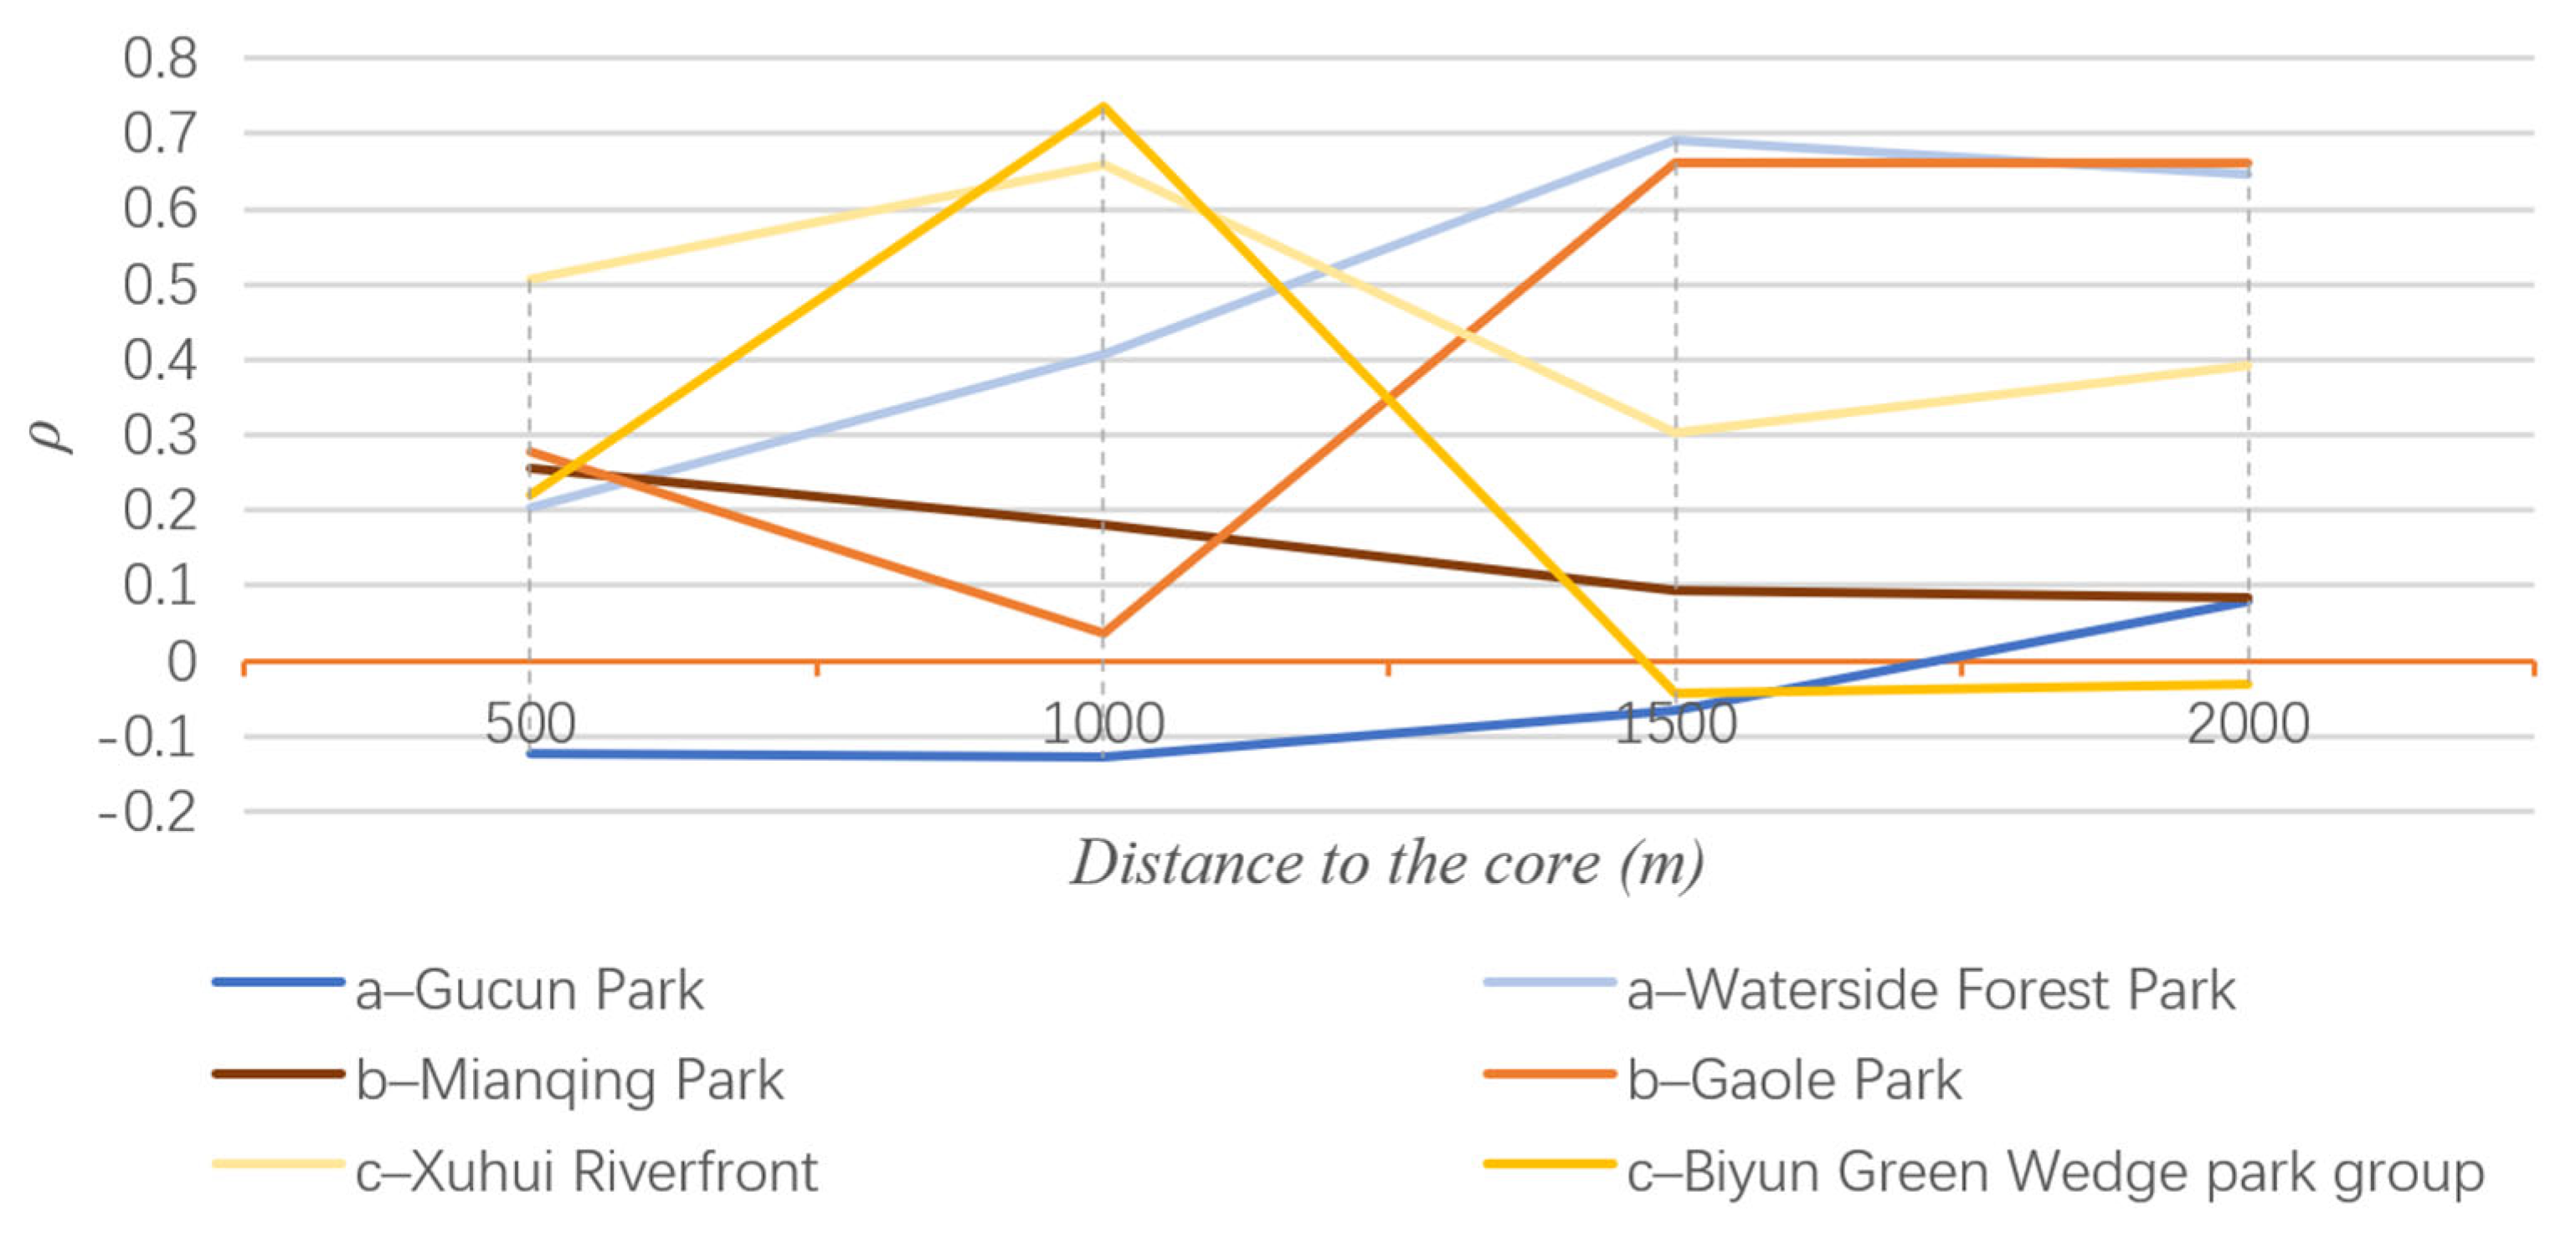
- These parks have a relatively large initial area and have continued to expand, maintaining a high level of recreational services. Shanghai Waterside Forest Park has a high spillover coefficient, which increases gradually with the threshold value. Its second phase of construction, based on citizens’ needs for nature therapy and weekend excursions, complements the first phase in terms of recreational service types. Features such as RV campsites and nature education bases effectively highlight the park’s unique characteristics. However, Gucun Park exhibited a negative spatial spillover, where the increase in the level of recreational services within the park did not positively drive the surrounding areas and even suppressed the growth rate of nearby regions. Over the decade, the local population has increased, but the development of surrounding infrastructure, such as transportation, has been relatively slow. The lack of connecting parks to the east of Gucun Park resulted in a discontinuity along the belt, which is not conducive to the positive spillover effect;
- (b)
- These parks represent the largest proportion along the belt, with rich recreational facilities built. Over the decade, with the construction of high-tech parks and residential areas, the population density around these parks has increased. Recreational demand has driven a rapid increase in both the quantity and quality of supply. The construction of Mianqing Park filled the gap in the southern section of the ecological park belt, serving as the starting point for updating this section. Its distance attenuation curve is similar to the overall trend of the belt. Gaole Park showed the highest spillover effect within the 1500–2000 m threshold. The park has an elongated shape, running parallel to the Pudong Canal and the Outer Ring Canal on its east and west sides, meeting the waterfront recreational needs along the canals;
- (c)
- These park clusters are formed by the integration of multiple urban green space systems. The grouped layout of multiple parks shows a significant spillover effect, with the maximum positive driving effect occurring at a threshold of 1000 m. At the junction of Xuhui Riverfront and the belt, the land use functions around the park cluster are relatively unified, with active art and leisure sports activities, creating a unique district atmosphere. There are several functionally unique urban parks, such as a nature art park and a sports park. Their distinct characteristics have significantly boosted the surrounding recreational service supply. In contrast, the Biyun Green Wedge park group showed a substantial weakening of the spillover effect and even a negative spatial spillover when the threshold exceeded 1500 m. The area around the park cluster is mainly composed of industrial parks and residential areas. It has a large population density and a high demand for recreational services. However, land use is limited, the green space ratio is low, and the spillover of recreational services is restricted. Currently, there is an imbalance between the supply and demand of recreational services.
5. Discussion
5.1. The Effectiveness of the Transformation of the Green Belt Function
5.2. Factors Influencing the Spillover Effect of Recreational Services
5.3. Potential Limitations in the Research
6. Conclusions
- (1)
- The ecological park belt’s recreational services have increased, with core areas becoming more clustered and structurally continuous, yet remaining somewhat fragmented. Over the decade, Shanghai has effectively enhanced overall service levels by introducing diverse recreational spaces and facilities while preserving urban forest resources and maintaining regional recreational potential. However, the concentration of high-value growth zones within the belt suggests planners should further explore the recreational value of green spaces beyond the belt;
- (2)
- The initial level of recreational services has a positive impact on the growth rate of the period. The spillover of the growth in recreational service levels in high-value areas drives the development of adjacent low-value areas, with this promoting effect radiating outward from the core zones. This demonstrates that the ecological park belt, as a relatively complete green space system, effectively enhances the service level in the urban–rural integration areas and increases its potential to expand its service scope both toward the urban center and the peripheral suburbs;
- (3)
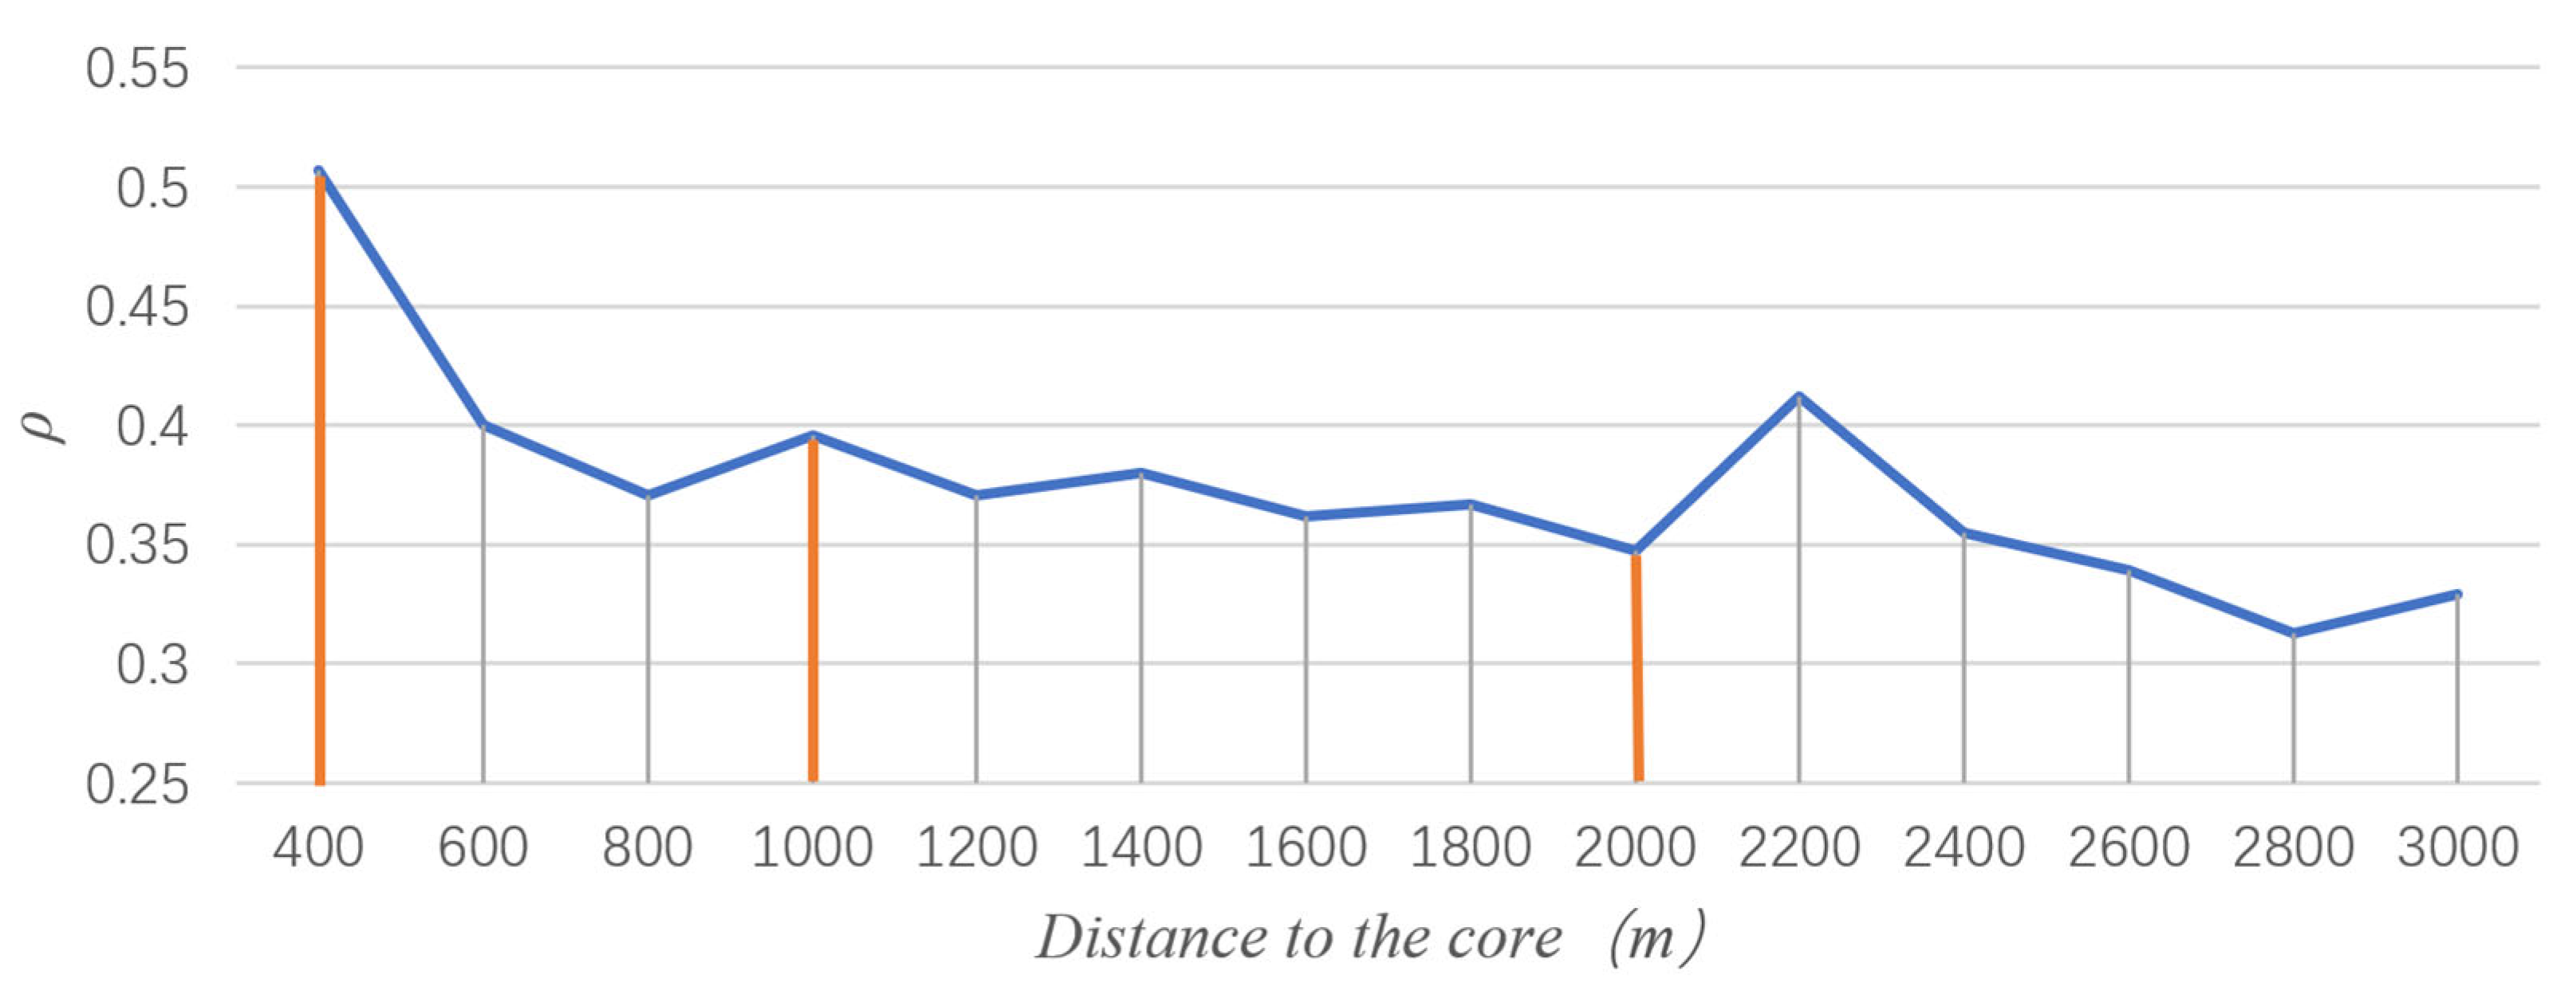
- The spatial scope of the spillover effect is examined. As the distance threshold increases, the spillover effect weakens, resulting in three distance intervals. The spillover coefficient is highest at 400 m, then drops sharply, and significantly rebounds at 1000 m; beyond 2000 m, the spillover effect becomes unstable. In planning and construction, efforts should continue to improve the quality of recreational services along the belt and fully utilize the spillover effects of the three boundaries to enhance the overall green space service level in the region. Specifically, the 400-m boundary with the maximum spillover effect should be leveraged by extending the recreational activities of the main parks to the surrounding squares and pocket parks. This will meet the daily recreational needs of citizens, especially the elderly, through short walks and promote the clustered development of recreational services in the area, together with the main parks. The 1000-m key spillover boundary should be utilized by improving the quality of affiliated and vacant green spaces. Based on citizens’ needs, various types of recreational facilities should be added to create more high-value areas. The ecological park belt system should also be linked with waterfronts and green wedges to form a coordinated network. The 2000-m stable spillover boundary, which serves as the buffer zone for spillover effects, should focus on tapping into green space resources outside the belt. This will create a unique recreational atmosphere in the area and comprehensively meet various needs. High-value areas should be connected through cycling greenways and waterfront scenic corridors. Facilities such as cycling stations should be added to integrate small and micro green spaces with urban transportation systems, meeting citizens’ slow travel needs. This can also mitigate the fragmentation and separation of green space resources by built-up areas, enrich the composition of the ecological park belt core, and enhance its structural stability during development and expansion;
- (4)
- There are differences in the spillover effects of parks and park clusters along the belt. During the multi-phase expansion of old parks, the negative spatial spillover should be guarded against. While optimizing the park itself, efforts should be made to improve the surrounding supporting infrastructure, establish activity linkages with small green spaces to disperse visitors, and deeply explore the unique features of the park to differentiate it from other parks of similar size in terms of functional settings and event planning to avoid competition. New parks along the belt show good initial spillover effects and can gradually fill the gaps in the belt. In design and planning, it is essential to fully understand citizens’ needs and explore regional culture and local landscape characteristics. After construction, updates should focus on the park’s connection with surrounding water bodies and transportation. Park clusters exhibit better spillover effects, with the optimal spillover effect achieved at 1500 m. A group of parks with clear functions and different main types can significantly enhance the surrounding recreational service supply. In planning, attention should be paid to the distribution of park clusters along the belt and the balance of green space service volumes on both sides of the belt. If one side is affected by urban built-up areas, accessible affiliated green spaces should be explored to meet the needs of citizens on that side and balance the driving effects on both sides.
Author Contributions
Funding
Data Availability Statement
Conflicts of Interest
Correction Statement
References
- Jin, Y.; Long, Q.; Wang, R.; Zhou, X.; Bo, M.; Guo, W.; Du, M. Green Ring Planning of Fengxian New City in Shanghai Based on Organic Renewal under the Governance of Urban-Rural Integration. Landsc. Archit. Acad. J. 2022, 39, 57–64. [Google Scholar]
- Thomas, D. London’s Green Belt: The Evolution of an Idea. Geography 1963, 129, 14–24. [Google Scholar] [CrossRef]
- Masucci, A.P.; Stanilov, K.; Batty, M. Limited urban growth: London’s street network dynamics since the 18th century. PLoS ONE 2013, 8, e69469. [Google Scholar] [CrossRef] [PubMed]
- Schram, A.; Doevendans, K. Planning beyond borders. An emerging discipline at the international townplanning conference on 1924. Bull. KNOB 2018, 117, 104–122. [Google Scholar]
- Hong, W.; Guo, R. Indicators for quantitative evaluation of the social services function of urban green belt systems: A case study of Shenzhen, China. Ecol. Indic. 2017, 75, 259–267. [Google Scholar] [CrossRef]
- Zhang, M.; Huang, J.; Deng, L. Can green belts limit urban sprawl?—An analysis of the role of London’s green belt from the perspective of population change. Urban Rural. Plan. 2021, 5, 62–71. [Google Scholar]
- Jun, M.J. The effects of Seoul’s green belt on the spatial distribution of population and employment, and on the real estate market. Ann. Reg. Sci. 2012, 49, 619–642. [Google Scholar] [CrossRef]
- Yang, J.; Jinxing, Z. The failure and success of green belt program in Beijing. Urban For. Urban Green. 2007, 6, 287–296. [Google Scholar] [CrossRef]
- Amati, M.; Yokohari, M. Temporal changes and local variations in the functions of London’s green belt. Landsc. Urban Plan. 2006, 75, 125–142. [Google Scholar] [CrossRef]
- Gant, R.L.; Robinson, G.M.; Fazal, S. Land-use change in the ‘edgelands’: Policies and pressures in London’s rural–urban fringe. Land Use Policy 2011, 28, 266–279. [Google Scholar] [CrossRef]
- Zhang, K.X. Research on the construction of large city green belts in the context of park cities: A case study of Beijing, Shanghai, and Chengdu. Beijing Plan. Des. 2024, 4, 99–103. [Google Scholar]
- Li, F.Z.; Li, K.H.; Li, X. Research on the scenario planning of the suburban park ring of the second green isolation belt in Beijing. Landsc. Gard. 2021, 28, 58–64. [Google Scholar]
- Ge, Y.Y.; Li, X. Spatial layout optimization of the suburban park ring in the second green isolation area of Beijing based on the coordinated improvement of carbon sequestration and recreational services. J. Beijing For. Univ. 2022, 44, 142–154. [Google Scholar]
- Zhao, X.L.; Qiu, X.; Xu, J.R.; Hou, Y.J. Review of Research Methods for Green Spatial Behavioral Activities and Environmental Cognition. Landsc. Archit. 2020, 27, 56–62. [Google Scholar]
- Bíziková, V.; Psotová, E. Visitor profile of enological tourism in Slovakia: Implications of the regional analysis of the demand for wine-themed experience stay. J. Infrastruct. Policy Dev. 2024, 8, 8072. [Google Scholar] [CrossRef]
- Sun, X.; Liu, H.; Liao, C.; Nong, H.; Yang, P. Understanding recreational ecosystem service supply-demand mismatch and social groups’ preferences: Implications for urban–rural planning. Landsc. Urban Plann. 2024, 241, 104903. [Google Scholar] [CrossRef]
- Lankia, T.; Kopperoinen, L.; Pouta, E.; Neuvonen, M. Valuing recreational ecosystem service flow in Finland. J. Outdoor Recreat. Tour. 2015, 10, 14–28. [Google Scholar] [CrossRef]
- Bedimo-Rung, A.L.; Mowen, A.J.; Cohen, D.A. The significance of parks to physical activity and public health: A conceptual model. Am. J. Prevent. Med. 2005, 28, 159–168. [Google Scholar] [CrossRef] [PubMed]
- Saelens, E.B.; Frank, D.; Auffrey, C.; Hitaker, C.R.; Burdette, L.H. Measuring physical environments of parks and playgrounds: EAPRS instrument development and inter-rater reliability. J. Phys. Act. Health 2006, 3 (Suppl. S1), S3. [Google Scholar] [CrossRef] [PubMed]
- Lee, G.; Hong, I. Measuring spatial accessibility in the context of spatial disparity between demand and supply of urban park service. Landsc. Urban Plann. 2013, 119, 85–90. [Google Scholar] [CrossRef]
- Paracchini, M.L.; Zulian, G.; Kopperoinen, L.; Maes, J.P.; Termansen, M.; Bidoglio, G. Mapping cultural ecosystem services: A framework to assess the potential for outdoor recreation across the EU. Ecol. Indic. 2014, 45, 371–385. [Google Scholar] [CrossRef]
- Zhang, Y.; Liu, Y.; Zhang, Y.; Liu, Y.; Zhang, G.; Chen, Y. On the spatial relationship between ecosystem services and urbanization: A case study in Wuhan, China. Sci. Total Environ. 2018, 637, 780–790. [Google Scholar] [CrossRef] [PubMed]
- Wang, Y.C.; Liu, L. Remote coupling: Spatial ecological wisdom in the performance evaluation of green infra-structure. Chin. Landsc. Archit. 2023, 39, 51. [Google Scholar]
- Wu, Z.Q. Studies on the Spillover Effect and Influencing Factors of Urban Green Space Cooling Services. Master’s Thesis, Huazhong Agricultural University, Wuhan, China, 2023. [Google Scholar]
- Chen, W.; Chi, G. Urbanization and ecosystem services: The multi-scale spatial spillover effects and spatial variations. Land Use Policy 2022, 114, 105964. [Google Scholar] [CrossRef]
- Liu, Z.; Chang, Y.; Pan, S.; Zhang, P.; Tian, L.; Chen, Z. Unfolding the spatial spillover effect of urbanization on composite ecosystem services: A case study in cities of Yellow River Basin. Ecol. Indic. 2024, 158, 111521. [Google Scholar] [CrossRef]
- Qu, H.; You, C.; Feng, C.C.; Guo, L. The spatial spillover effects of ecosystem services: A case study in Yangtze River economic belt in China. Ecol. Indic. 2024, 168, 112741. [Google Scholar] [CrossRef]
- Peng, C.L. Exploring the possibilities of urban green belts on the edge of large cities: A case study of the environmental transformation and improvement of Niuhe Pond in the outer ring forest belt of Shanghai. China Overseas Archit. 2019, 8, 169–172. [Google Scholar]
- Duany, A.; Steuteville, R. Defining the 15-Minute City; Public Square: Singapore, 2021. [Google Scholar]
- Qian, Z.H.; Liu, Q.; Huang, D.F. Three scales and planning trends of 15-minute life circle. Urban Plan. Int. 2022, 37, 63–70. [Google Scholar]
- Clark, R.N.; Stankey, G.H. The Recreation Opportunity Spectrum: A Framework for Planning, Management, and Research; Department of Agriculture, Forest Service, Pacific Northwest Forest and Range Experiment Station: Portland, OR, USA, 1979; Volume 98.
- Maes, J.; Paracchini, M.L.; Zulian, G.; Dunbar, M.B.; Alkemade, R. Synergies and trade-offs between ecosystem service supply, biodiversity, and habitat conservation status in Europe. Biol. Conserv. 2012, 155, 1–12. [Google Scholar] [CrossRef]
- Burkhard, B.; Kroll, F.; Müller, F.; Windhorst, W. Landscapes’ capacities to provide ecosystem services-A concept for land-cover based assessments. Landsc. Online 2009, 15, 1–22. [Google Scholar] [CrossRef]
- Crossman, N.D.; Burkhard, B.; Nedkov, S.; Willemen, L.; Petz, K.; Palomo, I.; Drakou, E.G.; Martín-Lopez, B.; McPhearson, T.; Boyanova, K.; et al. A blueprint for mapping and modelling ecosystem services. Ecosyst. Serv. 2013, 4, 4–14. [Google Scholar] [CrossRef]
- Liu, S.; Shen, P.; Huang, Y.; Jiang, L.; Feng, Y. Spatial distribution changes in nature-based recreation service supply from 2008 to 2018 in Shanghai, China. Land 2022, 11, 1862. [Google Scholar] [CrossRef]
- Koppen, G.; Sang, Å.O.; Tveit, M. Managing the potential for outdoor recreation: Adequate mapping and measuring of accessibility to urban recreational landscapes. Urban For. Urban Green. 2014, 13, 71–83. [Google Scholar] [CrossRef]
- Zhang, F.; Zhao, Q.; Zhang, D. A study on the accessibility of residential neighborhood green spaces in Zhengzhou from the perspective of life circle. Archit. Cult. 2022, 4, 231–232. [Google Scholar]
- Tuan, Y.F. Space and Place: Humanistic Perspective; Springer: Dordrecht, The Netherlands, 1979; pp. 387–427. [Google Scholar]
- Yu, K.J.; Duan, T.W.; Li, D.H.; Peng, J.F. Evaluation method and case study of landscape accessibility as an indicator for urban green space system function. City Plan. Rev. 1999, 8, 7–10+42+63. [Google Scholar]
- Zhang, L.; Li, J.; Liu, J.; Zuo, Y. Landsenses Evaluation and Spatial Governance Strategies of Green Space Units: A Case Study of Yangpu District in Shanghai. Landsc. Archit. Acad. J. 2025, 42, 4–12+49. [Google Scholar]
- Saura, S.; Vogt, P.; Velázquez, J.; Hernando, A.; Tejera, R. Key structural forest connectors can be identified by combining landscape spatial pattern and network analyses. For. Ecol. Manag. 2011, 262, 150–160. [Google Scholar] [CrossRef]
- Vogt, P.; Ferrari, J.R.; Lookingbill, T.R.; Gardner, R.H.; Riitters, K.H.; Ostapowicz, K. Mapping functional connectivity. Ecol. Indic. 2009, 9, 64–71. [Google Scholar] [CrossRef]
- Soille, P.; Vogt, P. Morphological segmentation of binary patterns. Pattern Recognit. Lett. 2009, 30, 456–459. [Google Scholar] [CrossRef]
- Qin, C.L.; Yang, X. Do the rich regions drive common prosperity in other areas? An analysis based on spatial spillover effects. China Ind. Econ. 2017, 10, 44–61. [Google Scholar]
- Huang, T.; Wei, M.; Xi, J.C. Evolution and spillover effect of urban ecotourism amenity spatial pattern in Suzhou. Econ. Geogr. 2023, 43, 210–219. [Google Scholar]
- Getis, A. A history of the concept of spatial autocorrelation: A geographer’s perspective. Geogr. Anal. 2008, 40, 297–309. [Google Scholar] [CrossRef]
- Xie, Q.; Lu, M. Measures of spatial and demographic disparities in access to urban Green space in Harbin, China. Complexity 2020, 2020, 8832343. [Google Scholar] [CrossRef]
- Kim, E.J.; Kim, H. Neighborhood Walkability and Housing Prices: A Correlation Study. Sustainability 2020, 12, 593. [Google Scholar] [CrossRef]
- Lambert, D.M.; Brown, J.P.; Florax, R.J. A two-step estimator for a spatial lag model of counts: Theory, small sample performance and an application. Reg. Sci. Urban Econ. 2010, 40, 241–252. [Google Scholar] [CrossRef]
- Tian, D.; Wang, J.; Xia, C.; Zhang, J.; Zhou, J.; Tian, Z.; Zhou, C. The relationship between green space accessibility by multiple travel modes and housing prices: A case study of Beijing. Cities 2024, 145, 104694. [Google Scholar] [CrossRef]
- Liu, R.; Yu, C.; Liu, C.; Jiang, J.; Xu, J. Impacts of haze on housing prices: An empirical analysis based on data from Chengdu (China). Int. J. Environ. Res. Public Health 2018, 15, 1161. [Google Scholar] [CrossRef] [PubMed]
| Data | Data Type | Data Source | Description |
|---|---|---|---|
| Land use/cover map | Raster data | Resource and Environment Data Cloud Platform http://www.resdc.cn (accessed on 20 July 2025) | Different types of land use in Shanghai (30 m) |
| Urban green map | Raster data | Open Street Map https://openmaptiles.org (accessed on 20 July 2025) | Shanghai park green space |
| Park POI | Vector data | Baidu map and Google Maps https://www.baidu.com/, http://www.google.com (accessed on 20 July 2025) | POI (Natural sensing point): Scenic spot, Plant/animal exhibition area, ecological conservation area |
| POI (Shopping/dining point): Restaurant, marina complex, service center, shop in the park | |||
| POI (Dynamic entertainment point): Playground, amusement park, cycling station, camping base | |||
| POI (Cultural/Educational point): Educational base, museum, art gallery, historical building in the park | |||
| POI (Innovative development level): University, innovation/technology industrial district | |||
| center of administrative regions | Vector data | Administrative map | The development center of Shanghai administrative regions |
| road network | Vector data | Open Street Map https://openmaptiles.org (accessed on 20 July 2025) | Different types of roads in Shanghai |
| subway station | Vector data | Baidu map https://www.baidu.com (accessed on 20 July 2025) | Subway stations in Shanghai |
| GDP | Vector data | ‘government work report’ of each administrative regions | Per capita GDP of Shanghai administrative regions |
| Population | Vector data | ‘government work report’ of each administrative regions | Population of Shanghai administrative regions |
| Land Use Type | Urban Green/Forests | Water | Grassland | Unused Land | Agricultural Land | Road | Urban |
|---|---|---|---|---|---|---|---|
| Cost values | 5 | 10 | 3 | 2 | 4 | 1 | 2 |
| Component | Variable | Description |
|---|---|---|
| recreation potential (0.5) | Land use/cover | Urban green (5) |
| Forests (4) Water (3) | ||
| Grassland (4) | ||
| Unused land (3) | ||
| Agricultural land (2) Road (2) | ||
| Urban (1) | ||
| recreation opportunity | POI (Natural sensing point) (0.118) | Kernel density analysis |
| (0.5) | POI (Commercial service point) (0.131) | Kernel density analysis |
| POI (Dynamic entertainment point) (0.12) | Kernel density analysis | |
| POI (Cultural and Educational point) (0.136) | Kernel density analysis | |
| Distance from the center of each administrative region (0.100) | Euclidean distance | |
| Distance from water (0.099) | Euclidean distance | |
| Distance from road (0.099) | Euclidean distance | |
| Distance from subway station (0.099) | Euclidean distance | |
| Accessibility of green space (0.098) | Cost distance |
| Moran’s I | OLS | LM | ||||||
|---|---|---|---|---|---|---|---|---|
| Variable | I | p-Value * | Variables | Coefficient | p-Value * | Test | Statistic | p-Value * |
| Y2013–2018 | 0.524 *** | 0.000 | X | 1.497 *** | 0.000 | LM-ERR | 1.700 | 0.192 |
| GDP | −0.478 *** | 0.008 | R-LM-ERR | 5.632 ** | 0.018 | |||
| Y2018–2023 | 0.416 *** | 0.000 | In | −0.493 | 0.313 | LM-lag | 22.612 *** | 0.000 |
| p | −0.012 | 0.968 | R-LM-lag | 26.544 *** | 0.000 | |||
| SLM | SEM | |||
|---|---|---|---|---|
| Variable | Coefficient | p-Value | Coefficient | p-Value |
| X | 6.078 *** | 0.000 | 1.288 *** | 0.000 |
| GDP | 3.427 *** | 0.000 | −0.126 | 0.652 |
| In | 0.409 *** | 0.008 | −0.885 | 0.234 |
| p | 1.663 | 0.637 | −0.052 | 0.907 |
| ρ/λ | 0.347 *** | 0.000 | 0.582 *** | 0.000 |
| Number of obs | 40 | 40 | ||
| R2 | 0.684 | 0.856 | ||
| Log-likelihood | 172.837 | 98.680 | ||
| Hausman | 132.130 *** | 132.130 *** | ||
Disclaimer/Publisher’s Note: The statements, opinions and data contained in all publications are solely those of the individual author(s) and contributor(s) and not of MDPI and/or the editor(s). MDPI and/or the editor(s) disclaim responsibility for any injury to people or property resulting from any ideas, methods, instructions or products referred to in the content. |
© 2025 by the authors. Licensee MDPI, Basel, Switzerland. This article is an open access article distributed under the terms and conditions of the Creative Commons Attribution (CC BY) license (https://creativecommons.org/licenses/by/4.0/).
Share and Cite
Zhang, L.; Liu, J.; Li, J.; Zuo, Y. The Functional Transformation of Green Belts: Research on Spatial Spillover of Recreational Services in Shanghai’s Ecological Park Belt. Buildings 2025, 15, 3076. https://doi.org/10.3390/buildings15173076
Zhang L, Liu J, Li J, Zuo Y. The Functional Transformation of Green Belts: Research on Spatial Spillover of Recreational Services in Shanghai’s Ecological Park Belt. Buildings. 2025; 15(17):3076. https://doi.org/10.3390/buildings15173076
Chicago/Turabian StyleZhang, Lin, Jiayi Liu, Jiawei Li, and You Zuo. 2025. "The Functional Transformation of Green Belts: Research on Spatial Spillover of Recreational Services in Shanghai’s Ecological Park Belt" Buildings 15, no. 17: 3076. https://doi.org/10.3390/buildings15173076
APA StyleZhang, L., Liu, J., Li, J., & Zuo, Y. (2025). The Functional Transformation of Green Belts: Research on Spatial Spillover of Recreational Services in Shanghai’s Ecological Park Belt. Buildings, 15(17), 3076. https://doi.org/10.3390/buildings15173076


