3.1. Analysis of Aesthetic Cognitive Mechanism Based on SOR Model
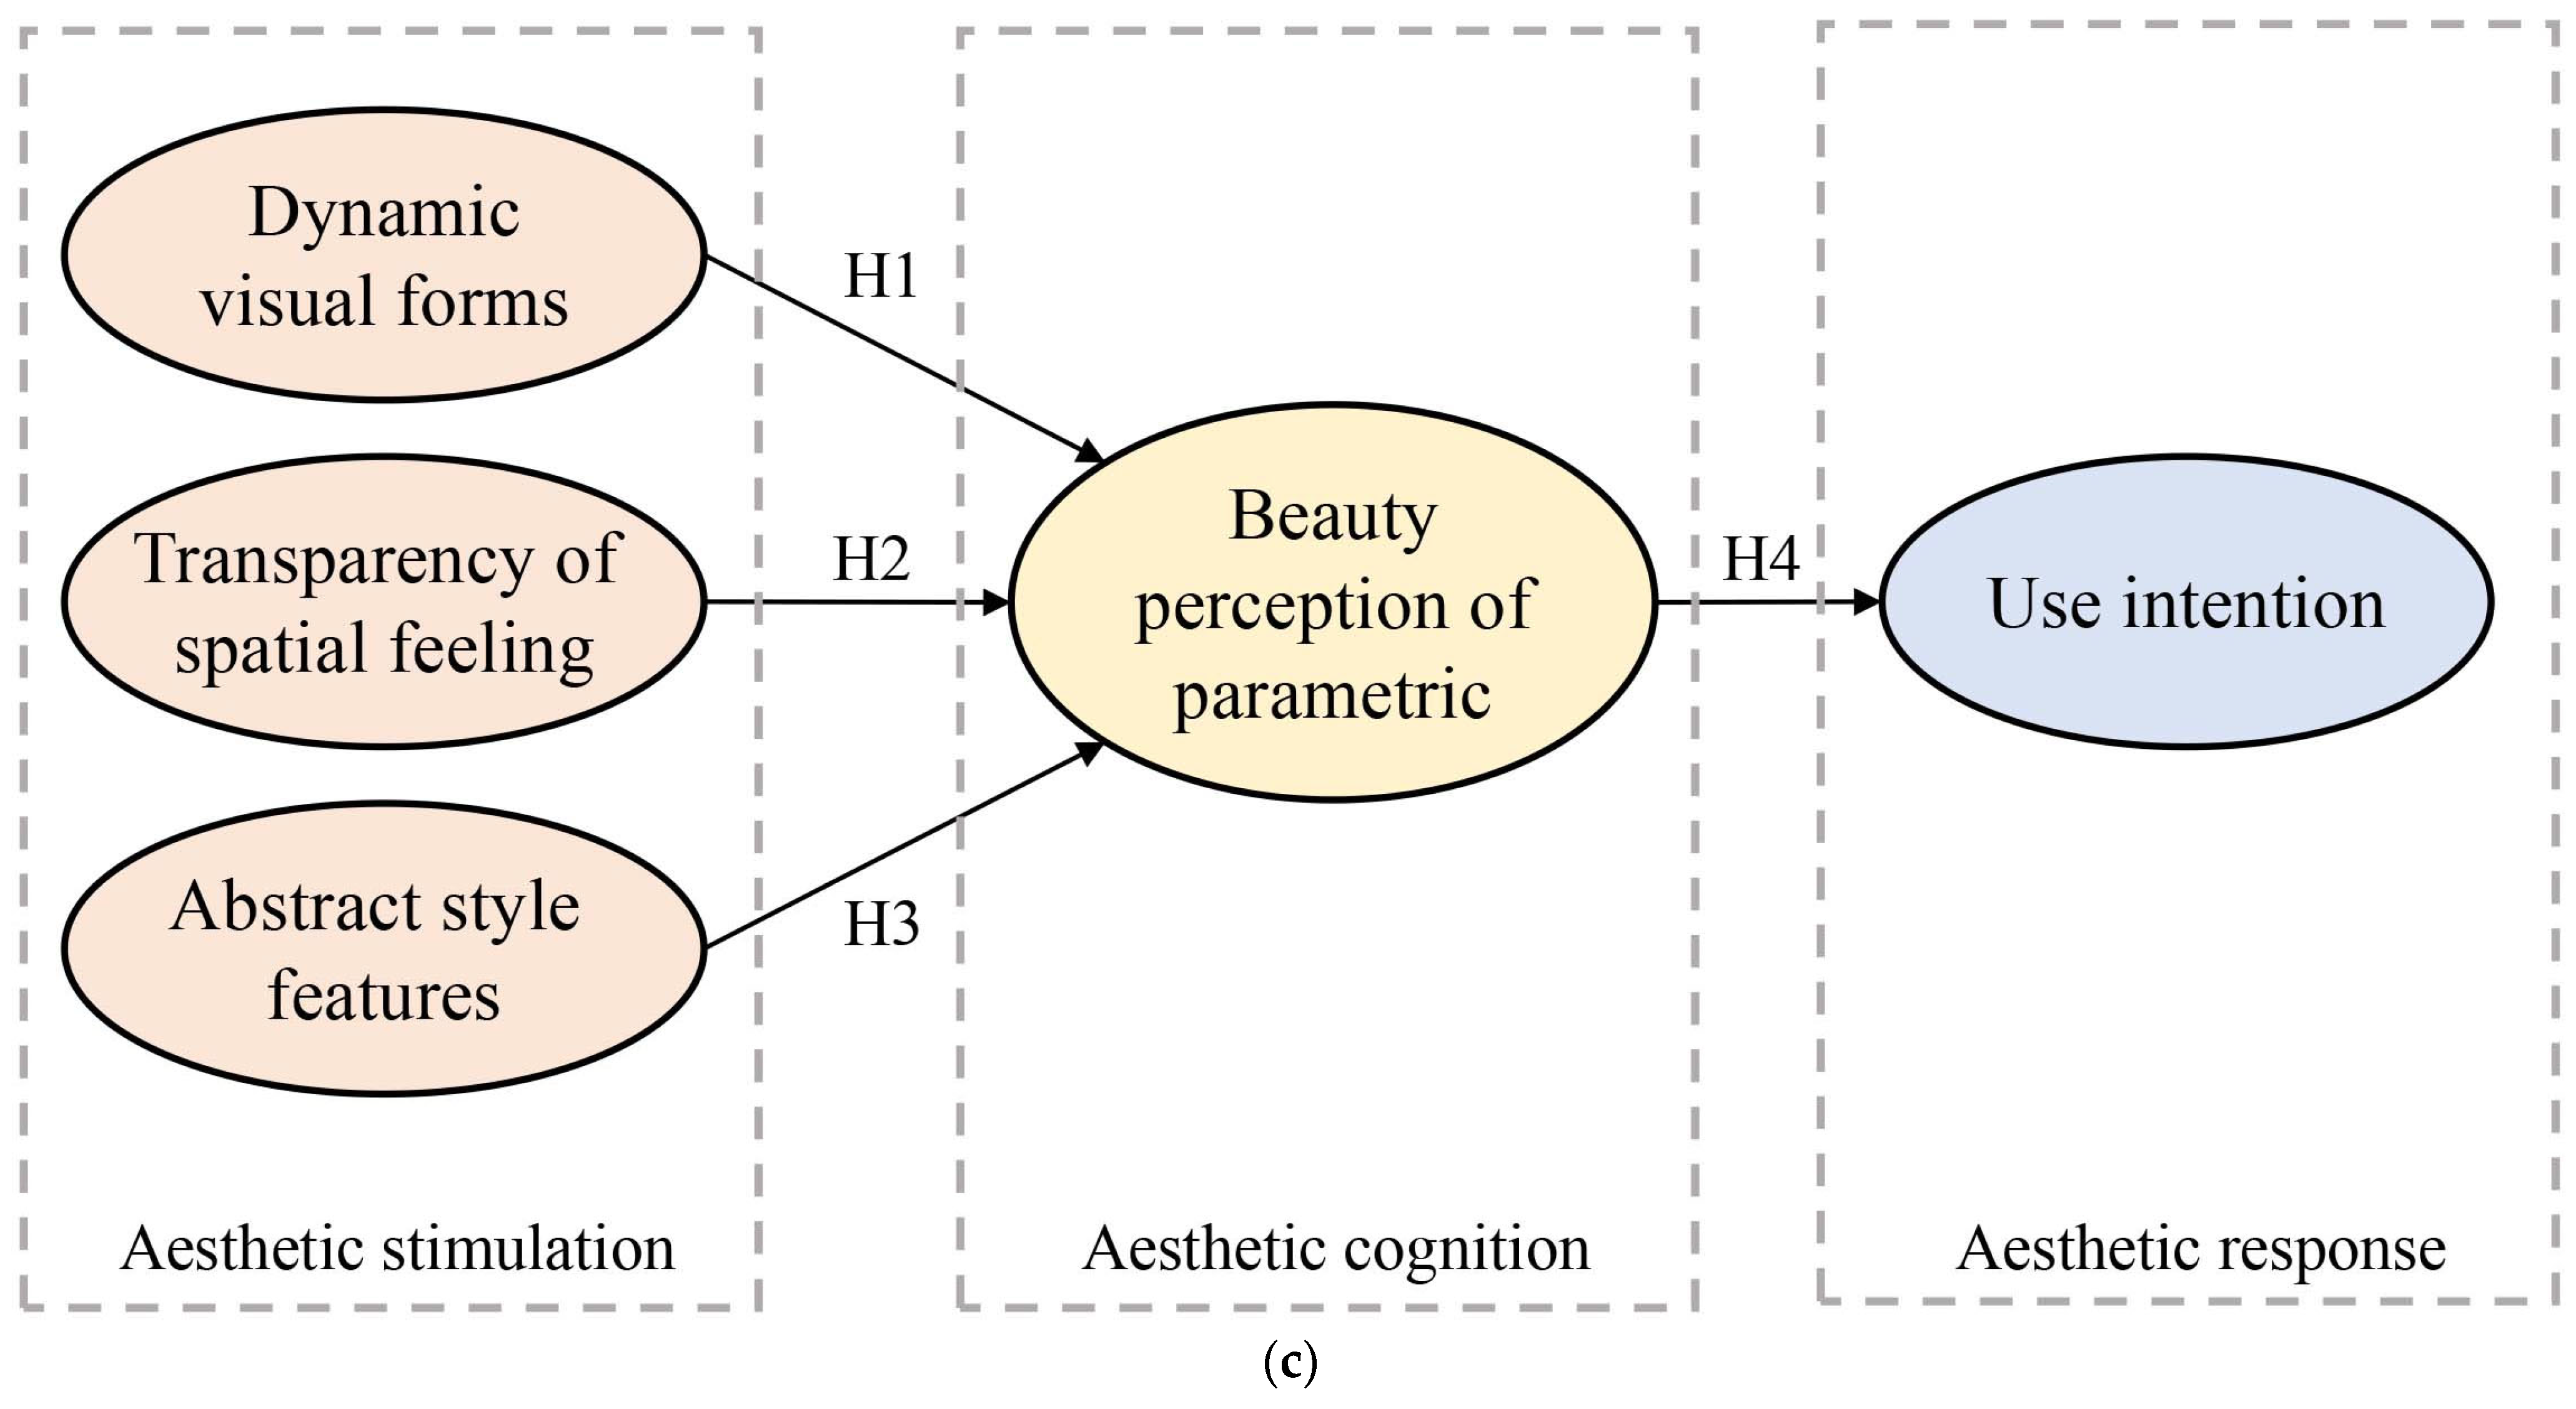
Based on the analysis of the aesthetic cognitive mechanism of the SOR model in the previous text, the hypothesis proposed in the previous text is verified by combining the Structural Equation Model method, exploring how various aesthetic stimulus variables affect beauty perception of parametric design. The experiment was conducted through questionnaires. Firstly, combining the meanings of each variable and the relevant literature [
59,
60,
61], the detailed measurement items are presented in
Table 5.
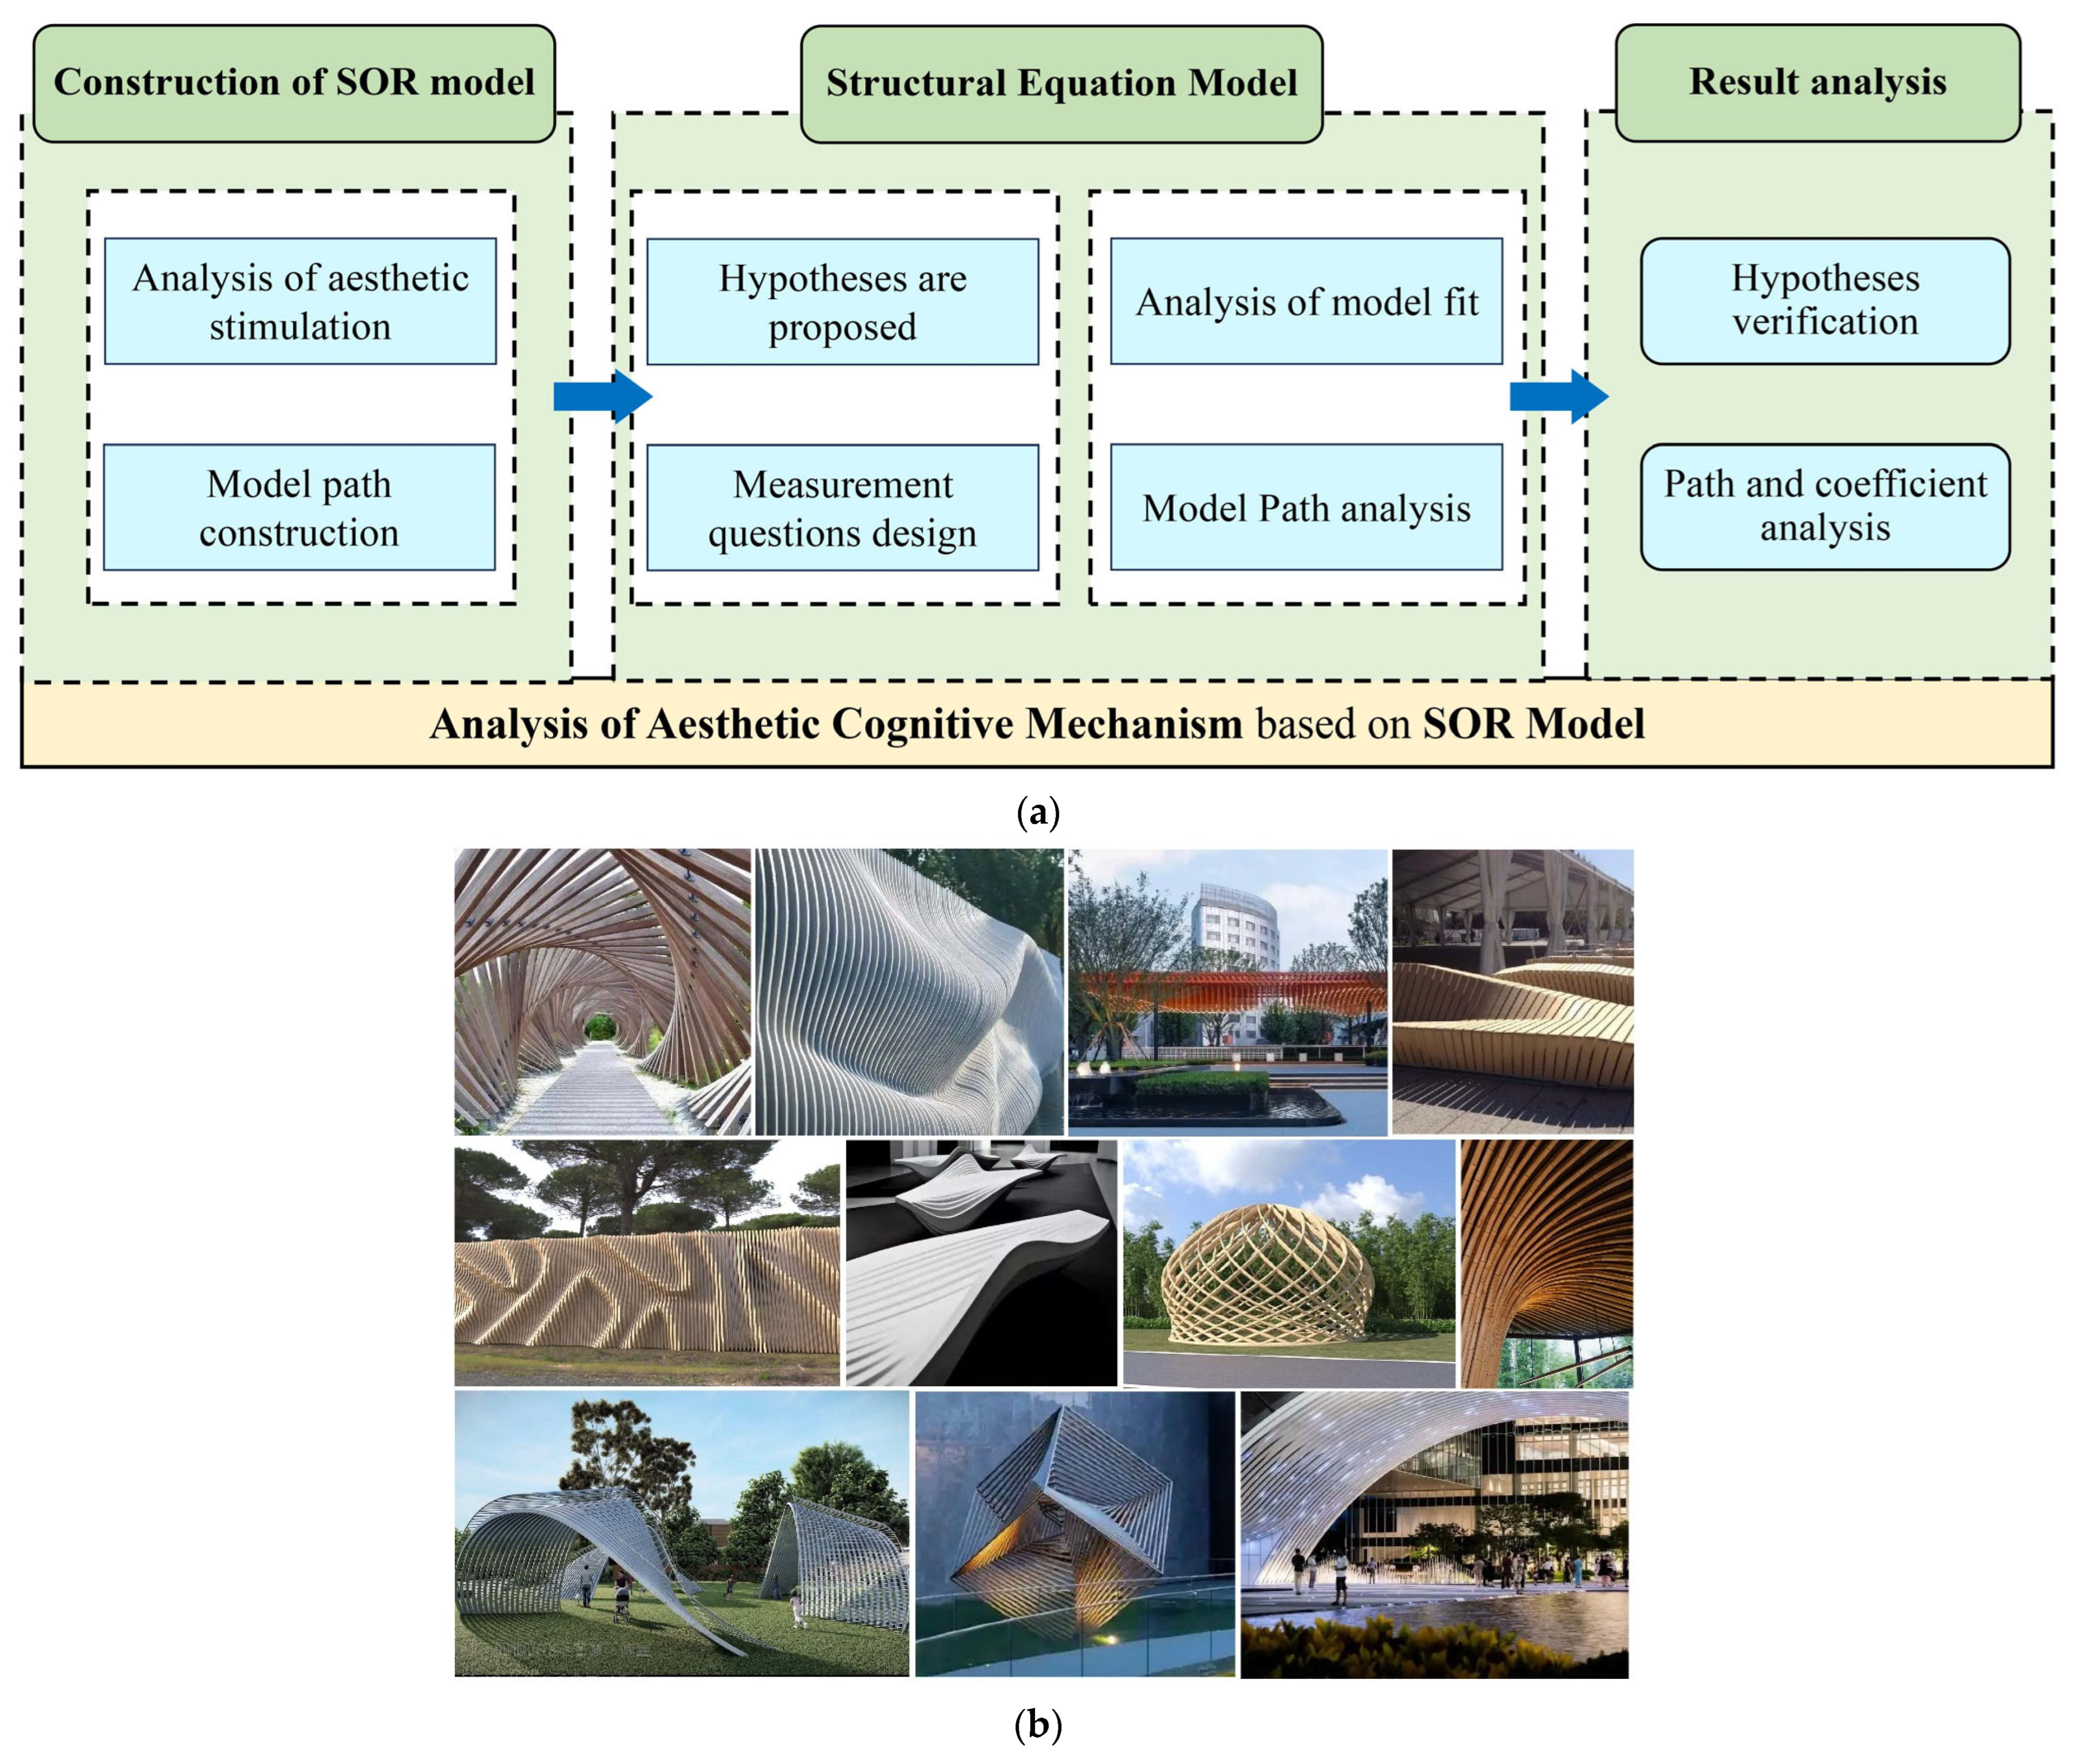
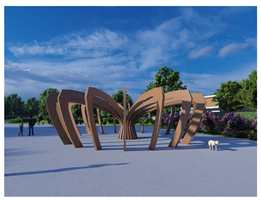
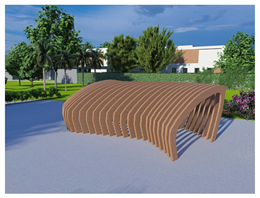
Secondly, 300 ordinary adults were selected as the subjects through questionnaire scoring. To ensure the validity of the questionnaire filling, it is necessary to show the subjects pictures of the parametric landscape facilities to let them understand the parametric landscape facilities. The survey questionnaire comprised two parts: (1) respondents’ basic information (gender, age, education level), and (2) scores for the measurement variables. All measurement items were evaluated using a 7-point Likert scale, where 1 indicates “strongly disagree” and 7 indicates “strongly agree”.
The survey participants were all adults with a balanced demographic distribution. A total of 300 questionnaires were distributed, with 294 collected, resulting in an effective response rate of 98.0%, questionnaire collection is acceptable in the study of Structural Equation Models. The details are shown in
Table 6.
Finally, the experimental data were analyzed through the Structural Equation Model to obtain the final research results. The questionnaire data were analyzed for reliability by using SPSS 22.0 software, and the Cronbach’s α value for each latent variable > 0.7, indicating good reliability of the data.
The model was tested using AMOS 24.0 for confirmatory factor analysis (CFA), as shown in
Table 7. The fit indices of the model are as follows: X2/df = 1.160, RMSEA = 0.023, GFI = 0.961, CFI = 0.994, NFI = 0.958, TLI = 0.992. The standardized regression weight (STD), composite reliability (CR), and average variance extracted (AVE) of each latent variables are shown in
Table 7. All standardized regression weights (STD) were above 0.6, and composite reliability (CR) and average variance extracted (AVE) values were above 0.5. The fit indices of the model demonstrated that this model were considered acceptable [
62].
In the test of discriminant validity, the square roots of the AVE values were above each correlation coefficient of the variables, indicating good discriminant validity [
63], as shown in
Table 8.
The theoretical model was analyzed by AMOS 24.0 software to calculate the model fit indices. The fit indices of the model are as follows: X2/df = 1.531, RMSEA = 0.042, GFI = 0.947, NFI = 0.942, and CFI = 0.979. All indices are within acceptable limits [
64], the fit indices of the model demonstrated that this model were considered acceptable. The results of the model path analysis are shown in
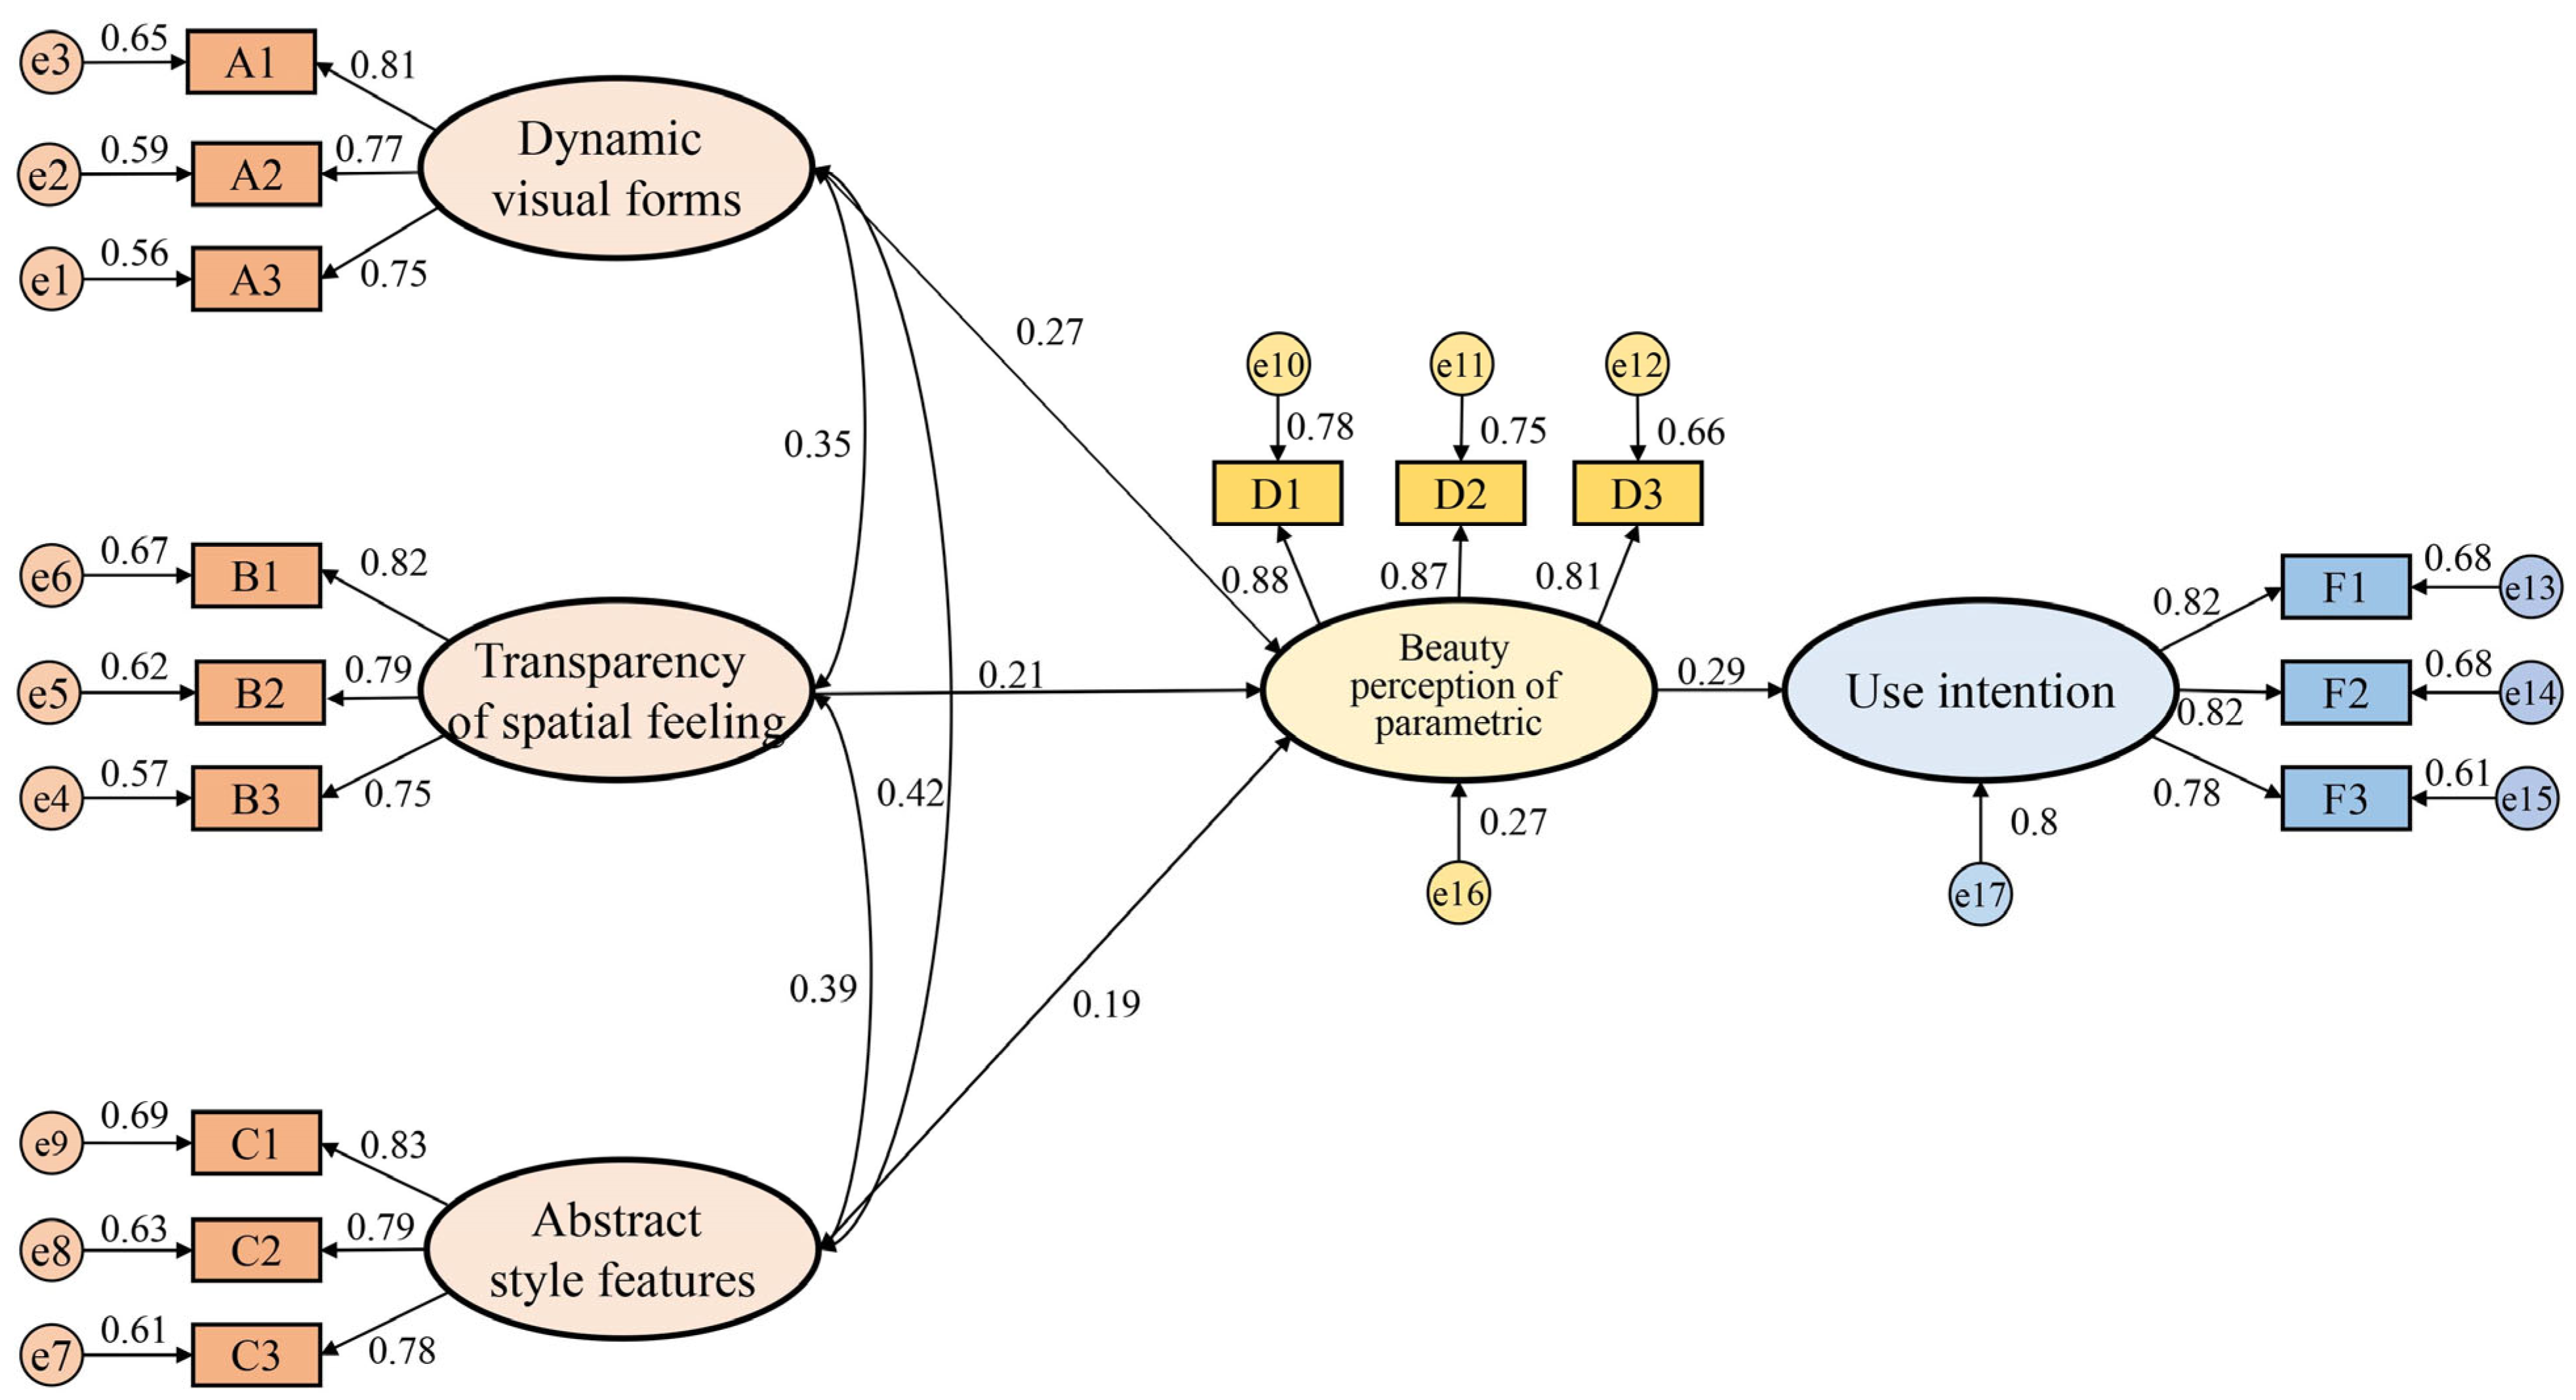
Table 9 and
Figure 13.
Based on the Structural Equation Model analysis results (
Table 9 and
Figure 13), all research hypotheses were supported. Dynamic visual forms (β = 0.27,
p < 0.001), transparency of spatial feeling (β = 0.211,
p < 0.05), and abstract style features (β = 0.192,
p < 0.05), all had a significant positive impact on beauty perception of the parametric design. Beauty perception of parametric design (β = 0.29,
p < 0.001) can influence the public’s use intention. The results of path analysis indicate that dynamic visual forms, transparency of spatial feeling, and the abstract style features of landscape facilities design are significant influencing factors for beauty perception of parametric design. In the degree of influence, dynamic visual forms are greater than transparency of spatial feeling than the abstract style features. Additionally, beauty perception of parametric design significantly influences the public’s use intention for landscape facilities (β = 0.29,
p < 0.001), this indicates that parametric landscape facilities design has a distinctive and novel beauty effect. Compared with other ordinary landscape facilities, it has a unique appeal to the public.
We mediated the effect analysis of the model using the Bootstrap method in AMOS 24.0 software. In this study, the bias-corrected percentile bootstrap method (Bootstrap = 5000) was used to analyze the mediating effect of beauty perception of parametric design between the aesthetic stimulation and the use intention of public. The bootstrap 95% confidence interval does not include 0, indicating that beauty perception of parametric design has a significant mediating effect. The analysis results are shown in
Table 10.
To sum up, the four hypotheses proposed in this study are all supported, indicating that the theoretical model constructed can explain the aesthetic cognition mechanism for parametric landscape facilities design.
Firstly, the significance of H1, H2, and H3 (p < 0.05) is supported, which indicates that the aesthetic cognition of landscape facilities is the comprehensive response of users to various beauty stimulus, and these stimulus come from the visual, spatial, and style levels of the facilities. The dynamic visual forms (β = 0.27), transparency of spatial feeling (β = 0.211), and the abstract style features (0.192) will significantly positively influence the public’s beauty perception of parametric design. The aesthetic of landscape facilities design is a complex of visual, spatial, and style, and the dynamic visual effects, transparency of spatial feeling, and abstract style are the key factors for beauty perception of parametric design. In the degree of influence, the perceived influence of dynamic visual forms, transparency of spatial feeling, and the abstract style features on parametric beauty has gradually decreased. This indicates that the dynamic combination of constantly changing shapes, the changing hollowed-out space and the simple geometric style are important factor for aesthetic cognition of parametric landscape facilities design.
Secondly, it is assumed that the significance of H4 (p < 0.001) is supported, which indicates that the beauty perception of parametric design of landscape facilities has a positive impact on the public’s use intention (β = 0.29), and landscape facilities with beauty perception of parametric design can promote the public’s active use of landscape facilities. This indicates that the public considers parametric landscape facilities design to be more attractive compared to other ordinary landscape facilities.
Thirdly, beauty perception of parametric design plays an important mediating role in the public’s willingness to use landscape facilities. Beauty perception of parametric design plays a complete mediating role between various aesthetic stimuli and the public’s usage intentions. This indicates that dynamic visual effects, transparency of spatial feeling, and abstract art styles need to be combined with each other and make the public perceive beauty of parametric landscape facilities, at the same time, this kind of distinctive beauty sense is attractive to the general public.
3.2. Design Feature Extraction Based on Forward Kansei Engineering
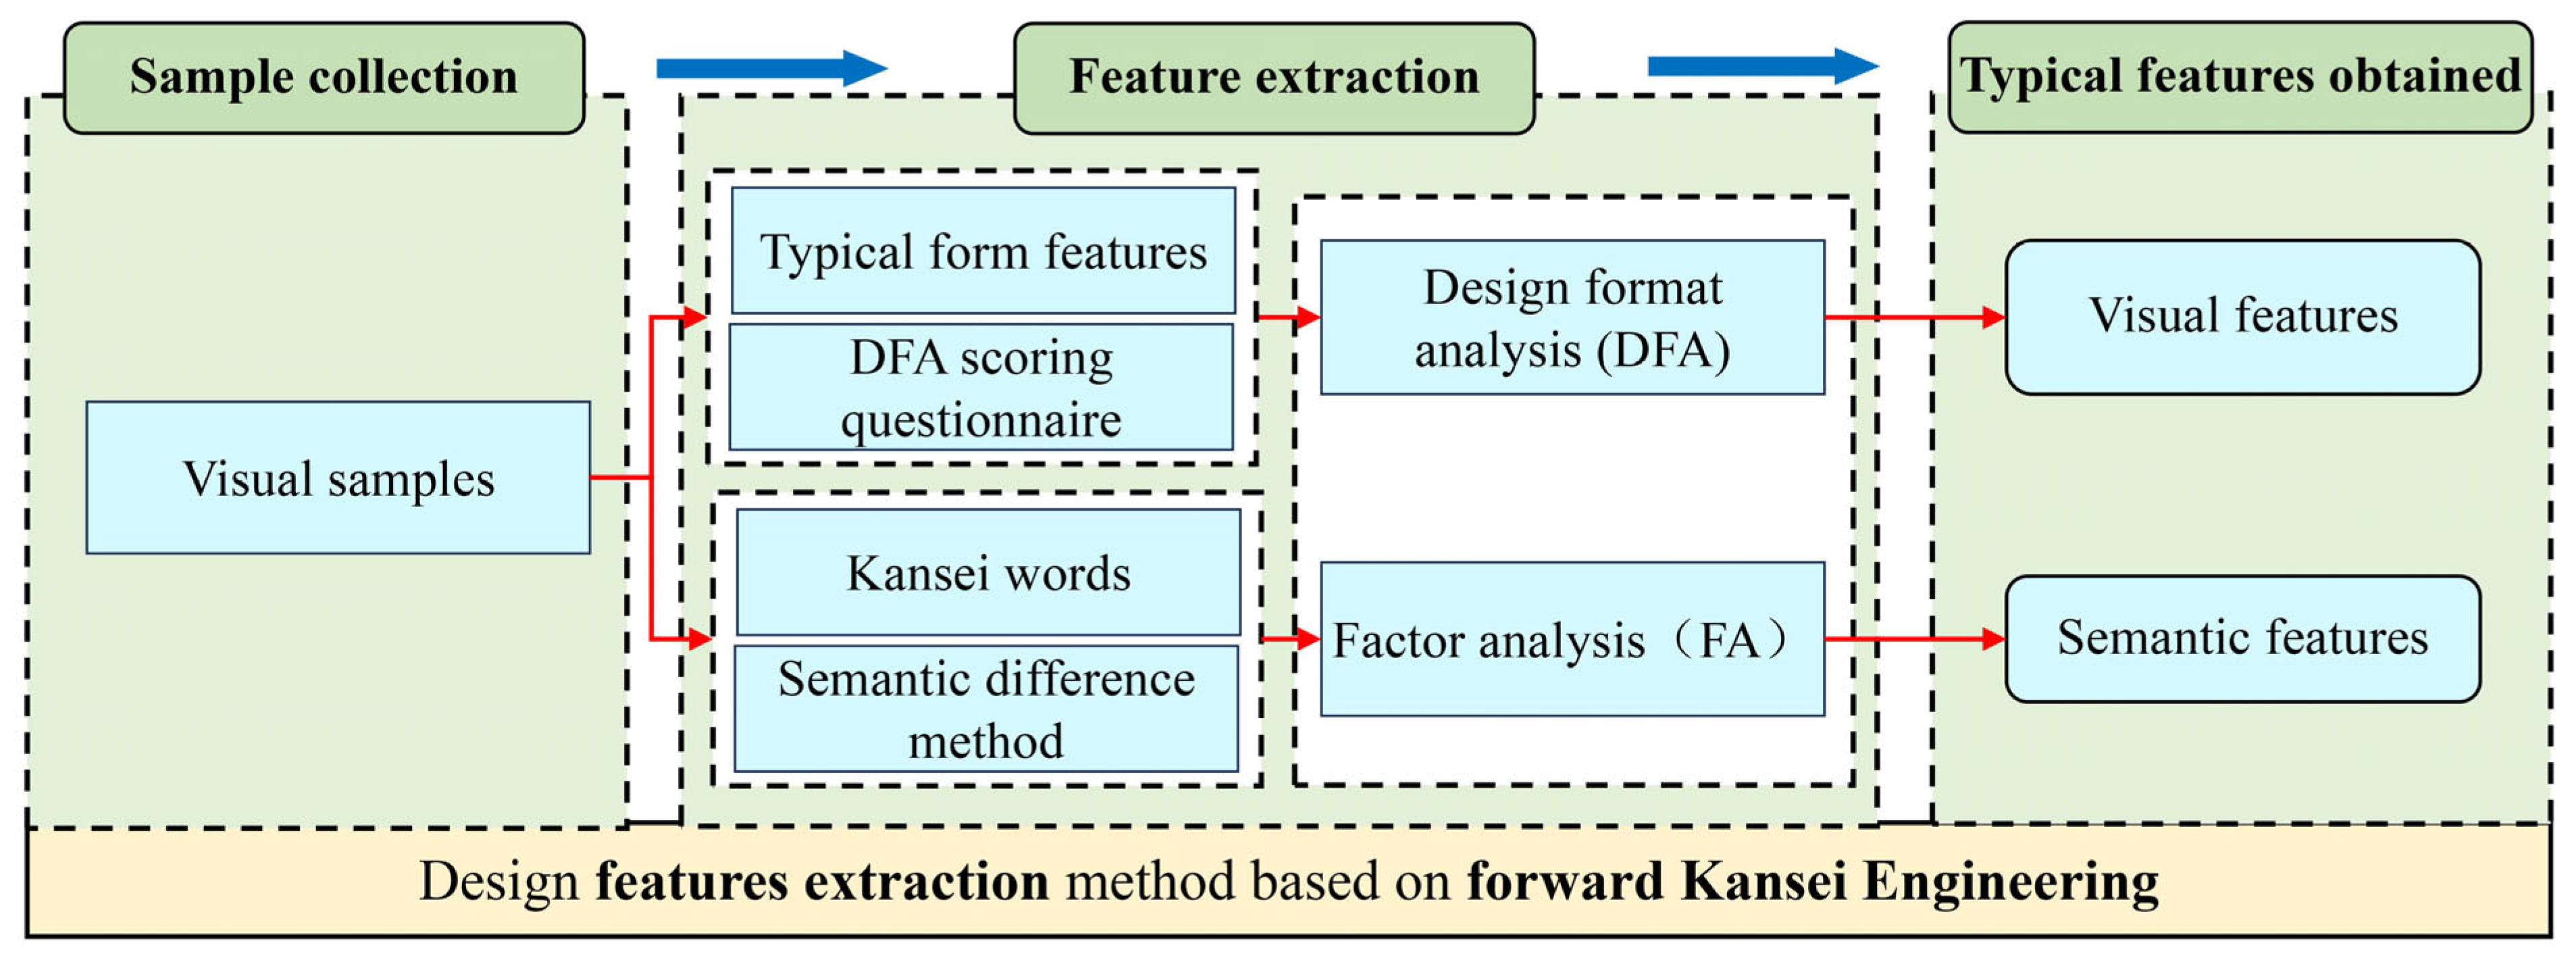
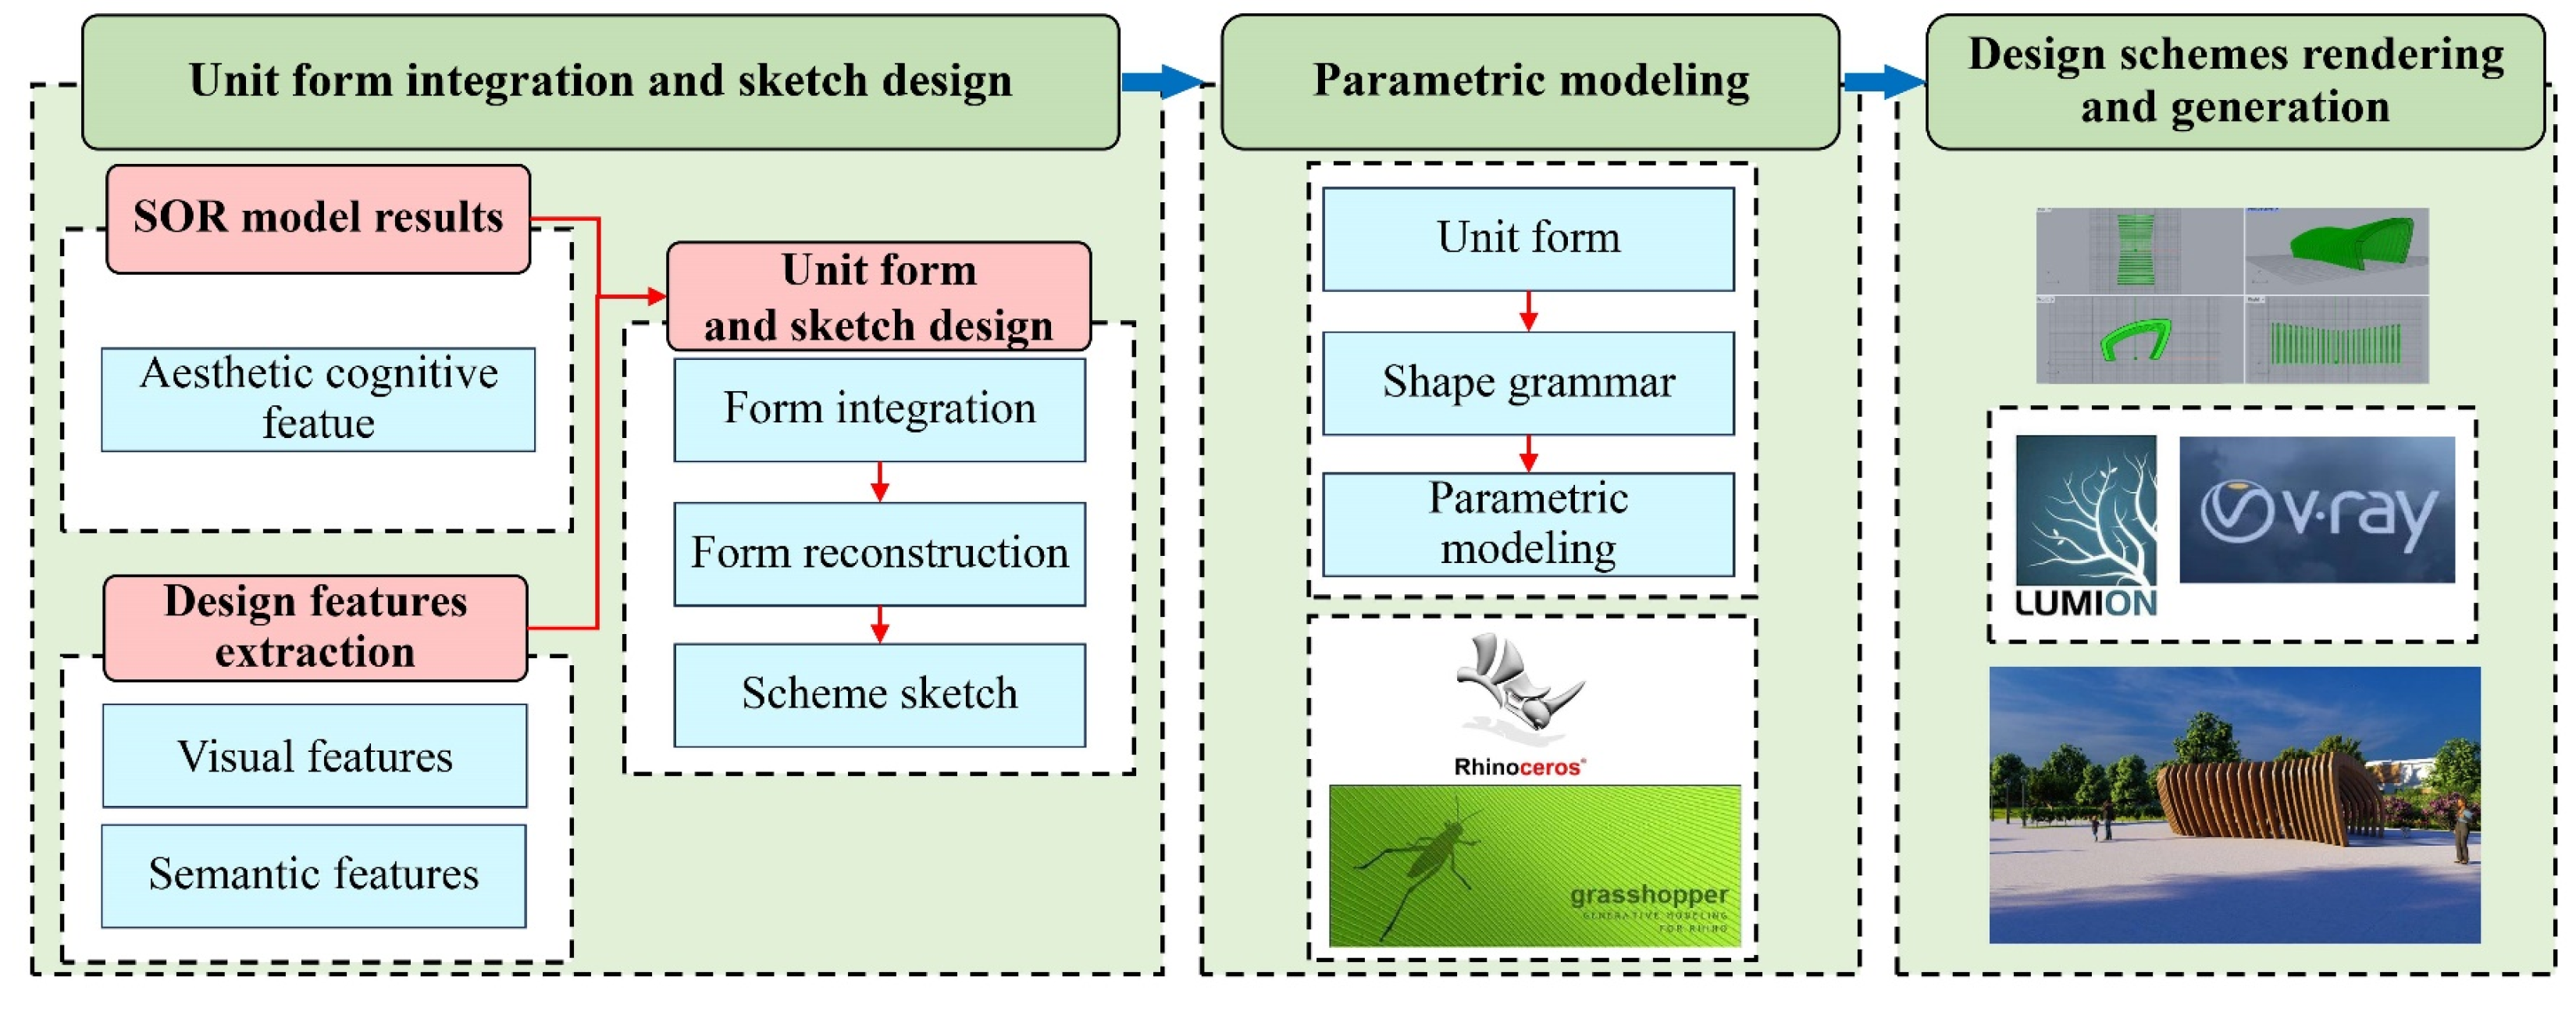
This section is based on analysis results of aesthetic cognition, forward Kansei Engineering is used to extract design features, providing a reference for parametric modeling and design.
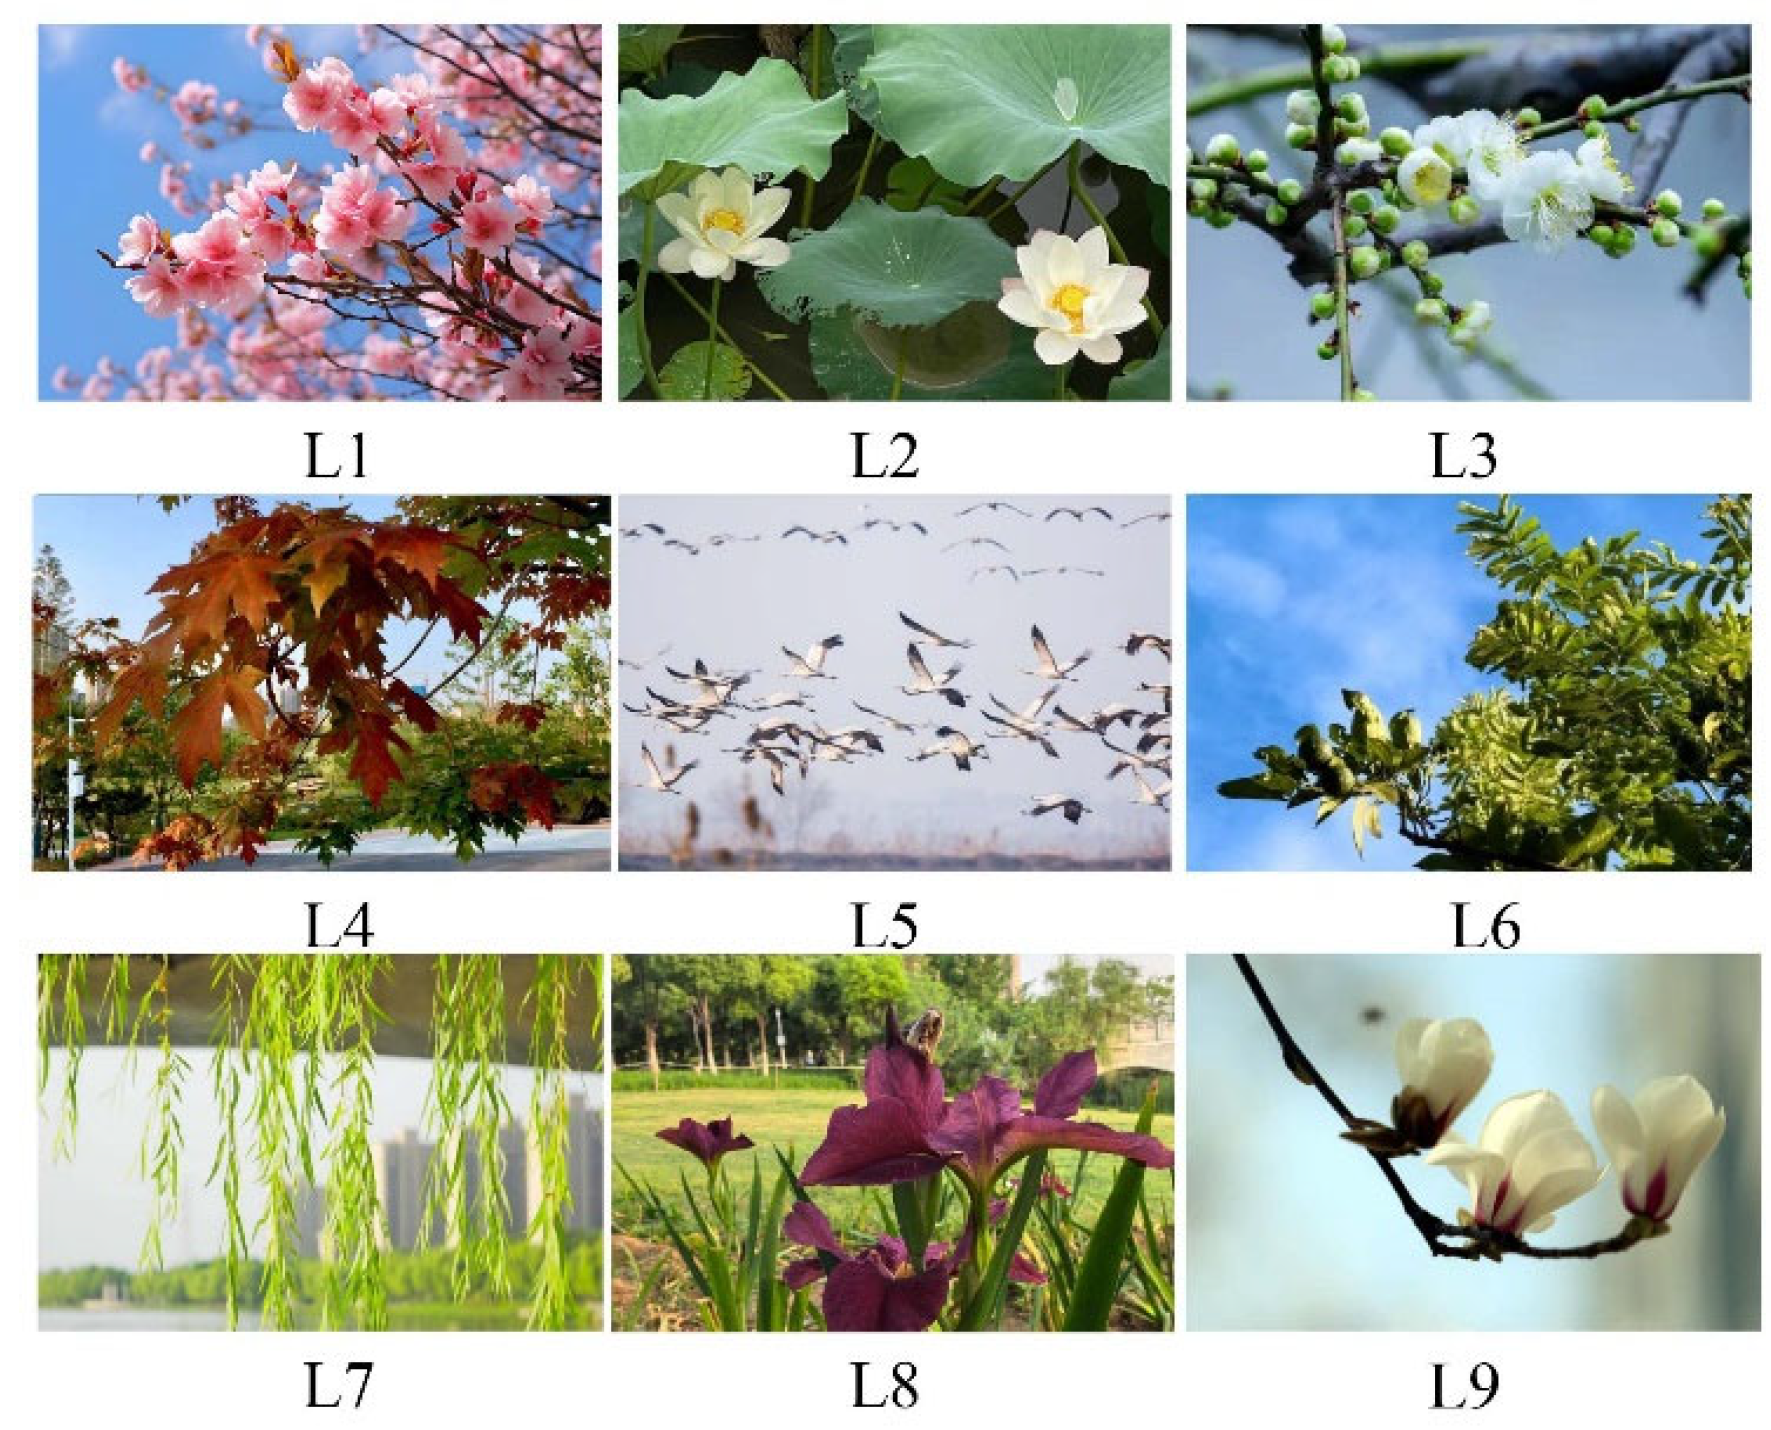
Firstly, based on the analysis results of the SOR model in the previous text, select relatively abstract visual image samples with a dynamic feel. In this study, we select flowers and plants as the sources of visual samples. After screening and comparison, the visual samples that were unclear and had low recognition were removed, nine visual samples (L1–L9) were selected, as shown in
Figure 14.
Secondly, and through the analysis of the form features of the visual samples, the form features collection (M1–M6) were extracted, respectively, from the arc shape and the turning shape, as shown in
Figure 15.
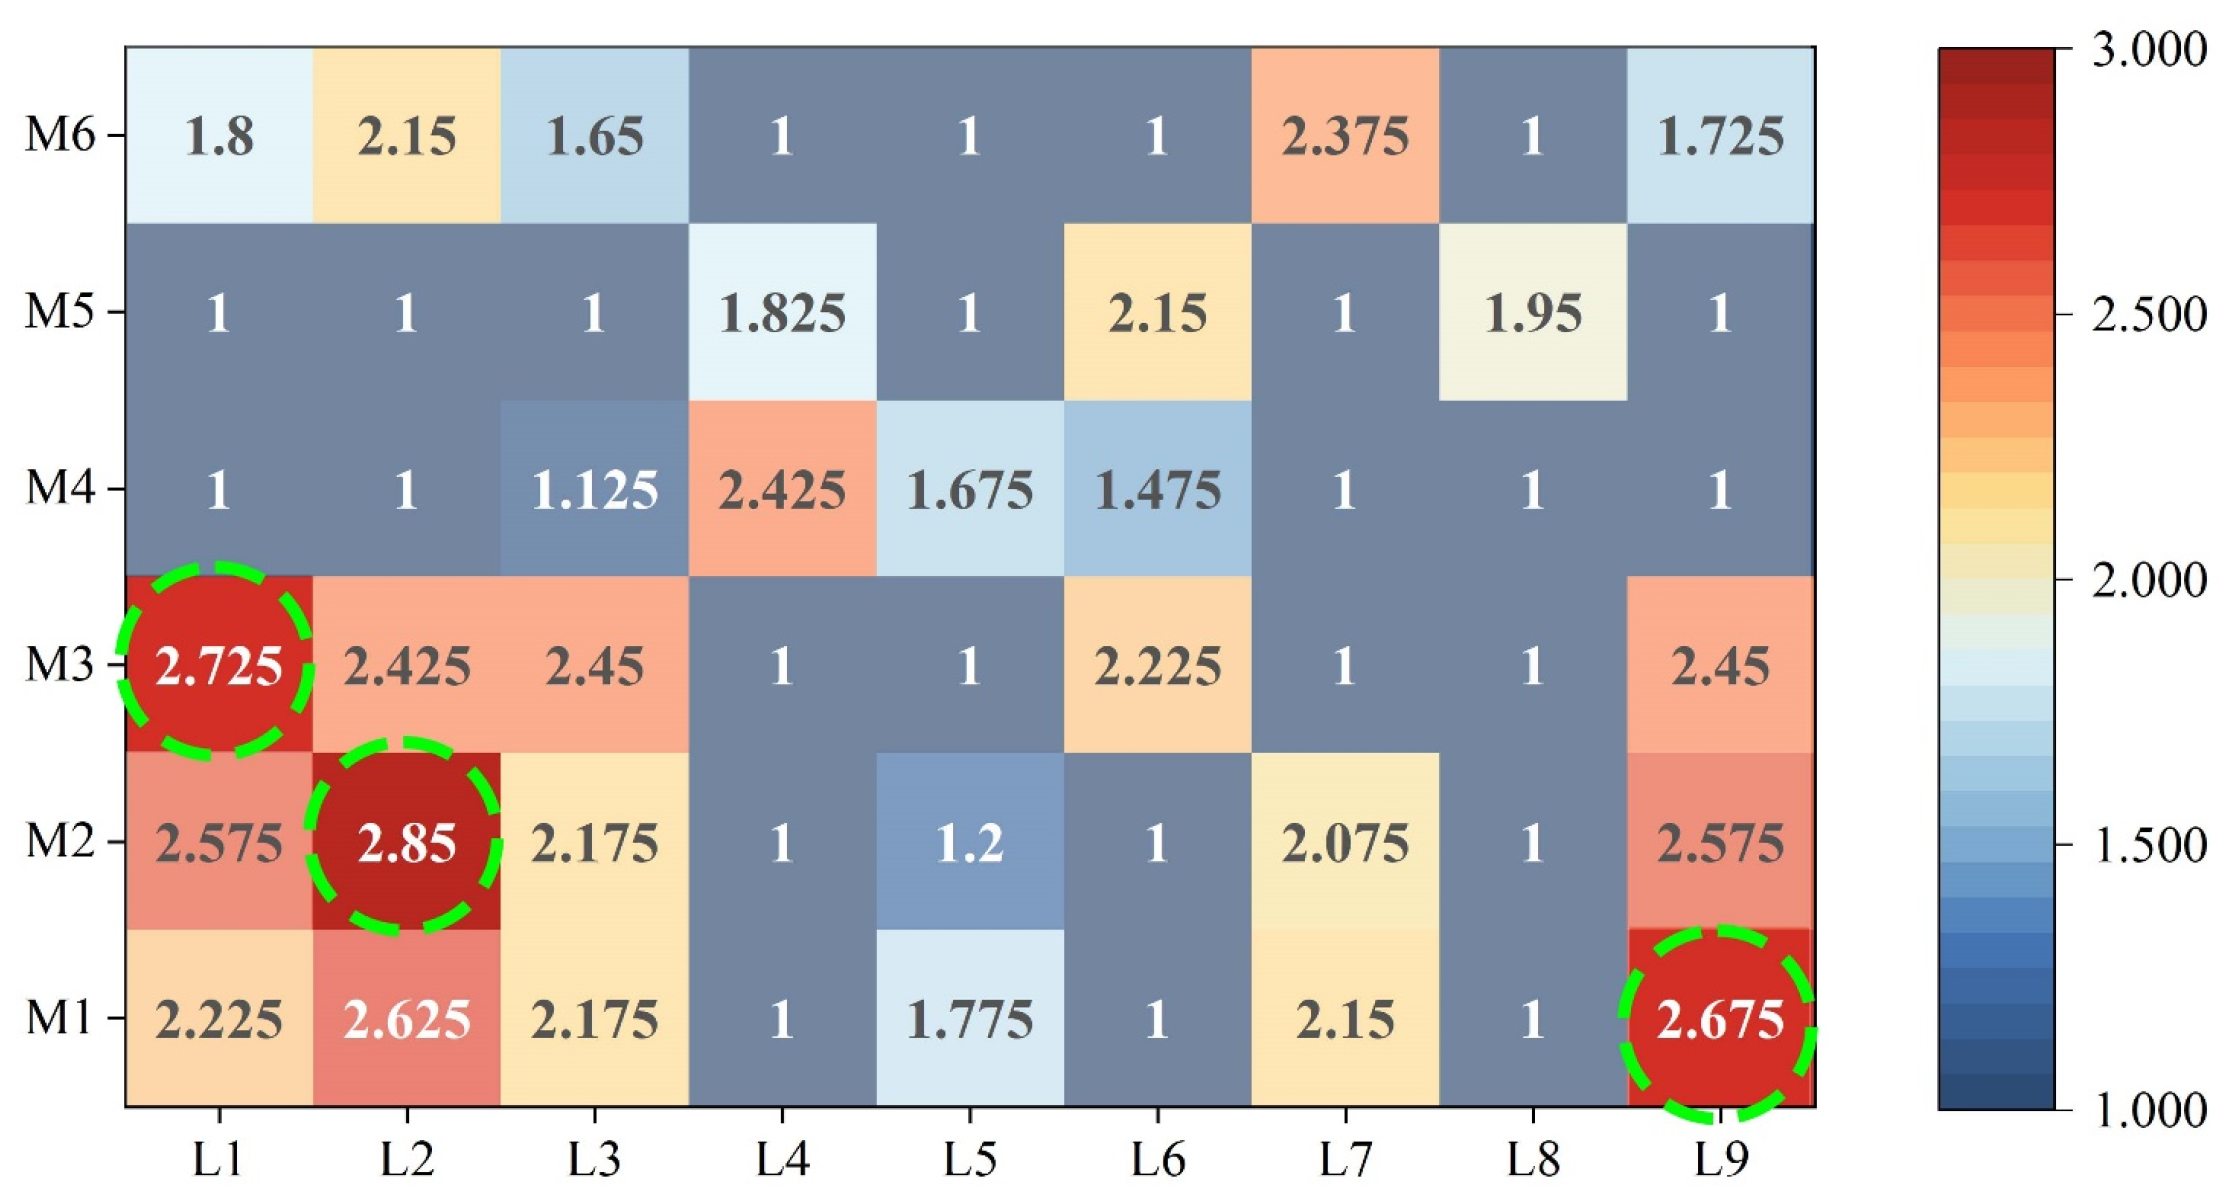
The DFA method is used to extract the typical form features of visual samples. Typical visual features were obtained by scoring the degree of association between nine samples (
Figure 14L1–L9) and six form features (
Figure 15M1–M6), and the scoring was conducted using a questionnaire. The scale is 1–3 point, higher scores indicate strong correlation of corresponding features.
All subjects are 80 adults who have normal vision and no color deficiencies, and can understand the content and purpose of the questionnaire. Among them, there are 42 males and 38 females, 57 from art and design majors, and 23 from non-art and design majors. A total of 80 valid questionnaires were retrieved, and the effective recovery rate of the questionnaires was 100%. Equation (1) was used to calculate the questionnaire scores, the results are presented in
Table 11. T1 is the total score of six typical form features (M1–M6), T2 is the total score of nine visual samples (L1–L9).
According to
Table 11, at the visual-sample level, the ranking is L2 > L9 > L1> L3 > L7 > L6 > L4> L5 > L8. In the form feature level, M1 >M2 > M3> M6> M5> M4. In this study, we select the top three feature elements as typical features. L1, L2, and L9 were selected as representative visual samples, and M1, M2, and M3 as representative form features, as shown in
Figure 16.
Thirdly, the implicit semantic features of flowers and plants were extracted using Factor Analysis (FA). Representative adjectives were selected based on the literature on landscape aesthetic design [
65,
66,
67]. These adjectives were used to constitute positive-inverse phrases, which can be used as Kansei word group, as shown in
Table 12.
The matching degree between eight Kansei word groups and nine visual samples was measured by a 7-point Likert scale (scale: −3 to 3) via a questionnaire administered to 80 subjects (the composition of the subjects was the same as that of the DFA experiment), the example of Kansei word groups questionnaire is shown in
Table 13.
The effective recovery rate of the questionnaires was 100%, and the mean values of the questionnaire score results are shown in
Table 14.
The questionnaire data were imported into SPSS 22 for Factor Analysis. The Cronbach’s α was 0.922, which indicates that the questionnaire has good reliability. The KMO value was 0.547, and Bartlett’s test yielded 0.000, (<1%), indicating that the data were suitable for Factor Analysis. The total variance explained are presented in
Table 15.
The results of FA are shown in
Figure 17. In
Figure 17a, the second factor begins to stabilize. In
Figure 17b, the first two factors can explain most of the data of the variable. In
Figure 17c, the composition of the two factors can be obtained.
The first two factors explain 87.725% of the total variable, so the number of extracted factors was set to two, which can explain most of the information about the variable. The factors were rotated with the maximum variance method, and factor classification of Kansei word groups is according to the absolute value of rotated component matrix; the rotated component matrix is shown in
Table 16.
Factor 1 consisted of S2 (lively-dull), S3 (elegant-vulgar), S4 (kind-cold), S5 (exquisite-rough), and S6 (soft-stiff), named the emotional factor, which mainly reflect elegance and affinity of visual samples.
Factor 2 consisted of S1 (flow-static), S7 (simple-complex), and S8 (fresh-stale), named the style factor, which mainly reflects flowing simple style of visual samples.
In conclusion, the semantic features are mainly reflected in the emotional features of elegance and affinity, and it embodies a simple and fluid artistic style.
3.4. Evaluation of Design Schemes Based on Backward Kansei Engineering
In this section, based on the scheme creation of parametric design, five design schemes were evaluated using backward Kansei Engineering. The beauty sense data of different design schemes were further analyzed to verify the aesthetic quality of the design schemes.
Firstly, the weights of aesthetic indicators are calculated by using the AHP. Based on Equations (3)–(9), combined with the evaluation indicators of landscape facilities design, this study invited 10 experts to score each indicator, the expert group comes from both theoretical research and design practice fields, including doctor and associate professor in landscape and product design, as well as designers with over 5 years of experience in landscape design. This composition makes the results of the questionnaire data balanced and objective.
Take Expert 1 as an example. The judgment matrix
A1 of j based on expert scores is as follows:
The calculation results satisfy the criterion CR < 0.1 in
Table 18,
Table 19,
Table 20 and
Table 21. This indicates that the consistency of the judgment matrix passes the test. The overall weight can be obtained by multiplying the first-level index weight and the second-level index weight. The weight analysis of evaluation indicators of color design is shown in
Table 22.
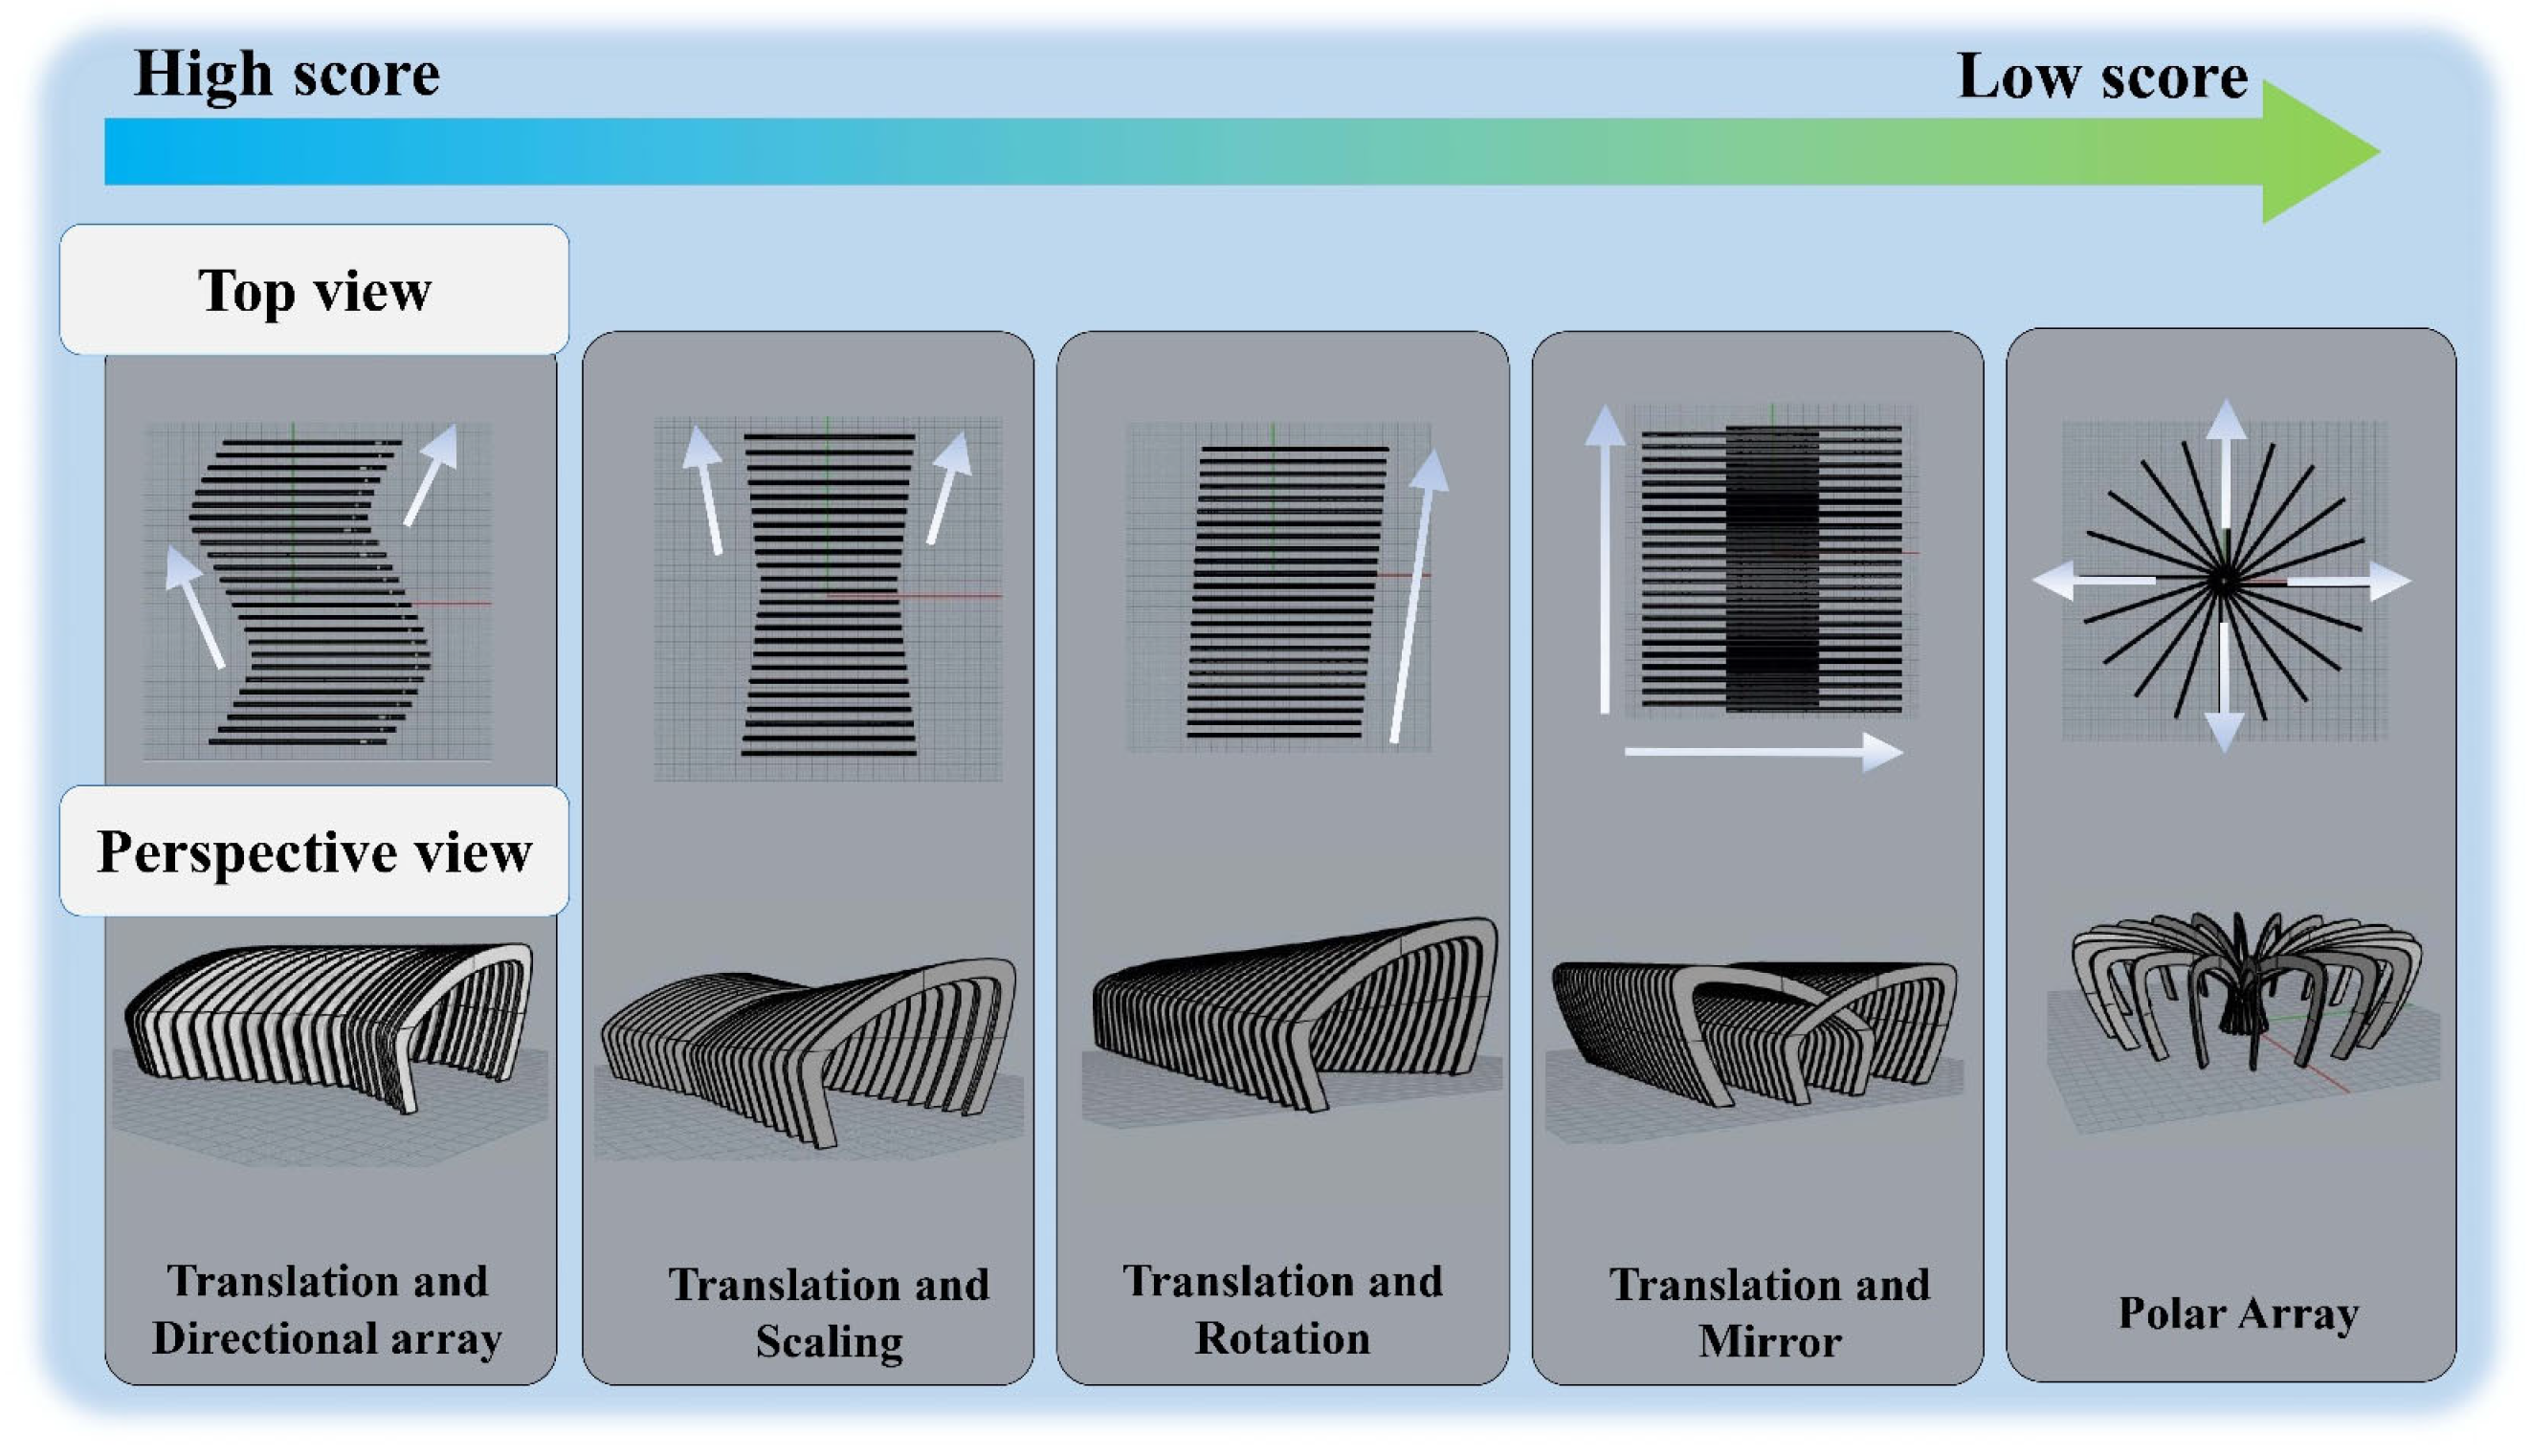
AHP-FCE is used to evaluate the design scheme. The evaluation is divided into five levels: excellent, good, general, poor, and very poor. The purpose of AHP-FCE is to evaluate the beauty sense of five design schemes for the general public. Therefore, the subjects are all randomly selected 50 from the general public and urban residents (in order to ensure that the questionnaire was valid, all participants were adults). Each participant selected the grades of each indicator of the five design schemes (T1–T5), respectively.
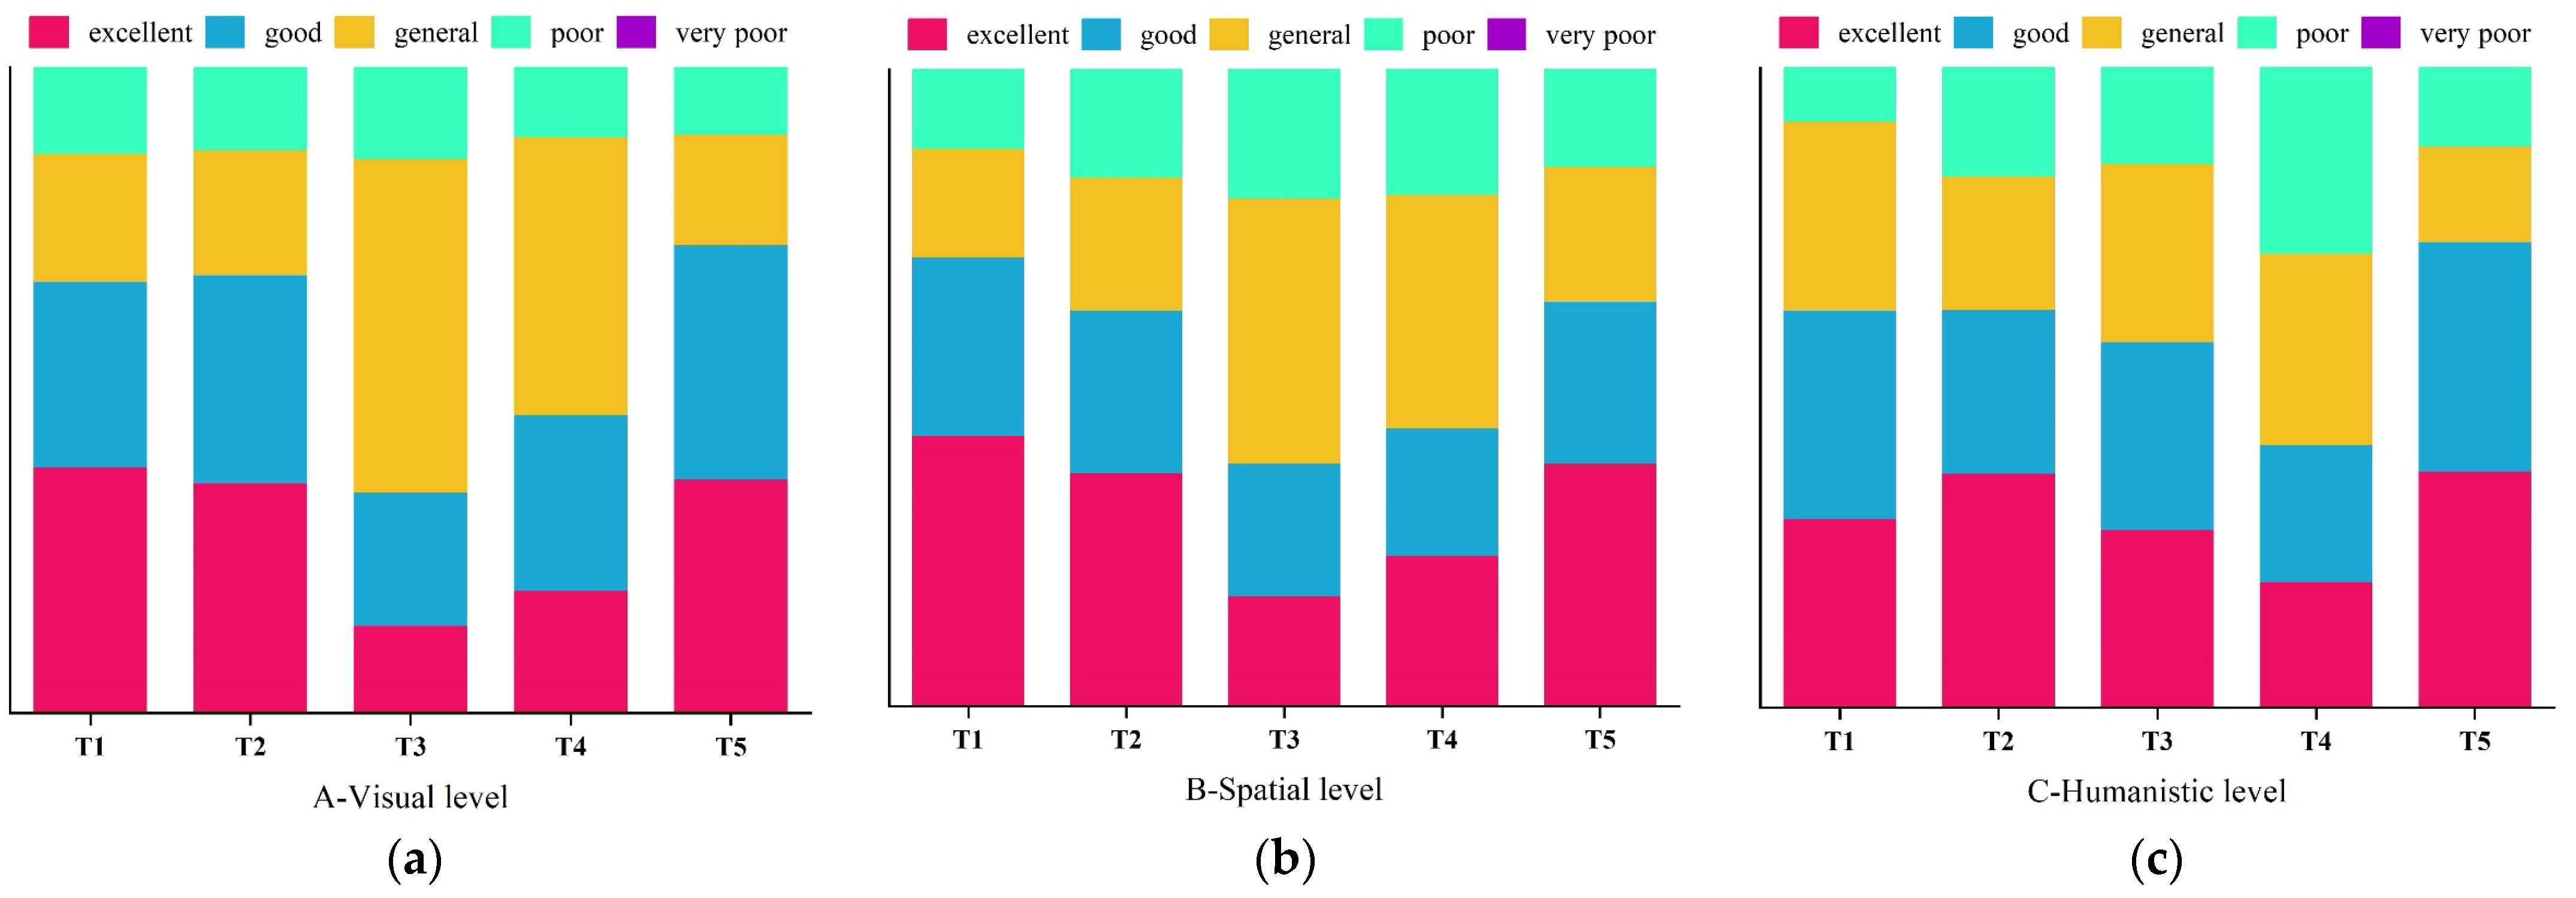
The weighted average algorithm M(·, +) is used to calculate the membership degree of the first level. The calculation method is Equations (12) and (13). The excellent, good, general, poor, and very poor membership of first-level indicator levels A (X
1a), B (X
1b), and C (X
1c) of design scheme T1 can be calculated.
By the same method, the excellent, good, general, poor, and very poor membership of the first-level indicator of scheme T2–T5 can be calculated.
The excellent, good, general, poor, and very poor membership of first-level indicator for scheme T2 are as follows.
The excellent, good, general, poor, and very poor membership of the first-level indicator for scheme T3 are as follows.
The excellent, good, general, poor, and very poor membership of the first-level indicator for scheme T4 are as follows.
The excellent, good, general, poor, and very poor membership of the first-level indicator for scheme T5 are as follows.
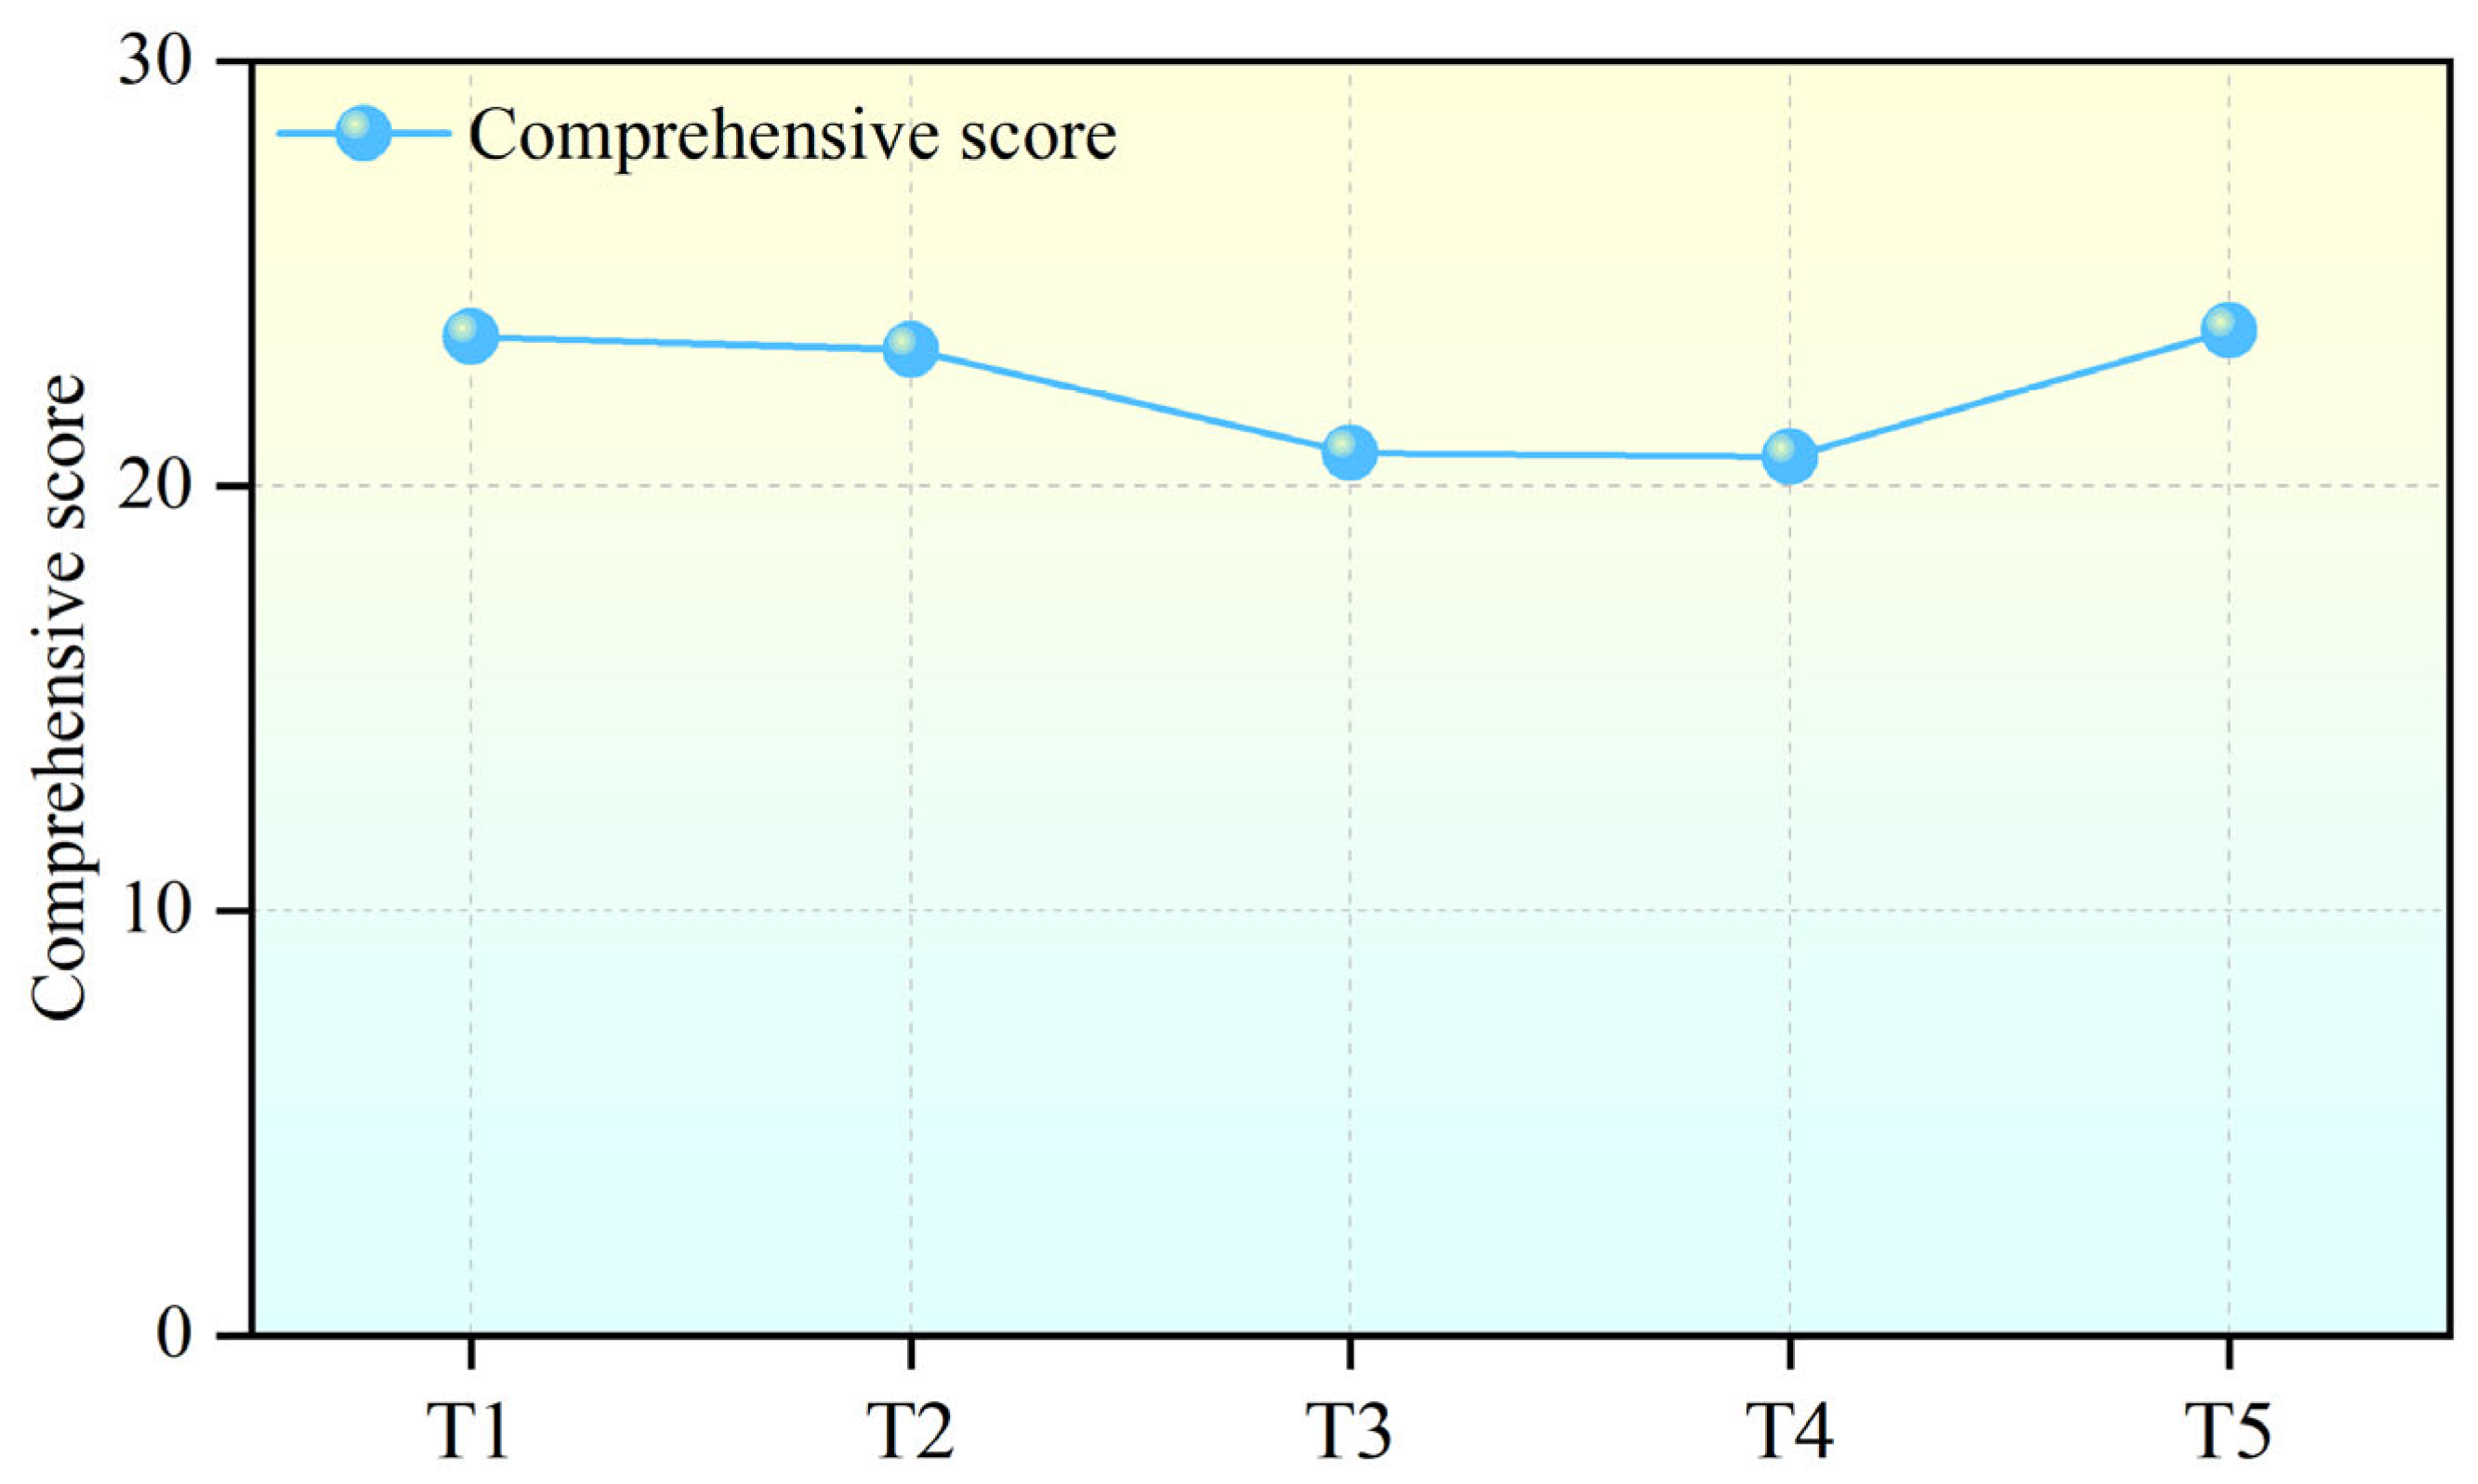
Based on the calculation results of the membership degree, the comprehensive scores of each design scheme can be calculated as according to Equation (14). The calculation process of scheme T1 is as follows.
By using the same method, the comprehensive score of the five design schemes are shown in
Table 23.
