Key Construction Materials for a Streamlined Building Life Cycle Assessment: A Meta-Analysis of 100 G-SEED Projects
Abstract
1. Introduction
2. Literature Review
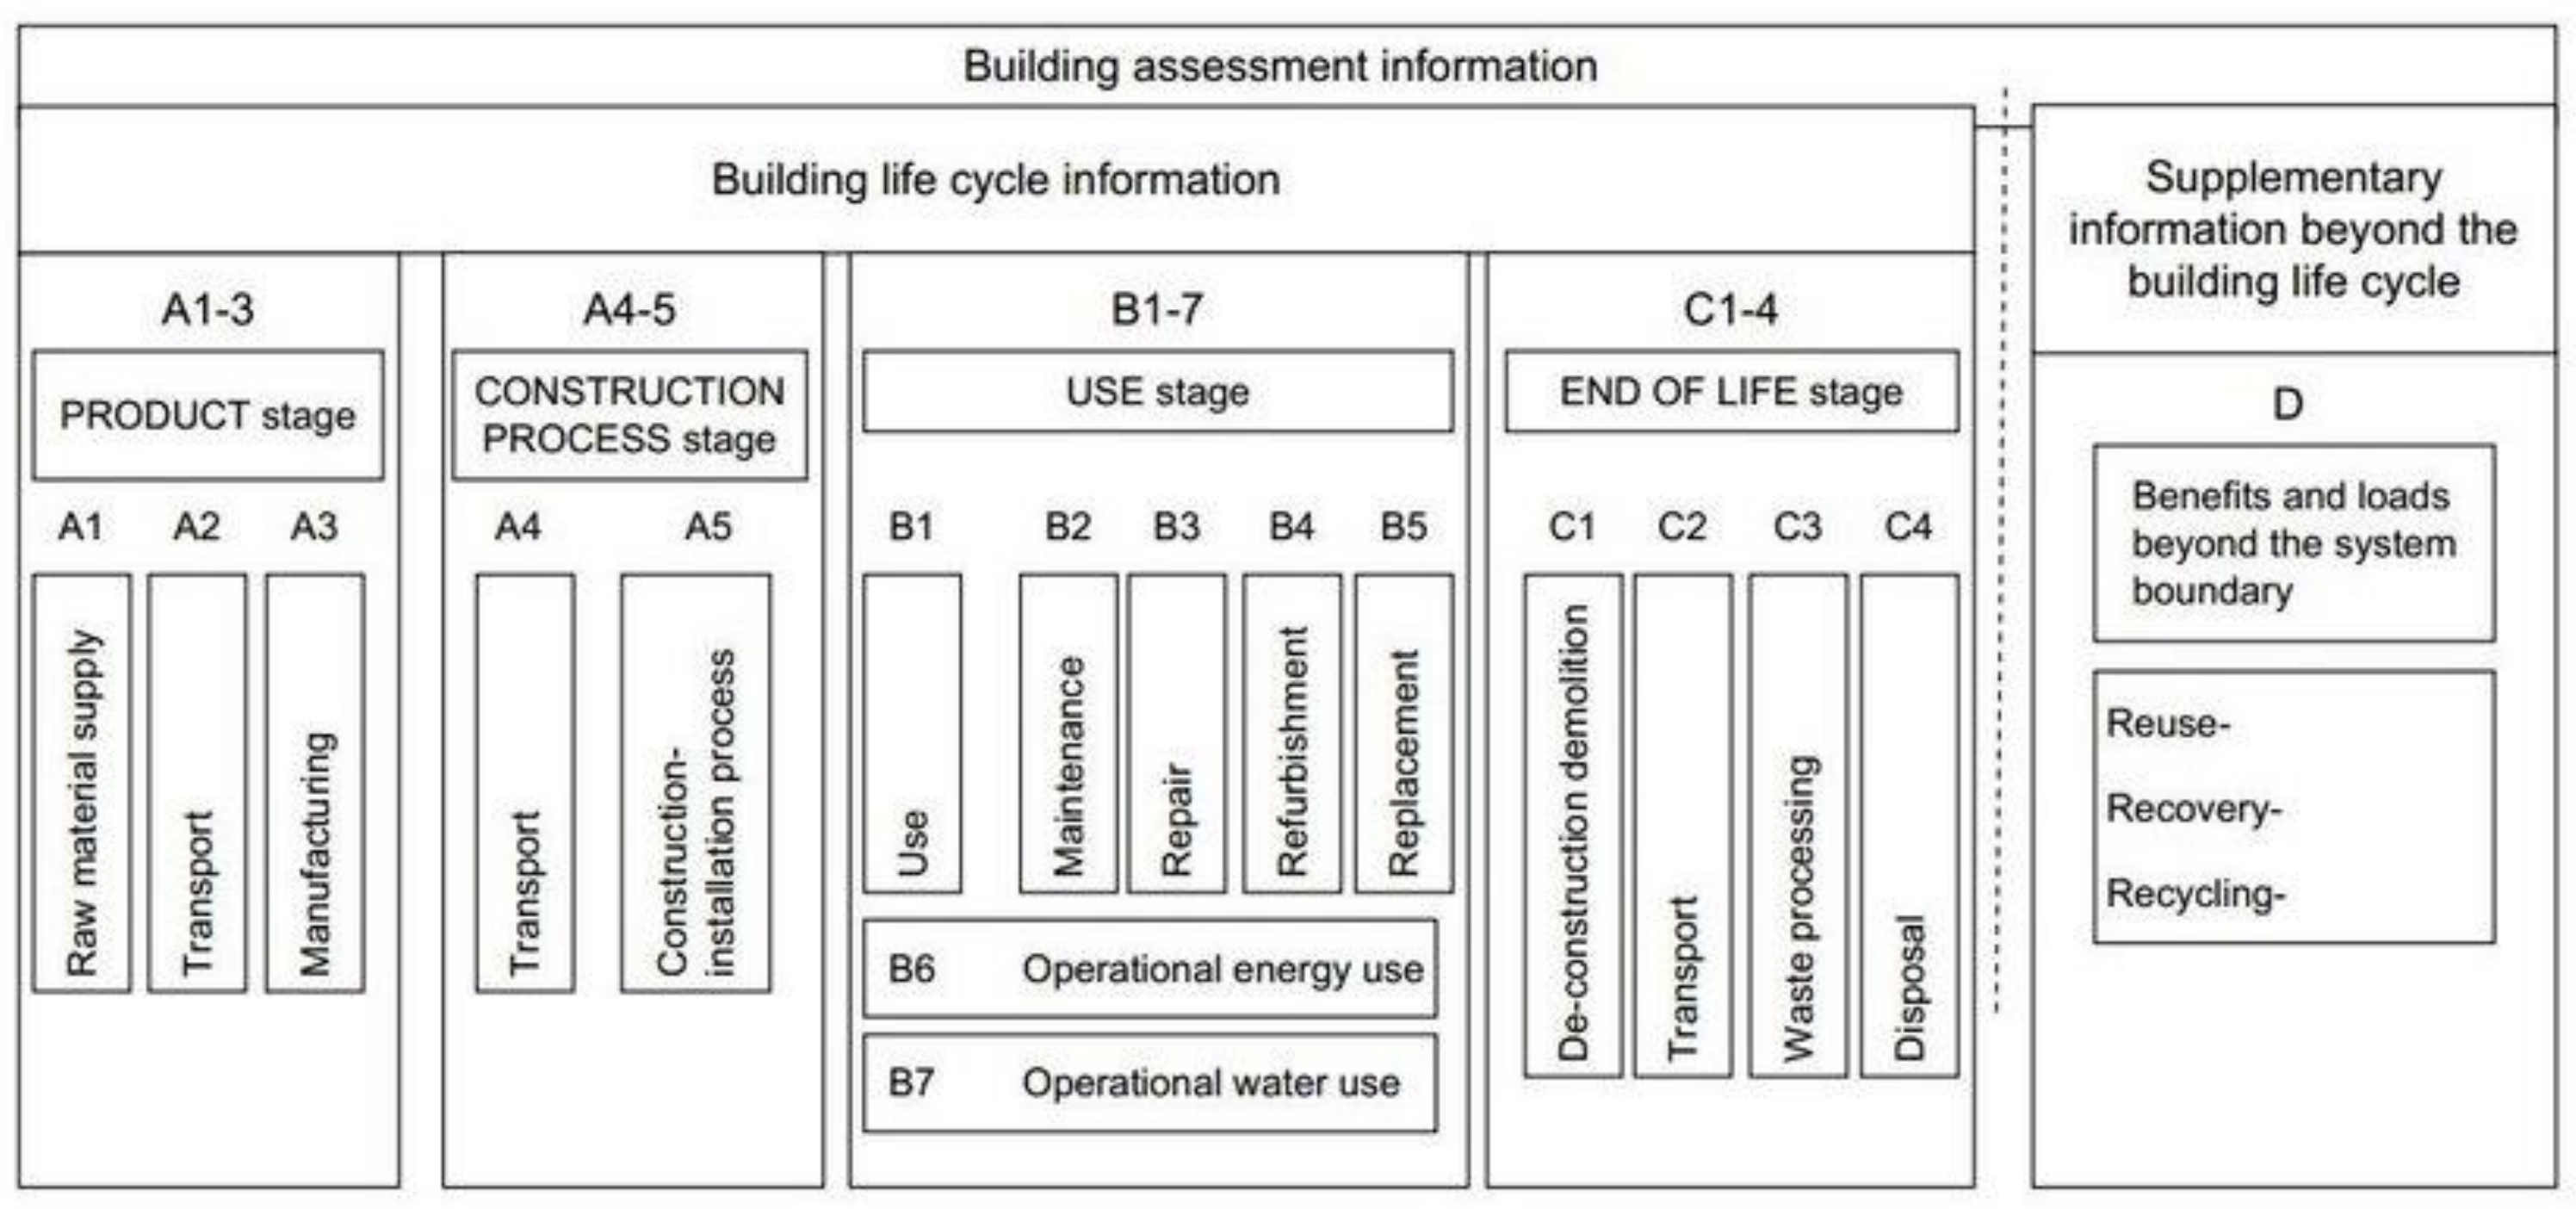
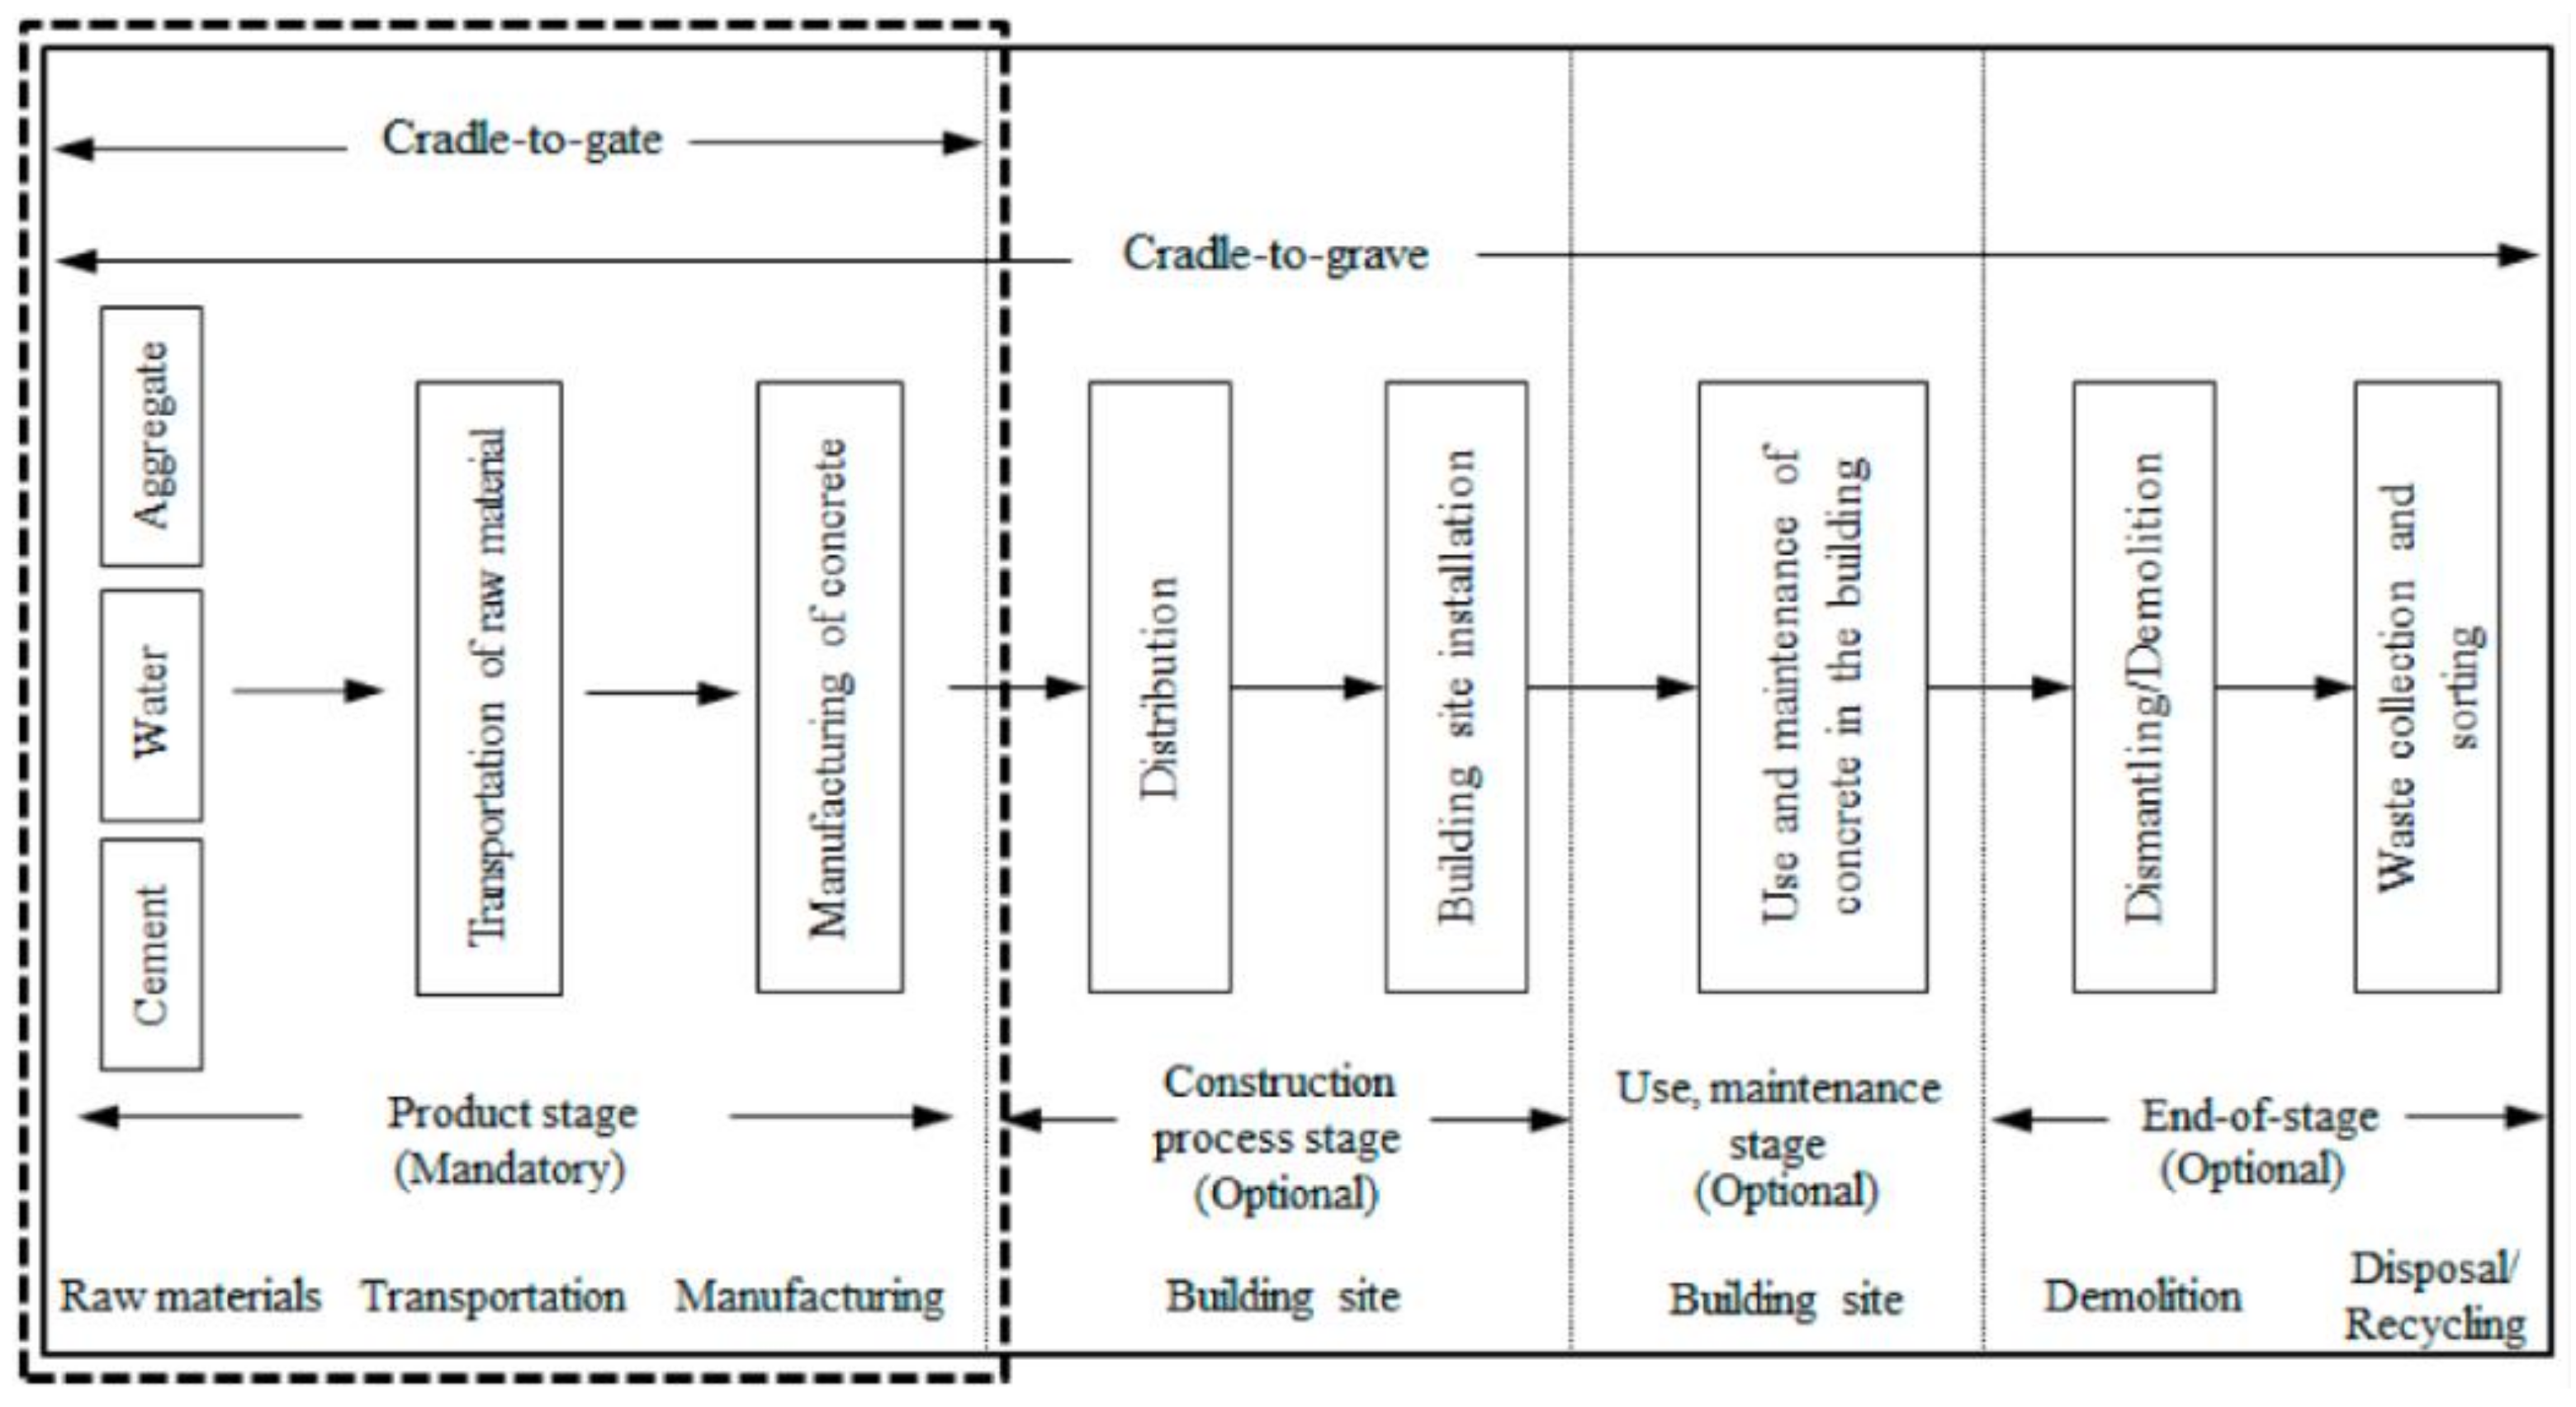
2.1. Overview of LCA in Buildings
2.2. Embodied Carbon and Material Contributions
2.3. Material Classification and Prioritization
2.4. Role of LCA in Certification and Policy
2.5. Practical Challenges in LCA Implementation
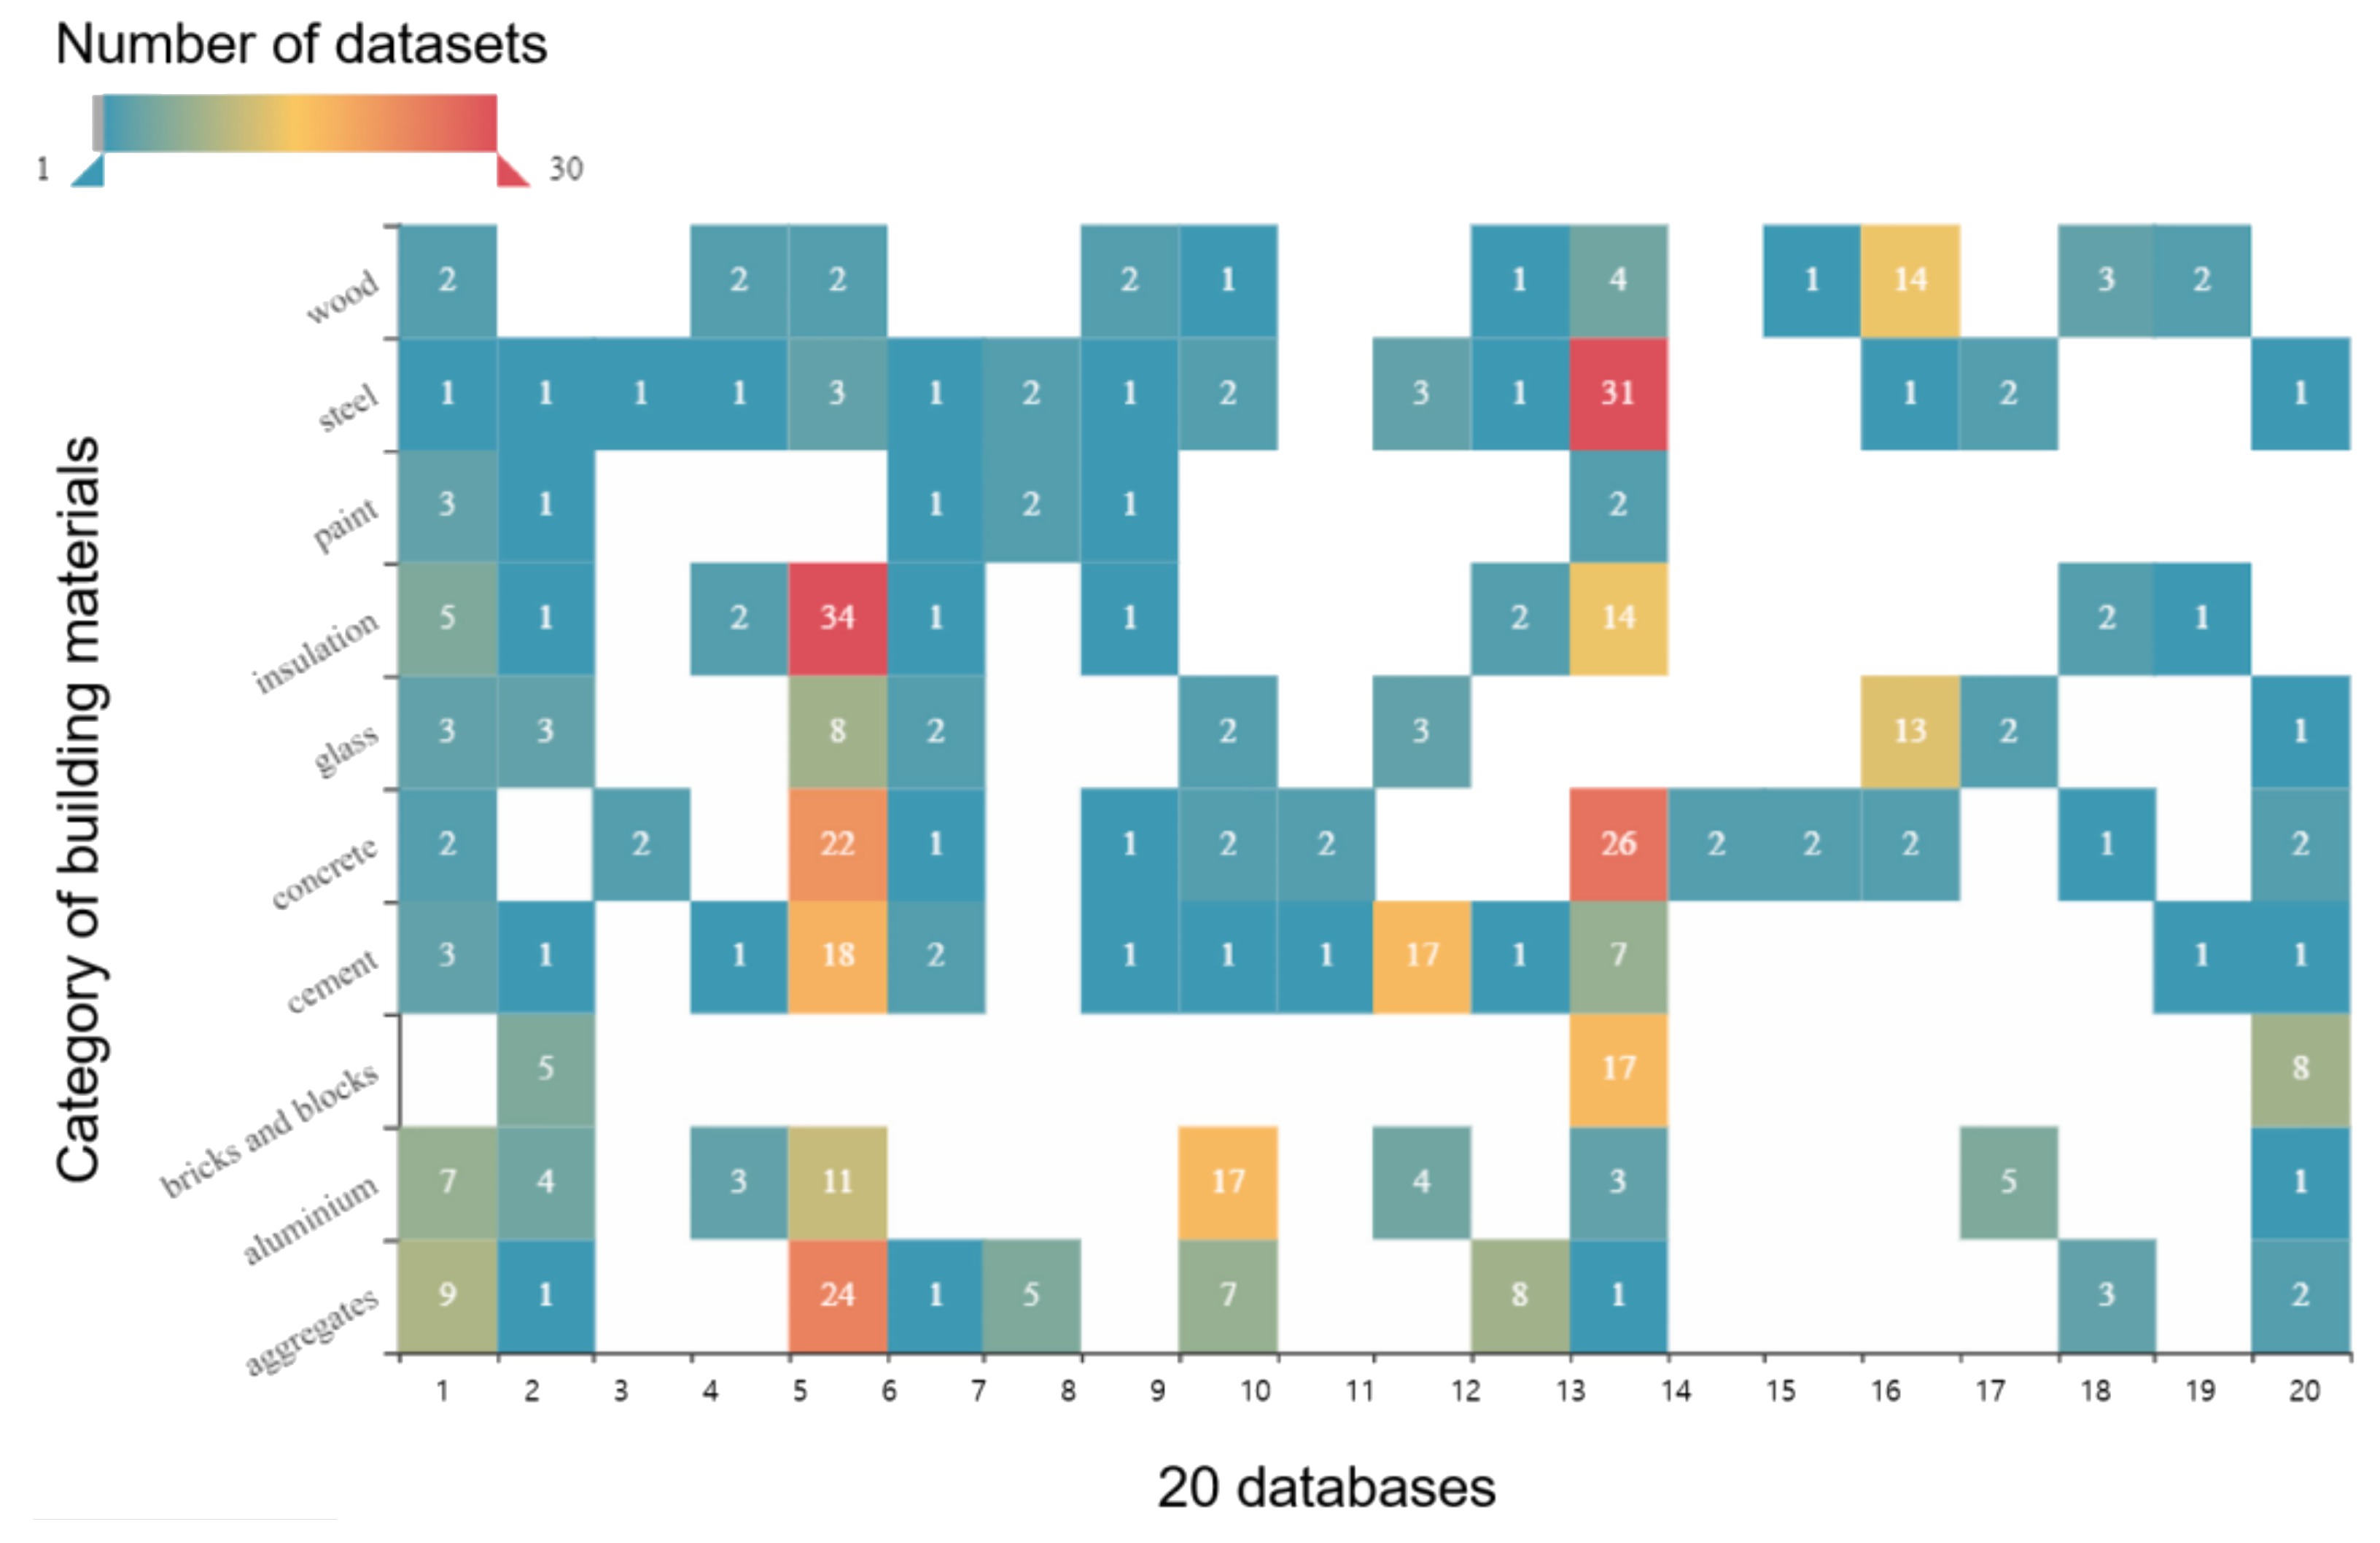
2.6. Summary of Literature Review
3. Data Collection and Analysis of Results
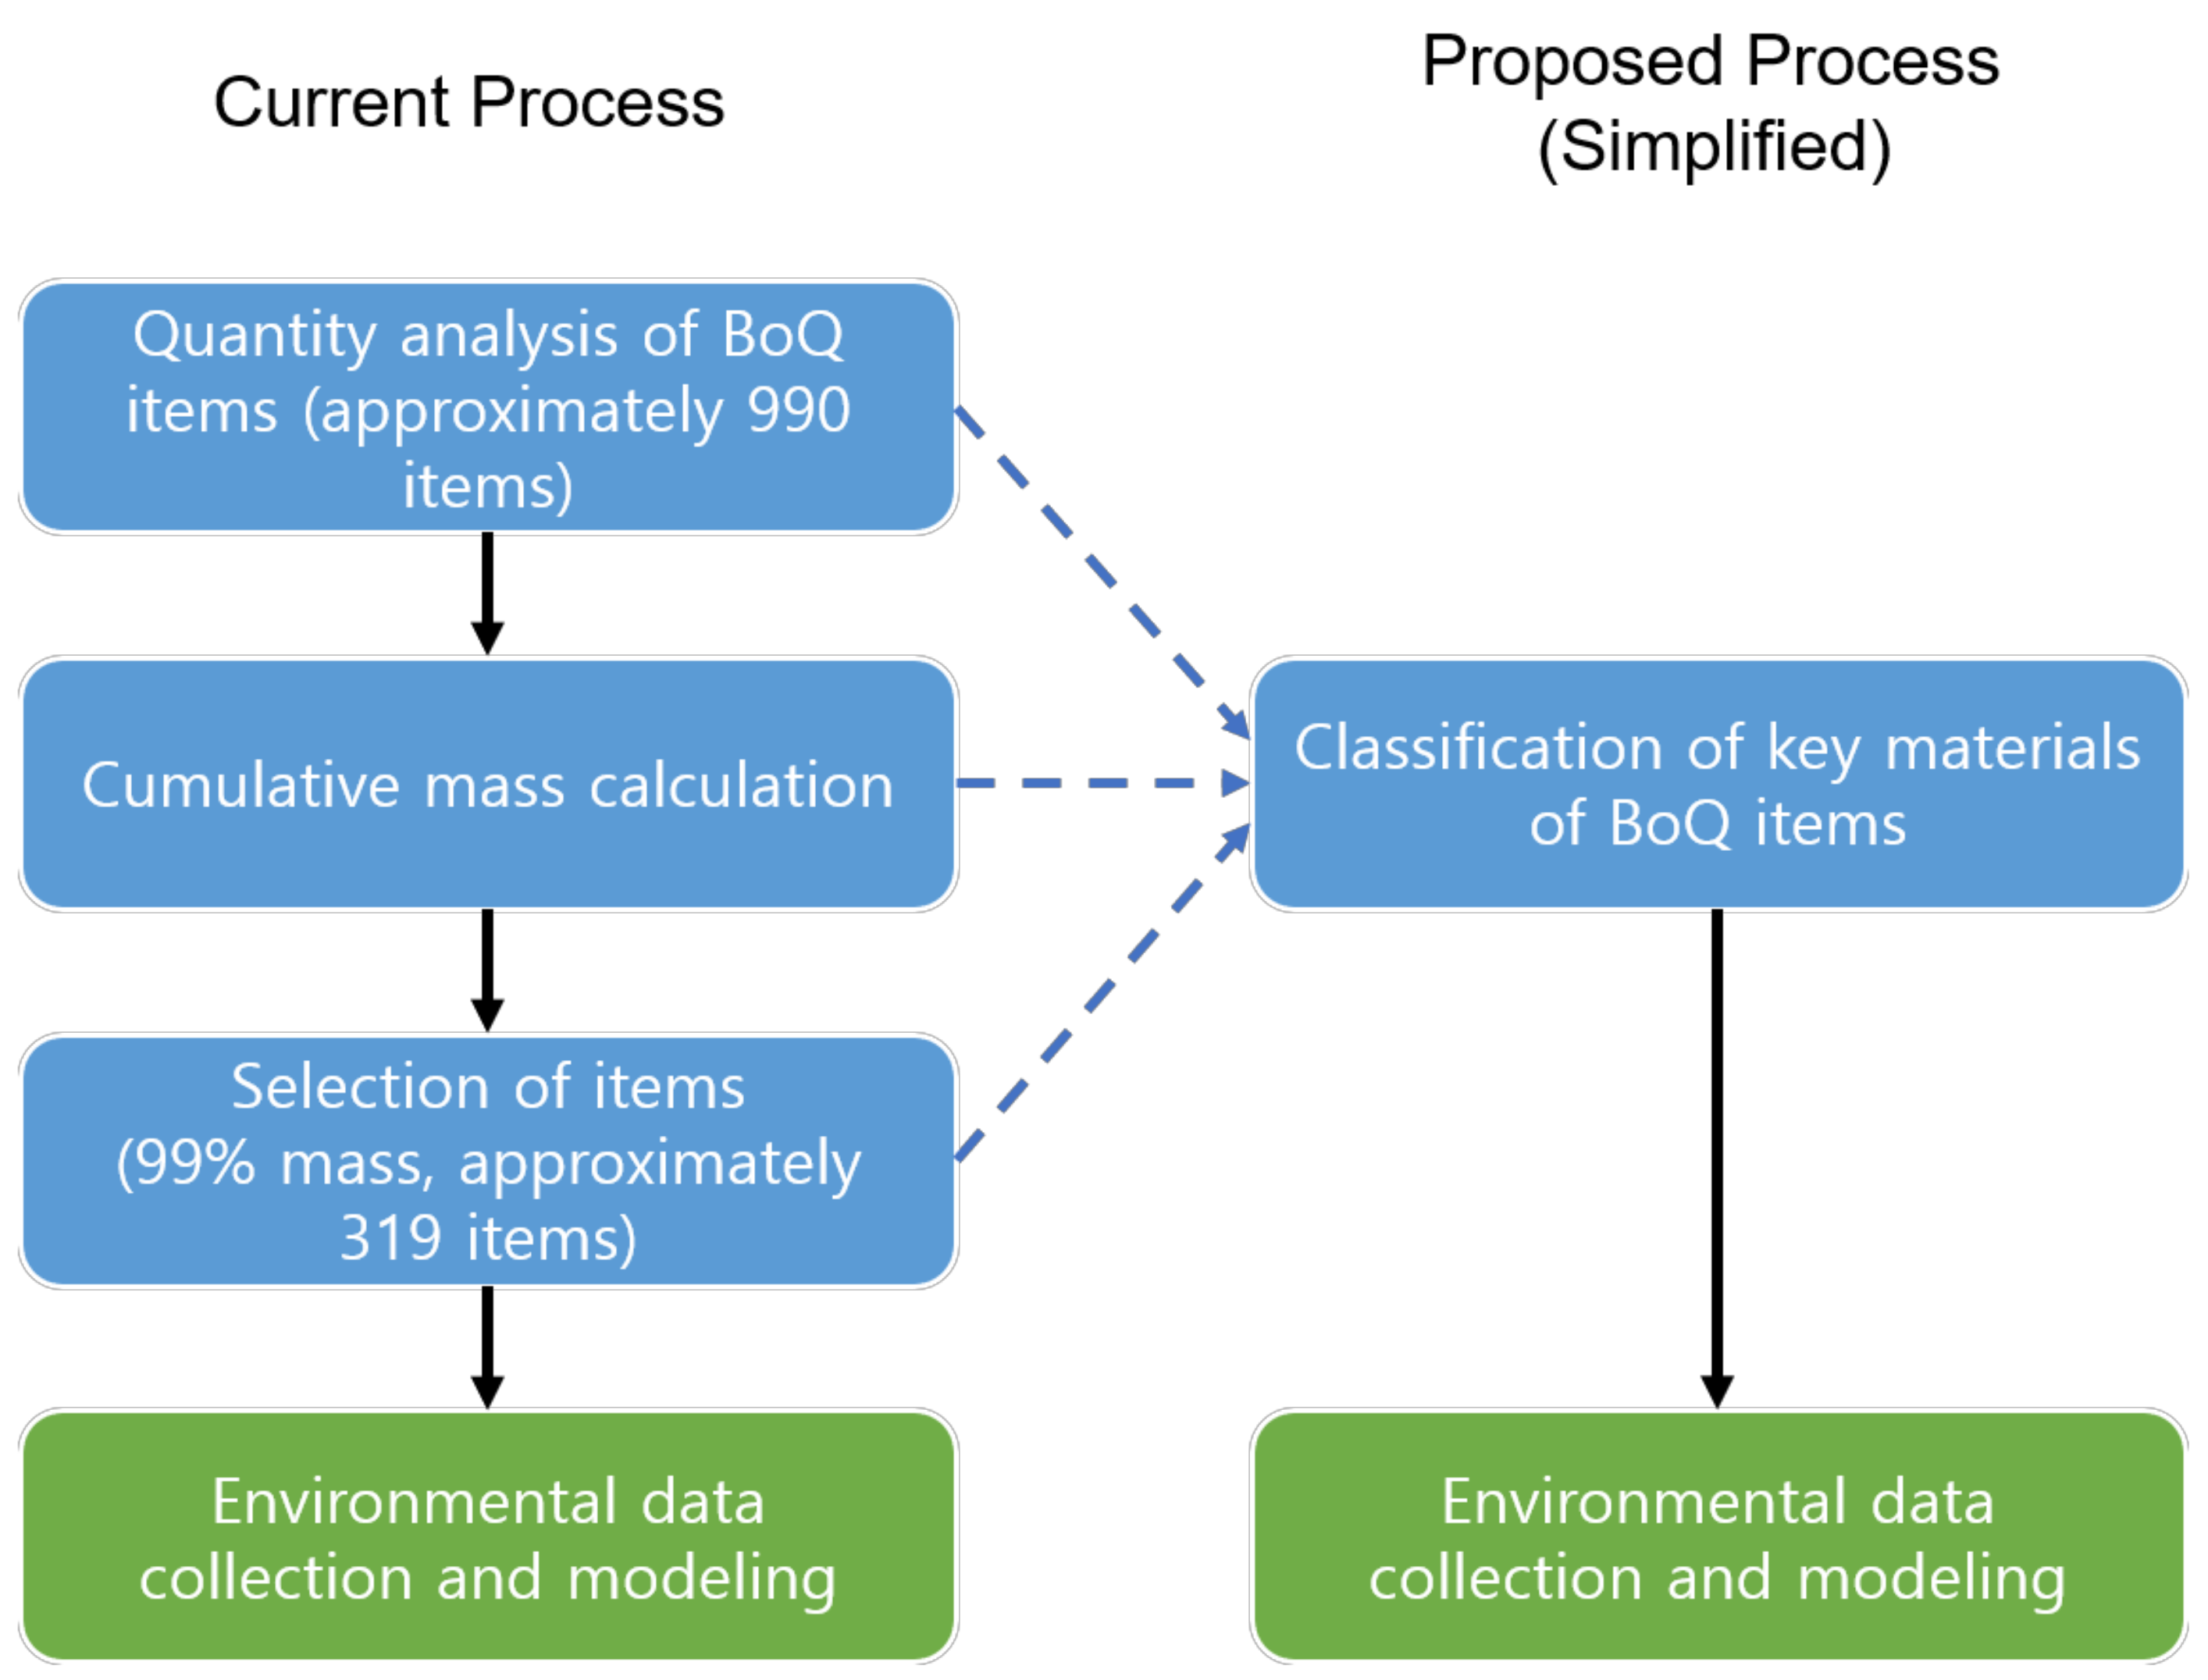
- BoQ review: The BoQ of each report was examined to determine the total number of materials listed.
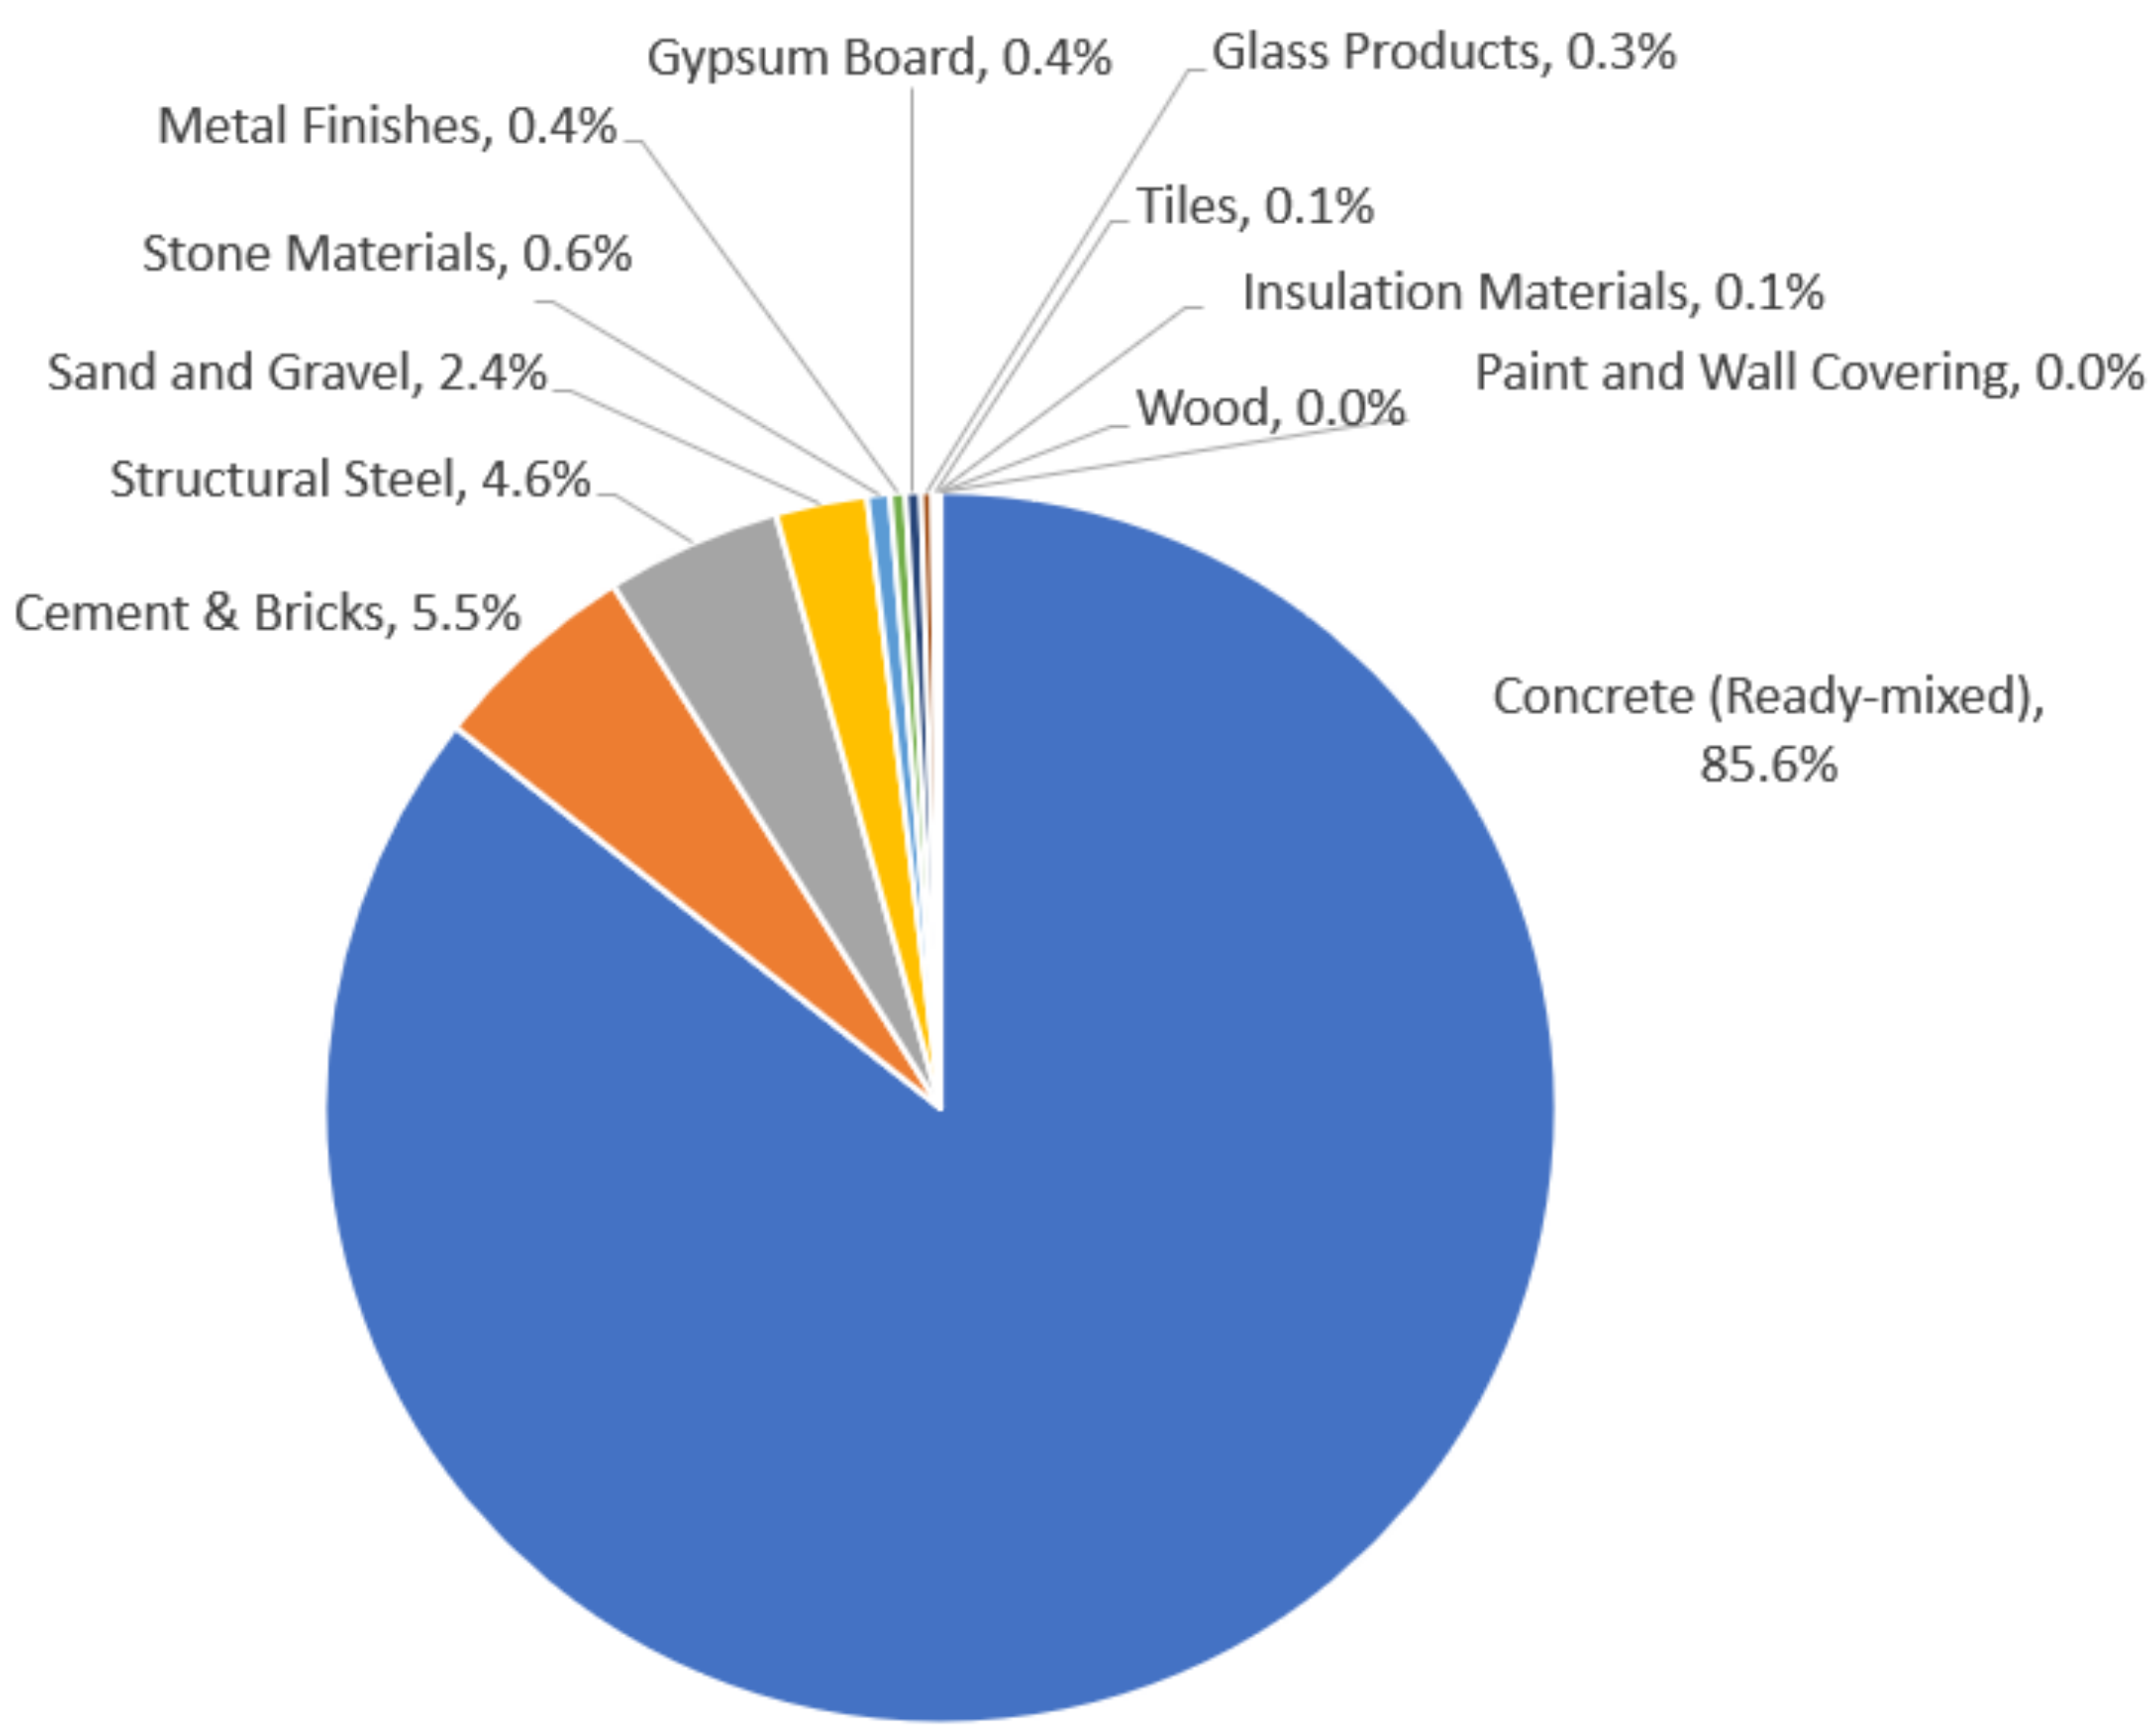
- Mass contribution calculation: For each material group, the percentage contribution to the total mass was computed.
- Material ranking: Materials were ranked based on their frequency of occurrence across projects, cumulative mass contribution, and relative carbon impact potential.
- Classification framework: Materials were grouped into 12 categories based on their functional roles and potential integration into certification systems.
3.1. Status of Green Building Certification and LCA Reports in Korea
3.2. LCA Data Analysis
3.3. Quantity Breakdown in LCAs
4. Discussion
4.1. Practical Barriers to LCA Implementation
4.2. Dominance of Key Material Categories
4.3. Implication for G-SEED and Global Certification Frameworks
5. Conclusions
Author Contributions
Funding
Data Availability Statement
Acknowledgments
Conflicts of Interest
Abbreviations
| LCA | Life cycle assessment |
| BIM | Building information modeling |
| G-SEED | Green Standard for Energy and Environmental Design |
| GHG | Greenhouse gas |
| LEED | Leadership in Energy and Environmental Design |
| BREEAM | Building Research Establishment Environmental Assessment Method |
| DGNB | Deutsche Gesellschaft für Nachhaltiges Bauen |
| BoQ | Bill of quantities |
| EPD | Environmental Product Declaration |
| LCI | Life cycle inventory |
Appendix A
| Building Type | Structure Type | Gross Floor Area (m2) | Number of Materials in BOQs | Number of Materials Used in LCA Reporting | Reporting Ratio |
|---|---|---|---|---|---|
| R1 | RC | 3881 | 1958 | 444 | 22.68% |
| R2 | RC | 4240 | 567 | 82 | 14.46% |
| R3 | RC | 7919 | 1129 | 424 | 37.56% |
| R4 | RC | 8689 | 405 | 132 | 32.59% |
| R5 | RC | 11,793 | 464 | 158 | 34.05% |
| R6 | RC | 18,918 | 717 | 273 | 38.08% |
| R7 | RC | 35,128 | 601 | 426 | 70.88% |
| R8 | RC | 40,330 | 750 | 160 | 21.33% |
| R9 | RC | 42,725 | 821 | 438 | 53.35% |
| R10 | RC | 44,925 | 702 | 316 | 45.01% |
| R11 | RC | 48,073 | 985 | 453 | 45.99% |
| R12 | RC | 68,601 | 1093 | 313 | 28.64% |
| R13 | RC | 97,490 | 6259 | 2473 | 39.51% |
| R14 | RC | 111,278 | 1317 | 495 | 37.59% |
| R15 | RC | 180,254 | 5984 | 602 | 10.06% |
| R16 | RC | 181,976 | 570 | 175 | 30.70% |
| R17 | RC | 292,294 | 1093 | 306 | 28.00% |
| R18 | RC | 466,221 | 2056 | 825 | 40.13% |
| R19 | RC | 70,872 | 2582 | 762 | 29.51% |
| R20 | RC | 86,905 | 2047 | 750 | 36.64% |
| Non-R1 | SRC | 2218 | 110 | 38 | 34.55% |
| Non-R2 | RC | 2307 | 180 | 86 | 47.78% |
| Non-R3 | SRC | 3058 | 515 | 132 | 25.63% |
| Non-R4 | SRC | 3666 | 697 | 255 | 36.59% |
| Non-R5 | RC | 5196 | 609 | 207 | 33.99% |
| Non-R6 | RC | 5296 | 434 | 116 | 26.73% |
| Non-R7 | RC | 6039 | 711 | 224 | 31.50% |
| Non-R8 | SRC | 6110 | 295 | 111 | 37.63% |
| Non-R9 | RC | 6529 | 1702 | 796 | 46.77% |
| Non-R10 | RC | 6529 | 473 | 182 | 38.48% |
| Non-R11 | SRC | 6691 | 747 | 290 | 38.82% |
| Non-R12 | SRC | 6876 | 769 | 261 | 33.94% |
| Non-R13 | RC | 7022 | 444 | 153 | 34.46% |
| Non-R14 | RC | 7198 | 523 | 150 | 28.68% |
| Non-R15 | SRC | 7225 | 751 | 232 | 30.89% |
| Non-R16 | RC | 7450 | 399 | 104 | 26.07% |
| Non-R17 | SRC | 8029 | 617 | 182 | 29.50% |
| Non-R18 | RC | 8592 | 693 | 236 | 34.05% |
| Non-R19 | RC | 15,155 | 1105 | 278 | 25.16% |
| Non-R20 | SRC | 15,258 | 981 | 448 | 45.67% |
| Non-R21 | RC | 17,621 | 572 | 199 | 34.79% |
| Non-R22 | RC | 19,680 | 328 | 95 | 28.96% |
| Non-R23 | RC | 20,099 | 522 | 89 | 17.05% |
| Non-R24 | SRC | 22,126 | 333 | 133 | 39.94% |
| Non-R25 | RC | 28,104 | 663 | 191 | 28.81% |
| Non-R26 | SRC | 32,635 | 897 | 350 | 39.02% |
| Non-R27 | SRC | 36,501 | 451 | 122 | 27.05% |
| Non-R28 | RC | 40,476 | 437 | 136 | 31.12% |
| Non-R29 | RC | 55,391 | 1327 | 443 | 33.38% |
| Non-R30 | SRC | 55,887 | 817 | 241 | 29.50% |
| Non-R31 | RC | 56,633 | 638 | 134 | 21.00% |
| Non-R32 | RC | 57,559 | 3171 | 1009 | 31.82% |
| Non-R33 | RC | 59,402 | 326 | 121 | 37.12% |
| Non-R34 | RC | 70,628 | 896 | 168 | 18.75% |
| Non-R35 | SRC | 130,144 | 2116 | 393 | 18.57% |
| Non-R36 | RC | 205,243 | 658 | 298 | 45.29% |
| Non-R37 | RC | 216,096 | 1495 | 568 | 37.99% |
| Non-R38 | RC | 259,223 | 632 | 228 | 36.08% |
| Office1 | RC | 3677 | 433 | 138 | 31.87% |
| Office2 | RC | 4078 | 128 | 44 | 34.38% |
| Office3 | RC | 4243 | 302 | 285 | 94.37% |
| Office4 | SRC | 4449 | 878 | 345 | 39.29% |
| Office5 | RC | 4993 | 489 | 118 | 24.13% |
| Office6 | RC | 5601 | 514 | 209 | 40.66% |
| Office7 | RC | 5757 | 897 | 363 | 40.47% |
| Office8 | RC | 8904 | 423 | 162 | 38.30% |
| Office9 | RC | 9467 | 986 | 572 | 58.01% |
| Office10 | RC | 10,103 | 487 | 120 | 24.64% |
| Office11 | RC | 11,466 | 623 | 247 | 39.65% |
| Office12 | RC | 13,019 | 849 | 408 | 48.06% |
| Office13 | RC | 15,328 | 682 | 250 | 36.66% |
| Office14 | RC | 17,226 | 759 | 198 | 26.09% |
| Office15 | RC | 17,881 | 374 | 111 | 29.68% |
| Office16 | RC | 18,601 | 779 | 222 | 28.50% |
| Office17 | RC | 18,945 | 580 | 164 | 28.28% |
| Office18 | RC | 19,171 | 626 | 103 | 16.45% |
| Office19 | RC | 21,554 | 1285 | 341 | 26.54% |
| Office20 | RC | 21,736 | 1043 | 456 | 43.72% |
| Office21 | RC | 25,653 | 941 | 377 | 40.06% |
| Office22 | RC | 25,694 | 1091 | 469 | 42.99% |
| Office23 | RC | 25,950 | 457 | 221 | 48.36% |
| Office24 | SRC | 31,785 | 1861 | 748 | 40.19% |
| Office25 | SRC | 33,420 | 1242 | 433 | 34.86% |
| Office26 | RC | 38,361 | 880 | 305 | 34.66% |
| Office27 | SRC | 41,723 | 1120 | 240 | 21.43% |
| Office28 | RC | 44,991 | 728 | 321 | 44.09% |
| Office29 | RC | 47,919 | 959 | 381 | 39.73% |
| Office30 | RC | 53,705 | 902 | 417 | 46.23% |
| Office31 | RC | 58,089 | 854 | 434 | 50.82% |
| Office32 | SRC | 197,057 | 2145 | 345 | 16.08% |
| Office33 | SRC | 302,472 | 5984 | 784 | 13.10% |
| School1 | RC | 8941 | 537 | 259 | 48.23% |
| School2 | SRC | 9657 | 577 | 165 | 28.60% |
| School3 | SRC | 17,261 | 406 | 114 | 28.08% |
| School4 | RC | 18,724 | 494 | 305 | 61.74% |
| School5 | RC | 30,380 | 715 | 190 | 26.57% |
| School6 | SRC | 61,464 | 387 | 161 | 41.60% |
| Hotel1 | RC | 10,890 | 519 | 248 | 47.78% |
| Hotel2 | RC | 14,740 | 791 | 296 | 37.42% |
| Retail | SRC | 125,563 | 1114 | 464 | 41.65% |
| Average | - | 48,030 | 990 | 319 | 35.24% |
Appendix B
| Building Type | Quantity of Major Construction Components in LCA Building (Tons) | |||||||||||
|---|---|---|---|---|---|---|---|---|---|---|---|---|
| Concrete | Structural Steel | Metal Finish | Cement and Brick | Wood | Glass | Insulation | Gypsum | Sand and Gravel | Stone Material | Tiles | Paint and Cover | |
| R1 | 11,550.6 | 627.4 | - | 629.0 | - | - | 3.0 | 72.7 | 160.0 | 273.9 | - | - |
| R2 | 10,419.6 | 379.2 | - | 212.0 | - | 160.0 | 33.2 | 84.5 | 636.4 | 148.6 | - | - |
| R3 | 19,798.4 | 915.6 | - | 1444.2 | - | 85.7 | 115.5 | - | 654.4 | 115.3 | - | - |
| R4 | 26,949.1 | 1298.8 | - | 631.9 | - | - | 130.3 | - | 848.0 | 588.4 | - | - |
| R5 | 24,603.1 | 1054.7 | - | 3324.6 | - | - | 246.0 | 162.1 | 193.6 | 262.9 | - | - |
| R6 | 45,047.8 | 1697.0 | - | 4166.8 | - | - | 429.8 | 171.9 | 3127.0 | 277.5 | 144.7 | - |
| R7 | 44,584.1 | 1420.6 | - | 3470.1 | - | - | 122.2 | - | 5018.0 | - | - | - |
| R8 | 66,019.6 | 2710.9 | - | 5476.0 | - | 272.4 | 185.5 | 741.8 | 2270.4 | - | 326.8 | - |
| R9 | 106,936.2 | 3047.0 | - | 3297.0 | - | - | 139.2 | 477.6 | 2775.9 | - | - | - |
| R10 | 117,832.7 | 4608.4 | - | 5737.6 | - | - | 49.9 | 515.3 | 8566.3 | - | - | - |
| R11 | 103,184.2 | 5358.6 | - | 7000.8 | - | 350.1 | 114.7 | 427.5 | 2298.1 | - | - | - |
| R12 | 131,556.2 | 4010.5 | - | 14,148.6 | - | - | 165.7 | 974.5 | 8616.0 | 813.3 | - | - |
| R13 | 216,451.9 | 7411.4 | - | 12,819.0 | 643.7 | 711.8 | 302.1 | - | 1504.5 | 1408.2 | - | - |
| R14 | 268,557.2 | 9030.0 | - | 24,973.0 | 281.5 | 983.1 | 2354.4 | - | 6915.2 | - | 1302.2 | - |
| R15 | 412,359.1 | 13,917.4 | - | 26,788.0 | - | - | 518.5 | 1607.6 | 22,974.8 | - | - | - |
| R16 | 409,249.9 | 13,770.6 | - | 24,153.5 | - | 3008.8 | 507.6 | - | 11,779.7 | 1886.3 | - | - |
| R17 | 542,944.9 | 24,678.0 | - | 79,196.1 | - | 3627.5 | 536.2 | - | 11,951.3 | - | - | - |
| R18 | 869,306.9 | 28,692.0 | - | 82,918.1 | - | - | 546.9 | 4498.9 | 13,686.4 | 27,523.5 | 4033.1 | - |
| R19 | 21,044.1 | 1180.2 | - | 1206.5 | - | 129.2 | 72.0 | 203.1 | 341.2 | - | 150.4 | - |
| R20 | 42,638.3 | 1992.5 | - | 3106.8 | - | - | 267.6 | - | 2073.6 | 398.0 | 156.2 | - |
| Non-R1 | 7054.2 | 447.4 | 43.7 | 456.5 | - | - | 34.4 | 47.5 | 244.2 | 38.0 | - | - |
| Non-R2 | 8823.5 | 409.4 | 46.1 | 345.1 | - | 31.2 | 45.9 | 73.0 | 1212.7 | 440.7 | - | - |
| Non-R3 | 11,168.8 | 495.6 | - | 717.4 | - | - | 31.8 | 56.9 | 800.8 | 214.0 | - | - |
| Non-R4 | 11,824.3 | 552.2 | - | 1392.3 | - | 37.7 | 14.1 | - | 576.0 | 42.2 | 44.9 | - |
| Non-R5 | 12,472.9 | 743.9 | - | 410.5 | - | - | 41.2 | 75.6 | 468.8 | 263.6 | - | - |
| Non-R6 | 14,768.3 | 837.2 | - | 655.5 | - | - | 22.0 | - | 317.4 | - | - | - |
| Non-R7 | 35,229.1 | 2785.2 | 408.9 | 464.0 | - | - | 195.2 | - | 278.9 | - | - | - |
| Non-R8 | 12,263.6 | 925.1 | 179.6 | 217.8 | - | - | 67.4 | 223.1 | 116.6 | - | - | - |
| Non-R9 | 18,593.2 | 2309.8 | 216.6 | 1184.5 | - | 303.1 | 36.0 | - | 920.0 | 261.4 | - | - |
| Non-R10 | 14,277.9 | 1230.6 | 164.6 | 497.3 | - | 52.4 | 45.5 | 66.7 | 304.6 | 316.7 | - | - |
| Non-R11 | 16,353.2 | 911.3 | - | 1161.1 | - | 68.9 | 26.3 | - | 869.7 | 438.3 | - | - |
| Non-R12 | 15,963.9 | 797.3 | 98.5 | 637.5 | - | 103.7 | 51.7 | 70.9 | 594.4 | 216.0 | - | - |
| Non-R13 | 27,460.6 | 1325.9 | - | 2196.3 | - | - | 61.4 | 94.7 | 915.2 | 128.7 | - | - |
| Non-R14 | 12,826.1 | 501.3 | 76.2 | 1968.2 | - | - | 22.5 | - | 2779.8 | 72.2 | - | - |
| Non-R15 | 15,262.2 | 931.9 | - | 1184.0 | - | 60.2 | 72.3 | 44.9 | 203.6 | - | 49.2 | - |
| Non-R16 | 21,953.5 | 1094.1 | - | 1241.8 | - | - | 38.4 | - | 1043.0 | 145.8 | - | - |
| Non-R17 | 30,581.4 | 1803.7 | 222.9 | 1554.5 | - | - | 27.2 | 205.4 | 1451.0 | 466.9 | - | - |
| Non-R18 | 20,902.6 | 2394.1 | 344.6 | 527.0 | - | 237.9 | 80.3 | 631.3 | 543.8 | - | 108.1 | - |
| Non-R19 | 54,409.8 | 2724.1 | 268.0 | 1853.5 | - | 134.3 | 94.6 | 300.5 | 1596.8 | 907.3 | - | - |
| Non-R20 | 45,001.8 | 1964.7 | - | 2841.5 | - | 589.3 | 45.1 | - | 1507.2 | - | 151.6 | - |
| Non-R21 | 43,828.0 | 1992.0 | - | 828.4 | - | 267.6 | 42.0 | - | - | 189.6 | - | - |
| Non-R22 | 47,842.3 | 3489.4 | 727.3 | 1230.2 | - | - | 51.4 | 229.7 | 2149.4 | 644.6 | 226.9 | - |
| Non-R23 | 48,619.7 | 2203.3 | 154.1 | 2692.2 | - | 652.8 | 85.9 | 177.3 | 2052.8 | - | - | - |
| Non-R24 | 35,431.5 | 10,630.2 | 9690.3 | - | - | - | 180.3 | 210.4 | - | - | - | - |
| Non-R25 | 56,449.0 | 2938.1 | - | 16,758.5 | - | 422.8 | 33.2 | 604.3 | 1176.9 | - | - | - |
| Non-R26 | 135,944.0 | 5755.1 | - | 1553.2 | - | 774.4 | 76.2 | - | - | - | - | - |
| Non-R27 | 107,169.5 | 6978.1 | 627.7 | 5702.3 | - | 1191.4 | 131.6 | 1131.0 | - | - | 645.3 | - |
| Non-R28 | 103,074.5 | 7067.0 | 584.7 | 3274.0 | - | 593.1 | 216.5 | 1640.9 | 2714.2 | - | 2712.3 | - |
| Non-R29 | 132,595.0 | 5895.5 | - | 3290.1 | - | 939.9 | 361.3 | - | 1705.6 | 1106.6 | - | - |
| Non-R30 | 108,638.2 | 5625.1 | 704.6 | 6960.6 | - | 523.1 | 349.2 | 1286.7 | 1460.6 | 1287.0 | - | - |
| Non-R31 | 106,763.7 | 4619.6 | - | 4035.6 | - | 461.2 | 123.6 | 1115.7 | 1064.0 | - | - | - |
| Non-R32 | 113,287.6 | 5595.1 | 485.5 | 4547.9 | - | 998.3 | 192.6 | 946.3 | 5569.8 | - | - | - |
| Non-R33 | 732,707.5 | 27,328.7 | 7758.8 | 6647.4 | - | 150.5 | 321.2 | 516.1 | 3284.0 | 273.7 | 92.8 | 220.4 |
| Non-R34 | 274,087.3 | 11,228.3 | 2576.6 | 21,412.3 | - | 2783.1 | 198.0 | - | 11,253.6 | 4311.9 | - | - |
| Non-R35 | 362,299.6 | 16,355.9 | 2164.4 | 26,466.6 | - | 3504.6 | 396.4 | 2649.8 | - | 2276.1 | - | - |
| Non-R36 | 430,010.4 | 14,272.2 | - | 22,665.4 | - | 2496.1 | 661.7 | 1557.1 | 10,345.6 | 3770.5 | - | - |
| Non-R37 | 174,096.0 | 4757.5 | - | 16,766.6 | - | - | 458.2 | 1071.3 | 1092.5 | 1492.2 | 577.7 | - |
| Non-R38 | 285,569.5 | 17,882.7 | - | 9675.2 | - | - | 464.7 | - | 9514.2 | - | 684.2 | - |
| Office1 | 10,591.5 | 513.2 | - | 151.3 | - | 33.3 | 21.8 | - | 313.6 | 127.1 | - | - |
| Office2 | 9427.7 | 638.7 | 177.3 | 1043.1 | - | 44.6 | 46.5 | 74.9 | 609.6 | 81.9 | - | - |
| Office3 | 11,115.8 | 587.7 | 23.9 | 752.4 | - | 77.4 | 30.2 | 7.6 | 1446.0 | 260.3 | 10.8 | 3.7 |
| Office4 | 14,989.1 | 756.3 | - | 1394.2 | - | 108.2 | 20.6 | 59.1 | 523.2 | 838.1 | 102.5 | - |
| Office5 | 13,615.0 | 622.6 | 100.3 | 417.4 | - | - | 52.1 | 59.4 | 435.2 | 281.0 | - | - |
| Office6 | 20,511.5 | 1213.9 | - | 538.0 | - | - | 10.0 | 115.6 | 829.3 | 474.3 | - | - |
| Office7 | 17,355.8 | 902.4 | 305.2 | 153.3 | - | 92.7 | 122.7 | 275.3 | 306.9 | 182.2 | - | - |
| Office8 | 22,065.6 | 1125.8 | 79.6 | 803.5 | - | 100.2 | 24.9 | 77.3 | 881.6 | 244.0 | - | - |
| Office9 | 25,601.3 | 1288.3 | - | 1998.9 | - | 103.0 | 62.1 | - | 1180.4 | 258.6 | - | - |
| Office10 | 24,872.2 | 1558.9 | - | 2480.0 | - | - | 78.1 | 138.9 | 1305.6 | - | 143.6 | - |
| Office11 | 25,893.4 | 1503.9 | - | 3419.7 | - | 121.8 | 63.3 | 205.1 | 1260.8 | 254.9 | - | - |
| Office12 | 31,783.2 | 1638.8 | 178.3 | 1537.2 | - | 283.7 | 55.8 | - | 941.0 | - | 164.9 | - |
| Office13 | 31,203.0 | 1905.3 | - | 2669.8 | - | - | 31.1 | - | 1481.3 | 463.7 | 180.7 | - |
| Office14 | 39,456.0 | 2274.8 | 305.0 | 2390.9 | - | 304.7 | 97.9 | 242.0 | 1759.8 | 274.5 | 206.6 | - |
| Office15 | 39,139.1 | 2154.5 | - | 1689.7 | - | 197.5 | 47.7 | - | 1022.4 | 325.5 | 151.2 | - |
| Office16 | 39,869.2 | 1843.6 | - | 1489.1 | - | - | 9.0 | 163.7 | 1252.3 | 256.3 | - | - |
| Office17 | 50,418.8 | 2157.1 | - | 3707.5 | - | - | 155.7 | 211.8 | 1230.4 | 216.1 | - | - |
| Office18 | 52,069.7 | 3227.6 | 343.0 | 2908.1 | - | 136.5 | 107.1 | 1185.4 | 522.6 | - | 136.5 | - |
| Office19 | 42,688.0 | 2414.1 | - | 1879.4 | - | 187.4 | 38.3 | - | 1545.3 | 346.9 | - | - |
| Office20 | 34,138.9 | 1906.1 | 1260.9 | 3190.8 | - | 158.0 | 78.5 | 377.7 | 184.1 | - | 170.1 | - |
| Office21 | 50,075.6 | 2242.6 | 101.5 | 2121.0 | 25.7 | 310.5 | 140.6 | 119.2 | 3316.2 | 105.8 | 3.4 | 13.3 |
| Office22 | 91,913.9 | 9807.3 | 1486.8 | 3376.7 | - | - | 128.9 | 391.0 | 1901.2 | 827.3 | - | - |
| Office23 | 123,315.9 | 34,110.4 | 509.3 | - | - | 799.8 | 191.9 | 1061.0 | 759.0 | - | - | - |
| Office24 | 82,631.6 | 5514.8 | 568.4 | 1736.8 | - | 979.2 | 162.6 | 857.7 | 2063.4 | - | 276.2 | - |
| Office25 | 60,687.6 | 6413.7 | 422.0 | 2099.5 | - | 975.9 | - | 483.9 | 1500.0 | 434.0 | 81.5 | 18.0 |
| Office26 | 71,364.4 | 3984.7 | 1160.8 | 3642.5 | - | - | 102.6 | 1290.2 | 2017.6 | - | 337.7 | - |
| Office27 | 74,342.9 | 6220.0 | 321.8 | 1132.5 | - | 226.1 | - | - | 758.4 | - | 218.0 | - |
| Office28 | 71,319.7 | 4180.0 | 495.9 | 12,801.0 | - | 334.0 | 213.6 | - | 336.1 | - | 272.2 | - |
| Office29 | 100,580.6 | 3794.2 | 386.7 | 17,226.8 | - | 444.3 | 291.9 | - | 469.6 | 411.1 | 474.6 | - |
| Office30 | 260,850.6 | 18,801.1 | 2625.8 | 6393.8 | - | - | 403.5 | 2344.2 | 5796.0 | 1878.0 | - | - |
| Office31 | 451,917.6 | 48,016.3 | 6475.1 | 37,597.1 | - | - | 774.3 | 3994.6 | 13,536.3 | 3892.2 | - | - |
| Office32 | 4961.3 | 289.3 | - | 354.1 | - | - | 0.6 | - | 266.5 | - | - | - |
| Office33 | 4491.9 | 205.9 | 15.5 | 225.4 | - | - | 20.4 | - | 122.7 | - | - | - |
| School1 | 15,010.6 | 794.4 | - | 1363.3 | 16.7 | 62.7 | 35.7 | - | 430.7 | 482.0 | - | - |
| School2 | 117,108.4 | 5445.8 | 396.2 | 4676.4 | - | - | 200.4 | - | 2353.6 | - | - | - |
| School3 | 35,410.8 | 1758.4 | - | 7088.5 | - | - | 61.1 | - | 2670.4 | 229.4 | - | - |
| School4 | 30,123.1 | 1490.8 | - | 1457.5 | - | - | 168.1 | 618.6 | 2774.4 | 139.0 | - | - |
| School5 | 18,092.0 | 1078.7 | 77.7 | 236.5 | - | 44.0 | 23.7 | 19.9 | 1063.3 | 347.2 | 12.4 | 19.4 |
| School6 | 143,970.8 | 11,197.3 | - | 4451.6 | - | 658.2 | 209.9 | - | 7821.4 | 607.6 | 531.5 | - |
| Retail | 246,470.6 | 19,598.9 | 2373.2 | 5098.0 | - | - | 354.8 | 2548.4 | 30,070.3 | - | 894.3 | - |
| Hotel1 | 9671.5 | 482.6 | - | 352.9 | - | - | 23.8 | 24.7 | 395.2 | 155.9 | - | - |
| Hotel2 | 8803.2 | 487.0 | - | 597.7 | - | - | 5.2 | - | 743.7 | 46.8 | - | - |
| Average | 98,265.6 | 5237.5 | 477.3 | 6293.6 | 9.7 | 334.9 | 169.0 | 419.1 | 2767.2 | 674.4 | 157.8 | 2.7 |
References
- United Nations Environment Programme—Global Alliance for Buildings and Construction. Not Just Another Brick in the Wall: The Solutions Exist-Scaling Them Will Build on Progress and Cut Emissions Fast. Global Status Report for Building and Construction 2024/2025. 2025. Available online: https://wedocs.unep.org/20.500.11822/47214 (accessed on 28 July 2025).
- Röck, M.; Saade, M.R.M.; Balouktsi, M.; Nygaard, R.F.; Birgisdottir, H.; Frischknecht, R.; Habert, G.; Lützkendorf, T. Embodied GHG emissions of buildings—The hidden challenge for effective climate change mitigation. Appl. Energy 2020, 258, 114107. [Google Scholar] [CrossRef]
- Moncaster, A.M.; Symons, K.E. A method and tool for ‘cradle to grave’ embodied carbon and energy impacts of UK buildings in compliance with the new TC350 standards. Energy Build. 2013, 66, 514–523. [Google Scholar] [CrossRef]
- Guggemos, A.A.; Horvath, A. Comparison of environmental effects of steel- and concrete-framed buildings. J. Infrastruct. Syst. 2005, 11, 93–101. [Google Scholar] [CrossRef]
- Wang, M.; Chen, B.; Zhang, D.; Yuan, H.; Rao, Q.; Zhou, S.; Li, J.; Wang, W.; Tan, S.K. Comparative life cycle assessment and life cycle cost and analysis of centralized and decentralized urban drainage systems: A case study in Zhujiang New Town, Guangzhou, China. J. Clean. Prod. 2023, 426, 139173. [Google Scholar] [CrossRef]
- Hollberg, A.; Genova, G.; Habert, G. Evaluation of BIM-based LCA results for building design. Autom. Constr. 2020, 109, 102972. [Google Scholar] [CrossRef]
- Obrecht, T.P.; Röck, M.; Hoxha, E.; Passer, A. BIM and LCA Integration: A Systematic Literature Review. Sustainability 2020, 12, 5534. [Google Scholar] [CrossRef]
- International Committee of the Decorative Laminates Industry. Comparison of the Certification Systems for Buildings DGNB, LEED and BREEAM. 2019. Available online: https://www.icdli.com/tech-centre/fachwissen/comparison-of-the-certification-systems-for-buildings-dgnb,-leed-and-breeam.html (accessed on 28 July 2025).
- Zoe, B.; Malmqvist, M. Limit values in LCA-based regulations for buildings—System boundaries and implications on practice. Build. Environ. 2024, 259, 111658. [Google Scholar] [CrossRef]
- Wang, S.; Tae, S. Assessment of carbon neutrality performance of buildings using EPD-certified Korean construction materials. Appl. Sci. 2025, 15, 6533. [Google Scholar] [CrossRef]
- G-SEED. Sharing the Draft Comprehensive Revision of Green Building Certification. Presentation Materials for the Green Building Future Forum, 12 November 2024. 2024. Available online: https://gseed.or.kr/openFileDetailPage.do?rnum=35&bbsCnt=463&bbsId=2430&pageNum=1 (accessed on 13 August 2025).
- Cabeza, L.F.; Rincón, L.; Vilariño, V.; Pérez, G.; Castell, A. Life cycle assessment (LCA) and life cycle energy analysis (LCEA) of buildings and the building sector: A review. Renew. Sustain. Energy Rev. 2014, 29, 394–416. [Google Scholar] [CrossRef]
- Dixit, M.K. Life cycle embodied energy analysis of residential buildings: A review of literature to investigate embodied energy parameters. Renew. Sustain. Energy Rev. 2017, 79, 390–413. [Google Scholar] [CrossRef]
- Obrecht, T.P.; Kunič, R.; Jordan, S.; Legat, A. Roles of the reference service life (RSL) of buildings and the RSL of building components in the environmental impacts of buildings. IOP Conf. Ser. Earth Environ. Sci. 2019, 323, 012146. [Google Scholar] [CrossRef]
- EN 15978; Sustainability of Construction Works—Assessment of Environmental Performance of Buildings—Calculation Method. CEN (European Committee for Standardization): Brussels, Belgium, 2011.
- Kim, T.; Lee, S.; Chae, C.; Jang, H.; Lee, K. Development of the CO2 emission evaluation tool for the life cycle assessment of concrete. Sustainability 2017, 9, 2116. [Google Scholar] [CrossRef]
- Asdrubali, F.; Baldassarri, C.; Fthenakis, V. Life cycle analysis in the construction sector: Guiding the optimization of conventional Italian buildings. Energy Build. 2013, 64, 73–89. [Google Scholar] [CrossRef]
- Bribián, I.Z.; Capilla, A.V.; Usón, A.A. Life cycle assessment of building materials: Comparative analysis of energy and environmental impacts and evaluation of the eco-efficiency improvement potential. Build. Environ. 2011, 46, 1133–1140. [Google Scholar] [CrossRef]
- Kim, H.; Jang, H.; Tae, S.; Kim, H.; Jo, K. Life-Cycle Assessment of Apartment Buildings Based on Standard Quantities of Building Materials Using Probabilistic Analysis Technique. Materials 2022, 15, 4103. [Google Scholar] [CrossRef]
- Akbarnezhad, A.; Xiao, J. Estimation and minimization of embodied carbon of buildings: A review. Buildings 2016, 7, 5. [Google Scholar] [CrossRef]
- Passer, A.; Kreiner, H.; Peter, M. Assessment of the environmental performance of buildings: A critical evaluation of the influence of technical building equipment on residential buildings. Life Cycle Assess. 2012, 17, 1116–1130. [Google Scholar] [CrossRef]
- Buyle, M.; Braet, J.; Audenaert, A. Life cycle assessment in the construction sector: A review. Renew. Sustain. Energy Rev. 2013, 26, 379–388. [Google Scholar] [CrossRef]
- Lasvaux, S.; Schiopu, N.; Habert, G.; Chevalier, J.; Peuportier, B. Influence of simplification of life cycle inventories on the accuracy of impact assessment: Application to construction products. J. Clean. Prod. 2014, 79, 142–151. [Google Scholar] [CrossRef]
- Barbhuiya, S.; Das, B.B. Life Cycle Assessment of Construction materials: Methodologies, applications and future directions for sustainable decision-making. Case Stud. Constr. Mater. 2023, 19, e02326. [Google Scholar] [CrossRef]
- Collinge, W.O.; Thiel, C.L.; Campion, N.A.; Al-Ghamdi, S.G.; Woloschin, C.L.; Soratana, K.; Landis, A.E.; Bilec, M.M. Integrating Life Cycle Assessment with Green Building and Product Rating Systems: North American Perspective. Procedia Eng. 2015, 118, 662–669. [Google Scholar] [CrossRef]
- Ferreira, A.; Pinheiro, M.D.; Brito, J.D.; Mateus, R. A critical analysis of LEED, BREEAM, and DGNB as sustainability assessment methods for retail buildings. J. Build. Eng. 2023, 66, 105825. [Google Scholar] [CrossRef]
- Pomponi, F.; Moncaster, A. Embodied Carbon Mitigation and reduction in the built environment—What does the evidence say? J. Environ. Manag. 2016, 181, 687–700. [Google Scholar] [CrossRef] [PubMed]
- Onososen, A.; Musonda, I. Barriers to BIM-Based Life Cycle Sustainability Assessment for Buildings: An Interpretive Structural Modelling Approach. Buildings 2022, 12, 324. [Google Scholar] [CrossRef]
- Ebeh, C.O.; Okwandu, A.C.; Abdulwaheed, S.A.; Iwanyanwu, O. Life Cycle Assessment (LCA) in Construction: Methods, Applications, and Outcomes. Int. J. Eng. Res. Dev. 2024, 20, 350–358. Available online: https://ijerd.com/paper/vol20-issue8/2008350358.pdf (accessed on 28 July 2025).
- Parece, S.; Resende, R.; Rato, V. Stakeholder perspectives on BIM-LCA integration in building design: Adoption, challenges, and future directions. Build. Environ. 2025, 284, 113434. [Google Scholar] [CrossRef]
- Teng, Y.; Li, C.Z.; Shen, G.Q.P.; Yang, Q.; Peng, Z. The impact of life cycle assessment database selection on embodied carbon estimation of buildings. Build. Environ. 2023, 243, 110648. [Google Scholar] [CrossRef]
- Kumar, D.; Maurya, K.K.; Mandal, S.K.; Mir, B.A.; Nurdiawati, A.; AI-Ghamdi, S.G. Life Cycle Assessment in the Early Design Phase of Buildings: Strategies, Tools, and Future Directions. Buildings 2025, 15, 1612. [Google Scholar] [CrossRef]
- Anyanya, D.; Paulillo, A.; Fiorini, S.; Lettieri, P. Evaluating sustainable building assessment systems: A comparative analysis of GBRS and WBLCA. Front. Built Environ. 2025, 11, 1550733. [Google Scholar] [CrossRef]
- Broer, R.; Simjanovic, J.; Toth, Z. Implementing the Paris Agreement and Reducing Greenhouse Gas Emissions Throughout the Life Cycle of Buildings: European Public Policies, Tools and Market Initiatives. BPIE. 2022. Available online: https://www.bpie.eu/wp-content/uploads/2022/01/SPIPA-LCA-2022FINAL.pdf?utm_source=chatgpt.com (accessed on 18 August 2025).
- Oneclick LCA. LCA Compliance Landscape in Europe for Construction and Manufacturing. 2025. Available online: https://oneclicklca.com/en/resources/articles/lca-compliance-landscape-in-europe-for-construction-and-manufacturing?utm_source=chatgpt.com (accessed on 18 August 2025).

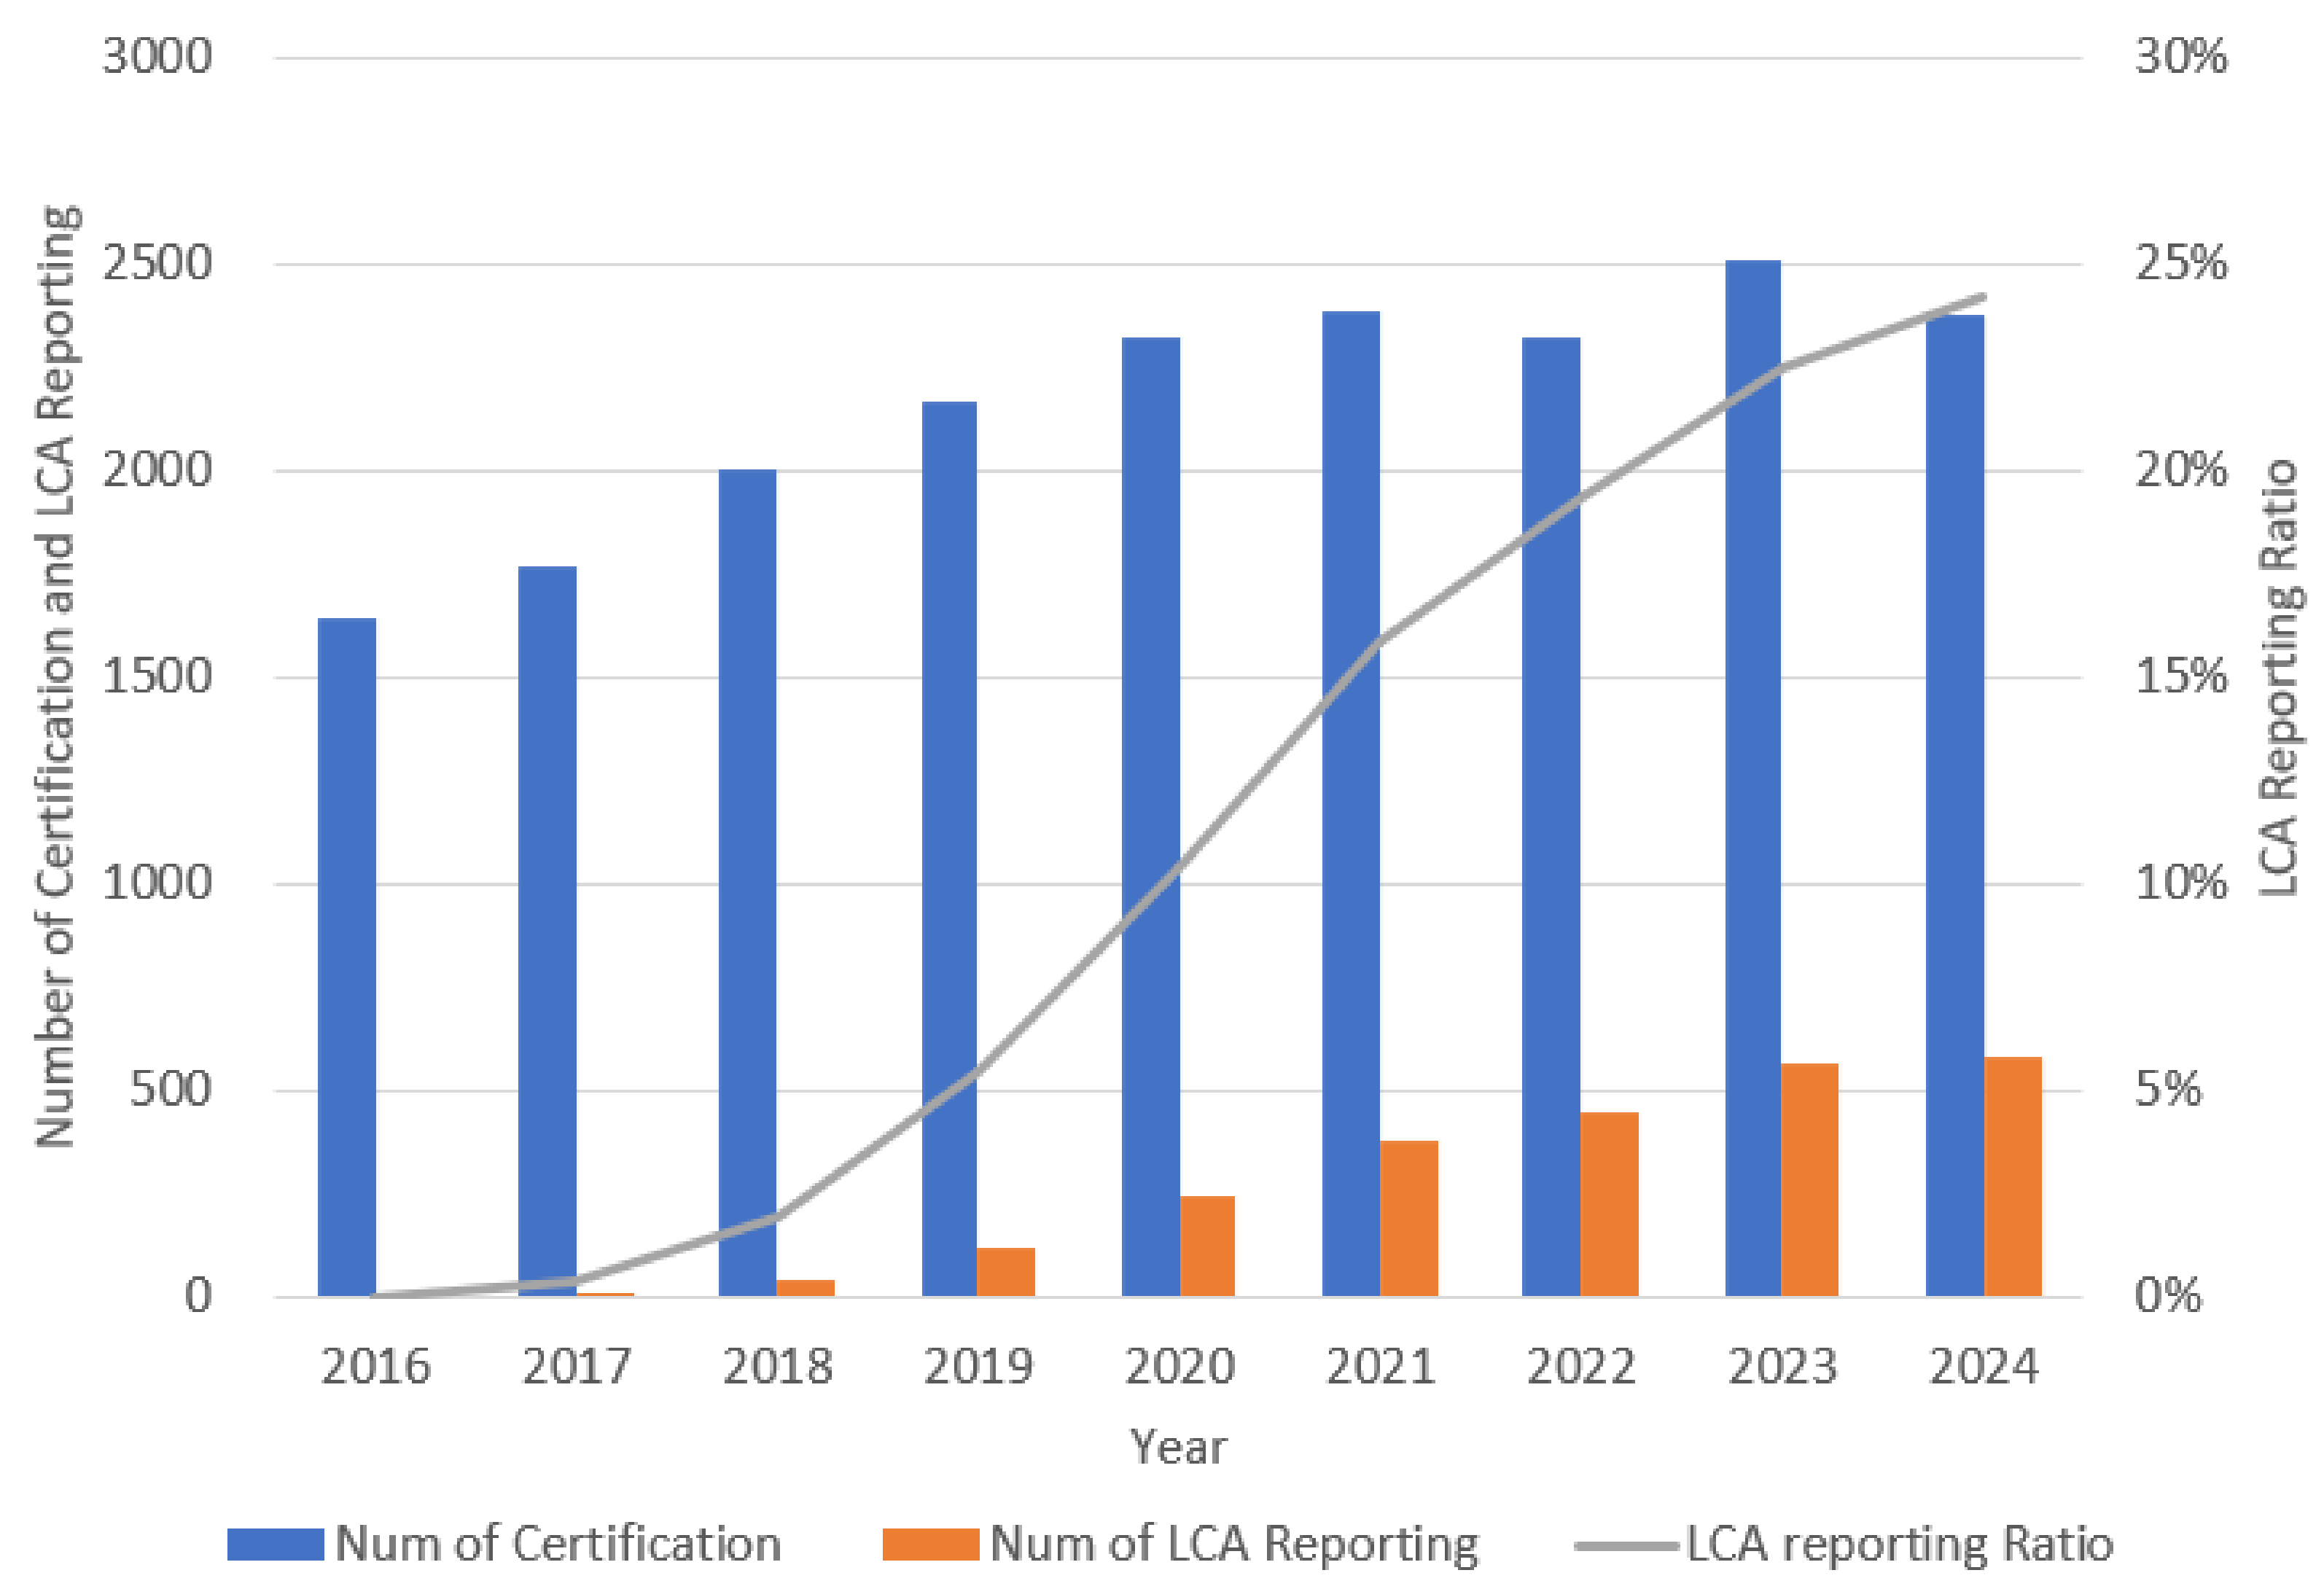


| Year | Number of Certifications | Number of LCA Reports | LCA Reporting Ratio |
|---|---|---|---|
| 2016 | 1639 | - | - |
| 2017 | 1765 | 6 | 0.34% |
| 2018 | 2000 | 38 | 1.90% |
| 2019 | 2169 | 118 | 5.44% |
| 2020 | 2324 | 241 | 10.37% |
| 2021 | 2383 | 377 | 15.82% |
| 2022 | 2319 | 448 | 19.32% |
| 2023 | 2509 | 565 | 22.52% |
| 2024 | 2381 | 576 | 24.19% |
| Total | 19,489 | 2369 | 12.16% |
| Number of Buildings (Total 100) | ||
|---|---|---|
| Building type | Residential | 20 |
| Non-residential (all public, commercial, and institutional buildings, except below) | 38 | |
| Office | 33 | |
| School | 6 | |
| Hotel | 2 | |
| Retail | 1 | |
| Structural type | RC | 76 |
| RC + S | 10 | |
| SRC | 14 | |
| Material Category | Examples | Functional Role |
|---|---|---|
| Concrete (ready-mixed) | Normal- and high-strength concrete | Primary structural component |
| Structural steel | Deformed bars, welded wire mesh, H-beams, columns, and steel framing | Structural reinforcement and system (steel buildings) |
| Metal finishes | Aluminum and steel plates | Non-structural finishes and façade |
| Cement and bricks | Mortar cement and solid bricks | Masonry walls and partitions |
| Wood | Structural timber and plywood | Structural timber, internal reinforcement, and finishes |
| Glass products | Single-pane, double-pane, and low-E glass | Windows and façades |
| Insulation materials | EPS, XPS, glass wool, and urethane foam | Thermal insulation |
| Gypsum board | Drywall panels | Interior wall finishes |
| Sand and gravel | Fine and coarse aggregates | Concrete mix and bedding material |
| Stone materials | Natural stone, marble, and granite | Exterior and interior finishes |
| Tiles | Ceramic and porcelain tiles | Flooring and wet area finishes |
| Paint and wall covering | Emulsion paints and wallpapers | Interior finishing |
| Material Category | Number of LCA Reports Using the Material Category | Mass Balance Average Ratio | |
|---|---|---|---|
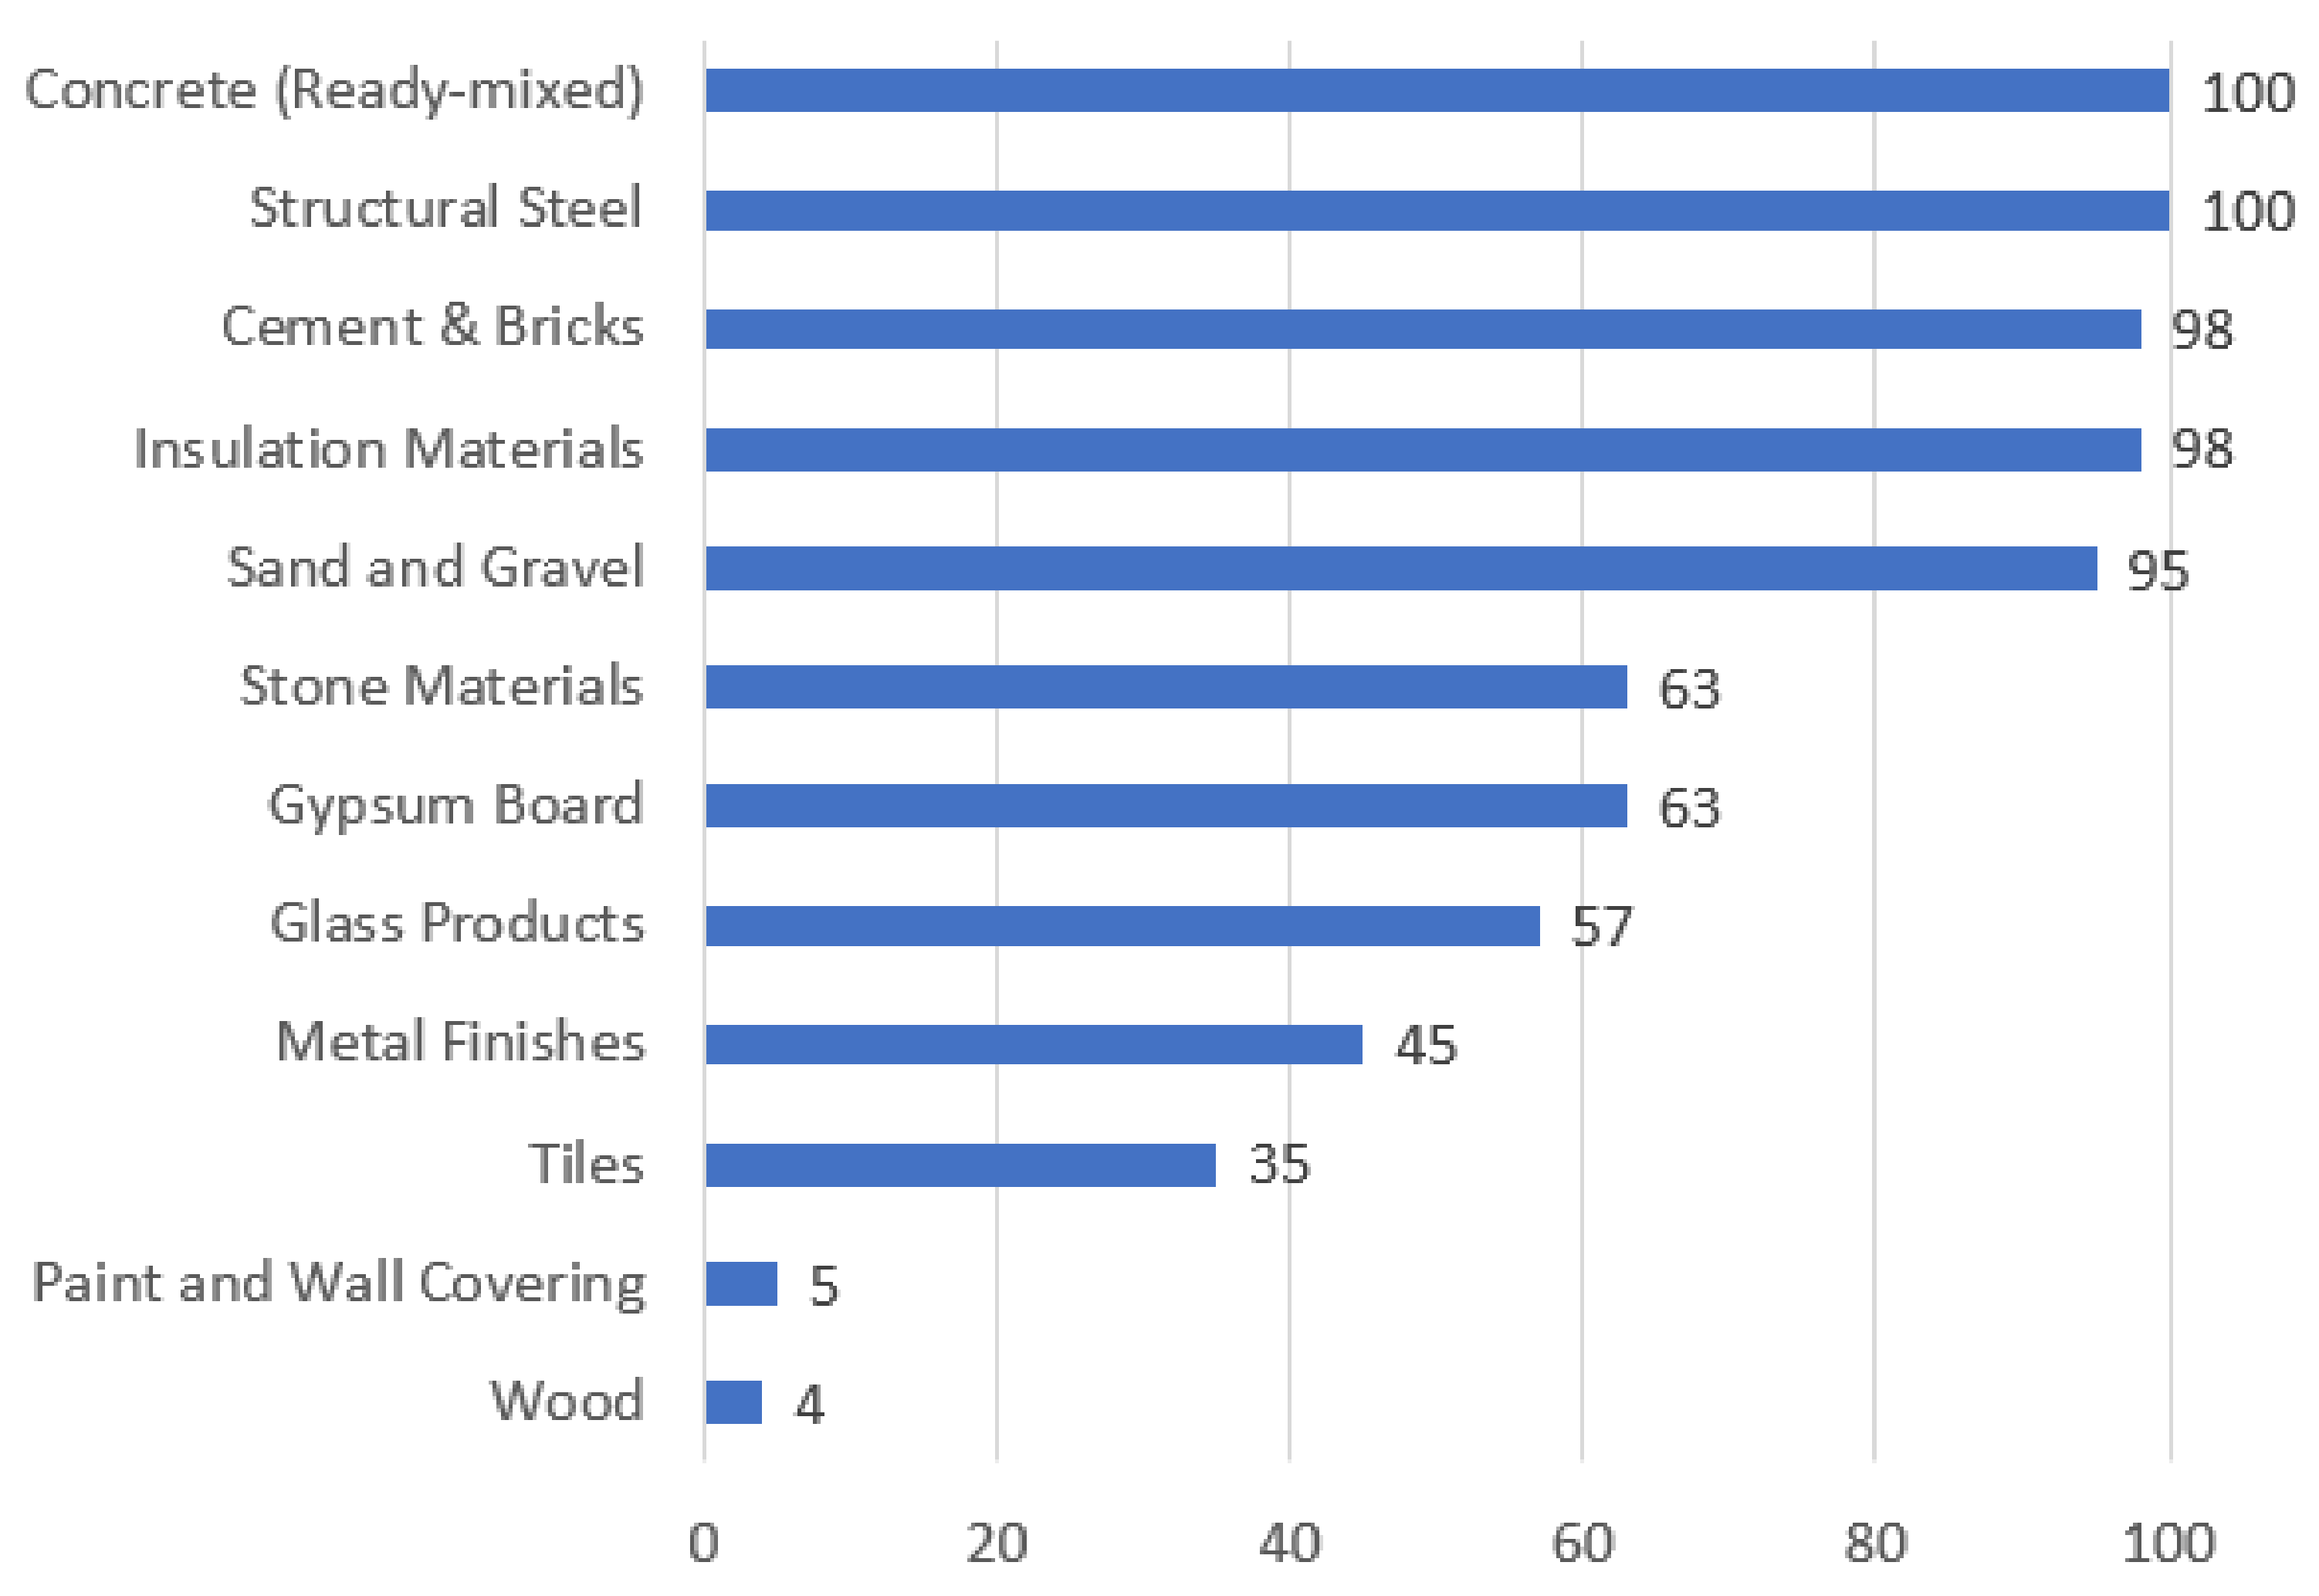
| 1 | Concrete (ready-mixed) | 100 | 85.6% |
| 2 | Structural steel | 100 | 4.6% |
| 3 | Metal finishes | 45 | 0.4% |
| 4 | Cement and bricks | 98 | 5.5% |
| 5 | Wood | 4 | 0.0% |
| 6 | Glass products | 57 | 0.3% |
| 7 | Insulation materials | 98 | 0.1% |
| 8 | Gypsum board | 63 | 0.4% |
| 9 | Sand and gravel | 95 | 2.4% |
| 10 | Stone materials | 63 | 0.6% |
| 11 | Tiles | 35 | 0.1% |
| 12 | Paint and wall coverings | 5 | 0.0% |
Disclaimer/Publisher’s Note: The statements, opinions and data contained in all publications are solely those of the individual author(s) and contributor(s) and not of MDPI and/or the editor(s). MDPI and/or the editor(s) disclaim responsibility for any injury to people or property resulting from any ideas, methods, instructions or products referred to in the content. |
© 2025 by the authors. Licensee MDPI, Basel, Switzerland. This article is an open access article distributed under the terms and conditions of the Creative Commons Attribution (CC BY) license (https://creativecommons.org/licenses/by/4.0/).
Share and Cite
Seo, S.; Kim, T.; Chae, C.U.; Park, J.-c. Key Construction Materials for a Streamlined Building Life Cycle Assessment: A Meta-Analysis of 100 G-SEED Projects. Buildings 2025, 15, 3039. https://doi.org/10.3390/buildings15173039
Seo S, Kim T, Chae CU, Park J-c. Key Construction Materials for a Streamlined Building Life Cycle Assessment: A Meta-Analysis of 100 G-SEED Projects. Buildings. 2025; 15(17):3039. https://doi.org/10.3390/buildings15173039
Chicago/Turabian StyleSeo, Sungmo, Taehyoung Kim, Chang U Chae, and Jin-chul Park. 2025. "Key Construction Materials for a Streamlined Building Life Cycle Assessment: A Meta-Analysis of 100 G-SEED Projects" Buildings 15, no. 17: 3039. https://doi.org/10.3390/buildings15173039
APA StyleSeo, S., Kim, T., Chae, C. U., & Park, J.-c. (2025). Key Construction Materials for a Streamlined Building Life Cycle Assessment: A Meta-Analysis of 100 G-SEED Projects. Buildings, 15(17), 3039. https://doi.org/10.3390/buildings15173039


