Abstract
Underground rail transit transfer stations are large-scale, complex structures with high-passenger flows, making them more vulnerable to fires and rescue challenges than other stations. Taking Zhongnan Road Metro Transfer Station in Wuhan as a project example, this study simulates two typical fire scenarios—flammable package ignition and equipment short circuits—using PyroSim to analyze changes in smoke movement, temperature, visibility, and CO concentration within the station. The required safety egress time (TRSET) was determined according to the critical threshold. Then, the critical evacuation phase time (tmove’) at each key evacuation node was calculated by working backward from TRSET. The threshold control of the open/close time nodes of the evacuation passages in the Pathfinder calculation was realized based on this time parameter. Based on the improved optimization algorithm method, personnel evacuation simulations are conducted to analyze evacuation characteristics, efficiency, and safety levels. Results show that the combustion characteristics of the fire source significantly affect the efficiency of passenger evacuation. The evacuation fails in Scenario 1 (flammable package) but succeeds in Scenario 2 (short circuit of an elevator circuit). Safety ratings for exits A–F are Level 1 (Good), Staircase 1 is Level 2 (Qualified), Staircases 2 and 3 are Level 3 (At Risk), and Staircase 4 is Level 4 (Poor). Finally, suggestions for improvement were proposed regarding size, quantity, and layout optimization of egress staircases.
1. Introduction
Following the rapid development of the social economy and urbanization, building a public transportation system mainly based on rail transit has become the primary solution to address the problems of urban traffic congestion and land resource scarcity [1]. By 31 December 2023, 336 rail transit lines had been opened in 61 cities in China spanning a total mileage of 11,034 km. The total number of urban rail transit stations in operation nationwide is 6239, among which there are 856 transfer stations. There are 43 cities in China that have transfer stations, accounting for 72.88% of the cities that have rail transit facilities [2]. As the development of urban underground space exploitation and underground transportation networks accelerates, many safety issues have emerged. The most important issue is fire accidents that cause substantial casualties and economic losses and have severe social impacts [3,4,5,6]. Accordingly, in the face of the continuously expanding scale of rail transit networks, it is highly important to investigate the smoke-spreading law and personnel evacuation paths in typical fire scenarios to guarantee the operational safety of underground spaces.
Current research on underground space fire effects has mainly focused on fire smoke analysis [7], temperature field characteristics [8], ventilation design [9], and other aspects by combining model experiments with numerical simulation. Hansen [10] constructed a CFD model and validated several empirical formulas using results from full-scale fire experiments in two mining tunnels. Xu et al. [11] used CFD simulations to develop and validate improved models for predicting smoke and temperature in tunnel evacuations. Kallianiotis et al. [12] conducted a comparative study on fire smoke propagation, finding that the ventilation shaft structure alone can effectively control smoke, while timely activation of the smoke control system may significantly accelerate smoke spread. Wang et al. [13] evaluated metro train fires based on full-scale experiments and numerical simulations and proposed a simple correction framework for assessing metro train fires using mutual validation of the two methods. Yao et al. [14,15] systematically studied flame behavior, heat release rate (HRR), smoke temperature, CO concentration, and visibility in underground structures such as oil depots and commercial streets under various fire conditions using PyroSim. Referring to the existing research directions, this study focuses on fire smoke dispersion and further investigates the thermal field, visibility field, and CO concentration field based on numerical simulation, aiming to comprehensively assess fire behavior and its impact on evacuation safety in underground metro stations.
Under complex and dark environmental conditions caused by fires, evacuation in underground spaces presents significant challenges [16,17]. In response to the frequent underground space fire accidents, scholars from various countries also conducted research on the evacuation of personnel in fires based on simulations. The fire evacuation simulation platforms based on intelligent modeling include AnyLogic [18], Pathfinder [19], and STEPS [20]. Adjiski et al. [21] developed an underground mine fire evacuation system to design a complete evacuation plan and analyzed fire scenarios and the optimal evacuation routes. Qin et al. [22] developed an evaluation study on the fire safety evacuation behavior of subway station personnel under different passenger flow conditions using the Pathfinder software program. To improve the emergency evacuation efficiency of subway passengers in fire conditions, Wang et al. [23] proposed the concept of “Guide Partition” and an intelligent partitioning algorithm and conducted simulation verification of the Military Museum Station of Beijing subway as the modeling object using the Building Exodus evacuation simulation software program.
A large number of research practices by scholars demonstrated that the two representative software platforms for fire and evacuation analysis Pyrosim and Pathfinder not only have the advantages of convenient modeling, good result visualization, and high-data-processing efficiency, but also have good compatibility and interactivity; therefore, the combined application of these two software platforms can achieve extremely good results. For example, Liu et al. [24] integrated BIM with Pyrosim and Pathfinder to model an underground cross tunnel, identifying a critical ventilation speed of 3.6 m/s for safe evacuation, with visibility found to significantly influence escape performance. Xu et al. [25] combined Pyrosim and Pathfinder simulations with an improved ant colony algorithm to optimize evacuation routes under fire conditions. Yang et al. [26] developed a fire spread model for Qingdao May 4th Square subway station using Pyrosim and coupled it with Pathfinder to establish and validate a multi-objective robust evacuation path optimization system.
However, according to the aforementioned literature, most current research studies were performed in combination with a single fire scenario, only set the fire source location or fire source area as the controlling factor, considered the control indicator parameters in the control of evacuation analysis conditions. Some studies also ignored the differences in disaster characteristics and the impact on the escape environment of different typical underground fire source types. Additionally, contemporary Pathfinder-based evacuation simulations often overlook the dynamic features of route availability. In actual fire incidents, critical escape paths may become compromised when environmental conditions—such as temperature, visibility, and CO concentration—surpass human survivability thresholds. Implementing time-dependent route accessibility parameters in simulations could substantially enhance both the realism of scenario modeling and the reliability of safety evaluations.
Based on this, this study aims to develop a more comprehensive and dynamic approach to fire evacuation safety assessment in complex underground metro stations. Based on field investigation data, a 1:1 model of Zhongnan Road Station—the transfer hub for Wuhan Metro Lines 2 and 4—was built to address evacuation challenges arising from complex spatial layouts and passenger flows. Using PyroSim (Version 2023.1), smoke dispersion, visibility, temperature, and CO concentration from different fire sources were simulated to determine the available safe egress time (TASET). Pathfinder (Version 2023.1) was then employed to conduct evacuation simulations under fire safety constraints, optimizing the required safe egress time (TRSET) by considering fire dynamics and human behavior. By comparing TASET and TRSET, evacuation safety was evaluated, key risks were identified, and the effectiveness and optimization potential of current safety designs were assessed, providing practical insights for fire emergency management in underground metro stations.
2. Materials and Methods
2.1. Overview of Transfer Stations
The Zhongnan Road Station is located in Wuhan City, Wuchang District, Hubei Province, and serves as a key transfer hub for Wuhan Metro Lines 2 and 4. The station features a representative and common dual-island cross-platform interchange design, allowing same-platform, same-direction transfers between the two lines. This configuration—where the four tracks are arranged side by side with two island platforms on the same level—is widely adopted in high-capacity urban transit systems and presents unique challenges in evacuation modeling due to its complex spatial layout and integrated passenger flow patterns.
The station has a two-story underground structure. The first floor of the basement is the station’s hall floor, and the second floor is the platform floor. The total length of the station is 298.4 m, with a total construction area of 3080 m2. Both metro lines share the same station hall, forming a large, integrated concourse that accommodates high passenger volumes and complex movement dynamics. This structural integration and spatial scale make Zhongnan Road Station an ideal case study for analyzing fire evacuation safety and crowd behavior under emergency conditions.
The station is equipped with eight entrances and exits, designated as A/F (A, F), B, C (C1, C2), D (D1, D2), and E, providing multiple access points to the surface. Figure 1 illustrates the layout schematics of both the hall and platform levels, along with representative on-site photographs showing typical interior scenes of the station.
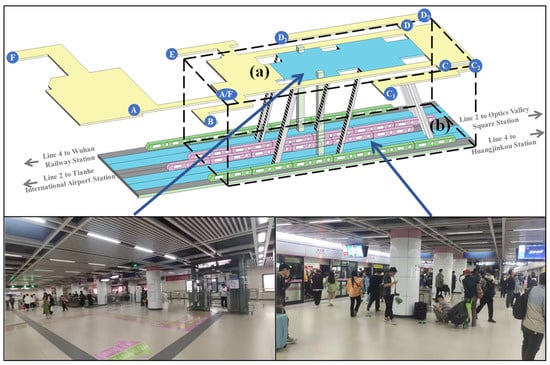
Figure 1.
Spatial structure and typical scenes of Zhongnan Road transfer station: (a) the station’s hall and (b) platform floors.
2.2. Research Methods
2.2.1. Pyrosim
Pyrosim is a software program developed by the National Institute of Standards and Technology and is specifically used for fire dynamic simulation [27]. This software simulates and predicts the dynamic changes of (among others) fire smoke flow, concentration, and temperature, based on the theory of CFD. Once a visual fire model was built using Pyrosim, fire simulation calculations were started directly, and the calculation results, along with smoke view animations, were visualized.
2.2.2. Pathfinder
Pathfinder is a simple, intuitive, and easy-to-use new intelligent emergency evacuation assessment system developed by Thunderhead Engineering in the United States [23]. It utilizes computer graphics simulation and technology in the field of game characters to simulate graphically the movement of each individual in multiple groups, thereby accurately determining the optimal escape routes and escape times for each individual in the event of a disaster.
2.2.3. Computational Analysis Process
In this study, smoke flow and personnel evacuation were evaluated in different fire scenarios at transfer stations based on combined Pyrosim and Pathfinder simulations. The specific computational analysis process is as follows:
STEP 1: Design of fire scenarios and simulations of smoke diffusion. Investigate the types of fire sources prone to occur in subway stations. Simulate the smoke flow patterns by using Pyrosim software after ignition of two different fire sources: flammable packages and equipment short circuits, including smoke spread, visibility field, temperature field, and CO concentration distribution. Calculate the critical evacuation phase time (tmove’) based on the available safety egress time (TASET) calculation formula.
STEP 2: Improvement of the Pathfinder algorithm for personnel evacuation simulation. The Pathfinder personnel evacuation simulations in current studies ignored the influence of environmental factors on escape routes. The default personnel model assumed that as long as the passage was open, the algorithm’s simulations would continue to be used, which could not reflect the impact of the dynamic development of the fire on the selection of evacuation routes. Therefore, this study proposed and improved the threshold conditions for evacuation exits and determined the passage status of safety exits based on real-time fire data, achieving a more reasonable selection of personnel evacuation routes. The safe evacuation phase time (tmove) was obtained using simulations.
STEP 3: Safety evaluation and improvement suggestions. Compare the critical evacuation phase time (tmove’) and the safe evacuation phase time (tmove) to evaluate the safety of emergency evacuation and propose recommended measures.
The specific research route is illustrated in Figure 2.
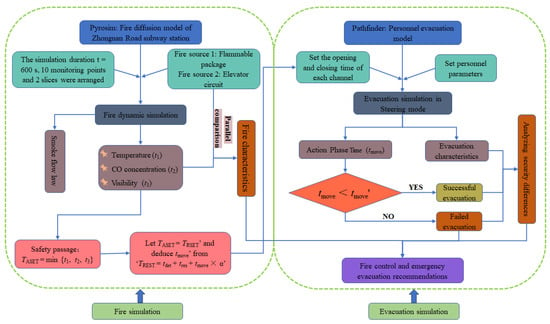
Figure 2.
Analysis process flowchart.
2.3. Establishment of Fire Analysis Model
2.3.1. Fire Model Construction
The size of the model was based on the main building of the station’s hall and platform floors, as illustrated in the dashed box in Figure 1. The overall framework of the model is a cube with dimensions of 116 m (x) × 46 m (y) × 12 m (z). Combined with the actual size of the station, a 1:1 subway station model was established. Figure 3 illustrates the plane and 3D models of the platform floor and station’s hall floor, separately. To simulate the flow of smoke from a structural perspective, the effects of automatic sprinkler systems and smoke exhaust systems were ignored in the calculations.
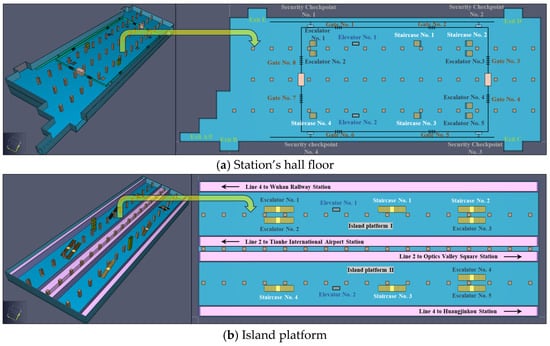
Figure 3.
Construction of the station’s fire analysis model.
2.3.2. Grid Division
Grid size (δx) plays a critical role in the accuracy of fire dynamics simulations. Following the FDS User’s Guide [28], the characteristic fire diameter D* is calculated using the dimensionless formula as follows:
where D* is the characteristic diameter of the fire source, m; ρo is the ambient air density, taking the value of 1.293 kg/m3; To is the temperature, taking the value of 293 K; Cp is the specific heat capacity of air, taking the value of 1.005 kJ/(kg·K) [29].
Taking Q = 4 MW and 5 MW, respectively, the corresponding D* values are calculated to be 4.08 m and 4.46 m according to Equation (1). With the recommended ratio D*/δx ranging from 4 to 16, the δx ranges from 0.255 m to 1.02 m. To determine an appropriate grid size within this range, a grid sensitivity analysis was conducted by setting δx to 0.4 m, 0.5 m, 0.6 m, and 0.7 m. Temperature values were recorded at monitoring points placed every 1 m from 1 to 50 m away from the fire source when t = 300 s. The results, as shown in Figure 4a, indicate that the curves for grid sizes of 0.4 m and 0.5 m exhibit small changes, while those for 0.6 m and 0.7 m show coarser variations with lower resolution. Considering the high degree of curve fitting between the 0.4 m and 0.5 m grids and the significant increase in computational time associated with smaller grid sizes, a grid size of 0.5 m × 0.5 m × 0.5 m was selected for this study. The model was then discretized into a total of 512,256 grid cells, with the grid division result illustrated in Figure 4b.

Figure 4.
Model grid division.
2.3.3. Fire Scenario Design
Fires were classified into six categories, namely A, B, C, D, E, and F, according to the type of combustibles and combustion characteristics [30], as listed in Table 1.

Table 1.
Fire types.
According to the investigation and analysis of common fire types in subway stations, most fire scenarios in subway stations were associated with Class A [31,32,33] and E [31,34,35] fires. Therefore, the simulated fire sources in this study can be designed as flammable packages and elevator short circuits. To analyze the safety of passenger evacuation of the two-story underground structure of the Zhongnan Road Station, the fire source should be located on the platform floor which is most disadvantageous for personnel evacuation and most susceptible to fire under the conditions of combustible materials. Meanwhile, the fire type was determined to be a t2 rapid fire, and it was assumed by default that the Heat Release Rate (HRR) remained constant after it reached the maximum value. The fire source size was 2 m × 2 m, and the fire simulation time was 600 s. The characteristic information of the two fire scenarios is listed in Table 2, and the layout of the fire source space is illustrated in Figure 5.

Table 2.
Calculation of fire scenario information.
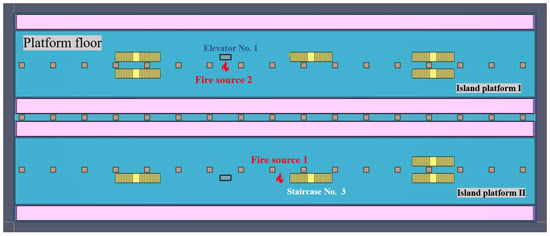
Figure 5.
Fire source layout.
2.3.4. Monitoring Point Arrangement
- (1)
- Determination of the critical height of the smoke layer
Smoke is one of the important factors that threaten personal safety in fires. The calculated height of the fire smoke layer Hs satisfies the following formula [38]:
where Hs is the height of the smoke layer, m. Hc is the critical height of the smoke layer, m. Hp is the eye-level height of evacuees; however, during actual evacuation under fire conditions, occupants are likely to adopt a crouched or bent-over posture to avoid inhaling smoke and heat, resulting in a lower effective eye level [39,40] that can be taken as 1.2 m. Hb is the net height of the building floor, m. The average net height of the two underground floors of the subway station is approximately 4.5 m.
According to the calculation based on Equation (1), we obtain Hc = 1.65 m; therefore, the smoke layer monitoring height was determined to be 1.6 m in this study.
- (2)
- Arrangement of monitoring points
To understand the smoke flow law and obtain TASET, this study performed real-time monitoring tests of three characteristic indicators: smoke visibility, smoke temperature, and CO concentration. The layout of the monitoring points is illustrated in Figure 6. Monitoring points 1–4 were located 1.6 m above the ground at the egress staircases on the platform floor, monitoring points 5–9 were located 1.6 m above the ground at the safety exits on the station’s hall floor, and monitoring point 10 was located 1.6 m above the ground at the center of the station’s hall floor. Cross-sections 1 and 2 are the visibility, temperature, and CO concentration cross-sections at 1.6 m above the ground on the platform’s and station’s hall floors, respectively.
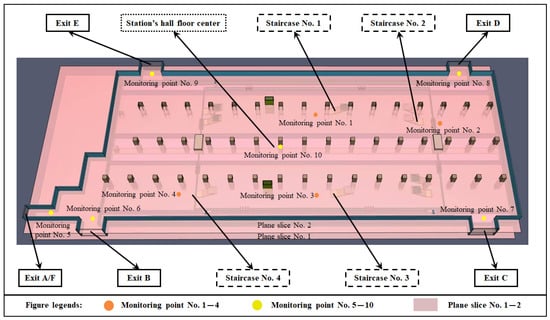
Figure 6.
Station’s layout showing the monitoring points.
2.4. Establishment of the Personnel Evacuation Model
2.4.1. Evacuation Model Construction
The .psm file of the Pyrosim model was imported to establish an evacuation model for Zhongnan Road Station. Then, a personnel evacuation simulation was conducted using Pathfinder. The Zhongnan Road Station has five escalators and two elevators from the platform to the station’s hall floor. According to international conventions and domestic fire-safety requirements, in the event of a fire, personnel are not allowed to evacuate using the escalator/elevator. Passengers on the platform floor are required to reach the station’s hall floor by using the evacuation stairs, while passengers on the station’s hall floor can directly evacuate to outdoor safe locations by using the safety exits. It was assumed that all fare gates on the station’s hall floor are open.
Based on a literature review and site investigations, the parameters of the evacuation model were set. These included personnel density, personnel size, and evacuation speed (both of which follow a normal distribution [19,41]), and various safety exits and egress staircases were established to simulate the evacuation behavior of passengers. The specific calculation parameters are as follows:
- (1)
- Personnel evacuation mode: Steering mode in which individuals can independently move toward the target while adhering to the criteria of avoiding other individuals and obstacles.
- (2)
- Personnel density: 0.2 person/m2.
- (3)
- Number of personnel: station’s hall floor, 616 persons; platform floor, 568 persons, including the old adults and children groups; adult group, 20:80%.
- (4)
- Personnel height: old adults and children, 110–150 cm; adults, 140–180 cm.
- (5)
- Personnel shoulder width: old adults and children, 30–37 cm; adults, 35–42 cm.
- (6)
- Evacuation speed: old adults and children, 0.7–1.0 m/s; adults, 1.1–1.4 m/s.
- (7)
- Evacuation priority: old adults and children > adults.
2.4.2. Critical Evacuation Criteria
- (1)
- Available safety egress time (TASET)
According to the research of the National Fire Protection Association in the United States, numerous factors in a fire can endanger human safety. This study selected the critical conditions of three categories of indicators, including smoke visibility, temperature, and CO concentration, and determined that the critical values of the indicators are those at a height of 1.6 m above the ground. The specific evaluation criteria can be found in Table 3. It was assumed that the time at which the smoke temperature reaches 60 °C is t1, the time at which the smoke visibility reaches 5 m is t2, and the time at which the CO concentration reaches 500 ppm is t3. The TASET is the minimum of the above three critical time values and is expressed as follows:

Table 3.
Critical values of indicators for fire safety evacuation [42].
- (2)
- Required safety egress time (TRSET)
The TRSET of passengers after a fire in a transfer station can be divided into three parts: detection phase time (tdet), response phase time (tres), evacuation phase time (tmove). The calculation formula is expressed as follows:
where α refers to the safety correction factor, which is 1.1 [43,44], tdec refers to the time it takes from the moment the fire detection device senses the alarm to the moment the signal becomes audible, and tres refers to the time from the instant the passenger receives the alarm signal to the instant he/she initiates efforts to escape. The sum of tdet and tres is the passenger’s pre-preparation time. Considering that the Zhongnan Road Station is equipped with a security room and a broadcasting system, this study used a preparation time of 60 s, that is, tdet + tres = 60 s; tmove refers to the time from the beginning to the end of the evacuation of personnel, obtained using Pathfinder simulation.
- (3)
- Evacuation safety assessment
The basis for determining whether personnel have evacuated safely is to compare the relative lengths of the TRSET and TASET. When TRSET < TASET, passengers can escape safely after a fire [45].
3. Results and Discussion
3.1. Simulation Results of Fire Smoke Characteristics
3.1.1. Smoke Spread Process
The dynamic evolution characteristics of smoke spread at different calculation durations in two typical fire scenarios were calculated as illustrated in Figure 7 (unit: s).

Figure 7.
Smoke spread characteristics in different fire scenarios. (The arrows in the figure indicate the direction of smoke flow, and the color bar represents the smoke height.).
Figure 7a illustrates the smoke spread process caused by the burning of luggage packages at staircase No. 3 on platform II. At the beginning of the fire, smoke was generated owing to the incomplete combustion of luggage. The smoke moved upward and spread under the action of thermal buoyancy. At t = 100 s, the smoke concentration around the fire source was high, and the smoke concentration was low at a distance from the fire source on the side of platform II. Some smoke spread to the station’s hall floor through staircase No. 3. At t = 200 s, the smoke spread on the side of platform II accelerated, and a small amount of smoke spread to the station’s hall floor through staircase No. 4 and escalators No. 4 and No. 5. At t = 300 s, the platform’s II side was nearly filled with smoke and the smoke began to output on a large scale to the station’s hall floor. At t = 400 s, the smoke concentration in the middle and right side of the station’s hall floor increased. At t = 500 s, most areas of the station’s hall floor were covered with smoke. At t = 600 s, both the platform’s II side and the station’s hall floor were filled with smoke which discharged outward through the safety exit.
Figure 7b illustrates the process of smoke spread caused by the fire owing to a short-circuit in vertical elevator 1 on the platform’s I side. At the beginning of the fire, there was a small amount of smoke at the fire source. At t = 100 s, the smoke concentration around the fire source increased. At t = 200 s, the smoke began to spread to both ends of the platform’s I side, and some smoke spread to the station’s hall floor through the opening of staircase No. 1. At t = 300 s, the smoke on the platform’s I side spread further, and a small amount of smoke spread to the station’s hall floor through staircase No. 2 and escalators No. 1, No. 2, and No. 3. At t = 400 s, the platform’s I side was nearly filled with smoke and the smoke began to spread on a large scale to the station’s hall floor. At t = 500 s, most areas of the station’s hall floor were covered with smoke. At t = 600 s, both the platform’s I side and the station’s hall floor were filled with smoke which discharged outward through the safety exit.
3.1.2. Smoke Gas Temperature
Figure 8 illustrates the temperature variation curves of evacuation passages in two fire scenarios.
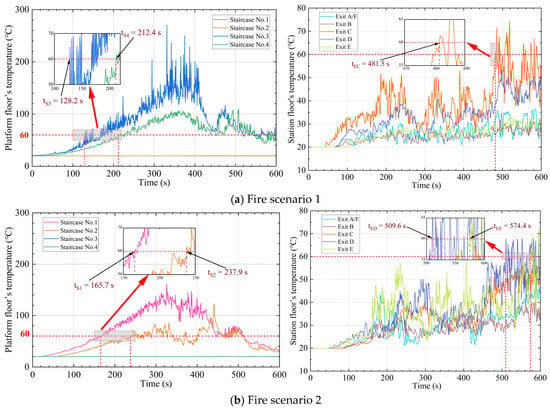
Figure 8.
Temperature curves.
In fire scenario 1, the temperature of staircases No. 3 and No. 4 on the platform’s II side reached the critical value at tS3 = 128.2 s and tS4 = 212.4 s, respectively, and that of safety exit C on the station’s hall floor reached the critical value at tEC = 481.5 s. Additionally, the temperature on the platform’s I side remained constant at the room temperature of 20 °C, and the temperatures of safety exits A/F, B, D, and E did not reach 60 °C throughout the simulation process.
In fire scenario 2, staircases No. 1 and No. 2 on the platform’s I side reached the critical value at tS1 = 165.7 s and tS2 = 237.9 s, respectively, and safety exits D and E on the station’s hall floor reached the critical value at tED = 509.6 s and tEE = 574.4 s, respectively. Additionally, the temperature on the platform’s II side remained nearly constant at the room temperature of 20 °C, and the temperatures of safety exits A/F, B, and C reached 60 °C throughout the calculation process, indicating a safe condition.
3.1.3. Smoke Visibility
Figure 9 illustrates the visibility change curves of evacuation passages in two fire scenarios.
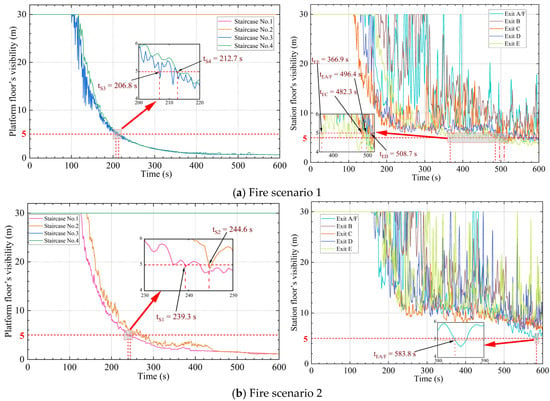
Figure 9.
Visibility variation curves.
In fire scenario 1, the visibility at staircases No. 3 and No. 4 on the platform’s II side reached the critical value of 5 m at tS3 = 206.8 s and tS4 = 212.7 s, respectively, and that at safety exits A/F, C, D, and E on the station’s hall floor reached the critical value at tEA/F = 496.4 s, tEC = 482.3 s, tED = 508.7 s, and tEE = 366.9 s, respectively. In addition, the visibility on the platform’s I side remained constant at 30 m, and the visibility of safety exit B did not decrease to 5 m throughout the simulation process.
In fire scenario 2, the visibility at staircases No. 1 and No. 2 on the platform’s I side reached the critical value at tS1 = 239.3 s and tS2 = 244.6 s, respectively, and that at safety exit A/F on the station’s hall floor reached the critical value at tEA/F = 583.8 s. The visibility on the platform’s II side remained constant at 30 m, and that at the safety exits B, C, D, and E did not drop below 5 m throughout the simulation process.
3.1.4. CO Concentration
Figure 10 illustrates the variation of CO concentration at the evacuation passages in two fire scenarios.
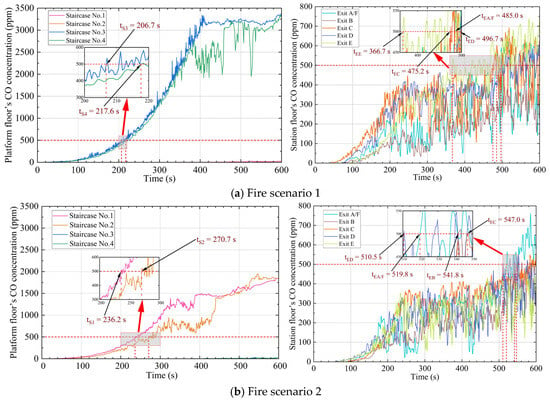
Figure 10.
CO concentration curves.
In fire scenario 1, the CO concentration at staircases No. 3 and No. 4 on the platform’s II side reached the critical value of 500 ppm at tS3 = 206.7 s and tS4 = 217.6 s, respectively, and that at the safety exits A/F, C, D, and E on the station’s hall floor reached the critical value at tEA/F = 485.0 s, tEC = 475.2 s, tED = 496.7 s, and tEE = 366.7 s, respectively. The CO concentration on the platform’s I side slightly increased at 500 s; its value at safety exit B did not reach 500 ppm throughout the simulation process.
In fire scenario 2, the CO concentration at staircases No. 1 and No. 2 on the platform’s I side reached the critical value at tS1 = 236.2 s and tS2 = 270.7 s, respectively, and that at the safety exits A/F, B, C, and D on the station’s hall floor reached the critical value at tEA/F = 519.8 s, tEB = 541.8 s, tEC = 547.0 s, and tED = 510.5 s, respectively. Additionally, the CO concentration on the platform’s II side slightly increased at 400 s, and safety exit E did not reach 500 ppm throughout the simulation process.
3.1.5. Available Safety Egress Time TASET
Table 4 below list the TASET at each node calculated according to Equation (1) based on the time at which the evaluation indicator at each key node reached the critical value in two fire scenarios obtained by the monitoring device.

Table 4.
Determination of TASET at key nodes in scenario 1 and 2 (unit: s).
According to the fire simulation results of fire scenario 1, passengers on the platform’s I side can choose any egress staircases for evacuation. Passengers on the platform’s II side should prioritize evacuation from staircase No. 4, TASET = 212.4 s. The staircase No. 3 near the fire source can be used for appropriate evacuation, TASET = 128.2 s. In fire scenario 2, passengers on the platform’s I side should prioritize evacuation from staircase No. 2, TASET = 237.9 s. Under conditions that ensure safety, evacuation can be achieved through the staircase No. 1, TASET = 165.7 s. Passengers on the platform’s II side can select any egress staircases for evacuation.
Further, the sliced cloud maps of three discriminant indicators at the platform’s floor in two fire scenarios are illustrated in Figure 11; these correspond to the time nodes of scenarios 1 (t = 212.4 s) and 2 (t = 237.9 s). Figure 11a illustrates that at t = 212.4 s in fire scenario 1, the spatial temperatures near the fire source reached values ≥60 °C, and the adjacent staircase No. 3 could no longer be used for evacuation. Meanwhile, the temperature at staircase No. 4 also reached the critical value, and the visibility and CO concentration at staircase No. 3 exceeded the critical value while those at staircase No. 4 were close to reaching the critical value, indicating that passengers on the platform floor on platform’s II side cannot escape at this time. In fire scenario 2, at t = 237.9 s, the temperature at staircase No. 1 already exceeded the critical value, and this staircase cannot be used for evacuation. The visibility and CO concentration at staircase No. 2 did not reach the critical value; however, the temperature reached the critical value. At this time, passengers on the platform floor on the platform’s I side could not escape.
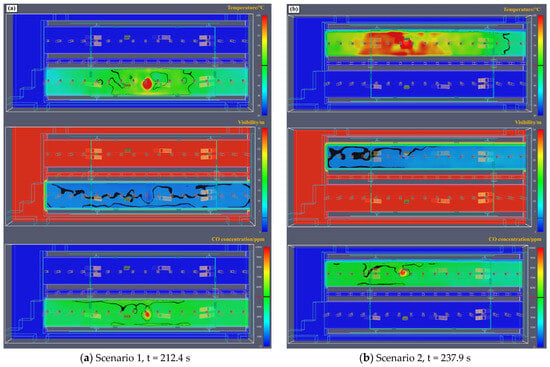
Figure 11.
Sliced cloud maps at the platform floor in the two studied fire scenarios.
3.1.6. Comparison of Fire Source Characteristics
In this fire simulation, the positions of the two fire sources were symmetrical with regard to the center of the station. The center position of the station’s hall floor can be chosen to study the smoke characteristics and analyze the fire characteristics of different fire sources. Real-time monitoring data of smoke temperature, visibility, and CO concentration at monitoring point 10 in the center position of the station’s hall floor under two fire scenarios are illustrated in Figure 12.

Figure 12.
Curves of monitoring indicators at monitoring point 10 in the two fire scenarios.
Figure 12 illustrates that the temperature of scenario 1 is typically higher than that of scenario 2 at the center position of the station’s hall floor, indicating that the heat release rate parameters of the two scenarios satisfied the condition: elevator circuit > luggage package. Furthermore, the visibility in scenario 1 was typically lower than that in scenario 2, indicating that the smoke generation rates of the two scenarios satisfied the condition: luggage package > elevator circuit. Moreover, the CO concentration in scenario 1 was typically higher than that in scenario 2, indicating that the CO generation rates of the two scenarios satisfied the condition: luggage package > elevator circuit. Based on this, targeted fire protection measures can be enforced according to the characteristics of different fire sources. When a fire caused by Class-A combustible materials occurs in a subway station, emphasis should be placed on smoke control, fast ventilating and exhausting smoke, and reducing the concentration of smoke and toxic gases, such as CO. If a fire occurs in Class-E electromechanical equipment, the focus should be on cooling measures, such as sprinkler systems to control the temperature rise as much as possible.
3.2. Personnel Evacuation Simulation Results
3.2.1. Analysis of Evacuation Environment Conditions
During the actual occurrence of a fire, passengers will choose evacuation routes based on the onsite environmental conditions. Considering that the environmental conditions of egress staircases and safety exits will reach critical states one after another after a fire occurs, the environmental conditions at this time cannot meet the safety requirements for personnel evacuation. Therefore, to implement a more refined evacuation escape design, according to the TASET at each key node obtained by the previous Pyrosim simulation, we let TASET = TRSET’ and used Equation (4) to inversely calculate the allowable evacuation phase time tmove’ of each corresponding evacuation point (see Table 5). Accordingly, the opening and closing times of each evacuation exit in Pathfinder were set to simulate the choice of evacuation safety in actual environmental scenarios to optimize the Pathfinder’s algorithm. The blue color indicates that the egress staircases are open, and the red color indicates that they are closed. The light green color indicates that the safety exits are open, and red indicates that they are closed (see Figure 13 and Figure 14). When the actual evacuation phase time of the personnel in the simulation is tmove < tmove’, that is, the personnel enter the passage before the passage is closed, the evacuation is successful; otherwise, the evacuation fails.

Table 5.
Inversion of tmove’ at each key position according to “TRSET = tdet + tres + tmove × α” (unit: s).
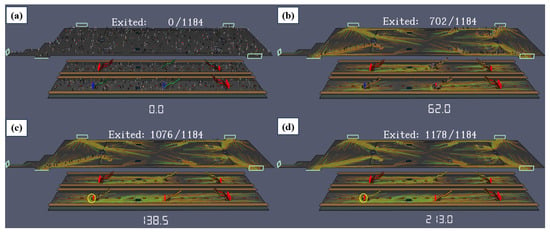
Figure 13.
Schematic of key personnel evacuations in scenario 1 at (a) t = 0 s, (b) t = 62.0 s, (c) t = 138.5 s, and (d) t = 213.0 s.
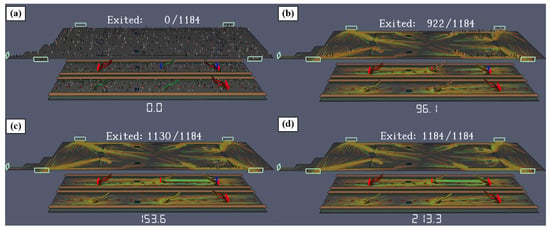
Figure 14.
Schematic of key personnel evacuation in scenario 2 at (a) t = 0 s, (b) t = 96.1 s, (c) t = 153.6 s, and (d) t = 213.3 s.
3.2.2. Evacuation Characteristics of Fire Scenario 1
Figure 13 illustrates the personnel evacuation situation at four key time points in evacuation scenario 1. When t = 0 s, the passengers on the platform’s and station’s hall floors were in a randomly distributed, initial evacuation state. At t = 62.0 s, the staircase No. 3 was closed, and passengers on the platform’s II side queued to enter staircase No. 4 or moved toward staircase No. 4. At t = 138.5 s, staircase No. 4 was closed. However, there were still six passengers on the platform’s II side who had not entered the egress staircase (highlighted by yellow circles in the figure), and they were in a dangerous state at this time. At t = 213.0 s, except for the aforementioned six passengers who did not manage to complete the evacuation, all other passengers safely escaped. The personnel evacuation in scenario 1 failed according to comprehensive judgment.
3.2.3. Evacuation Characteristics of Fire Scenario 2
Figure 14 illustrates the personnel evacuation situation at four key time points in evacuation scenario 2. When t = 0 s, the same initial state was maintained as in scenario 1. When t = 96.1 s, staircase No. 1 was closed, and the remaining passengers on the platform’s I side continued to queue to enter evacuation staircase No. 2 or moved toward staircase No. 2. At t = 153.6 s, all passengers on the platform floor escaped, and staircase No. 2 was still open. At t = 213.3 s, all passengers inside the station safely escaped, and all safety exits were open. Therefore, it is considered that the evacuation of personnel in scenario 2 was successful.
3.3. Comparison of Evacuation Efficiency and Analysis of Safety Level Differences
The curves showing the dynamic flow patterns of people at different positions (a, b) and the pedestrian flow curves of the egress staircase (c, d) are shown in Figure 15 for the two evacuation scenarios.
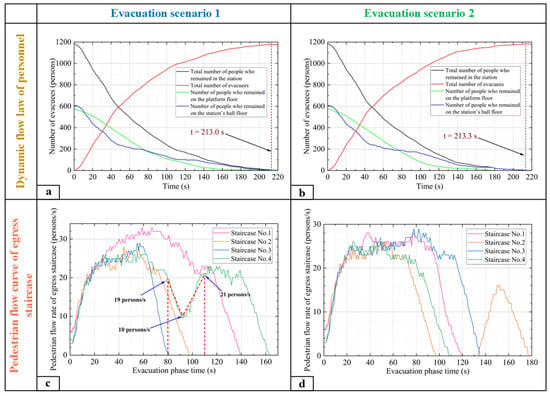
Figure 15.
Dynamic flow law of personnel (a,b) and pedestrian flow curves of egress staircase (c,d) in two evacuation scenarios.
Figure 15a,b illustrates that the overall evacuation process of the two scenarios is the same. The evacuation efficiency (number of people) gradually decreased with time. At t ≈ 40 s, the number of people stranded on the station’s hall floor decreased slowly. At this time, most of the passengers in the station’s hall floor had evacuated, and passengers on the platform floor quickly escaped to the station’s hall floor. At t ≈ 50 s, the numbers of evacuees and of passengers who remained in the station were equal. At t ≈ 100 s, the number of passengers who remained on the platform decreased slowly. At this time, most of the passengers on the platform evacuated to the concourse or safety exits.
Additionally, based on calculations, it was found that the closing time of each safety exit in both fire scenarios far exceeded the passenger’s safe evacuation time, and there was no obvious passenger congestion at any safety exit. The overall safety level was considered acceptable. Figure 15c,d illustrates the variation curve of the pedestrian flow of each egress staircase in the two evacuation scenarios. Focus was placed on the analysis of the safety level of each evacuation staircase.
Approximately 30 s after the onset of evacuation, the pedestrian flow of each egress staircase on the platform floor quickly reached its maximum value, indicating that the efficiency of the evacuation staircase in transporting passengers to the station’s hall floor reached its maximum. Combined with the evacuation animation demonstration, it was found that there were queues in all the evacuation staircases, which gradually slowed down the evacuation progress.
In evacuation scenario 1, the evacuation of passengers on the platform Ⅰ side was not affected by the fire; therefore, the number of personnel passing through staircase No. 1 and the evacuation efficiency of this staircase was relatively higher than those of staircase No. 2. Additionally, the evacuation operation time of staircase No. 1 was longer, indicating that the safety level of staircase No. 1 was higher than that of staircase No. 2. Meanwhile, it was observed that the pedestrian flow at Staircase No. 4 was 19 persons/s at t ≈ 80 s, after which it began to decrease rapidly. At t ≈ 90 s, the flow reached its minimum value in this interval, dropping to 10 persons/s, and then started to increase sharply. By t = 110 s, the flow had risen to 21 persons/s. The default Pathfinder situation was that each personnel chose the nearest path to escape. Combined with the evacuation animation, it can be observed that the sudden increase in pedestrian flow at t ≈ 90 s was caused by the closure of Staircase No. 3, which caused the passengers to queue there initially before they chose another evacuation path. Therefore, the main reason for the failure of evacuation in scenario 1 was attributed to the unreasonable layout of staircase No. 4, and the safety level of staircase No. 4 in this scenario was poor.
In evacuation scenario 2, the evacuation of passengers on the platform’s II side was not affected by the fire. The number of personnel passing through staircase No. 3 and evacuation efficiency at staircase No. 3 were relatively higher than those of staircase No. 2, and the evacuation operation time of staircase No. 2 was shorter, indicating that the safety level of staircase No. 3 was higher than that of staircase No. 4. Although all the personnel in scenario 2 successfully evacuated, it was also found in the calculation that there was an obvious flow interruption of personnel at staircase No. 2 (circled in red in Figure 15d), mainly owing to the closure of staircase No. 1. This indirectly indicates that the arrangement of staircase No. 2 had certain defects, resulting in an increase in the length of the evacuation path and obstacles for passengers in their efforts to choose evacuation methods and exits in emergency situations. Based on the above analysis, the safety levels of each evacuation exit are summarized in Table 6.

Table 6.
Safety level determination of main evacuation exits (1—good; 2—qualified; 3—at risk; 4—poor).
3.4. Discussion
Based on the analysis of smoke flow characteristics and personnel evacuation characteristics in the two tested fire scenarios, and in combination with the spatial structure layout of the Zhongnan Road Subway Station, the following optimization strategies of emergency evacuation are proposed:
- (1)
- Evacuation simulations show that limited number and narrow width of egress staircases cause congestion. It is recommended to increase both the number and width of emergency staircases in future subway station designs.
- (2)
- The current layout places staircases No. 2 and No. 4 at platform ends, leading passengers to favor central staircases No. 1 and No. 3, increasing congestion. Staircase placement should be optimized to distribute evacuation flow more evenly, ensuring all passengers can reach exits via the shortest path.
- (3)
- Underground transfer stations are complex for evacuation. A comprehensive emergency plan should be developed and combined with regular fire drills to improve response capabilities of staff and passengers. Plans should be science-based, standardized, and informed by simulation results under various scenarios.
- (4)
- Passengers tend to evacuate via the “nearest exit,” which can lead to overcrowding and trampling. Real-time information (e.g., video monitoring and public address alerts) should be used to guide passengers toward optimal, less congested routes during a fire, improving evacuation efficiency and safety.
At the same time, this study has certain limitations. The following discussion provides perspectives and future outlook regarding these aspects:
- (1)
- Due to no real fire accidents at this specific station, the direct validation of calculated model was not accessible. However, there are still some methods to ensure the accuracy of the model, including geometry that matches built dimensions, fire and occupant parameters are from classic case studies, and the Pyrosim–Pathfinder method is well-validated. This study has identified general smoke flow and evacuation patterns under realistic conditions. Future work can focus on the small-scale model test to reveal more detailed information about the fire situation in metro stations.
- (2)
- Current standards regarding fires and firefighting such as GB 51251-2017 [38] are primarily based on civil buildings and high-rise buildings, and specific consideration and provisions for underground spaces are lacking. Performance-based design supported by advanced calculation tools can provide an effective means for the unique challenges of smoke control, visibility distribution, and emergency response in complex underground fire environments. The fire safety evaluation and rescue strategies development for urban underground space also deserve more attention and research.
- (3)
- Although the station layout is site-specific, the island platform configuration and the two fire scenarios (electrical equipment and passenger belongings) are representative of common conditions in underground metro systems. The evacuation strategies and simulation framework developed in this study can be adapted to other stations with similar designs, enhancing the transferability of the findings. With the deep utilization of underground space and the construction of urban rail transit systems, more and more large transfer stations and other underground complexes will emerge. The issue of fire safety in underground space structures requires more in-depth research.
4. Conclusions
This study selected the transfer station of the Zhongnan Road Station (Wuhan Metro Lines 2 and 4) as the project support and simulated the dynamic development process of various fire scenarios in the station and the emergency evacuation scenarios of passengers in the event of a fire by employing computer simulation software programs Pyrosim and Pathfinder. The specific research conclusions are the following:
- (1)
- By comparing and analyzing the fire combustion of combustible materials of Scenarios 1 and 2, it can be concluded that the heat released by the elevator circuit was greater than that released by the flammable package, the smoke released by the flammable package was greater than that released by the elevator circuit, and the CO released by the flammable package was greater than that released by the elevator circuit. For different properties of fire sources, targeted smoke control and cooling measures can be adopted to attain the optimal fire disposal effect.
- (2)
- Based on the TRSET calculation formula, the tmove’ of key nodes was inverted according to the TASET value obtained based on simulations to realize the control threshold of the improved algorithm, which was then applied to the Pathfinder simulations. The results demonstrated that the evacuation of personnel in flammable package scenario failed, while that in elevator circuit Scenario was successful.
- (3)
- Based on the coupled simulation results from Pyrosim and Pathfinder, a safety assessment of the evacuation routes at Zhongnan Road Station was conducted. The results indicate that exits A–F are rated at Level 1 (Good), Staircase 1 at Level 2 (Qualified), Staircases 2 and 3 at Level 3 (At Risk), and Staircase 4 at Level 4 (Poor). This grading suggests the need for targeted improvements in staircase design and smoke management to enhance overall evacuation safety.
Author Contributions
J.W.: Writing—Original draft preparation, Conceptualization, Methodology; C.Z.: Data curation, Writing—Review and Editing; Q.D.: Data curation; Z.M.: Data curation; S.G.: Investigation. All authors have read and agreed to the published version of the manuscript.
Funding
This research was funded by the National Natural Science Foundation of China (Grant no. 41920104007).
Data Availability Statement
Some or all data, models, or code that support the findings of this study are available from the corresponding author upon reasonable request.
Conflicts of Interest
The authors declare that they have no known competing financial interests or personal relationships that could have appeared to influence the work reported in this paper. The funders had no role in the design of the study; in the collection, analyses, or interpretation of data; in the writing of the manuscript; or in the decision to publish the results.
Nomenclature
| FDS | Fire Dynamics Simulator |
| CFD | Computational Fluid Dynamics |
| HRR | Heat Release Rate |
| ASET | Available Safety Egress Time |
| RSET | Required Safety Egress Time |
References
- Gan, B.L.; Zhang, D.M.; Huang, Z.K.; Zheng, F.Y.; Zhu, R.; Zhang, W. Ontology-driven knowledge graph for decision-making in resilience enhancement of underground structures: Framework and application. Tunn. Undergr. Space. Technol. 2025, 163, 106739. [Google Scholar] [CrossRef]
- Wang, F.W.; Liang, S.W.; Feng, A.J. Statistics and development analysis of urban rail transit in China in 2023. Tunn. Constr. 2024, 44, 393–400. [Google Scholar]
- Ju, W.; Wu, J.; Kang, Q.C.; Jiang, J.C.; Xing, Z.X. Fire risk assessment of subway stations based on combination weighting of game theory and topsis method. Sustainability 2022, 14, 7275. [Google Scholar] [CrossRef]
- Chen, J. Review of fire risk assessment methods at subway stations. Saf. Emerg. Sci. 2025, 1, 9590001. [Google Scholar] [CrossRef]
- Xie, R.H.; Pan, Y.; Zhou, T.J.; Ye, W. Smart safety design for fire stairways in underground space based on the ascending evacuation speed and BMI. Saf. Sci. 2020, 125, 104619. [Google Scholar] [CrossRef]
- Cui, J.R.; Mei, H.; Sun, H.S.; Ye, J.Q.; Hu, W.; Xu, Y. An experimental study on fire characteristics of urban complex underground space based on BIM. CAAI Trans. Intell. Technol. 2023, 8, 1403–1414. [Google Scholar] [CrossRef]
- Wu, F.; Wang, Y.; Zhou, R.; Jiang, J.C. Effects of passenger blockage on smoke flow properties in subway station fires. Environ. Sci. Pollut. Res. 2022, 29, 65407–65422. [Google Scholar] [CrossRef] [PubMed]
- Meng, N.; Wang, Q.; Liu, Z.X.; Li, X.; Yang, H. Smoke flow temperature beneath tunnel ceiling for train fire at subway station: Reduced-scale experiments and correlations. Appl. Therm. Eng. 2017, 115, 995–1003. [Google Scholar] [CrossRef]
- Ou, J.C.; Wang, X.Y.; Ming, Y.Y.; Sun, X.X. Study on the Influence of Ventilation Speed on Smoke and Temperature Characteristics of Complex Underground Spaces. Fire 2023, 6, 436. [Google Scholar] [CrossRef]
- Hansen, R. Modelling temperature distributions and flow conditions of fires in an underground mine drift. Geosyst. Eng. 2020, 23, 299–314. [Google Scholar] [CrossRef]
- Xu, T.; Zhao, D.Y.; Tao, H.W.; Lei, P. Extended CFD models for numerical simulation of tunnel fire under natural ventilation: Comparative analysis and experimental verification. Case Stud. Therm. Eng. 2022, 31, 101815. [Google Scholar] [CrossRef]
- Kallianiotis, A.; Papakonstantinou, D.; Tolias, I.C.; Benardos, A. Evaluation of fire smoke control in underground space. Undergr. Space 2022, 7, 295–310. [Google Scholar] [CrossRef]
- Wang, X.J.; Zhang, K.S.; Shi, Q.L.; Zeng, B.; Li, Q.; Li, D. Fire Assessment of a Subway Train Fire: A Study Based on Full-Scale Experiments and Numerical Simulations. Fire 2025, 8, 259. [Google Scholar] [CrossRef]
- Yao, H.W.; Lv, K.F.; Li, Y.X.; Zhang, J.G.; Lv, Z.B.; Wang, D.; Zhan, Z.Y.; Wei, X.G.; Song, H.T.; Qin, H.J. Numerical Simulation of Fire in Underground Commercial Street. Comput. Intell. Neurosci. 2022, 1, 4699471. [Google Scholar] [CrossRef] [PubMed]
- Yao, H.W.; Lv, K.F.; Yan, S.K.; Xing, M.Y.; Lou, Z.; Ren, W. Simulation Study on Fire Combustion Process of Oil Immersed Transformer. Int. J. Heat Technol. 2023, 41, 455–461. [Google Scholar] [CrossRef]
- Lin, B.S.M.; Lin, C.Y.; Kung, C.W.; Lin, Y.J.; Chou, C.C.; Chuang, Y.J.; Hsiao, G.L.K. Wayfinding of firefighters in dark and complex environments. Int. J. Environ. Res. Public Health 2021, 18, 8014. [Google Scholar] [CrossRef]
- Vylund, L.; Jacobsson, J.; Frykmer, T.; Eriksson, K. Improving complex problem-solving in emergency response: A study of the fire and rescue service in Sweden. Int. J. Disaster Risk Sci. 2024, 15, 867–878. [Google Scholar] [CrossRef]
- Shan, S.Q.; Guo, X.S.; Wei, Z.Y.; Sun, W.Z.; Zheng, H.T.; Pan, H.F.; Lin, J. Simulation analysis of evacuation processes in a subway station based on multi-disaster coupling scenarios. Int. J. Disaster Risk Reduct. 2023, 96, 103998. [Google Scholar] [CrossRef]
- Kuligowski, E.D.; Gwynne, S.M.V.; Xie, H.; Westbury, A.; Antonellis, D.; Pongratz, C. Simulating Evacuation of Humanitarian Settlements. Fire Technol. 2023, 61, 1327–1357. [Google Scholar] [CrossRef]
- Li, Y.F.; Sun, X.L.; Feng, X.; Wang, C.; Li, J.M. Study on Evacuation in Subway Transfer Station Fire by STEPS. Procedia Eng. 2012, 45, 735–740. [Google Scholar] [CrossRef]
- Adjiski, V.; Mirakovski, D.; Despodov, Z.; Mijalkovski, S. Simulation and optimization of evacuation routes in case of fire in underground mines. J. Substain. Min. 2015, 14, 133–143. [Google Scholar] [CrossRef]
- Qin, J.W.; Liu, C.C.; Huang, Q. Simulation on fire emergency evacuation in special subway station based on Pathfinder. Case Stud. Therm. Eng. 2020, 21, 100677. [Google Scholar] [CrossRef]
- Wang, J.; Guo, J.; Wu, X.M.; Guo, X.H. Study on intelligent algorithm of guide partition for emergency evacuation of a subway station. IET Intell. Transp Syst. 2020, 14, 1440–1446. [Google Scholar] [CrossRef]
- Liu, Z.; Gu, X.Y.; Hong, R. Fire Protection and Evacuation Analysis in Underground Interchange Tunnels by Integrating BIM and Numerical Simulation. Fire 2023, 6, 139. [Google Scholar] [CrossRef]
- Xu, L.; Huang, K.; Liu, J.P.; Li, D.S.; Chen, Y.F. Intelligent planning of fire evacuation routes using an improved ant colony optimization algorithm. J. Build. Eng. 2022, 61, 105208. [Google Scholar] [CrossRef]
- Yang, X.X.; Zhang, R.; Li, Y.X.; Pan, F.Q. Passenger Evacuation Path Planning in Subway Station Under Multiple Fires Based on Multiobjective Robust Optimization. IEEE Trans. Intell. Transp. Syst. 2022, 23, 21915–21931. [Google Scholar] [CrossRef]
- Ovadiuc, E.P.; Năstase, I.; Calotă, R. Numerical Fire Simulation: Key Tools in Fire Safety for Modern Engineering. Rev. Romana de Ing. Civ. 2024, 15, 1–12. [Google Scholar] [CrossRef]
- McGrattan, K.; Forney, G.P. Fire Dynamics Simulator (Version 5) User’s Guide; NIST Special Publication; NIST: Gaithersburg, MD, USA, 2008; Volume 1019, p. 35.
- Zhao, X.K.; Ni, M.H.; Wang, W.C.; Wang, H.W.; Wang, J.N. Study on the Fire Characteristics of Dual Fire Sources and the Difference in Power Temperature of Different Fire Sources in Tunnel. Fire 2024, 7, 273. [Google Scholar] [CrossRef]
- GB/T 4968-2008; Classification of Fires. Standardization Administration of the People’s Republic of China: Beijing, China, 2008.
- Li, X.W.; Yuan, J.F.; Zhang, L.M.; Yang, D.J. Risk assessment of subway station fire by using a Bayesian network-based scenario evolution model. J. Civ. Eng. Manag. 2024, 30, 279–294. [Google Scholar] [CrossRef]
- Wang, X.J.; Liu, B.; Ma, W.L.; Feng, Y.H.; Li, Q.; Sun, T. Simulations on evacuation strategy and evacuation process of the subway train under the fire. Fire 2024, 7, 464. [Google Scholar] [CrossRef]
- Deng, Q.; Zhou, Z.; Zhang, S.R.; Li, D.; Xu, Y.; Zhu, J.L.; Jiang, H.L.; Feng, Y. Bidirectional Evacuation in Subway Fires Considering the Number of Retrograders and Proactive Avoidance Behavior Based on Experiments and Simulations. Int. J. Disaster Risk Sci. 2024, 15, 919–934. [Google Scholar] [CrossRef]
- Sajid, Z.; Yang, Y.Q.; You, P.L.; Deng, H.; Cheng, X.; Danial, S.N. An explorative methodology to assess the risk of fire and human fatalities in a subway station using fire dynamics simulator (FDS). Fire 2022, 5, 69. [Google Scholar] [CrossRef]
- Lu, Y.; Deng, Y.X.; Sun, S.Q. Design for safety in metro station evacuation: A study of fire emergency evacuation behavior and simulation. Eng. Constr. Archit. Manag. 2024, 31, 3479–3507. [Google Scholar] [CrossRef]
- Carlotti, P.; Suzanne, M. Experimental Estimation of Heat Release Rate of Burning Luggage. Fire Technol. 2024, 60, 289–311. [Google Scholar] [CrossRef]
- Zhong, M.H.; Liu, C. Progress of Full-scale Experimental Study for Fire Prevention and Control in Metro Tunnel. Bull. Nat. Sci. Found. China 2021, 35, 878–884. [Google Scholar] [CrossRef]
- GB 51251-2017; Technical Standard for Building Smoke Prevention and Exhaust System. Standardization Administration of the People’s Republic of China: Beijing, China, 2017.
- Yan, J.J.; He, G.G.; Basiri, A.; Hancock, C.; Yeboah, S.K. The impact of postures and moving directions in fire evacuation in a low-visibility environment. Sensors 2024, 24, 1378. [Google Scholar] [CrossRef] [PubMed]
- Wehbe, R.; Shahrour, I. A BIM-based smart system for fire evacuation. Future Internet 2021, 13, 221. [Google Scholar] [CrossRef]
- Fang, S.M.; Liu, Z.J.; Wang, X.J.; Wang, J.; Yang, Z.L. Simulation of evacuation in an inclined passenger vessel based on an improved social force model. Saf. Sci. 2022, 148, 105675. [Google Scholar] [CrossRef]
- Shen, Z.C.; Zhu, H.Y.; Gao, X.H. Study on Building Fire and Evacuation Based on Numerical Simulation. ICCES 2023, 143, 429–437. [Google Scholar] [CrossRef]
- Fan, Y.R.; Cui, H.; Qin, J.W.; Liu, C.C.; Huang, Q. A Case Study on the Evacuation of People during a Fire in the Workshop of a Large Factory. Fire 2024, 7, 47. [Google Scholar] [CrossRef]
- Zhu, Q.K.; Li, J.W.; Du, Y.F. Simulation Study of Personnel Evacuation in Fire Scenarios of Old School Buildings. J. Syst. Simul. 2024, 36, 2043–2053. [Google Scholar] [CrossRef]
- Liu, Z.H.; Zou, R.H. Dynamic evacuation path planning for subway station fire based on IACO. J. Build. Eng. 2024, 86, 108828. [Google Scholar] [CrossRef]
Disclaimer/Publisher’s Note: The statements, opinions and data contained in all publications are solely those of the individual author(s) and contributor(s) and not of MDPI and/or the editor(s). MDPI and/or the editor(s) disclaim responsibility for any injury to people or property resulting from any ideas, methods, instructions or products referred to in the content. |
© 2025 by the authors. Licensee MDPI, Basel, Switzerland. This article is an open access article distributed under the terms and conditions of the Creative Commons Attribution (CC BY) license (https://creativecommons.org/licenses/by/4.0/).