Article

Data-Driven Digital Innovation Networks for Urban Sustainable Development: A Spatiotemporal Network Analysis in the Yellow River Basin, China

School of Economics and Management, Xi’an University of Technology, Xi’an 710054, China
*
Author to whom correspondence should be addressed.
Buildings 2025, 15(17), 3006; https://doi.org/10.3390/buildings15173006
Submission received: 16 June 2025 / Revised: 24 July 2025 / Accepted: 22 August 2025 / Published: 24 August 2025
(This article belongs to the Section Architectural Design, Urban Science, and Real Estate)

Abstract

Digital city planning increasingly relies on data-driven approaches to address complex urban sustainability challenges through innovative network analysis methodologies. This study introduces a comprehensive spatiotemporal network framework to examine digital innovation networks as fundamental infrastructure for urban sustainable development, focusing on the Yellow River Basin as a representative case study. Utilizing digital patent data as innovation indicators across 57 urban centers, we employ advanced network analysis techniques including Social Network Analysis (SNA) and the Quadratic Assignment Procedure (QAP) to investigate the spatiotemporal evolution patterns and underlying driving mechanisms of regional digital innovation networks. The methodology integrates big data analytics with urban planning applications to provide evidence-based insights for digital city planning strategies. Our empirical findings reveal three critical dimensions of urban sustainable development through digital innovation networks: First, the region demonstrated significant enhancement in digital innovation capacity from 2012 to 2022, with accelerated growth patterns post 2020, indicating robust urban resilience and adaptive capacity for sustainable transformation. Second, the spatial network configuration exhibited increasing interconnectivity characterized by strengthened urban–rural linkages and enhanced cross-regional innovation flows, forming a hierarchical centrality pattern where major metropolitan centers (Xi’an, Zhengzhou, Jinan, and Lanzhou) serve as innovation hubs driving coordinated regional development. Third, analysis of network formation mechanisms indicates that spatial proximity, market dynamics, and industrial foundations negatively correlate with network density, suggesting that regional heterogeneity in these characteristics promotes innovation diffusion and strengthens inter-urban connections, while technical human capital and governmental interventions show limited influence on network evolution. This research contributes to the digital city planning literature by demonstrating how data-driven network analysis can inform sustainable urban development strategies, providing valuable insights for policymakers and urban planners implementing AI technologies and big data applications in regional development planning.

1. Introduction

In the digital economy era, information technology has undergone rapid iteration and widespread adoption, fundamentally reshaping global economic structures and urban development models at an unprecedented pace and scale [1]. This transformation necessitates a precise conceptual framework to understand the multi-layered nature of digital innovation processes. Digital innovation constitutes the foundational concept, encompassing the technological processes, methodologies, and outcomes that emerge from the application of digital technologies to create new products, services, or business models. Unlike traditional innovation models, digital innovation exhibits significant characteristics of interconnectedness, openness, and cross-domain integration [2], transcending the constraints of singular entities or linear processes. Building upon this foundation, urban digital innovation represents the city-specific manifestation of digital innovation activities, referring to the localized processes through which urban actors—including enterprises, research institutions, and government agencies—leverage digital technologies to address urban challenges and opportunities within specific municipal contexts. Urban digital innovation encompasses smart city initiatives, digital governance systems, and technology-enabled urban services that operate within individual city boundaries, creating distinctive innovation ecosystems tailored to local conditions and needs.
Beyond individual urban contexts, urban digital innovation networks represent the most sophisticated manifestation of digital innovation processes, constituting the primary analytical focus of this investigation. These networks manifest as complex relational systems comprising multiple actors, levels, and dimensions that transcend individual urban contexts. This networked ecosystem encompasses traditional innovation entities such as enterprises, universities, and research institutions, alongside emerging network-based innovators including digital platforms, digital enterprises, and makerspaces [3]. These diverse innovation actors become interconnected through digital technologies, products, and infrastructure, forming dynamic innovation ecosystems that generate network effects exceeding the sum of individual urban capabilities. The evolution and development of urban digital innovation networks play a crucial role in driving regional economic transformation, upgrading, and enhancing competitiveness [4]. Moreover, they accelerate knowledge diffusion and recombination processes, fostering deep integration between digital technologies and traditional industries through inter-urban collaboration and resource sharing mechanisms. However, regional variations in economic foundations, technological accumulation, and policy environments create significant differences in the evolutionary characteristics and driving mechanisms of urban digital innovation networks across different geographical contexts.
In China, to achieve “sustainable development in the digital economy”, governments have issued a series of policies and guidance documents, such as the “Overall Layout Plan for Building Digital China”, which calls for the establishment of a self-reliant and robust digital innovation system. Focusing on digital technology, enhancing the overall level of digital innovation has become an inevitable choice for accelerating economic digital transformation and achieving high-quality regional development [5]. As cities serve as the essential components of regions and the hub of economic activities and the center of regional innovation, they are critical spaces for the development of digital economies. Furthermore, cities represent the region’s digital innovation due to the concentration of digital resources and the origin of digital innovation [6]. As regional economic integration and digital technology innovation accelerate, central cities and urban clusters are becoming the main carriers of digital economic development, playing a crucial role in promoting China’s overall digital transformation and innovative development.
The Yellow River Basin assumes a strategic role in regional development in China and holds a prominent position in the country’s economic development. However, the overall lag in economic and social development has led to the industrial structure exhibiting a strong reliance on resources, causing insufficient momentum for economic structural transformation, severely hindering its own “rise” [7]. In line with China’s national strategy of sustainable development, adhering to the principles of “seeking benefits from technology” is essential for utilizing digital technology to drive transformation in dynamic, efficient, and quality aspects. Therefore, exploring the network structure of urban digital innovation in the Yellow River Basin is significant as it can inform strategies to enhance the reasonable flow and efficient aggregation of digital innovation factors between regions. It also improves the comprehensive competitiveness of cities in the basin, thus accelerating the realization of sustainable development goals.
The remainder of this paper is constructed as follows: Section 2 provides a comprehensive literature review of urban digital innovation networks, identifying existing research gaps and establishing the rationale for this investigation; Section 3 theoretically elaborates on the conceptual framework of urban digital innovation networks and examines the five key determinants influencing their formation and evolution; Section 4 presents the study area, research methodology, and variable selection procedures; Section 5 employs specialized software for data processing and empirical analysis of the results; and Section 6 discusses the research conclusions, theoretical and practical implications, limitations, and directions for future research.

2. Literature Review

Digital innovation has attracted considerable scholarly attention across multiple disciplines, including economics, management, and geography. Contemporary research examines its conceptual framework, measurement methodologies, and comprehensive impacts. The foundational concept of digital innovation was introduced by Yoo [8], who defined it as the integration of digital and physical components to create novel products. This concept has evolved alongside technological advancements, with scholarly consensus identifying two primary dimensions: technological application and value creation. Notably, Fichman et al. (2014) [9] and Nambisan et al. (2017) [10] characterize digital innovation as the transformation of products, processes, and business models through digital technology implementation. Scholars have also identified distinctive features of digital innovation compared to traditional innovation, including enhanced efficiency and cost-effectiveness [11]. These characteristics contribute to economic vitality, industrial structure optimization, and reduced information asymmetry [12], thereby promoting regional coordination [13].
The measurement of digital innovation has been conducted across multiple spatial scales and digital innovation dimensions. At the international level, Liu et al. (2021) conducted comparative analyses of digital innovation development across major economies, include digital innovation in China, the United States, South Korea, and Japan, utilizing artificial intelligence patent data [14]. At the national level, researchers have developed evaluation frameworks to examine digital innovation levels, efficiency, and spatiotemporal patterns across Chinese provinces [15]. Urban-scale research has investigated OECD metropolitan areas [16], Chinese resource-transitional cities (e.g., Shenyang, Taiyuan) [17], and European smart cities [18], analyzing their respective digital innovation trajectories. The measurement framework has evolved from a bilateral approach (innovation input and output) [15] to a tripartite model (innovation environment, elements, and outcomes) [19], culminating in a comprehensive six-dimensional digital innovation framework encompassing power foundation, social environment, enterprise value, capital dynamics, active domains, and performance metrics [20].
Recent academic digital innovation discourse has increasingly focused on the multifaceted impacts of digital innovation. In corporate management, empirical evidence suggests that digital innovation technology integration significantly enhances Environmental, Social, and Governance (ESG) performance [21]. Huang et al. (2023) demonstrated through an analysis of Chinese listed companies’ digital innovation patent data that digital innovation demonstrated improved corporate performance through enhanced labor productivity, operational efficiency, and competitive advantage [22]. Studies on digital innovation during the COVID-19 pandemic have revealed that digital innovation reduces internal digital innovation coordination costs and enhances supply chain responsiveness [23]. In regional development, Ralston and Blackhurst’s (2020) empirical analysis of innovative city pilot policies demonstrated digital innovation’s catalytic effect on regional digital innovation transformation [24]. Ma et al. (2025) identified an inverted U-shaped relationship between digital innovation economy and regional carbon emissions [25]. Additional innovation research has examined digital innovation’s influence on regional economic digital innovation coordination [26] and total factor productivity [27].
While the extant literature on digital innovation demonstrates considerable progress, several research gaps persist. Although scholars have recognized the comprehensive nature and spatial heterogeneity of digital innovation through developing diverse digital innovation measurement frameworks for regional comparative analysis, insufficient attention has been directed toward digital innovation cross-regional factor flows and the evolution of network structures. Additionally, despite extensive research on digital innovation, innovation’s impacts and effects, the underlying drivers of urban digital innovation networks, and their evolutionary trajectories remain understudied. The development of urban digital innovation networks involves multiple interconnected elements, including technological infrastructure, financial resources, policy frameworks, and human capital, necessitating systematic analysis of their driving mechanisms. Therefore, this study adopts a network relationship perspective, examining 57 cities in China’s Yellow River Basin to analyze spatial patterns and evolutionary dynamics of urban digital innovation networks. Through the identification and analysis of key determinants in network formation, this research aims to illuminate the driving mechanisms of urban digital innovation networks. This approach provides strategic insights for enhancing innovation capabilities and facilitating resource flows across the Yellow River Basin.

3. Theoretical Analysis of Urban Digital Innovation Networks and Their Driving Mechanisms

While the existing literature has extensively examined innovation networks through traditional network theory and digital innovation through technology adoption frameworks, significant theoretical gaps remain in understanding spatially embedded digital innovation networks at the inter-urban scale. Traditional network theory primarily focuses on actor-level relationships within bounded geographical contexts, while digital innovation research often overlooks spatial dimensions and inter-urban connectivity patterns. This study addresses these theoretical limitations by developing an integrated framework that synthesizes spatial network theory with digital innovation systems to conceptualize urban digital innovation networks as emergent inter-urban structures. Drawing from social network analysis, we reconceptualize innovation networks as complex adaptive systems where nodes (innovation actors) and ties (collaborative relationships) evolve dynamically across urban boundaries in response to technological and market stimuli. Network theory emphasizes that innovation emerges not from isolated actors but through interactive relationships and knowledge flows within interconnected structures. In the digital context, these networks exhibit enhanced connectivity and reduced geographical constraints while maintaining spatial embeddedness in local innovation ecosystems.
Building upon this theoretical foundation, the urban digital innovation networks are characterized by four key features: multi-actor involvement, multi-layered structure, dynamic evolution, and spatial correlation. The proliferation of digital technologies has significantly reduced innovation barriers, enabling diverse actors—including large technology firms, startups, academic institutions, research centers, government bodies, investors, industry associations, and individual innovators—to engage in the innovation process. The urban digital innovation networks’ structure is non-linear, comprising a complex, multi-layered topology where entities interconnect through flows of data, knowledge, and capital. Its dynamic nature is evident in continuous structural adjustments, fluid resource allocation, and evolving innovation models. As technological landscapes evolve, market demands shift, and policies change, the network’s components undergo constant reconfiguration. This fluidity facilitates the flexible movement of innovative resources within the network, fostering novel innovation paradigms such as open innovation, crowdsourcing, and platform-based innovation. Although digital technologies have mitigated certain geographical constraints, spatial factors remain crucial in shaping the urban digital innovation networks’ formation and development. Digital technologies exhibit significant effects on geographical agglomeration, spatial spillovers, and network structuring, underscoring the enduring importance of spatial dynamics in digital innovation processes.
The formation and evolution of urban digital innovation networks are influenced by multiple factors. Drawing on existing research and empirical observations from the Yellow River Basin, this study identifies five key determinants: geographical proximity, factor mobility, market mechanisms, industrial foundation, and government policies. Geographical proximity remains a fundamental factor in the formation of innovation networks [28], even in the digital economy era. Spatial agglomeration significantly influences knowledge spillovers and innovation collaboration by reducing transaction costs, fostering trust, and accelerating knowledge diffusion [11], particularly in vast, unevenly developed regions like the Yellow River Basin. Concurrently, the mobility of production factors drives the development of urban digital innovation networks through optimized resource allocation and enhanced knowledge dissemination [29]. The digital economy has increased the fluidity of talent, capital, and information, accelerating resource integration and promoting cross-regional network expansion. Furthermore, market dynamics play a pivotal role in shaping urban digital innovation networks through competition and cooperation, compelling innovation entities to seek external collaborations while creating new opportunities through evolving market demands and emerging business models [30]. The industrial foundation of a region, encompassing its structure, technological capabilities, and innovation capacity, directly influences its position within urban digital innovation networks by providing essential support through technological accumulation, talent pools, and market demand [31]. In the Yellow River Basin, cities with strong digital industry foundations often emerge as core network nodes, while those dominated by traditional industries must undergo transformation to enhance their network position. Lastly, government policies serve as a significant external force in shaping urban digital innovation networks through policy formulation, infrastructure provision, and resource allocation guidance [32]. While multi-level governmental entities have been instrumental in promoting digital economy growth and fostering innovation cooperation in the Yellow River Basin, a delicate balance is necessary to avoid impeding market mechanisms and hindering the organic development of innovation networks.
This study employs a systematic methodological approach to investigate the evolutionary characteristics and driving mechanisms of urban digital innovation networks (Figure 1). The research process commences with a comprehensive review of relevant domestic and international literature on digital innovation. This is followed by an elucidation of the core concepts and developmental features of urban digital innovation networks. The methodology then outlines the variable selection process for measuring digital innovation and the application of these metrics to assess innovation capacity in the Yellow River Basin. Utilizing SNA, the study constructs urban digital innovation networks encompassing 57 cities in the Yellow River Basin, examining the evolutionary patterns of both the overall network and individual nodes. Finally, the research quantitatively analyzes the driving mechanisms behind urban digital innovation networks, employing multiple indicators across five dimensions: geographical proximity, industrial foundation, policy support, market demand, and technological spillovers. This multifaceted approach facilitates a comprehensive understanding of the factors influencing urban digital innovation networks’ development and dynamics in the region.

4. Materials and Methods

4.1. Study Area

The Yellow River Basin, spanning approximately 5464 km across nine Chinese provinces and regions (Qinghai, Sichuan, Gansu, Ningxia, Inner Mongolia, Shaanxi, Shanxi, Henan, and Shandong), is a cradle of Chinese civilization and plays a crucial role in China’s socioeconomic development. Despite its significance, the region faces challenges including limited digital innovation capacity, overconcentration of innovation resources, and insufficient inter-regional collaboration. In the digital economy era, technological advancements are reshaping regional industrial structures and innovation paradigms, offering new avenues for coordinated and high-quality development in the Yellow River Basin [33]. This study focuses on the Yellow River Basin cities for two primary reasons: (1) the region’s diverse array of cities with varying economic foundations, industrial structures, and innovation capabilities provides a rich dataset for examining the formation mechanisms and driving factors of urban digital innovation networks; and (2) the Yellow River Basin’s dual imperatives of ecological preservation and economic growth highlight the pivotal role of digital innovation in fostering sustainable development and industrial transformation. This research aims to elucidate the general principles governing digital economic development and provide targeted recommendations for the Yellow River Basin’s sustainable growth.
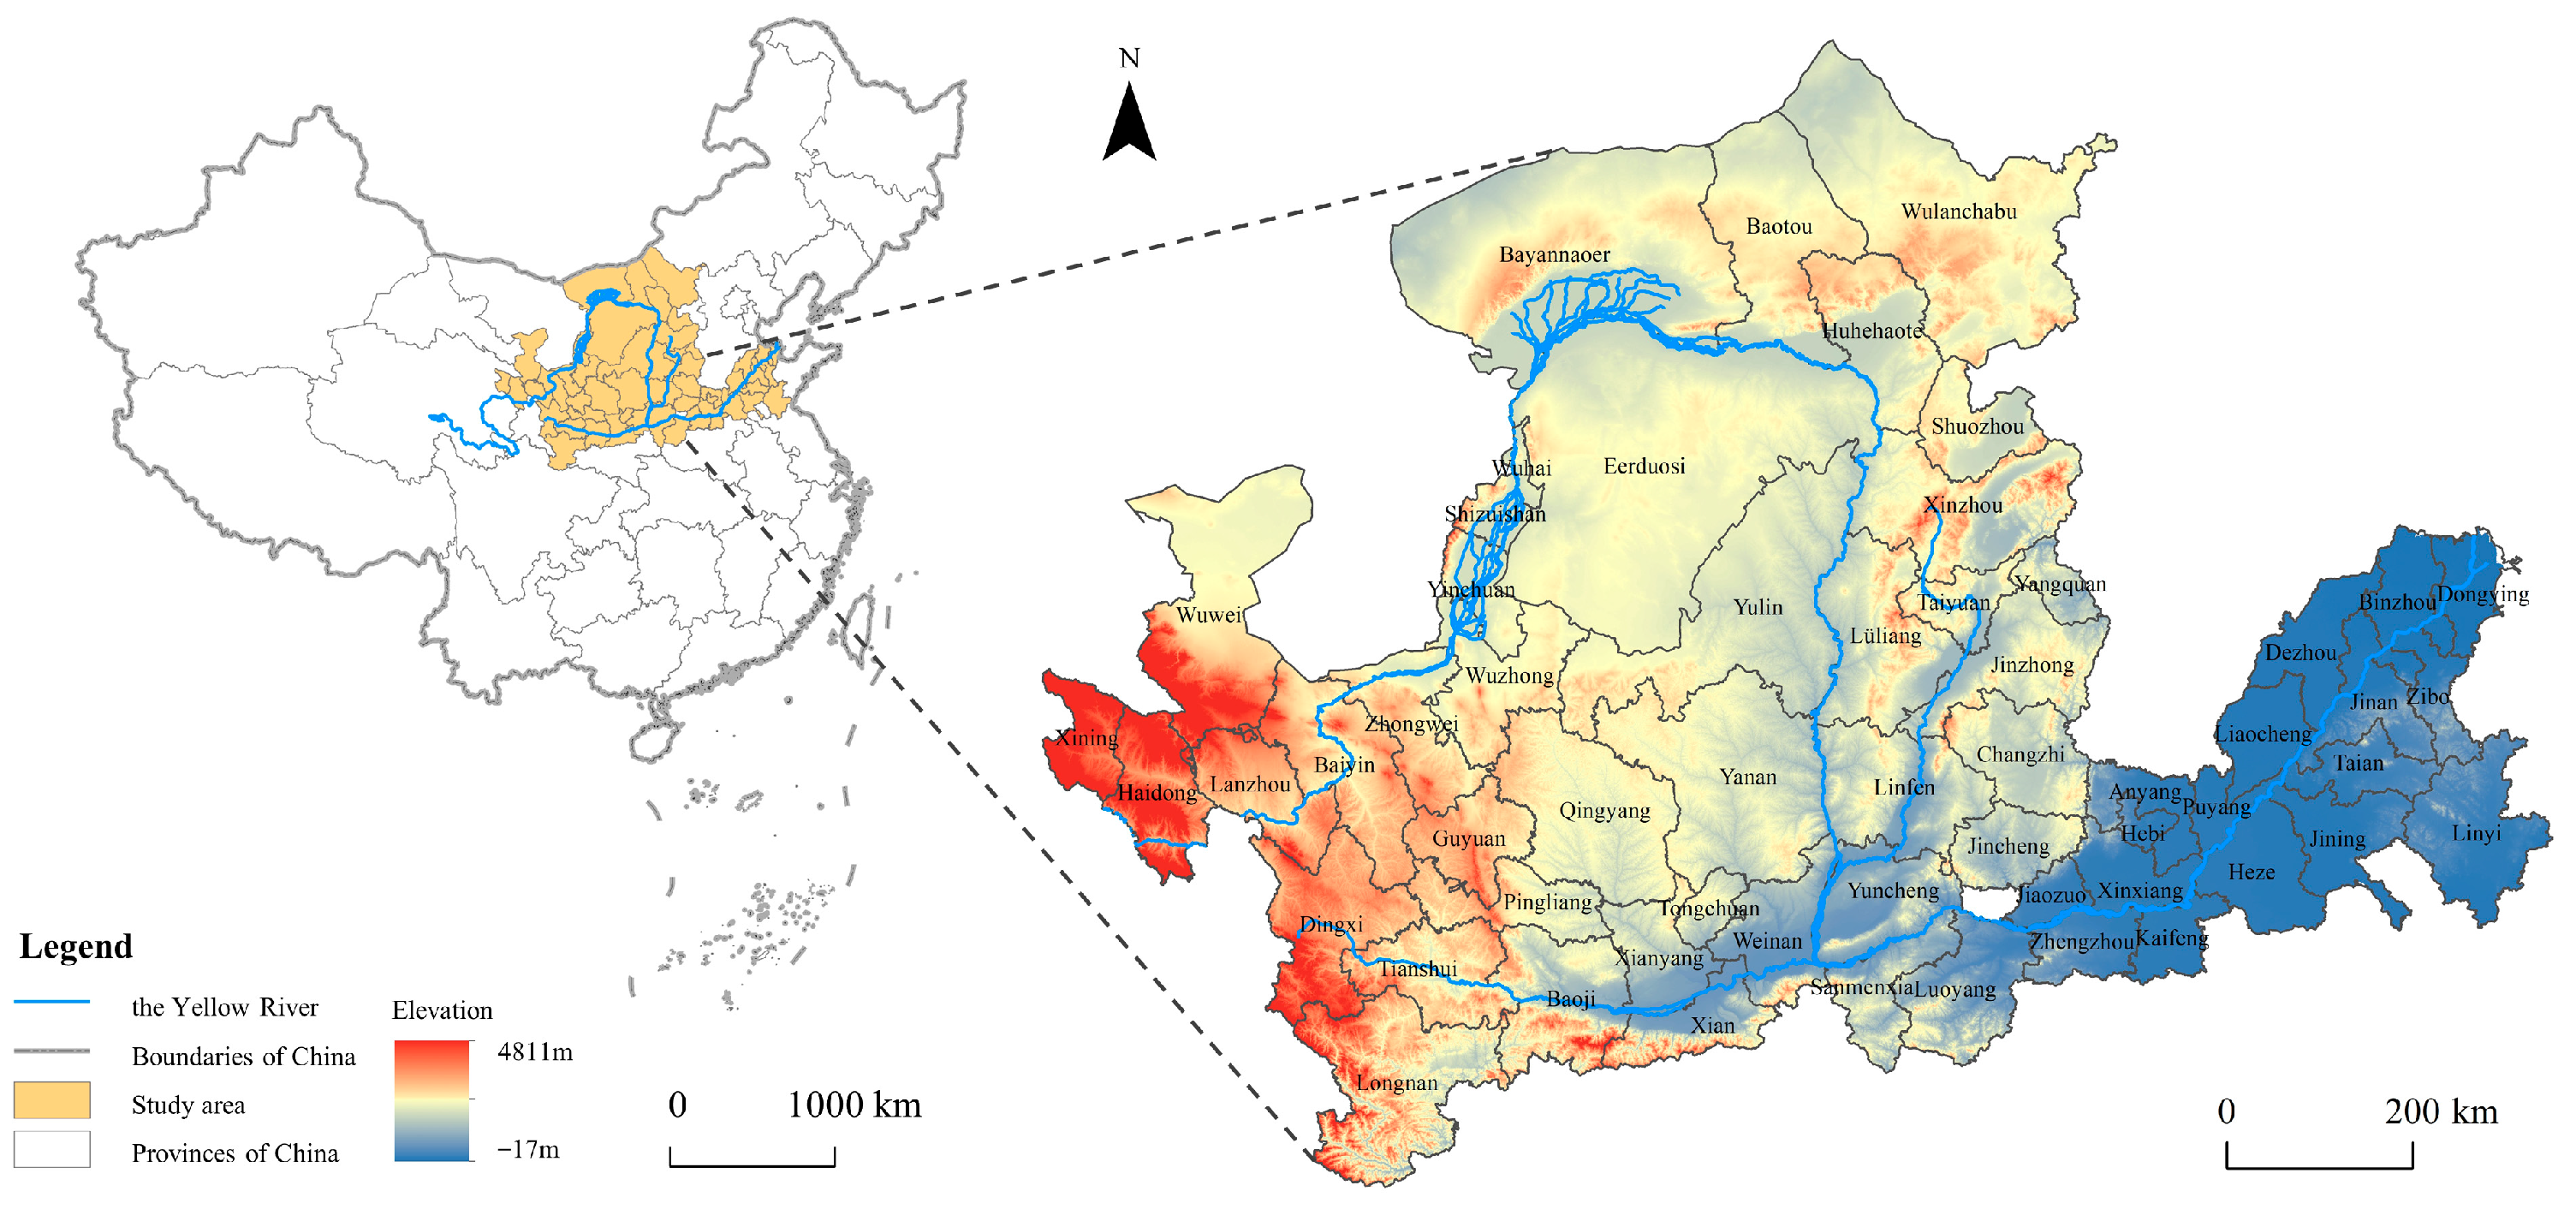
Drawing from the “Encyclopedia of Yellow River Culture”, a seminal work in the Chinese Yellow River Basin scholarship, this study initially considered 66 cities, among which Aba, Linxia, Gannan, Haibei, Huangnan, Hainan, Guoluo, Yushu, and Haixi had more missing data and were eliminated. Finally, 57 cities were selected as the study area for this research (Figure 2). According to the criteria of the Yellow River Conservancy Commission of the Ministry of Water Resources, the above cities are divided into three regions: upstream, midstream and downstream. There are 21 upstream cities, namely Xining, Haidong, Yinchuan, Shizuishan, Wuzhong, Zhongwei, Guyuan, Lanzhou, Baiyin, Tianshui, Wuwei, Pingliang, Qingyang, Dingxi, Longnan, Huhehaote, Baotou, Wuhai, Eerduosi, Bayannaoer and Wulanchabu. There are 21 midstream cities, namely Xi’an, Tongchuan, Baoji, Xianyang, Weinan, Yan’an, Yulin, Taiyuan, Yangquan, Changzhi, Jincheng, Shuozhou, Jinzhong, Yuncheng, Xinzhou, Linfen, Lvliang, Zhengzhou, Luoyang, Jiaozuo and Sanmenxia. The remining 15 cities, namely Kaifeng, Anyang, Hebi, Xinxiang, Puyang, Jinan, Zibo, Dongying, Jining, Tai’an, Linyi, Dezhou, Liaocheng, Binzhou and Heze, are all downstream cities.

4.2. Research Methods

4.2.1. Constructing Urban Digital Innovation Networks: A Modified Gravity Model Approach

In urban digital innovation network research, “nodes” represent individual cities, while “links” represent digital innovation relationships between cities. Literature review reveals that scholars typically construct urban innovation networks using methods such as Exponential Random Graph Models (ERGMs) and gravity models. Considering that the ERGM primarily captures endogenous network processes and assumes relatively homogeneous interaction environments, it cannot explicitly incorporate spatial and economic heterogeneity [34,35], resulting in insufficiently precise characterization of the driving mechanisms of inter-urban innovation flows. However, gravity models can compensate for the limitations of ERGMs. The gravity model, derived from the law of universal gravitation in physics, posits that interaction intensity between two entities is proportional to their masses and inversely proportional to their distance. Its theoretical foundation aligns highly with spatial economics, emphasizing that knowledge spillovers follow predictable patterns based on economic mass and spatial proximity [36,37,38].
Therefore, this study draws upon relevant research to construct a Modified Gravity Model for characterizing the spatial associations of urban digital innovation networks in the Yellow River Basin [39,40]. To address the limitation of traditional models in reflecting directional interactions, this study introduces a directional coefficient k, enabling the model to identify spatial transmission pathways of digital innovation factors. By selecting relevant variables to characterize the “mass” of urban digital innovation and its spatial distance, the Modified Gravity Model provides a powerful analytical tool for accurately constructing urban digital innovation networks in the Yellow River Basin. The mathematical expression of the Modified Gravity Model (MGM) is presented in Equation (1):
R i j = K i j P i G i M i 3 × P j G j M j 3 D i j 2 ,   K i j = M i M i + M j ,
In the equation: Rij denotes the digital innovation gravitational force between cities i and j; Dij represents the Euclidean distance between the centroids of cities i and j (computed via ArcGIS 10.2). Given that digital innovation is influenced by urban scale and economic development, this study employs a composite measure incorporating resident population (P), gross regional product (G), and digital patent grants (M) to quantify urban digital innovation capacity. The reasons are as follows: Resident population serves as a proxy for human capital availability and knowledge base diversity, essential components of innovation capacity as established in endogenous growth theory. GRP captures the economic infrastructure and resource availability necessary for sustaining innovation activities, reflecting the material foundations of innovation ecosystems [41]. Digital patents directly measure technological output and innovation performance in digital domains, representing the realized innovation capacity that can be transmitted across urban networks [42,43]. These variables collectively operationalize the multidimensional nature of digital innovation capacity by capturing input factors (population, economic resources) and output measures (patent production), consistent with established innovation measurement frameworks.
The demographic and economic data are sourced from the “China City Statistical Yearbook”. K represents the gravitational correction coefficient, defined as the ratio of digital patent grants in city i to the total grants in cities i and j.
To establish the urban digital innovation networks connectivity between cities, the initial gravitational matrix Rij is converted into a binary matrix B, with elements bij satisfying the conditions specified in Equation (2):
b i j = 1 ,   R i j > t * 0 ,   R i j t * ,   t * = 1 n j = 1 n R i j ,
In Equation (2), following relevant literature, this study employs the annual gravity matrix row mean t* as the threshold identification criterion to eliminate weak correlations and highlight the backbone structure of the network [40]. Unlike fixed absolute thresholds, row means adapt to the varying scales of urban innovation activities, ensuring that threshold determination reflects each city’s relative position within the regional innovation hierarchy. When Rij > t*, bij = 1 indicating that the digital innovation influence of city i on city j exceeds the average influence of city i across all cities, thereby establishing a directed link from city i to city j. Conversely, bij = 0 denotes the absence of such a directed link from city i to city j.

4.2.2. Evolutionary Characteristics of Urban Digital Innovation Networks: A Social Network Analysis Approach

SNA is a methodology that elucidates the overall structure and hierarchical nature of spatial networks by examining network nodes and their interrelationships [44]. In recent years, SNA has gained widespread application across various disciplines, including statistics, economics, sociology, and management [45]. This study employs SNA to investigate urban digital innovation networks in the Yellow River Basin. Based on the binary relationship matrix of the digital innovation network derived from Equation (2), we utilize four metrics to characterize the overall network structure:
(1)
Network Density (D): Reflects the degree of interconnectedness among cities in the network, calculated as the ratio of existing relationships to the maximum possible connections.
(2)
Network Connectivity (C): Measures the extent to which city nodes can establish direct or indirect connections, indicating the network’s stability and vulnerability.
(3)
Network Efficiency (E): Assesses the level of redundancy in inter-city interactions for digital innovation advancement.
(4)
Network Hierarchy (H): Quantifies the degree of asymmetric accessibility within the network, with higher values indicating more pronounced hierarchical structures.
Furthermore, we employ three centrality measures to characterize the individual roles of cities within the Yellow River Basin’s urban digital innovation networks:
(1)
Degree Centrality (CD): Indicates a city’s prominence within the network, with higher values suggesting a more central role and greater autonomy.
(2)
Closeness Centrality (CC): Represents a city’s proximity to all other nodes, reflecting its capacity for rapid communication and collaboration within the network.
(3)
Betweenness Centrality (CB): Measures a city’s intermediary function, with higher values signifying a more significant role in facilitating information flow and resource exchange.
The computational formulas for these overall and individual network metrics are presented in Table 1.

4.2.3. Driving Factors of Urban Digital Innovation Networks: A Quadratic Assignment Procedure Analysis

QAP is a method for evaluating the similarity between elements of two matrices. It operates by comparing matrix elements to derive correlation coefficients, followed by non-parametric testing of these coefficients [46]. QAP, fundamentally based on matrix permutation and utilizing relational data, offers more robust parameter estimates compared to traditional parametric statistical tests [47]. The QAP analysis process comprises the following steps:
(1)
Calculating the correlation coefficient between the dependent variable matrix and each independent variable matrix.
(2)
Performing random permutation of row and column labels of one matrix and computing the correlation coefficient between the permuted and unpermuted matrices. This process is repeated multiple times (typically thousands or tens of thousands) to generate a distribution of correlation coefficients.
(3)
Comparing the initial correlation coefficient with the distribution obtained from the permutation process, and determining statistical significance by assessing whether the coefficient falls within the critical region. The significance of the relationship is typically evaluated at conventional levels (0.01, 0.05, or 0.10), with coefficients within these levels indicating strong associations between the matrices under study [48].
This approach enables robust inference in network analysis, particularly when dealing with interdependent observations, a common characteristic of network data.

4.3. Variable Selection and Data Sources

While some scholars have developed technological innovation evaluation systems based on variables from authoritative institutions like the World Intellectual Property Organization, INSEAD, and the European Union [49], these systems primarily rely on macro-statistical data (e.g., regional patent counts, R&D funding, and economic totals) and lack specific indicators for digital economy sectors [50]. Other researchers have attempted to assess digital innovation by focusing on a limited number of enterprises in specific locations, but this approach proves challenging for large-scale regional comparisons and network analyses [51].
To address these limitations, this study employs the number of invention patents in core digital economy industries as a key metric for urban digital innovation. Although patent data alone cannot comprehensively capture urban digital innovation capacity and quality, it serves as a valuable indicator of technological progress and innovation dynamics. The use of digital patent data in measuring urban digital innovation offers several advantages: Firstly, clear classification standards for core digital economy industries ensure consistency in statistical calibration when matching patent data. Secondly, patent data effectively captures technological advancements and knowledge creation in the city’s digital economy, providing a reliable representation of urban digital innovation levels. Lastly, digital patent data provide enhanced reliability and accessibility, facilitating more accurate measurements of inter-city innovation network characteristics. This approach, although not without limitations, provides a robust foundation for analyzing urban digital innovation trends and networks across broader spatial scales [52].
The process of acquiring digital patent data consists of the following steps:
(1)
Defining the scope of core digital economy industries.
The “Classification of National Economic Industries (2017)” (https://www.mca.gov.cn/images3/www/file/201711/1509495881341.pdf, accessed on 21 August 2025) issued by China’s National Bureau of Statistics was utilized to categorize core digital economy industries into four major sectors: digital product manufacturing, digital product services, digital technology applications, and digital factor-driven industries. The subclasses and specific items for these categories were retained as defined in the classification [53].
(2)
Matching industries with patent classifications.
A correspondence was established between the defined digital economy industries and their respective International Patent Classification (IPC) numbers. This was achieved by mapping the relationships between digital economy industries and national economic industries, resulting in a comprehensive correspondence table.
(3)
Extracting and processing patent data.
Using the Inco Pat global patent database (https://www.incopat.com/), we collected patent data for core digital economy industries from 2012 to 2022. We encountered a challenge due to discrepancies in classification levels between the patent data (using subgroup-level IPC main classifications) and our industry-IPC correspondence table (including subclass, main group, and subgroup levels). To address this, subclass and main group level information were extracted from the patent data’s IPC main classifications and matched at consistent classification levels. This process yielded the final patent counts for core digital economy industries in the Yellow River Basin cities.

5. Results

5.1. Analysis of Evolution Characteristics of Urban Digital Innovation in the Yellow River Basin

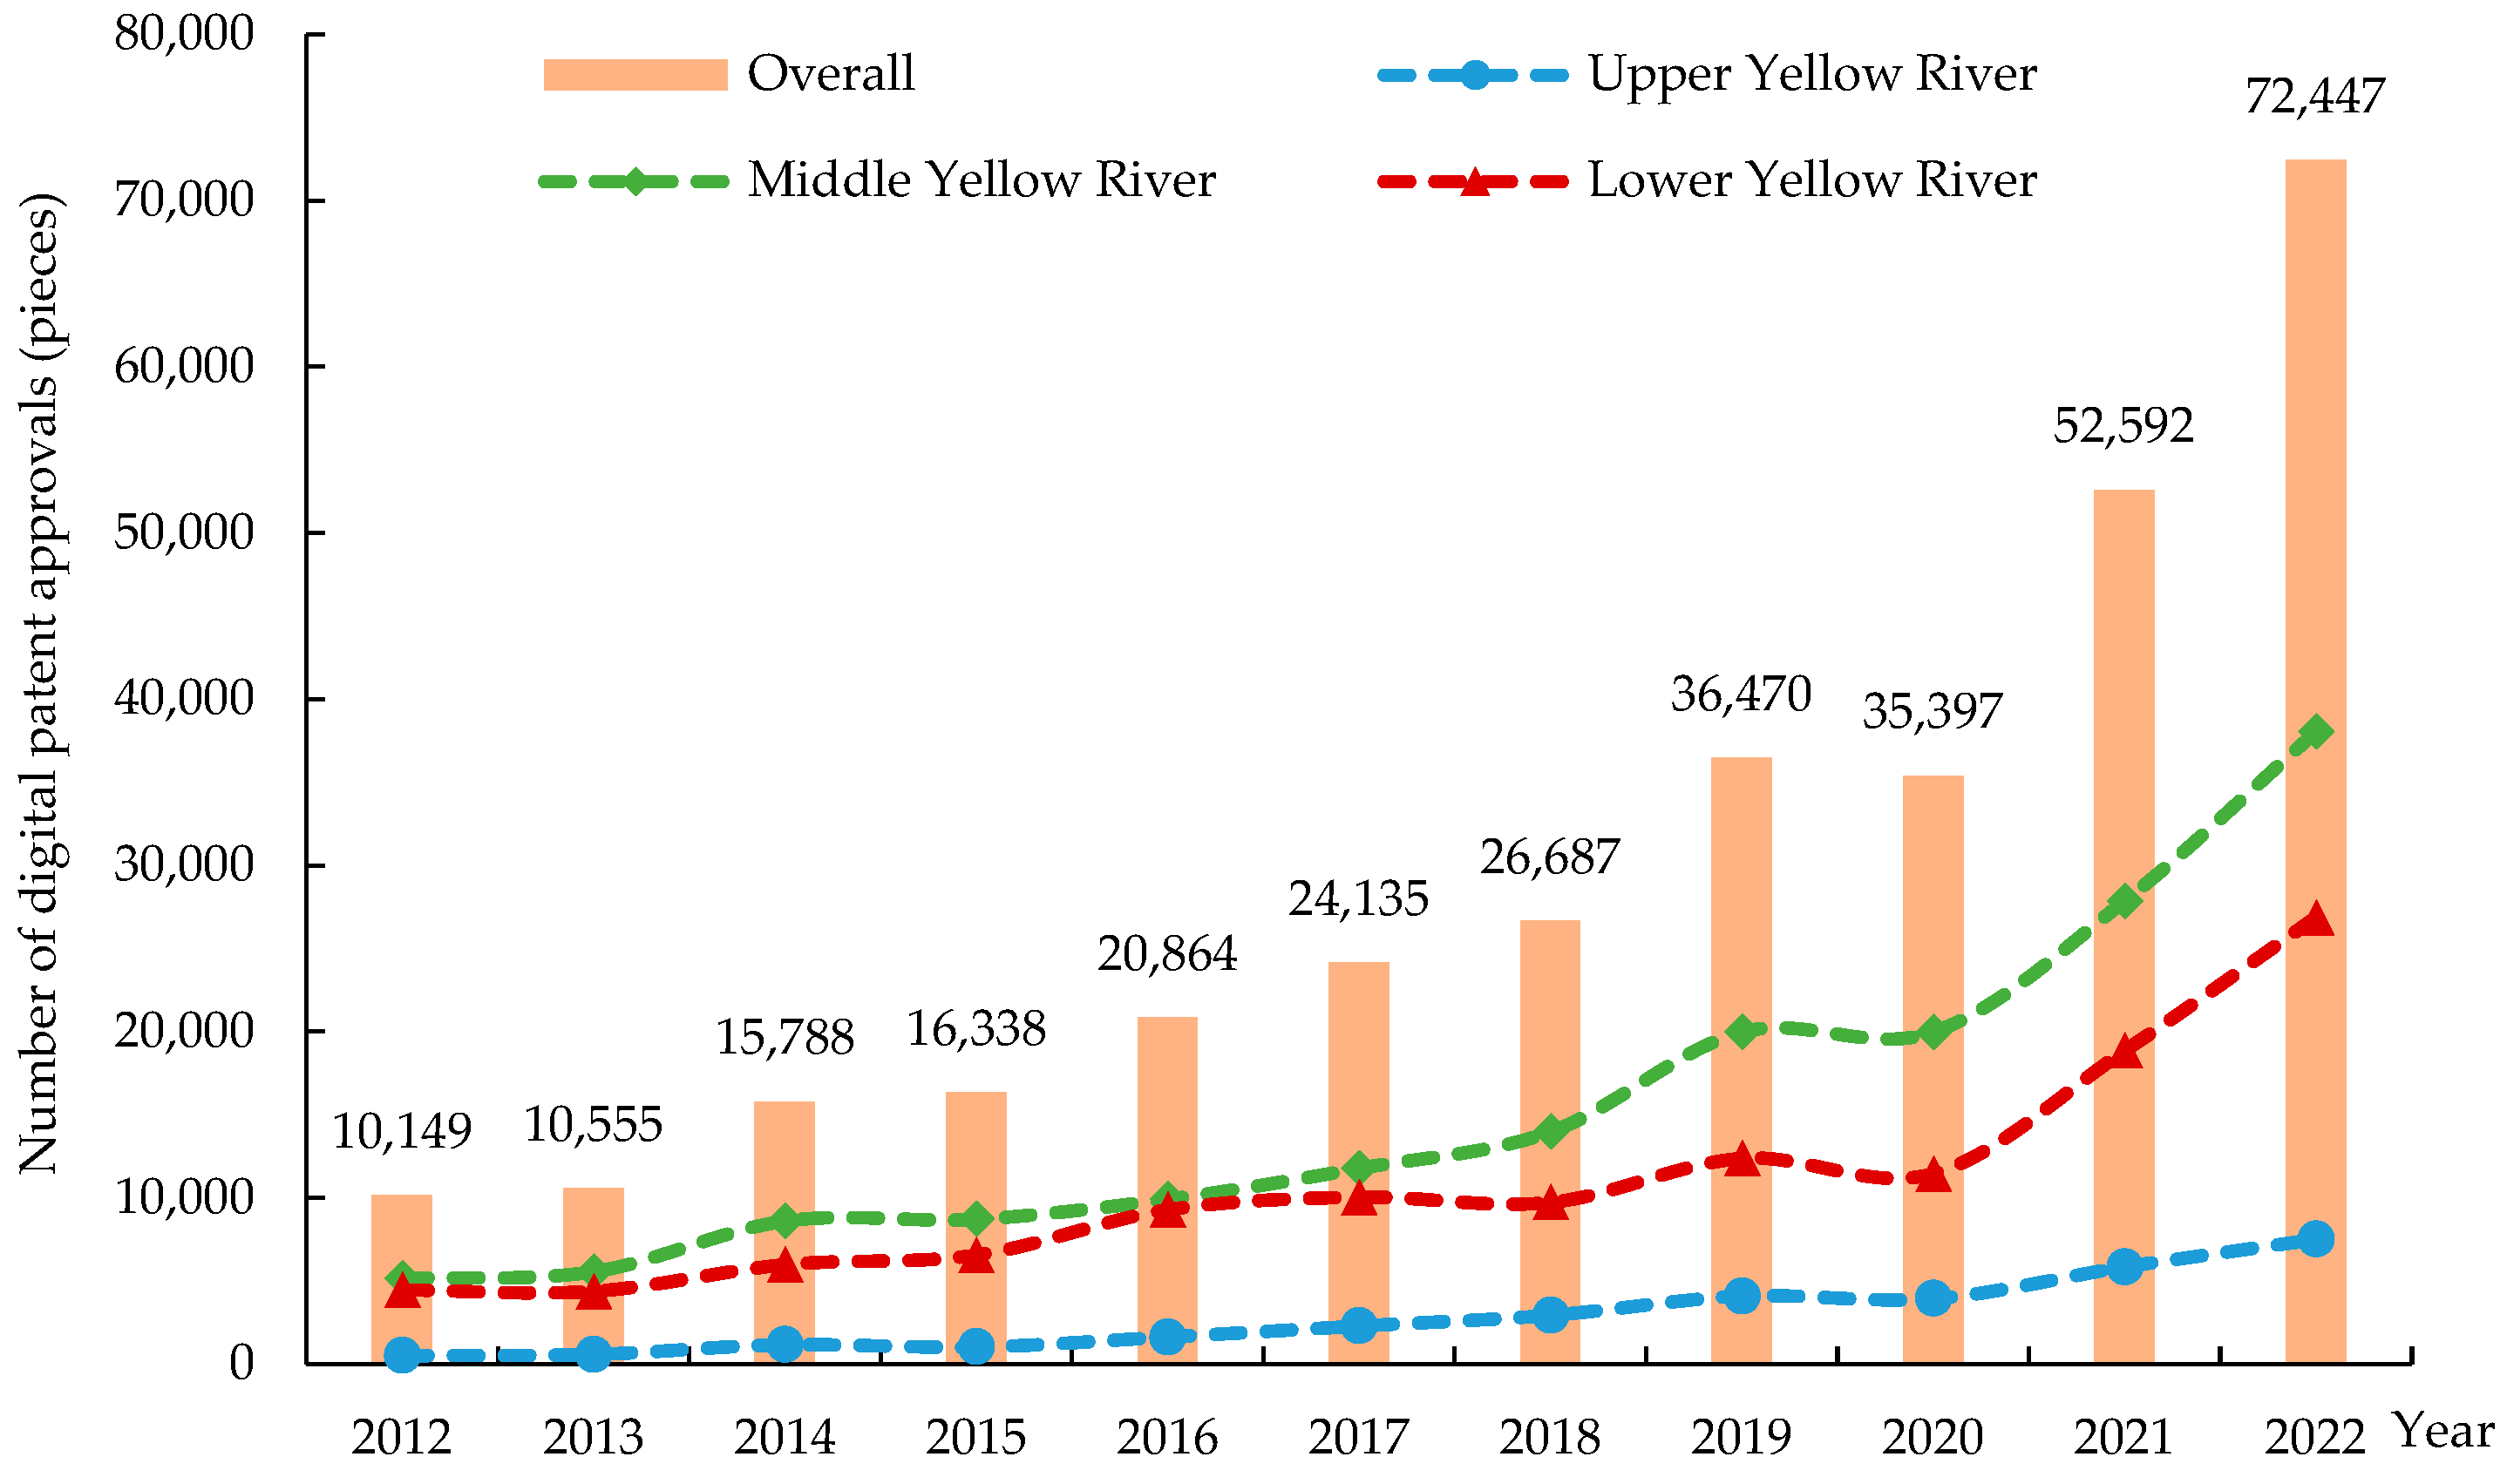
Digital patent data serve as a key indicator for assessing the development of urban digital innovation in the Yellow River Basin. Figure 3 illustrates the overall upward trend in urban digital innovation development within the Yellow River Basin. The number of digital patent grants increased significantly from 10,149 in 2012 to 72,447 in 2022, with an average annual growth rate of approximately 61.4%. This surge not only reflects the rapid enhancement of urban digital innovation capabilities in the Yellow River Basin but also highlights the progressive improvement of the region’s innovation ecosystem. Recent national-level strategies, such as the “Digital China Construction” initiative and the “Ecological Protection and High-Quality Development of the Yellow River Basin” program, have provided substantial momentum for the Yellow River Basin’s digital economy development. The Yellow River Basin’s unique geographical advantages and robust industrial foundation have created extensive application scenarios and market demand for its digital economy. Major cities in the Yellow River Basin, including Xi’an, Zhengzhou, and Jinan, have consistently increased their investments in frontier technologies such as artificial intelligence, Internet of Things (IoT), and cloud computing, further enhancing the region’s digital innovation capabilities.
Notably, in 2020, the number of digital patent grants in the Yellow River Basin temporarily declined to 35,397 before quickly rebounding. This fluctuation may be attributed to two primary factors: (1) Due to the impact of the COVID-19 pandemic, the economy weakened, and enterprises, as the main bodies of patent output, collectively reduced their R&D investments, leading to an overall decrease in the number of digital patent grants in the Yellow River Basin. (2) The revision of China’s patent law, which potentially affected the speed of digital patent grants due to new examination standards and procedures. The subsequent rapid increase in digital patent grants after 2020 underscores the resilience and adaptability of the Yellow River Basin’s digital innovation ecosystem.
The cities across the upstream, midstream, and downstream of the Yellow River Basin exhibit significant disparities in digital patent grants, reflecting varying levels of digital innovation capacity. Cities in midstream lead with an average annual grant of 15,422 patents during 2012–2022, demonstrating robust innovation momentum. This region, serving as a crucial link between upstream and downstream, has effectively integrated urban digital innovation resources, achieving breakthroughs in frontier fields such as artificial intelligence and big data. Consequently, urban digital innovation clusters have emerged, centered around cities like Zhengzhou and Xi’an. The downstream of the river ranks second with 10,921 annual grants during the study period, indicative of a transition from scale-driven growth to high-quality socio-economic development. While possessing a strong urban digital innovation foundation, the downstream’s growth rate ranks second with 10,921 annual grants during the study period, indicative of a transition from scale-driven growth to high-quality socio-economic development. has decelerated compared to midstream. Interestingly, cities in upstream lag behind in digital patent grants, suggesting a comparatively lower level of urban digital innovation development. This phenomenon can be attributed to less developed digital infrastructure, a less diversified industrial structure, and weaker agglomeration effects for innovation resources. However, with the implementation of supportive national policies, cities in upstream, such as Lanzhou, are beginning to show increased innovation vitality.

5.2. Analysis of Evolution Characteristics of Urban Digital Innovation Networks in the Yellow River Basin

To construct and analyze the structural system of the urban digital innovation networks in the Yellow River Basin for the years 2012, 2017, and 2022. Due to space constraints, these three years were selected at equal intervals to represent the starting point, midpoint, and endpoint of our study period, providing a representative temporal framework for capturing network evolution dynamics. This strategic sampling approach, while using discrete time points, enables effective analysis of structural transformations across the entire research timespan. Figure 4 illustrates the evolution of network strength between cities in the basin. Using ArcGIS 10.2 software, network strengths were categorized into five levels: weak, relatively weak, moderate, relatively strong, and strong, based on thresholds of 2000, 50,000, 100,000, and 200,000 patent collaborations. Weak association links were excluded from the visualization.
Temporally, the Yellow River Basin’s digital innovation networks exhibit significant changes across the study years, evolving from localized to comprehensive, simple to complex, and weak to strong associations. The number of cities with strong digital innovation links increased from 2 in 2012 to 4 in 2017 and 14 in 2022. Similarly, relatively strong connections grew from 6 in 2012 to 8 in 2017 and 10 in 2022. This network densification reflects enhanced resource allocation efficiency and innovation diffusion mechanisms crucial for urban sustainability. The shift from isolated city operations to interconnected innovation ecosystems facilitates optimal distribution of digital innovation resources, reduces development redundancy, and promotes collaborative problem-solving approaches to urban challenges. Improved transportation networks and increased personnel exchanges have catalyzed knowledge spillovers that enable smaller cities to access advanced digital solutions, fostering inclusive and balanced regional development essential for long-term sustainability.
Spatially, the urban digital innovation networks display a pattern of higher density in the east and lower density in the west, with greater concentration in the downstream areas compared to the vast upstream regions. In 2012, the network primarily consisted of weak connections, mainly covering cities in northern Henan and Shandong provinces in downstream of the river. By 2017, more core node cities emerged, with provincial capitals like Taiyuan, Xi’an, Zhengzhou, and Jinan showing stronger innovation links with surrounding cities. This hierarchical organization promotes sustainable urbanization by enabling efficient knowledge transfer from advanced centers to developing areas, reducing the need for each city to independently develop costly innovation infrastructure.
By 2022, the network had expanded to encompass multiple urban clusters including Shandong, Central Plains, Guanzhong Plain, and central Shanxi, indicating strengthening spatial spillover effects that support coordinated regional development. However, the persistently low network density among upstream cities presents sustainability challenges. This spatial imbalance constrains the region’s ability to achieve integrated sustainable development goals, as upstream areas—often characterized by fragile ecosystems and resource-dependent economies—remain isolated from digital innovation flows that could facilitate green transformation and economic diversification. The uneven network distribution highlights the urgent need for targeted policies to enhance innovation connectivity between upstream, midstream, and downstream regions, ensuring that digital innovation serves as a catalyst for comprehensive sustainable development across the entire Yellow River Basin.

5.2.1. Characteristics of Overall Network Structure

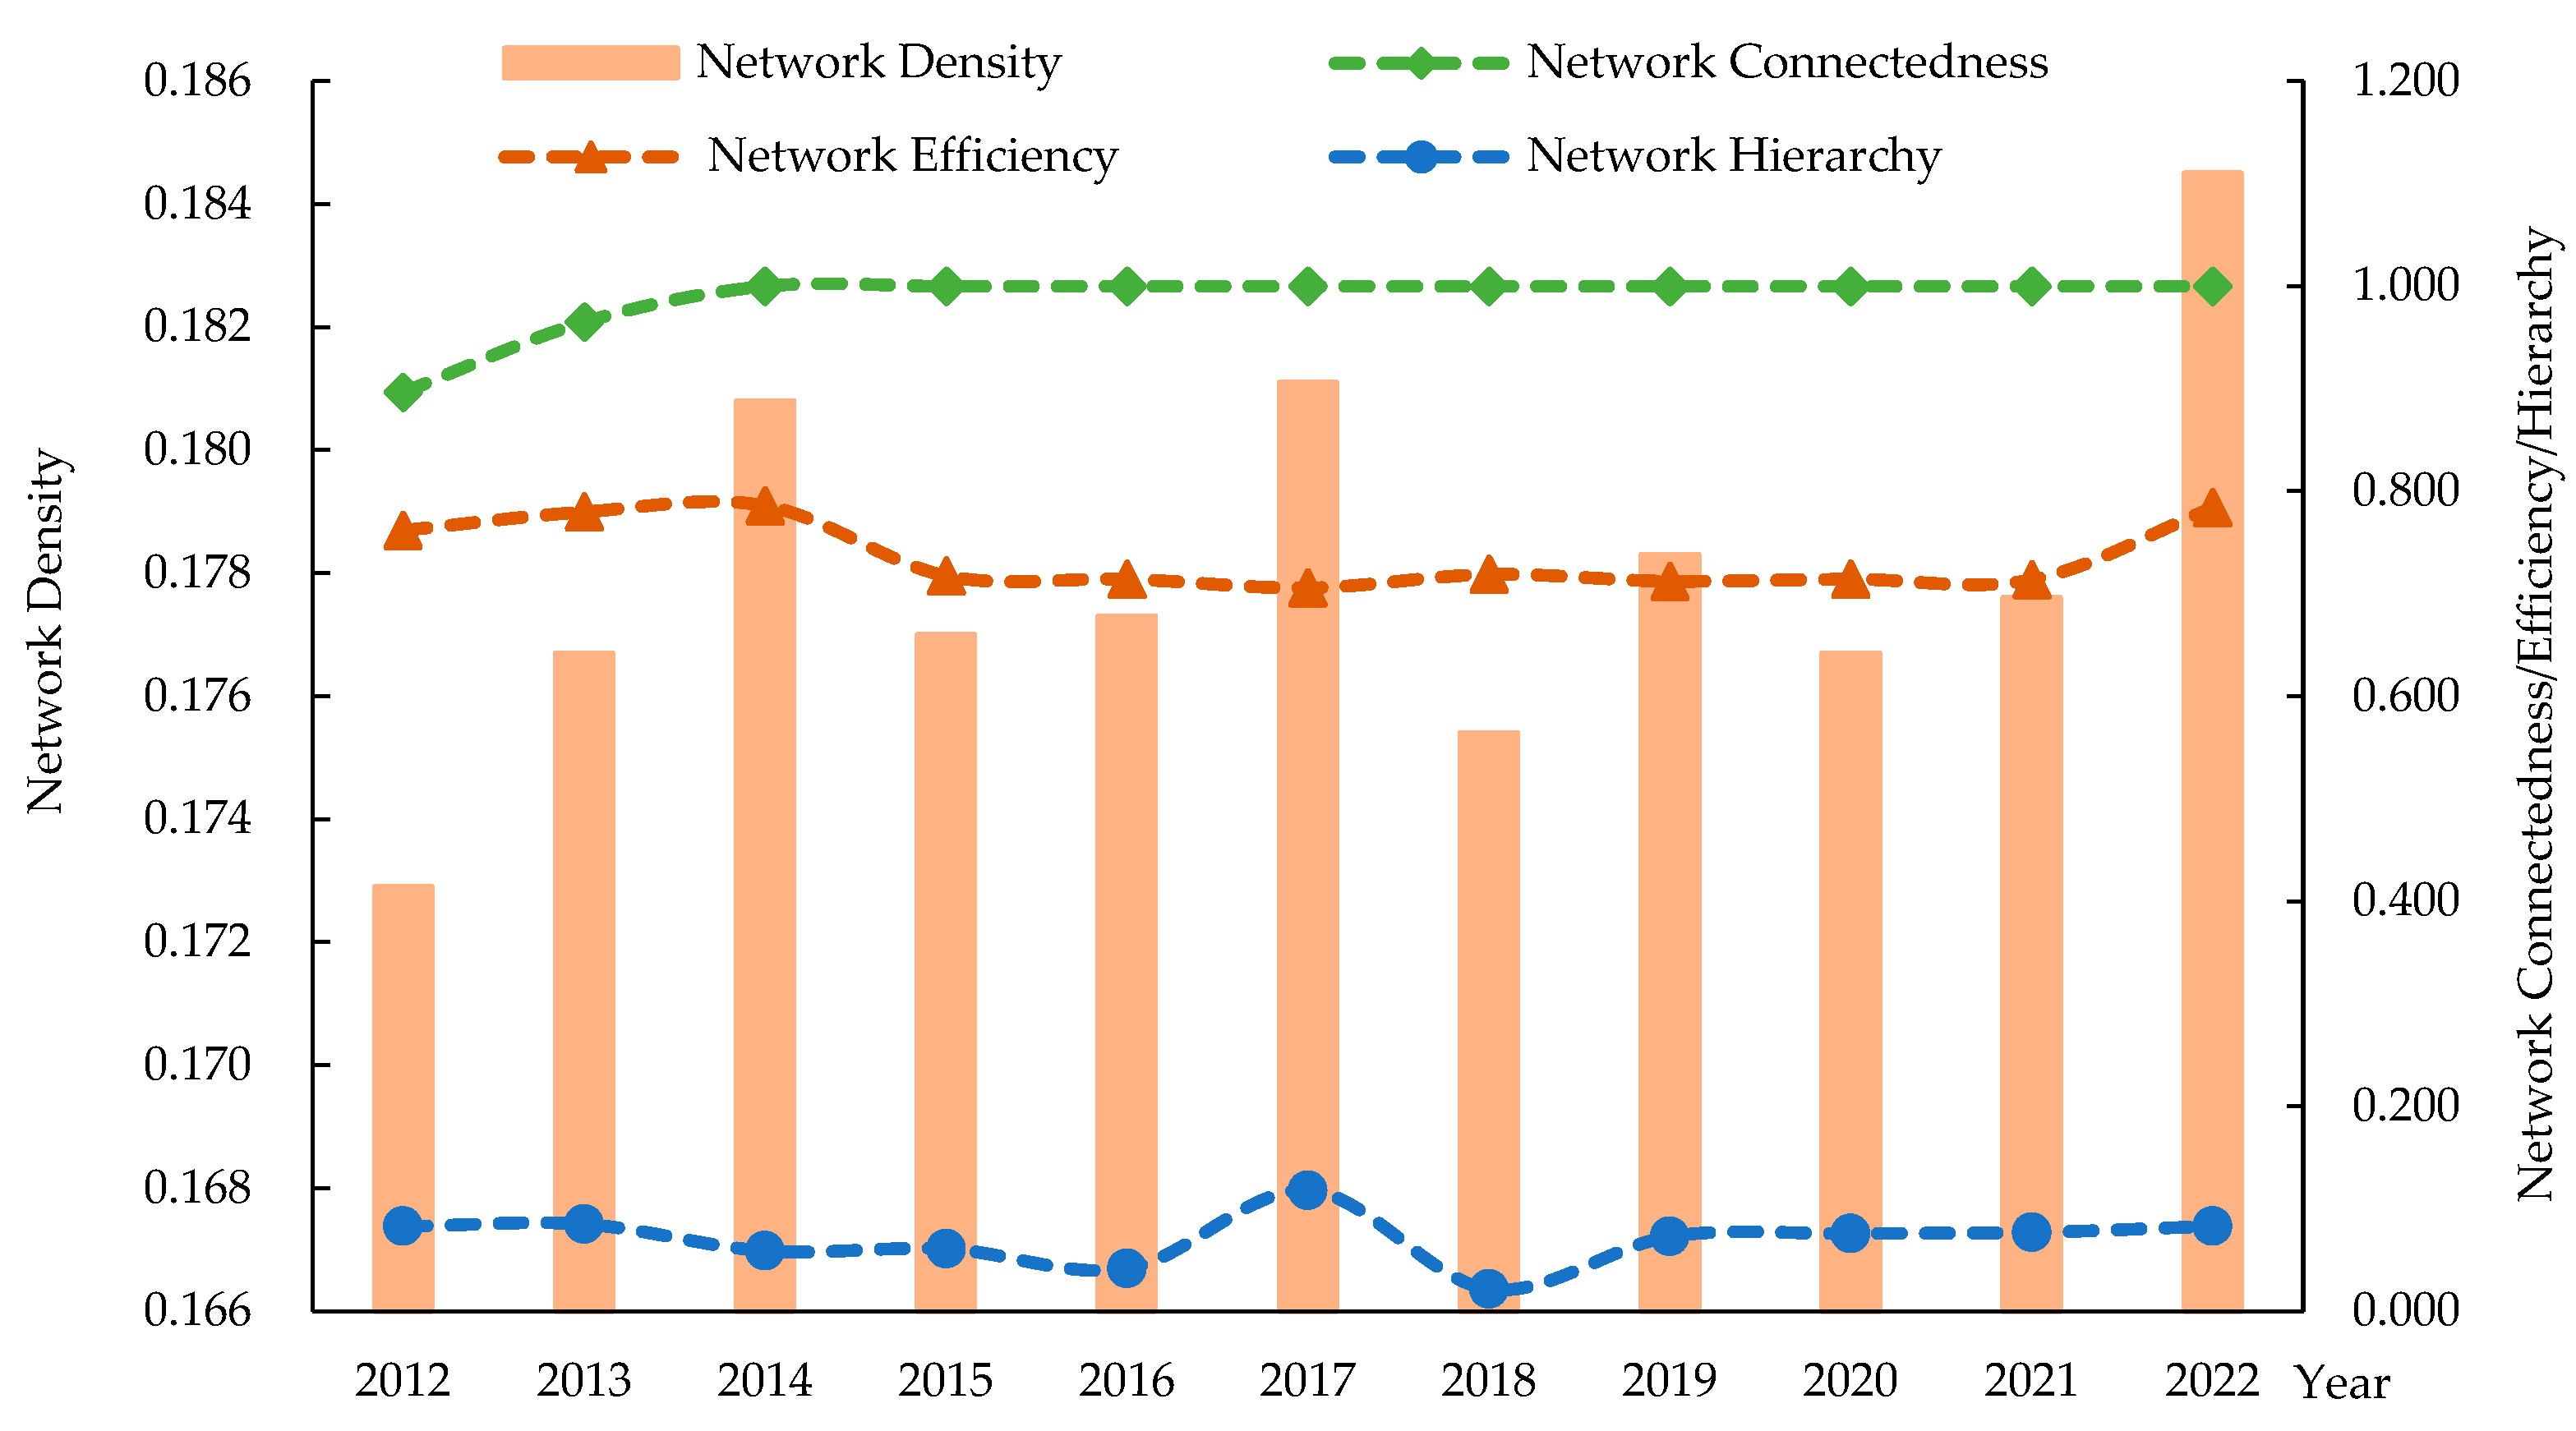
From 2012 to 2022, the overall network density of urban digital innovation in the Yellow River Basin exhibited a fluctuating upward trend, increasing from 0.1729 to 0.1845 (Figure 5). This density enhancement reflects the deepening integration of digital innovation ecosystems, which is fundamental for sustainable urban development through several mechanisms. Higher network density facilitates more efficient resource sharing, reduces innovation costs through economies of scale, and enables rapid diffusion of sustainable technologies across cities. The alignment with national strategic plans for ecological protection and high-quality development demonstrates how digital innovation networks serve as infrastructure for green transformation. However, the relatively low average network density of 0.1780 suggests substantial unrealized potential for sustainability gains. Low density constrains the system’s capacity for collective problem-solving on regional sustainability challenges, limits cross-city learning on best practices, and reduces resilience to economic or environmental shocks that require coordinated responses.
The network connectivity reaching a maximum value of 1.0 after 2013 represents a critical sustainability milestone, ensuring that innovation solutions developed in any city can theoretically reach all others through direct or indirect pathways. This complete accessibility is crucial for urban sustainability as it enables rapid propagation of environmental innovations, facilitates coordinated climate action strategies, and supports equitable access to digital solutions regardless of a city’s individual innovation capacity. Perfect connectivity ensures that smaller, resource-constrained cities can benefit from sustainability innovations developed in larger centers, promoting balanced regional development and preventing the marginalization of peripheral areas.
Network efficiency stability around 0.7371 indicates optimized information flow pathways with minimal redundancy, suggesting that the network structure supports sustainable resource utilization in innovation diffusion. This efficiency is particularly valuable for sustainability applications where rapid deployment of solutions—such as emergency response systems, environmental monitoring technologies, or resource management innovations—is critical. The absence of excessive redundancy prevents wasted resources while maintaining adequate connectivity for resilience.
The low network hierarchy (consistently below 0.10) reveals a relatively egalitarian innovation ecosystem where no single city dominates information flows. This decentralized structure supports sustainability through multiple pathways: it prevents over-dependence on individual nodes that could create system vulnerabilities, promotes diverse innovation approaches suited to different local contexts, and enables bottom-up sustainability initiatives to gain regional traction. However, extremely low hierarchy may also indicate insufficient leadership coordination for large-scale sustainability projects that require centralized planning and resource mobilization. The “W”-shaped hierarchical fluctuations suggest ongoing structural adjustments as the network seeks optimal balance between decentralized innovation and coordinated sustainability governance.

5.2.2. Characteristics of Individual Network Structure

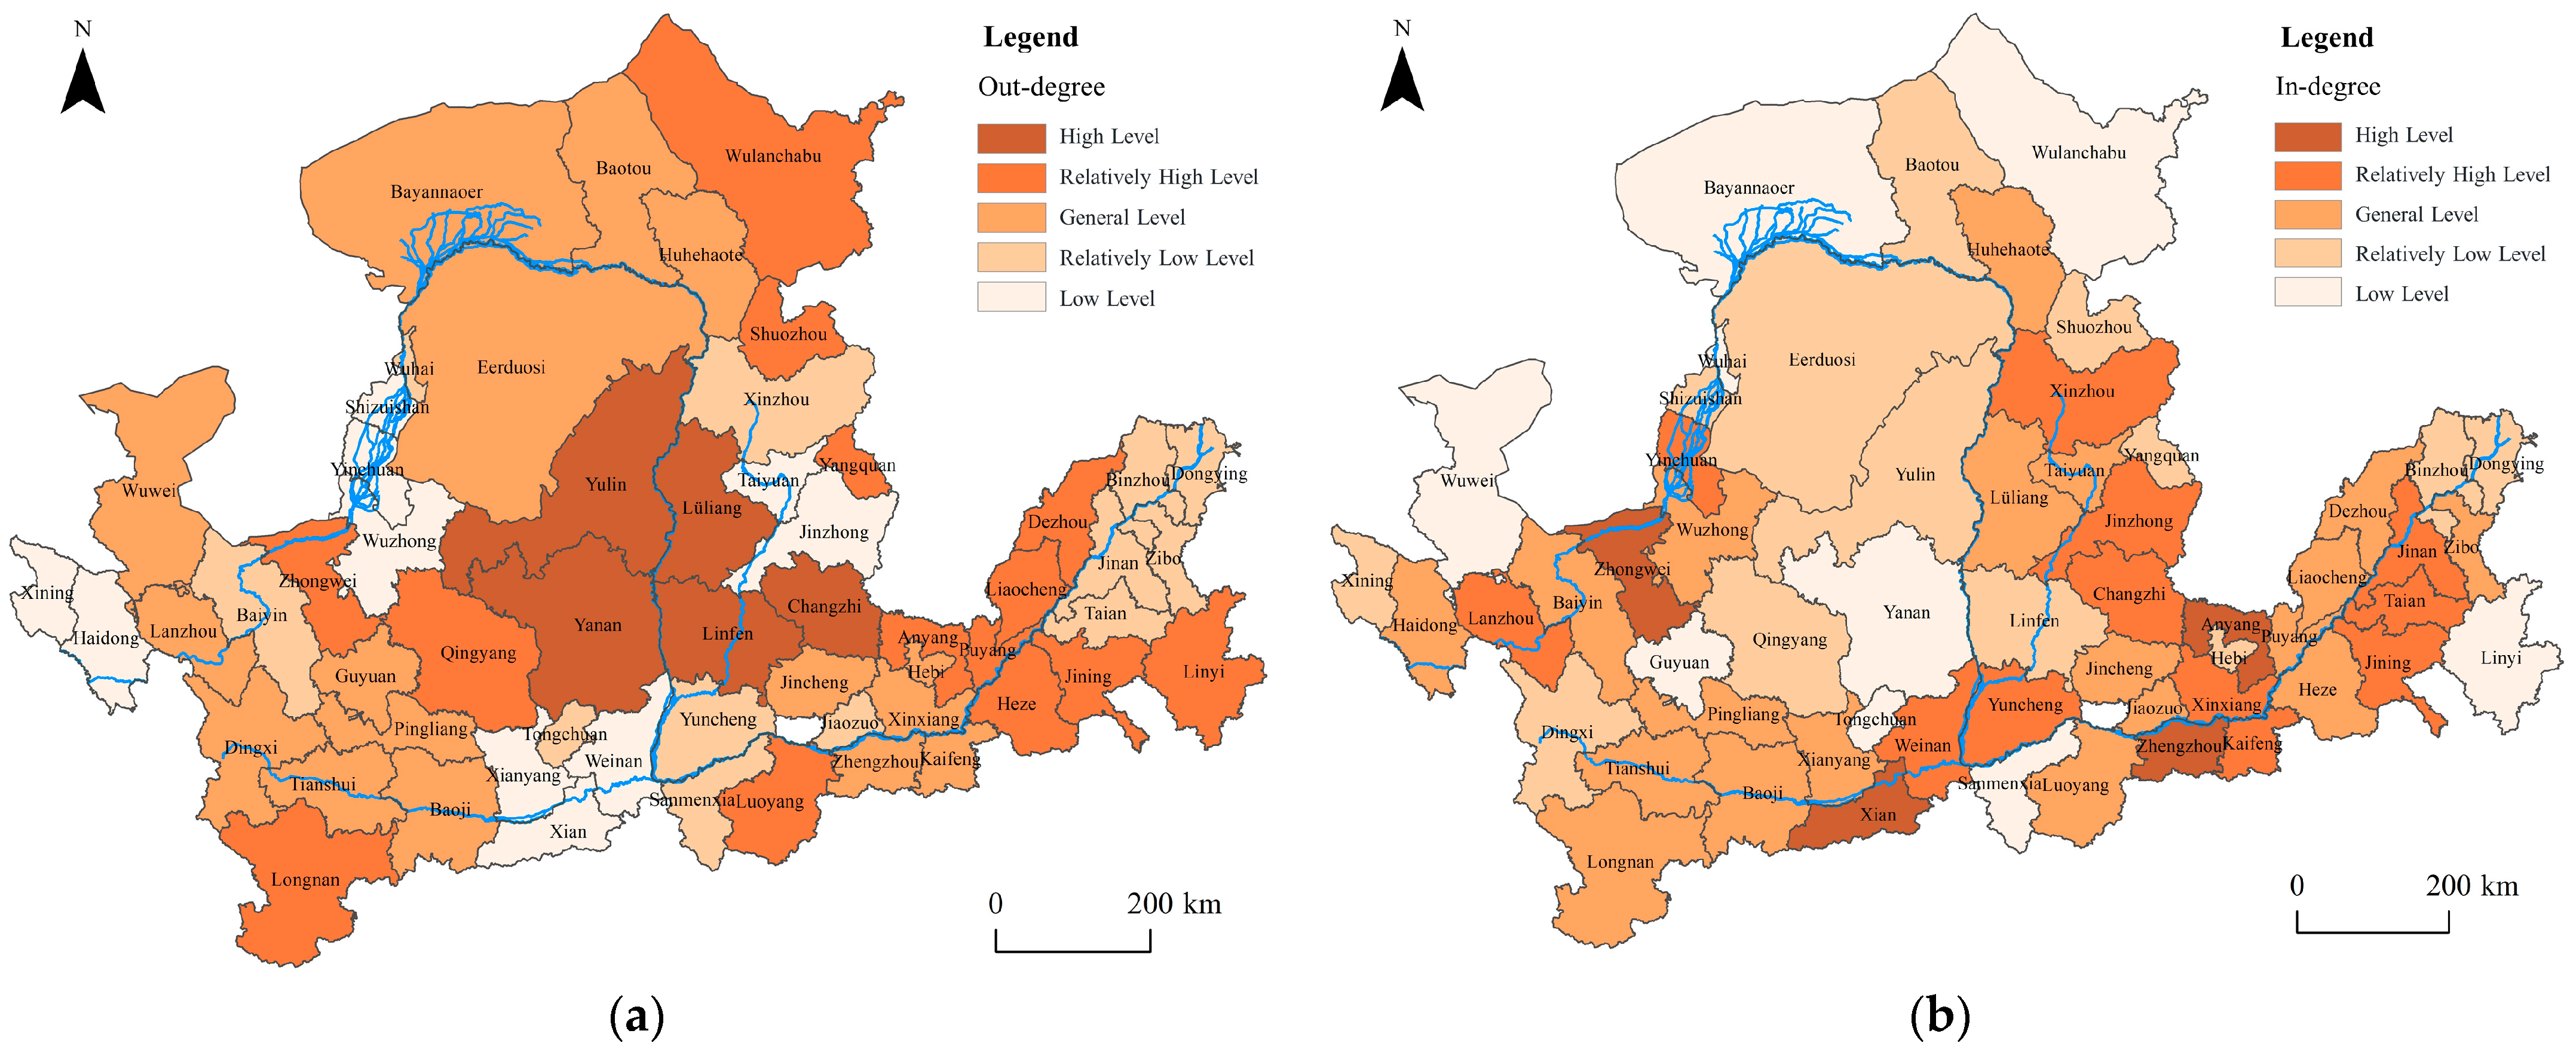
Centrality is a key focus in social network research, as cities in central positions are more likely to acquire resources and information, exerting stronger influence over other cities. This study analyzes the individual network characteristics of urban digital innovation networks in 57 cities within the Yellow River Basin by calculating their ‘average degree, betweenness, and closeness centrality’ from 2012 to 2022. As illustrated in Figure 6a, the mean degree centrality of the Yellow River Basin’s digital innovation networks during the study period was 28.5660, with 29 cities exceeding this average. Notably, cities such as Yan’an, Yulin, Lüliang, Linfen, and Changzhi exhibited high out-degree rankings. Despite initial challenges in digital economic development, these cities benefit from geographical proximity to more economically advanced urban centers like Taiyuan, Jinzhong, and Xi’an, facilitating technology spillovers and knowledge diffusion. Their high out-degree suggests a strong propensity for innovation and learning, as they seek to collaborate with neighboring developed cities to acquire advanced expertise for industrial upgrading and digital transformation.
Conversely, Figure 6b shows that cities with high in-degree rankings, including Lanzhou, Xi’an, Zhengzhou, Anyang, and Jinan, are predominantly regional hubs or provincial capitals within the Yellow River Basin, functioning as core nodes in the urban digital innovation networks. Their high in-degree indicates a significant capacity to attract innovation factors, capital, and talent within the regional digital innovation ecosystem. The empirical findings on degree centrality reveal a hierarchical centrality pattern of urban digital innovation in the Yellow River Basin, characterized by central innovation hubs extending their influence through industrial, innovation, and value chains to stimulate the development of surrounding cities. This structure underscores the importance of these central nodes in driving regional digital innovation and sustainable development across the Yellow River Basin.
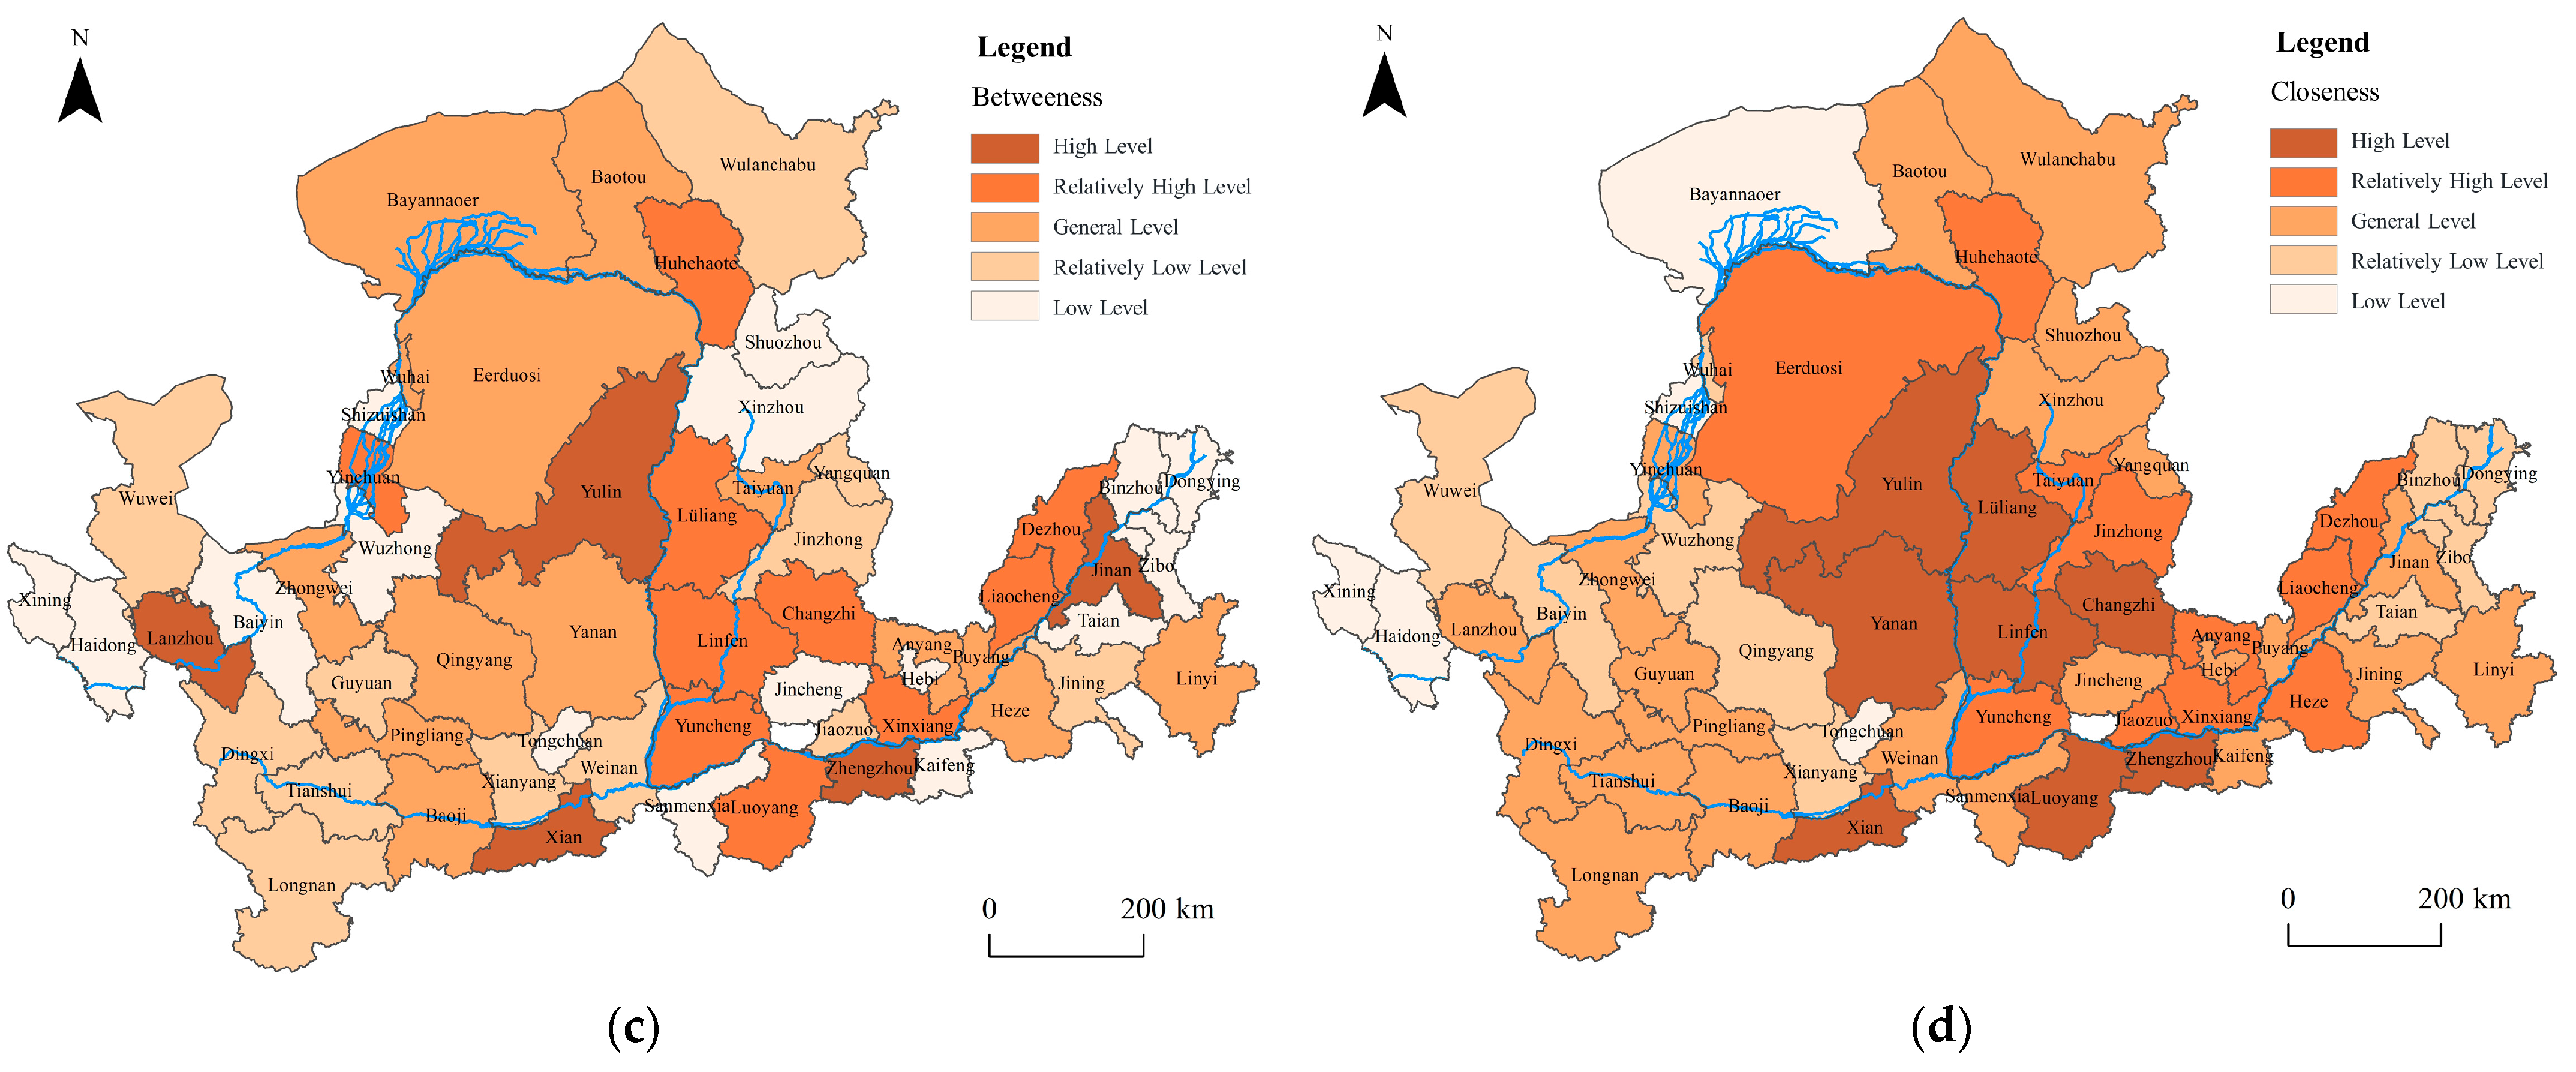
Figure 6c illustrates the betweenness centrality rankings in the digital innovation networks of the Yellow River Basin. The top five cities—Xi’an, Yulin, Zhengzhou, Jinan, and Lanzhou—serve as critical nodes connecting upstream, midstream, and downstream. These urban centers not only function as economic hubs for their respective provinces but also facilitate knowledge flow and diffusion of digital innovation factors across the Yellow River Basin. Their strategic positions enable them to stimulate innovation among digital economy entities, coordinate cross-regional cooperation, and optimize innovation resource allocation. In contrast, cities in upstream and midstream, such as Sanmenxia, Xining, Shizuishan, and Tongchuan, exhibit lower betweenness centrality values (consistently below 0.20) during the study period. These cities, characterized by slower economic development and limited capacity to attract innovation factors, occupy peripheral positions in the Yellow River Basin’s digital innovation networks. This disparity in betweenness centrality underscores the historical accumulation and path dependence of urban digital innovation development across the Yellow River Basin, highlighting the urgency for enhanced collaboration and balanced growth in the region’s digital economy.
The closeness centrality analysis, presented in Figure 6d, reveals a spatial concentration of high-centrality cities within the crescent-shaped urban agglomeration of the Yellow River Basin and along the economically developed midstream and downstream. This distribution pattern aligns with the degree centrality results, further evidencing the spatial agglomeration of urban digital innovation resources and factors in the Yellow River Basin. The observed core-periphery structure of the digital innovation networks not only enhances overall regional innovation efficiency but also fosters conditions conducive to cross-regional collaborative development. Notably, the closeness centrality values are relatively concentrated, ranging between 40% and 60% of the standardized scale. This distribution suggests that while disparities in urban digital innovation capabilities exist among cities, they have not resulted in insurmountable gaps, presenting opportunities for promoting balanced regional development and constructing a collaborative innovation ecosystem across the Yellow River Basin in the future.

5.3. Analysis of Driving Mechanisms of Urban Digital Innovation Networks in the Yellow River Basin

5.3.1. Model Construction and Driving Factors

The analysis above reveals that urban digital innovation in the Yellow River Basin exhibits characteristics of spatial correlation and network evolution. To develop targeted and scientifically sound collaborative strategies for urban digital innovation across Yellow River Basin cities, it is essential to investigate the driving mechanisms underlying the Yellow River Basin’s digital innovation networks. Given that the correlation matrix of the urban digital innovation networks comprises relational data, which challenges the assumption of variable independence in conventional regression analysis, the variables selected for examining the network’s driving mechanisms should also be relational indicators.
The QAP offers a robust approach for analyzing such relational data. While Multiple Regression Quadratic Assignment Procedure (MRQAP) offers advantages for examining multiple explanatory variables simultaneously and provides more sophisticated control for autocorrelation effects, QAP is specifically suited for this study’s analytical objectives. QAP excels at testing the correlation between network matrices while accounting for the non-independence inherent in network data through permutation-based significance testing. Unlike MRQAP, which assumes linear relationships between multiple predictors, QAP allows for more flexible examination of individual factor influences without imposing restrictive parametric assumptions about variable interactions [54]. Consequently, this study employs the QAP method to systematically investigate the driving mechanisms of the Yellow River Basin’s urban digital innovation networks evolution.
The theoretical analysis indicates that the formation and development of urban digital innovation networks are influenced by multiple factors, including geographical proximity, factor mobility, market mechanisms, industrial foundations, and government intervention [35]. Based on these considerations, this study constructs a driving mechanism model for the urban digital innovation networks using the following indicators:
(1)
Geographical proximity (Dist): Measured by the straight-line distance matrix between Yellow River Basin cities.
(2)
Factor mobility [55]: Encompassing differences in innovation, talent, and financial factors. (a) Innovation factor difference (Inno): Represented by the inter-city patent grant difference matrix. (b) Talent factor difference (Lab): Represented by the inter-city difference matrix of employees in information transmission, computer services, and software industries. (c) Financial factor difference (Fin): Represented by the inter-city difference matrix of the ratio of year-end financial institution loan balance to GDP.
(3)
Market mechanism (Mark): Reflected in cities’ varying purchasing power for UDI factors, represented by the inter-city difference matrix of the ratio of total retail sales of consumer goods to GDP.
(4)
Industrial foundation (Ind): Represented by the inter-city difference matrix of digital economy development levels. This study employs an index system comprising: telecom business revenue; employment in information transmission and software industries; Internet broadband access users; mobile phone users; and inclusive finance index. These indicators are synthesized using the entropy method to measure urban digital economy development.
(5)
Government intervention (Gov): Reflected by the inter-city difference matrix of the ratio of science and technology expenditure to fiscal expenditure.
The QAP model is constructed to examine the driving mechanisms of the Yellow River Basin’s urban digital innovation networks evolution, as shown in Equation (10):
N t = f D i s t , I n n o , L a b , F i n , M a r k , I n d , G o v
In the above formula, Nt represents the spatial correlation matrix of urban digital innovation in Yellow River Basin cities in year t; Dist represents the inter-city geographical distance matrix computed through ArcGIS; Inno, Lab, Fin, Mark, Ind, and Gov denote the differential matrices of innovation factor, talent factor, financial factor, market mechanisms, industrial foundations, and governmental intervention, respectively, with relevant data mainly sourced from the “China City Statistical Yearbook”.

5.3.2. Multicollinearity Diagnostics and Model Specification Considerations

Before interpreting the QAP regression results, we conducted variance inflation factor (VIF) analysis to assess potential multicollinearity among explanatory variables and address concerns regarding model specification. As presented in Table 2, the VIF diagnostics reveal that multicollinearity is not a significant concern in our model specification. All variables exhibit VIF values well below the conventional threshold of 5.0, with the highest VIF observed for government intervention factors (2.03) and financial factors (1.96). The mean VIF of 1.50 indicates an acceptable level of multicollinearity across all variables, suggesting that the limited influence of certain variables—particularly human capital and government factors—reflects genuine empirical relationships rather than statistical artifacts arising from collinearity issues.
Additionally, we acknowledge that spatial autocorrelation in network data may potentially inflate significance levels in QAP analysis. However, QAP’s permutation-based testing procedure inherently accounts for much of the spatial dependence by preserving the network’s spatial structure during randomization, thereby providing more robust inference than conventional regression approaches for spatially embedded relational data.

5.3.3. Empirical Results of Driving Mechanisms

The analysis using the QAP method with six thousand random permutations examined the regression results between the correlation matrix of the Yellow River Basin’s urban digital innovation networks and various influencing factors. As shown in Table 3, the magnitude and direction of influence of the driving factors on the Yellow River Basin’s urban digital innovation networks remained relatively stable throughout the 2012–2022 study period. Notably, the regression coefficients for geographical proximity, market mechanism similarity, and industrial foundation convergence are negative. This implies that the urban digital innovation networks’ correlation between cities strengthens as the spatial distance decreases, market mechanisms become more similar, and regional economic development converges. These results highlight the spatial dependence, institutional isomorphism, and industrial synergy characteristics of digital economic development in the Yellow River Basin.
Geographical proximity theory posits that spatial closeness facilitates trust-building and reduces transaction costs, while institutional similarity reduces uncertainty and coordination barriers in inter-organizational collaboration [56]. Proximity between cities facilitates face-to-face interactions and collaborations related to urban digital innovation, reducing knowledge transfer costs and promoting inter-city innovation spillovers, ultimately reinforcing network connections. Furthermore, similarities in market mechanisms between cities contribute to reducing institutional transaction costs, fostering a favorable environment for cross-regional digital innovation cooperation. Less disparity in market mechanisms suggests greater consistency in business regulations, intellectual property protection, and innovation incentive structures, thus mitigating institutional barriers to urban digital innovation. In the context of the digital economy, similarities in industrial foundations and convergence in industrial structures between cities can lead to the development of common digital industry standards [57], application scenarios, and market demands, further catalyzing the formation and strengthening of urban digital innovation networks.
Conversely, the positive regression coefficients for innovation and financial factors indicate that inter-city differences in these dimensions contribute to the formation and strengthening of the urban digital innovation networks in the Yellow River Basin. This finding reflects the complex dynamics and complementary mechanisms of digital economic development in the region. In the digital economy landscape, cities often possess distinct advantages in specific digital technologies or application scenarios. This differentiation serves as a catalyst for regional cooperation and the formation of network structures in urban digital innovation. The complementarity of innovation factors not only optimizes resource allocation but also drives the integrated innovation of digital technologies, injecting new momentum into the Yellow River Basin’s digital economy development. The enhancement of regional financial development has reduced barriers in technology and information access for innovative entities, facilitating the flow of innovation factors. As disparities in financial factor flows expand, cities with more advanced science and technology financial systems in the Yellow River Basin can continuously influence the flow of digital factors, thereby strengthening spatial correlations in digital innovation between cities.
Interestingly, both talent factors and government intervention variables did not demonstrate statistical significance, suggesting that inter-city differences in technical talent and government intervention in the Yellow River Basin do not significantly impact the strengthening of its urban digital innovation networks. This finding can be explained by two factors. First, in the digital economy era, the mobility of high-quality talent is often unrestricted by geographical boundaries, potentially diminishing the influence of talent factor differences on the formation of urban digital innovation networks in the Yellow River Basin [58]. Second, market forces play a dominant role in regional digital economic development and urban digital innovation networks formation, while governments across various Yellow River Basin regions implement similar support policies in the digital economy sphere [59], resulting in minimal impact of differences in government support on innovation networks.

6. Conclusions and Discussions

6.1. Conclusions

This study systematically examines urban digital innovation networks in the Yellow River Basin through their theoretical foundations, evolutionary characteristics, and driving mechanisms. Based on urban digital patent data from 57 cities, the research constructed comprehensive innovation networks and analyzed their spatial structure and temporal dynamics using modified gravity models and QAP regression analysis. The main conclusions of this paper are presented below.
First, the Yellow River Basin demonstrated progressive advancement in urban digital innovation development throughout the study period, with substantial increases in digital patent grants post-2020 indicating robust regional resilience and adaptive capacity in the digital economy. The spatial distribution of digital innovation follows a distinct pattern of midstream > downstream > upstream regions, reflecting heterogeneous digital economic development and varying innovative capabilities across different basin areas. This geographical differentiation highlights the uneven but complementary nature of digital innovation capacity distribution within the basin.
Second, the urban digital innovation networks exhibit intensifying spatial linkages characterized by enhanced innovation factor flows and increasing network density without significant hierarchical stratification. The networks follow a hierarchical centrality pattern anchored by major innovation hubs including Xi’an, Zhengzhou, Jinan, and Lanzhou, which serve as focal points facilitating regional development through integrated industrial, innovation, and value chains. This polycentric structure demonstrates strong overall connectivity while maintaining balanced regional representation.
Third, the network formation mechanisms reveal significant causal complexity in driving urban digital innovation networks development. Spatial proximity, market mechanisms, and industrial foundation demonstrate negative correlations with network density, indicating that inter-city similarities in these dimensions facilitate innovation factor flows and network strengthening. However, variations in technical talent and government intervention across cities show no significant impact on network development, suggesting that certain factors may require threshold effects or complementary conditions to influence network formation effectively.

6.2. Research Contributions

This study advances the theoretical understanding and empirical analysis of urban digital innovation networks through three distinctive contributions that extend current knowledge and provide new insights into inter-urban innovation dynamics.
Firstly, we advance innovation network theory by developing a spatially embedded framework for understanding inter-urban digital innovation dynamics. While traditional network theory has predominantly examined innovation relationships within bounded geographical contexts [34,35], and digital innovation research has often treated technology as a spatial neutralizer [1,10], our study demonstrates that spatial factors remain fundamental to network formation even in the digital economy. By synthesizing spatial network theory with digital innovation systems, we theoretically establish that geographical proximity, institutional similarities, and regional economic convergence continue to shape inter-urban innovation linkages despite enhanced digital connectivity [37]. This theoretical integration addresses the artificial dichotomy between “place-based” and “space-of-flows” perspectives in innovation studies, providing a more nuanced understanding of how digital technologies reconfigure rather than eliminate spatial dependencies in innovation networks.
Secondly, we introduce a comprehensive spatiotemporal network analysis framework that captures both structural evolution and driving mechanisms of urban digital innovation networks. Existing studies have typically adopted static analytical approaches or examined network dynamics through discrete time snapshots, failing to capture the continuous evolutionary nature of digital innovation networks [36]. Our methodological contribution lies in integrating social network analysis with QAP regression techniques to simultaneously examine network topology, temporal dynamics, and causal mechanisms across multiple geographical scales [54,60]. This analytical framework not only reveals the hierarchical and clustered characteristics of inter-urban innovation networks but also identifies the differential impacts of geographical, economic, and institutional factors on network evolution, addressing methodological calls for more sophisticated approaches to studying complex innovation phenomena.
Thirdly, through comprehensive empirical analysis of the Yellow River Basin’s urban digital innovation networks, we provide novel insights into regional digital innovation patterns in emerging economies. Unlike previous studies that have predominantly focused on developed metropolitan regions or isolated city-level analyses, our investigation of this economically diverse and spatially extensive region reveals distinctive network formation patterns characterized by core-periphery structures, temporal clustering effects, and multi-dimensional driving mechanisms [41,43]. These empirical findings not only contribute to understanding digital innovation dynamics in transitional economic contexts but also generate evidence-based policy insights for fostering inter-regional innovation coordination and balanced digital development. The study’s focus on patent-based innovation networks further advances methodological discussions on measuring digital innovation activities and their spatial manifestations in policy-relevant contexts [42].

6.3. Practical Implications

First, understanding the spatiotemporal heterogeneity in urban digital innovation development across the Yellow River Basin is fundamental for promoting coordinated regional digital economic advancement. National initiatives, including the Digital China Strategy and the Yellow River Basin Ecological Protection and High-Quality Development Program, provide strategic opportunities for regional digital economic growth. The development of context-specific digital economy plans appears essential for different regions. Midstream cities need to prioritize digital industry chain integration and innovation capabilities to establish nationally competitive digital economic clusters [61]. Downstream cities can leverage their robust industrial foundation and market environment to accelerate digital transformation of traditional industries and foster emerging digital industry clusters. Upstream cities would benefit from emphasizing digital infrastructure enhancement and talent development to cultivate a conducive digital economy ecosystem.
Second, strengthening network effects in the Yellow River Basin’s Urban digital innovation networks is crucial for facilitating efficient inter-regional innovation flows. This can be achieved through two primary approaches: Maximizing the agglomeration and spillover effects of urban digital innovation hubs (Xi’an, Zhengzhou, Jinan, and Lanzhou) through strategic digital infrastructure investment and innovation resource concentration. Fostering inter-city urban digital innovation networks through institutionalized mechanisms, including integrated digital industrial parks, shared innovation platforms, and cross-regional innovation alliances. Furthermore, targeted policy interventions can nurture cities with distinctive competencies in specific digital domains, enhancing urban digital innovation networks’ resilience and diversity.
Finally, systematic interventions are essential to address the multiple drivers influencing the Yellow River Basin’s urban digital innovation networks. While convergence in spatial proximity, market mechanisms, and industrial foundations contribute to network density, it appears important to maintain regional distinctiveness. Innovation and financial factors can be leveraged through strategic investment in digital talent, research institutions, and innovation platforms. The development of a comprehensive financing system for urban digital innovation represents another crucial aspect. Additionally, promoting cross-sector integration and open innovation will facilitate the development of multi-stakeholder urban digital innovation, establishing a sustainable foundation for the Yellow River Basin’s digital economic development.

6.4. Research Limitations

Despite contributing to theoretical understanding and spatiotemporal analysis of urban digital innovation networks, this study has several limitations.
(1)
Data and Measurement Limitations: Although patent data serve as a representative metric for urban digital innovation assessment, they present methodological challenges including locational mismatches, commercialization gaps, and spatial deployment inconsistencies. Patents may not adequately capture the diverse characteristics of urban digital innovation in the evolving digital economy. Future research should triangulate patents with complementary innovation proxies such as startup density, venture capital flows, and digital platform launches, while expanding the measurement framework to include technological, managerial, and institutional innovation indicators.
(2)
Analytical Framework Constraints: Our analysis encompasses five driving dimensions but potentially overlooks significant factors including digital infrastructure disparities, socio-cultural similarities, multi-stakeholder collaboration mechanisms, and environmental sustainability dimensions. The study primarily focuses on government-led and enterprise-driven networks while underestimating the role of NGOs, research institutes, and private sector intermediaries. Additionally, the framework emphasizes economic structures while neglecting environmental impacts such as digital infrastructure carbon footprints and resource consumption. Future research should integrate sustainability indicators, multi-stakeholder network analysis, and comprehensive infrastructure metrics.
(3)
Generalizability Limitations: The findings are limited to the Yellow River Basin context, potentially restricting applicability to other major river basin economies such as the Yangtze River Delta and Pearl River Delta regions. Comparative analysis across different river basins with varying economic development levels, institutional frameworks, and innovation ecosystems would enhance the robustness and generalizability of our theoretical framework and empirical findings.

Author Contributions

Conceptualization, H.H.; Data curation, H.H.; Funding acquisition, H.H.; Methodology, X.Z.; Project administration, H.H.; Resources, X.Z.; Software, X.Z.; Supervision, H.H.; Validation, X.Z.; Visualization, X.Z.; Writing—original draft, X.Z.; Writing—review and editing, H.H. All authors have read and agreed to the published version of the manuscript.

Funding

This work was supported by the National Natural Science Foundation of China (72072144); Shaanxi Province Innovation Capacity Support Program Soft Science Research Plan projects (2024ZC-YBXM-031).

Data Availability Statement

This study does not report any data. The entire analysis was con-ducted using publicly available secondary data, and there is no data that is required to make available.

Conflicts of Interest

The authors declare no conflicts of interest.

References

  1. Yu, S.; Liu, D.; Gao, J. Can’t Have Your Cake and Eat It Too? The Impact of Digital Infrastructure Construction on Urban Ecological Welfare Performance—A Quasi-Natural Experiment Based on the “Broadband China” Strategy. Land 2024, 13, 2125. [Google Scholar] [CrossRef]
  2. Ciriello, R.F.; Richter, A.; Schwabe, G. Digital Innovation. Bus. Inf. Syst. Eng. 2018, 60, 563–569. [Google Scholar] [CrossRef]
  3. Chae, B. A General Framework for Studying the Evolution of the Digital Innovation Ecosystem: The Case of Big Data. Int. J. Inf. Manag. 2019, 45, 83–94. [Google Scholar] [CrossRef]
  4. Ge, C.; Lv, W.; Wang, J. The Impact of Digital Technology Innovation Network Embedding on Firms’ Innovation Performance: The Role of Knowledge Acquisition and Digital Transformation. Sustainability 2023, 15, 6938. [Google Scholar] [CrossRef]
  5. Zhou, C.; Zhang, X.H.; Zhang, Q.; Liu, B.H. Construction and Spatial Difference Research of “Five in One” Comprehensive Evaluation System in Yellow River Basin. J. Desert Res. 2021, 41, 1–11. [Google Scholar]
  6. Hao, J.; Zhang, Y.; Guo, L. Research on a Multidimensional Dynamic Environmental Assessment: Based on the PSR Analysis Framework and Bootstrap-DEA Model, in the Yellow River Basin, China. Land 2024, 13, 2063. [Google Scholar] [CrossRef]
  7. Wang, G.; Yuan, Q.; Jiao, Y. Impact of the Digital Economy on Low Carbon Sustainability Evidence from the Yellow River Basin. Front. Energy Res. 2024, 12, 1292904. [Google Scholar] [CrossRef]
  8. Yoo, Y.; Henfridsson, O.; Lyytinen, K. Research Commentary–The New Organizing Logic of Digital Innovation: An Agenda for Information Systems Research. Inf. Syst. Res. 2010, 21, 724–735. [Google Scholar] [CrossRef]
  9. Fichman, R.G.; Dos Santos, B.L.; Zheng, Z.E. Digital Innovation as a Fundamental and Powerful Concept in the Information Systems Curriculum. MIS Q. 2014, 38, 329–343. [Google Scholar] [CrossRef]
  10. Nambisan, S.; Lyytinen, K.; Majchrzak, A.; Song, M. Digital Innovation Management: Reinventing Innovation Management Research in a Digital World. MIS Q. 2017, 41, 223–238. [Google Scholar] [CrossRef]
  11. Autio, E.; Nambisan, S.; Thomas, L.D.W.; Wright, M. Digital Affordances, Spatial Affordances, and the Genesis of Entrepreneurial Ecosystems. Strateg. Entrep. J. 2018, 12, 72–95. [Google Scholar] [CrossRef]
  12. Vial, G. Understanding Digital Transformation: A Review and a Research Agenda. J. Strateg. Inf. Syst. 2019, 28, 118–144. [Google Scholar] [CrossRef]
  13. Popkova, E.G.; De Bernardi, P.; Tyurina, Y.G.; Sergi, B.S. A Theory of Digital Technology Advancement to Address the Grand Challenges of Sustainable Development. Technol. Soc. 2022, 68, 101831. [Google Scholar] [CrossRef]
  14. Liu, Y.Q.; Han, J.M.; Wang, J.G.; Hua, L.L. Analysis on Patent Technology Distribution, Evolution and Cooperation Innovation Network of Artificial Intelligence. China Sci. Technol. Forum 2021, 37, 64–74. [Google Scholar]
  15. Liu, Y.W.; Ouyang, Y. Spatial-Temporal Characteristics and Dynamic Evolution of Innovation Efficiency of China’s New Generation Information Technology Industry. J. Hunan Univ. Soc. Sci. 2020, 34, 52–61. [Google Scholar]
  16. Paunov, C.; Guellec, D.; El-Mallakh, N.; Planes-Satorra, S.; Nüse, L. On the Concentration of Innovation in Top Cities in the Digital Age. In OECD Science, Technology and Industry Policy Papers; OECD Publishing: Paris, France, 2019; 48p. [Google Scholar]
  17. Chen, H.; Sun, Y.C.; Xiong, C.L. Resource Portfolio Configuration Logic for Improving Digital Government Construction Performance: A Dynamic QCA Analysis Based on Panel Data of 30 Key Cities in China. Urban Probl. 2024, 43, 15–26. [Google Scholar] [CrossRef]
  18. Putra, Z.D.W.; Van Der Knaap, W.G. Urban Innovation System and the Role of an Open Web-Based Platform: The Case of Amsterdam Smart City. J. Reg. City Plan. 2018, 29, 234. [Google Scholar] [CrossRef]
  19. Mi, C.M.; Lu, Y.; Wang, Y.J. Design and Research of Innovation Index under the Background of “Internet+”: Taking Jiangsu Province as an Example. Sci. Technol. Manag. Res. 2018, 38, 1–5. [Google Scholar]
  20. Huang, C.Q.; Zhang, J.; Xie, C.L. Research on Construction and Evaluation of Innovation Capability Development Index of China’s Internet Industry. J. Shantou Univ. Humanit. Soc. Sci. 2016, 32, 146–153. [Google Scholar]
  21. Wang, Z.; Tang, P. Substantive Digital Innovation or Symbolic Digital Innovation: Which Type of Digital Innovation Is More Conducive to Corporate ESG Performance? Int. Rev. Econ. Financ. 2024, 93, 1212–1228. [Google Scholar] [CrossRef]
  22. Huang, Q.; Xu, C.; Xue, X.; Zhu, H. Can Digital Innovation Improve Firm Performance: Evidence from Digital Patents of Chinese Listed Firms. Int. Rev. Financ. Anal. 2023, 89, 102810. [Google Scholar] [CrossRef]
  23. Huang, H.; Zhao, L. Does Digital Innovation Help Firms Navigate the COVID-19 Pandemic? Evidence from China. Emerg. Mark. Rev. 2024, 62, 101171. [Google Scholar] [CrossRef]
  24. Ralston, P.; Blackhurst, J. Industry 4.0 and Resilience in the Supply Chain: A Driver of Capability Enhancement or Capability Loss? Int. J. Prod. Res. 2020, 58, 5006–5019. [Google Scholar] [CrossRef]
  25. Ma, Z.; Xiao, H.; Li, J.; Chen, H.; Chen, W. Study on How the Digital Economy Affects Urban Carbon Emissions. Renew. Sustain. Energy Rev. 2025, 207, 114910. [Google Scholar] [CrossRef]
  26. Bai, D.; Li, M.; Wang, Y.; Mallek, S.; Shahzad, U. Impact Mechanisms and Spatial and Temporal Evolution of Digital Economy and Green Innovation: A Perspective Based on Regional Collaboration within Urban Agglomerations. Technol. Forecast. Soc. Change 2024, 207, 123613. [Google Scholar] [CrossRef]
  27. Pan, W.; Xie, T.; Wang, Z.; Ma, L. Digital Economy: An Innovation Driver for Total Factor Productivity. J. Bus. Res. 2022, 139, 303–311. [Google Scholar] [CrossRef]
  28. Hu, C.; Mao, J.; Tian, M.; Wei, Y.; Guo, L.; Wang, Z. Distance Matters: Investigating How Geographic Proximity to ENGOs Triggers Green Innovation of Heavy-Polluting Firms in China. J. Environ. Manag. 2021, 279, 111542. [Google Scholar] [CrossRef]
  29. Huang, Y.; Wang, Y. How Does High-Speed Railway Affect Green Innovation Efficiency? A Perspective of Innovation Factor Mobility. J. Clean. Prod. 2020, 265, 121623. [Google Scholar] [CrossRef]
  30. Yu, Y.; Cheng, L.; Zhang, D. How Does Market Competition Affect Enterprise Cooperative Innovation? The Moderating Role of Intellectual Property Protection and Government Subsidies. Technovation 2024, 137, 103102. [Google Scholar] [CrossRef]
  31. Xu, L.; Shu, H.; Lu, X.; Li, T. Regional Technological Innovation and Industrial Upgrading in China: An Analysis Using Interprovincial Panel Data from 2008 to 2020. Financ. Res. Lett. 2024, 66, 105621. [Google Scholar] [CrossRef]
  32. Sohag, K.; Urazbaeva, A.; Shams, S.M.R.; Mariev, O. Government Policy Innovation in Spurring Nascent Entrepreneurship during Pandemic. Eur. Manag. J. 2024; in press, corrected proof. [Google Scholar] [CrossRef]
  33. Zhou, C.; Liu, B.H.; Zhang, X.H.; Tian, J.; Zhou, L. Spatial Distribution Characteristics and Influencing Factors of Cultural Relics Protection Units in the Yellow River Basin. J. Desert Res. 2021, 41, 10–20. [Google Scholar]
  34. Nelson, R.E. Social Network Analysis as Intervention Tool: Examples From the Field. Group Organ. Stud. 1988, 13, 39–58. [Google Scholar] [CrossRef]
  35. Doreian, P.; Conti, N. Social Context, Spatial Structure and Social Network Structure. Soc. Netw. 2012, 34, 32–46. [Google Scholar] [CrossRef]
  36. Zhong, C.; Arisona, S.M.; Huang, X.; Batty, M.; Schmitt, G. Detecting the Dynamics of Urban Structure through Spatial Network Analysis. Int. J. Geogr. Inf. Sci. 2014, 28, 2178–2199. [Google Scholar] [CrossRef]
  37. Abramo, G.; D’Angelo, C.A.; Di Costa, F. Knowledge Spillovers: Does the Geographic Proximity Effect Decay over Time? A Discipline-Level Analysis, Accounting for Cognitive Proximity, with and without Self-Citations. J. Informetr. 2020, 14, 101072. [Google Scholar] [CrossRef]
  38. Scott, A.J. Industrial Organization and Location: Division of Labor, the Firm, and Spatial Process. Econ. Geogr. 1986, 62, 215. [Google Scholar] [CrossRef]
  39. Yue, L.; Lei, Y.Y. Spatial Association Network Construction and Evolution Factors of Green Water Resource Efficiency in the Yellow River Basin. J. Northwest Norm. Univ. Soc. Sci. 2022, 59, 62–74. [Google Scholar] [CrossRef]
  40. Zhang, M.D.; Weng, A.H. Spatial Association Network and Formation Mechanism of Urban Water Resources Utilization Efficiency in the Yangtze River Economic Belt. Acta Geogr. Sin. 2022, 77, 2353–2373. [Google Scholar]
  41. Zhao, T.; Zhang, Z.; Liang, S.K. Digital Economy, Entrepreneurial Activity and High-Quality Development—Empirical Evidence from Chinese Cities. Manag. World 2020, 36, 65–76. [Google Scholar] [CrossRef]
  42. Bai, Y.; Chou, L.; Zhang, W. Industrial Innovation Characteristics and Spatial Differentiation of Smart Grid Technology in China Based on Patent Mining. J. Energy Storage 2021, 43, 103289. [Google Scholar] [CrossRef]
  43. Li, Y.; Liu, C.L. Spatial-Temporal Evolution and Influencing Factors of Urban Digital Technology Innovation in China. Sci. Geogr. Sin. 2024, 44, 754–765. [Google Scholar] [CrossRef]
  44. Zheng, X.; Le, Y.; Chan, A.P.C.; Hu, Y.; Li, Y. Review of the Application of Social Network Analysis (SNA) in Construction Project Management Research. Int. J. Proj. Manag. 2016, 34, 1214–1225. [Google Scholar] [CrossRef]
  45. Liu, J.-B.; Liu, B.-R.; Lee, C.-C. Social Network Analysis of Regional Transport Carbon Emissions in China: Based on Motif Analysis and Exponential Random Graph Model. Sci. Total Environ. 2024, 954, 176183. [Google Scholar] [CrossRef]
  46. Bai, R.; Lin, B. An In-Depth Analysis of Green Innovation Efficiency: New Evidence Based on Club Convergence and Spatial Correlation Network. Energy Econ. 2024, 132, 107424. [Google Scholar] [CrossRef]
  47. Kim, A.C.H.; Newman, J.I.; Kwon, W. Developing Community Structure on the Sidelines: A Social Network Analysis of Youth Sport League Parents. Soc. Sci. J. 2020, 57, 178–194. [Google Scholar] [CrossRef]
  48. Bai, C.; Zhou, L.; Xia, M.; Feng, C. Analysis of the Spatial Association Network Structure of China’s Transportation Carbon Emissions and Its Driving Factors. J. Environ. Manag. 2020, 253, 109765. [Google Scholar] [CrossRef] [PubMed]
  49. Xu, J.; Guo, X.; Jiang, Y.C. Evaluation of China’s Regional Digital Innovation Capability and Research on Spatial Correlation and Differentiation. Soft Sci. 2022, 36, 49–58. [Google Scholar] [CrossRef]
  50. Liu, L.; Gu, T.; Wang, H. The Coupling Coordination between Digital Economy and Industrial Green High-Quality Development: Spatio-Temporal Characteristics, Differences and Convergence. Sustainability 2022, 14, 16260. [Google Scholar] [CrossRef]
  51. Luo, Q.; Wang, J. Digital Finance and Green Technology Innovation: A Dual Path Test Based on Market and Government. Financ. Res. Lett. 2024, 70, 106283. [Google Scholar] [CrossRef]
  52. Tao, F.; Zhu, P.; Qiu, C.Z.; Wang, X.R. Research on the Impact of Digital Technology Innovation on Enterprise Market Value. J. Quant. Tech. Econ. 2023, 40, 68–91. [Google Scholar] [CrossRef]
  53. Zhou, H.; Li, J.B. Characteristic Facts and Analysis of China’s Digital Economy Innovation Activities—Evidence from Patents. J. Jinan Univ. Philos. Soc. Sci. 2023, 45, 54–68. [Google Scholar]
  54. Zhang, J.; Luo, Y. Degree Centrality, Betweenness Centrality, and Closeness Centrality in Social Network. In Proceedings of the 2017 2nd International Conference on Modelling, Simulation and Applied Mathematics (MSAM2017), Bangkok, Thailand, 26–27 March 2017; Atlantis Press: Bangkok, Thailand, 2017. [Google Scholar]
  55. Wang, L.; Chen, L.; Li, Y. Digital Economy and Urban Low-Carbon Sustainable Development: The Role of Innovation Factor Mobility in China. Environ. Sci. Pollut. Res. 2022, 29, 48539–48557. [Google Scholar] [CrossRef]
  56. Boschma, R. Proximity and Innovation: A Critical Assessment. Reg. Stud. 2005, 39, 61–74. [Google Scholar] [CrossRef]
  57. Cooke, P. Regional Innovation Systems, Clusters, and the Knowledge Economy. Ind. Corp. Change 2001, 10, 945–974. [Google Scholar] [CrossRef]
  58. Florida, R.L. The Rise of the Creative Class: Revisited; Basic Books: New York, NY, USA, 2014. [Google Scholar]
  59. Binz, C.; Truffer, B. Global Innovation Systems—A Conceptual Framework for Innovation Dynamics in Transnational Contexts. Res. Policy 2017, 46, 1284–1298. [Google Scholar] [CrossRef]
  60. Gan, C.; Voda, M.; Wang, K.; Chen, L.; Ye, J. Spatial Network Structure of the Tourism Economy in Urban Agglomeration: A Social Network Analysis. J. Hosp. Tour. Manag. 2021, 47, 124–133. [Google Scholar] [CrossRef]
  61. Jiang, Z.R. Coupling Research on Digital Economy and New Quality Productive Forces in Cities in the Yellow River Basin. Areal Res. Dev. 2024, 43, 29–35. [Google Scholar]
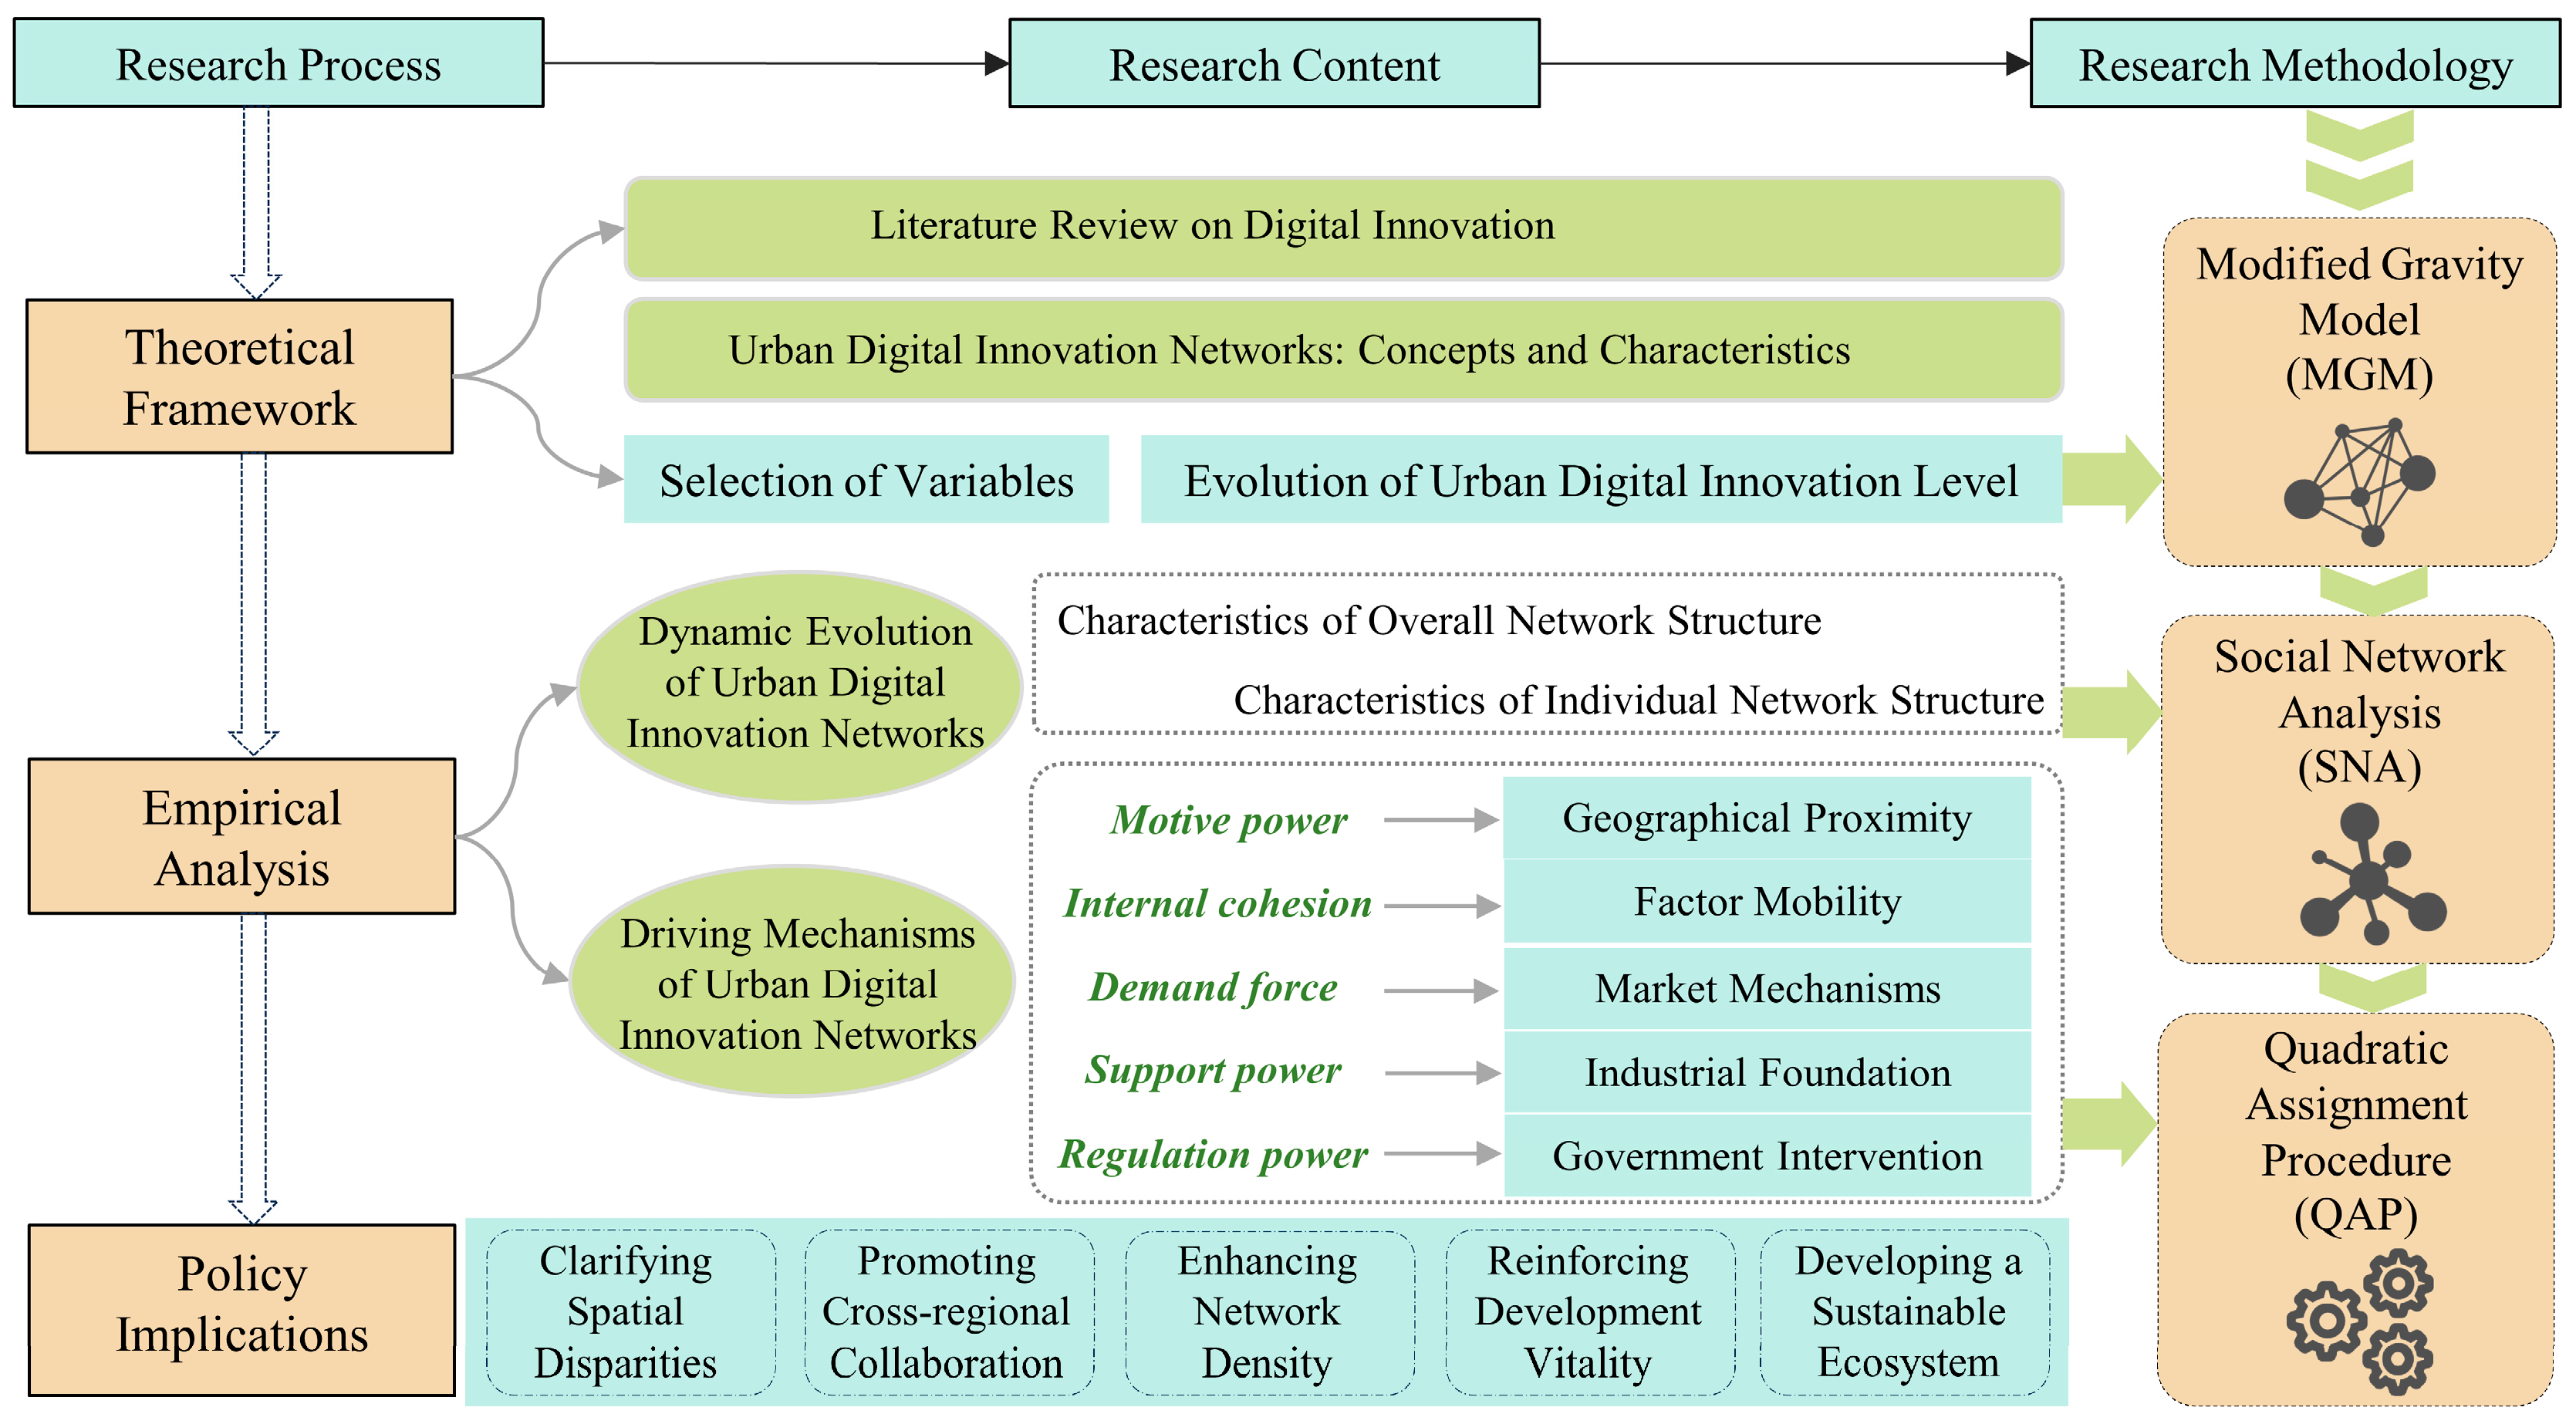
Figure 1. Technical Framework; source: Authors, 2025.
Buildings 15 03006 g001
Figure 2. Overview of the Study Area; source: Authors, 2025.
Buildings 15 03006 g002
Figure 3. Changes in Invention Patent Numbers of Core Digital Economy Industries in the Yellow River Basin; source: Authors, 2025.
Buildings 15 03006 g003
Figure 4. Spatial Characteristics of Urban Digital Innovation Networks in the Yellow River Basin for 2012, 2017 and 2022. (a) 2012. (b) 2017. (c) 2022; source: Authors, 2025.
Buildings 15 03006 g004
Figure 5. Evolution of Overall Network Structure in the Yellow River Basin from 2012 to 2022; source: Authors, 2025.
Buildings 15 03006 g005
Figure 6. Spatial Distribution Characteristics of Individual Network Structure in the Yellow River Basin. (a) Out-degree. (b) In-degree. (c) Betweeness. (d) Closeness; source: Authors, 2025.
Buildings 15 03006 g006aBuildings 15 03006 g006b
Table 1. Measurement and Description of Overall and Individual Network Characteristics of Urban Digital Innovation Networks.
IndicatorEquationDescription
overall
network
Network
density
D = l/[n(n − 1)](3)n: the number of cities; l: the total number of actual network connections.
Network
connectedness
C = 1 − v/[n(n − 1)/2](4)n: the number of cities; v: the number of unreachable city pairs.
Network
hierarchy
H = 1 − s/max(s)(5)s: the number of symmetrically reachable city pairs; max(s): the maximum possible number of symmetrically reachable pairs.
Network
efficiency
E = 1 − k/max(k)(6)k: the number of redundant connections; max(k): the maximum possible number of redundant connections.
individual
network
Degree
centrality
CRDi = (m1 + m2)/(2n − 2)(7)n: the number of cities; m1 and m2: the in-degree and out-degree of nodes.
Closeness
centrality
C A P i = j = 1 n d i j (8)dij: the shortest path distance between cities i and j.
Betweenness
centrality
C R B i = 2 j = 1 n k = 1 n b j k i N 2 3 N + 2 (9)n: the number of cities; bjk(i): the betweenness centrality of city i in controlling the connectivity between cities j and k.
Table 2. Variance Inflation Factor Results.
Influencing FactorsVIF1/VIF
Dist1.001.0000
Inno1.290.7740
Lab1.220.8217
Fin1.960.5106
Mark1.600.6240
Ind1.380.7221
Gov2.030.4937
Table 3. QAP Regression Results of Correlation Matrix of the Urban Digital Innovation Networks and Various Influencing Factors in the Yellow River Basin.
Influencing Factors201220142016201820202022
Dist−0.135 ***
(0.000)
−0.145 ***
(0.000)
−0.146 ***
(0.000)
−0.150 ***
(0.000)
−0.135 ***
(0.000)
−0.132 ***
(0.000)
Inno0.058 **
(0.016)
0.073 ***
(0.007)
0.0745 ***
(0.003)
0.079 ***
(0.000)
0.084 ***
(0.000)
0.083 ***
(0.000)
Lab0.006
(0.484)
0.006
(0.369)
0.007
(0.377)
0.014
(0.560)
0.011
(0.103)
0.009
(0.344)
Fin0.028 ***
(0.003)
0.020 *
(0.087)
0.017 **
(0.021)
0.022 **
(0.028)
0.030 ***
(0.007)
0.031 ***
(0.004)
Mark−0.012 **
(0.027)
−0.010 **
(0.038)
−0.008 **
(0.040)
−0.025 **
(0.014)
−0.006 **
((0.030)
−0.010 **
(0.017)
Ind0.006
(0.343)
0.019
(0.303)
0.011
(0.355)
0.014
(0.174)
0.006
(0.280)
0.008
(0.391)
Gov−0.017 **
(0.021)
−0.009 **
(0.032)
−0.016 *
(0.066)
−0.008 **
(0.044)
−0.019 **
(0.034)
−0.007 *
(0.077)
Random Number Seed319231923192319231923192
Number of Permutations600060006000600060006000
Note: The coefficients are standardized regression coefficients; values in parentheses indicate significance levels; ***, **, and * denote statistical significance at the 1%, 5%, and 10% levels, respectively.
Disclaimer/Publisher’s Note: The statements, opinions and data contained in all publications are solely those of the individual author(s) and contributor(s) and not of MDPI and/or the editor(s). MDPI and/or the editor(s) disclaim responsibility for any injury to people or property resulting from any ideas, methods, instructions or products referred to in the content.