


Abstract
People’s perceptions of architectural spaces are shaped by multiple senses, including vision and hearing. While vision has received extensive attention, hearing is often overlooked in architectural design, with a primary focus on sound insulation and noise reduction rather than on using acoustics to enhance spatial experience. Therefore, this study aims to investigate the impact of acoustic environments on two key spatial perceptions: Spaciousness and transparency. Two laboratory experiments were conducted with 60 participants. Thirty subjects evaluated 96 audiovisual stimuli for perceived spaciousness, and another 30 subjects assessed 128 audiovisual stimuli for perceived transparency. The results indicate that sound type significantly affects perceived spaciousness, while sound type and sound pressure level (SPL) significantly influence perceived transparency. Reverberation time (RT, T60) had no effect on either spatial perception. Interaction analysis further revealed that sound type affects transparency across different space sizes and window proportions, while SPL only influences small spaces and standard window proportions, with transparency decreasing as SPL increases. Mediation analysis showed that the effects of sound type on both spaciousness and transparency are partially mediated by subjective spatial perceptions, such as building environment preference and alignment with the outdoor environment. These findings emphasize the importance of integrating acoustic considerations into architectural design, which can enhance spatial experiences and provide valuable insights for future design practices.
1. Introduction
The acoustic environment is a crucial component of architectural design, with numerous studies highlighting its significant impact on users’ perceptions [1,2,3], emotions [4,5], recovery [6,7,8], and behavior [9,10]. Despite this importance, acoustics often receive less attention compared to other architectural elements such as form, materials, light, and color, which are extensively studied and considered fundamental to design. While architects like Holl [11] and Zumthor [12] have advocated for integrating acoustic considerations into architectural practice, other scholars have also conducted studies that measure both subjective and objective sound fields in specific spaces [13,14,15]. Practical applications frequently focus solely on noise reduction and sound insulation [16,17]. This narrow approach overlooks the potential of acoustic environments to actively shape and improve spatial perception. Consequently, the acoustic conditions in many existing buildings often contradict the original design intentions of architects, leading to suboptimal user experiences [18].
A significant reason for the neglect of acoustic environment design is the lack of research that integrates acoustic factors with spatial perception and architectural design [19]. Taking spaciousness and transparency as examples, extensive research has demonstrated that factors such as spatial size [20,21,22,23,24,25], window proportion [23,24,26], spatial content (arrangement of partitions and furniture) [22,27], spatial shape [20], wall material roughness [18], wall material texture direction [23], wall material type [28], and wall color [20,24] significantly influence perceived spaciousness. Similarly, window proportion [24,26], spatial size [24,26,29], room shape [29], and wall color [24] have been shown to impact perceived transparency. Additionally, it has been discovered that lighting intensity significantly affects both perceived spaciousness and transparency [21,22,23,24,26,30], while indoor temperature does not affect perceived spaciousness [24]. These findings provide valuable design guidance for architects. In contrast, although the acoustic environment holds the potential to influence the perception of architectural space, the process by which acoustic environment factors influence spatial perception remains underexplored.
Human spatial perception is typically influenced by both the physical characteristics of a space (e.g., size, shape, color) and its associative meanings (e.g., affinity, ecology, preference) [31]. Variations in physical attributes naturally evoke distinct user experiences [20,21,22,23,24,25,26,27,28,29,30]. For example, reverberation time is a key indicator of a space’s sound properties; larger spaces typically have longer reverberation times, while smaller spaces have shorter ones. These variations are likely to significantly influence the perception of spaciousness. Regarding associative meanings, extensive research has shown that human environmental perception arises from the integration of multiple senses, such as vision, hearing, and olfaction [32]. During the process of environmental perception, there is a bidirectional interaction between auditory and visual inputs [33]. Auditory perception interacts with other senses, modulating interest and focus of perception [34], and helping users form a more positive environmental perception [35]. This means that the sound environment naturally plays a role in shaping the associative meanings attributed to a space.
Furthermore, in the field of environmental psychology, scholars share the perspective that acoustic environments are essential and natural components of spatial perception. Allpton integrated design elements with human experiences and proposed the renowned prospect-refuge theory [36]. According to this theory, perceptions and aesthetics are holistic judgments of what is “conducive to survival,” grounded in experience, behavior, and strategic relationships. These perceptions arise from the psychological comfort provided by well-known design elements and are not confined to fixed forms, orders, or patterns [37]. As David and Mohsen articulated, materials, light, sound, and temperature form the “language of architecture.” Although these elements are often experienced subconsciously, they significantly influence observers’ spatial perceptions and should be holistically integrated into the architectural design process [38]. Stamp revealed that the shape of a space and the roughness of wall materials significantly impact perceived spaciousness. He argued that narrow spaces limit lateral movement and exclude escape routes, while uneven surfaces introduce limitations and uncertainties in perceived space, which can adversely affect feelings of safety and survival, thereby influencing judgments of spaciousness. This phenomenon cannot be attributed to any single physical form but results from a comprehensive cognitive process involving multiple elements [39].
The acoustic environment has the potential to influence spatial perception. However, spatial perception is multifaceted, with studies identifying at least 51 different aspects, such as uniqueness, complexity, coherence, and vividness, among others [40]. This study focuses on spaciousness and transparency as primary research subjects for two key reasons. Firstly, spaciousness and transparency are fundamental qualities in architectural design, often regarded by architects as primary concerns closely tied to architectural practice [41]. For example, the Chinese “Code for Design of Nursery and Kindergarten Buildings [42]” stipulates that the windowsill height in activity and multifunctional rooms should not exceed 0.60 m from the floor, ensuring visual openness and transparency suitable for the psychological and physiological needs of children. Secondly, spaciousness and transparency are significant predictive variables of spatial quality, profoundly affecting individuals’ spatial experiences and behaviors [43]. Research indicates that, except in specific activities or states (e.g., needing privacy or safety), people generally prefer relatively spacious and transparent spaces [44,45]. Overcrowded environments can evoke feelings of threat, stress, and aggression, and reduce work performance [46], while excessively enclosed spaces have been shown to prompt the decision to leave [47]. In contrast, larger spaces and higher ceilings provide a sense of freedom, facilitating more creative problem-solving ideas [48], and relatively open rooms are more likely to be considered aesthetically pleasing [44].
The purpose of this study is to explore how acoustic environments influence the perception of spaciousness and transparency in architectural spaces. Based on the objectives of the study, the following hypotheses are proposed:
(1) Sound type has a significant effect on perceived spaciousness and transparency in architectural spaces.
(2) Sound pressure level (SPL) and reverberation time (RT) will significantly affect perceived spaciousness and transparency.
(3) The interaction between acoustic and visual elements will affect perceived Spaciousness and Transparency.
This study aims to provide foundational evidence for architects to incorporate acoustic environment design techniques into their work, thereby promoting the broader application of acoustics in architectural practice.
2. Method
The core idea of this study is to orthogonally combine the primary factors of the acoustic environment with the key factors influencing perceived spaciousness and transparency identified in previous research, while also creating perceptual models to evaluate these perceptions. Relatively minor influencing factors from previous studies will be treated as control variables, enabling a more streamlined experimental approach and providing a deeper understanding of the core influences.
2.1. Experimental Stimuli
2.1.1. The Spaciousness Experiment
- Visual Stimuli
Previous studies have identified spatial size as the primary factor influencing perceived spaciousness [20]. Consequently, three different space sizes were selected for the experiment: Large, medium, and small. The large space measures 21 m × 14 m × 8 m, representing expansive areas like public lobbies and exhibition halls; the medium space measures 12 m × 8 m × 3.6 m, representing spaces such as conference rooms and offices; and the small space measures 5.4 m × 3.6 m × 2.8 m, representing compact areas like living rooms and bedrooms.
The presence of objects within a space (such as partition walls, furniture, and appliances) has been shown to significantly influence the perception of spaciousness [22,27]. In real environments, spatial content serves as a visual cue that aids users in judging spaciousness. Therefore, it is essential to consider whether the acoustic environment can still impact spaciousness perception when visual references are present. To address this, three realistic scenario spaces were designed to correspond to the large, medium, and small sizes: A public lobby, an office, and a living room. To ensure the accuracy of these visual references, the content in the real spaces was created according to average human body size guidelines [49].
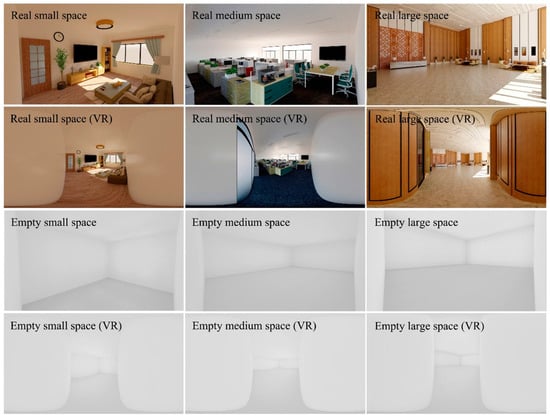
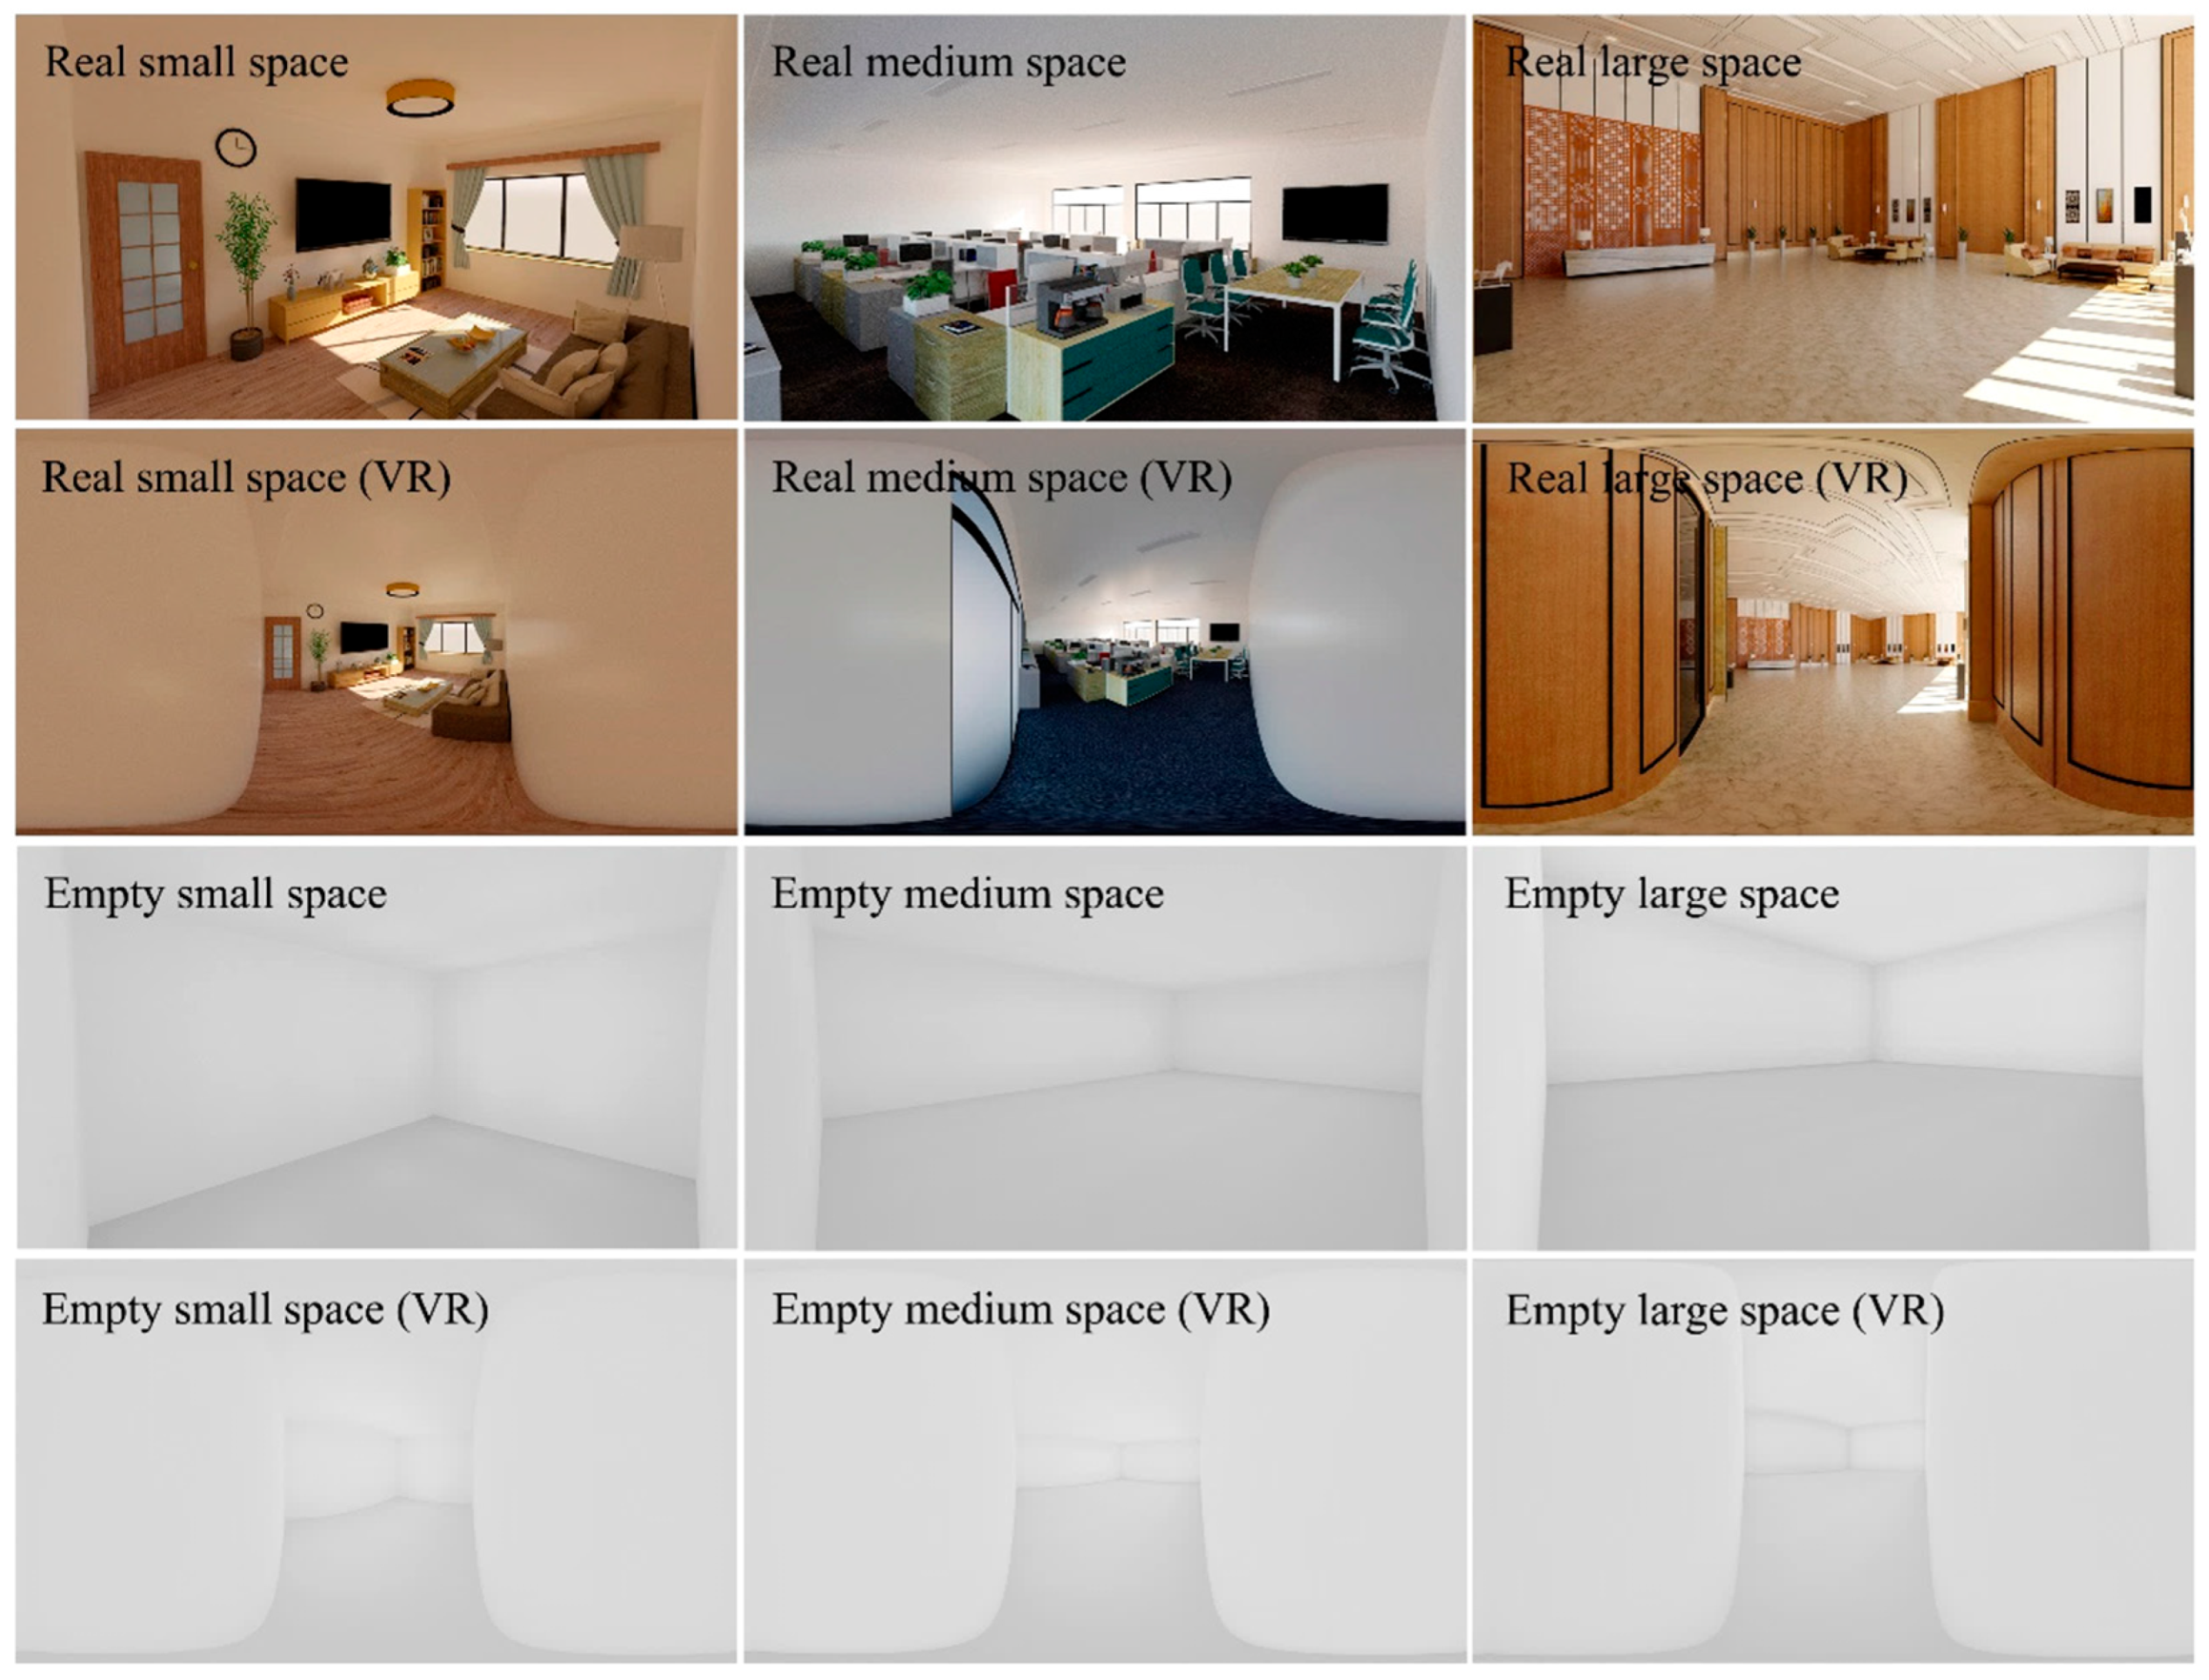
Relatively minor factors identified in previous studies were controlled in the experiment [17,18,19,20,21,27]. The aspect ratio was set to 3:2 (21 m × 14 m for the large space, 12 m × 8 m for the medium space, and 5.4 m × 3.6 m for the small space). Brightness was standardized using a luminance histogram [50], windows were opaque with no outdoor views, and the boundaries were smooth. Space renderings and virtual reality (VR) images were modeled and rendered using SketchUp and V-Ray for SketchUp. The viewpoint height was standardized at 1.6 m, with the viewing angle set at 60 degrees, which corresponds to the clear visual field range of human binocular vision and is commonly used in computer-generated visuals [51,52]. Observation points were positioned at the corners of the spaces to allow a full view in the VR devices. In summary, six visual conditions were created by combining the three space sizes with either real or empty rooms (Figure 1).
Figure 1.
Six visual stimulations and their VR images in the spaciousness experiment.
- Auditory Stimuli
In terms of auditory stimuli, sound type, sound pressure level (SPL), and reverberation time (RT) were selected as research indicators. Sound type is a fundamental element of the sound source and is crucial for acoustic environment research [53]. The selected sound types need to be common in architectural spaces and exhibit distinct preferences in evaluations (preference levels were included in the questionnaire; see Section 2.4). Therefore, slow tempo music, fast tempo music, slow footsteps, and neutral crowd noise were chosen as auditory stimuli. The slow tempo music used was from 32 to 52 s of *Canon in D* (Pachelbel’s Canon), while the fast tempo music was from 31 to 51 s of the first movement of *String Quartet No. 14—Death and the Maiden.* Both pieces were downloaded from an online sound database and processed with a 16-bit sampling depth and a 44,100 Hz sampling rate using Adobe Audition CC. Footsteps and crowd noise were generated by real people in the semi-anechoic chamber at Tianjin University, with the same sampling depth and rate as the music.
Reverberation time (RT) is a key acoustic indicator most closely related to the scale of the architectural space. By creating models of large, medium, and small spaces in Odeon Room Acoustics Software 14, setting the receiving points at the same location as the VR image observation points, and adjusting the sound absorption coefficients of surface materials, four types of sound were assigned long and short reverberation times, respectively. Based on common reverberation times for large, medium, and small spaces, as well as reasonable adjustment ranges using typical sound reflection materials (smooth tiles) and sound-absorbing materials (perforated panels with acoustic cotton), the reverberation times were set as follows: 1.5 s/0.5 s for the large space, 1.3 s/0.3 s for the medium space, and 1.0 s/0.1 s for the small space. All signals were created as binaural stimuli using Odeon Room Acoustics Software 14.
Sound pressure level (SPL) has been shown to significantly impact human perception [54]. In this study, based on ratings from eight participants in a pre-experiment, eight different sound conditions (four sound types combined with two reverberation times) were set at 60 dB(A) (relatively high but not noisy) and 40 dB(A) (relatively low but audible).
By combining four sound types, two reverberation times, and two sound pressure levels, overall, 16 auditory stimuli were generated. When combined with the six visual stimuli, 96 experimental audiovisual stimuli were produced.
2.1.2. The Transparency Experiment
- Visual Stimuli
Previous studies have identified spatial size and window proportions as the main factors influencing transparency [24,26,29]. For spatial size, two dimensions were selected: The large space was defined as 18 m × 12 m × 6 m, while the small space was defined as 7.5 m × 5 m × 3.3 m. For window proportions, based on common real-world conditions, both standard and full window proportions were selected. The standard window proportion included windows measuring 5.4 m × 2.0 m in the large space and 2.4 m × 1.5 m in the small space. The large space contained three windows, while the small space had two, with the windowsill height set at 0.9 m. The full window proportion design featured the long side of the space primarily composed of windows, with only a few columns and reverse beams. In addition, the outside view in the experiment was uniformly set to a cityscape that includes green areas, rivers, roads, and buildings.
Transparency is a more complex and multifaceted perception than spaciousness, placing greater emphasis on contextual factors [41]. The same acoustic environment can convey different feelings depending on the architectural function or arrangement. Considering the building’s function ensures the practicality of the research. Thus, the transparency experiment was designed with two distinct functions for each spatial size: The large space was designated as a public hall and a shop, while the small space was designated as an office and a dining room.
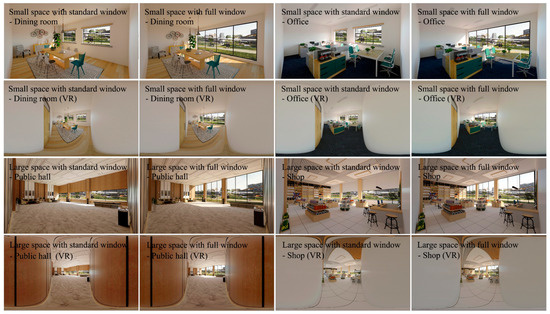
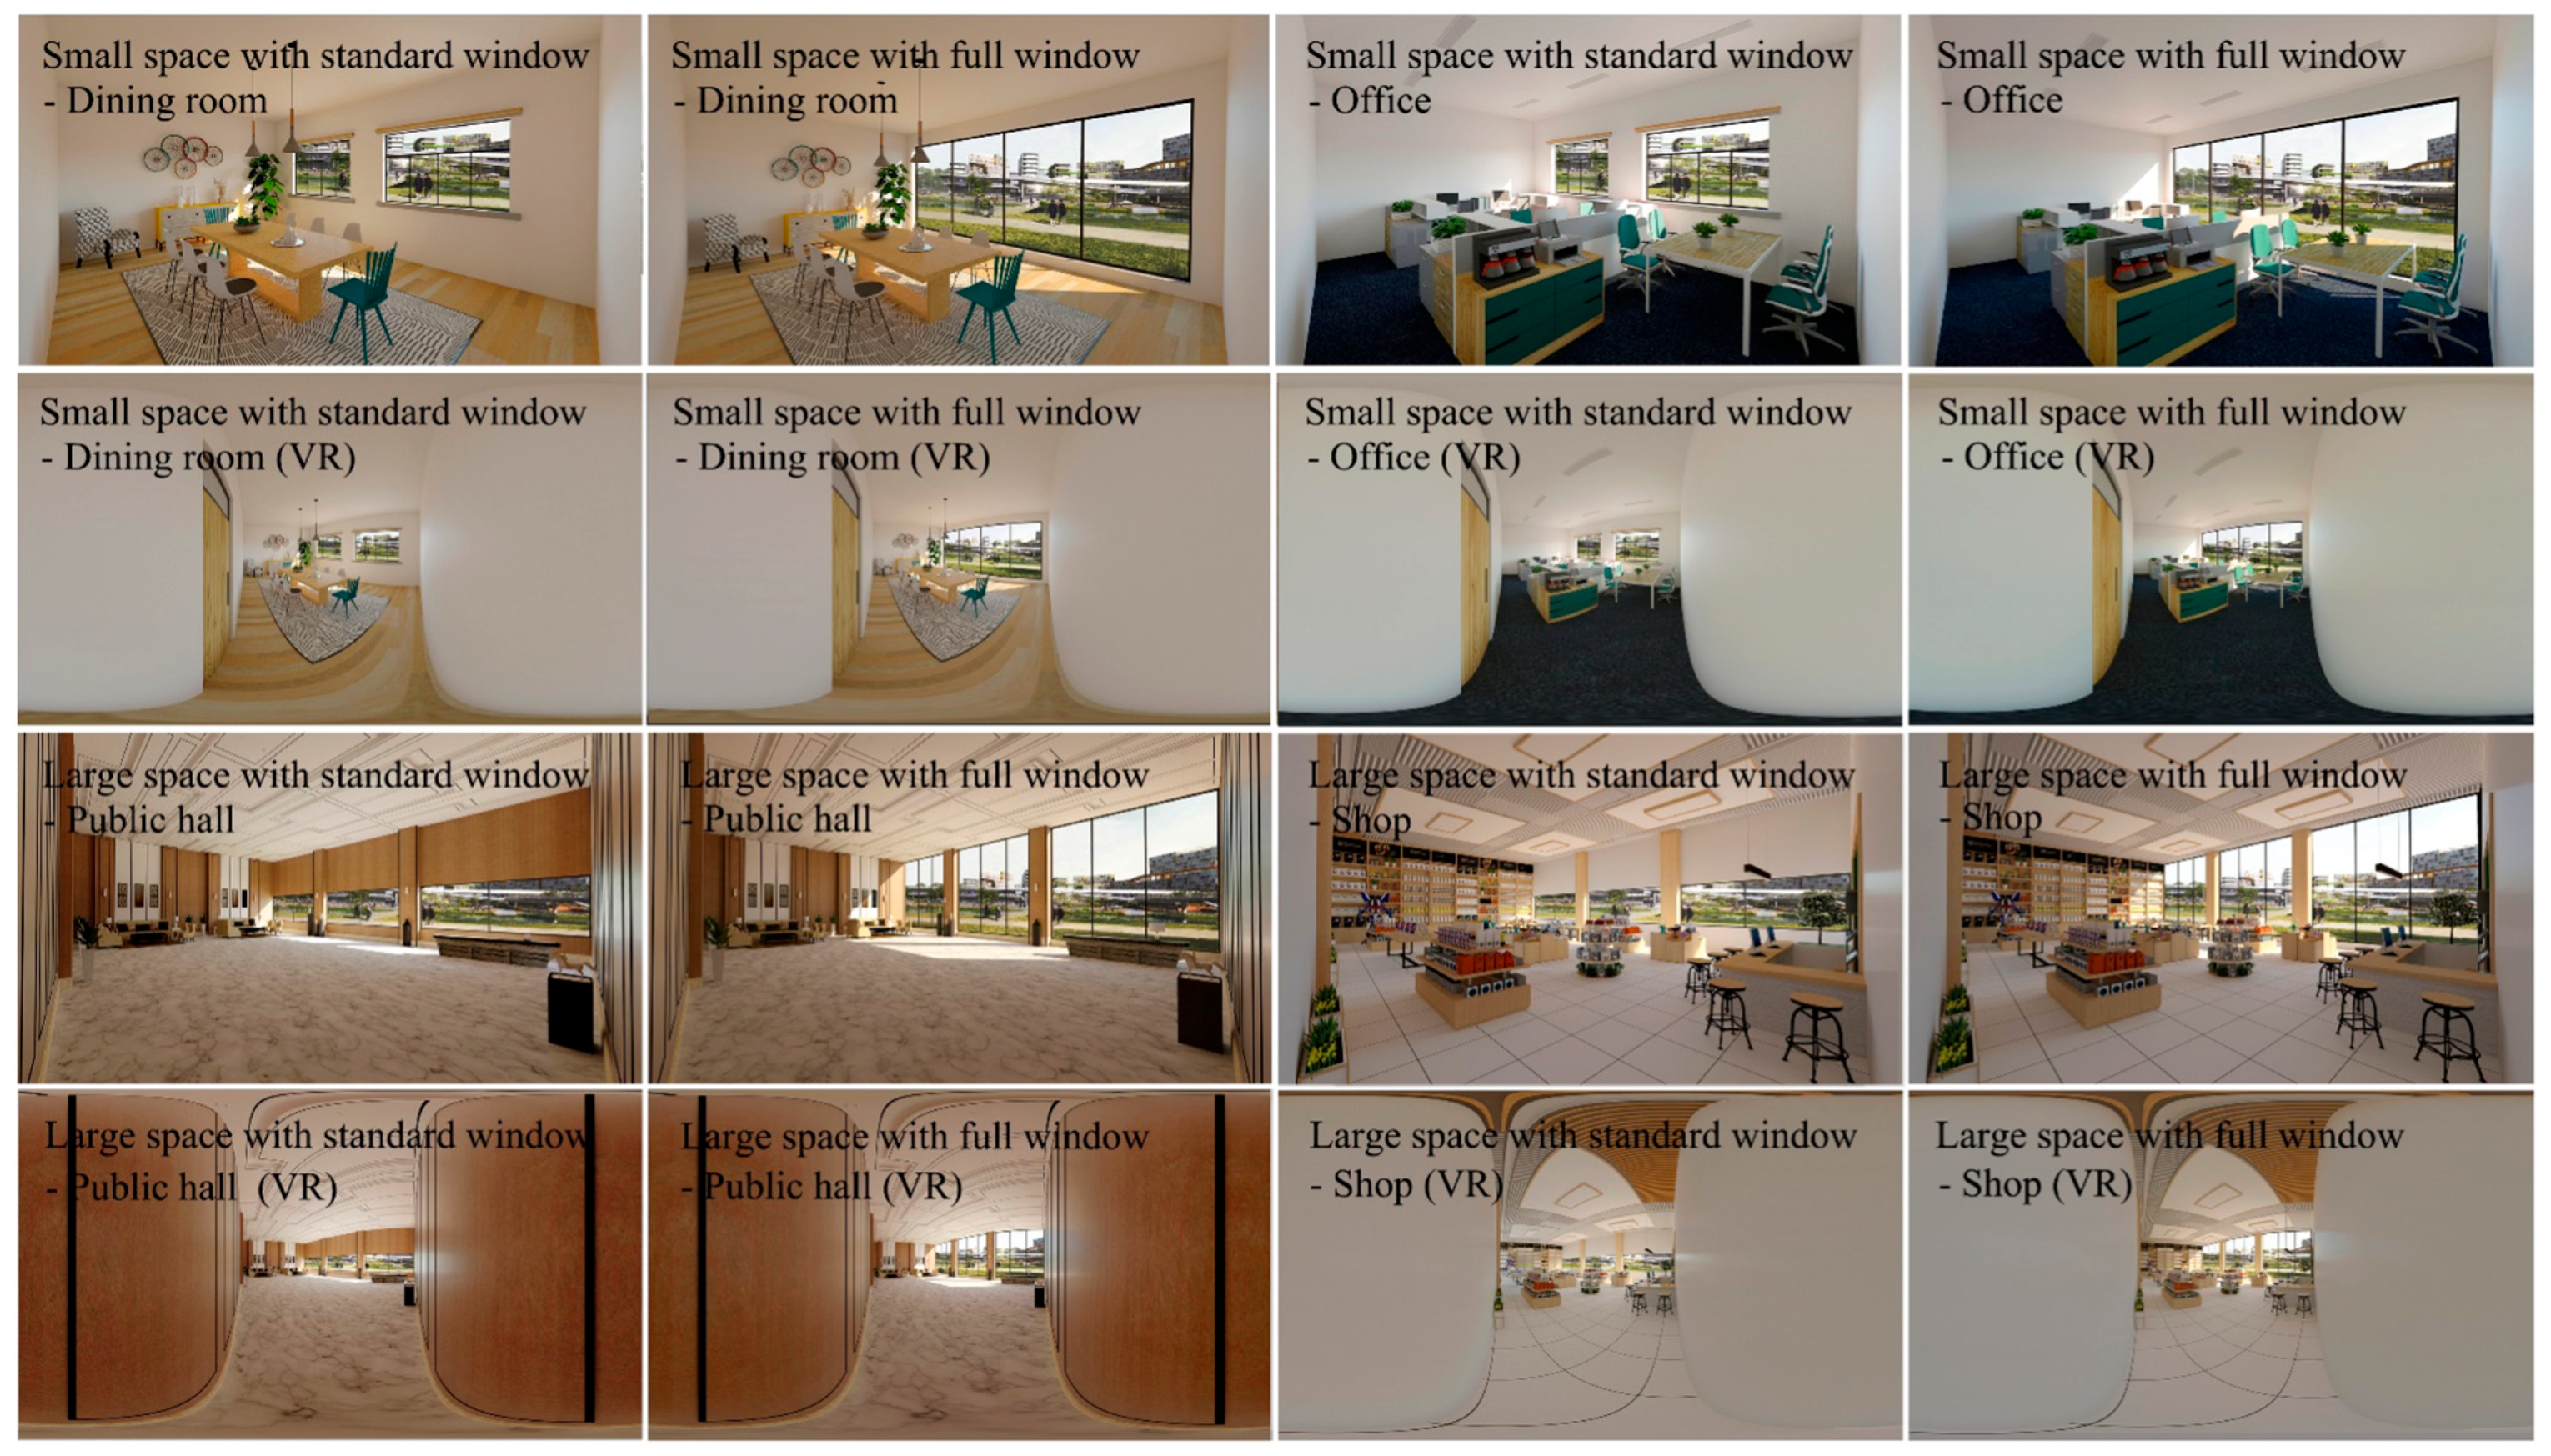
Additionally, factors previously considered minor were controlled [26,29]: The spatial aspect ratio was maintained at 3:2 (18 m:12 m for the large space and 7.5 m:5 m for the small space), brightness was standardized using a brightness histogram [50], windows were set as fully transparent, and the position of the windows relative to the observer was consistent. The visual stimuli for the transparency experiment were produced using SketchUp and V-Ray for SketchUp, with the same parameter settings as those in the spaciousness experiment. In summary, the transparency experiment included two spatial sizes, two window proportions, and two spatial functions, resulting in a total of eight visual stimuli (Figure 2).
Figure 2.
Eight visual stimuli used in the transparency experiment and their VR images.
- Auditory Stimuli
In the transparency experiment, sound type, sound pressure level (SPL), and reverberation time (RT) were selected as research indicators, similar to the spaciousness experiment. While the direct correlation between RT and perceived transparency is minimal, studies indicate that RT can influence the emotional quality of the acoustic environment, contributing to an ethereal and bright auditory experience [55], which may relate to the perception of transparency. Therefore, RT was retained as a factor in this experiment.
The questionnaire for the transparency experiment included a question about the degree of alignment between the architectural space’s acoustic environment and the outdoor environment (see Section 2.4). To increase this alignment, the sound types were adjusted, replacing fast-tempo music and crowd noise with water sounds and traffic noise, which are more congruent with outdoor scenes. The water sound was recorded at Tianjin Water Park, and the traffic noise was recorded on Tianjin Weijin Road, both using a 16-bit sampling depth and a 44,100 Hz sampling rate.
For RT and SPL, consistent with the method of spaciousness experiment, the reverberation times were set to 1.4 s/0.4 s for large spaces and 1.2 s/0.2 s for small spaces, while the sound pressure levels were set to 60 dB(A) and 40 dB(A). Overall, four sound types were combined with two reverberation times and two sound pressure levels, resulting in 16 auditory stimuli. By combining these 16 auditory stimuli with 8 visual stimuli, an overall 128 audiovisual experimental stimuli were created.
2.2. Participants
In the spaciousness experiment, 30 students participated (17 male and 13 female), with an average age of 22.3 years, in the transparency experiment, another group of 30 students participated (14 male and 16 female), with an average age of 23.7 years, thirty participants are generally considered a large sample in statistics [56]. All 60 participants were students from Tianjin University, representing various majors such as architecture, urban planning, chemical engineering, and material science. All participants self-reported having normal hearing and vision.
2.3. Experimental Design
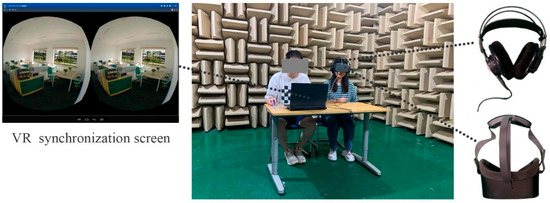
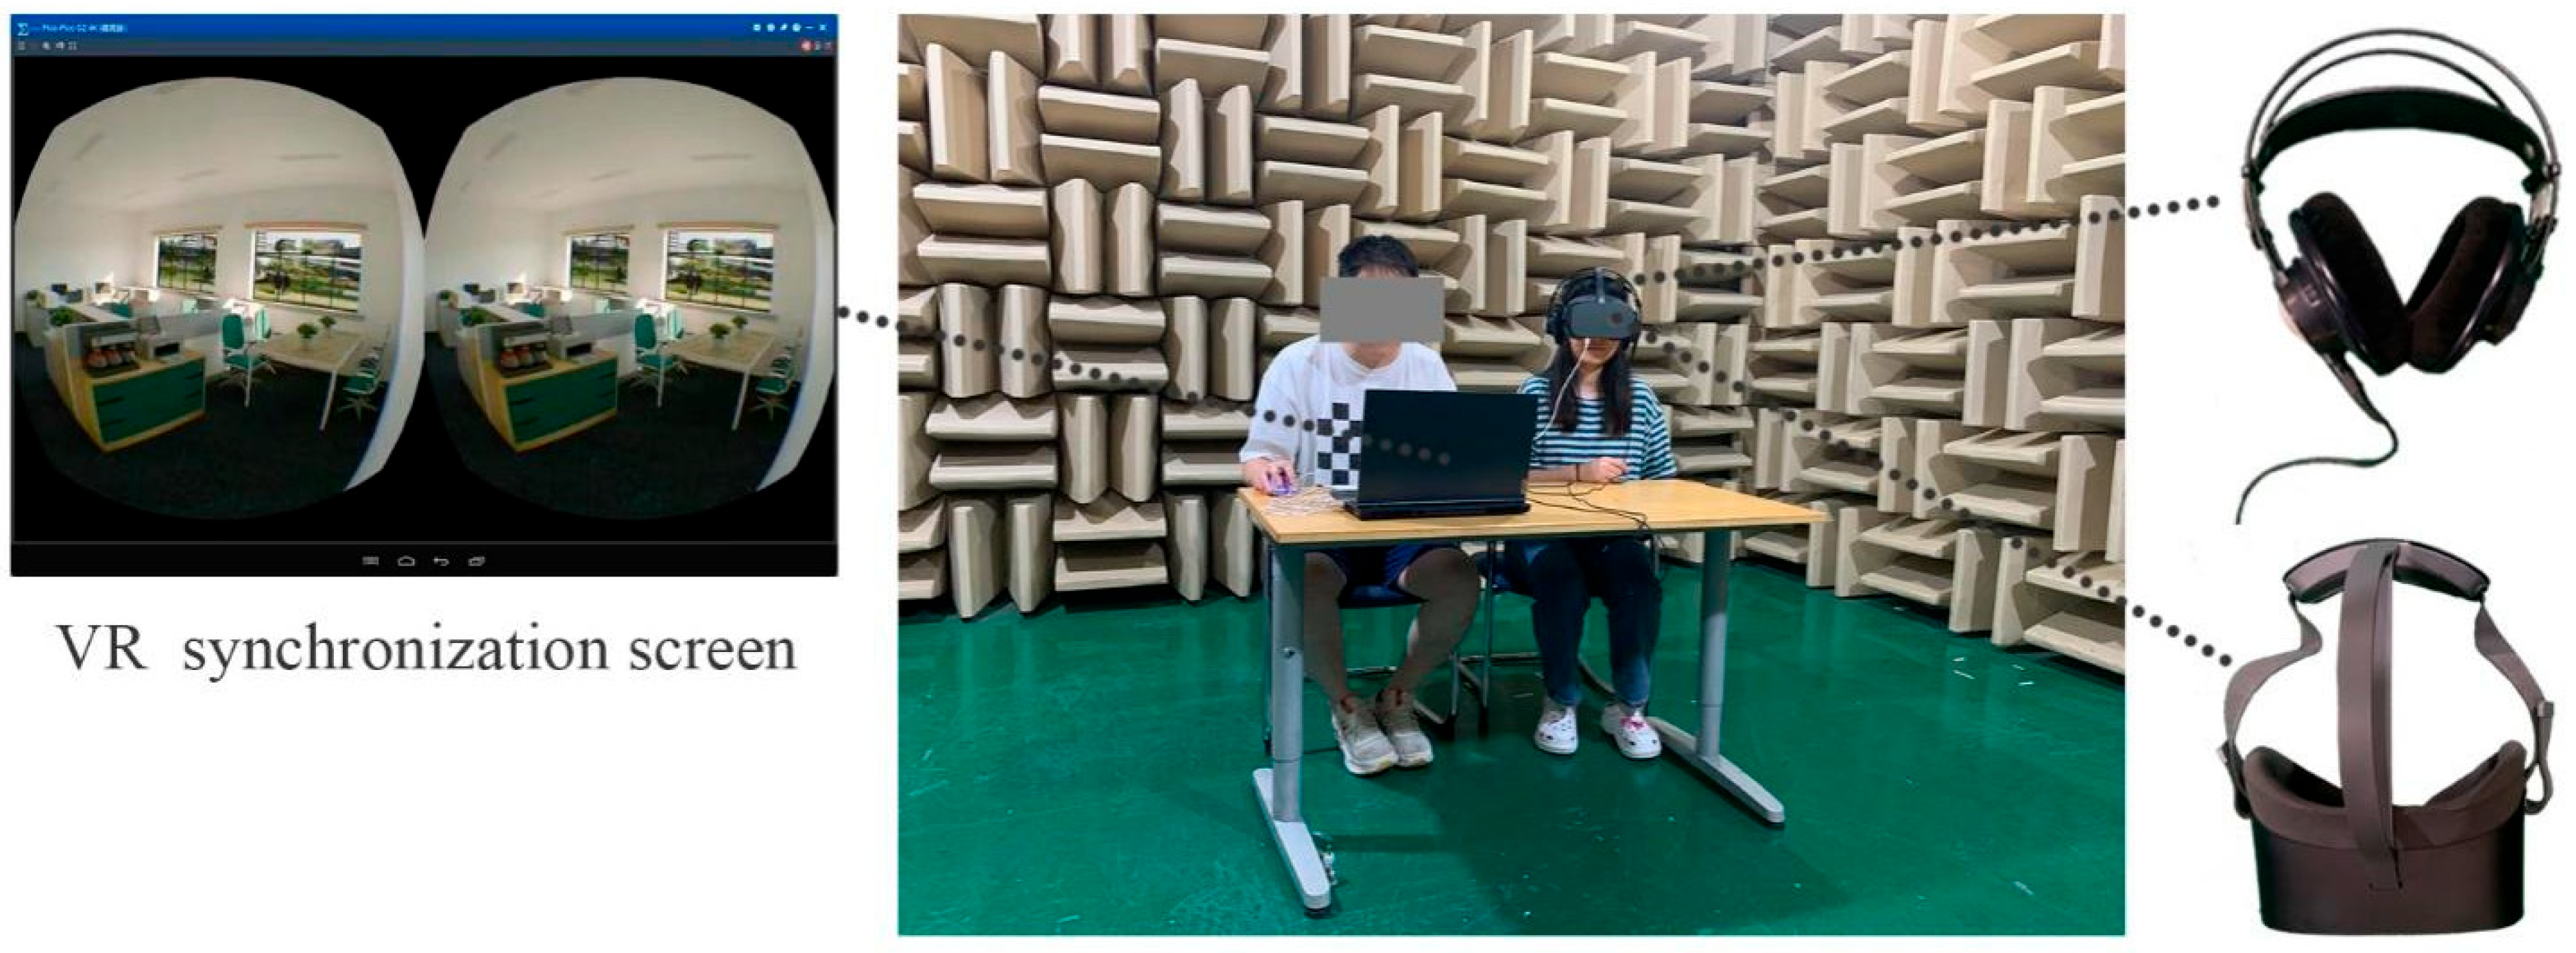
The experiment was conducted in the semi-anechoic chamber at Tianjin University, where the sound pressure level was approximately 22 dB(A). The experimental sounds were adjusted using Adobe Audition CC acoustic software and calibrated with an artificial head to ensure the accuracy of the sound pressure level in the head-mounted monitoring headphones (AKG K702). Visual stimuli were presented through the immersive virtual reality device, Pico G2 (Figure 3). Studies have demonstrated that virtual reality devices effectively replicate spatial perception, providing controllable experimental conditions with high perceptual fidelity and showing no significant differences in spatial perception evaluations when compared to real environments [57].
Figure 3.
Experimental environment and equipment.
To avoid perception fatigue and boredom during the experiments, based on the specific time of fatigue observed in the pilot study, the spaciousness and transparency experiments were divided into two stages with a one-day interval between each stage. In each stage, a 10-min rest period was incorporated (Figure 4). To reduce experimental error and learning effects caused by the order of presentation, 96 and 128 kinds of audiovisual stimuli were randomly arranged for each individual participant, ensuring that each participant experienced a unique random combination of stimuli. Each stimulus was presented in VR equipment for 20 s. The average overall duration of the spaciousness experiment was 95 min, while the transparency experiment lasted 130 min.
Figure 4.
Experimental procedure (using the spaciousness experiment as an example).
2.4. Measures
Since spatial design cannot compromise users’ fundamental spatial perceptions, such as preference and satisfaction, a question regarding preference for the architectural space was included alongside inquiries about perceived spaciousness and transparency. In the spaciousness experiment, participants evaluated both perceived spaciousness and their preference for the architectural environment (see Table 1, Spaciousness Experiment section). Similarly, in the transparency experiment, the perception of external elements is crucial; the interaction between auditory perception and the outdoor visual environment can enhance perceptual clarity and attention [58], thereby influencing participants’ perception of outdoor elements and their sense of transparency. Consequently, participants in the transparency experiment were asked three questions related to transparency, preference, and the degree of alignment between the architectural space’s acoustic environment and the outdoor environment (see Table 1, Transparency Experiment section). All questions were measured using a nine-point verbal scale, and the questionnaire was provided in both Chinese and English. Participants were instructed to intuitively evaluate their perceptions of the spaciousness and transparency of the architectural space. Perceived Spaciousness refers to the impression of how large, open, and unconfined a space feels. A higher score indicated a large, open, and non-oppressive space, while a lower score suggested a small, confined, and crowded space [22]. Perceived Transparency pertains to the sense of openness and connection to the outside environment. A higher score denoted a transparent and open space, while a lower score implied an enclosed and obstructed space [39]. The experimenter did not specifically mention any acoustic-related experimental content.
Table 1.
Experimental questionnaire.
3. Results
In this study, all analyses were conducted using SPSS 25.0 software. The Shapiro–Wilk normality test confirmed that all variables followed a normal distribution. Consequently, the analysis of variance (ANOVA) was performed to assess the effects of the sound environment on perceived spaciousness and transparency. Following the ANOVA, correlation analysis, and mediation effect analysis were employed to explore the underlying reasons for the influence of the acoustic environment on perceived spaciousness and transparency. In all analyses, a p-value of less than 0.05 was used as the criterion to determine significant differences.
3.1. Spaciousness Experiment
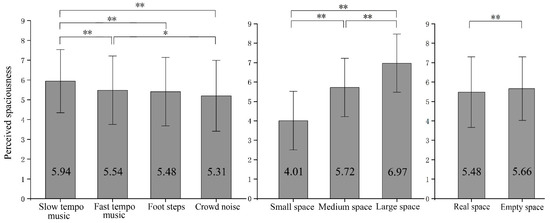
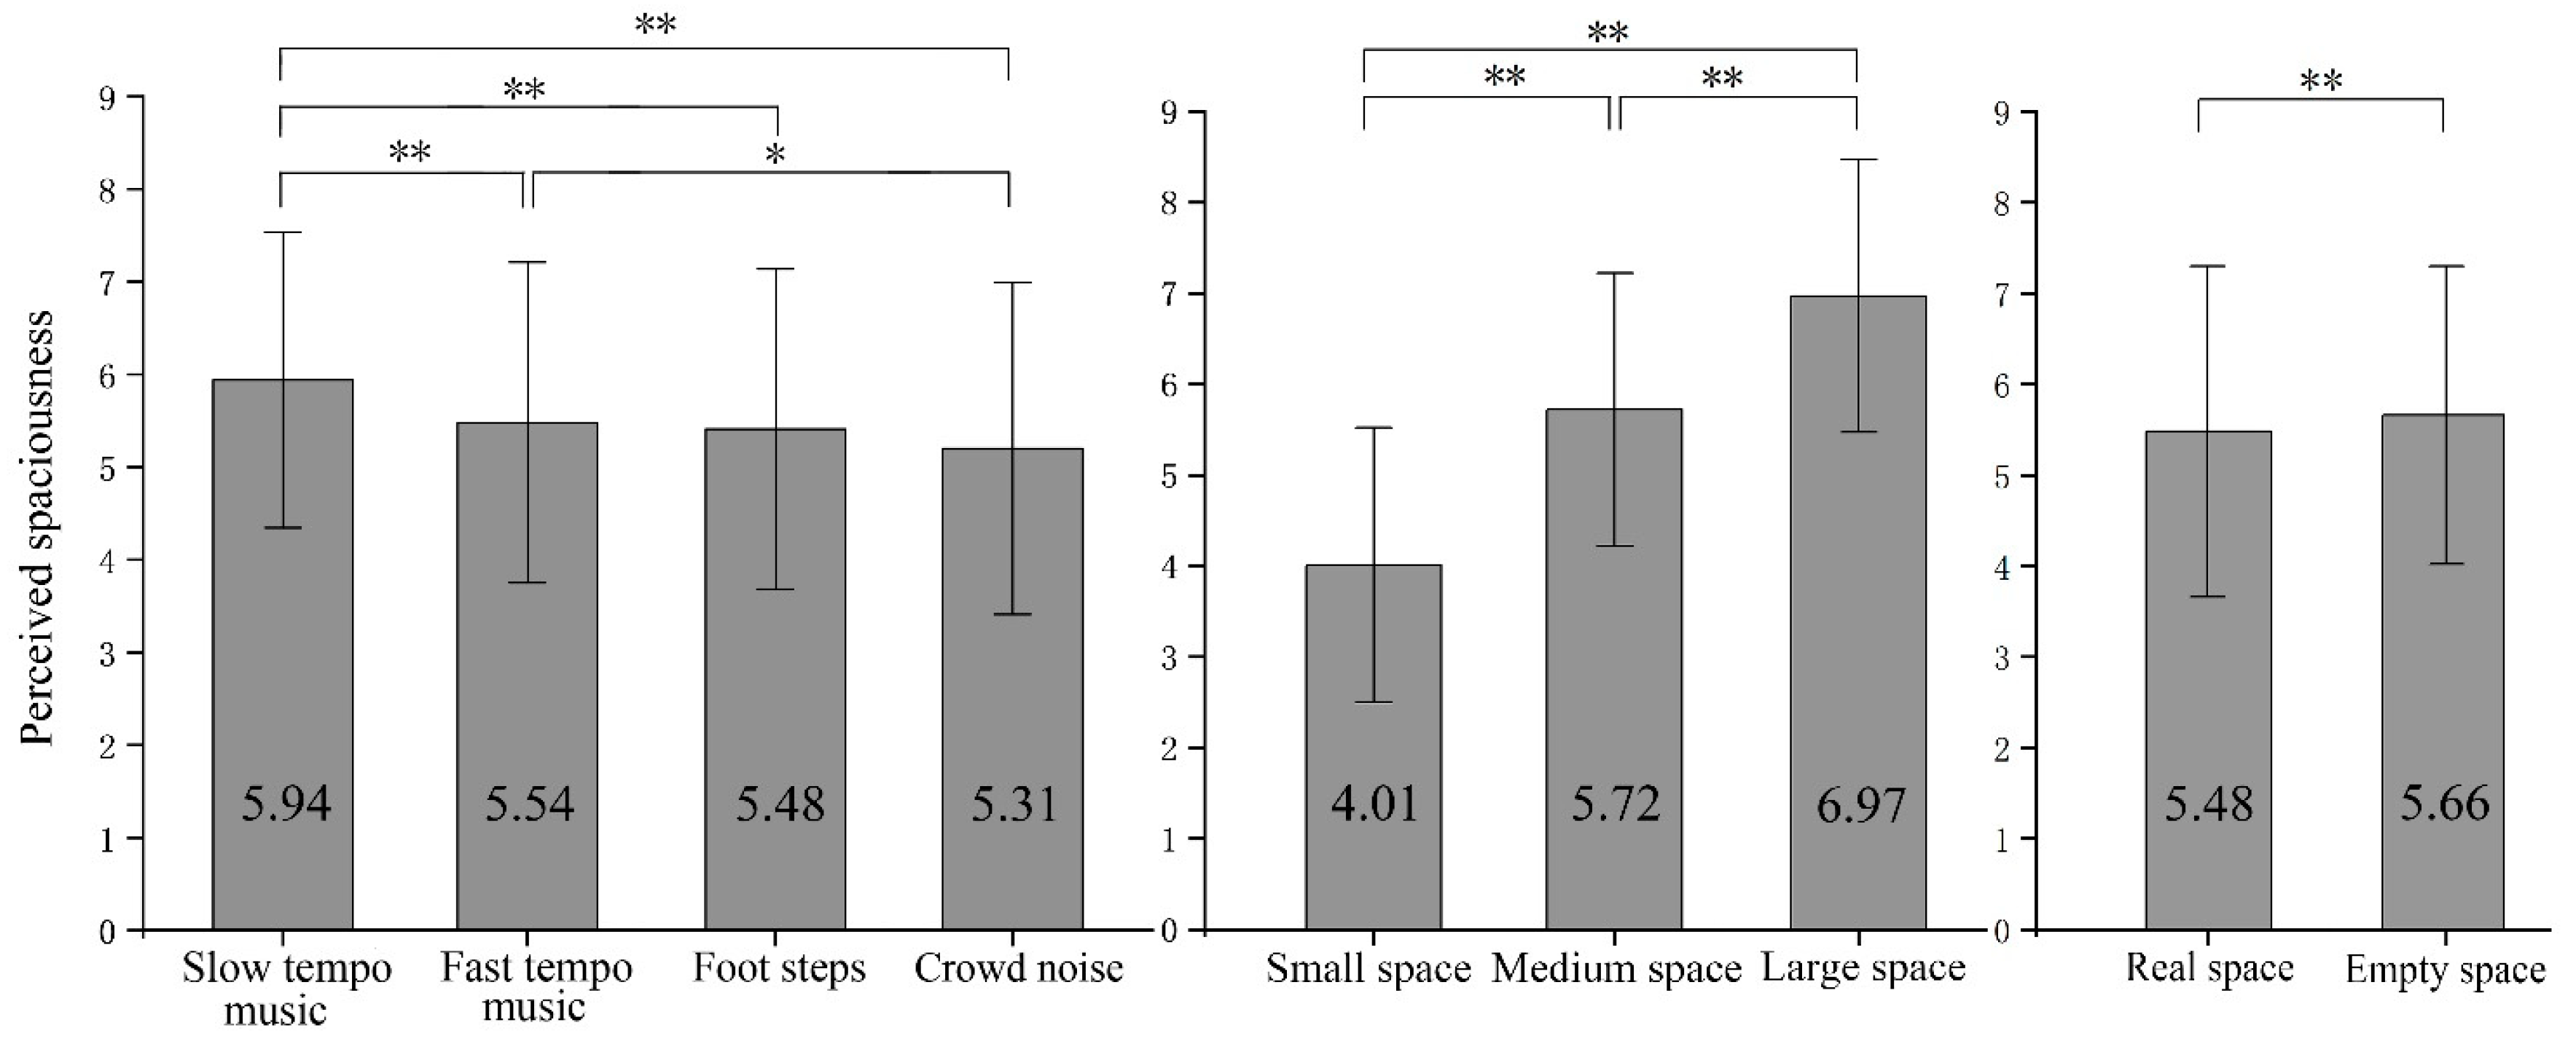
In the spaciousness experiment, ANOVA analysis (Table 2) indicated that perceived spaciousness was significantly influenced by spatial size (p < 0.01), sound type (p < 0.01), and spatial content (p = 0.008) in the overall six types of spaces. As illustrated in Figure 5, the perception of spaciousness was greatest when slow-tempo music was played, with significant differences compared to the other three sounds. The crowd noise evoked a feeling of confinement, while the effects of fast-tempo music and footsteps fell in between. Additionally, consistent with previous research, perceived spaciousness increased with area size, and participants reported a higher sense of spaciousness in empty spaces compared to furnished environments. Additionally, no interactions between any of the independent variables were found in the experiment.
Table 2.
ANOVA of spatial size, spatial content, sound type, RT, and SPL on perceived spaciousness.
Figure 5.
Effects of sound type, spatial size, and spatial content on perceived spaciousness, * and ** indicate significance at 0.05 and 0.01 levels, error bars represent 95% confidence interval.
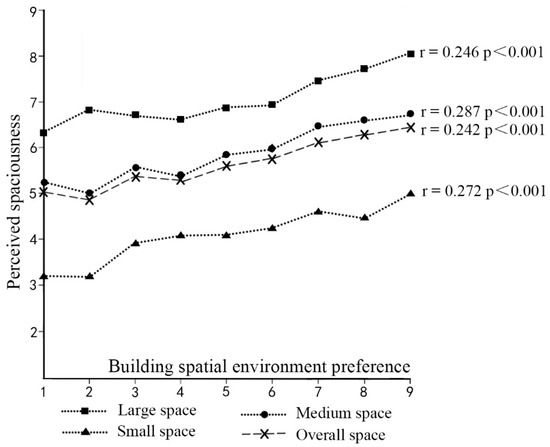
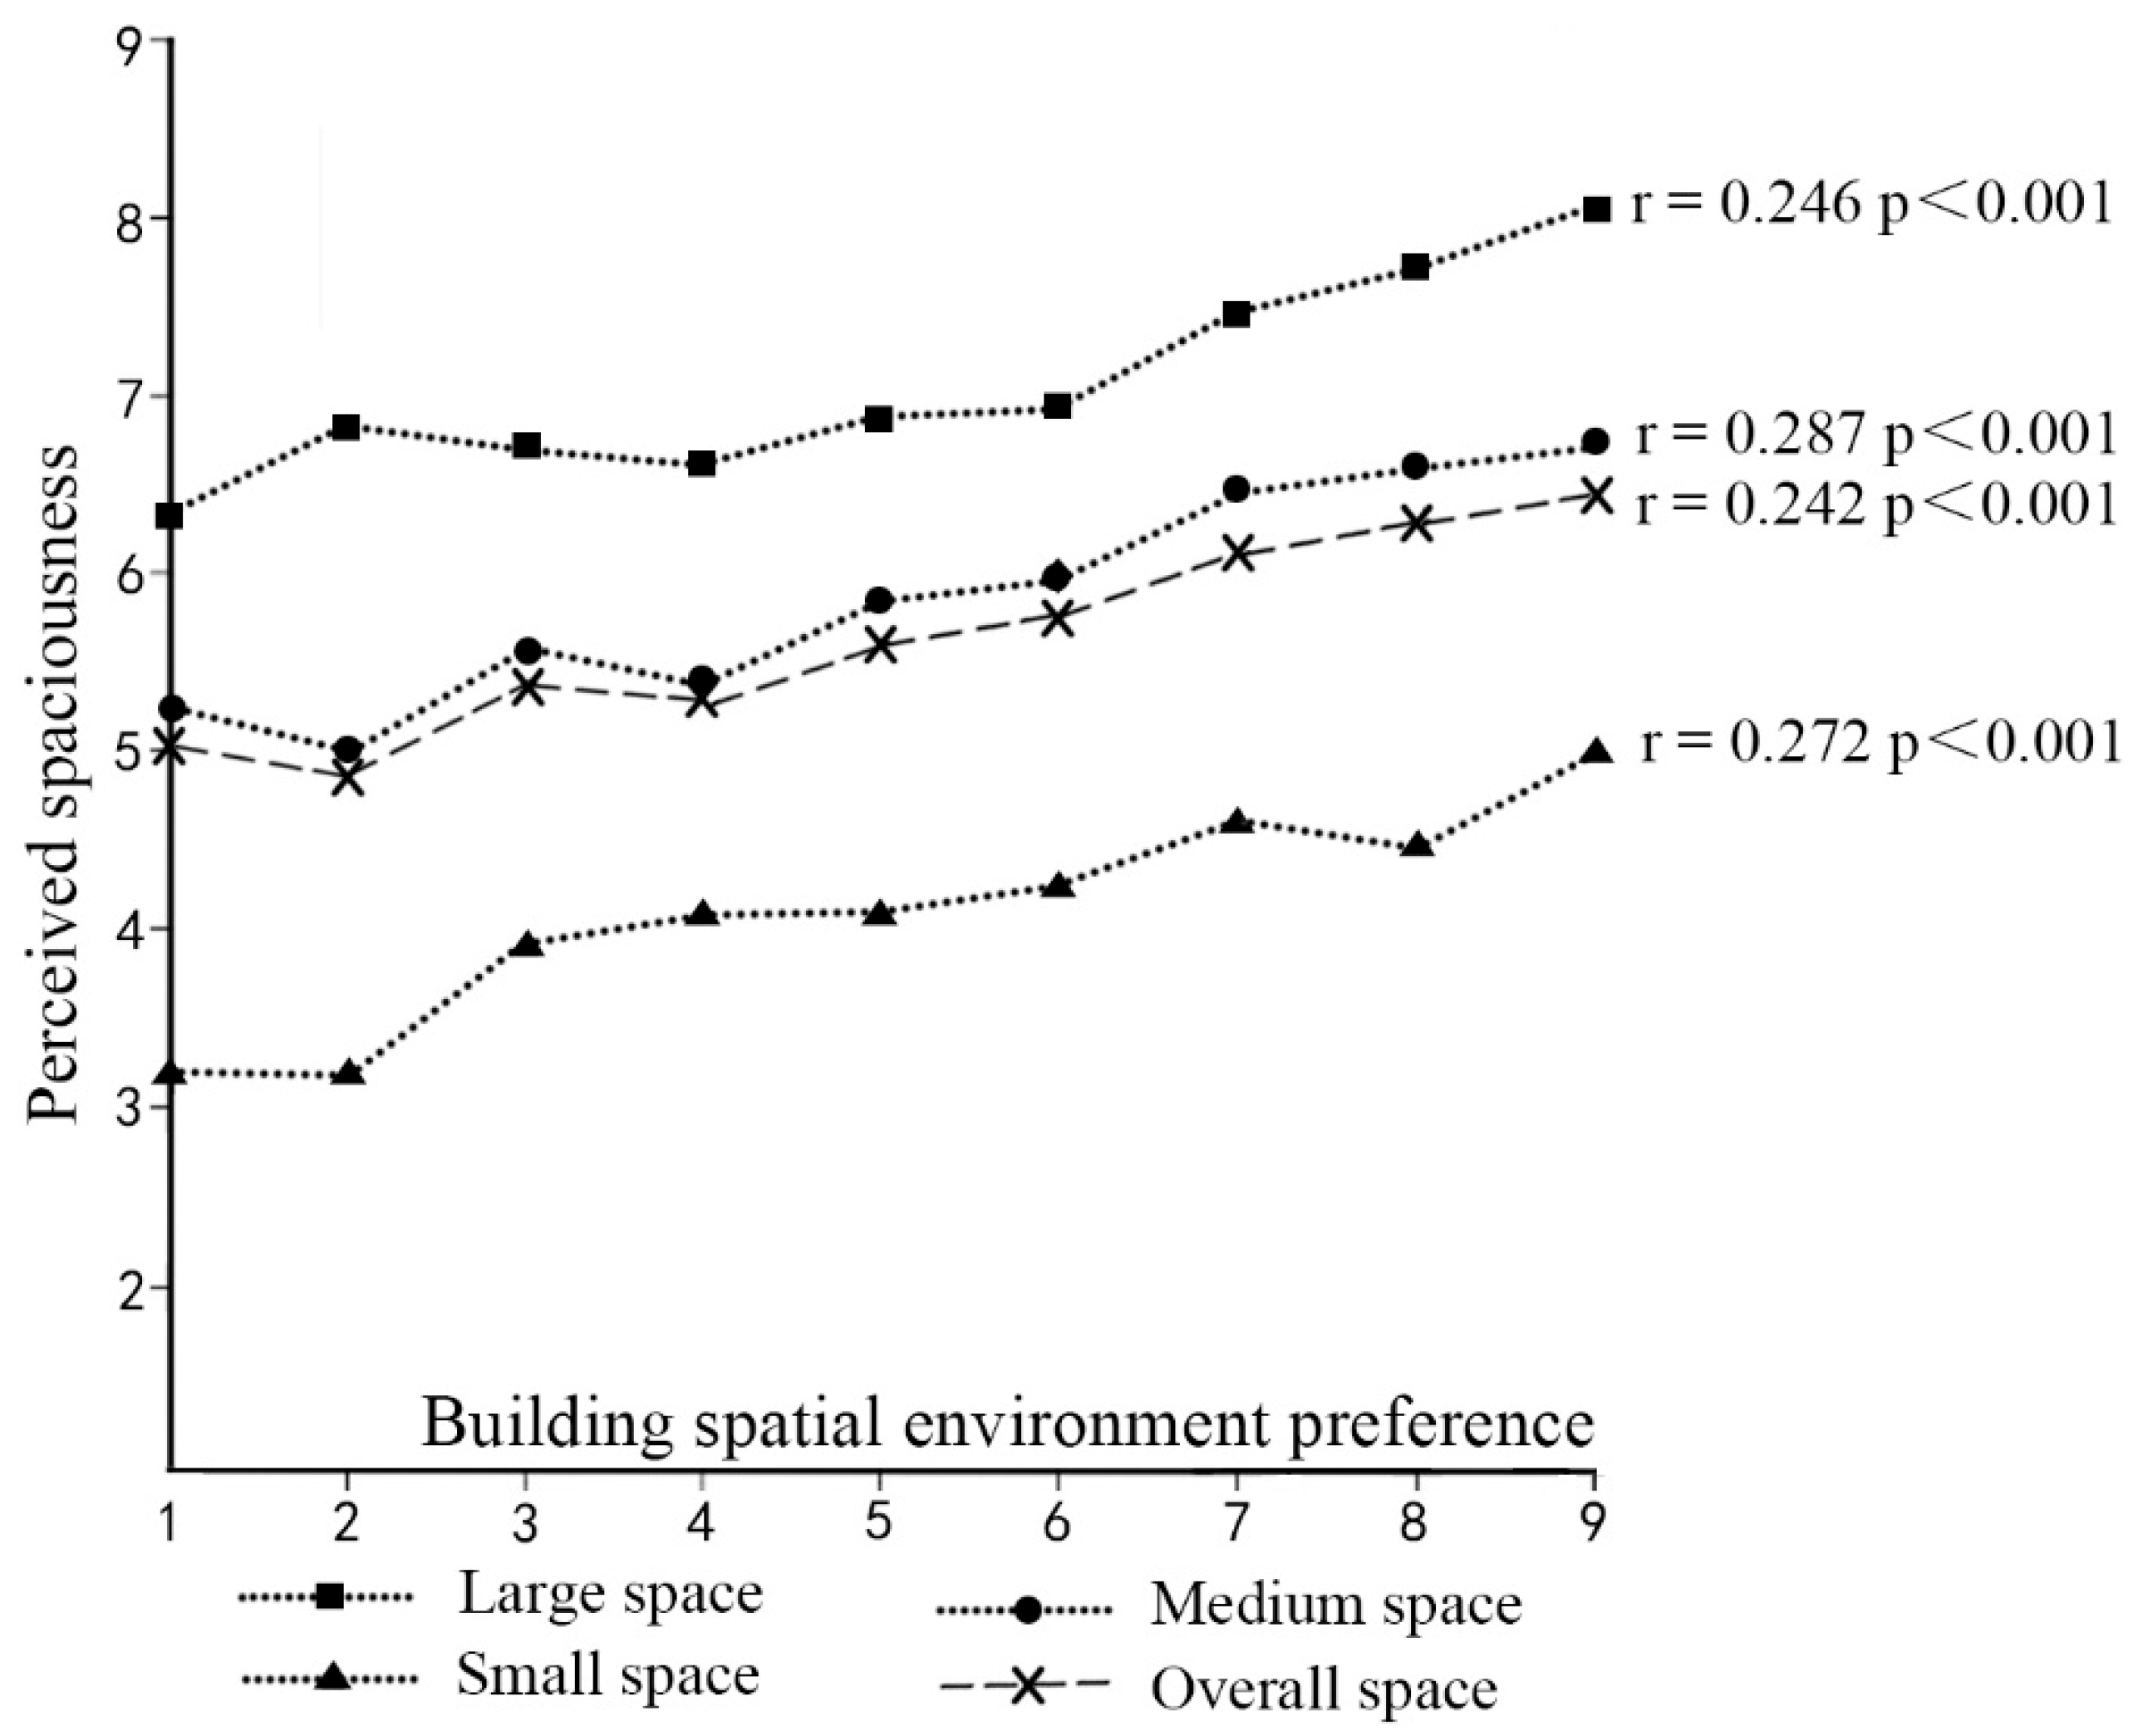
In addition to perceived spaciousness, participants also evaluated their preference for the architectural space environment. As shown in Figure 6, there was a significant positive correlation between preference for the building’s spatial environment and perceived spaciousness (r = 0.242, p < 0.001). Perceived spaciousness increased with higher preference, and this correlation was consistent across all three spatial sizes and both spatial content conditions (p < 0.001 for all conditions).
Figure 6.
The changing trend of perceived spaciousness with the building spatial environment preference (the changing trend of empty space and real space is very close to overall spaces; therefore, they are not illustrated separately). r: The correlation coefficient, which measures the strength of the relationship between two variables. The closer it is to ±1, the stronger the correlation between the variables.
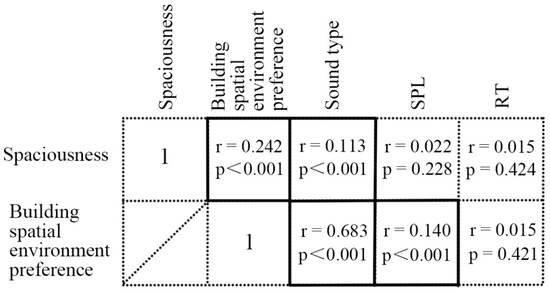
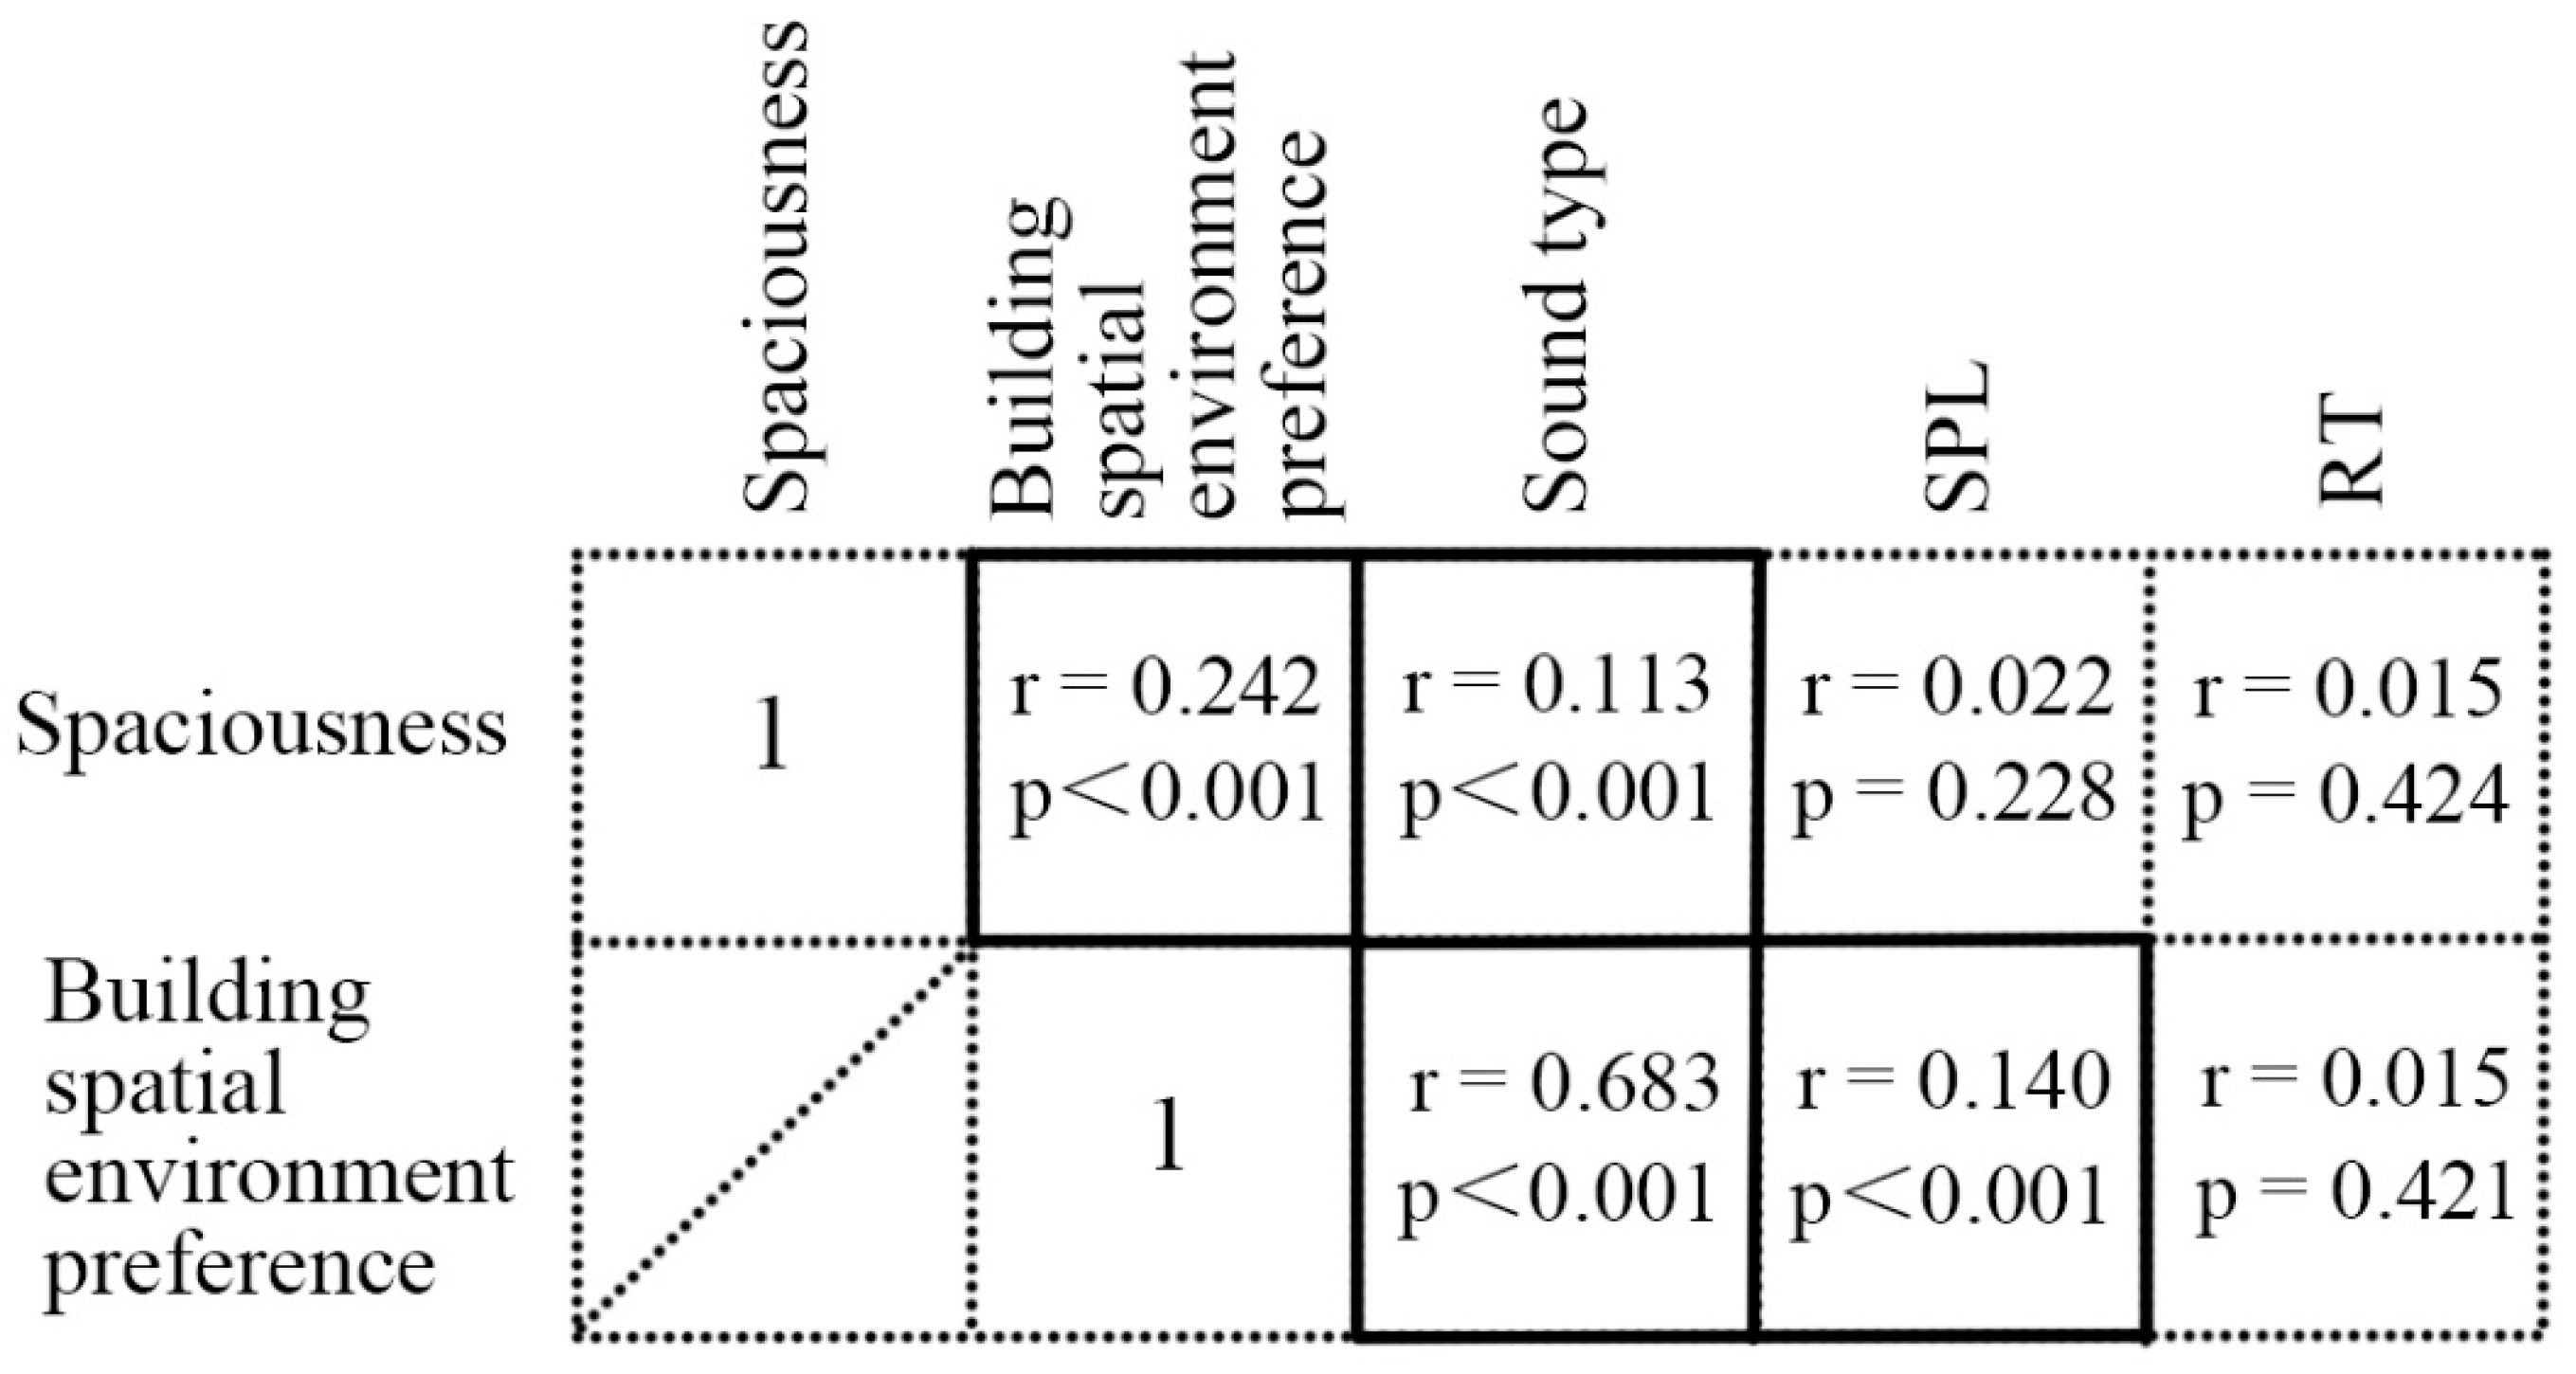
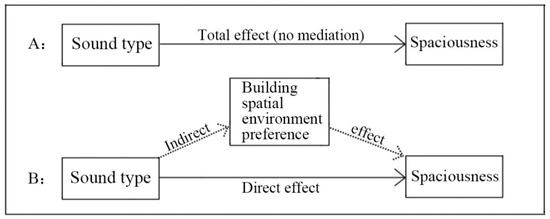
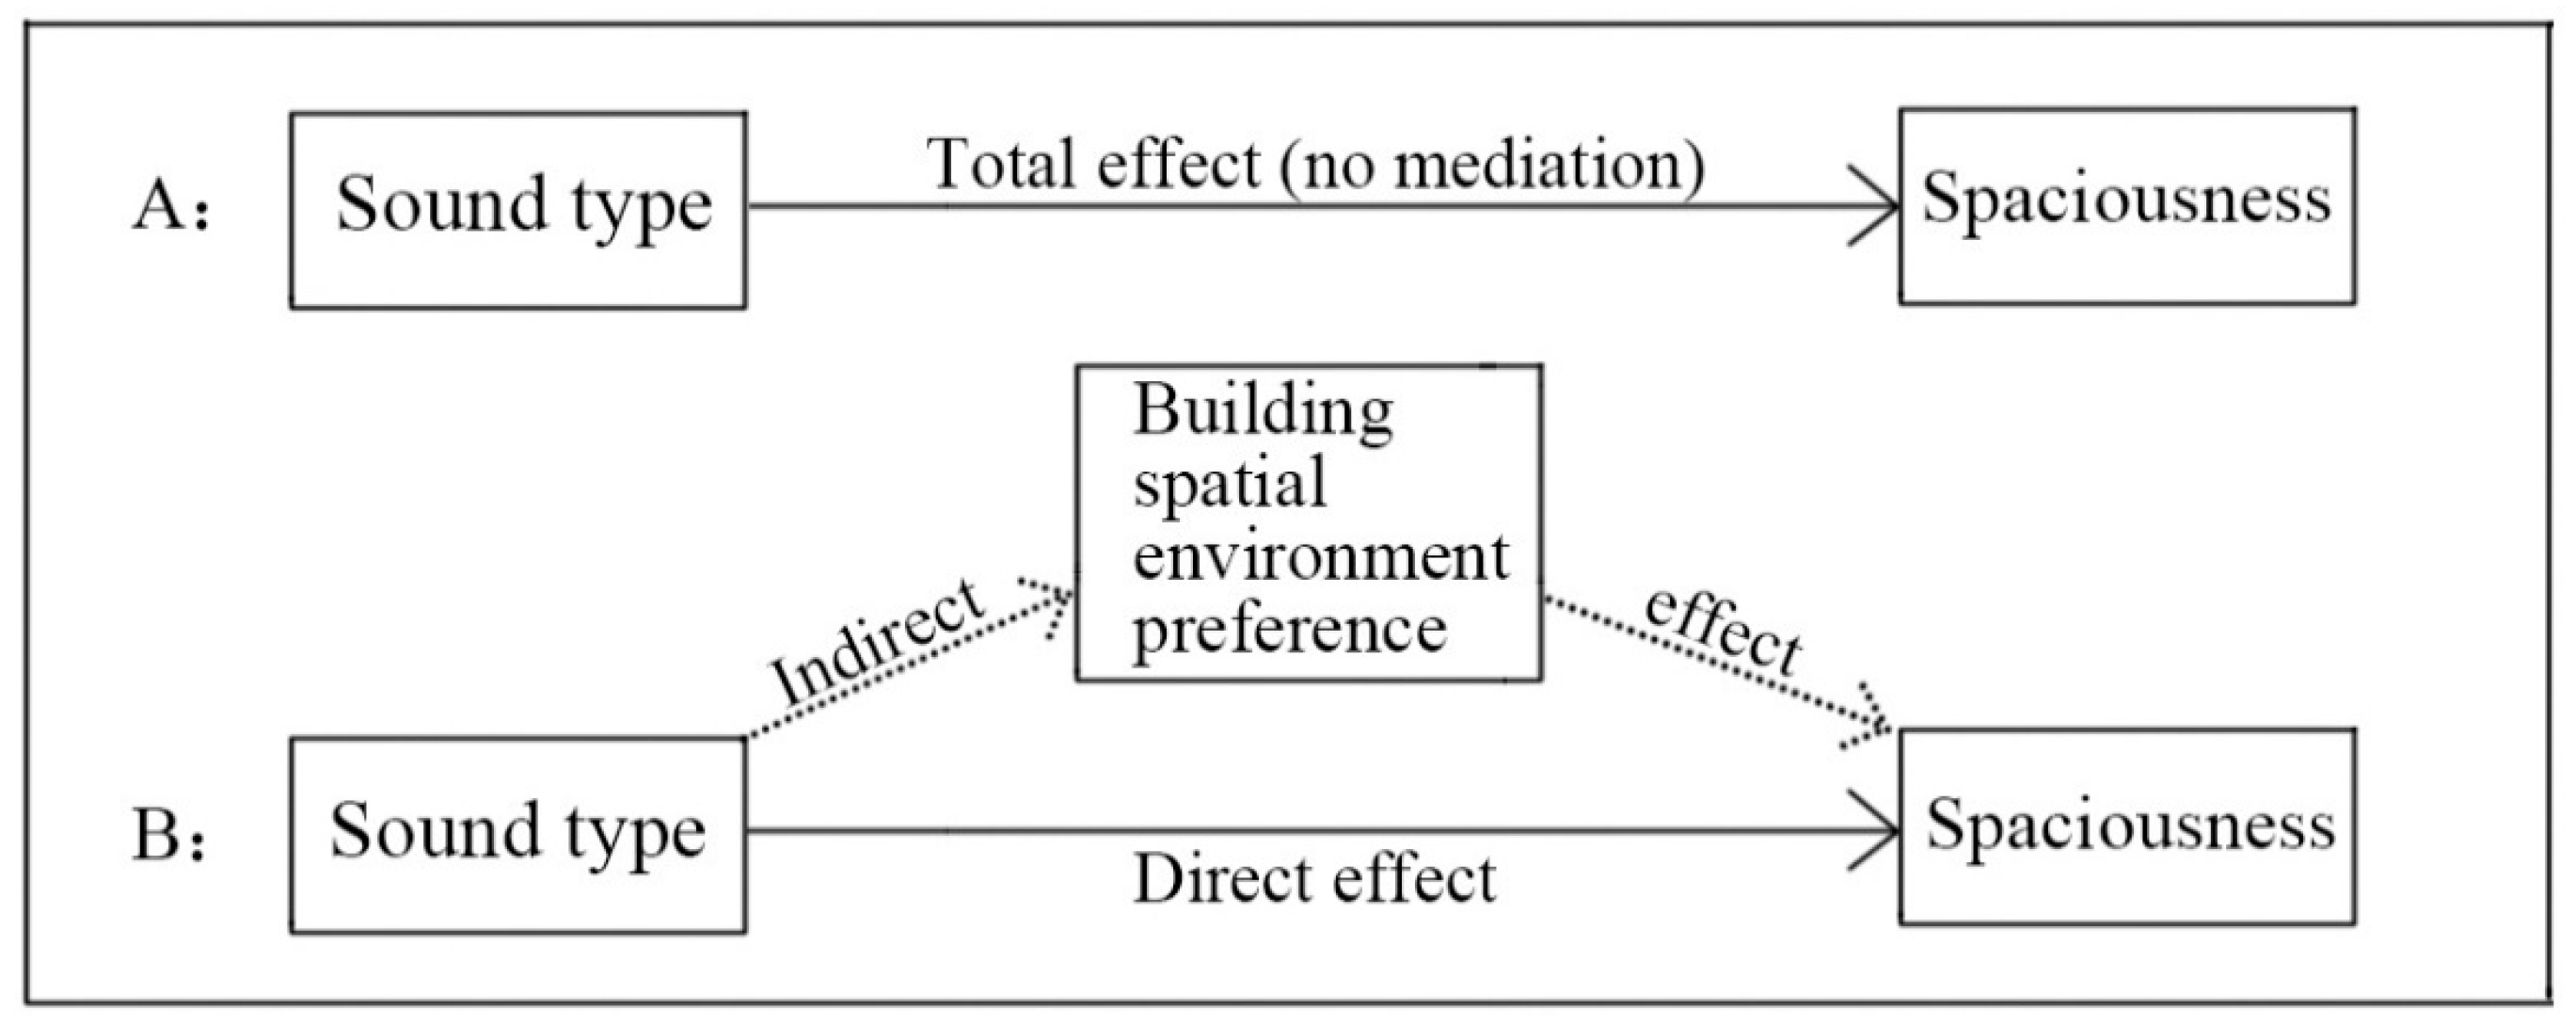
For overall spaces, the correlation matrix (Figure 7) indicated that sound type, building spatial environment preference, and perceived spaciousness were intercorrelated. This suggests that a mediation effect analysis could further explore the influence of the sound environment (specifically, of sound types) on perceived spaciousness (Figure 8). Using the bootstrap estimation approach (process plugin for SPSS, V3.4 by Andrew F. Hayes) [59] with 5000 resamples, the results (Table 3) indicated that the effect of sound type on perceived spaciousness was partially mediated by building spatial environment preference. The direct effect estimate was 0.099 (p < 0.001), while the indirect effect estimate was 0.211 (p < 0.001), with both effects being significant.
Figure 7.
Correlation matrix for Spaciousness, Building spatial environment preference, Sound type, SPL, and RT. The solid line frame indicates a significant correlation (Pearson p < 0.05).
Figure 8.
Further characterizes the overall effect of sound type on perceived spaciousness (Model A) as a mediation model mediated by building spatial environment preference (Model B).
Table 3.
Mediation analyses for the effect of sound type on perceived spaciousness.
3.2. Transparency Experiment
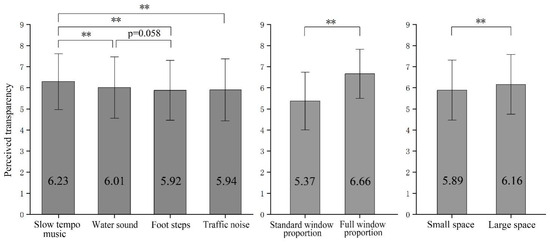
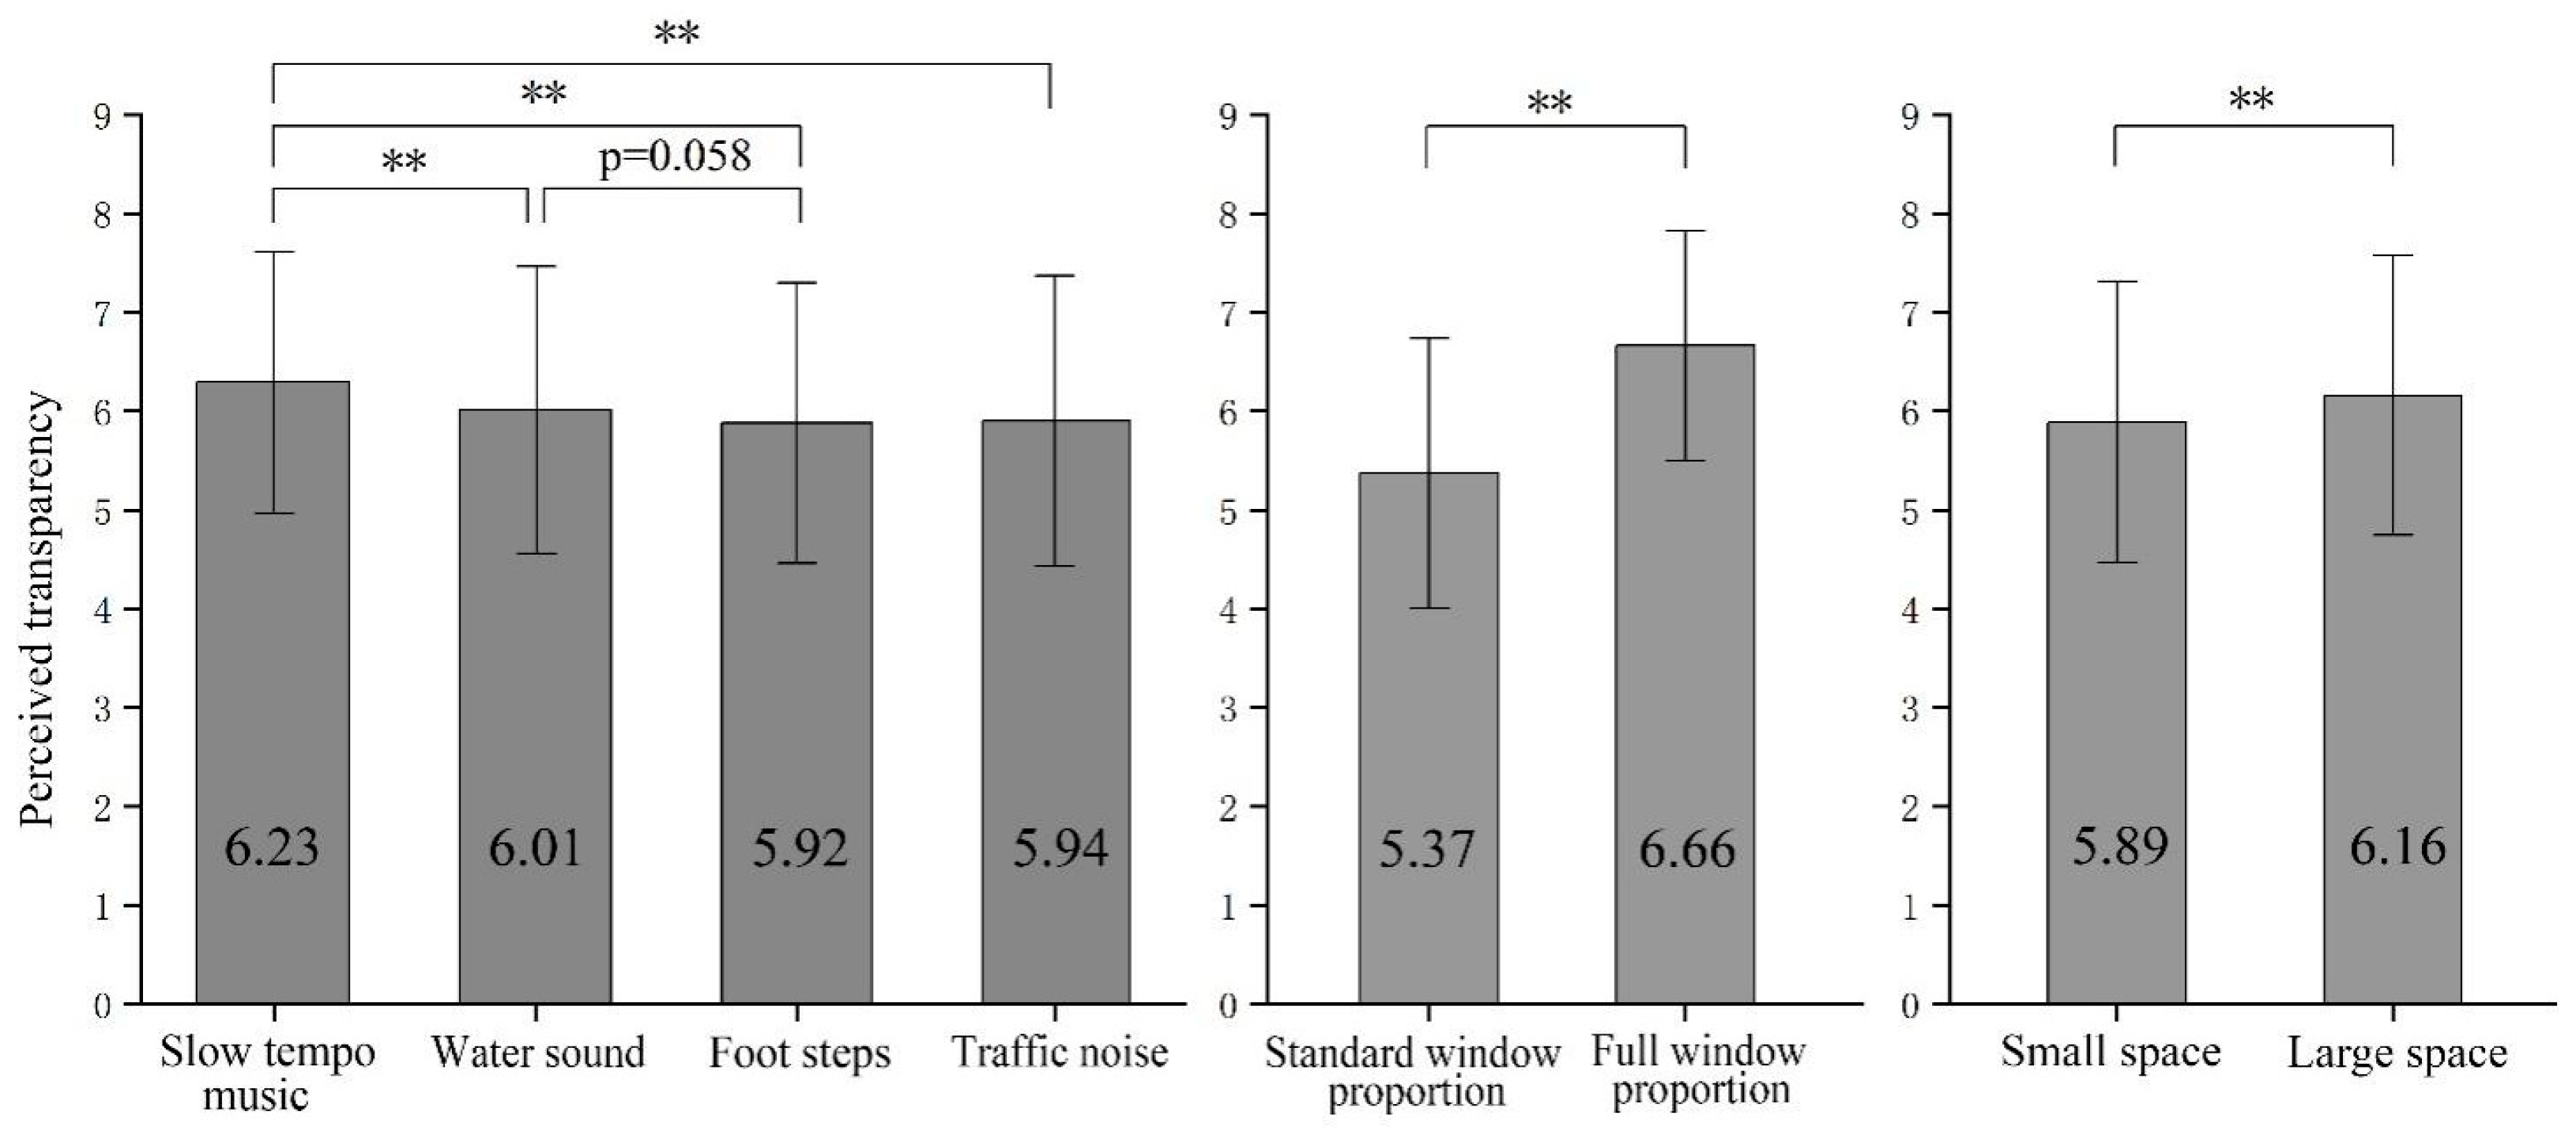
In the transparency experiment, ANOVA analysis (Table 4) indicated that perceived transparency was significantly influenced by sound type (p < 0.01), window proportion (p < 0.01), and spatial size (p < 0.01) in the overall eight types of spaces. As shown in Figure 9, perceived transparency was highest when soothing music was played, with significant differences compared to the other three sounds. Water sounds resulted in the next highest level of transparency, while footsteps and traffic noise created a more enclosed perception. Additionally, consistent with previous research, perceived transparency increased with larger window proportions and spatial sizes.
Table 4.
ANOVA of sound type, RT, SPL, spatial function, window proportion, and spatial size on perceived transparency.
Figure 9.
Effects of sound type, window proportion, and spatial size on perceived transparency, ** indicates significance at 0.01 level, error bars represent 95% confidence interval.
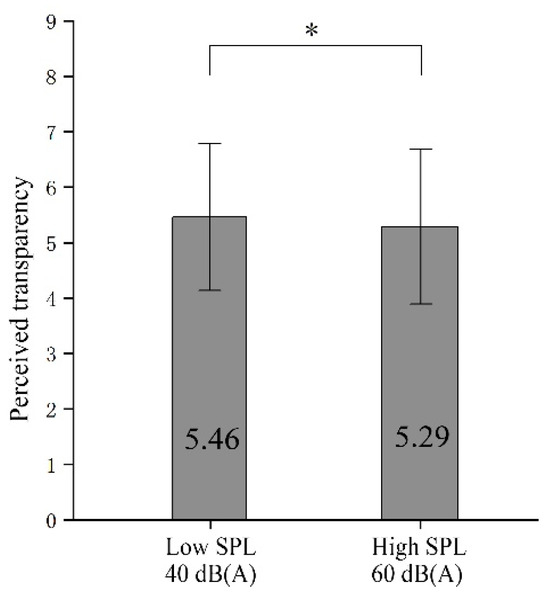
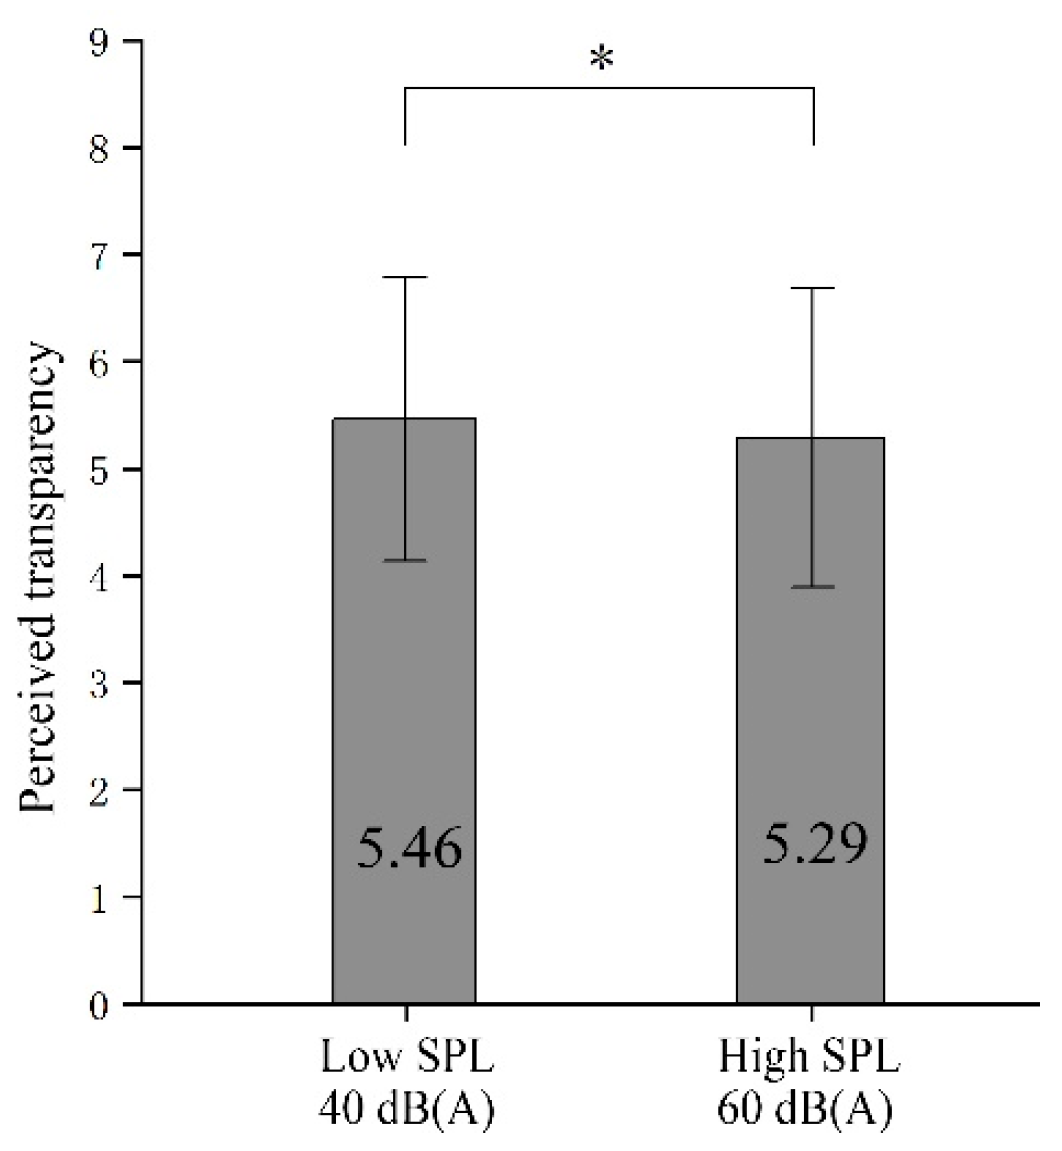
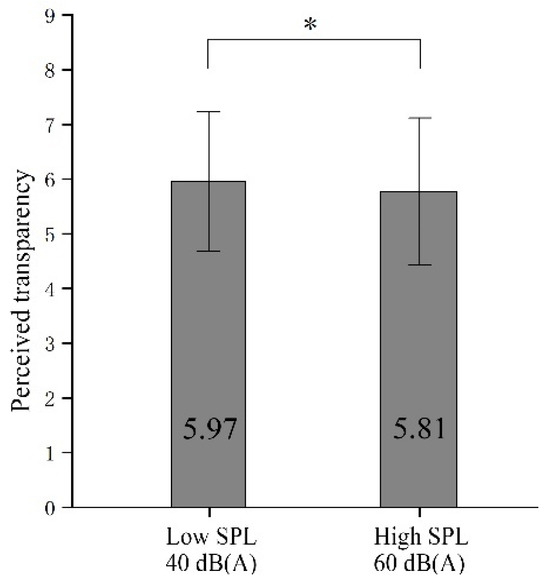
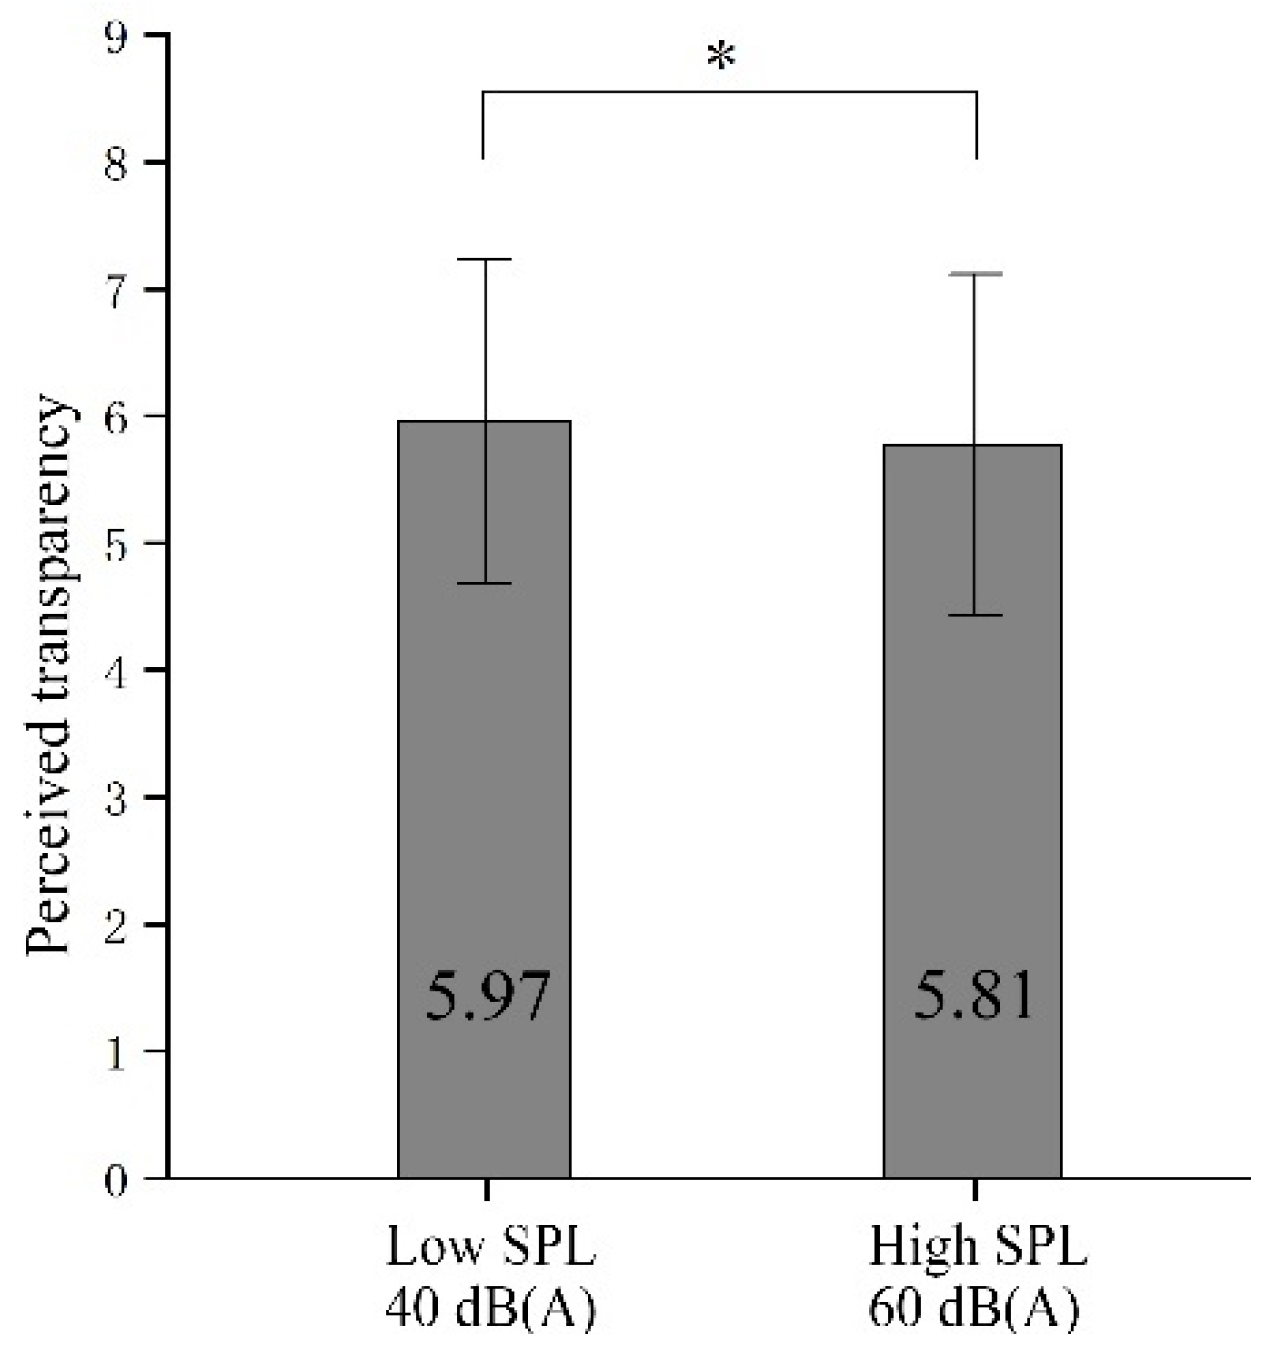
In addition, the ANOVA analysis (Table 4) revealed significant interaction effects between window proportion and SPL (F = 4.97, p = 0.027), as well as between spatial size and SPL (F = 3.65, p = 0.043). In full window proportion and large spaces (Table 5 and Table 6), the impact of the sound environment on perceived spaciousness is consistent with the overall findings. However, with standard window proportion and small spaces (Table 7 and Table 8), perceived transparency is significantly influenced not only by sound type but also by SPL (standard window proportion space: p = 0.030; small space: p = 0.035). Perceived transparency decreased with an increase in SPL (Figure 10 and Figure 11), although the significance and effect sizes were lower than those of sound types. Notably, ANOVA analysis showed that spatial functions do not interact with other factors.
Table 5.
ANOVA of sound type, RT, SPL, spatial function, and spatial size on perceived transparency in full window proportion space.
Table 6.
ANOVA of sound type, RT, SPL, spatial function, and window proportion on perceived transparency in large spaces.
Table 7.
ANOVA of sound type, RT, SPL, spatial function, and spatial size on perceived transparency in standard window proportion spaces.
Table 8.
ANOVA of sound type, RT, SPL, spatial function, and window proportion on perceived transparency in small spaces.
Figure 10.
Effects of SPL on perceived transparency in standard window proportion space. * indicates significance at 0.05 level.
Figure 11.
Effects of SPL on perceived transparency in small spaces. * indicates significance at 0.05 level.
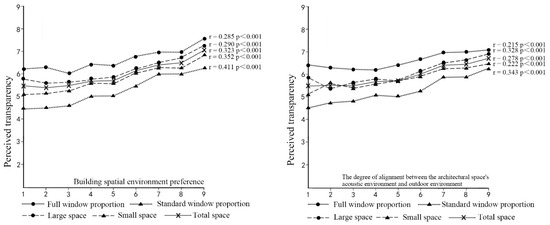
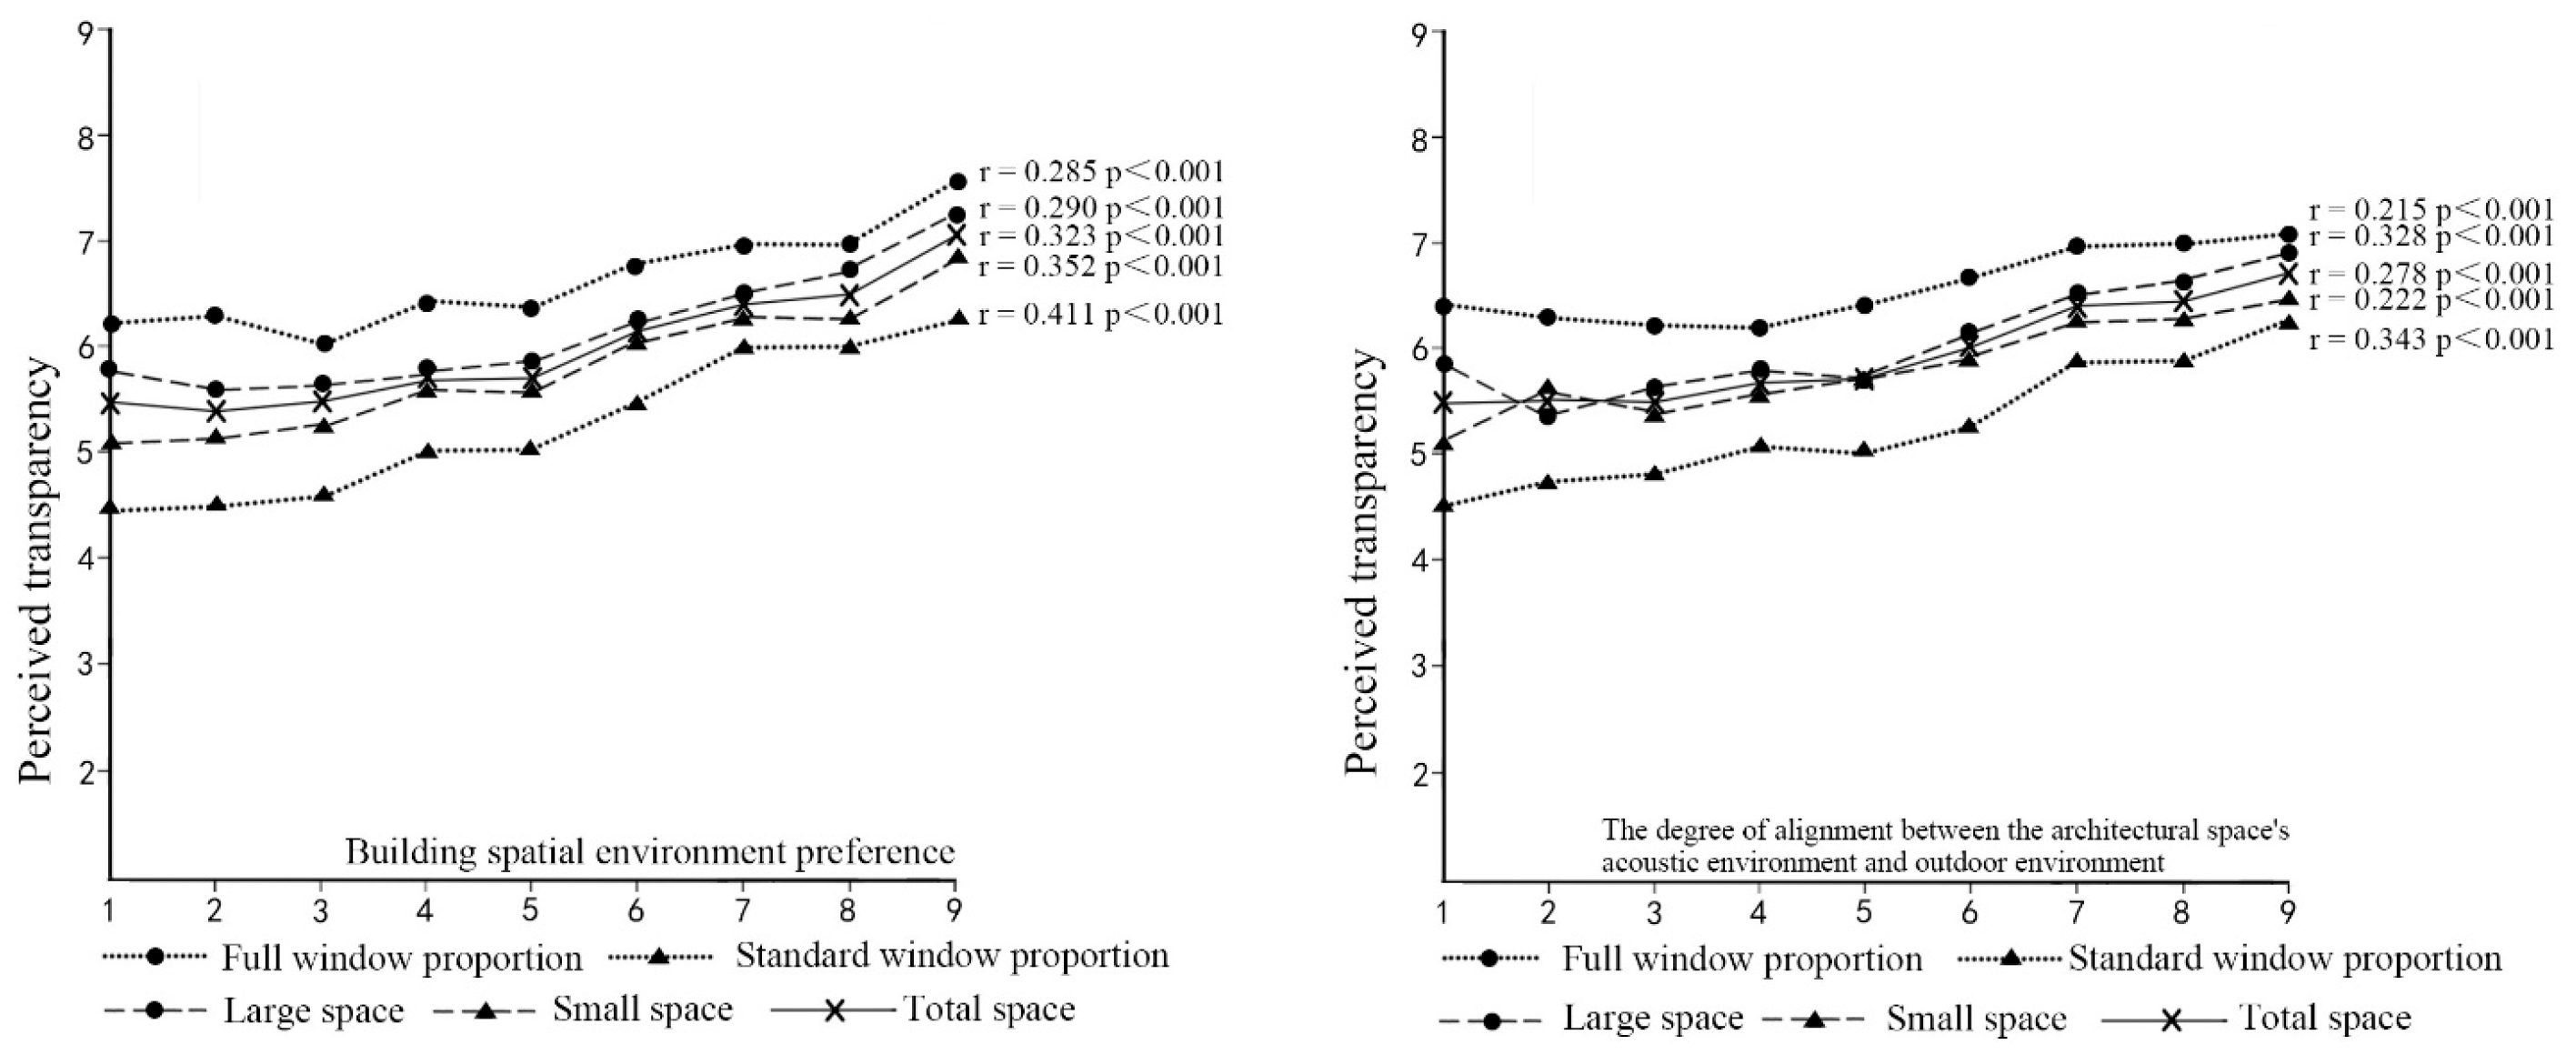
In addition to perceived transparency, participants also evaluated their preference for the building’s spatial environment and the degree of alignment between the architectural space’s acoustic environment and the outdoor environment. As shown in Figure 12, there is a significant positive correlation between perceived transparency and building spatial environment preference (r = 0.323, p < 0.001). Perceived transparency increases with a higher preference, and this correlation holds true across different space sizes, window proportions, and space functions (p < 0.001 for all conditions). Furthermore, there is a significant positive correlation (r = 0.278, p < 0.001) between perceived transparency and the degree of alignment between the architectural space’s acoustic environment and the outdoor environment. Similarly, perceived transparency increases with a higher degree of alignment, and this correlation is also consistent for different space sizes, window proportions, and space functions (p < 0.001 for all conditions).
Figure 12.
The changing trend of perceived transparency with building spatial environment preference (the changing trend of different spatial content spaces is very close to the overall spaces; they are not illustrated separately).
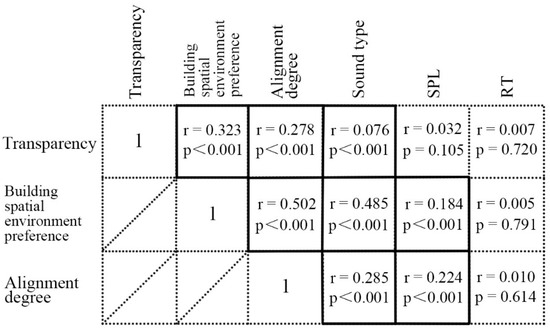
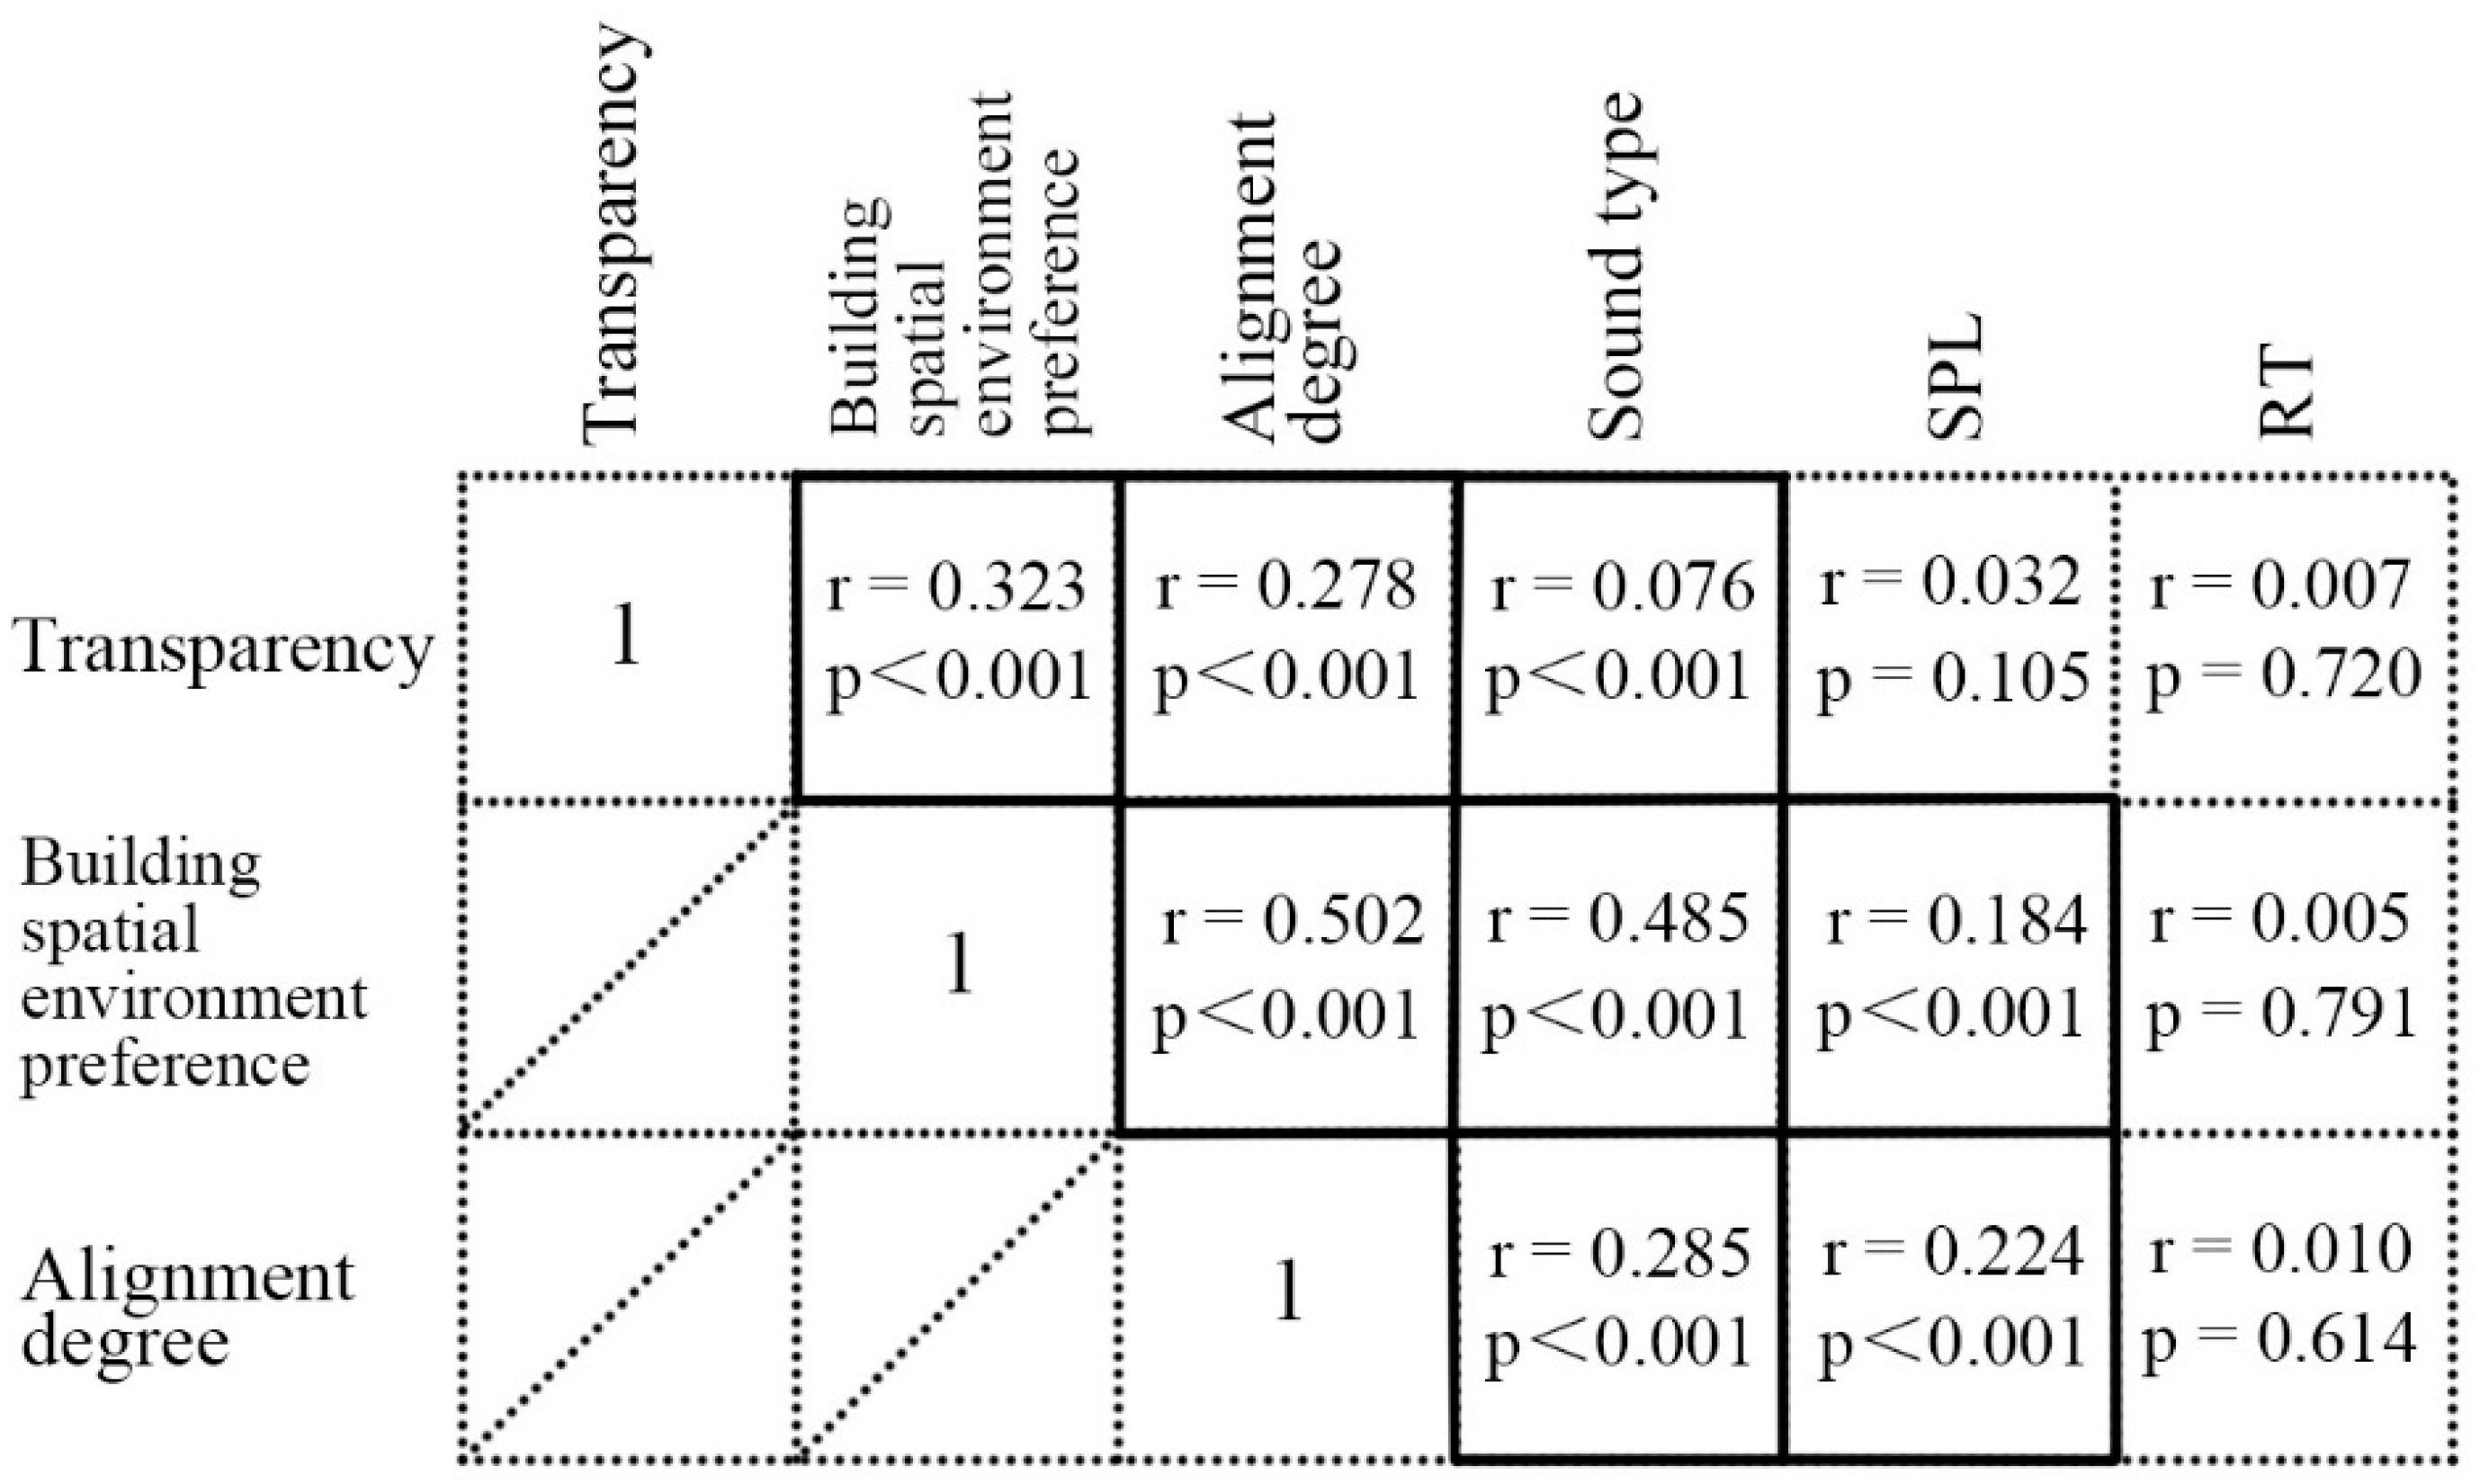
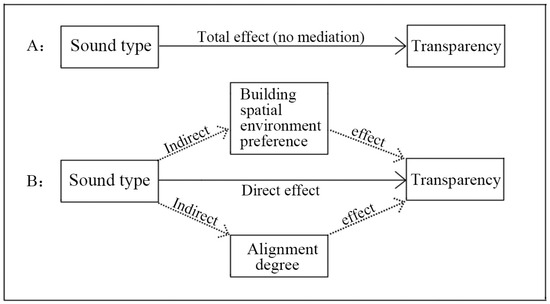
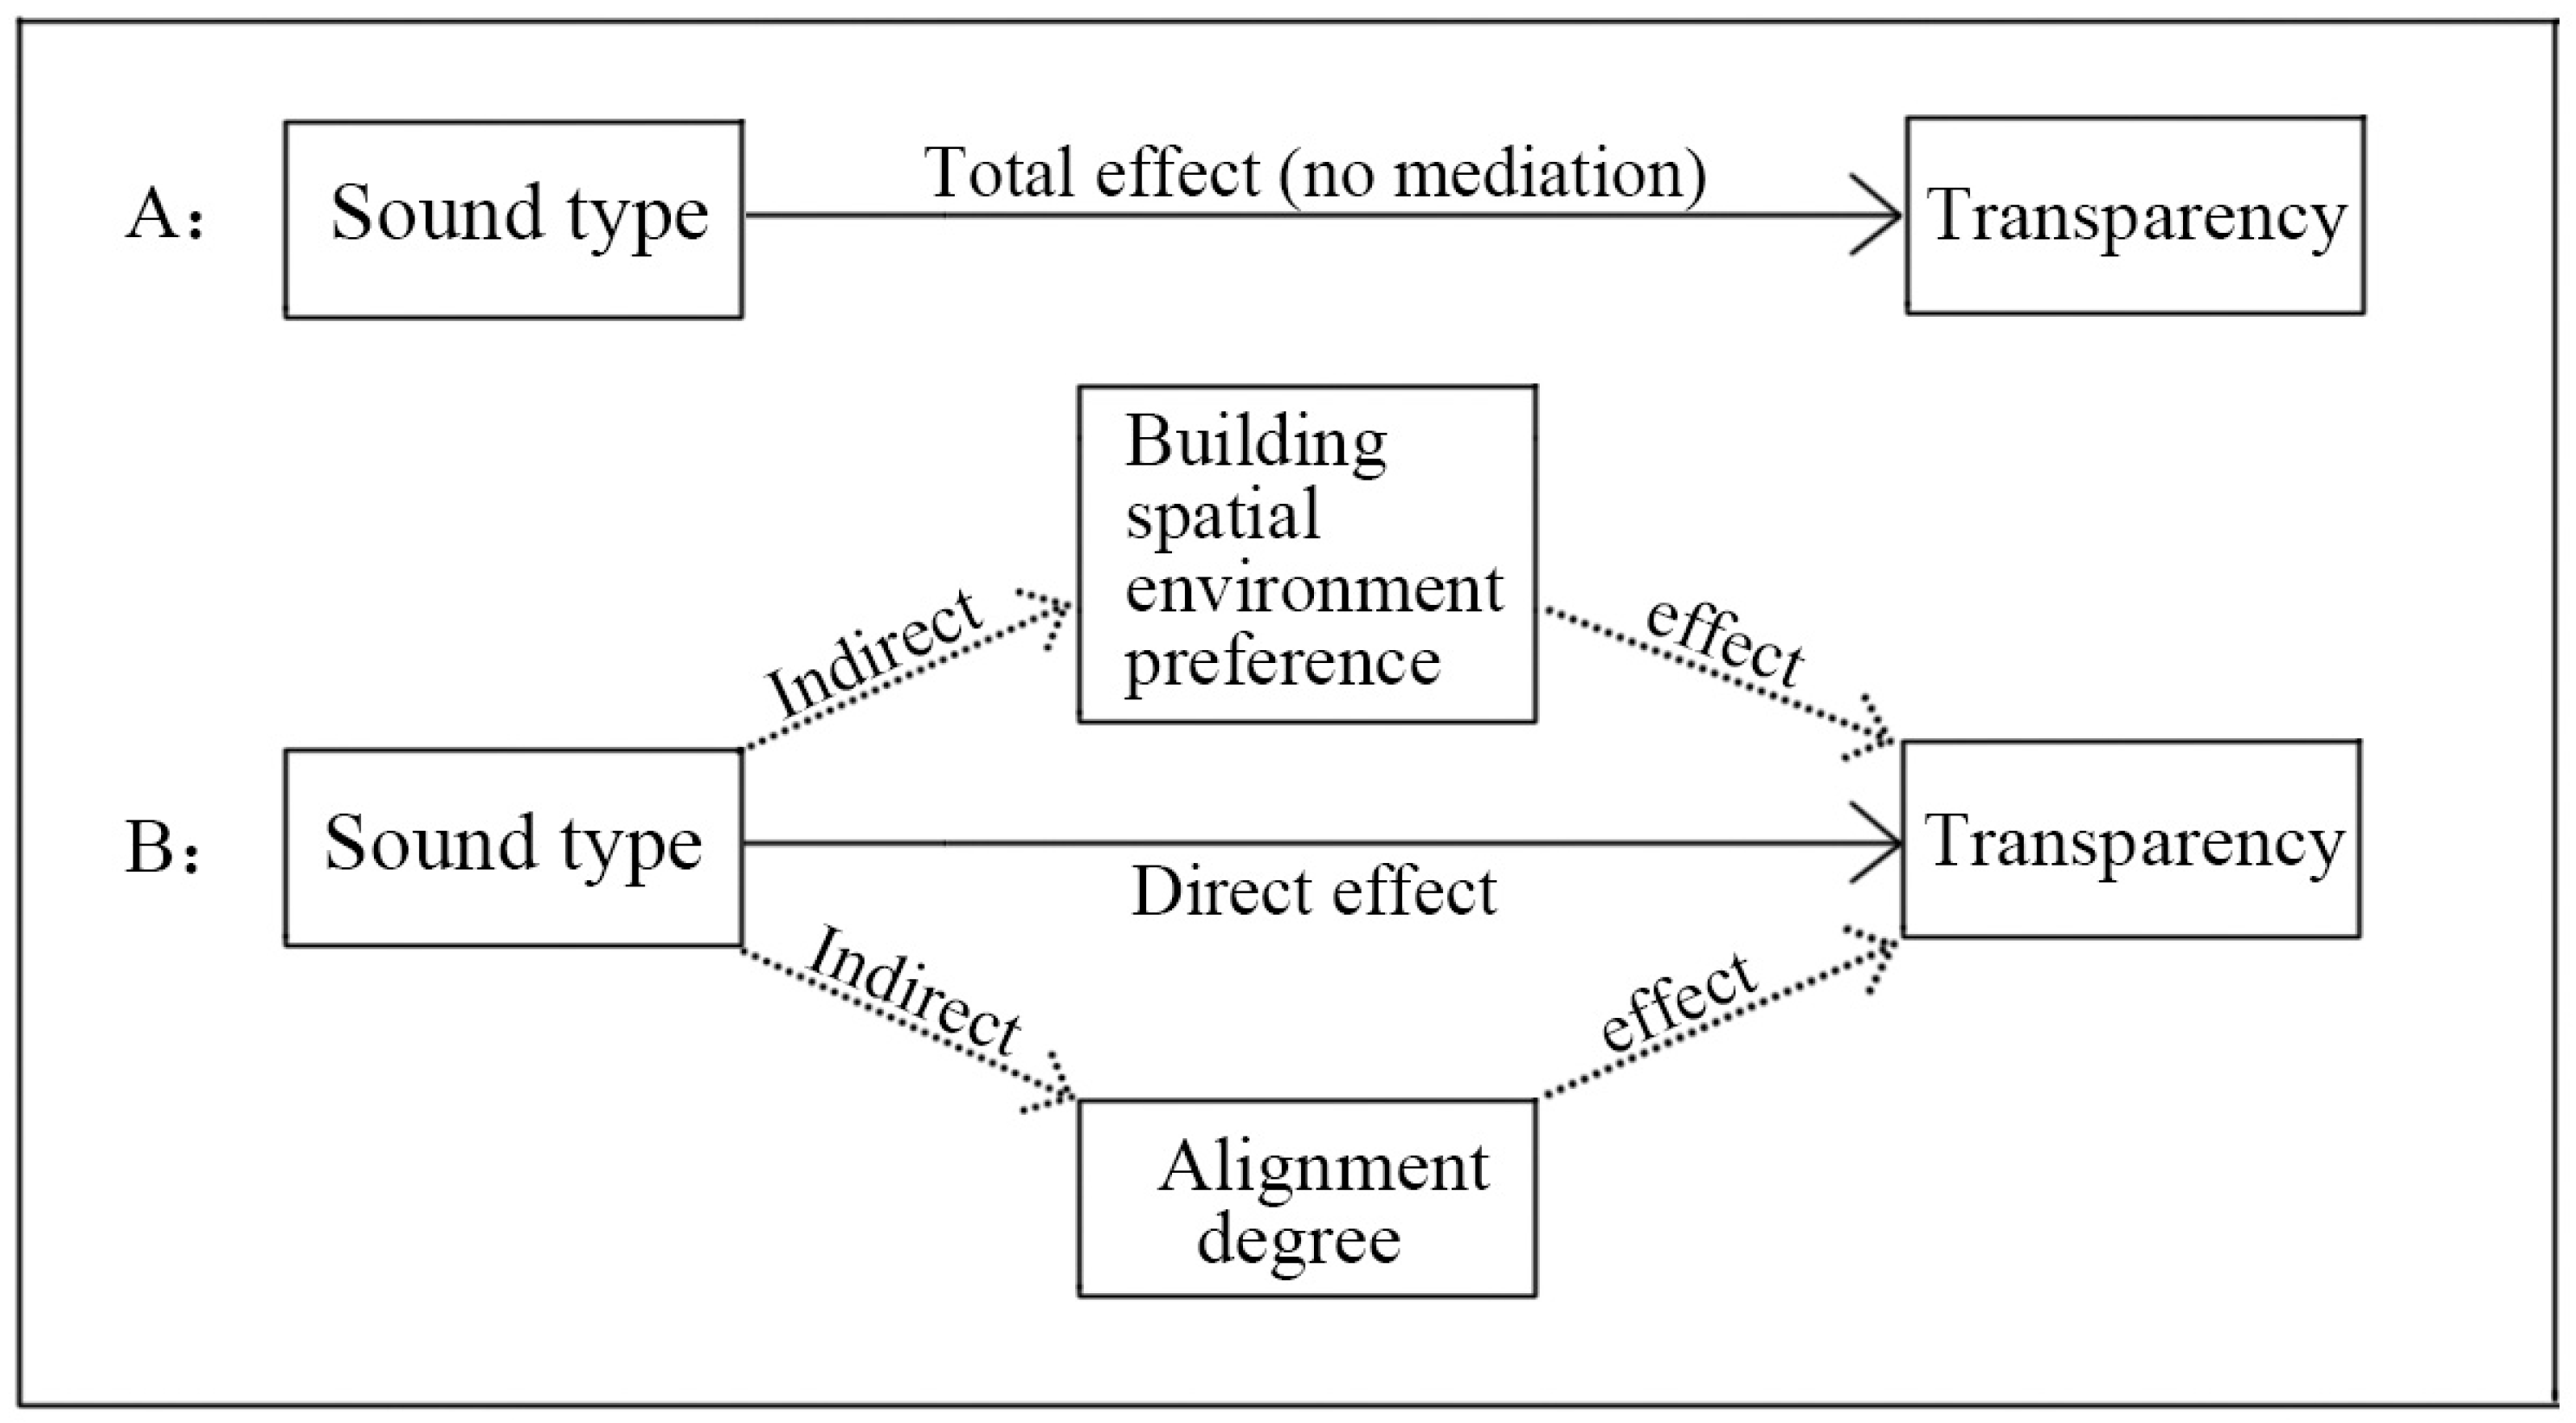
For overall spaces, the correlation matrix (Figure 13) indicated that perceived transparency, sound type, building spatial environment preference, and the degree of alignment between the architectural space’s acoustic environment and the outdoor environment were all correlated with each other. This suggests that mediation effect analysis can be employed to further explore the impact of the sound environment (specifically, sound types) on perceived transparency (Figure 14).
Figure 13.
Correlation matrix for Transparency, Building spatial environment preference, Alignment degree (the degree of alignment between the architectural space’s acoustic environment and outdoor environment), Sound type, SPL, and RT. The solid line frame indicates a significant correlation (Pearson p < 0.05).
Figure 14.
Further characterize the overall effect of sound type on perceived transparency (Model A) as a mediation model, mediated by building spatial environment preference and the degree of alignment between the architectural space’s acoustic environment and the outdoor environment (Model B).
Consistent with the analysis of spaciousness, the bootstrap estimation approach [59] was used to analyze the mediation path. As shown in Table 9, the effect of sound type on perceived transparency was partially mediated by building spatial environment preference (direct effect estimate = 0.146, p < 0.001; indirect effect estimate = 0.144, p = 0.014; both direct and indirect effects were significant) and the degree of alignment between the architectural space’s acoustic environment and the outdoor environment (direct effect estimate = 0.146, p < 0.001; indirect effect estimate = 0.046, p = 0.005; both direct and indirect effects were significant). Although the effect size of the alignment degree is smaller than that of preference, its significance is higher, indicating a more stable influence.
Table 9.
Mediation analyses for the effect of sound type on perceived transparency.
4. Discussion
4.1. The Influence of the Acoustic Environment on Perceived Spaciousness and Transparency
This study found that the acoustic environment significantly influences perceived spaciousness and transparency. Among the various factors, the impact of sound type is greater than that of physical indicators such as sound pressure level (SPL) and reverberation time (RT). Mediation analysis further revealed that the effect of sound type on perceived spaciousness and transparency is partially mediated by subjective spatial perceptions, including building spatial environment preference and the degree of alignment between the architectural space’s acoustic environment and the outdoor environment.
In contrast, RT had no effect on the perception of spaciousness or transparency, while SPL exerts a limited impact on perceived transparency in standard windowed space and small spaces. This stands in contrast to previous research, which has typically been conducted in “auditory spaces” (such as anechoic chambers or empty rooms) without visual input. In those settings, the spaciousness or spatial impression of high-quality room acoustics is often assessed using RT and the Early Lateral Energy Fraction [60,61,62,63,64], whereas room transparency or listener envelopment is assessed using D50 (Definition), C80 (Clarity), Late Lateral Sound Level, reverberation time, and the overall sound level reflections arriving from behind the listener [60,61,62,63,65]. For example, previous studies have shown that when spatial size is judged solely through hearing (without visual input), perceived spaciousness increases with RT, often leading to an overestimation of actual room size [66]. However, in the present study, when both visual and auditory perceptions were considered, RT was found to have no impact on perceived spaciousness.
This phenomenon may indicate that, in relatively realistic audiovisual stimuli, the influence of physical indicators (RT and SPL) is not directly related to their physical meaning, but rather to subjective perceptions affected by these indicators in a specific spatial context. In relatively enclosed spaces (standard window proportion space) and confined areas (small spaces), high SPL is less tolerable, reducing preference and perceived suitability. The process by which the acoustic environment interacts with spatial context may differ from a notion of “auditory space”, and further research comparing the two situations is highly valuable.
4.2. Comparison with Other Influencing Factors and Their Implications
The influence of the acoustic environment on perceived spaciousness and transparency contrasts with conventional understanding. In this study, we systematically organized the impact of various influencing factors to provide a deeper analysis of the processes behind these effects. As shown in Appendix A and Appendix B, experimental data related to spaciousness and transparency were compiled into standardized tables.
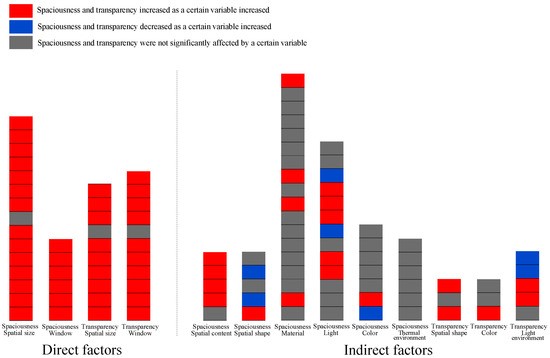
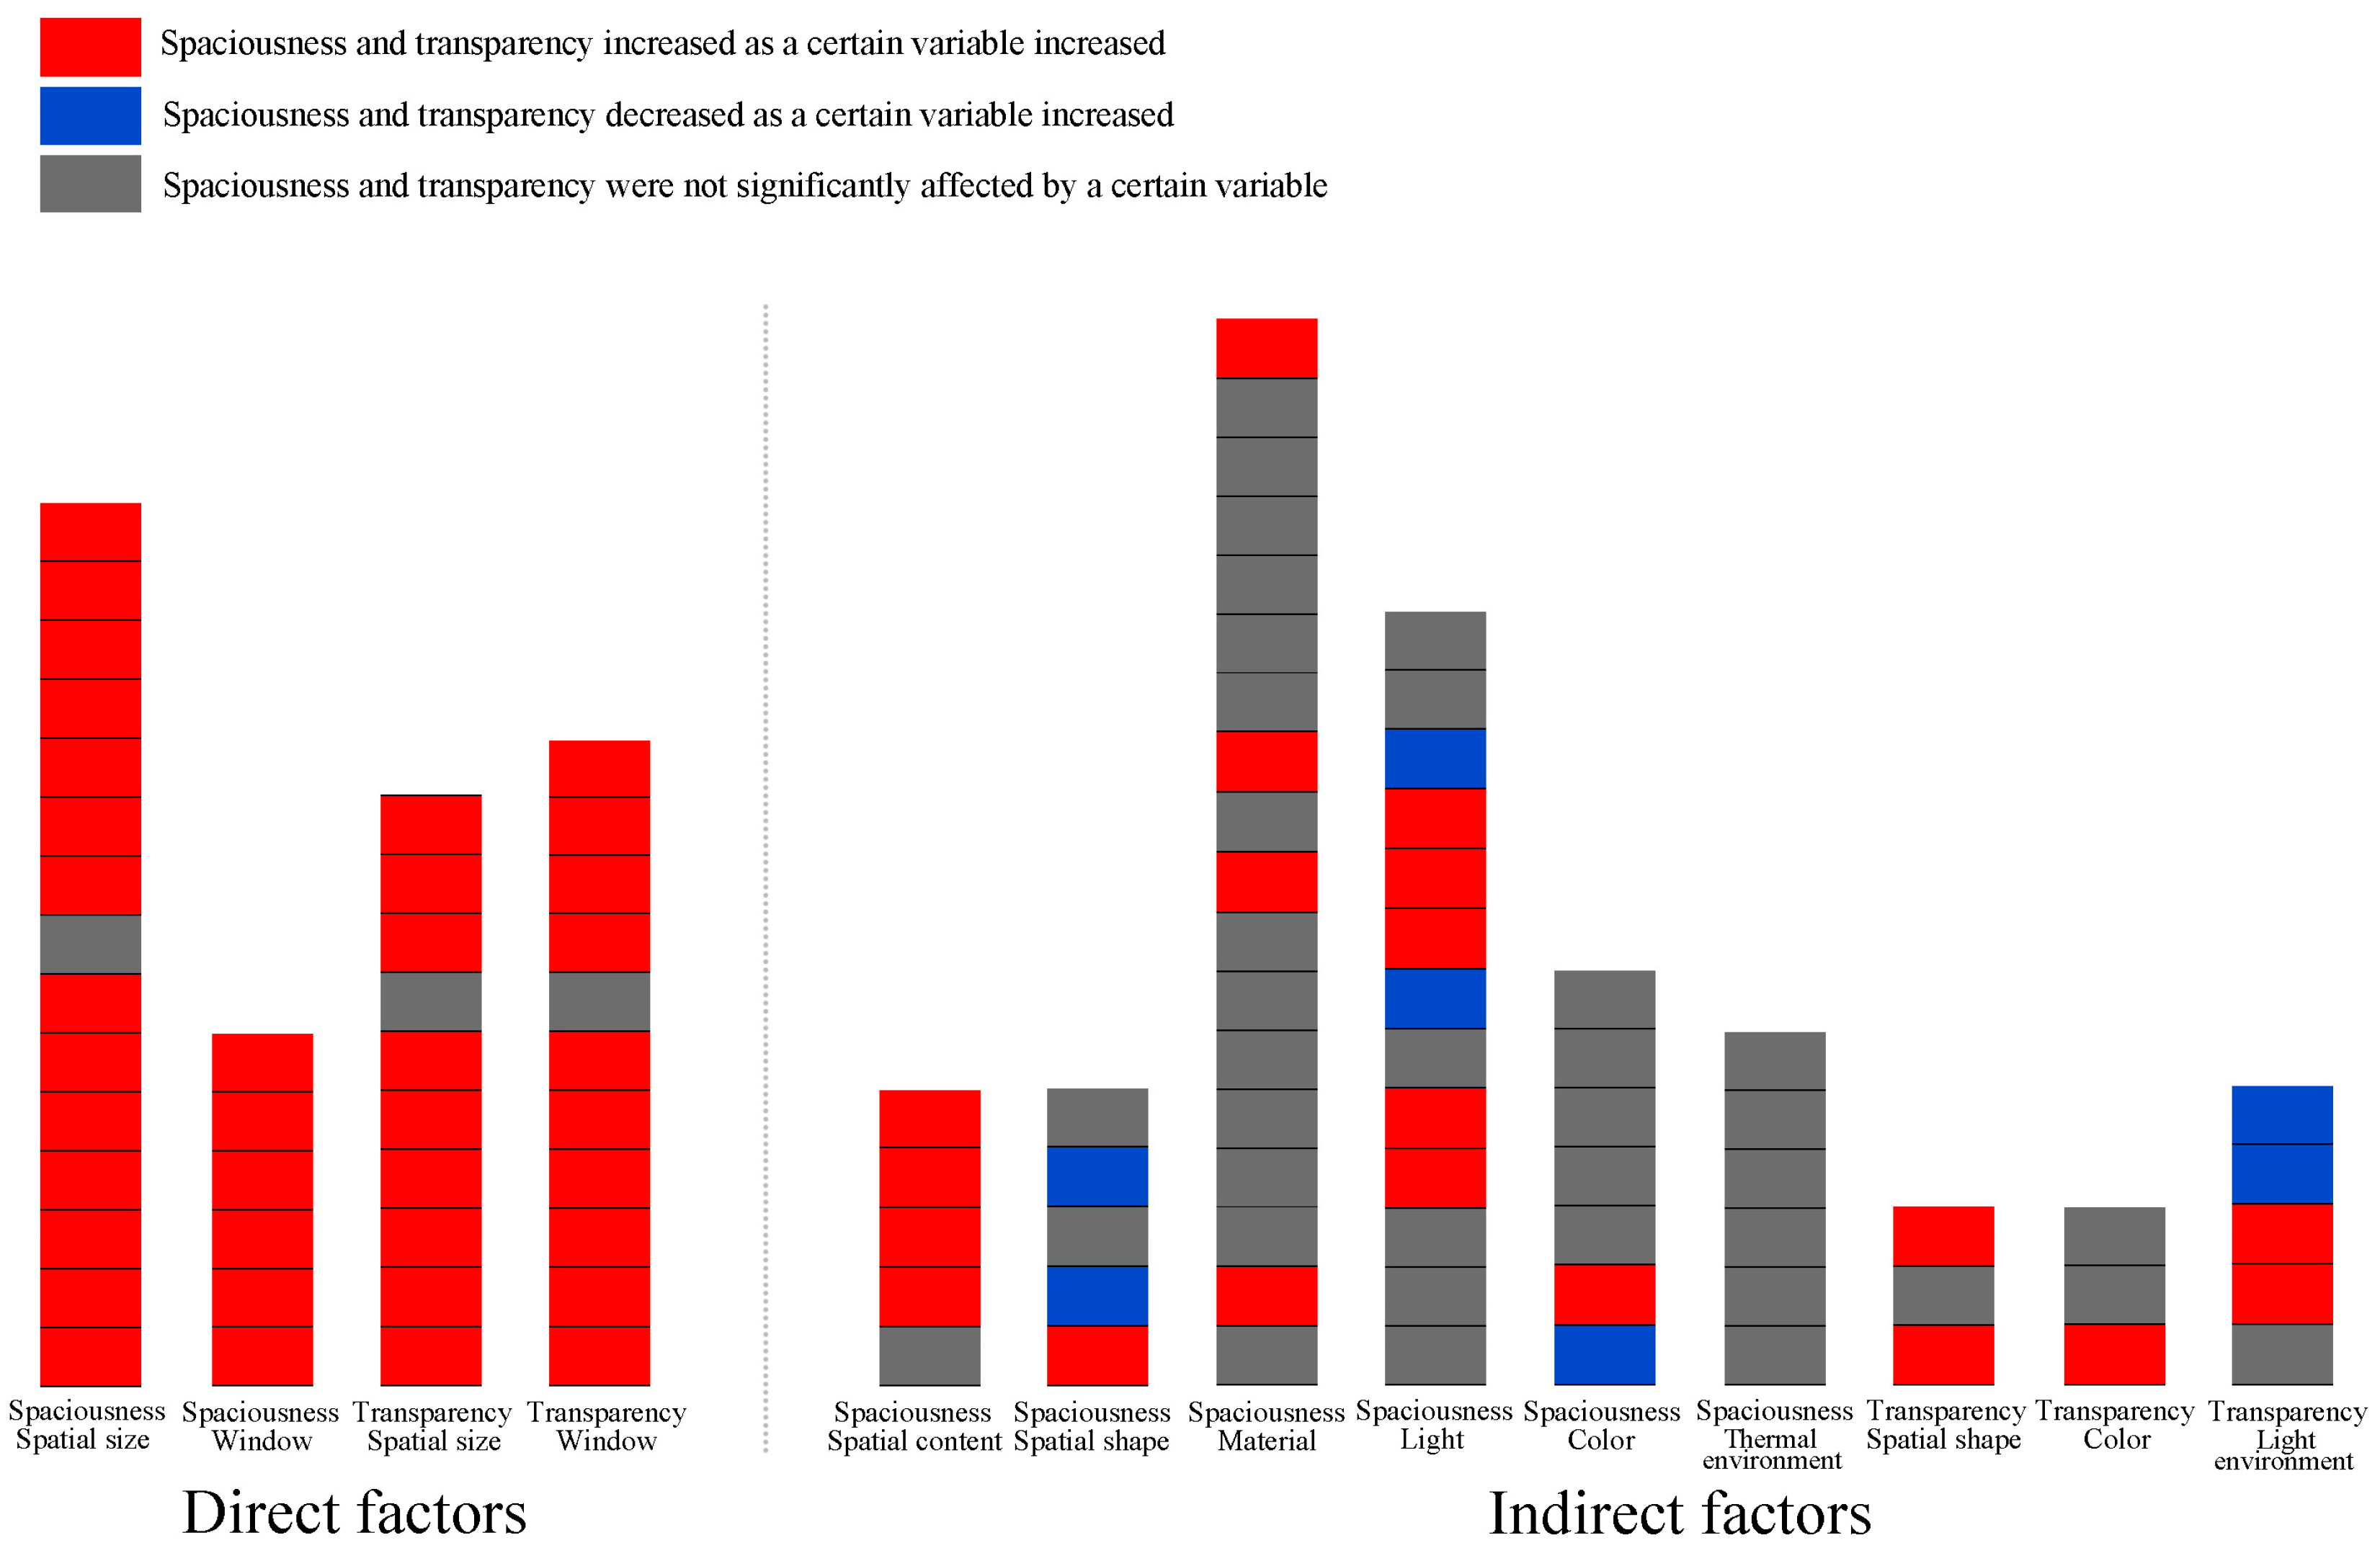
Previous studies addressed numerous factors influencing perceived spaciousness and transparency. However, each experiment was conducted in different spatial contexts, and the ranges of independent variables vary greatly, which limited the possibility of secondary analysis in this study. To address this, the present study adopted a more straightforward method for conducting comparisons. Specifically, if an experiment indicated that perceived spaciousness and transparency increased with a particular independent variable, this result was marked in red in the conclusion column. If it decreased, it was marked in blue, and if there was no effect, it was marked in gray. For categorical variables, such as color or material, the first instance of an independent variable change leading to increased spaciousness or transparency was marked in red; if the same change later led to a decrease, it was marked in blue, and if there was no effect, it remained gray. This approach enables preliminary integration and organization of the influencing factors identified in previous research.
The color labeling in the experimental conclusion column (summarized in Figure 15) revealed a clear distinction between influencing factors, which can be categorized into two groups: Direct and indirect factors. Direct factors, including space size and window proportion, directly change the physical spaciousness and transparency of a space. In related studies, the experimental results for physical indicators as independent variables were highly consistent, as reflected in the uniform color blocks in the conclusion column, with only a few non-significant cases organized in the left half of Figure 15. Indirect factors, including spatial content, spatial shape, materials, lighting, color, and thermal environment, do not directly affect the physical spaciousness and transparency of a space. In studies involving these factors, the experimental results were much more inconsistent, as shown by the mix of red and blue color blocks, along with many non-significant findings, compiled in the right half of Figure 15. These indirect factors play different roles in varying spatial environments, and the experimental outcomes are highly dependent on the spatial context and the ranges of independent variables.
Figure 15.
Comparison of research conclusions on factors influencing perceived spaciousness and transparency.
For example, Okken conducted an experiment involving 90 participants to assess perceived spaciousness under different lighting conditions. The study utilized a “low-threat space” (a medical consultation room where the patient received a non-serious diagnosis) and a “high-threat space” (a consultation room where the patient received an uncertain diagnosis, causing concern). Results showed that in the “high-threat space,” the bright room (60% brighter than the dark room) was perceived as more spacious (bright room: 3.44 > dark room: 2.83, p < 0.05). However, in the “low-threat space,” there was no significant difference between the two, with the dark room being perceived as slightly more spacious (bright room: 3.44 < dark room: 3.64, p > 0.05) [30].
Meagher and Marsh explored the impact of spatial content on perceived spaciousness by comparing three types of rooms: An empty room, a room with a functional layout, and a room with a disorderly arrangement. They found that the disorderly room felt significantly more confined than both the empty room (3.63 < 4.54, p < 0.05) and the functionally arranged room (3.63 < 4.32, p = 0.014), but there was no significant difference between the functionally arranged room and the empty room (4.32 < 4.54, p = 0.559) [27].
Xu investigated the effects of different colors (white, red, and blue) on perceived spaciousness and transparency using 32 participants in three spatial areas: 6 m × 6 m, 12 m × 12 m, and 24 m × 24 m. For perceived spaciousness, in the 6 m × 6 m space, the red room was perceived as the most confined (p = 0.01), while in the 12 m × 12 m and 24 m × 24 m spaces, color had no effect on perceived spaciousness. Regarding perceived transparency, the red room reduced transparency only in the 6 m × 6 m space (p = 0.009), while in the 12 m × 12 m (p = 0.703) and 24 m × 24 m (p = 0.940) spaces, transparency was not affected by room color [24].
A brighter space does not inherently feel more spacious; however, in a “high-threat” situation, a reasonable increase in brightness can make the space feel “more favorable,” thus affecting the perception of spaciousness [30]. Similarly, the presence of spatial content does not necessarily make a space feel more confined; a well-organized layout will not reduce perceived spaciousness [27]. Additionally, not all red spaces feel more confined and enclosed; in smaller spaces, red may evoke a sense of discomfort or irrationality, leading to changes in perceived spaciousness and transparency [24].
Considering the analysis of conclusion consistency and findings from previous research, it becomes evident that the influence of indirect factors on perceived spaciousness and transparency cannot be attributed solely to fixed physical indices. Instead, it leans more toward users’ interpretation and experience of the space within a particular environment. This further reinforces the conclusions of this study.
4.3. Enhancing Spatial Perception Through Acoustic Design
The present study found that the acoustic environment significantly influences the perception of architectural space. In addition to noise reduction and sound insulation, designers can use the acoustic environment to enhance spatial perceptions. For perceived spaciousness, creating soundscapes that align with user preferences and suit the architectural space (such as soothing music) can be effective. To enhance transparency, creating an internal acoustic environment that resonates with users’ preferences and is compatible with the natural environment and external sounds (such as outdoor nature sounds or urban sounds) can improve the perception of transparency. Designs should be tailored to users’ spatial preferences and perceptions, taking into account both psychological and perceptual dimensions.
4.4. Limitations
Potential limitations of this study arise from the setting of the independent variables, the homogeneity of the participants, and the controlled environment of the experiment. First, the primary aim of this study was to explore the overall influence of the sound environment on spatial perception. Given the scope of the experiment, each independent variable was categorized as a second to fourth order factor; more detailed research can be conducted in future studies. Second, the sample in this study consisted solely of students from Tianjin University, which resulted in a relatively homogeneous group in terms of demographic characteristics. To improve the generalizability of the findings, future experiments should include participants from a broader range of demographic backgrounds. Finally, the controlled laboratory environment may limit the generalizability of the results to real-space experiences. The artificial nature of the indoor space and the limitations of VR technology may affect the validity of the findings; further studies in more naturalistic settings are needed to validate these results.
4.5. Future Research Directions
Future research could build on this study by increasing both the number and diversity of participants, as well as conducting long-term studies in natural environments to improve the generalizability of the findings. Additionally, exploring a wider range of spaces and environments, along with diversifying audio and visual stimuli with varying characteristics, would offer a more comprehensive understanding of the acoustic environment’s impact. Finally, translating these insights into actionable design guidelines for architects and designers could significantly strengthen the practical impact of this research.
5. Conclusions
In summary, the present study investigates the influence of the sound environment on perceived spaciousness and transparency. Given the limited scope of the current study, the conclusions should be seen as informed decisions based on the available data.
Building on these considerations, the key findings are as follows:
(1) Perceived spaciousness and transparency are significantly influenced by sound type. Spaciousness is perceived as most expansive when soothing music is played, and most confined when crowd noise is introduced. Perceived transparency is most transparent with soothing music and most enclosed with footsteps or traffic noise.
(2) Perceived spaciousness is not influenced by sound pressure level (SPL) and reverberation time (RT). However, perceived transparency is significantly influenced by SPL, but not by RT.
(3) The influence of the acoustic environment on perceived spaciousness is independent of spatial size and spatial content (visual cues related to spaciousness). The influence of the acoustic environment on perceived transparency is independent of spatial function. However, there is an interaction between SPL, window proportion, and spatial size. Unlike sound type, which plays a key role in perceived transparency across different space sizes and window proportions, SPL only influences spaces with standard window proportions and small spaces, where transparency decreases as SPL increases.
Moreover, there is a strong positive correlation between perceived spaciousness and building spatial environment preference. Mediation analysis indicates that the effect of sound type on perceived spaciousness is partially mediated by building spatial environment preference. Likewise, there is a strong positive correlation between perceived transparency, building spatial environment preference, and the degree of alignment (the degree to which the architectural space’s acoustic environment aligns with the outdoor environment). Mediation analysis reveals that the effect of sound type on perceived transparency is partially mediated by building spatial environment preference and the degree of alignment.
Additionally, the literature review reveals that many similar conclusions exist regarding other indirect influencing factors, such as spatial content, shape, materials, lighting, color, and thermal environment. Their impact on perceived spaciousness and transparency is based on subjective experiences and feelings in specific contexts, rather than on specific physical indicators. This field warrants further exploration.
This study deepens the understanding of how acoustic environments influence spatial perception, particularly spaciousness and transparency. The findings suggest a more comprehensive approach to sound environment design, integrating user preferences and the interaction between sound and visual elements. It provides designers with additional considerations, complementing the crucial goals of achieving optimal acoustic response and comfort.
Author Contributions
Conceptualization, X.L. and J.K.; methodology, X.L., H.M., and C.W.; software, X.L. and C.W.; investigation, X.L.; resources, J.K.; data curation, X.L.; writing—original draft preparation, X.L.; writing—review and editing, H.M. and C.W.; visualization, X.L.; supervision, J.K.; project administration, J.K. and H.M. All authors have read and agreed to the published version of the manuscript.
Funding
This work was supported by the National Key Research and Development Program of China (2024YFC3809203 in 2024YFC3809200).
Data Availability Statement
The data presented in this study are available on request from the corresponding author, the data are not publicly available due to privacy.
Conflicts of Interest
The authors declare that they have no known competing financial interests or personal relationships that could have appeared to influence the work reported in this paper.
Appendix A. Summary of Relevant Research on the Factors Influencing Perceived Spaciousness
Table A1.
Experimental data related to the spaciousness experiment.
Appendix B. Summary of Relevant Research on the Factors Influencing Perceived Transparency
Table A2.
Experimental data related to the transparency experiment.
References
- Schweiker, M.; Ampatzi, E.; Andargie, M.S.; Andersen, R.K.; Azar, E.; Barthelmes, V.M.; Berger, C.; Bourikas, L.; Carlucci, S.; Chinazzo, G.; et al. Review of multi-domain approaches to indoor environmental perception and behavior. Build. Environ. 2020, 176, 106804. [Google Scholar] [CrossRef] [Scilit]
- Acun, V.; Yilmazer, S. A grounded theory approach to investigate the perceived soundscape of open-plan offices. Appl. Acoust. 2018, 131, 28–37. [Google Scholar] [CrossRef] [Scilit]
- Acun, V.; Yilmazer, S. Combining Grounded Theory (GT) and Structural Equation Modelling (SEM) to analyze indoor soundscape in historical spaces. Appl. Acoust. 2019, 155, 515–524. [Google Scholar] [CrossRef] [Scilit]
- Meng, Q.; Jiang, J.; Liu, F.; Xu, X. Effects of the musical sound environment on communicating emotion. Int. J. Environ. Res. Public Health 2020, 17, 2499. [Google Scholar] [CrossRef] [Scilit] [PubMed]
- Marquis-Favre, C.; Premat, E.; Aubrée, D. Noise and its effects—A review on qualitative aspects of sound. Part II: Noise annoyance. Acta Acust. United Acust. 2005, 91, 626–642. [Google Scholar]
- Alvarsson, J.J.; Wiens, S.; Nilsson, M.E. Stress recovery during exposure to nature sound and environmental noise. Int. J. Environ. Res. Public Health 2010, 7, 1036–1046. [Google Scholar] [CrossRef] [Scilit]
- Medvedev, O.; Shepherd, D.; Hautus, M.J. The restorative potential of soundscapes: A physiological investigation. Appl. Acoust. 2015, 96, 20–26. [Google Scholar] [CrossRef] [Scilit]
- Ma, H.; Shu, S. An experimental study: The restorative effect of soundscape elements in a simulated open-plan office. Acta Acust. United Acust. 2018, 104, 106–115. [Google Scholar] [CrossRef] [Scilit]
- Su, H.; Ma, H.; Wang, C. Effects of soundscape on Chinese children’s social interaction measured by self-reported behavioral expectations. Appl. Acoust. 2023, 207, 109350. [Google Scholar] [CrossRef] [Scilit]
- Meng, Q.; Zhang, S.; Kang, J. Effects of typical dining styles on conversation behaviours and acoustic perception in restaurants in China. Build. Environ. 2017, 121, 148–157. [Google Scholar] [CrossRef] [Scilit]
- Holl, S.; Pallasmaa, J.; Alberto, P. Questions of Perception: Phenomenology of Architecture; William Stout Publishers: San Francisco, CA, USA, 2006. [Google Scholar]
- Zumthor, P. Atmospheres: Architectural Environments—Surrounding Objects; Birkhäuser GmbH: Basel, Switzerland, 2006. [Google Scholar]
- Alvarez-Morales, L.; Díaz-Andreu, M. Acoustics, soundscapes and sounds as intangible heritage. Acoustics 2024, 2, 408–412. [Google Scholar] [CrossRef] [Scilit]
- Fratoni, G.; Hamilton, B.; D’Orazio, D. Rediscovering the acoustics of a XII-Century Rotunda through FDTD simulation. In Proceedings of the 2021 Immersive and 3D Audio: From Architecture to Automotive (I3DA), Bologna, Italy, 8–10 September 2021; pp. 1–8. [Google Scholar]
- Carvalho, P.; Morgado, E.; Henrique, L. Relationships between subjective and objective acoustical measures in churches. Build. Acoust. 1997, 4, 1–20. [Google Scholar] [CrossRef] [Scilit]
- Mattern, S. Resonant texts: Sounds of the American public library. Senses Soc. 2007, 2, 277–302. [Google Scholar] [CrossRef] [Scilit]
- Torresin, S.; Aletta, F.; Babich, F.; Bourdeau, E.; Harvie-Clark, J.; Kang, J.; Lavia, L.; Radicchi, A.; Albatici, R. Acoustics for supportive and healthy buildings: Emerging themes on indoor soundscape research. Sustainability 2020, 12, 6054. [Google Scholar] [CrossRef] [Scilit]
- Jones, P.B.; Kang, J. Acoustic form in the Modern Movement. arq Archit. Res. Q. 2003, 7, 75–85. [Google Scholar] [CrossRef] [Scilit]
- Liu, X.; Kang, J.; Ma, H.; Wang, C. Comparison between architects and non-architects on perceptions of architectural acoustic environments. Appl. Acoust. 2021, 184, 108313. [Google Scholar] [CrossRef] [Scilit]
- Stamps, A.E. Effects of area, height, elongation, and color on perceived spaciousness. Environ. Behav. 2011, 43, 252–273. [Google Scholar] [CrossRef] [Scilit]
- Stamps, A.E.; Krishnan, V. Spaciousness and boundary roughness. Environ. Behav. 2006, 38, 841–872. [Google Scholar] [CrossRef] [Scilit]
- Stamps, A.E. Evaluating spaciousness in static and dynamic media. Des. Stud. 2007, 28, 535–557. [Google Scholar] [CrossRef] [Scilit]
- Bokharaei, S.; Nasar, J.L. Perceived spaciousness and preference in sequential experience. Hum. Factors 2016, 58, 1069–1081. [Google Scholar] [CrossRef] [Scilit]
- Xu, H. A Study on Public Building Indoor Environment Perception and Its Influence on Behavior in a Comprehensive Way. Ph.D. Dissertation, Tianjin University, Tianjin, China, 2017. [Google Scholar]
- Cha, H.; Koo, C.; Kim, W.; Hong, T. Spatial perception of ceiling height and type variation in immersive virtual environments. Build. Environ. 2019, 163, 106285. [Google Scholar] [CrossRef] [Scilit]
- Stamps, A.E. Effects of permeability on perceived enclosure and spaciousness. Environ. Behav. 2010, 42, 864–886. [Google Scholar] [CrossRef] [Scilit]
- Meagher, R.; Marsh, L. Testing an ecological account of spaciousness in real and virtual environments. Environ. Behav. 2015, 47, 782–815. [Google Scholar] [CrossRef] [Scilit]
- Wang, C. Experimental Studies on the Effect of Material Texture on Spatial Scale Perception. Ph.D. Dissertation, Dalian University of Technology, Dalian, China, 2021. [Google Scholar]
- Stamps, A.E. Elongation and enclosure. Percept. Mot. Ski. 2005, 101, 303–308. [Google Scholar] [CrossRef] [Scilit]
- Okken, V.; Rompay, T.; Pruyn, A. When the world is closing in: Effects of perceived room brightness and communicated threat during patient-physician interaction. HERD Health Environ. Res. Des. J. 2013, 7, 37–53. [Google Scholar] [CrossRef] [Scilit]
- Wang, C.; Lu, W.; Ohno, R.; Gu, Z. Effect of wall texture on perceptual spaciousness of indoor space. Int. J. Environ. Res. Public Health 2020, 17, 4177. [Google Scholar] [CrossRef] [Scilit]
- Altomonte, S.; Allen, J.; Bluyssen, M.; Brager, G.; Heschong, L.; Loder, A.; Schiavon, S.; Veitch, J.A.; Wang, L.; Wargocki, P. Ten questions concerning well-being in the built environment. Build. Environ. 2020, 180, 106949. [Google Scholar] [CrossRef] [Scilit]
- Gelder, B.; Vroomen, J. The perception of emotions by ear and by eye. Cogn. Emot. 2000, 14, 289–311. [Google Scholar] [CrossRef] [Scilit]
- Liu, C.; Kang, J.; Xie, H. Effect of sound on visual attention in large railway stations: A case study of St. Pancras railway station in London. Build. Environ. 2020, 185, 107177. [Google Scholar] [CrossRef] [Scilit]
- Chen, J.; Ma, H. A conceptual model of the healthy acoustic environment: Elements, framework, and definition. Front. Psychol. 2020, 11, 554285. [Google Scholar] [CrossRef] [Scilit]
- Appleton, J. The Experience of Landscape; John Wiley and Sons: New York, NY, USA, 1975. [Google Scholar]
- Dosen, A.; Ostwald, M. Prospect and refuge theory: Constructing a critical definition for architecture and design. Int. J. Des. Soc. 2013, 6, 9–23. [Google Scholar] [CrossRef] [Scilit]
- Mostafavi, M.; Leatherbarrow, D. On Weathering: The Life of Buildings in Time; MIT Press: Cambridge, UK, 1993. [Google Scholar]
- Stamps, A.E. Isovists, enclosure, and permeability theory. Environ. Plan. B Plan. Des. 2005, 32, 735–762. [Google Scholar] [CrossRef] [Scilit]
- Ewing, R.; Clemente, O. Measuring Urban Design: Metrics for Livable Places; Island Press: Washington, DC, USA, 2013. [Google Scholar]
- Vartanian, O.; Navarrete, G.; Chatterjee, A.; Fich, L.B.; Gonzalez-Mora, J.L.; Leder, H.; Modroño, C.; Nadal, M.; Rostrup, N.; Skov, M. Architectural design and the brain: Effects of ceiling height and perceived enclosure on beauty judgments and approach-avoidance decisions. J. Environ. Psychol. 2015, 41, 10–18. [Google Scholar] [CrossRef] [Scilit]
- JGJ 39-2016; National Standard of the People’s Republic of China—Code for Design of Nursery and Kindergarten Buildings. Ministry of Housing and Urban-Rural Development of the People’s Republic of China: Beijing, China, 2019.
- Franz, G.; Heyde, M.; Bülthoff, H. An empirical approach to the experience of architectural space in virtual reality—Exploring relations between features and affective appraisals of rectangular indoor spaces. Autom. Constr. 2005, 14, 165–172. [Google Scholar] [CrossRef] [Scilit]
- Ozdemir, A. The effect of window views’ openness and naturalness on the perception of rooms’ spaciousness and brightness: A visual preference study. Sci. Res. Essays 2010, 5, 2275–2287. [Google Scholar]
- Hur, M.; Nasar, J.L.; Chun, B. Neighborhood satisfaction, physical and perceived naturalness and openness. J. Environ. Psychol. 2010, 30, 52–59. [Google Scholar] [CrossRef] [Scilit]
- Calhoun, B. Population density and social pathology. Sci. Am. 1962, 206, 139–149. [Google Scholar]
- Loewen, L.; Steel, G.; Suedfeld, P. Perceived safety from crime in the urban environment. J. Environ. Psychol. 1993, 13, 323–331. [Google Scholar] [CrossRef] [Scilit]
- Meyers, J.; Zhu, R. The influence of ceiling height: The effect of priming on the type of processing that people use. J. Consum. Res. 2007, 34, 174–186. [Google Scholar] [CrossRef] [Scilit]
- Architectural Design Dataset Editorial Board. Architectural Design Dataset; China Architecture & Building Press: Beijing, China, 1994. [Google Scholar]
- Stamps, A.E. Enclosure and safety in urbanscapes. Environ. Behav. 2005, 37, 102–133. [Google Scholar] [CrossRef] [Scilit]
- Chakrabarty, N.; Lakshman, A.; Gupta, K.; Bhatnagar, A. Visual challenges among drivers: A case study in Delhi, India. International Journal of Innovative Research in Science. Eng. Technol. 2013, 2, 3074–3083. [Google Scholar]
- Barfield, W.; Rosenberg, C.; Furness, A. Situation awareness as a function of frame of reference, computer-graphics eyepoint elevation, and geometric field of view. Int. J. Aviat. Psychol. 1995, 5, 233–256. [Google Scholar] [CrossRef] [Scilit]
- Lavandier, C.; Defréville, B. The contribution of sound source characteristics in the assessment of urban soundscapes. Acta Acust. United Acust. 2006, 92, 912–921. [Google Scholar]
- Nilsson, E.; Alvarsson, J.; Radsten-Ekman, M.; Bolin, K. Auditory masking of wanted and unwanted sounds in a city park. Noise Control Eng. J. 2010, 58, 524–531. [Google Scholar] [CrossRef] [Scilit]
- Meng, Z. Research on the acoustical psychology of reverberation perception. Appl. Acoust. 2013, 32, 81–90. [Google Scholar]
- David, M.; George, M. Introduction to the Practice of Statistics; W H Freeman/Times Books/Henry Holt & Co.: New York, NY, USA, 1989. [Google Scholar]
- Bülthoff, H.; Veen, H. Vision and Action in Virtual Environments: Modern Psychophysics in Spatial Cognition Research; Max Planck Institute for Biological Cybernetics: Tübingen, Germany, 2000; Technical Report No. 77. [Google Scholar]
- Watanabe, K.; Shimojo, S. When sound affects vision: Effects of auditory grouping on Visual Motion Perception. Psychol. Sci. 2001, 12, 109–116. [Google Scholar] [CrossRef] [Scilit]
- Schneider, W.; Eschman, A.; Zuccolotto, A. E-Prime 2.0; Psychological Software Tools: Pittsburgh, PA, USA, 2002. [Google Scholar]
- ISO 3382-1:2009; Acoustics—Measurement of Room Acoustic Parameters—Part 1: Performance Spaces. International Organization for Standardization: Geneva, Switzerland, 2009.
- Morimoto, M. Auditory spaciousness and envelopment. In Proceedings of the 13th International Congress on Acoustics—Belgrade, Belgrade, Yugoslavia, 7–14 September 1989; Volume 2, pp. 215–218. [Google Scholar]
- John, B.; Gilbert, S. The influence of late-arriving energy on spatial impression. J. Acoust. Soc. Am. 1995, 97, 2263–2291. [Google Scholar] [CrossRef] [Scilit]
- Morimoto, M.; Iida, K.; Sakagami, K. The role of reflection from behind the listener in spatial impression. Appl. Acoust. 2001, 62, 109–124. [Google Scholar] [CrossRef] [Scilit]
- Barron, M.; Marshall, A. Spatial impression due to early lateral reflections in concert halls: The derivation of a physical measure. J. Sound Vib. 1981, 77, 211–232. [Google Scholar] [CrossRef] [Scilit]
- Bradley, S.; Soulodre, A. Objective measures of listener envelopment. J. Acoust. Soc. Am. 1995, 98, 2590–2597. [Google Scholar] [CrossRef] [Scilit]
- Cabrera, D.; Jeong, C.; Kwak, H.J.; Kim, J.-Y. Auditory room size perception for modeled and measured rooms. INTER-NOISE and NOISE-CON Congress and Conference Proceedings. Inst. Noise Control Eng. 2005, 2005, 2995–3004. [Google Scholar]



Disclaimer/Publisher’s Note: The statements, opinions and data contained in all publications are solely those of the individual author(s) and contributor(s) and not of MDPI and/or the editor(s). MDPI and/or the editor(s) disclaim responsibility for any injury to people or property resulting from any ideas, methods, instructions or products referred to in the content. |
© 2025 by the authors. Licensee MDPI, Basel, Switzerland. This article is an open access article distributed under the terms and conditions of the Creative Commons Attribution (CC BY) license (https://creativecommons.org/licenses/by/4.0/).