1. Introduction
Data centers are facilities that house IT (Information technology) equipment such as communication systems, computer systems, and storage devices, serving critical functions such as data storage, processing, and transmission. With the rapid growth of the AI market, the volume of internet data has surged, leading to an increase in the number of data centers in South Korea, which grew from 156 in 2020 to 187 in 2022 [
1]. Consequently, the total energy consumption of South Korean data centers is projected to rise from 1762 MWh in 2022 to 49,397 MWh by 2029 [
2]. As energy demand continues to grow, the need for effective energy-saving strategies in data centers has become increasingly urgent. The primary contributors to energy consumption in data centers are Information Technology (IT) equipment and the cooling system [
3]. The cooling system plays a critical role in dissipating the heat generated by IT equipment, which, if not adequately managed, can lead to equipment malfunction, data loss, and decreased operational reliability [
4]. Accordingly, cooling systems are essential for maintaining stable data center operation. However, these systems account for approximately 40% of the total energy consumption in data centers, highlighting the importance of strategies to reduce cooling energy use [
5].
In response to this, outdoor air (OA)-based cooling strategies, commonly known as economizer systems, have been widely adopted in data centers to improve energy efficiency. The purpose of introducing OA in data centers is to take advantage of favorable OA temperature and humidity conditions to minimize the operation of mechanical cooling systems. This approach helps reduce energy consumption while maintaining the thermal safety and reliability of IT equipment. These systems are generally categorized into air-side or water-side economizers [
6]. Air-side economizers directly introduce OA into the indoor environment (direct type) or use heat exchangers to indirectly cool return air (RA) (indirect type) [
7]. Although air-side economizers can significantly reduce mechanical cooling demand, their performance is affected by variations in OA humidity and air quality [
7]. Water-side economizers, typically employed in large-scale data centers, utilize OA to lower the temperature of chilled water, which is then used to cool the indoor environment through heat exchangers [
8]. While less sensitive to ambient air quality, water-side economizers require significant upfront investment due to the need for cooling towers and heat exchangers [
7].
Previous studies have explored various economizer-based strategies to reduce energy consumption in data centers.
Kim et al. [
9] evaluated the effects of supply air (SA) temperature and design airflow rate on energy consumption in a data center utilizing an air-side economizer. SA temperatures of 16, 20, and 24 °C were selected based on ASHRAE recommended conditions, with airflow rates of 230, 270, and 325 CMH/kW. The findings indicated that higher SA temperatures extended the duration during which OA could be utilized, thereby reducing cooling energy consumption. Additionally, reduced airflow resulted in lower fan energy demand. In this context, OA was introduced only when its temperature was lower than the RA temperature.
Kim et al. [
10] assessed energy use under varying OA operation modes in water-side economizers across four Korean cities—Seoul, Busan, Daegwallyeong, and Chuncheon. Connecting chillers and heat exchangers in the series yielded energy savings of up to 20%. The operation was controlled based on OA wet-bulb temperature.
Ali et al. [
11] examined air-side economizer performance using a dry-bulb temperature-based control across four distinct climates—Dubai, Stockholm, Singapore, and San Francisco. Substantial energy reductions were observed in Stockholm (86%) and San Francisco (76%), whereas energy consumption increased in Dubai (2%) and Singapore (4%) due to high ambient temperatures and humidity. The analysis was based on the criterion that OA is introduced only when the dry-bulb temperature is below 24 °C.
Kim et al. [
12] conducted a comparative analysis of three economizer configurations—direct air-side, indirect air-side, and water-side—across 15 regions, reporting that the indirect air-side economizer exhibited the highest energy-saving potential, with reductions of up to 40%. In the case of direct air-side economizer systems, OA can only be utilized when the SA dry-bulb temperature is within the range of 18 to 27 °C and the dew point temperature remains below 15 °C.
Park and Chang [
13] evaluated a multi-stage economizer system integrating both air-side and water-side economizers. The system was simulated across five major Korean cities, demonstrating energy savings of approximately 21% at a SA temperature of 13 °C and up to 32% at 25 °C. The air-side economizer was operated when the OA enthalpy was below 43.8 kJ/kg, the dry-bulb temperature was below 21.5 °C, and the dew point temperature was below 10.5 °C.
Lan et al. [
14] analyzed the impact of SA temperature and airflow on IT equipment inlet conditions and energy consumption using a fan-wall cooling system. While increased airflow and power raised the inlet air temperature, overall energy use was reduced by up to 34% with the fan-wall configuration.
Fan and Zhou [
15] proposed an optimized control algorithm for chillers and water-side economizers, demonstrating a 14.3% reduction in energy consumption relative to a baseline model, with the most effective scenario involving hourly control optimization.
Jin et al. [
16] evaluated the feasibility of applying water-side economizer systems in 34 cities across China, based on a data center in Chongqing with an 8270 kW design load. Free cooling was applied when the OA wet-bulb temperature fell below a threshold defined by the chilled water supply temperature, the cooling tower approach (typically 5 °C), and the heat exchanger temperature difference (1 °C). Under chilled water temperatures range of 21 to 27 °C, full free cooling was available in all cities, resulting in energy savings 3.17 times higher than those at 12/18 °C. However, water consumption increased in 74% of the cities. Both energy and water consumption showed a geographical trend—lower in the western and northern regions, and higher in the eastern and southern regions.
Park and Seo [
17] conducted a simulation study on a data center located in Seoul, South Korea, to evaluate the impact of exhaust air (EA) recirculation and SA temperature on the performance of air-side economizers. Thirteen cases were modeled by varying EA recirculation ratios (0%, 5%, 10%, and 15%) and SA temperature settings (13.5 °C, 18 °C, and 22 °C). The results showed that a 15% EA recirculation increased annual cooling energy consumption by up to 9% compared to the no-recirculation case, while raising the SA temperature to 22 °C reduced energy use by up to 67% compared to a central chilled-water system. OA was introduced based on temperature or enthalpy conditions, and was generally allowed when the OA temperature was below approximately 22 °C.
Previous studies have investigated various types of economizer systems, including air-side economizers [
9,
11,
14,
17], water-side economizers [
10,
15,
16], and integrated or multi-stage systems [
12,
13].
However, most of these studies did not attempt to determine the optimal OA intake dry-bulb temperature range for air-side economizer operation, often relying on fixed thresholds or guideline values without optimization.
As shown in
Table 1, the allowable OA intake temperature was either set equal to the RA temperature [
9] or fixed within a range, such as 21.5 °C to below 24 °C [
11,
12,
13,
17]. In addition to dry-bulb temperature control, some studies applied humidity-related constraints, such as enthalpy or dew point limits. However, study [
15] did not consider the inlet air temperature and humidity to IT equipment—factors critical for ensuring reliability and thermal safety. Moreover, studies [
10,
11,
12,
13,
14,
15] did not include analyses specific to ASHRAE Climate Zone 4A [
18], where hot-humid summers and cold winters significantly influence air-side economizer performance.
To address these limitations, this study evaluated the performance of a dry-bulb temperature–based an air-side economizer system using a small-to-medium-scale simulation-validated data center model located in Daejeon, South Korea—representative of ASHRAE Climate Zone 4A [
19]. This zone is classified as a mixed-humid region, characterized by at least 2000 heating degree days (base 18 °C), and hot, humid summers. The objective of this study is to identify the optimal OA intake dry-bulb temperature range and establish effective operational guidelines that improve energy efficiency while ensuring reliable environmental conditions for IT equipment.
3. Simulation Results and Analysis
3.1. Evaluation of OA Applicability by Case
Section 3.1 analyzed the allowable OA intake time for each case based on hourly outdoor dry-bulb temperature data from the IWEC2 weather file for Daejeon, South Korea [
22].
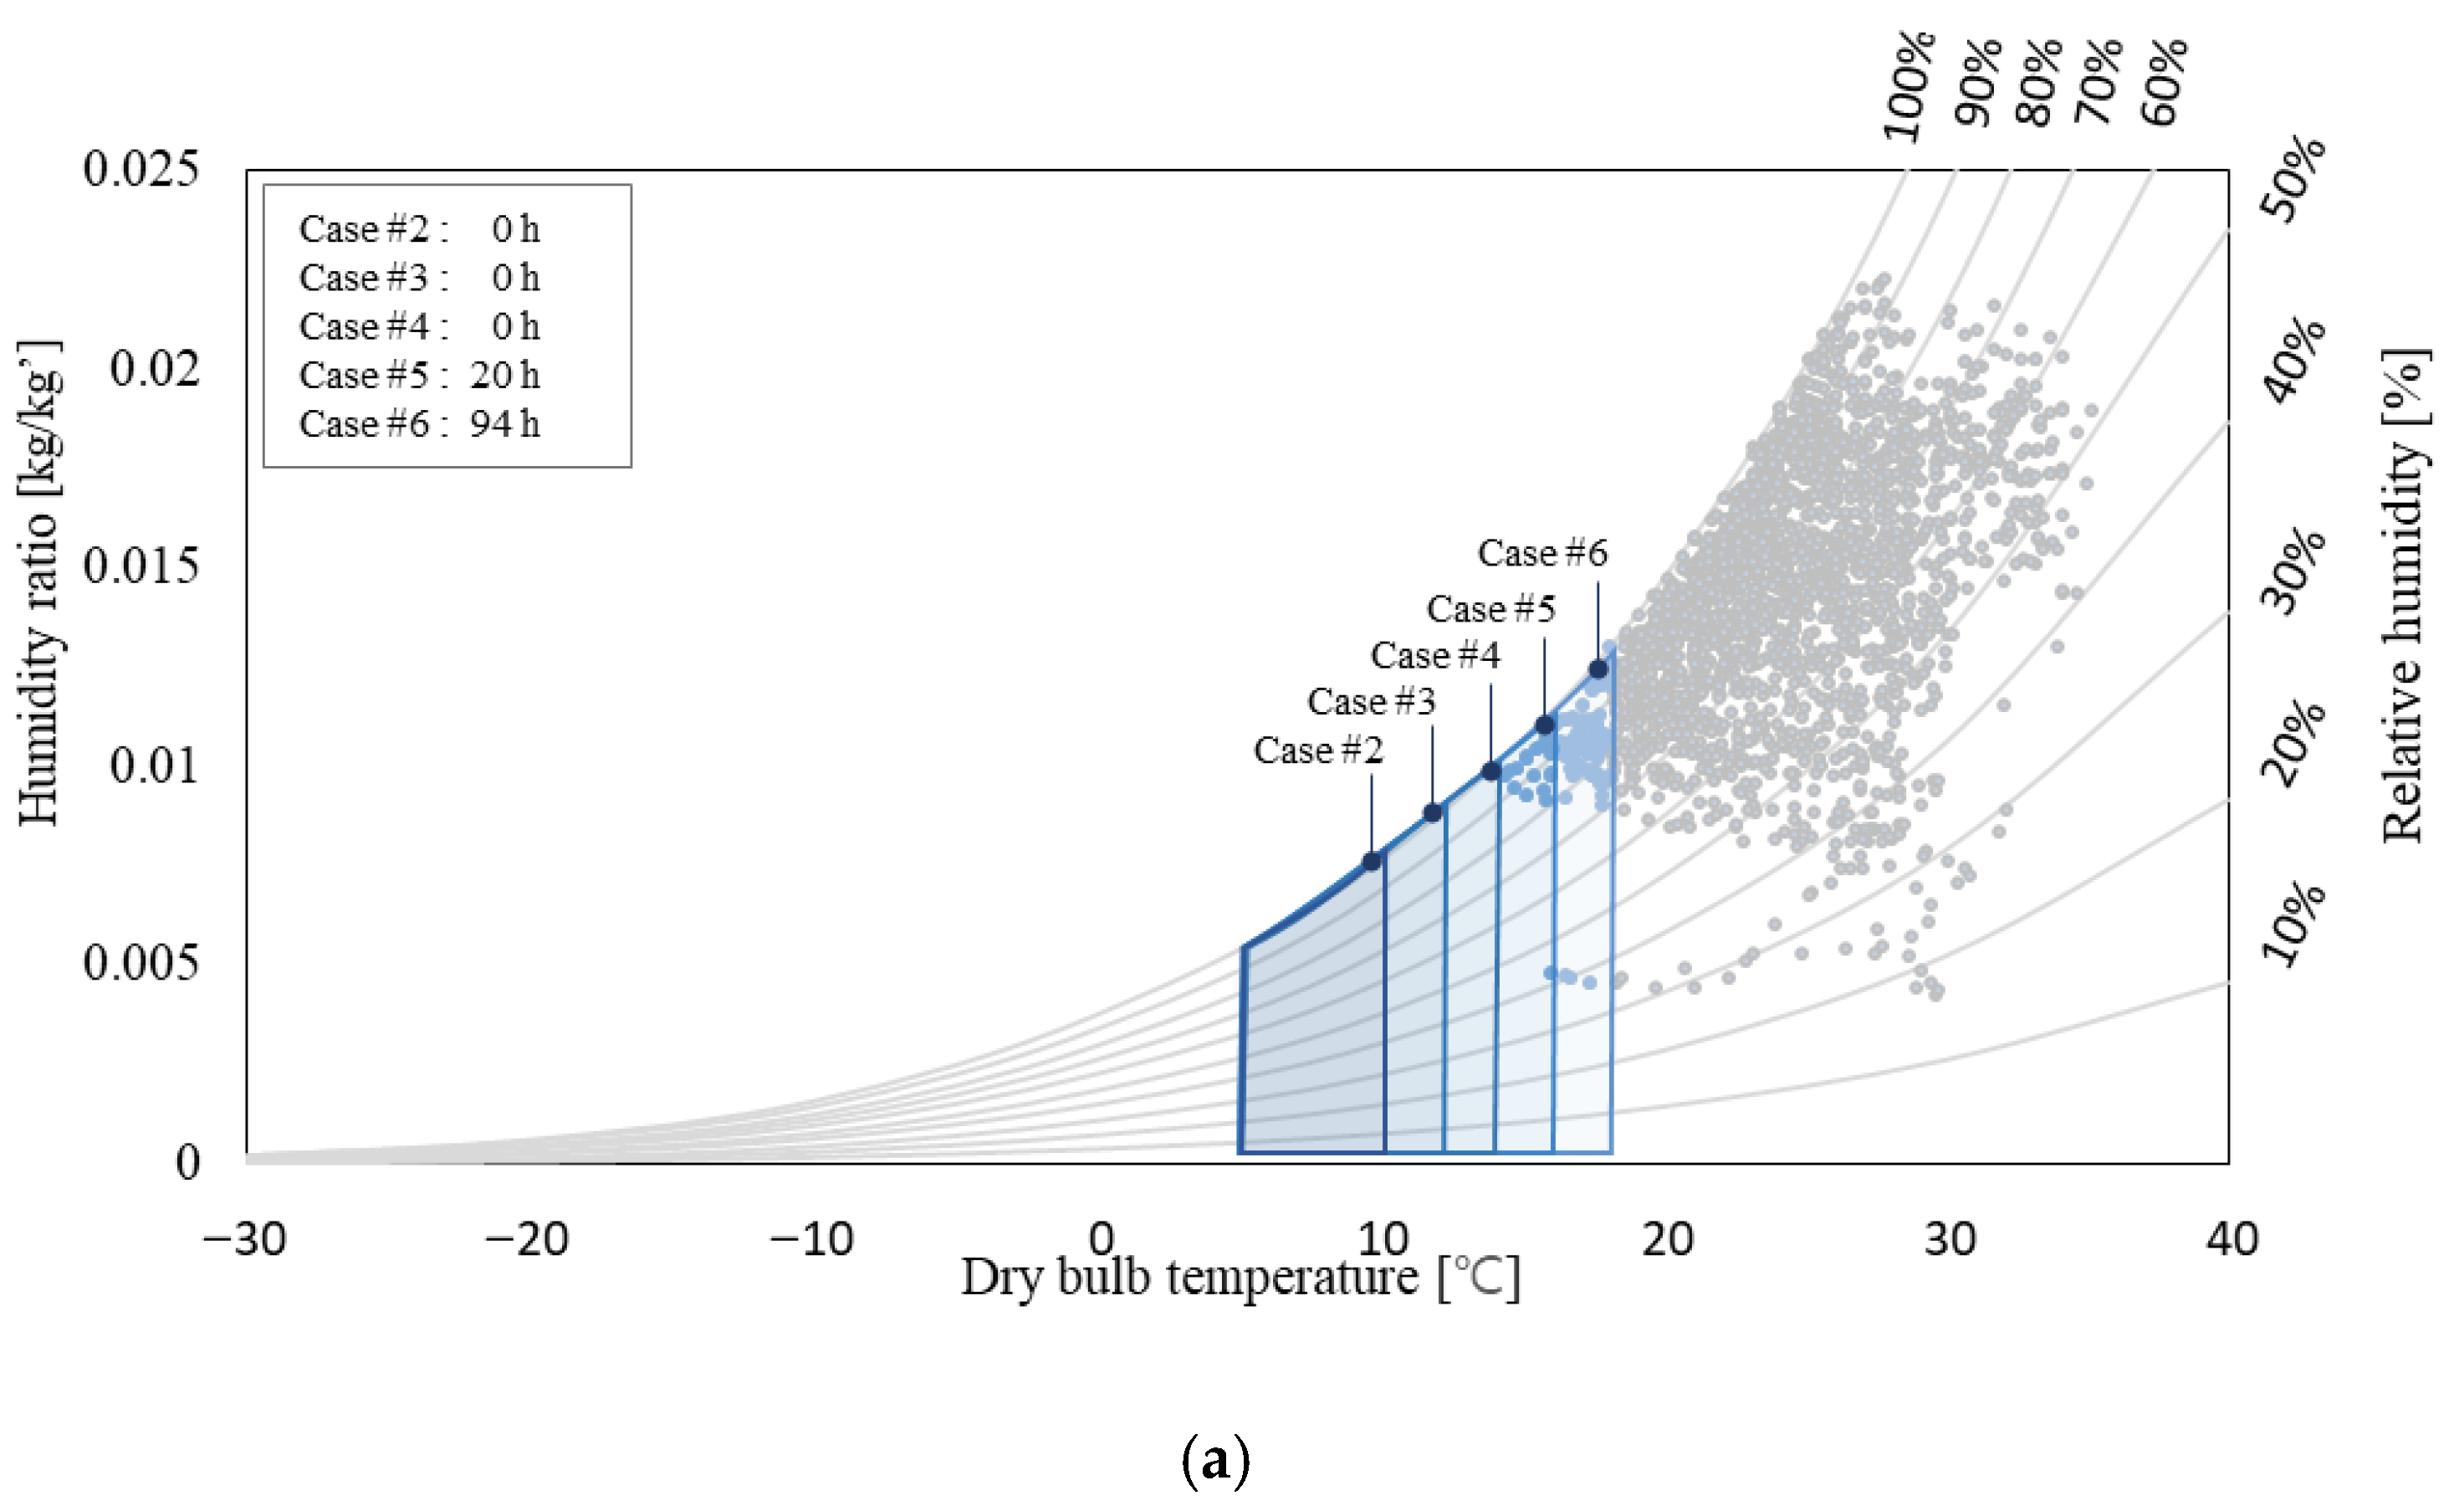
Figure 3 illustrated the OA conditions and the number of hours during which OA intake was allowed for each case across the summer season, interseason, and winter season periods. The summer season was defined as June to August (2208 h), the winter season as November to March (3624 h), and the interseason periods as April to May and September to October (2928 h).
In summer, the number of allowable hours intake was 94 for Case #6 and 20 for Case #5, out of 2208 total hours. No OA intake was allowed for Case #2 to Case #4 during this period. Only two cases permitted OA use in summer, suggesting the limited applicability of OA cooling in this season. This was because the OA temperatures rarely dropped below the upper intake thresholds (e.g., 14 °C or lower), which were defined for Cases #2 to #4, making OA intake infeasible under the given criteria.
In the interseason periods, Case #6 allowed 1668 h of OA intake, followed by Case #5 with 1329 h, Case #4 with 937 hours, and Case #3 with 624 hours. The percentage of allowable intake hours during the interseason period ranged from 11.71 to 45.39%.
In winter, Case #6 had 1,242 allowable hours, accounting for 56.25% of the total winter hours. Case #5 and Case #4 also showed more than 50% applicability, with 55.16% and 51.86%, respectively. Due to high dry-bulb temperatures, the OA intake potential in summer was limited, and the energy-saving effect was expected to be minimal. However, in the interseason periods and winter seasons, the allowable intake ratio ranged from 11 to 55%, indicating that OA could have significantly contributed to cooling energy reduction during these periods.
3.2. Analysis of Air Conditions at the IT Equipment Inlet
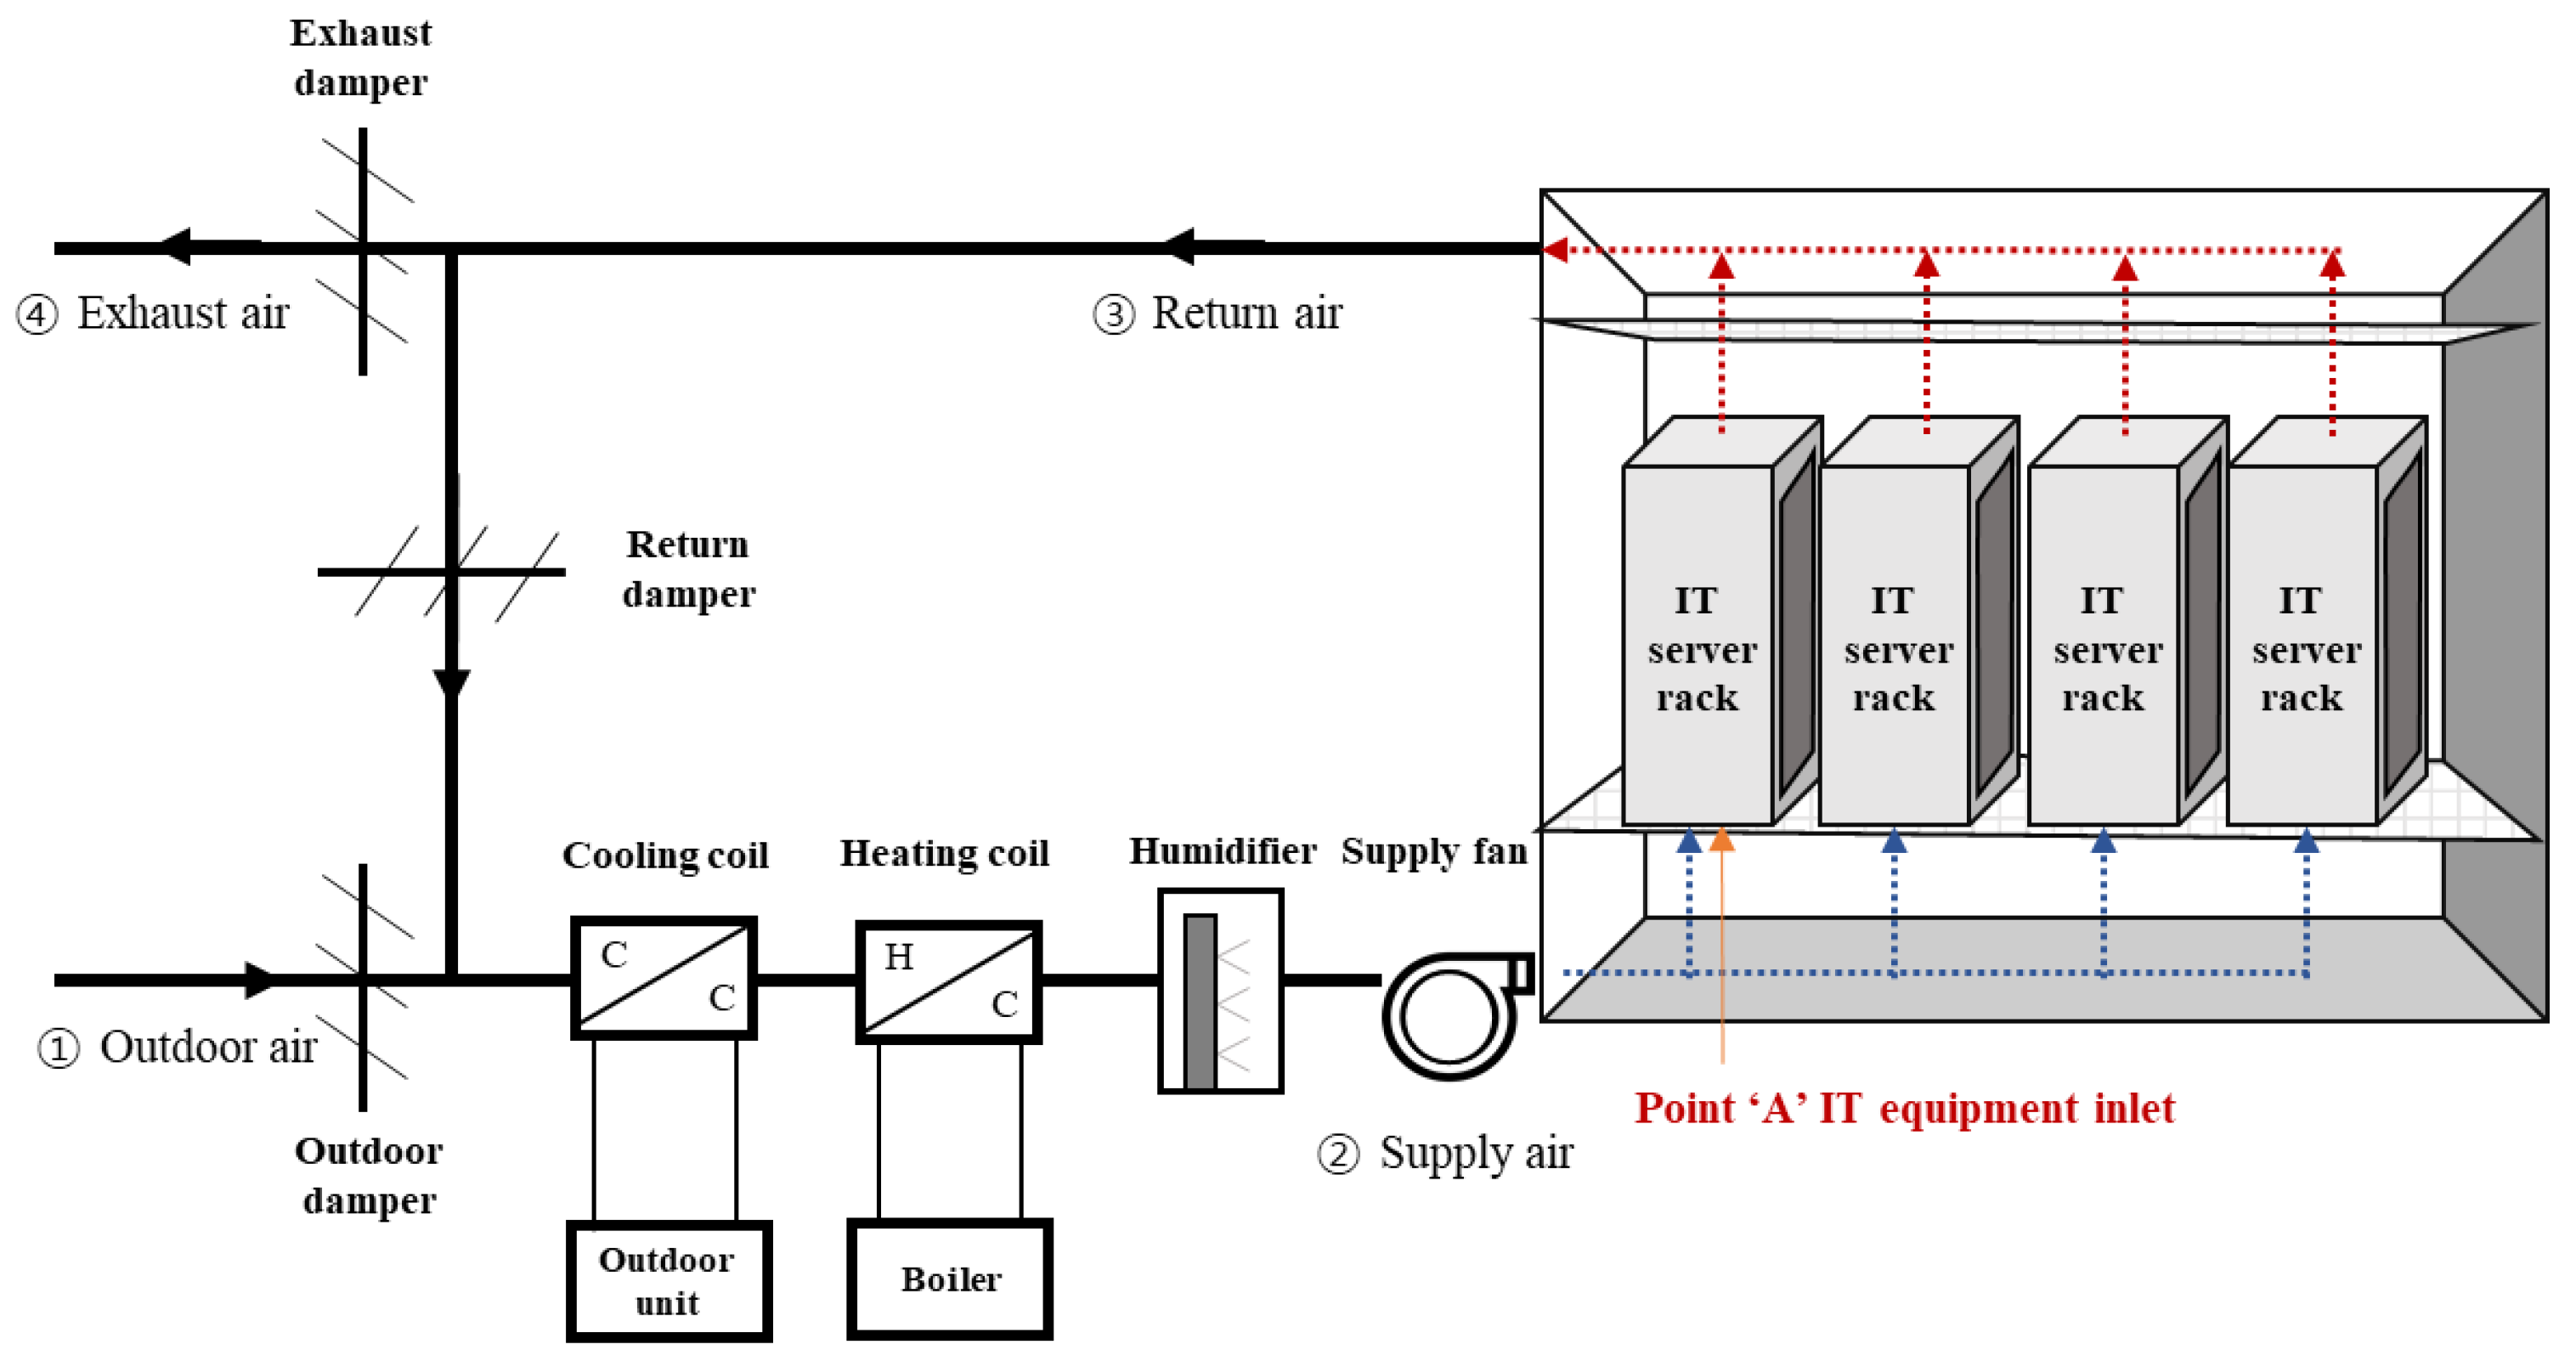
Section 3.2 evaluated the air condition at the inlet point of the IT equipment, which corresponds to Point ‘A’ in
Figure 2. In the simulation, this location was represented by a designated node in EnergyPlus.
All simulation cases were configured to maintain the inlet air temperature for the IT equipment within the ASHRAE TC 9.9 recommended dry-bulb temperature range of 18–27 °C. Since this condition was satisfied in all cases, the analysis primarily focused on evaluating humidity control performance, which showed greater variability across scenarios.
The relative humidity at this node was directly obtained using the standard output variables available for each node in EnergyPlus. ASHRAE TC 9.9 recommends that the humidity level at the IT equipment inlet be maintained below a dew point temperature of 15 °C or within a relative humidity of 60%. In this study, the air conditions were assessed based on the relative humidity criterion.
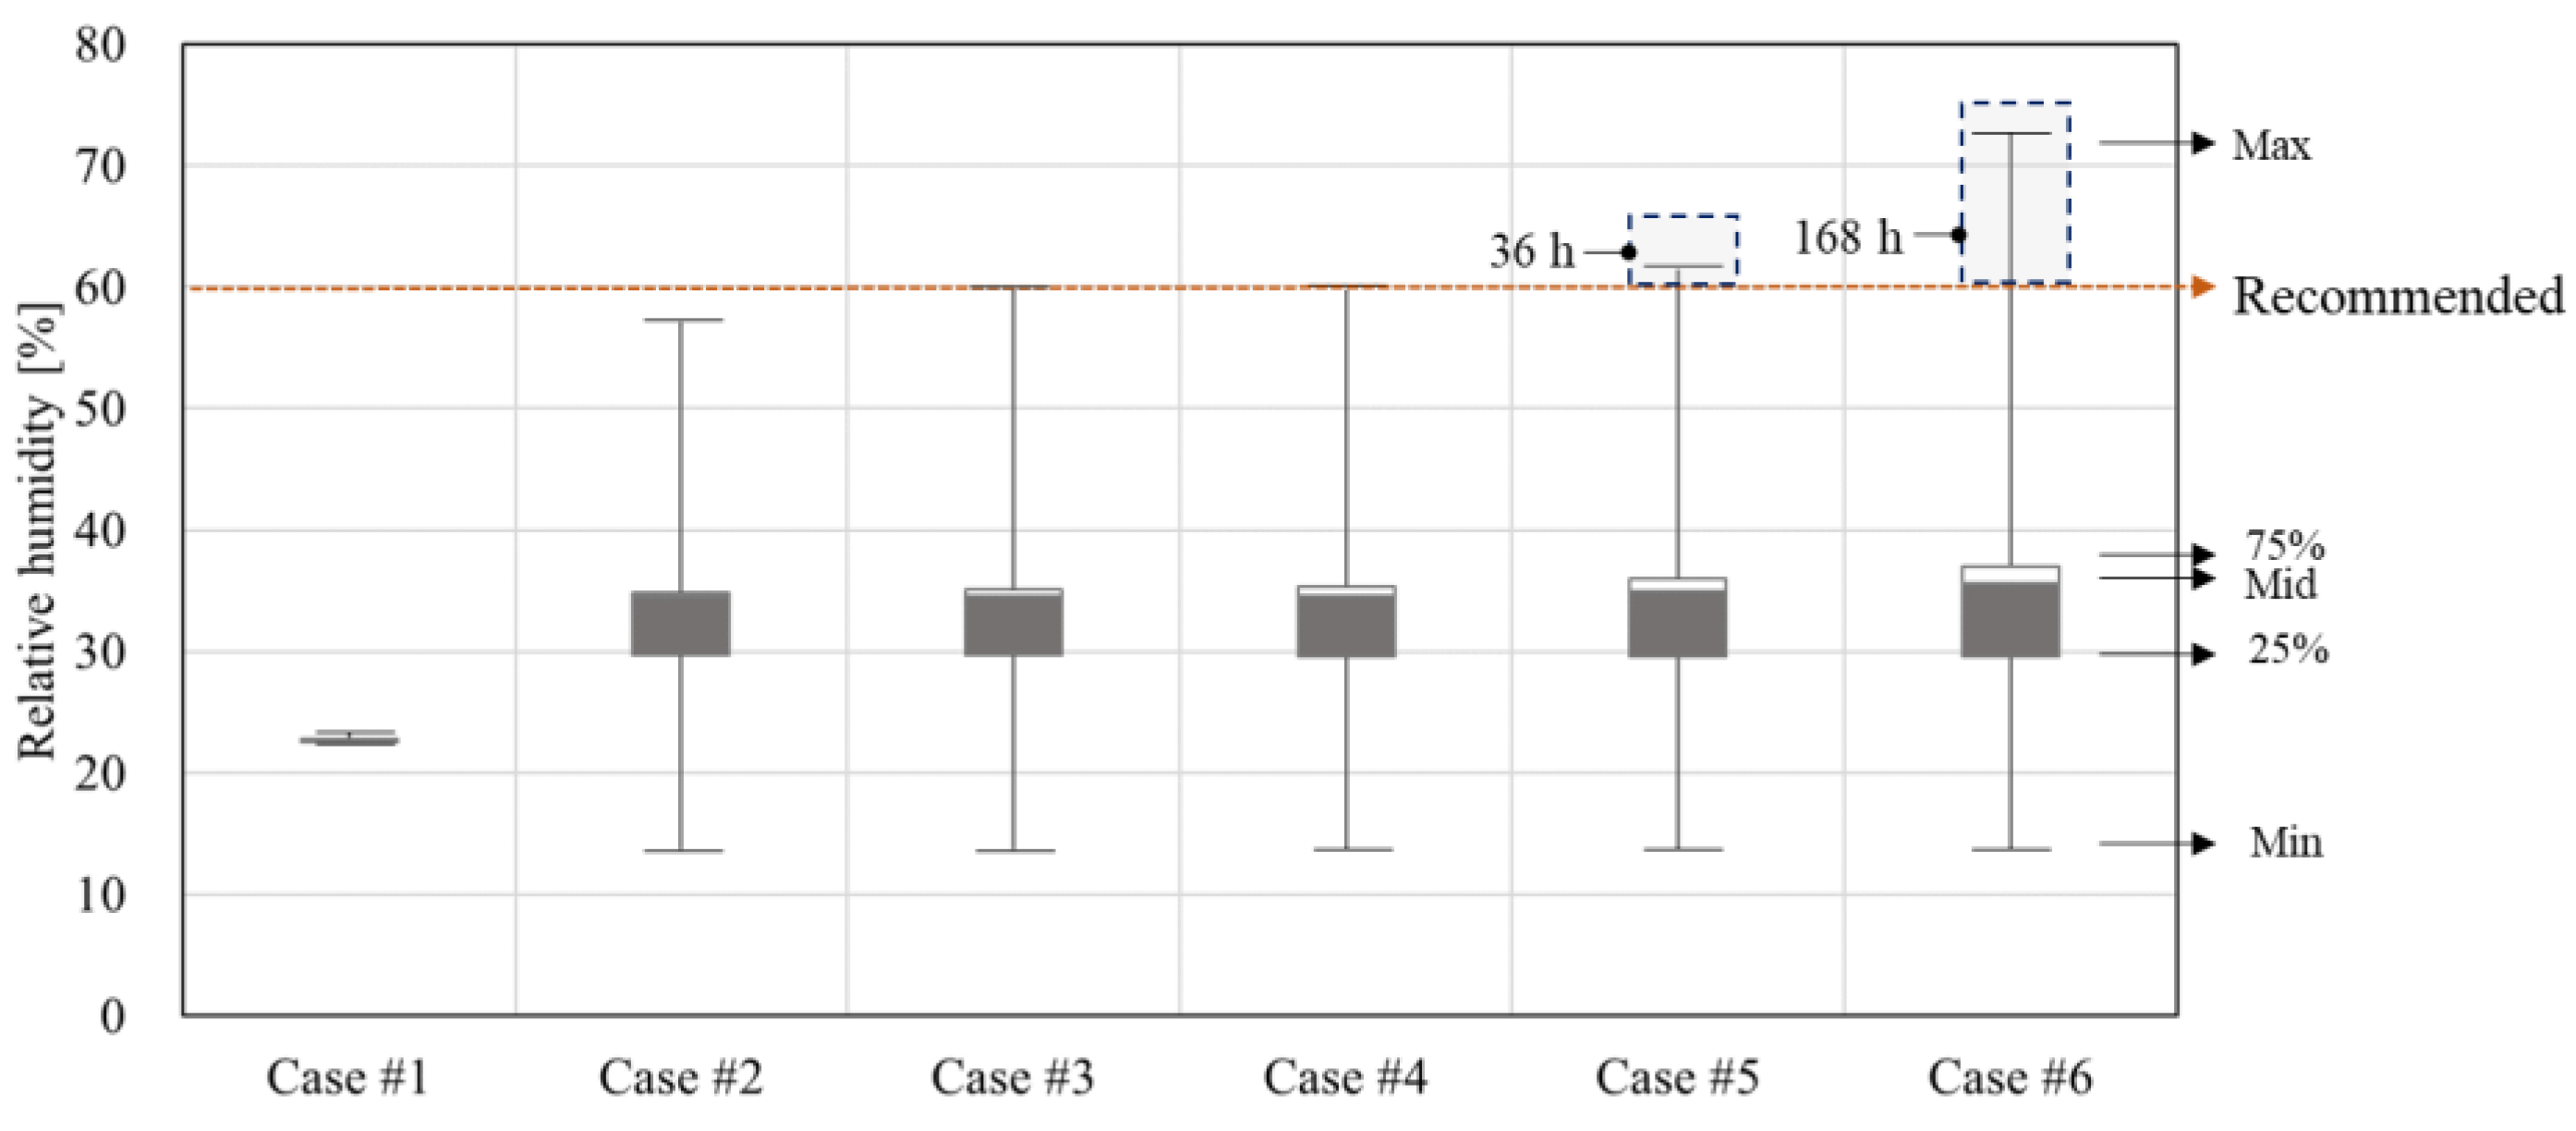
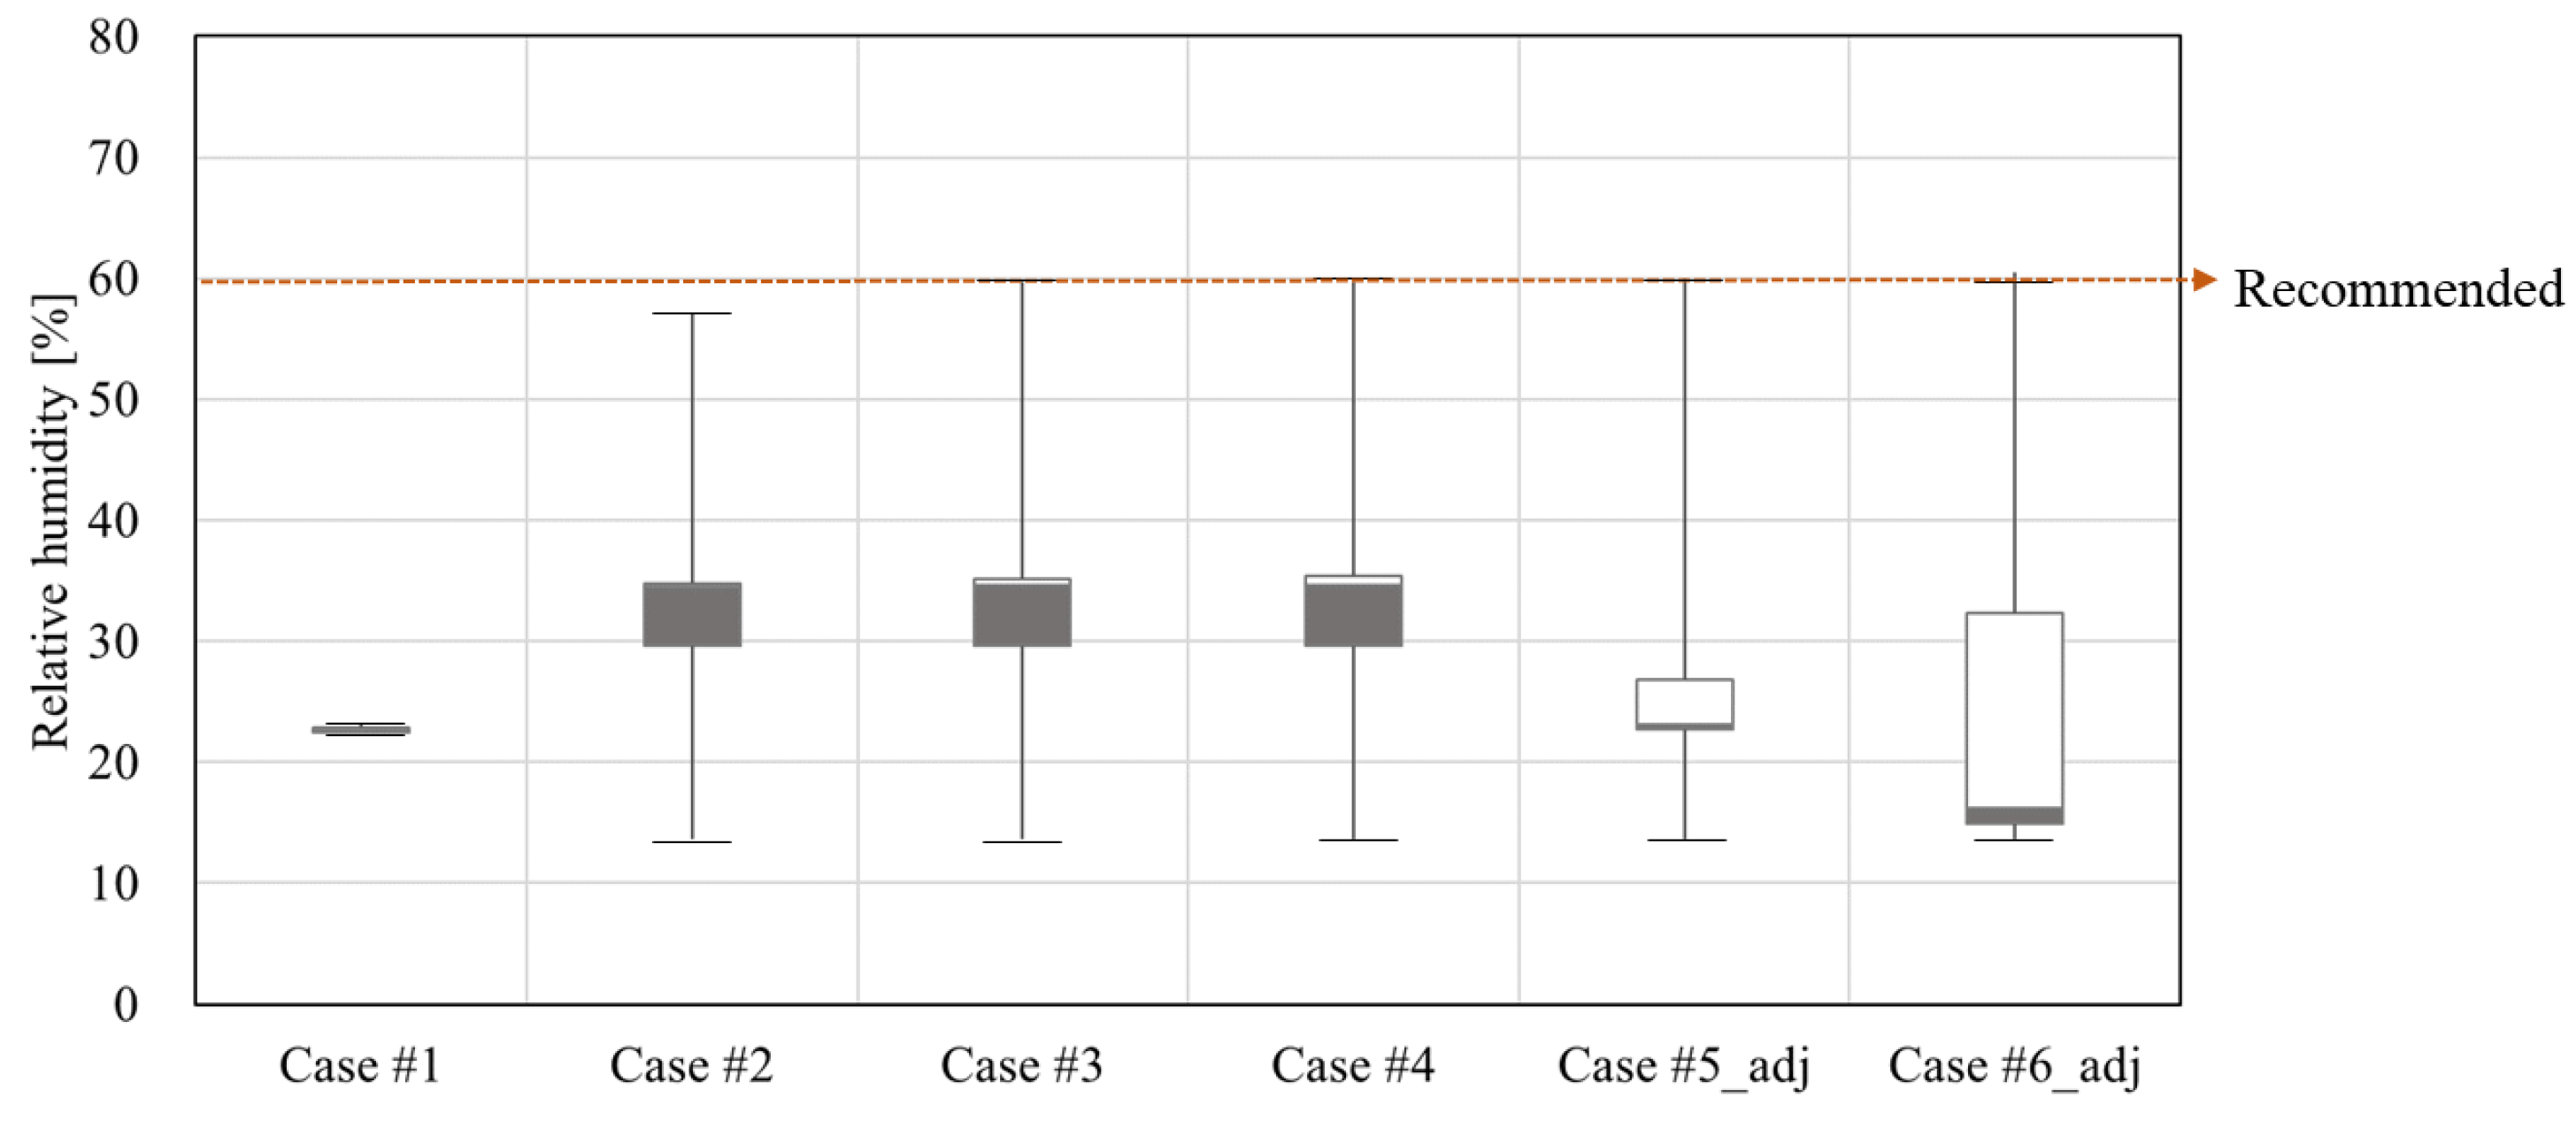
Figure 4 was generated by plotting the relative humidity values at the IT equipment inlet node over the entire simulation year for each case. The box plots illustrate the distribution of relative humidity, including the maximum, 75th percentile, median, 25th percentile, and minimum values. This visualization enabled a clear comparison of humidity conditions across different OA intake cases and highlighted periods when the relative humidity exceeded or remained within the ASHRAE TC 9.9 recommended limit.
The results indicated that Case #2 through #4 met the ASHRAE TC 9.9 standard. However, in Case #5 and Case #6, the relative humidity exceeded the standard for 36 hours and 168 hours, respectively. This was attributed to insufficient dehumidification of the incoming OA. Therefore, a reassessment of the cooling system capacity is required to enhance the dehumidification performance in Case #5 and #6.
3.3. Determination of Appropriate Cooling Capacity by OA Intake Dry-Bulb Temperature
The simulation results indicated that the cooling coil significantly lowered the temperature of the incoming OA below its dew point to reduce humidity. This overcooling process was essential to dehumidify the humid OA before supplying it to the IT equipment.
As a result, in Case #5 and Case #6, the originally designed cooling system capacity (30 RT) was insufficient to handle the increased cooling demand, including the added latent load, under high-temperature and high-humidity OA conditions (refer to
Figure 4). Consequently, the dry-bulb temperature and humidity at the IT equipment inlet did not meet the standards recommended by ASHRAE TC 9.9.
Increasing cooling capacity is generally considered an abnormal strategy from the perspective of energy efficiency, as it typically results in higher energy consumption. However, this study prioritized maintaining the thermal and humidity conditions required by ASHRAE TC 9.9 for stable IT equipment operation. Accordingly, the cooling capacity was adjusted to meet the environmental criteria even under humid OA conditions. Although this adjustment may increase energy use, it also enables a wider OA intake range, which can improve the potential for cooling energy savings through enhanced economizer operation.
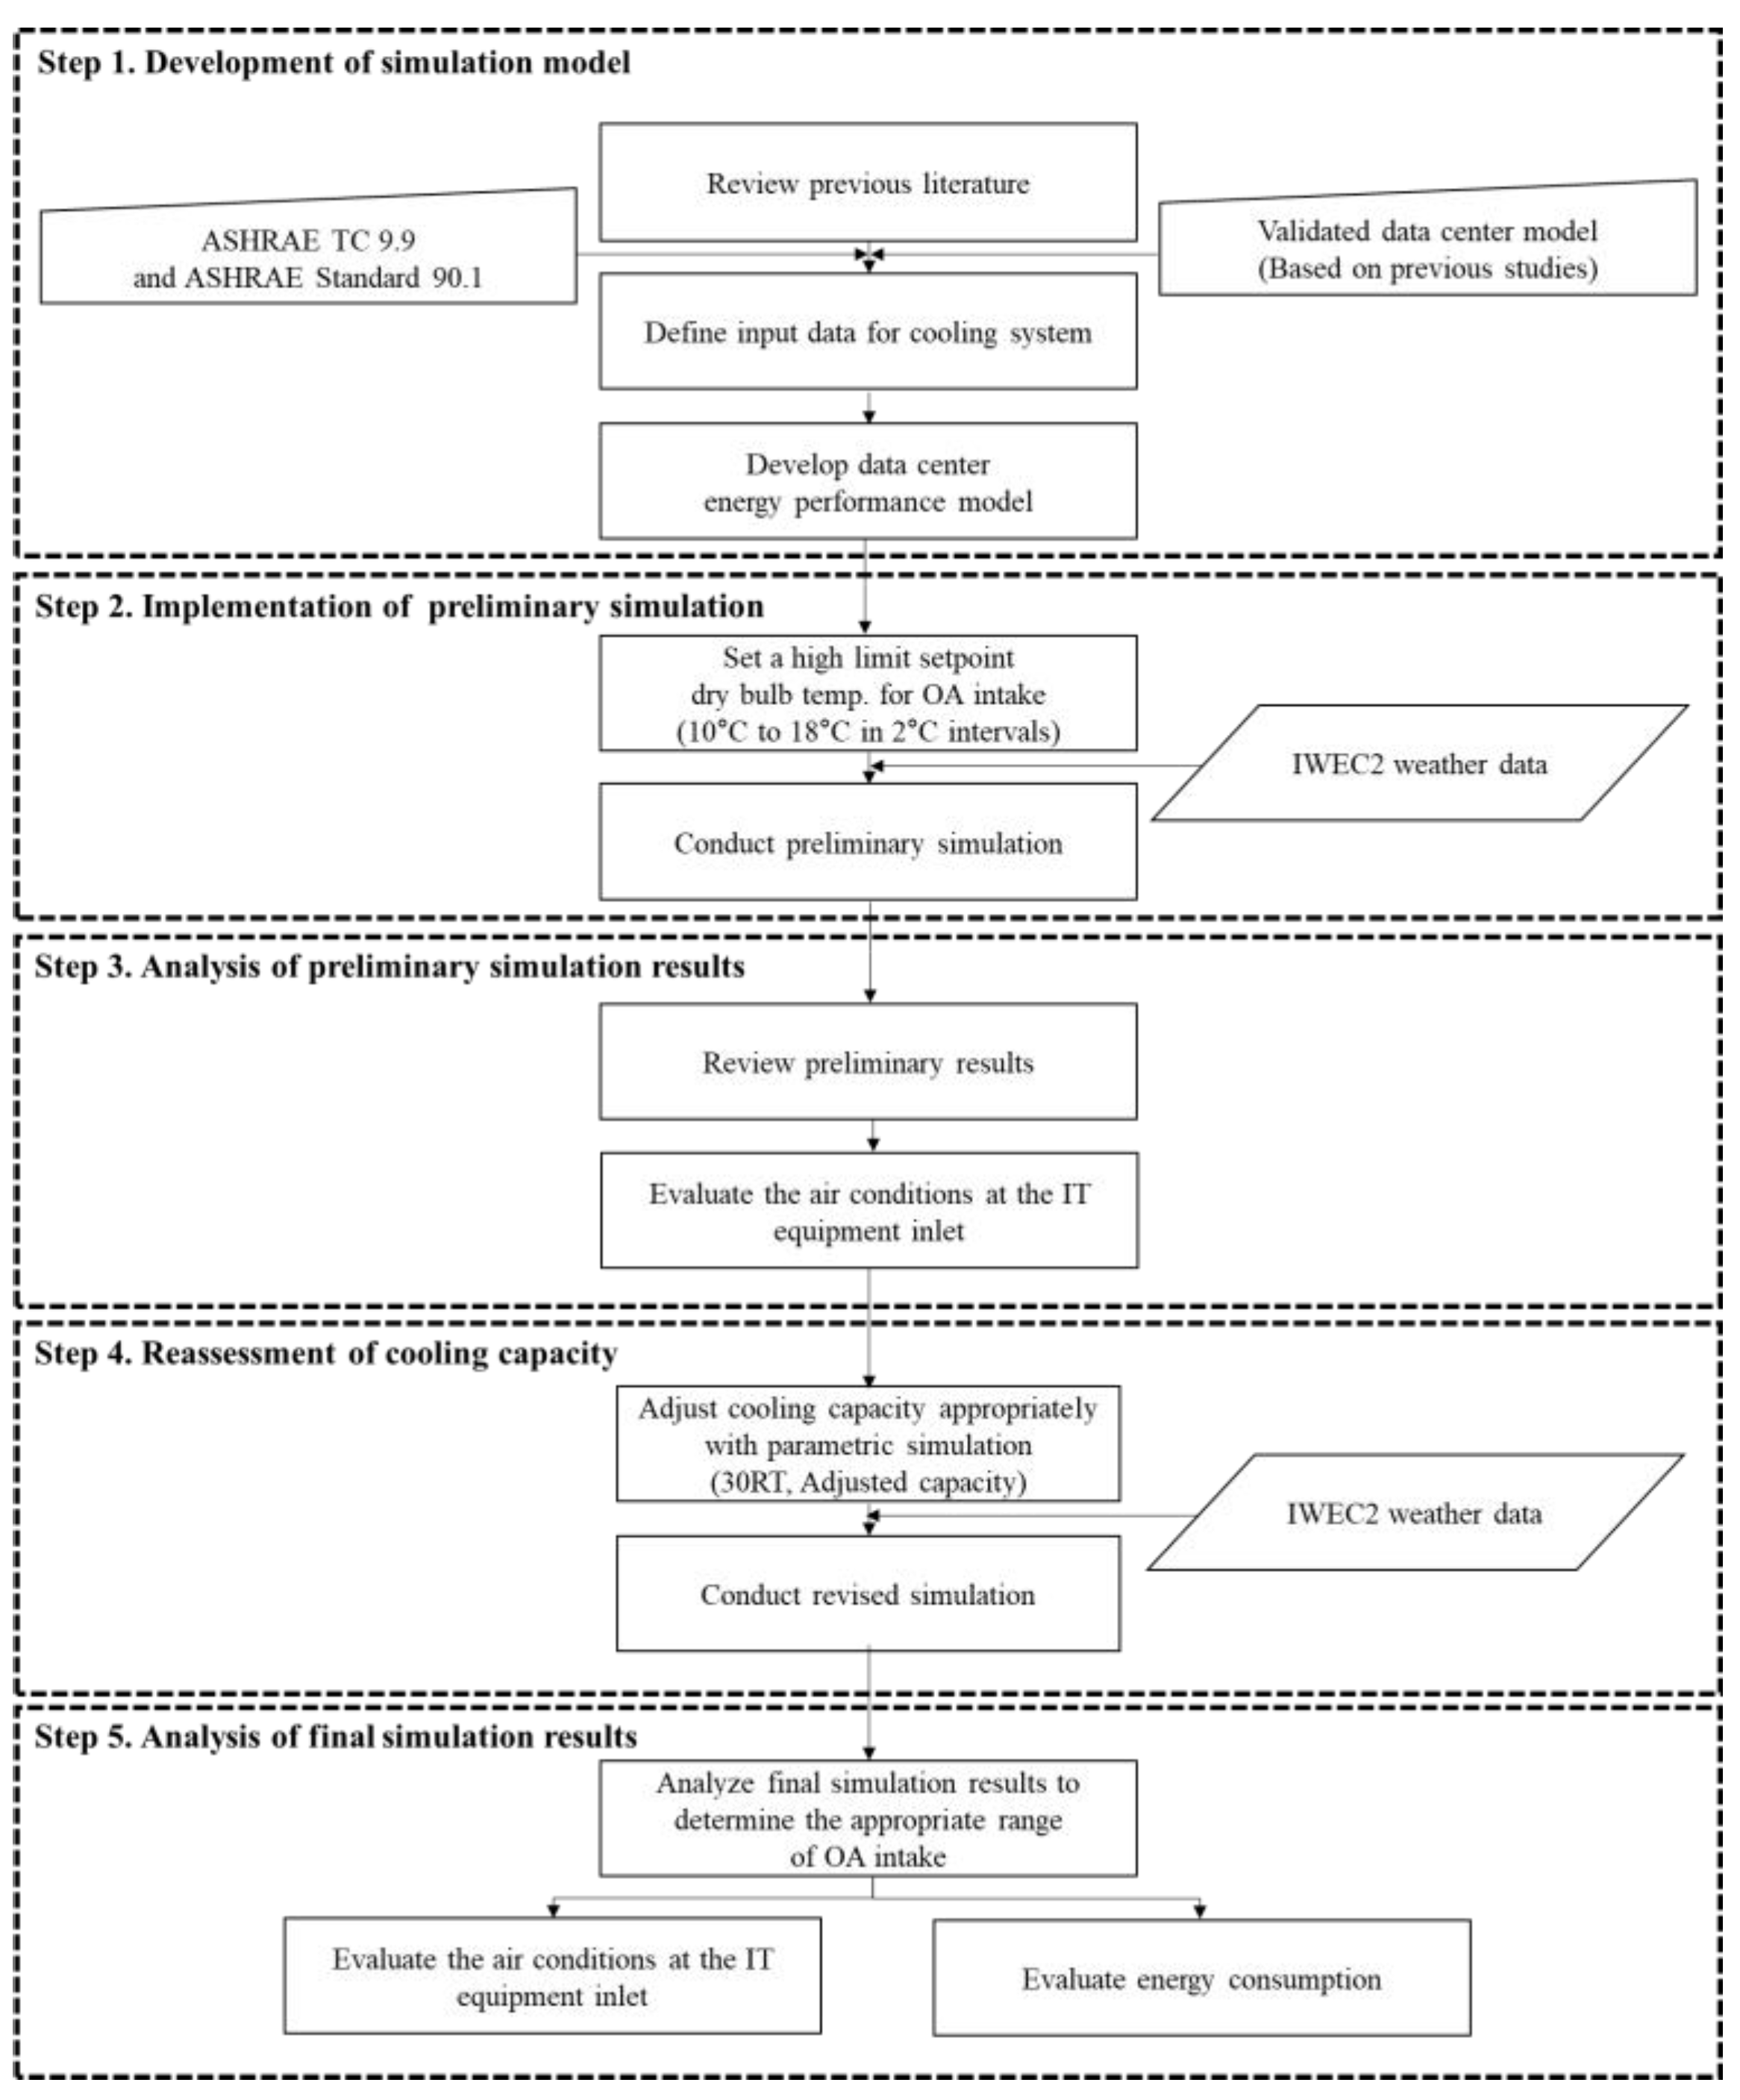
In this study, the cooling capacities for Case #5 and Case #6 were redefined using a parametric approach to satisfy the environmental criteria set by ASHRAE TC 9.9. The capacities were incrementally increased until the conditions at the IT equipment inlet met the required standards. As shown in
Table 5, the optimal cooling capacities were determined to be 45 RT for Case #5_adj and 56 RT for Case #6_adj. The simulation model had been previously validated under baseline load conditions, and only the cooling capacity was modified without altering the system configuration.
3.4. Analysis of Thermal Conditions at the IT Equipment Intake with Adjusted Cooling Capacity
Section 3.4 analyzed the air conditions at the IT equipment intake when the cooling system capacity was appropriately configured for each case.
Figure 5 presents the air condition at the intake point for each simulation case. The results showed that with appropriately adjusted cooling capacities, the relative humidity at the IT equipment intake in Case #5_adj and Case #6_adj remained below the ASHRAE TC 9.9 recommended limit of 60%.
These findings emphasize that when applying an economizer system in a data center, the cooling system capacity should be selected with consideration for its dehumidification capability. In this study, the adjustment of cooling system capacities was intended to examine the potential to expand the OA intake range while ensuring compliance with the relative humidity limits recommended by ASHRAE TC 9.9. By satisfying this criterion, it becomes possible to explore wider OA intake thresholds that may enhance energy-saving potential under favorable OA conditions. This modeling approach was not intended as a design recommendation but rather aimed at demonstrating that achieving humidity control performance is a prerequisite for enabling such expansion.
3.5. Energy Consumption
3.5.1. Seasonal Energy Consumption
This section analyzed the impact of varying the allowable OA intake dry-bulb temperature range on energy consumption across three periods: summer (June to August), interseason (April to May and September to October), and winter (November to March).
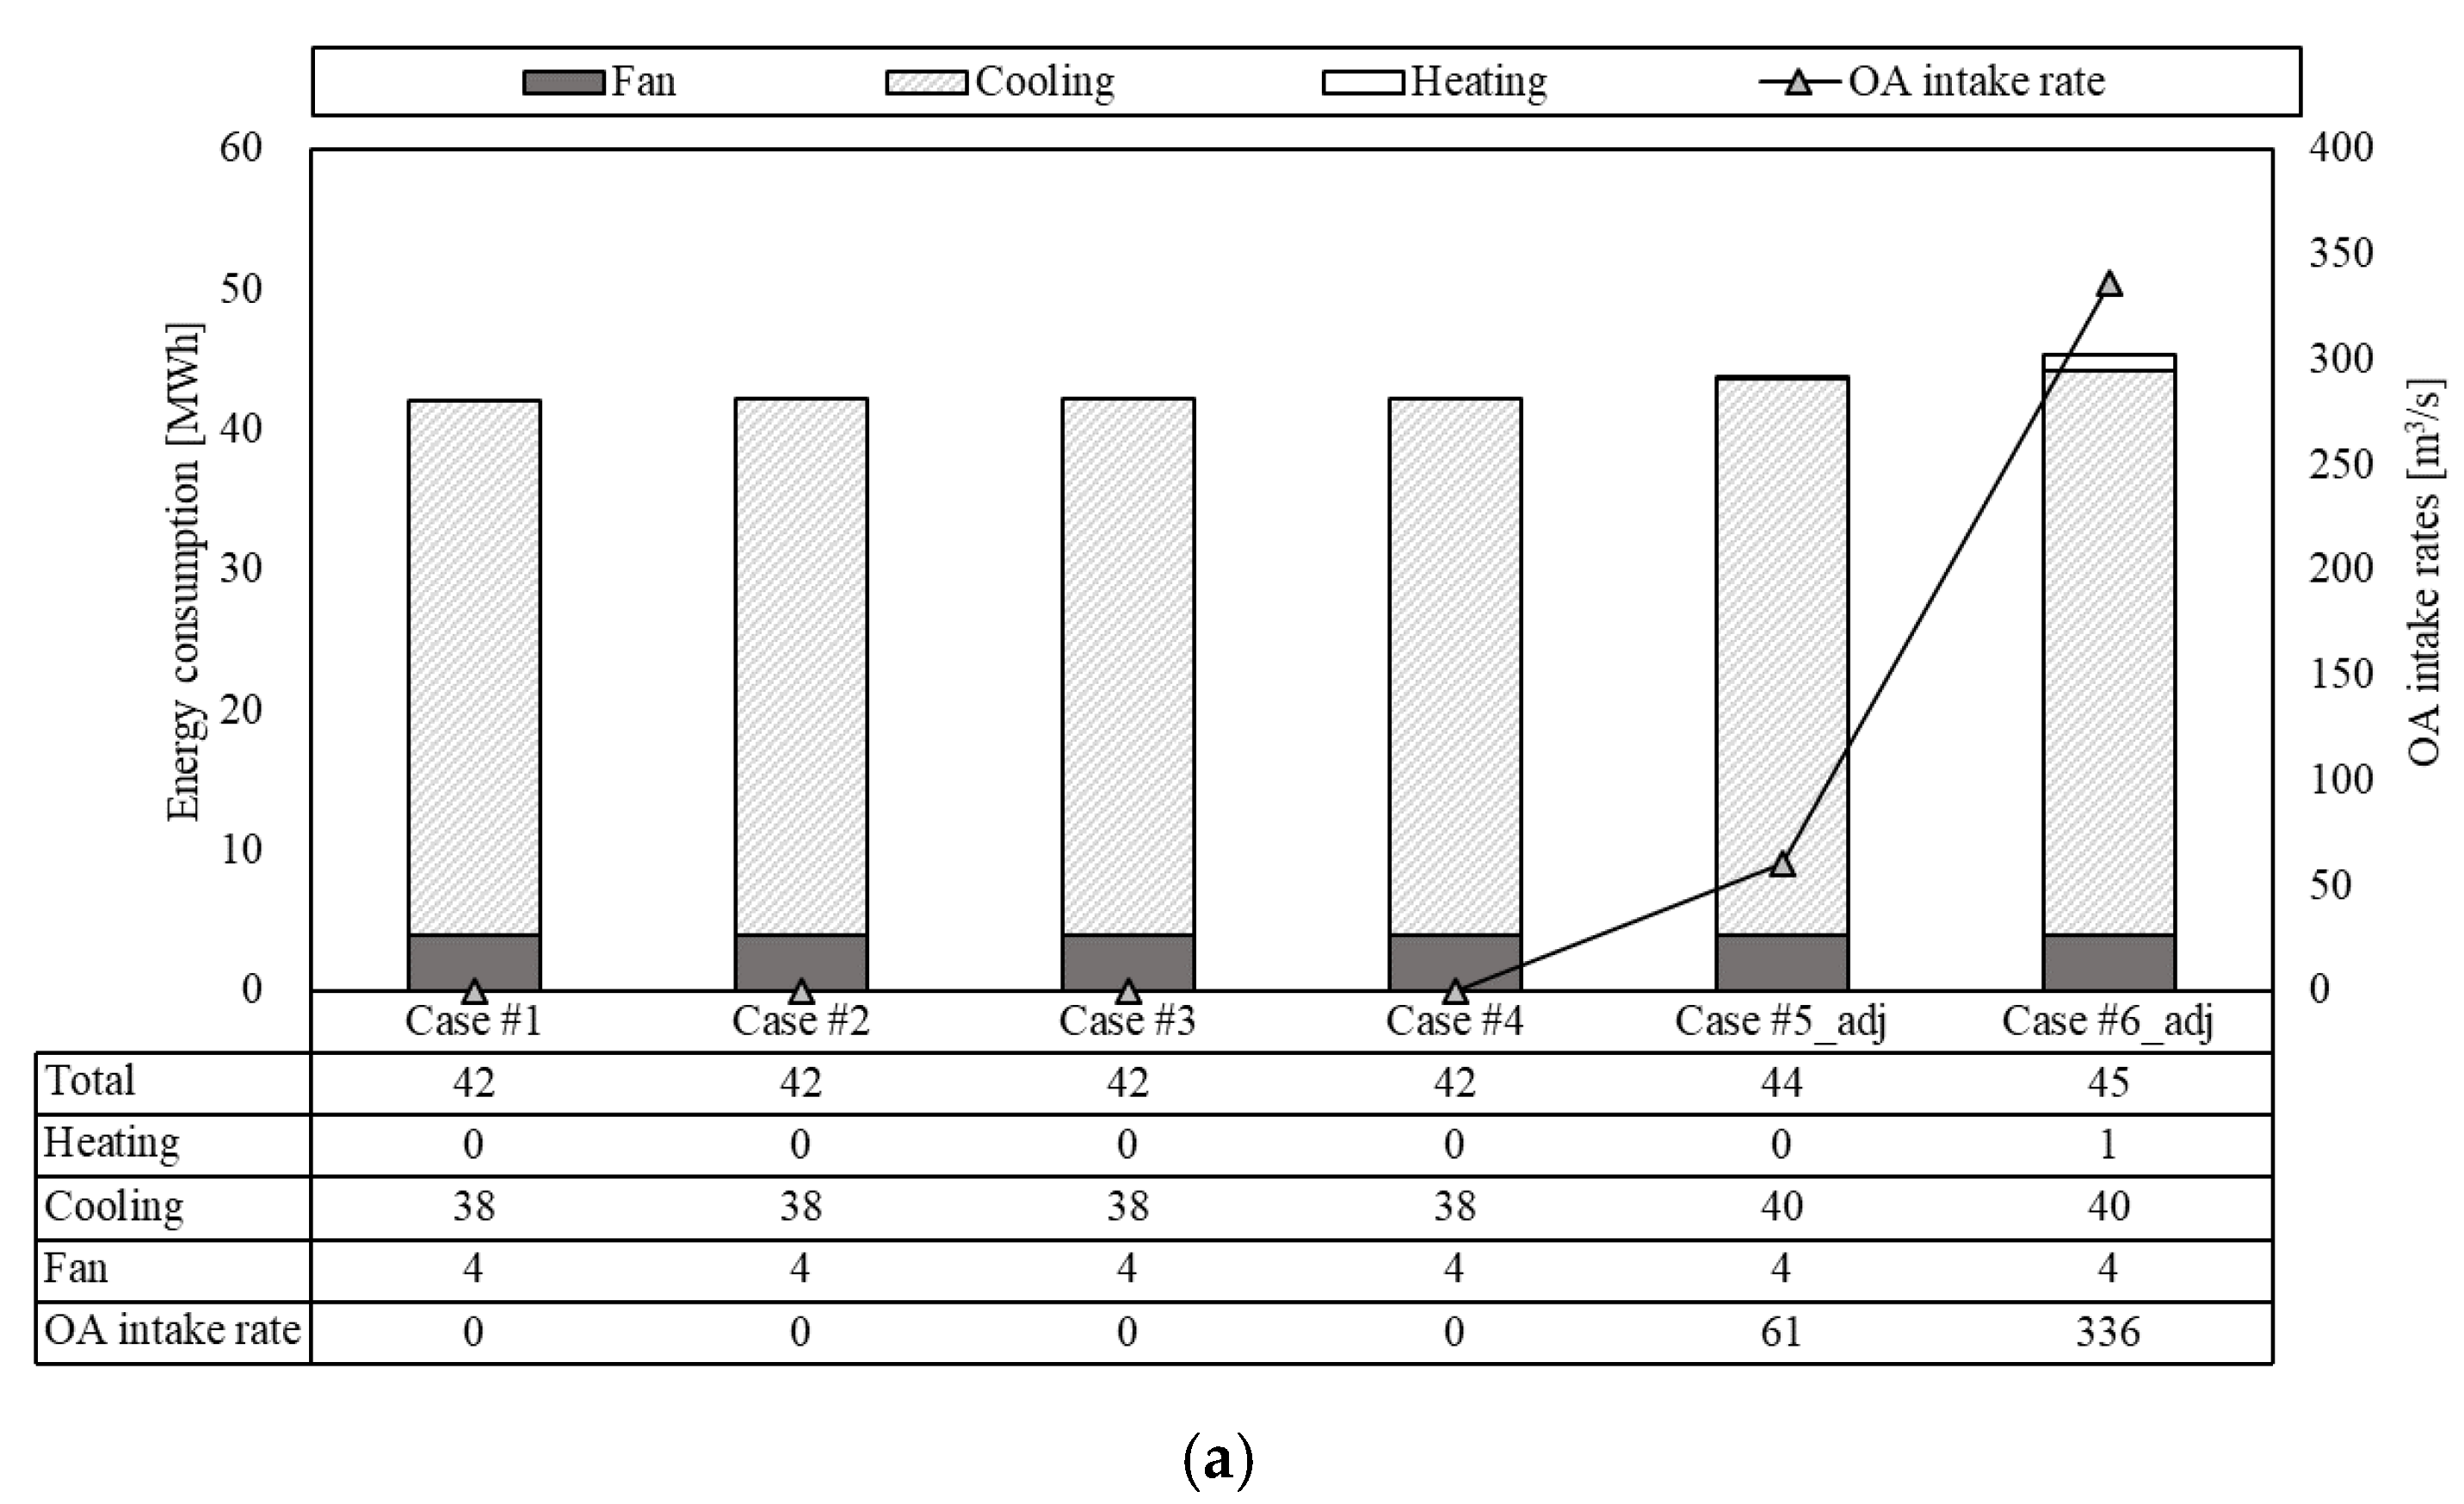
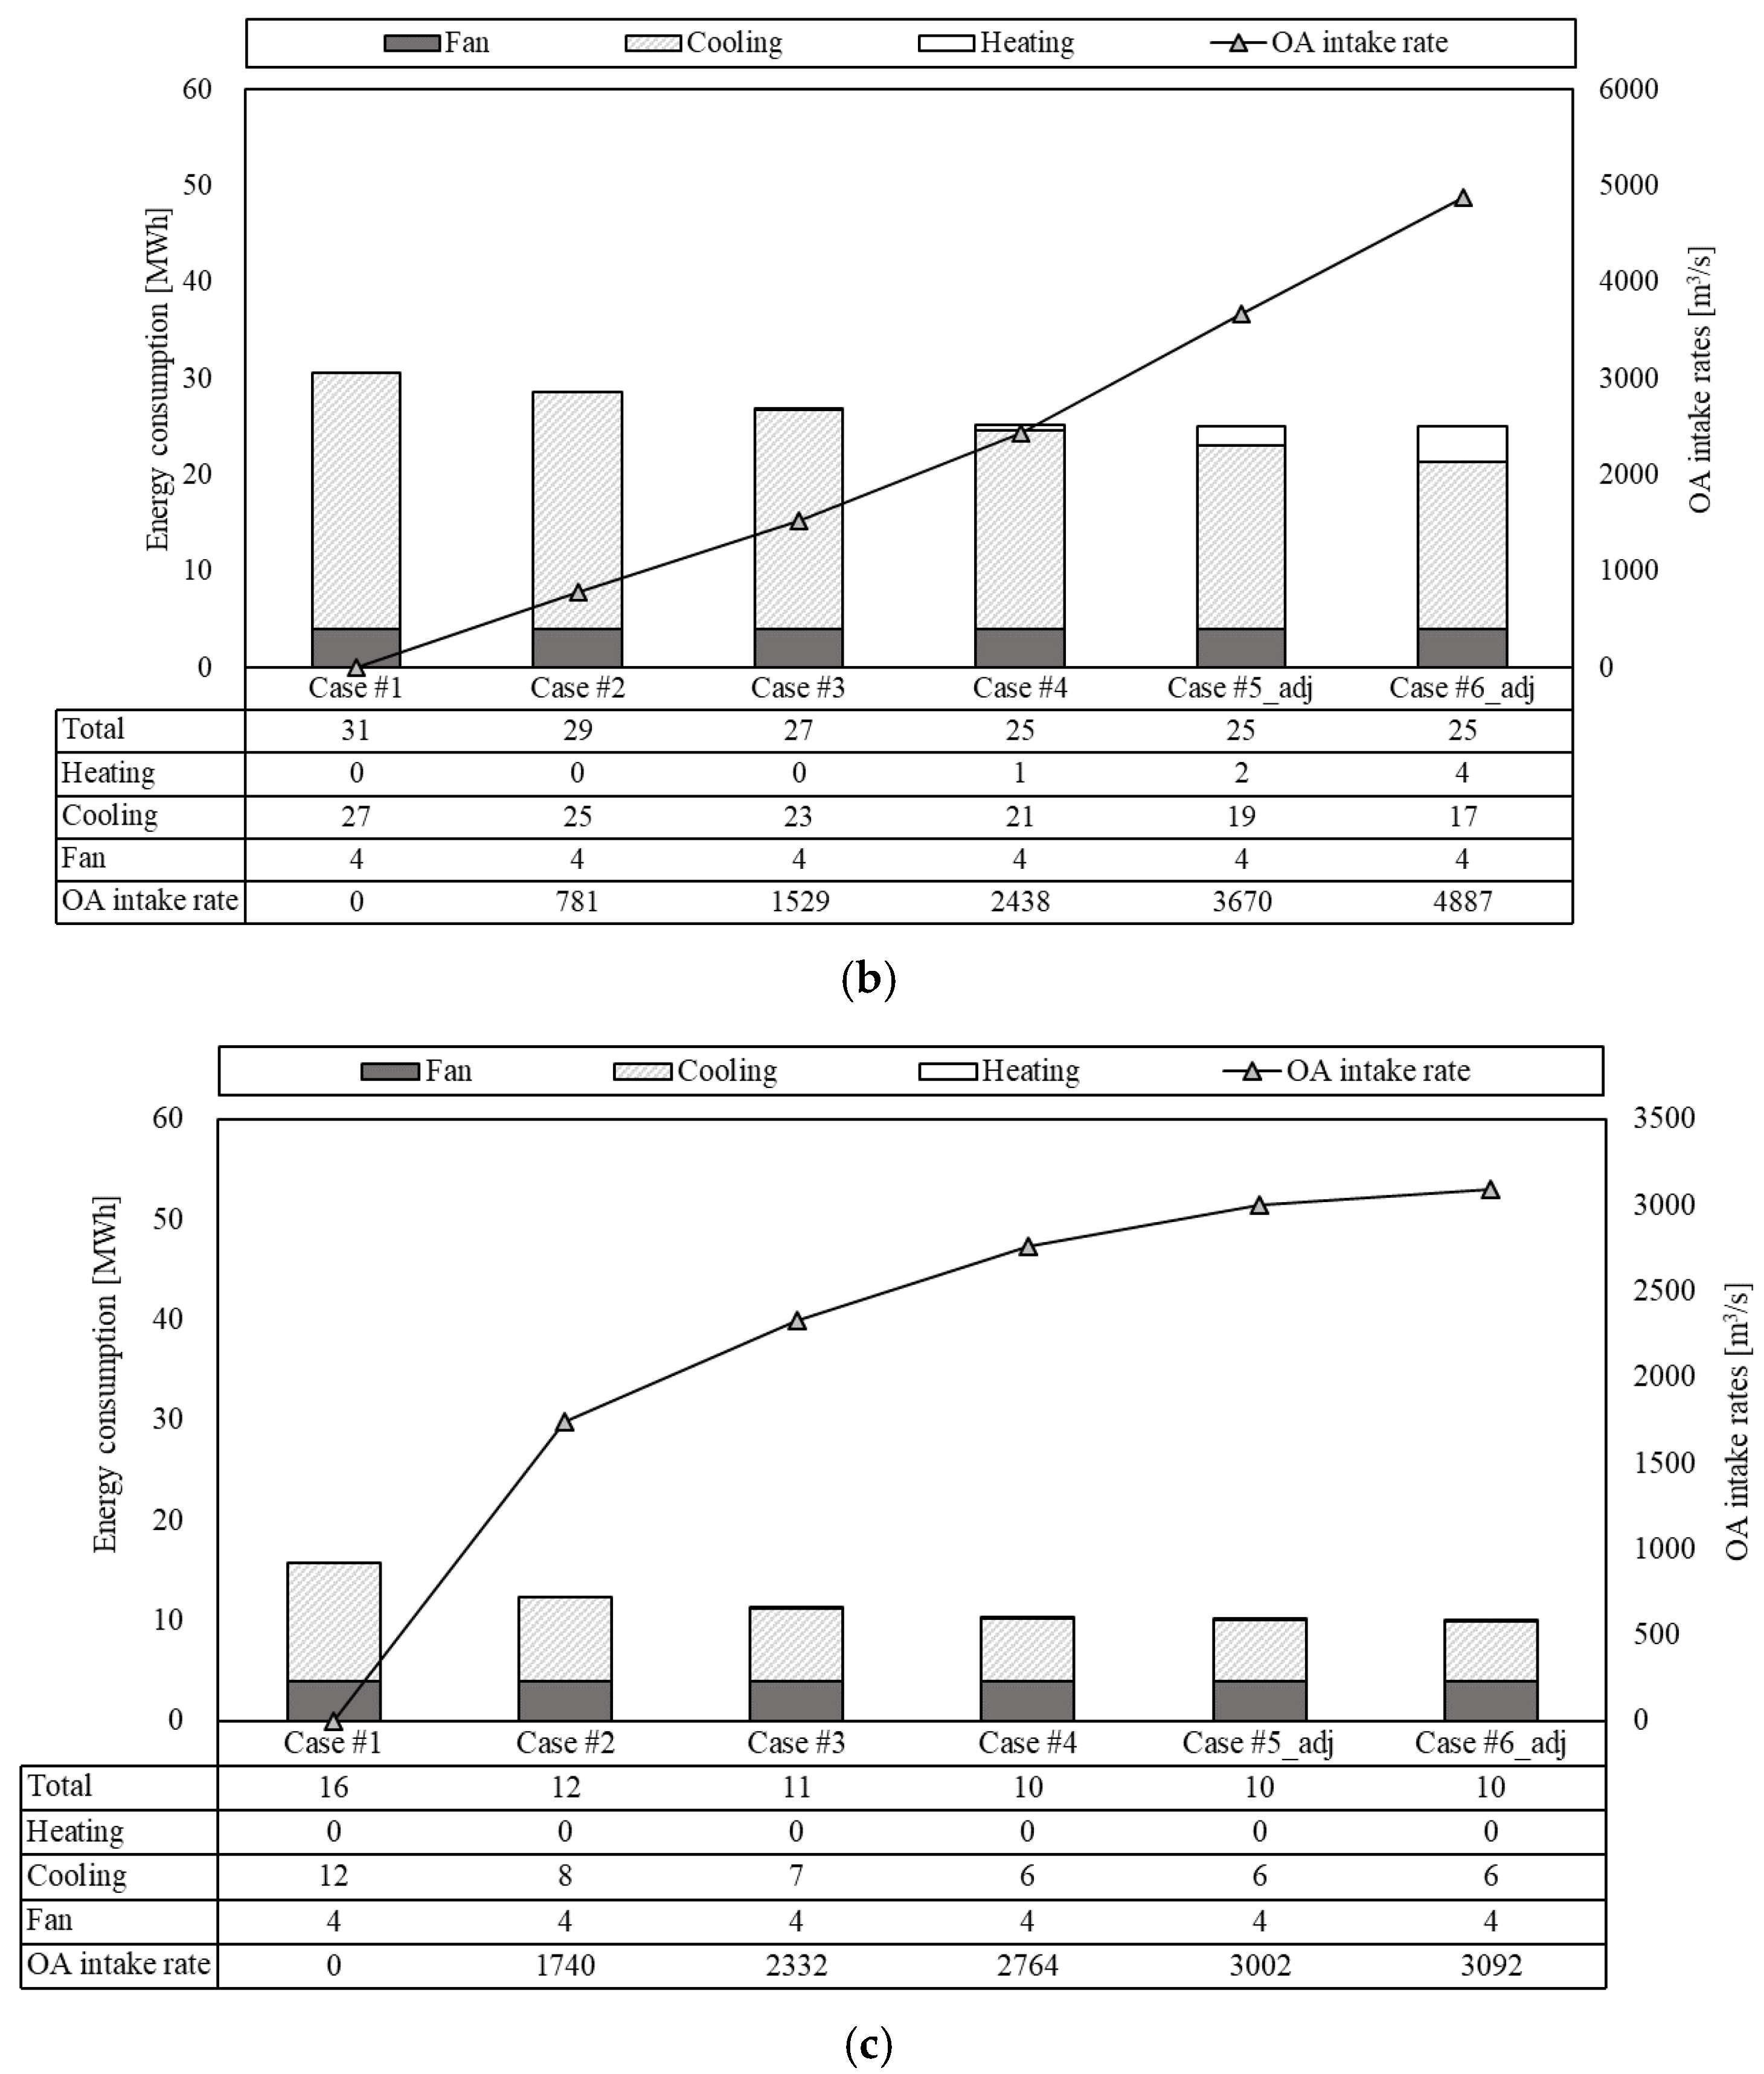
Figure 6 illustrated the hourly energy consumption for fan operation, cooling, and reheating, as well as the OA intake rate for each simulation case (Case #1 to Case #6).
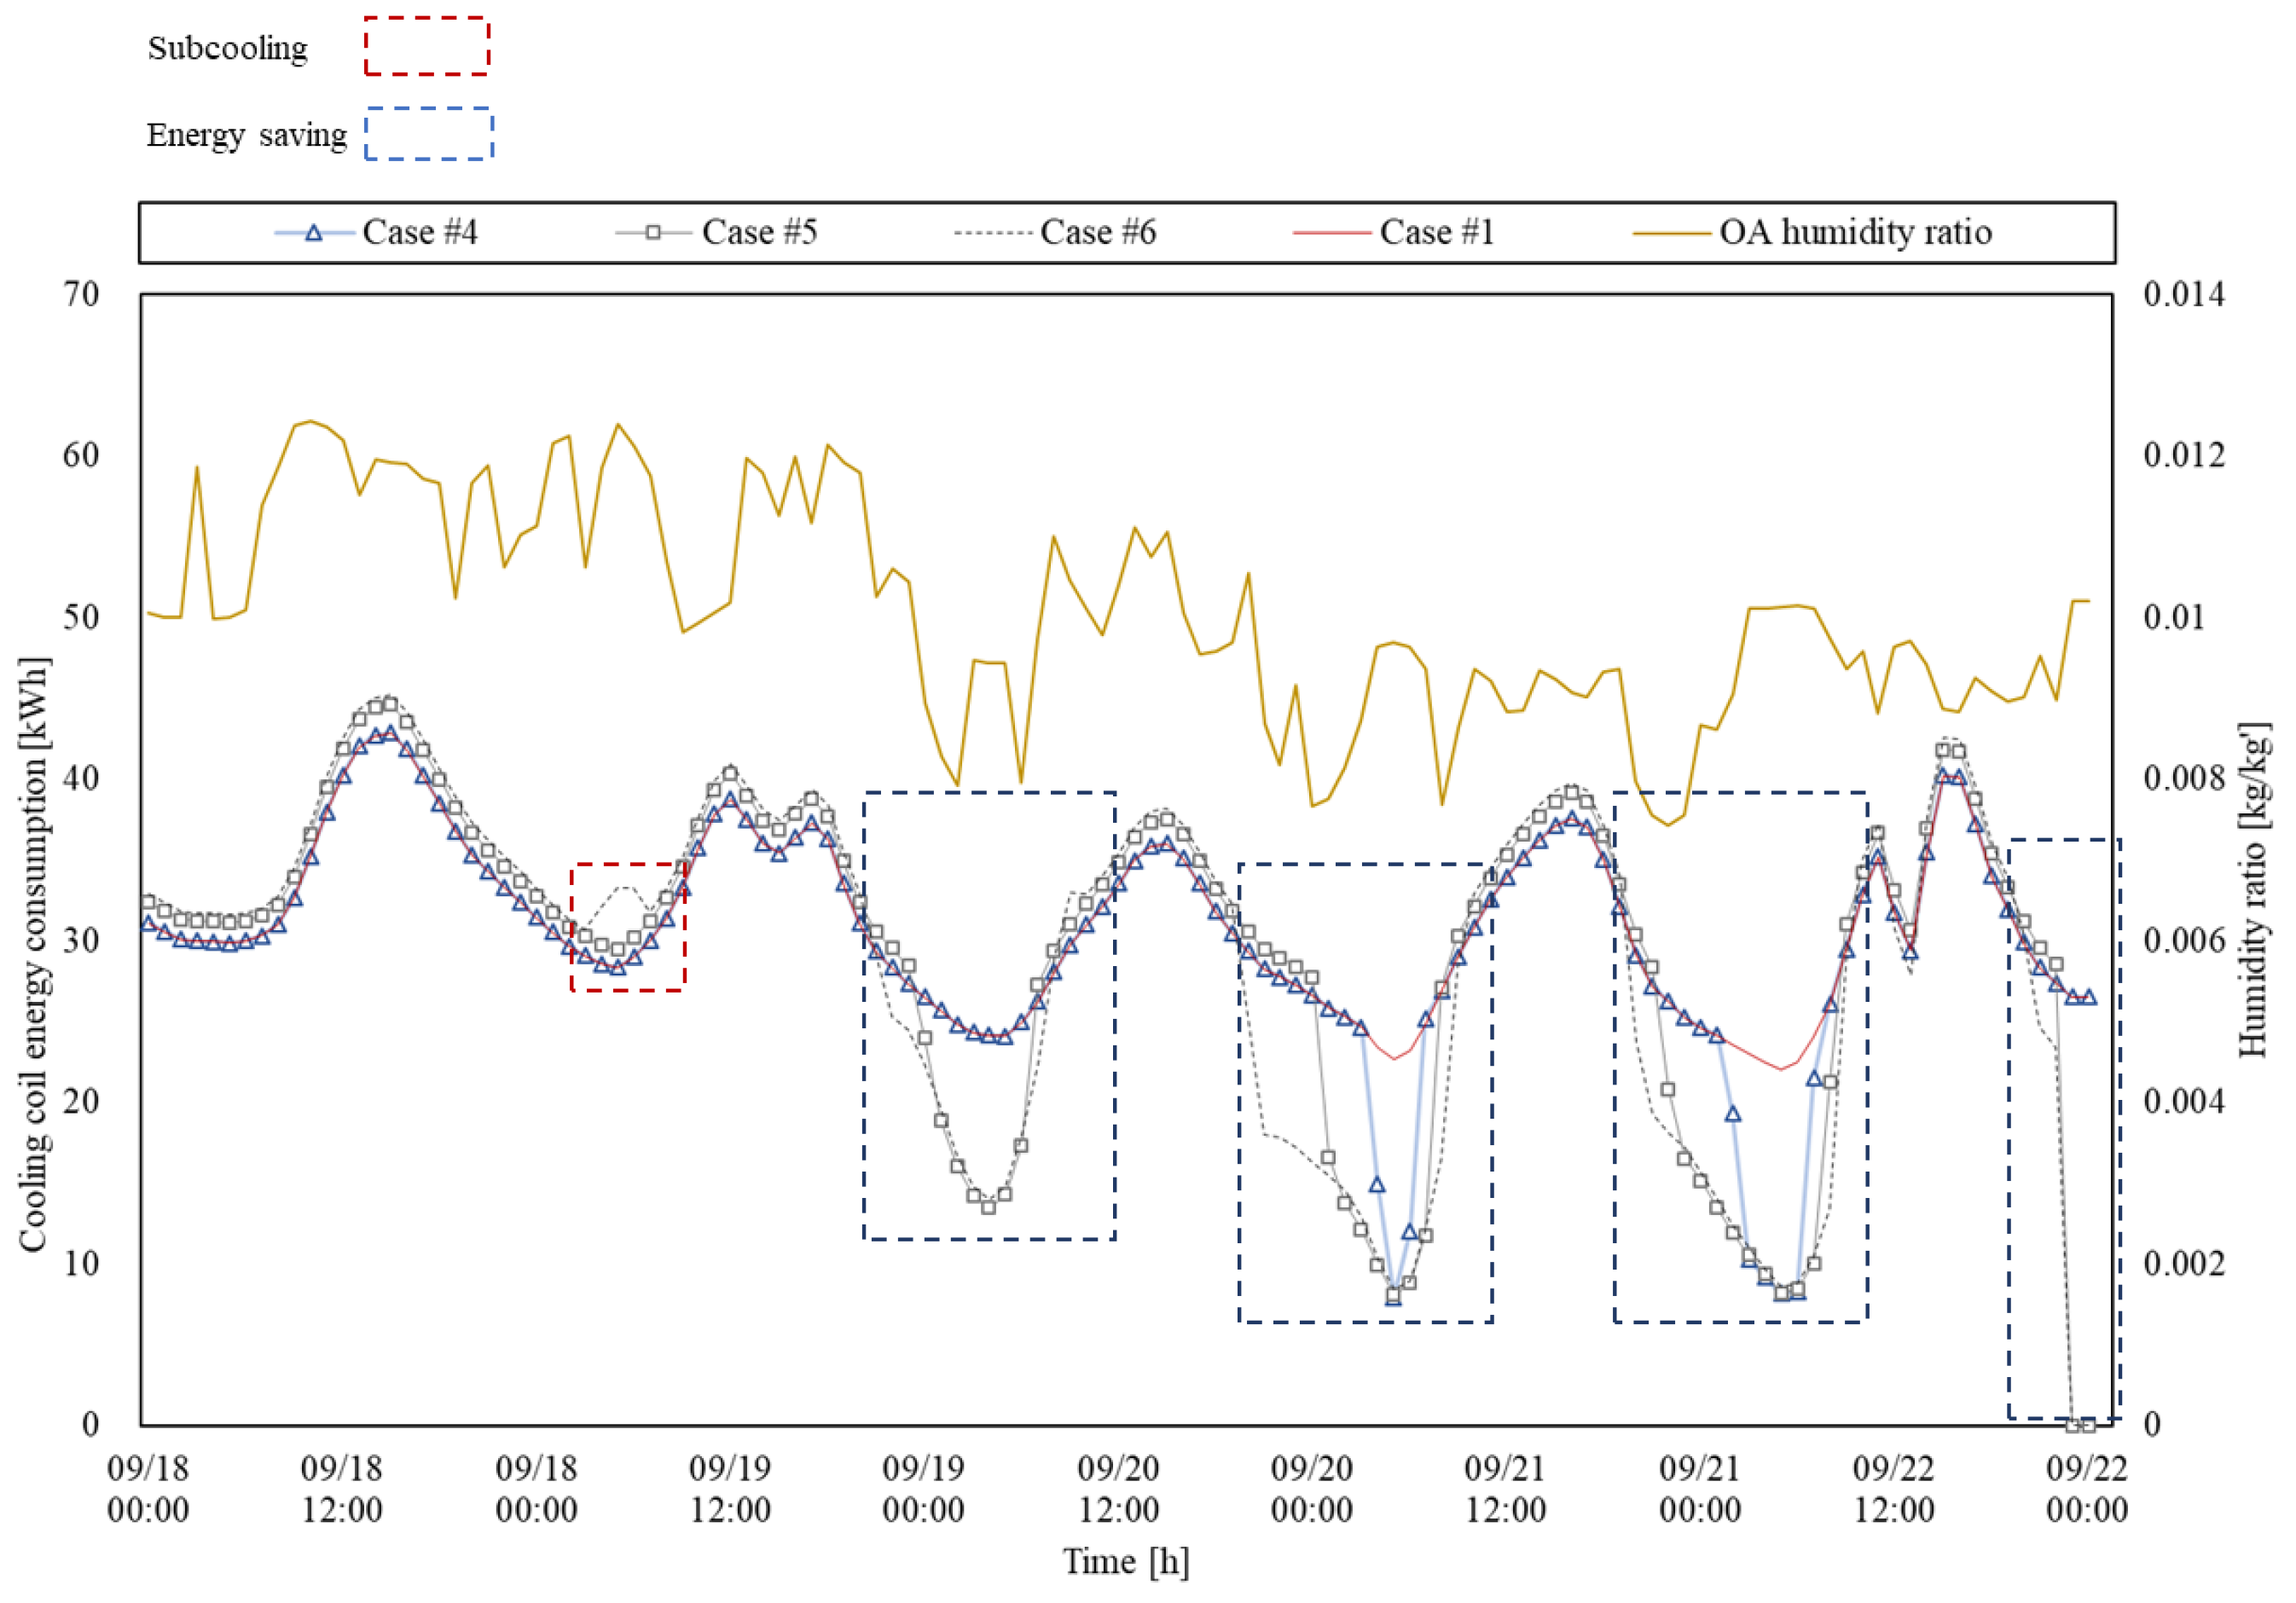
Figure 7 presented the hourly cooling coil energy consumption and OA humidity ratio during five weekdays around the autumnal equinox (22 September).
Each case was evaluated with its corresponding cooling capacity: 30 RT for Cases #1 to #4, 45 RT for Case #5, and 56 RT for Case #6. In summer, as the OA intake increased from 0 m3/s in Case #1 to 336 m3/s in Case #6, and the hourly total energy consumption rose from 42 to 45 MWh. Case #5 also showed a 2 MWh increase compared to Case #1, primarily due to elevated energy use by the cooling and reheating coils. This increase resulted from overcooling to remove excess humidity in Daejeon’s summer climate, followed by reheating to reach the desired SA temperature, thereby increasing energy use in both systems. Therefore, OA intake during summer was not recommended due to its inefficiency in terms of energy consumption.
During the interseason, energy consumption was reduced by 2 to 6 MWh from Case #1 to Case #6, as the increased OA intake shortened the operating time of the cooling system. Although the OA intake in Case #6 was 4887 m3/s greater than that in Case #2, the total energy savings were similar from Case #4 to Case #6. This was because the over-cooled air in Case #6 required reheating for dehumidification, which increased energy usage 4 MWh. An hourly analysis conducted from 18 to 22 September indicated that energy savings were most prominent after 7:00 p.m., with Case #6 demonstrating a maximum reduction of up to 30 kWh. Conversely, during the early morning period between 5:00 a.m. and 6:00 a.m. on 19 September, the energy consumption in Case #6 increased by approximately 15–17% compared to Case #1. This increase was attributed to additional subcooling required for humidity control. Therefore, it can be concluded that, during interseason periods with low ambient humidity, the allowable OA intake temperature threshold may be reasonably extended up to the level defined in Case #6.
In winter, energy consumption in Cases #5 and #6 was approximately 6 MWh lower than that in Case #1. Although OA intake increased by 1529 m
3/s from Case #2 to Case #6, the magnitude of increase was smaller than in the interseason. This was likely due to the generally low temperatures during winter and the limited OA intake duration of only 482 hours from Case #2 to Case #6 (refer to
Figure 3c, Winter). Therefore, the OA intake ranges defined in Cases #5 and #6 were considered effective for reducing energy consumption during the winter season.
These findings suggested that data center economizer systems should apply seasonally optimized OA intake ranges based on climate conditions and external air characteristics.
3.5.2. Annual Energy Consumption
Section 3.5.2 analyzed the annual energy consumption of the design-sized cooling system (30 RT) and the adjusted systems. The total energy use included cooling, dehumidification, reheating, humidification, and supply fan operation.
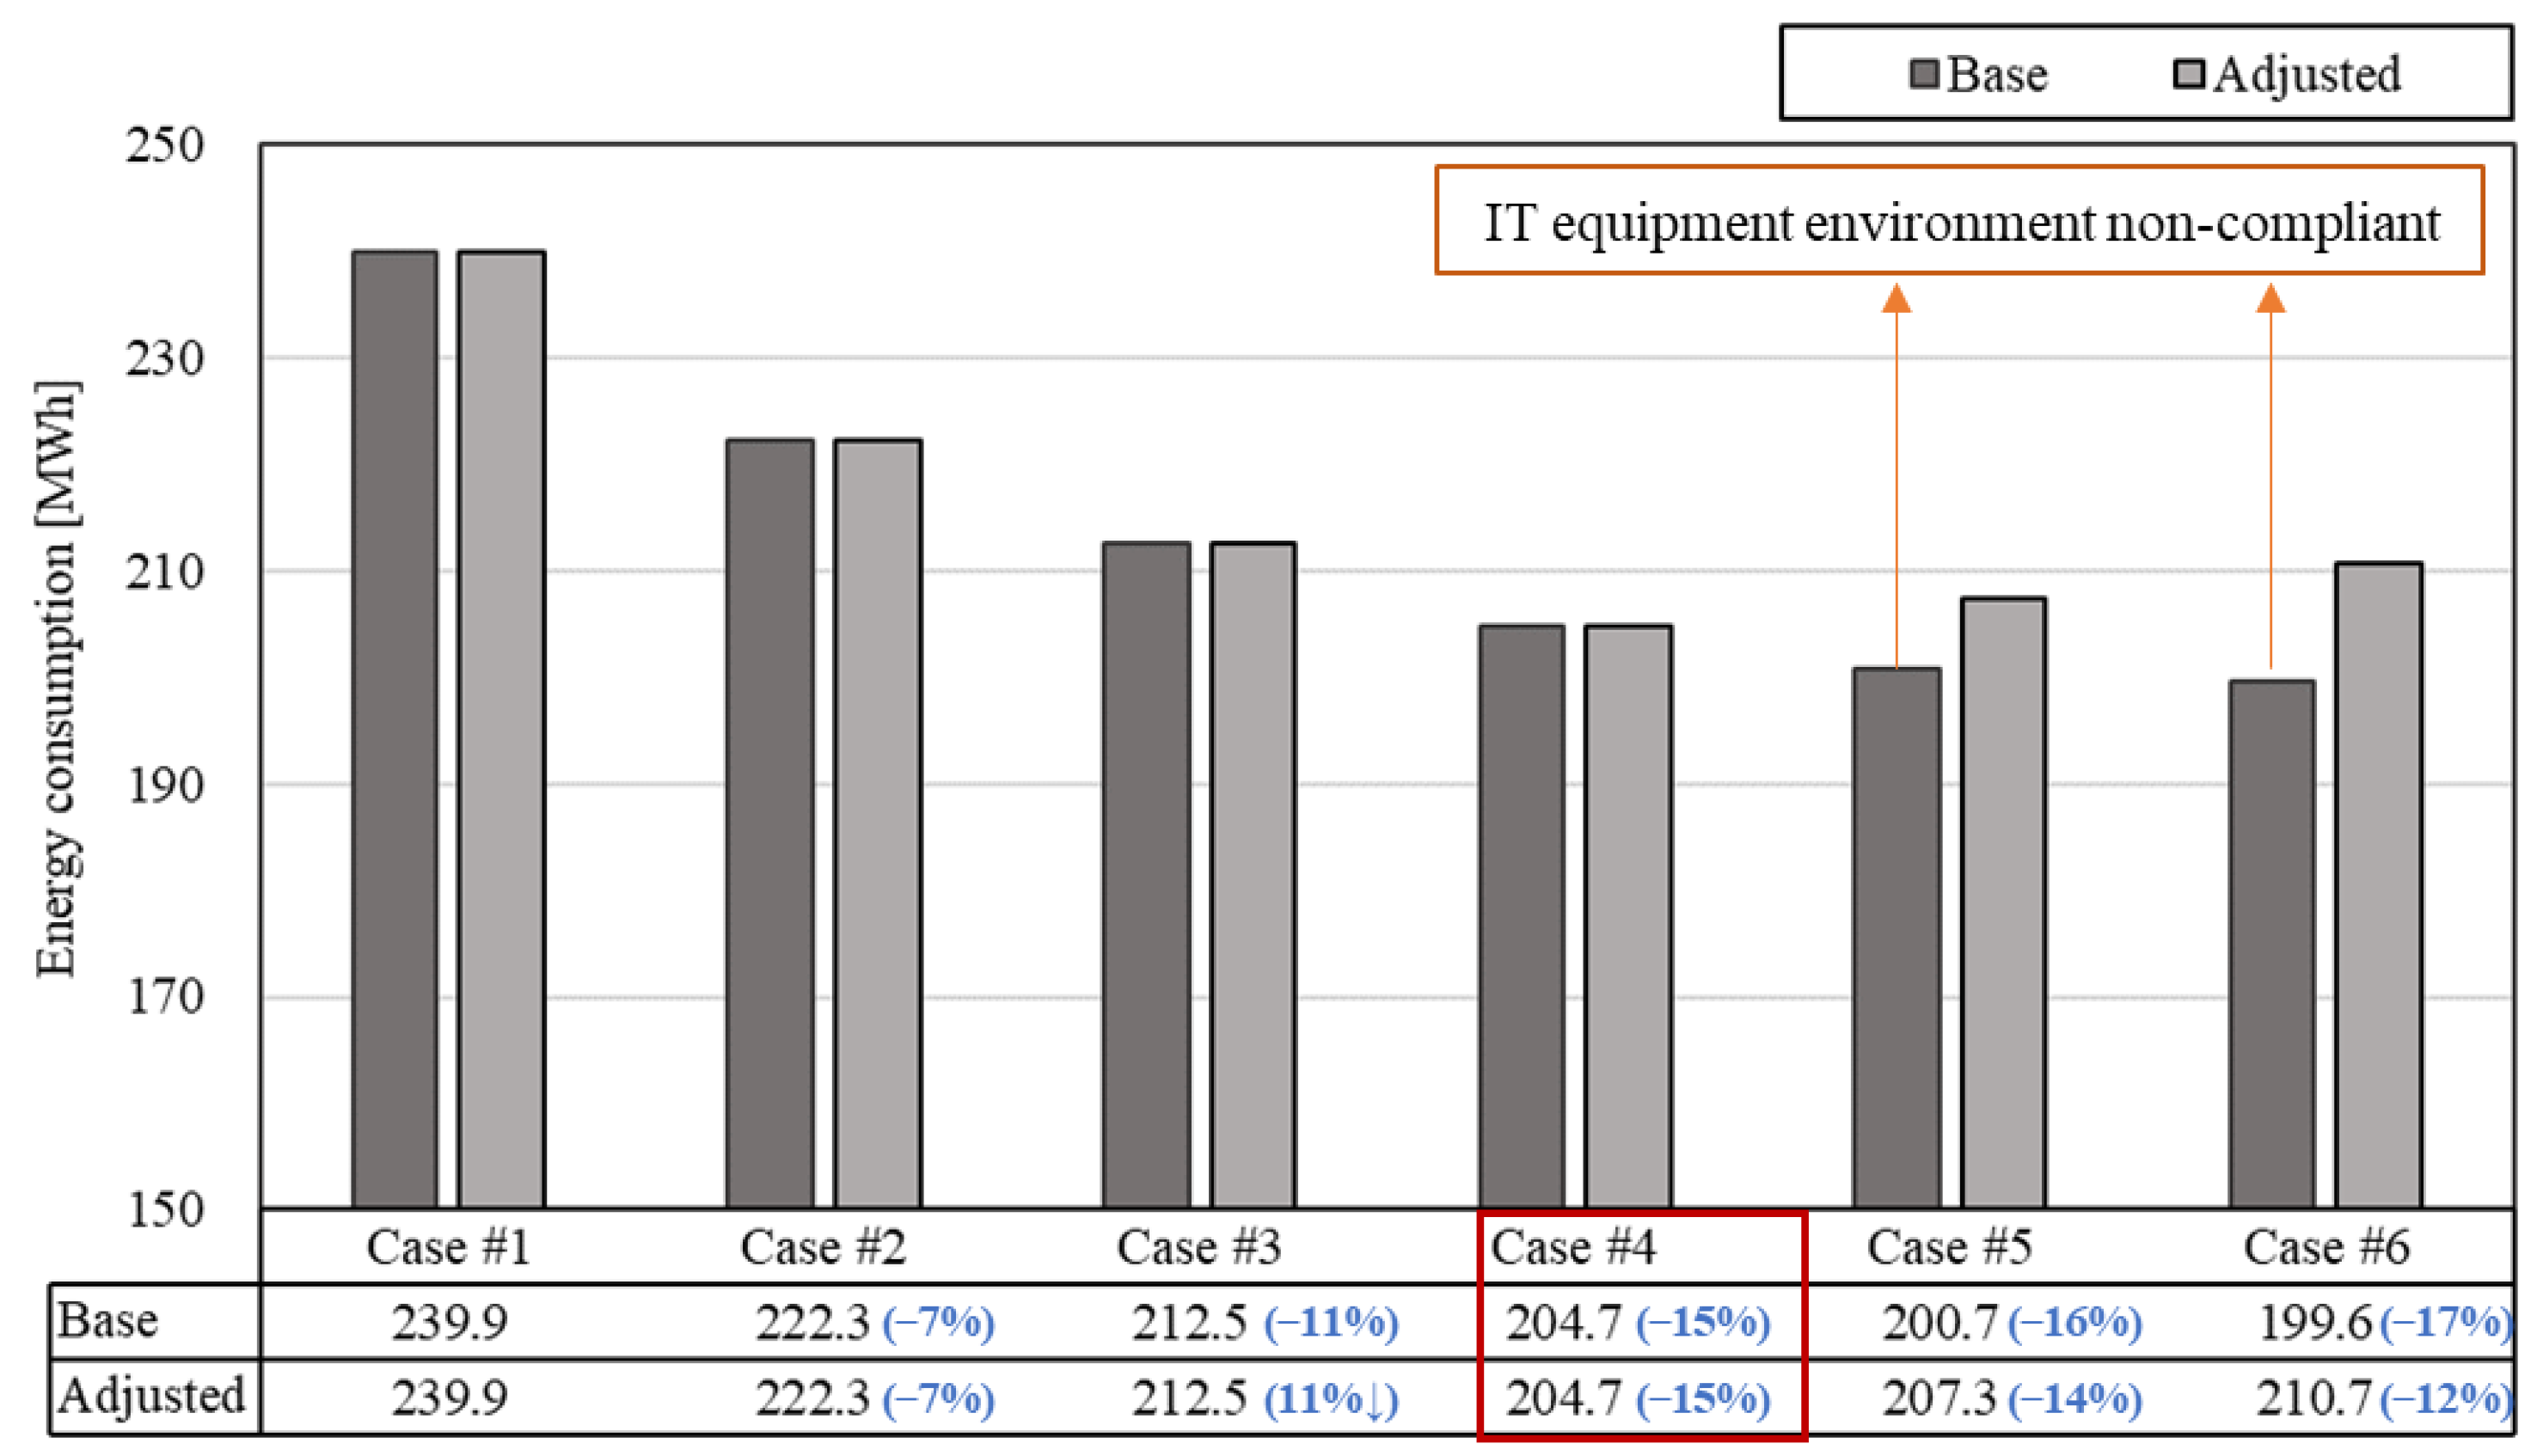
Figure 8 presents the annual energy consumption for each simulation case according to cooling system capacity.
The results showed that with adjusted cooling capacities, energy consumption from Case #1 to Case #6 was reduced by up to approximately 15% compared to the baseline (Case #1). A gradual decrease in energy use was observed from Case #2 to Case #5, while in Case #6, the reduction rate declined by 2.9% compared to Case #5. This decrease in efficiency was attributed to increased energy use in cooling and reheating caused by overcooling, which was necessary to meet the humidity standard at the IT equipment inlet when high-humidity air was introduced.
Based on the annual cumulative energy consumption analysis, Case #4 (5 to 14 °C) was identified as the optimal allowable OA intake dry-bulb temperature range under adjusted cooling capacities.
4. Conclusions
This study aimed to determine the optimal OA intake dry-bulb temperature range for a data center located in Daejeon, Republic of Korea (ASHRAE Climate Zone 4A), by applying a dry-bulb temperature–based economizer system. For this purpose, simulation scenarios were established based on allowable OA temperature thresholds, and simulations were conducted after determining and applying the appropriate cooling system capacities. The analysis focused on the air condition at the IT equipment inlet and the corresponding energy consumption to evaluate system performance.
The key findings are summarized as follows:
- (1)
The analysis of allowable OA intake durations revealed a significant seasonal variation in OA utilization. In summer, high temperature and humidity limit the intake potential, whereas in winter and interseason periods, longer intake durations allowed for greater cooling energy savings.
- (2)
When the maximum OA intake dry-bulb temperature exceeded 16 °C, the baseline cooling capacity (30 RT) was insufficient to maintain the relative humidity at the IT equipment inlet within the ASHRAE TC 9.9 limits. Simulation-based adjustments revealed that cooling capacities between 30 RT and 56 RT were required depending on the case, and all scenarios satisfied the humidity criteria after adjustment.
- (3)
The energy consumption analysis showed that the effectiveness of OA intake varied depending on climatic conditions. In summer, the introduction of humid OA led to overcooling and subsequent reheating, resulting in increased total energy use. Conversely, during the interseason and winter periods, the economizer operation significantly reduced cooling energy consumption. The annual energy analysis confirmed energy savings in most scenarios with adjusted cooling capacities, with Case #4—defined by a 14 °C intake threshold and 30 RT capacity—achieving the greatest reduction of approximately 15%.
Based on the simulation results, Case #4 was identified as the most balanced configuration for applying a fixed year-round OA intake strategy, achieving both energy efficiency and compliance with IT equipment environmental standards. Furthermore, seasonally adjusting the OA intake dry-bulb temperature may allow for slightly higher thresholds during interseason periods. Under favorable nighttime conditions with low humidity, extending the threshold to the level defined in Case #6 appears feasible.
While increasing the cooling system capacity helped meet the humidity control requirements under expanded OA intake conditions, it inevitably results in higher capital expenditure (CAPEX). Nevertheless, this cost increase may be offset by operational expenditure (OPEX) savings enabled through extended economizer operation. Although an in-depth economic assessment was beyond the scope of this study, such trade-offs are critical for practical implementation and should be considered in future research.
For data centers located in Daejeon, South Korea (ASHRAE Climate Zone 4A), it is recommended to implement a flexible OA control strategy that reflects seasonal and annual climatic variability to maximize energy savings while maintaining a stable thermal environment for IT equipment.
The simulation model was developed in accordance with ASHRAE TC 9.9 guidelines and based on a previously validated data center model. However, following the incorporation of the economizer control strategy, no experimental or field-based validation was conducted. Therefore, future research should aim to implement the proposed control strategy in an operational data center to evaluate its real-world applicability. Additionally, several technical challenges must be addressed for practical deployment, including the optimization of sensor placement for accurately monitoring OA and IT equipment inlet conditions, integration of control logic with existing BMS platforms, and the development of real-time feedback mechanisms for dynamic OA regulation. Although these aspects were beyond the scope of this study, they are essential for practical implementation and should be explored in future work.
While the findings are based on the climatic conditions of Daejeon, South Korea, they may be extended to other regions within ASHRAE Climate Zone 4A due to shared climatic characteristics. However, climatic and operational variability across different regions, even within the same climate zone—may, influence the performance of the proposed strategy. Therefore, further comparative studies across diverse geographic contexts, including locations beyond Daejeon, are required to evaluate the robustness and generalizability of the results.
Although the proposed approach in this study was developed and validated using a small- to medium-scale data center model, the core concept—controlling OA intake based on dry-bulb temperature—can be applied to larger facilities with appropriate adjustments. However, when scaling the strategy to larger data centers, new challenges may arise, such as increased internal heat loads, more complex airflow distribution, and the need for coordinated control across multiple zones. Therefore, to assess the scalability and practical applicability of the proposed strategy, future research should involve high-fidelity simulations or pilot-scale implementations in large and multi-zone data centers.
