Article

Dynamic Optimization and Performance Analysis of Solar Thermal Storage Systems for Intermittent Heating in High-Altitude Cold Regions

1
State Key Laboratory of Green Building in China, Xi’an University of Architecture and Technology, Xi’an 710055, China
2
School of Building Services Science and Engineering, Xi’an University of Architecture and Technology, Xi’an 710055, China
*
Author to whom correspondence should be addressed.
Buildings 2025, 15(16), 2908; https://doi.org/10.3390/buildings15162908
Submission received: 20 July 2025 / Revised: 13 August 2025 / Accepted: 14 August 2025 / Published: 17 August 2025

Abstract

Solar thermal technology is an important component of low-carbon energy systems, but its application potential is constrained by two key factors: the inherent limits of energy flux density and the temporal mismatch between supply and demand. This study examined efficiency losses in building heating systems in Northwest China caused by the mismatch between supply and demand in intermittent solar thermal storage systems. Three typical building heating models (Day–Night Intermittent Mode, Day–Night + Monthly Intermittent Mode, and Composite Intermittent Mode (Day–Night + Weekly + Monthly)) were constructed through SketchUp, integrating the Transient System Simulation Tool (TRNSYS) with improved calculation methods in an innovative way. The study first examined regional energy consumption patterns and the temporal characteristics of building occupancy and then proposed a collaborative optimization framework for thermal collection and storage, focused on improving the dynamic matching algorithm of the thermal collection area ratio and the tank volume ratio and establishing a tank capacity calculation model that considers the time-varying characteristics of heat demand and fluctuations in thermal collection efficiency during the intermittent heating cycle. The results show that compared with continuous operation, the intermittent strategy reduces the annual cumulative heat load by 13–33%, among which the Day–Night Intermittent Mode shows the daily peak load reaches 1.8 times the normal value during restart, while the daily fluctuation amplitude of the Day–Night + Monthly Intermittent Mode decreases by 42%. The corresponding solar energy guarantee rate reaches 86–88%, and the heat storage loss is reduced by 19–27%. The time-varying coupling design method established in this study provides an optimization path that takes into account both system efficiency and economy for intermittent heating scenarios. The proposed dynamic capacity configuration criterion has universal guiding value for the design of solar district heating systems.

1. Introduction

The sustainable development of modern societies is fundamentally dependent on efficient energy management systems. As the world’s leading energy producer and second-ranked consumer [1], China’s energy infrastructure plays a pivotal role in global sustainability efforts. Statistical records indicate that national energy consumption in 2020 amounted to 4.98 billion tons of standard coal equivalent (tce) [2], with the construction sector responsible for 46.5% of this total [3]. Particularly significant is the thermal energy demand in northern urban areas, where 15.6 billion square meters of heated spaces require 214 million tce annually, constituting approximately 20% of national building energy utilization [4,5]. Projections suggest this heated area will expand to 20 billion square meters [6], underscoring the urgency for sustainable solutions. In response to these challenges, China announced its 2060 carbon neutrality target in September 2020. [7]. This ambitious environmental commitment necessitates substantial transformations in energy infrastructure and consumption patterns. A critical pathway involves reducing dependence on fossil fuel combustion while accelerating the integration of renewable alternatives, particularly photovoltaic and wind power generation systems [8]. The nation’s geographical endowment offers ideal solar energy conditions, especially in northwestern regions [9]. This natural advantage positions China to potentially lead in the global transition toward sustainable energy systems.
Solar heating systems (SHS), comprising solar collectors, thermal storage, and terminal heat distribution components, are among the most mature and widely adopted renewable technologies for thermal energy utilization in buildings [10,11]. Current operational strategies for SHS predominantly adopt either continuous or intermittent modes, each presenting distinct technical characteristics and application scenarios [12].
Continuous operation mode maintains 24-hour heating regardless of occupancy patterns, a strategy particularly prevalent in Northern China’s district heating systems [13]. While this approach ensures superior thermal comfort and system stability for large-scale applications [14], it incurs significant energy consumption due to prolonged operation periods [15]. In contrast, intermittent heating demonstrates enhanced energy efficiency by aligning heat supply with actual occupancy patterns through zoned and time-dependent thermal distribution [16,17]. This adaptive strategy concentrates heating in actively occupied spaces based on occupants’ winter activity rhythms and spatial preferences [18,19]. Intermittent heating saves 15–30% energy while ensuring thermal comfort [20]. However, critical knowledge gaps persist regarding the development of building-specific intermittent strategies, particularly in matching solar thermal system characteristics with diverse occupancy patterns across building typologies.
Significant research efforts have been devoted to optimizing intermittent heating systems across multiple performance dimensions. Meng et al. [21] identified wall insulation configurations (internal insulation and foam concrete walls) that maximize thermal efficiency under intermittent conditions. Through empirical testing in Cambridge residences, Badran et al. [22] revealed that low-temperature continuous heating outperformed intermittent heating in both comfort (12% improvement) and cost-effectiveness (5% energy saving advantage). Computational fluid dynamics simulations by Wang et al. [23] quantified that interior wall thermal dynamics account for ≥65% of room heat load during intermittent heating, with heating duration being the predominant influencing factor. Subsequent COMSOL Multiphysics4.1 (COMSOL)-based investigations [24] elucidated the thermal storage-release characteristics of floor heating systems, demonstrating a 40% improvement in thermal response during intermittent cycles.
The thermoelectric analogy model developed by Wang et al. [12] established that convection heating systems achieve 18% faster temperature recovery and 22% lower heating loads compared to radiant systems under intermittent heating. Zhu et al.’s EnergyPlus simulations [25] in hot summer/cold winter regions revealed that internal wall insulation (0.03 m thickness) enhances intermittent heating efficiency by 27% compared to external insulation alternatives. Sun et al. [26] advanced predictive modeling through dynamic building models, achieving >80% accuracy in forecasting intermittent heating requirements under variable solar radiation and ambient conditions. Tsilingiris’s finite difference analysis [27] in Mediterranean climates demonstrated that interior-wall insulation reduces quasi-steady-state heat loss by 35% during intermittent heating.
Despite these advancements, current design methodologies remain inadequate for high-altitude plateau regions characterized by extreme diurnal temperature variations (ΔT > 15 °C) and intensive solar radiation (≥6 kWh/m2/day) [28]. A critical research gap exists in resolving the temporal mismatch between solar energy availability and building thermal demand under intermittent heating. This study addresses three fundamental challenges: (1) developing adaptive solar collection-storage systems responsive to intermittent demand patterns; (2) optimizing traditional energy conversion efficiency while minimizing fossil fuel dependence; and (3) establishing climate-specific design protocols for solar intermittent heating systems.
The present work proposes an optimized design framework for solar intermittent heating systems through three methodological innovations: First, developing building typology-specific intermittent heating strategies based on occupancy pattern analysis; second, creating dynamic system models that synchronize solar thermal collection with intermittent demand profiles; third, formulating plateau climate-adaptive design criteria addressing high radiation intensity and rapid thermal dissipation characteristics. This integrated approach aims to achieve dual objectives: meeting winter heating demands for intermittent-use buildings while reducing heating energy consumption by 40–50% compared to conventional systems.
Unlike prior studies that typically focus on continuous heating modes or isolated intermittent strategies, this study innovatively integrates building occupancy pattern analysis, dynamic simulation modeling, and climate-responsive system design tailored to high-altitude cold regions. The proposed methodology effectively addresses the temporal mismatch between solar energy availability and building heat demand and establishes a generalizable optimization framework adaptable to various intermittent heating modes. These contributions distinguish this work from prior studies and demonstrate its value for optimizing solar thermal storage systems under complex building operation scenarios.

2. Study on Heat Load Characteristics of Typical Intermittent Heating Buildings and Modification of Design Methods

2.1. Classification and Selection of Intermittent Heating Buildings

2.1.1. Classification of Buildings with Intermittent Heating

Heating schedules are typically categorized based on temporal attributes, including calendar variations (holidays vs. non-holidays, weekends vs. weekdays) and diurnal patterns (day vs. night) [29]. Temperature regimes for space heating can be classified into three operational modes: active heating periods, duty cycle maintenance, and non-heating intervals [13]. These thermal requirements are fundamentally dictated by building functionality, with four principal architectural classifications recognized: residential, industrial, public service, and agricultural structures [30].
Intermittent heating patterns are particularly applicable to occupancy-regulated facilities. Residential complexes and dormitories exemplify typical intermittent heating due to their predictable occupancy cycles. Similarly, within public infrastructure categories, office buildings demonstrate characteristic intermittent heating demands aligned with commercial working hours, as illustrated in Figure 1. This operational paradigm contrasts with continuous heating requirements observed in industrial or agricultural facilities, where thermal stability is paramount.

2.1.2. Selection and Use of Typical Intermittent Buildings

Through systematic analysis of occupancy patterns, this study establishes three characteristic intermittent heating modes: (1) Day–Night Intermittent Mode, (2) Day–Night + Monthly Intermittent Mode, and (3) Composite Intermittent Mode (Day–Night + Weekly + Monthly), as shown in Figure 2.
Office buildings, constituting the predominant category in public infrastructure (32.7% of total floor area), served as the representative for the day–night mode. Workforce analysis revealed distinct temporal patterns: 90% workforce arrived clustered between 08:00 and 09:00, while departure times exhibited greater dispersion, with 84% occurring from 17:00 to 18:00. Notably, among the 65 surveyed office buildings, 23% remained operational on weekends.
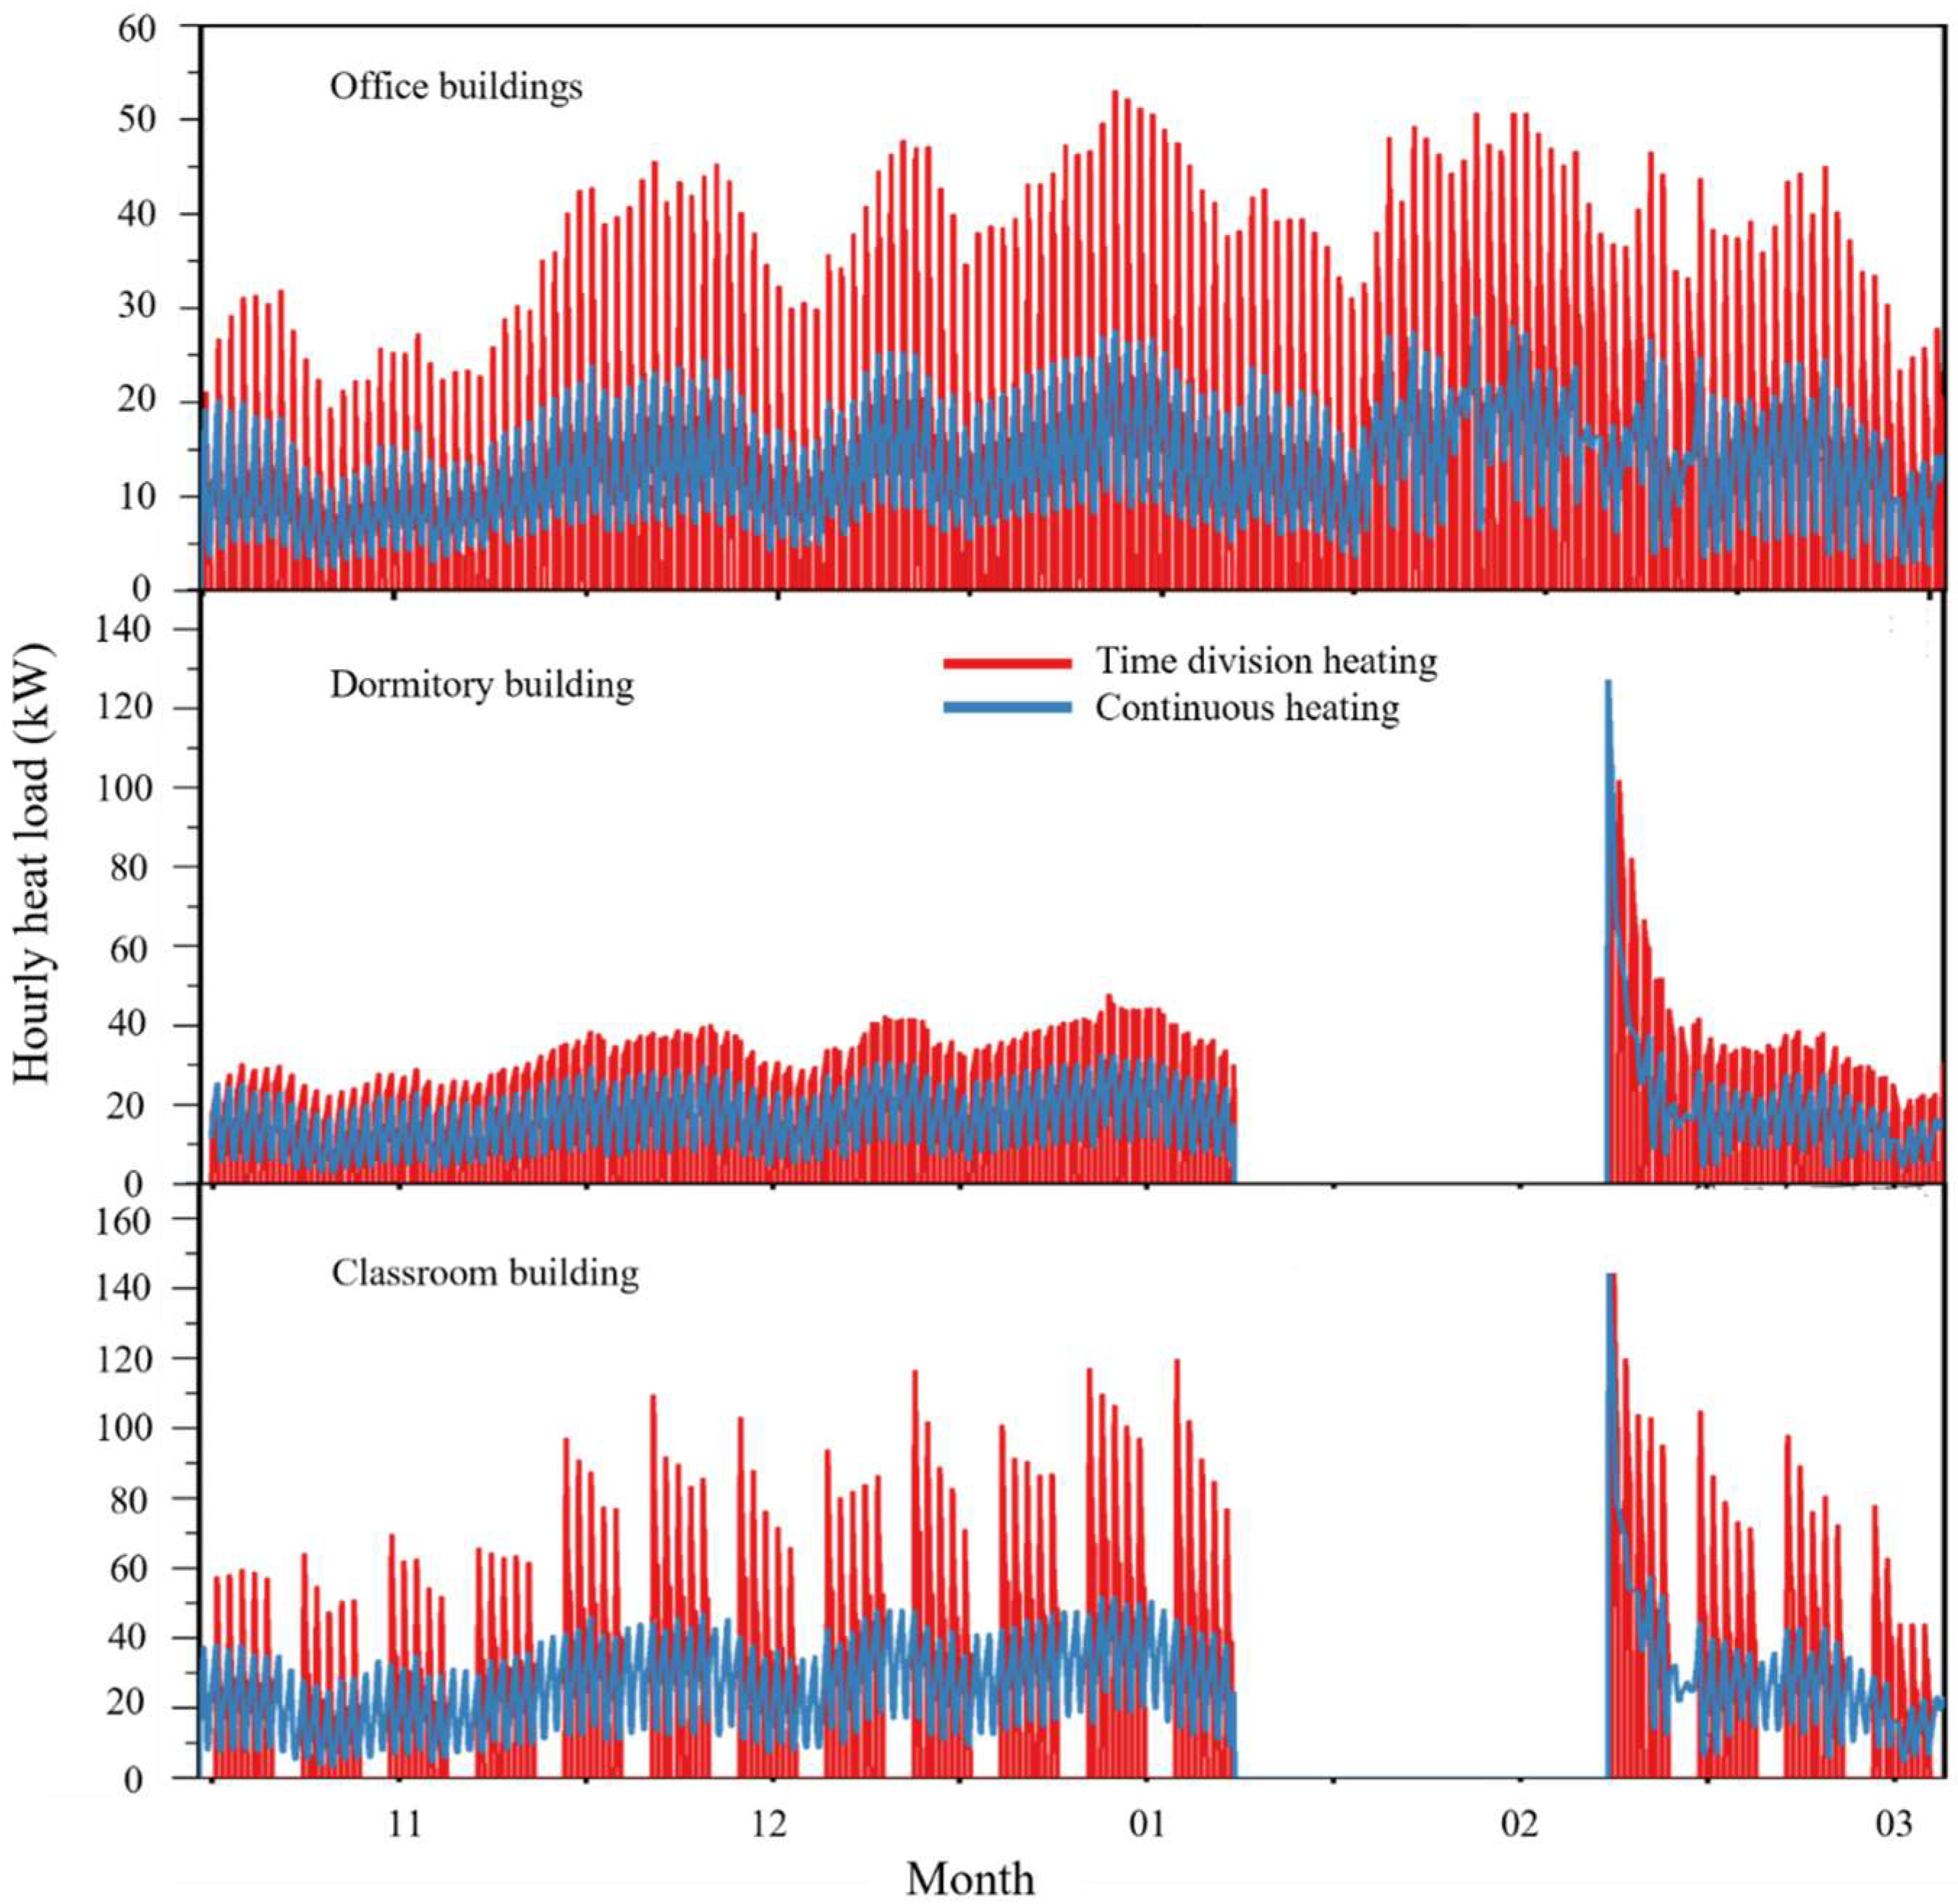
Educational dormitories exemplify the Day–Night + Monthly Intermittent Mode, demonstrating heating suspension during winter academic recesses while maintaining thermal regulation between daily dismissal (16:30–17:30) and morning reactivation (06:00–07:00). Conversely, academic-research complexes manifest the Composite Intermittent Mode (Day–Night + Weekly + Monthly), ceasing climate control during weekends, winter breaks (January–February) and summer recesses (July–August). The heating system is completely shut down during the winter break, which is reflected in the zero heat load observed. See Figure 2 and Figure 3.

2.2. Analysis of Heat Load Law

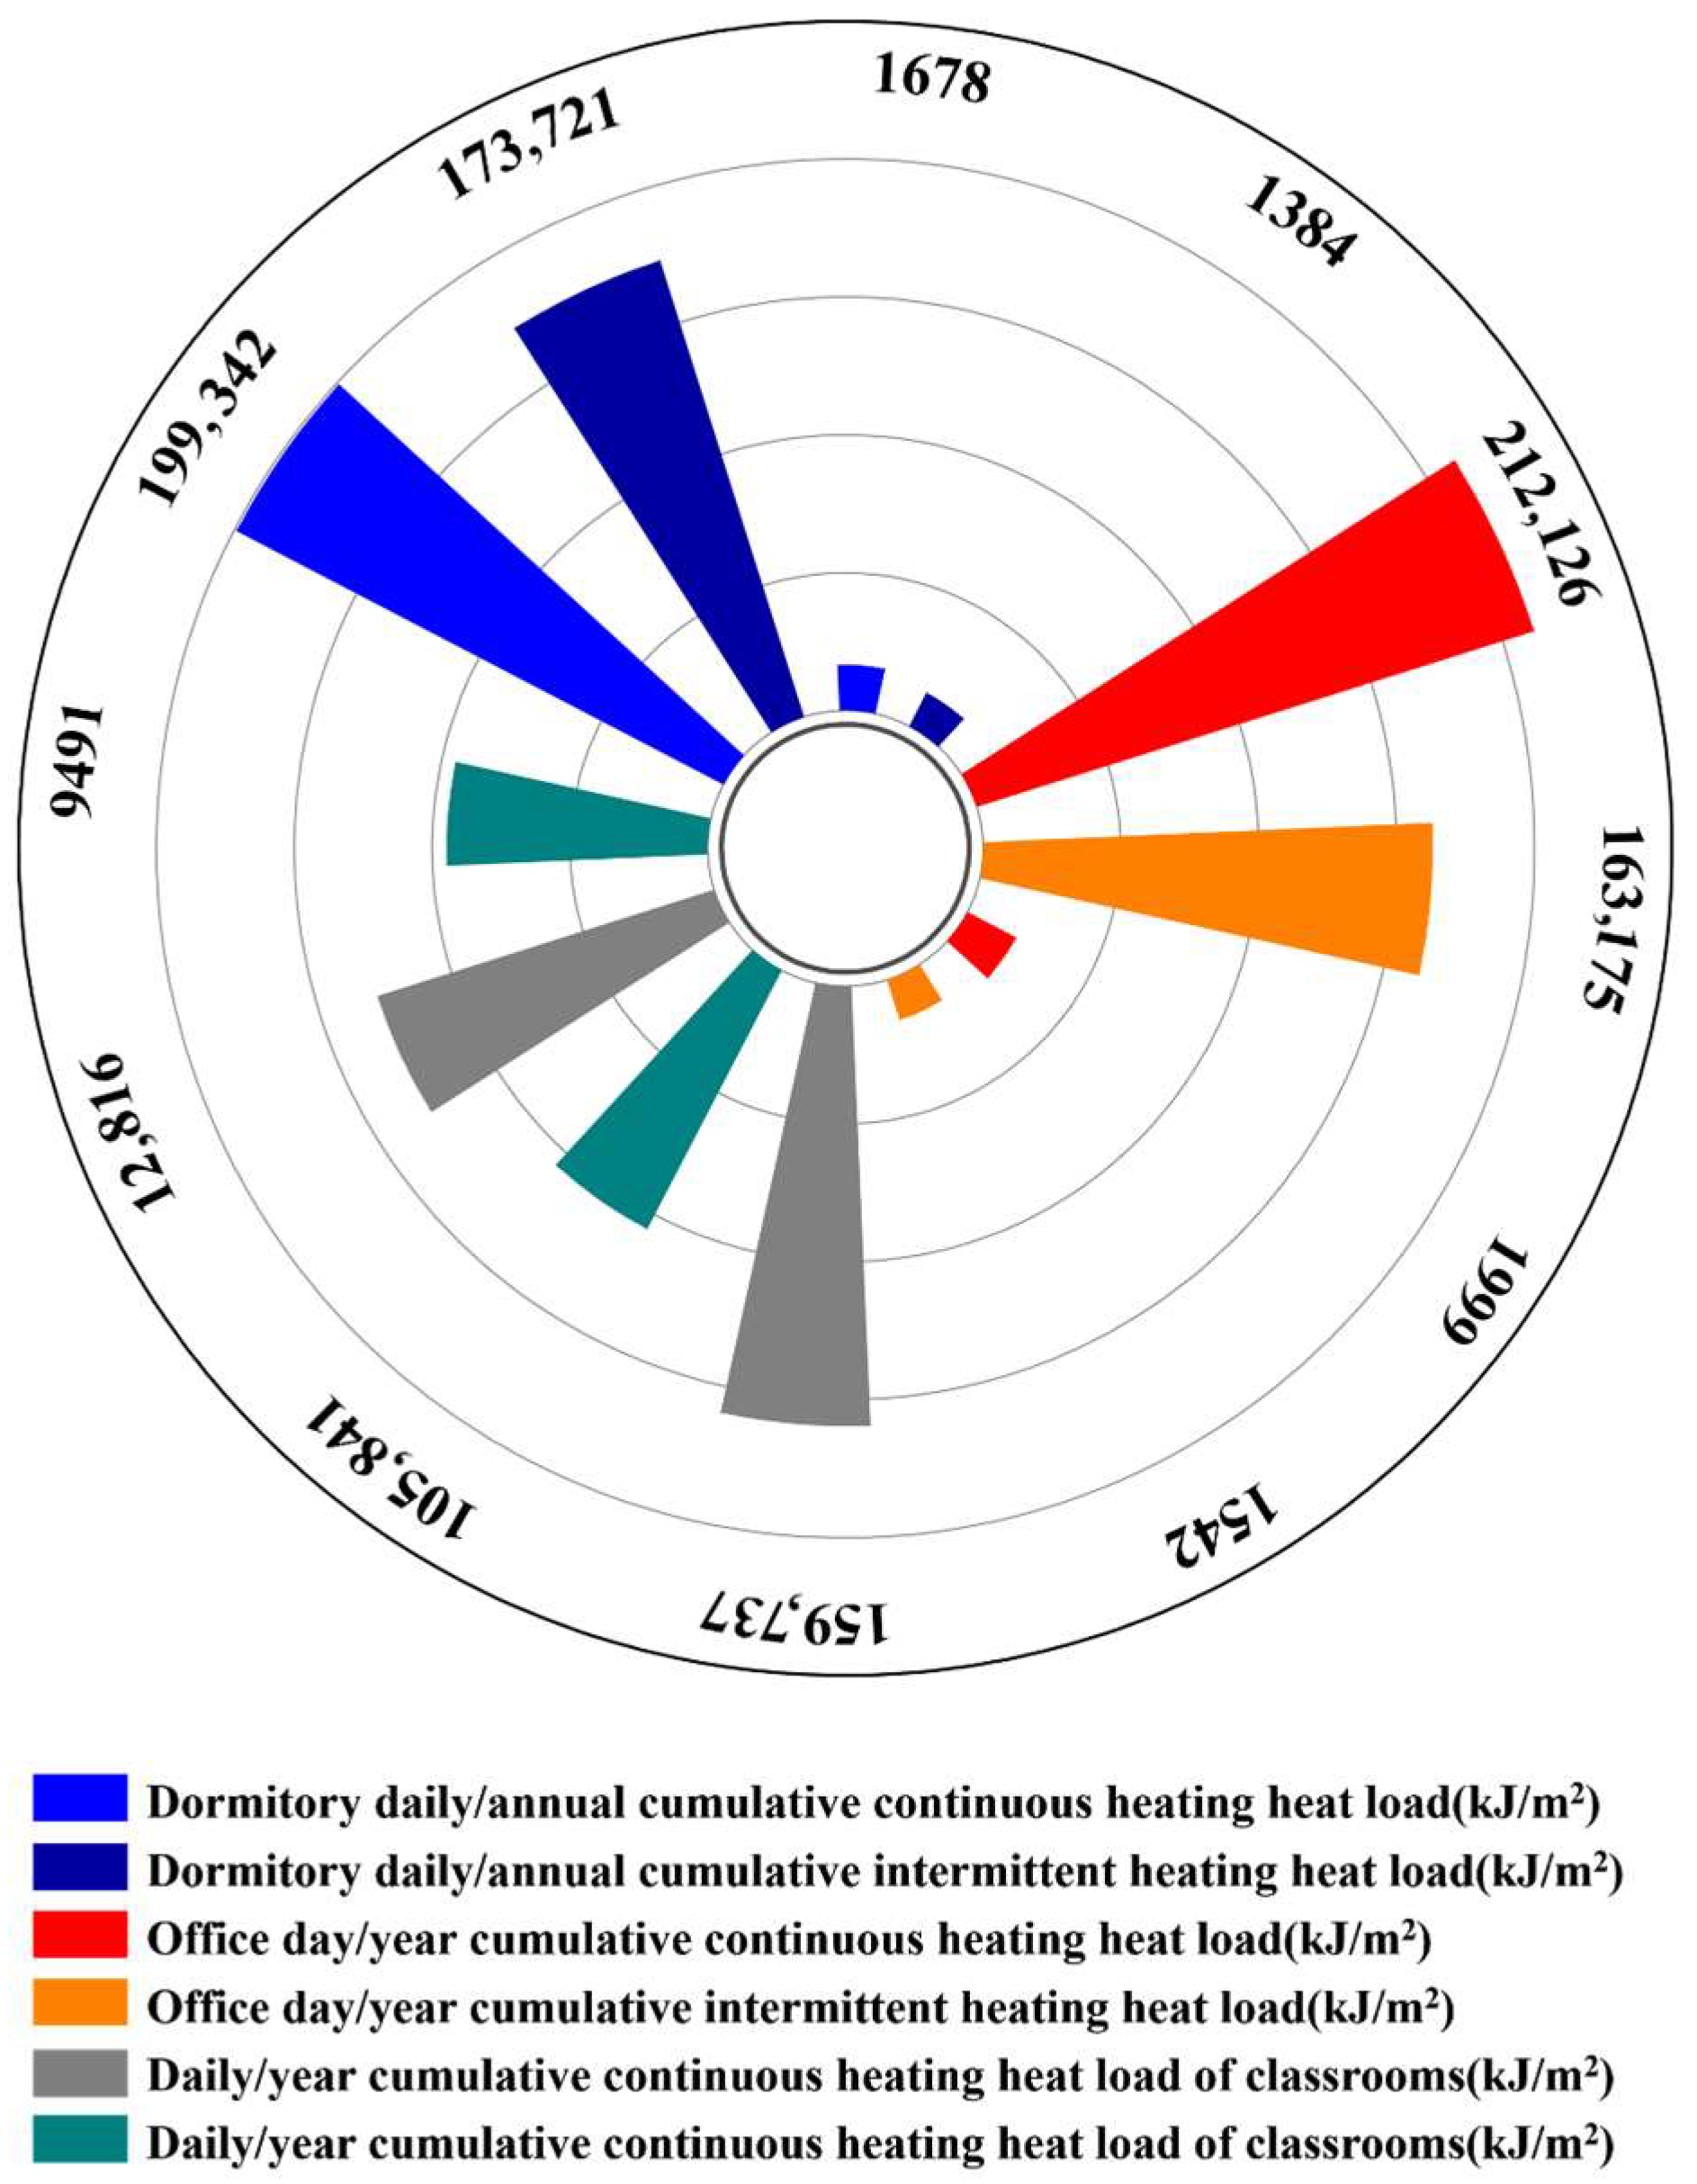
Figure 3 demonstrates distinct thermal performance characteristics across building typologies under intermittent heating regimes. Office buildings show 2.28× peak load but 24% lower annual demand. Dormitory facilities employing the C show moderated load fluctuation (1.68× peak multiplier) with 13% annual load reduction, benefiting from reduced nocturnal preheating requirements compared to conventional night setback strategies.
Academic structures utilizing the Composite Intermittent Mode (Day–Night + Weekly + Monthly) present critical operational divergences: 30% elevated Monday preheating loads versus weekly maxima, coupled with 28% peak intensification during post-holiday recovery periods. Weekend heating suspension induces pronounced thermal inertia loss, manifesting in progressive load decline from Monday maxima (Qmax) to Friday minima (Qmin) during typical operational weeks.
Comparative analysis of annualized energy metrics (Figure 4) reveals intermittent heating induces a 33% cumulative load reduction in classroom complexes versus 24% and 13% reductions in offices and dormitories, respectively, establishing temporal modulation intensity as a key determinant of energy conservation potential.

2.3. Design Method of Heat Storage for Intermittent Solar Heating System

Through theoretical analysis of thermal processes in solar collection-storage systems under various intermittent heating conditions, this study develops an optimized design methodology for solar-assisted intermittent heating systems. The established framework incorporates parameter corrections specific to intermittent heating modes, enabling precise system configuration for enhanced thermal performance.

2.3.1. Design Method of Intermittent Solar Thermal Collector

The periodic heat load fluctuations characteristic of intermittent heating buildings necessitate distinct computational approaches for both cumulative solar energy harvesting and thermal demand assessment under intermittent heating conditions.
(1) Cumulative solar radiation on the inclined surface.
Through parametric optimization of intermittent radiant heating systems, the following analytical expression is derived:
Q u = i = 1 n τ 1 τ 2 I θ ( τ ) A c d τ ,
In the equation, Qu is the total solar radiation during intermittent heating, kJ; n is the number of operation days; τ1 and τ2 are daily solar radiation time intervals; Iθ(τ) is the solar irradiance on the tilted collector, W/m2; and Ac is the collector area, m2.
(2) Cumulative heat consumption of buildings.
The cumulative heat load during intermittent heating periods is the fundamental design parameter and is calculated as follows:
Q L = i = 1 n τ a τ b q l ( τ ) d τ ,
In the equation, Q′L is the cumulative heat consumption of intermittent heating buildings during the heating period, kJ; n is the number of intermittent heating operation days; τa and τb denote the start and stop times of intermittent heating operation; ql(τ) is the hourly heat load of the intermittent heating building, comprising heat loss through the envelope, infiltration loss from cold air, and internal heat gains, measured in watts, kW.
(3) Intermittent solar collector area.
The solar collector area for intermittent heating is determined through seasonal energy balance analysis, correlating cumulative solar irradiation with building thermal demand across the entire heating period, as expressed by:
Q u η c d = Q L ,
Intermittent solar collector area calculation formula:
A c = i = 1 n f n τ a τ b q l ( τ ) d τ η c d ( 1 η L ) i = 1 n τ 1 τ 2 I θ ( τ ) d τ ,
In the equation, Ac is the total area of intermittent solar collectors, m2; ηcd is the average collector efficiency during the heating period; ηL is the heat loss rate of the storage tank and piping; and n is the number of intermittent heating operation days.

2.3.2. Design Method of Intermittent Solar Thermal Storage

A computational methodology for determining solar storage tank capacity is developed, incorporating operational intermittency through thermal energy balance analysis. The storage volume is derived from the temporal integration of positive differentials between solar collection and thermal demand, yielding the following expression for stored energy (∆Q):
Δ Q = a b Q u ( τ ) Q l ( τ ) d τ = a b I θ ( τ ) A c η c d Q l ( τ ) d τ ,
where a and b represent the intersection points between the solar energy collection curve and the hourly heat load curve.
Thermal storage capacity determination requires distinct computational approaches corresponding to specific load fluctuation patterns. Figure 5 illustrates the characteristic load profiles for three fundamental intermittent heating modes, providing the basis for subsequent capacity calculations.
Figure 5a demonstrates the Day–Night + Monthly Intermittent Mode, featuring daytime thermal collection and nocturnal heating provision. The storage requirement equates to the total solar energy harvested during daylight hours, expressed as:
Δ Q = τ 1 τ 2 Q u ( τ ) d τ ,
Figure 5b presents the Composite Intermittent Mode, exhibiting 7-day cyclical load fluctuations with progressive 5-day attenuation. The storage capacity design parameter is derived from the mean daily thermal storage requirement across fluctuation cycles, expressed as:
Δ Q = 1 n i = 1 n a b Q i u ( τ ) Q i l ( τ ) d τ ,
Figure 5c illustrates the Day–Night Intermittent Mode, characterized by daytime heating operation and nocturnal shutdown. The thermal storage requirement is determined through differential integration of the fitted collection and demand profiles during operational periods, expressed as:
Δ Q = a b Q u ( τ ) Q l ( τ ) d τ ,
In the equation, Qu(τ) represents the fitted curve of effective solar heat collection, while Ql(τ) represents the fitted curve of the building’s hourly heat load.

2.3.3. Design of a Typical Intermittent Solar Thermal Storage System

(1) Design of a typical intermittent solar thermal collector system.
The collector area for intermittent solar heating systems is calculated based on the seasonal heat load and solar radiation input, using the correction formula previously introduced in Equation (4).
For this analysis, the heat loss rate ηL of the solar energy system is assumed to be 0.2, and the average solar collection efficiency is taken as 0.5. These values help calculate collector areas for the three modes.
The cumulative heat consumption of intermittent buildings is determined using a dynamic hourly simulation method, as defined in Equation (2). This dynamic thermal demand profile serves as the input for sizing both the collector area and the corresponding storage capacity.
The solar radiation during the intermittent heating day is accumulated. The solar radiation intensity of three typical intermittent heating systems during operation is calculated as follows:
H = t 1 t 2 h s ( τ ) d τ ,
The required collector areas for three types of typical intermittent buildings and the required collector areas per unit heating area are shown in Table 1.
(2) Typical intermittent solar water tank volume design.
Building upon the established design methodology for intermittent thermal collection and storage systems, the solar storage tank volume calculation is optimized, yielding the following corrected formulation for intermittent heating:
V = a b Q u ( τ ) d τ 4.187 ( t e n d t l ) a b [ Q u ( τ ) Q l ( τ ) ] d τ 4.187 ( t e n d t l ) i = 1 i = n a b [ Q i u ( τ ) Q i l ( τ ) ] d τ n 4.187 ( t e n d t l )

3. Numerical Simulation

3.1. Building Overview and Heat Load

The Qinghai–Tibet Plateau experiences pronounced diurnal temperature fluctuations and high levels of ultraviolet (UV) radiation [31]. This study employs SketchUp for architectural modeling and TRNSYS for thermal performance simulation.

3.1.1. Selection of Typical Cities and Meteorological Parameters

The Qinghai–Tibet Plateau has exceptional solar energy potential, characterized by >3000 annual sunshine hours and 8170 MJ/m2 of solar radiation [32,33]. With limited centralized heating infrastructure, this region represents an ideal candidate for distributed thermal solutions. This study selects Lhasa as a representative case for intermittent solar heating analysis, employing Typical Meteorological Year (TMY-2) data for the designated heating season (November 1–March 20). Lhasa’s outdoor meteorological parameters are shown in Figure 6.

3.1.2. Typical Intermittent Heating Building Interior Design Parameters

Thermal comfort standards in cold regions indicate 90% occupant acceptance within 18–23 °C [34,35]. Accordingly, office building heating systems are designed for 18 °C indoor temperatures, optimizing energy efficiency and thermal comfort. Research suggests that indoor temperature conditions can significantly affect cognitive performance, particularly in learning environments [36,37], with 15 °C identified as the optimal expected thermal comfort temperature [38]. Dormitory heating systems in severe cold regions maintain 18 °C indoor temperatures, consistent with residential comfort standards.

3.1.3. Model Establishment and Parameter Setting

Through architectural analysis, three representative building types were selected for simulation: a standard mid-rise office building (Figure 7a), a low-rise (≤5 floors) classroom building with diurnal occupancy patterns [39] (Figure 7b), and a square-plan dormitory building, chosen from four common typologies (longitudinal, square, Y-shaped, and enclosed) based on prevalence [40] (Figure 7c). The specific parameters of three typical building models are shown in Table 2.
Table 3 presents the optimized wall structural parameters designed to meet stringent energy efficiency standards for buildings in severe cold regions.

3.2. Mathematical Model

Utilizing fundamental heat balance principles [41], this study develops comprehensive mathematical representations for solar heating systems across three primary intermittent heating modes. The modeling framework incorporates six essential components: (1) solar collector model, (2) thermal storage tank model, (3) auxiliary heating model, (4) radiator model, (5) hydraulic circulation model, and (6) room thermal equilibrium model.

3.2.1. Solar Collector Model

The energy equation for a solar thermal collector is:
Q ˙ A c = F R ( τ α ) e G F R U L ( t 1 t a ) ,
The solar collector efficiency equation is:
η = a 0 a 1 Δ T G a 2 ( Δ T ) 2 G ,
Thermal efficiency is determined by three parameters: a0, a1, and a2, which can be obtained based on the test parameters of the collector sample. The selected solar collector is the Micoe P-Y/0.6 flat-plate collector, and the relevant parameters are: a0: 0.7843, a1: 5.5024, a2: 0.

3.2.2. Hot Water Storage Tank Model

The energy balance equation of the hot water storage tank is:
d T tank d τ = Q in , tank Q out , tank C tank ,
The heat loss equation of the hot water storage tank is:
Q l o s s , j = Q l o s s , t o p , j + Q l o s s , b o t t o m , j + Q l o s s , e d g e s , j ,
Q l o s s , t o p , j = A t o p , j U t o p ( T t a n k , j T e n v , t o p ) ,
Q l o s s , b o t t o m , j = A b o t t o m , j U b o t t o m ( T t a n k , j T e n v , b o t t o m ) ,
Q l o s s , e n d g e s , j = A e n d g e s , j U e n d g e s ( T t a n k , j T e n v , e n d g e s ) ,
The energy balance equation corresponding to the water tank node is:
Q c o n d , j = A j U j T j T j 1 L c o n d , j + A j 1 U j 1 T j T j 1 L c o n d , j 1 ,
In the equation, Aj is the heat loss surface area of the storage tank, m2; Ttank,j is the temperature at node j of the storage tank, °C; and Tenv is the ambient temperature surrounding the storage tank, °C.

3.2.3. Auxiliary Heat Source Model

The auxiliary heat source heating energy equation is:
Q i n p u t = m ˙ C p ( T o u t T i n ) ε h e a t e r ,
In the equation, Qinput is the heat supplied to the fluid by the auxiliary heat source; Tout and Tin are the outlet and inlet temperatures, respectively; and εheater is the thermal efficiency of the auxiliary heater.

3.2.4. Radiator Model

The mathematical model of the radiator is:
C s d T h d t = c w G ( T g T h ) U s F s T g + T h 2 T r ,
In the equation, CS is the heat capacity of the radiator, J/°C; Fs is the heat transfer area, m2; Ks is the heat transfer coefficient, W/(m2·°C); Tg and Th are the inlet and outlet water temperatures of the radiator, °C; and Tr is the indoor room temperature, °C.

3.2.5. Circulating Water Pump Model

The operating efficiency of the pump is:
η pumping = η overall η motor ,
The energy relationship of the water pump is:
T 0 = T i + P f par m C p ,
In the equation, ηpumping is the pump operating efficiency; To is the outlet temperature of the circulating fluid, °C, Ti is the inlet temperature of the circulating fluid, °C; P is the pump power consumption, kW; fparf is the proportion of pump electrical power converted to heat; m is the mass flow rate of the circulating fluid, kJ/s; and Cp is the specific heat capacity of the fluid, kJ/kg·K.

3.2.6. Room Thermal Balance Model

The room dynamic heat transfer model is based on the heat balance model of the air nodes in each partition. The heat balance equation is:
Q i = Q s u r f , i + Q i n f , i + Q v e n t , i + Q g , c , i + Q c p l g , i + Q s o l a i r , i + Q I S H C C I , i ,
In the equation, Qinf,i = V·ρ·cp·(ToutTin) represents heat gain from air infiltration, kJ/h; Qvent,i = V·ρ·cp·(TventTin) is heat gain from ventilation, kJ/h; Qg,c,i denotes internal convective heat gain, kJ/h; Qcplg,i = V·ρ·cp·(Tzone,iTin) refers to heat transfer from adjacent zones, kJ/h; Qsolair,i is solar radiation entering indoors through exterior windows, kJ/h; and QISHCCI,i represents solar radiation absorbed by indoor shading devices, which is transferred as convective gain to the indoor air, kJ/h.

3.3. Model Building

While architectural configurations and component parameters vary across intermittent solar energy systems, their fundamental thermal processes (collection, storage, and distribution) maintain consistent operational principles. This study employs office buildings as a representative case for TRNSYS modeling demonstration, based on an actual prototype structure featuring solar collectors, thermal storage tanks, terminal radiators, and heat distribution systems, all regulated by differential controllers. The modeling method and steps are shown in Table 4.

3.4. Intermittent Solar Energy Operation Regulation Strategy

The solar thermal system employs differential temperature control between the collector and storage tank outlet. The heat collection cycle activates at ΔT ≥ 8 °C and deactivates when ΔT ≤ 2 °C, with additional high-temperature protection triggering pump shutdown at collector outlet temperatures ≥ 85 °C.
On the heating distribution side, dual temperature thresholds regulate operation:
Heat collection suspension at storage tank outlet temperatures ≥ 85 °C
Auxiliary heat source activation at ≤50 °C and deactivation at >50 °C
The collection system utilizes flow modulation based on characteristic intermittent building load profiles. The solar heating system’s thermal output is expressed as:
Q load ( τ ) = Q g ( τ ) = C w m g ( τ ) T s ( τ ) T h ,
According to the above formula, the water supply flow mg(τ) of the heating system can be obtained as:
m g ( τ ) = Q l o a d ( τ ) C w [ T s ( τ ) T h ]
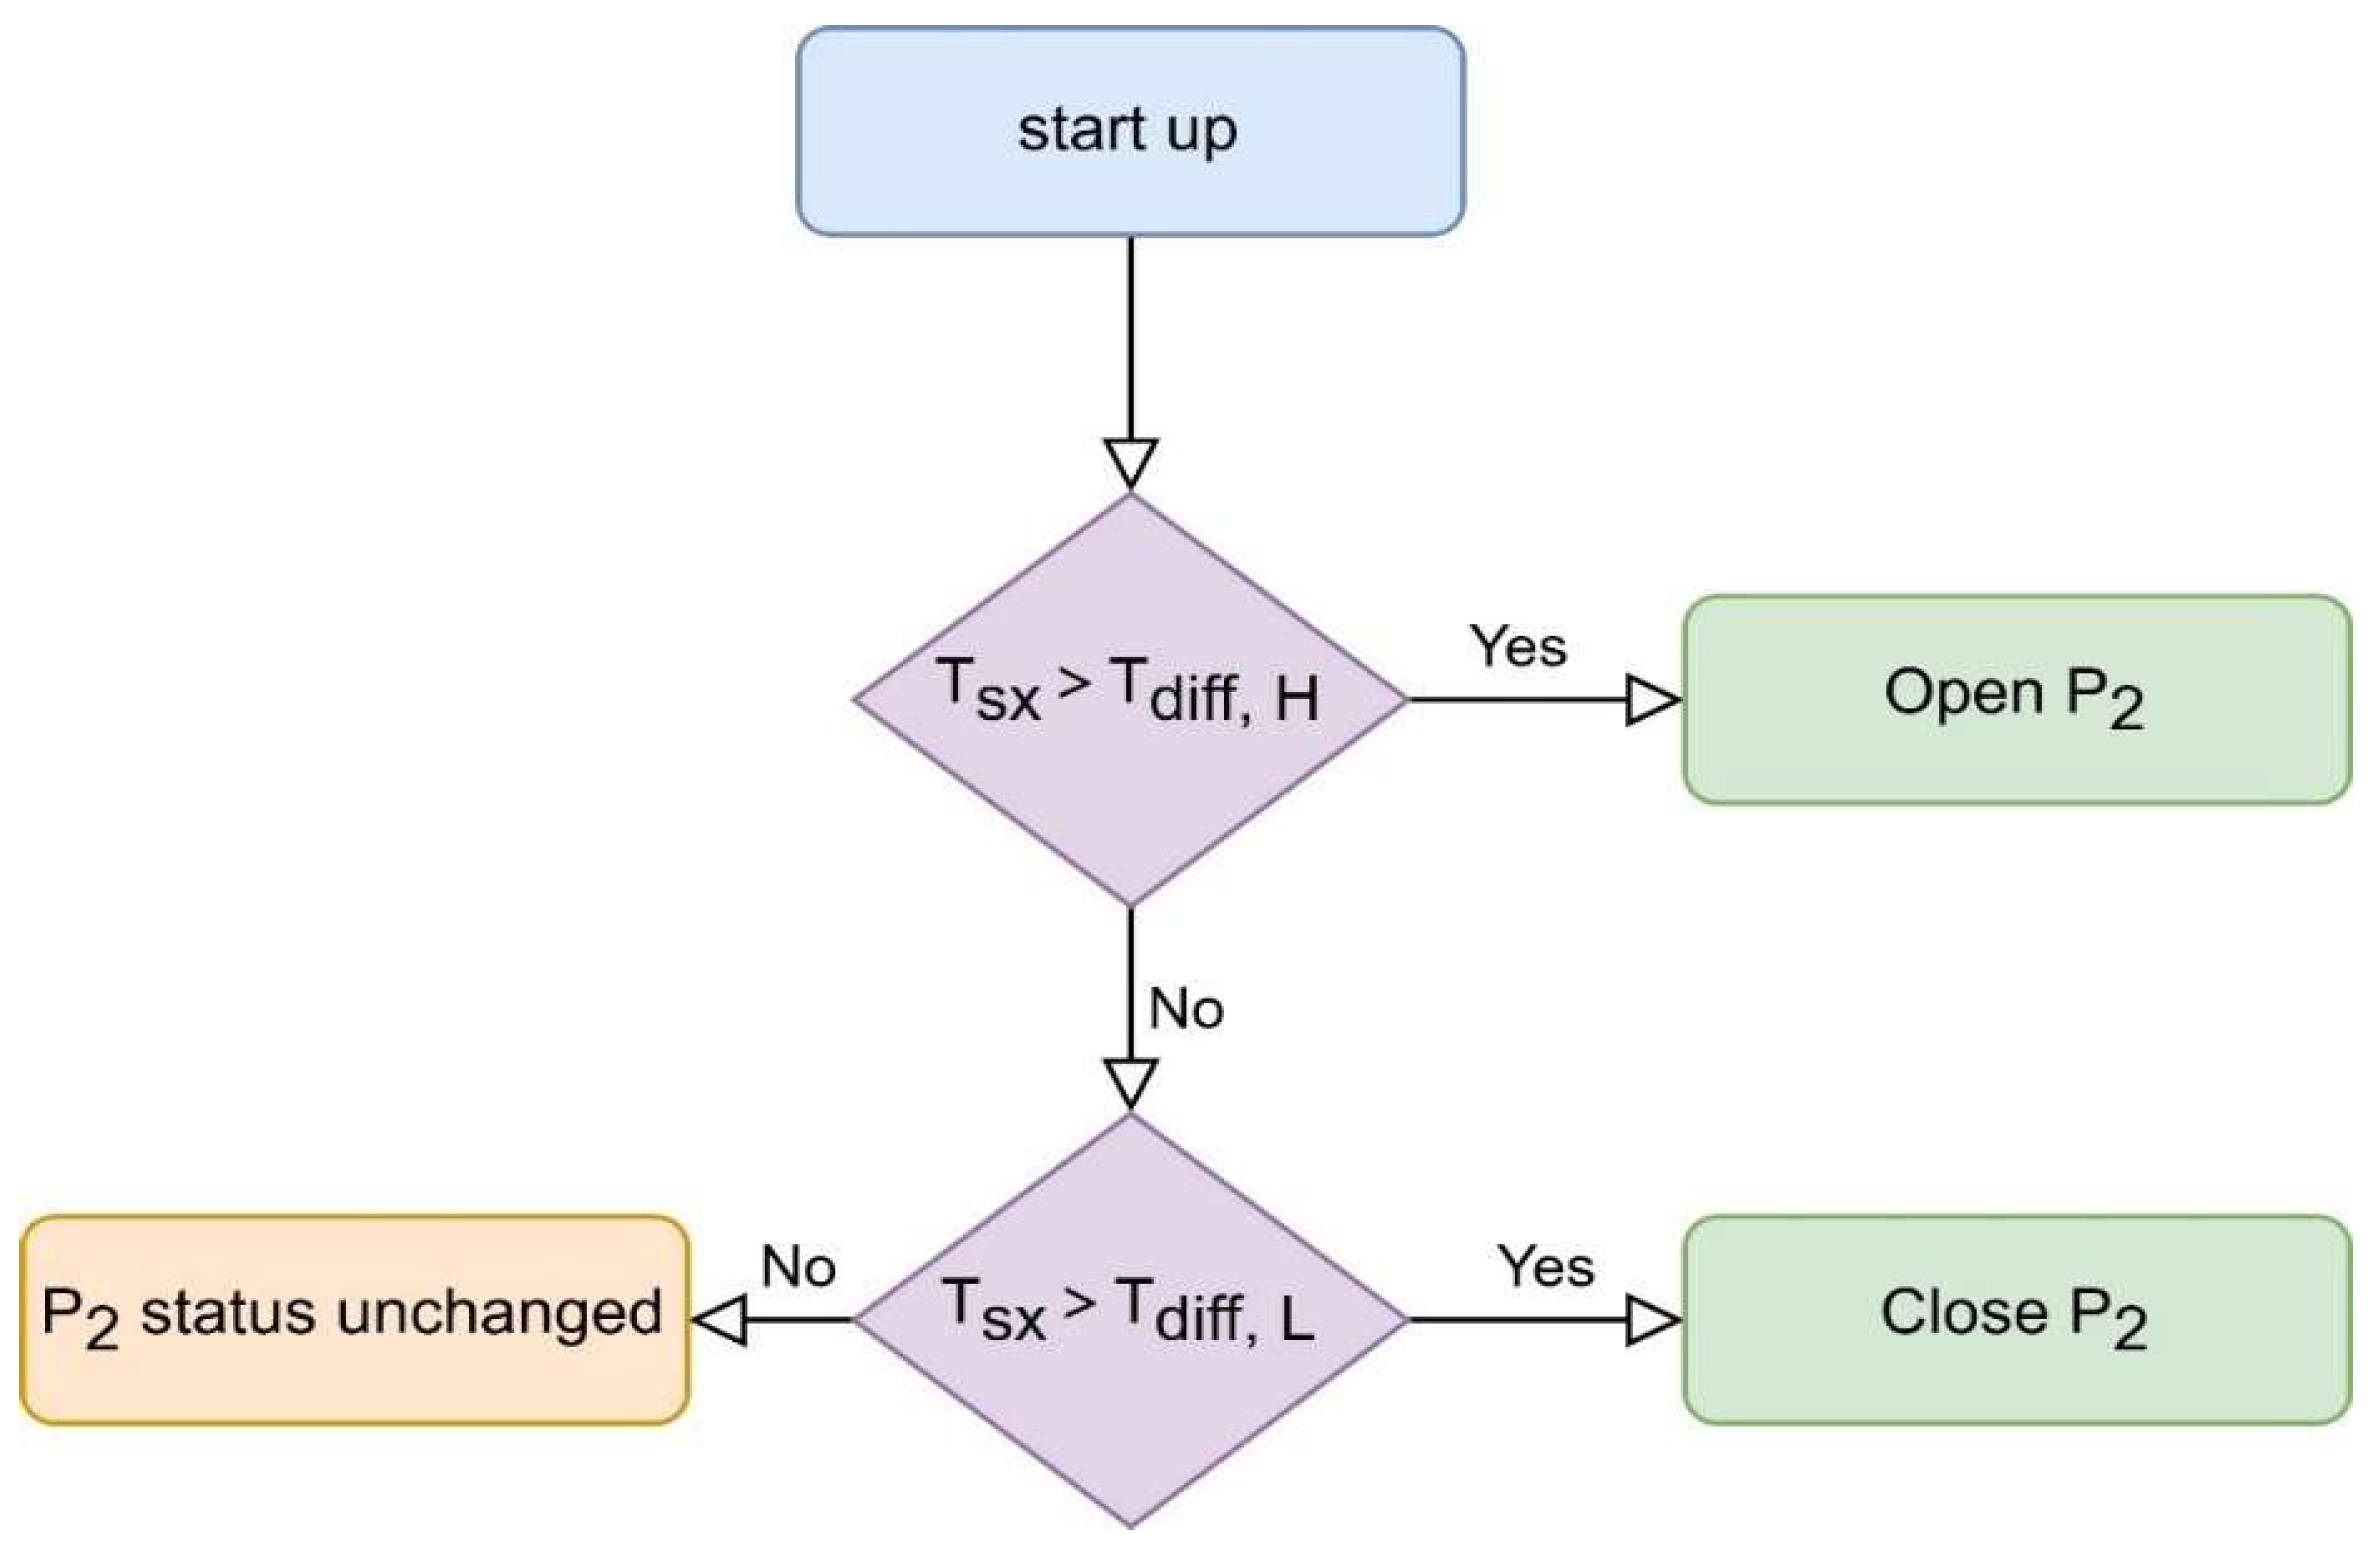
To address critical operational challenges, particularly thermal system shutdowns occurring at storage tank temperatures exceeding 85 °C that risk medium vaporization and overheating, this study proposes an optimized tank control strategy. The feasibility of this operational framework is validated through classroom building case analysis; the corresponding tank operation strategy is schematically shown in Figure 8, where a temperature-based two-stage control mechanism is used. The circulation pump is switched on or off based on threshold temperatures (Tdiff,H and Tdiff,L), ensuring safe operation during high-temperature periods and effective heat release during low-temperature intervals.
Table 5 presents comparative simulation results for various heating system configurations, analyzing classroom building performance under dual control modes and operational strategies.
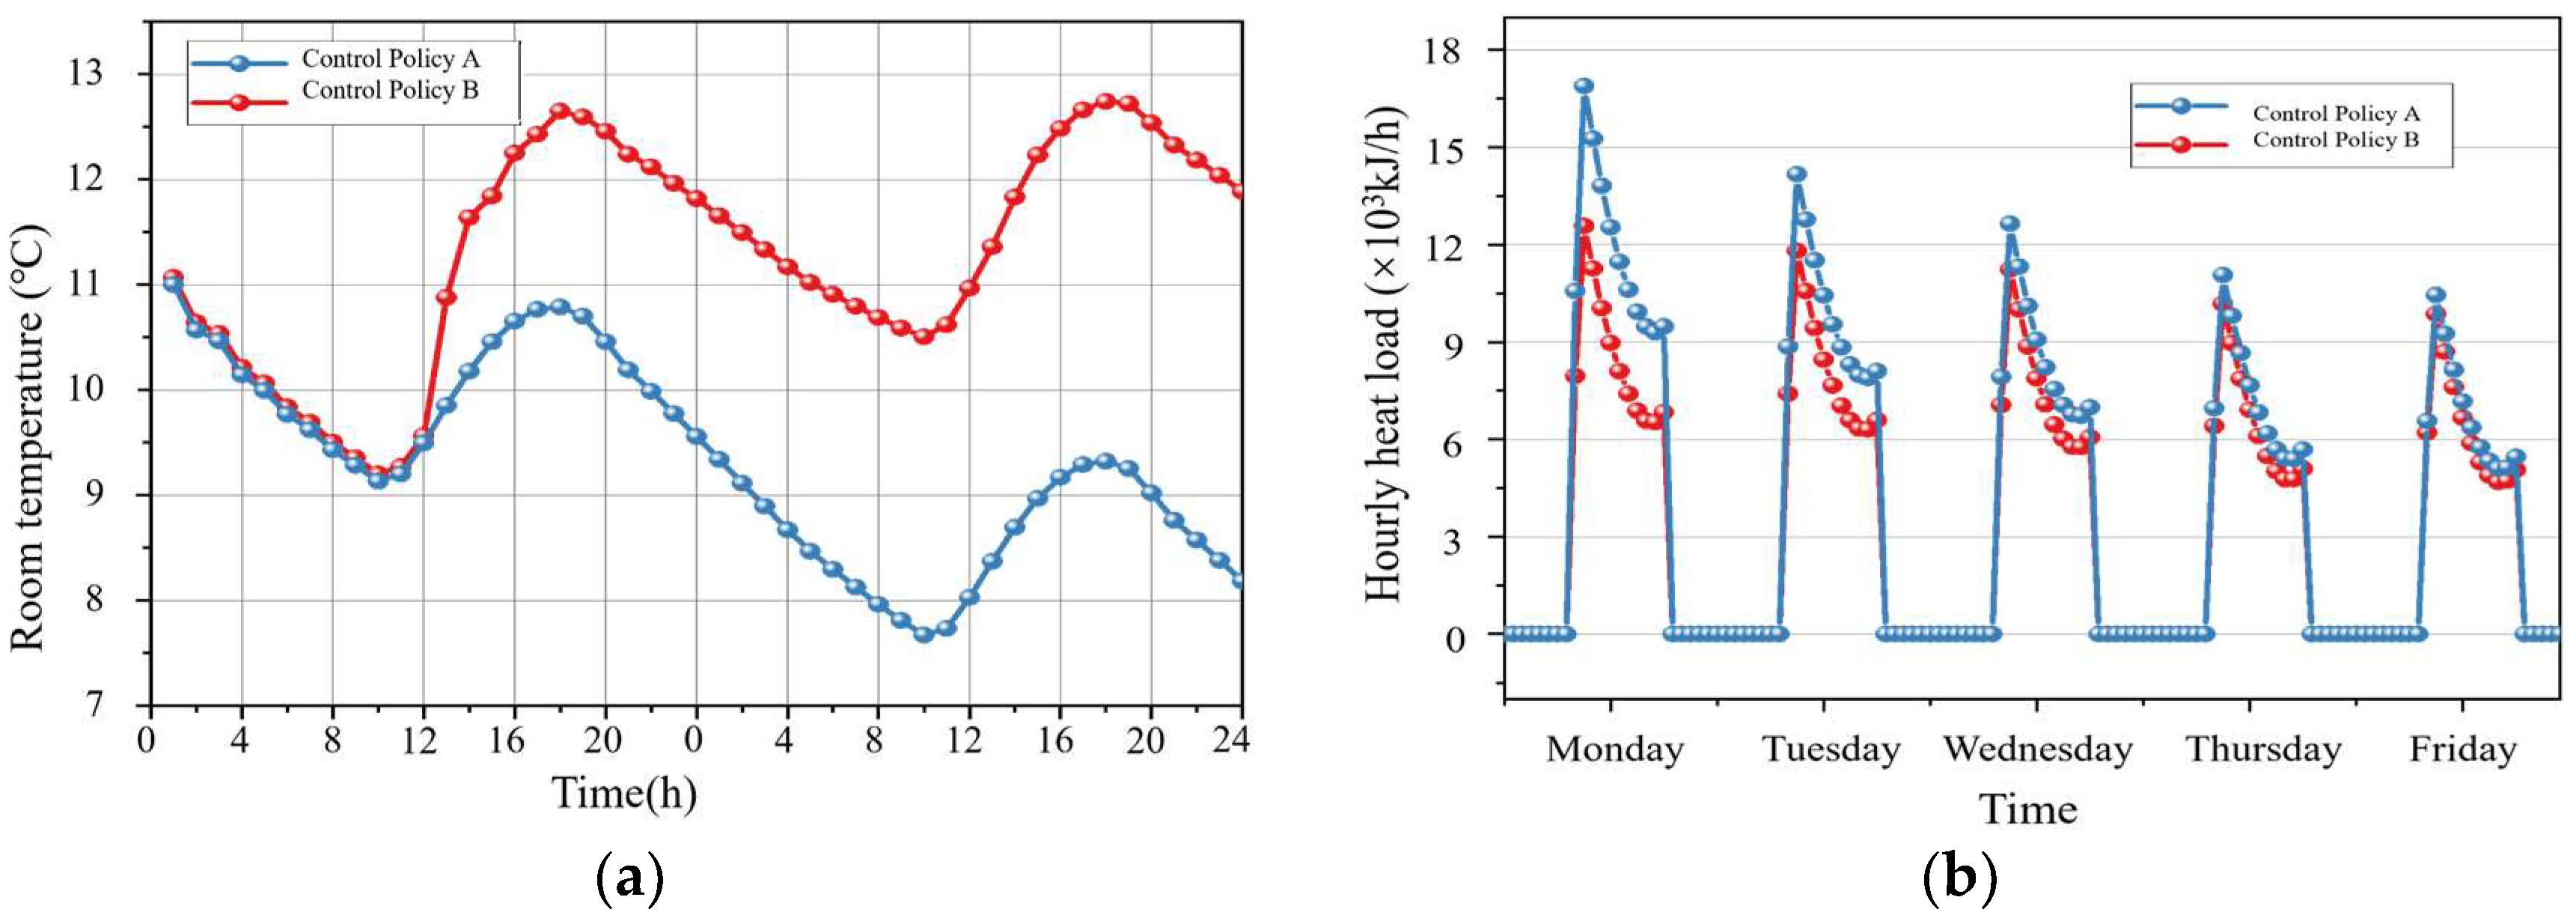
Figure 9a,b demonstrates enhanced system performance through optimized thermal management, particularly during peak solar collection periods (14:00–17:00) when tank temperatures exceed 85 °C, enabling effective heat redistribution to occupied spaces during weekend non-heating periods. The optimized control strategy elevates terminal interval temperatures by 2 °C compared to conventional methods, achieving an 8 °C startup threshold versus the traditional 6 °C. Weekly load analysis reveals significant reductions under optimized operation, with Monday–Tuesday heat loads decreasing substantially, including a maximum Monday hourly load reduction of 3500 kJ/h, while maintaining minimal impact from Wednesday through Friday. This control optimization proves particularly effective for multi-scale Composite Intermittent heating by reducing preheating needs and improving startup response.
Comparative analysis of annual energy consumption between optimized and traditional operation strategies reveals significant efficiency improvements (Table 6). While the optimized strategy increases pump energy consumption by 125 kWh annually, it achieves a substantial 1730 kWh reduction in auxiliary heating requirements, resulting in net annual energy savings of 1605 kWh. These findings demonstrate that the optimized control strategy for multi-scale Composite Intermittent heating effectively enhances the solar heating system’s operational efficiency.

4. Discussion

This study optimizes solar intermittent heating control strategies through a comprehensive analysis of operational characteristics, focusing on thermal storage system enhancement. The optimization framework addresses two critical aspects: thermal storage capacity configuration and operational control parameters, ensuring precise synchronization between solar collection and heat delivery across various intermittent heating modes. These advancements establish a robust foundation for achieving high-efficiency solar thermal performance in intermittent heating applications.

4.1. Effect of Heat Storage Tank Capacity on Intermittent Solar Energy System

To analyze the impact of the water tank volume on the system in this intermittent mode, the collector area of the office building is set to Ac = 72 m2. The cumulative heat collection and cumulative auxiliary heat consumption throughout the year are simulated and analyzed under different hot water storage tank volumes. The results are shown in Figure 10.
Figure 11 illustrates the relationship between thermal storage performance and the tank volume ratio (V/Ac), indicating that cumulative heat supply increases rapidly at low volumes and then plateaus, whereas auxiliary heat consumption exhibits a convex pattern—declining initially and rising again as volume continues to increase. At V/Ac < 0.1, insufficient storage capacity leads to high auxiliary heating demand and limited tank output. The optimal operational range occurs at V/Ac = 0.12–0.3, where tank heat supply stabilizes and auxiliary consumption reaches its minimum, representing the most efficient system configuration.
Figure 12 demonstrates the thermal dynamics of varying tank volumes (V/Ac) throughout collection cycles. Initial collection phases show proportional increases in effective heat with volume, while later stages exhibit reduced efficiency due to elevated temperature peaks at smaller volumes. Analytical results show that larger tanks result in lower average temperatures, with a 0.05 V/Ac reduction increasing non-collection temperatures by approximately 0.8 °C. Temperature stabilization improves with larger capacities, as evidenced by daily fluctuations decreasing from 8 °C (V/Ac = 0.15: 65.8 °C min at midnight, 73.7 °C max at 17:00) to 3.8 °C (V/Ac = 0.30: 67 °C min at midnight, 70.8 °C max at 17:00).
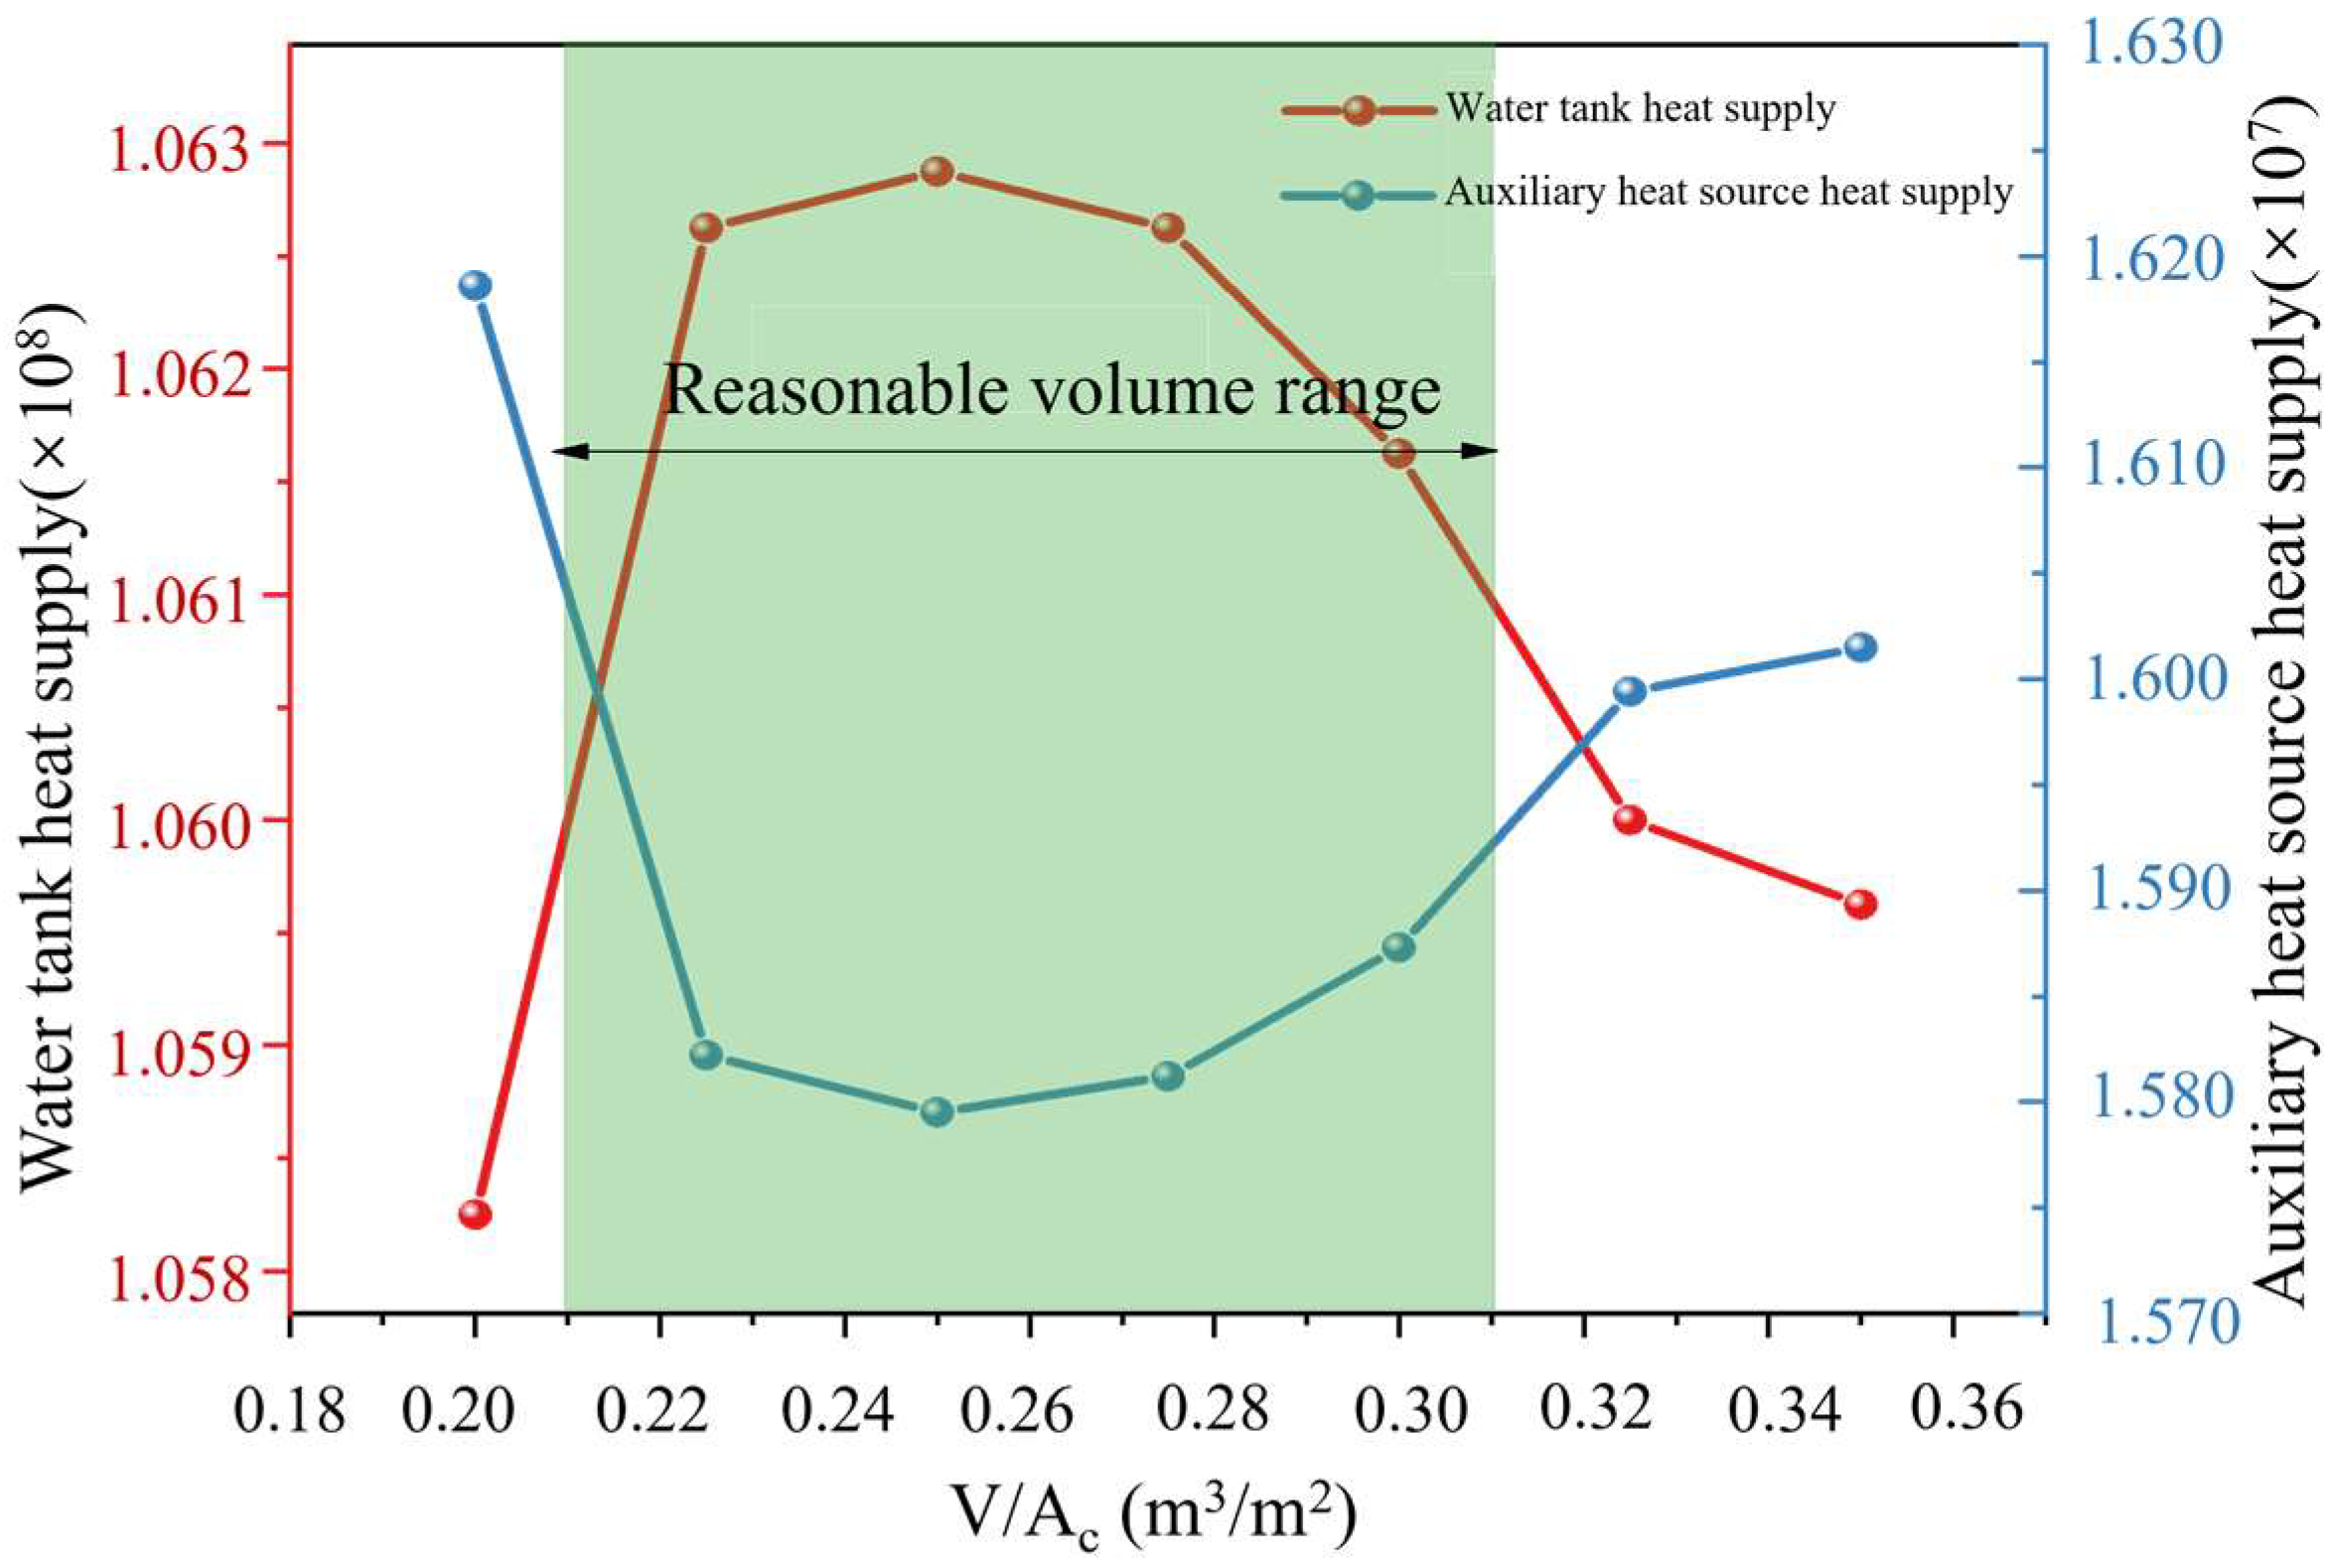
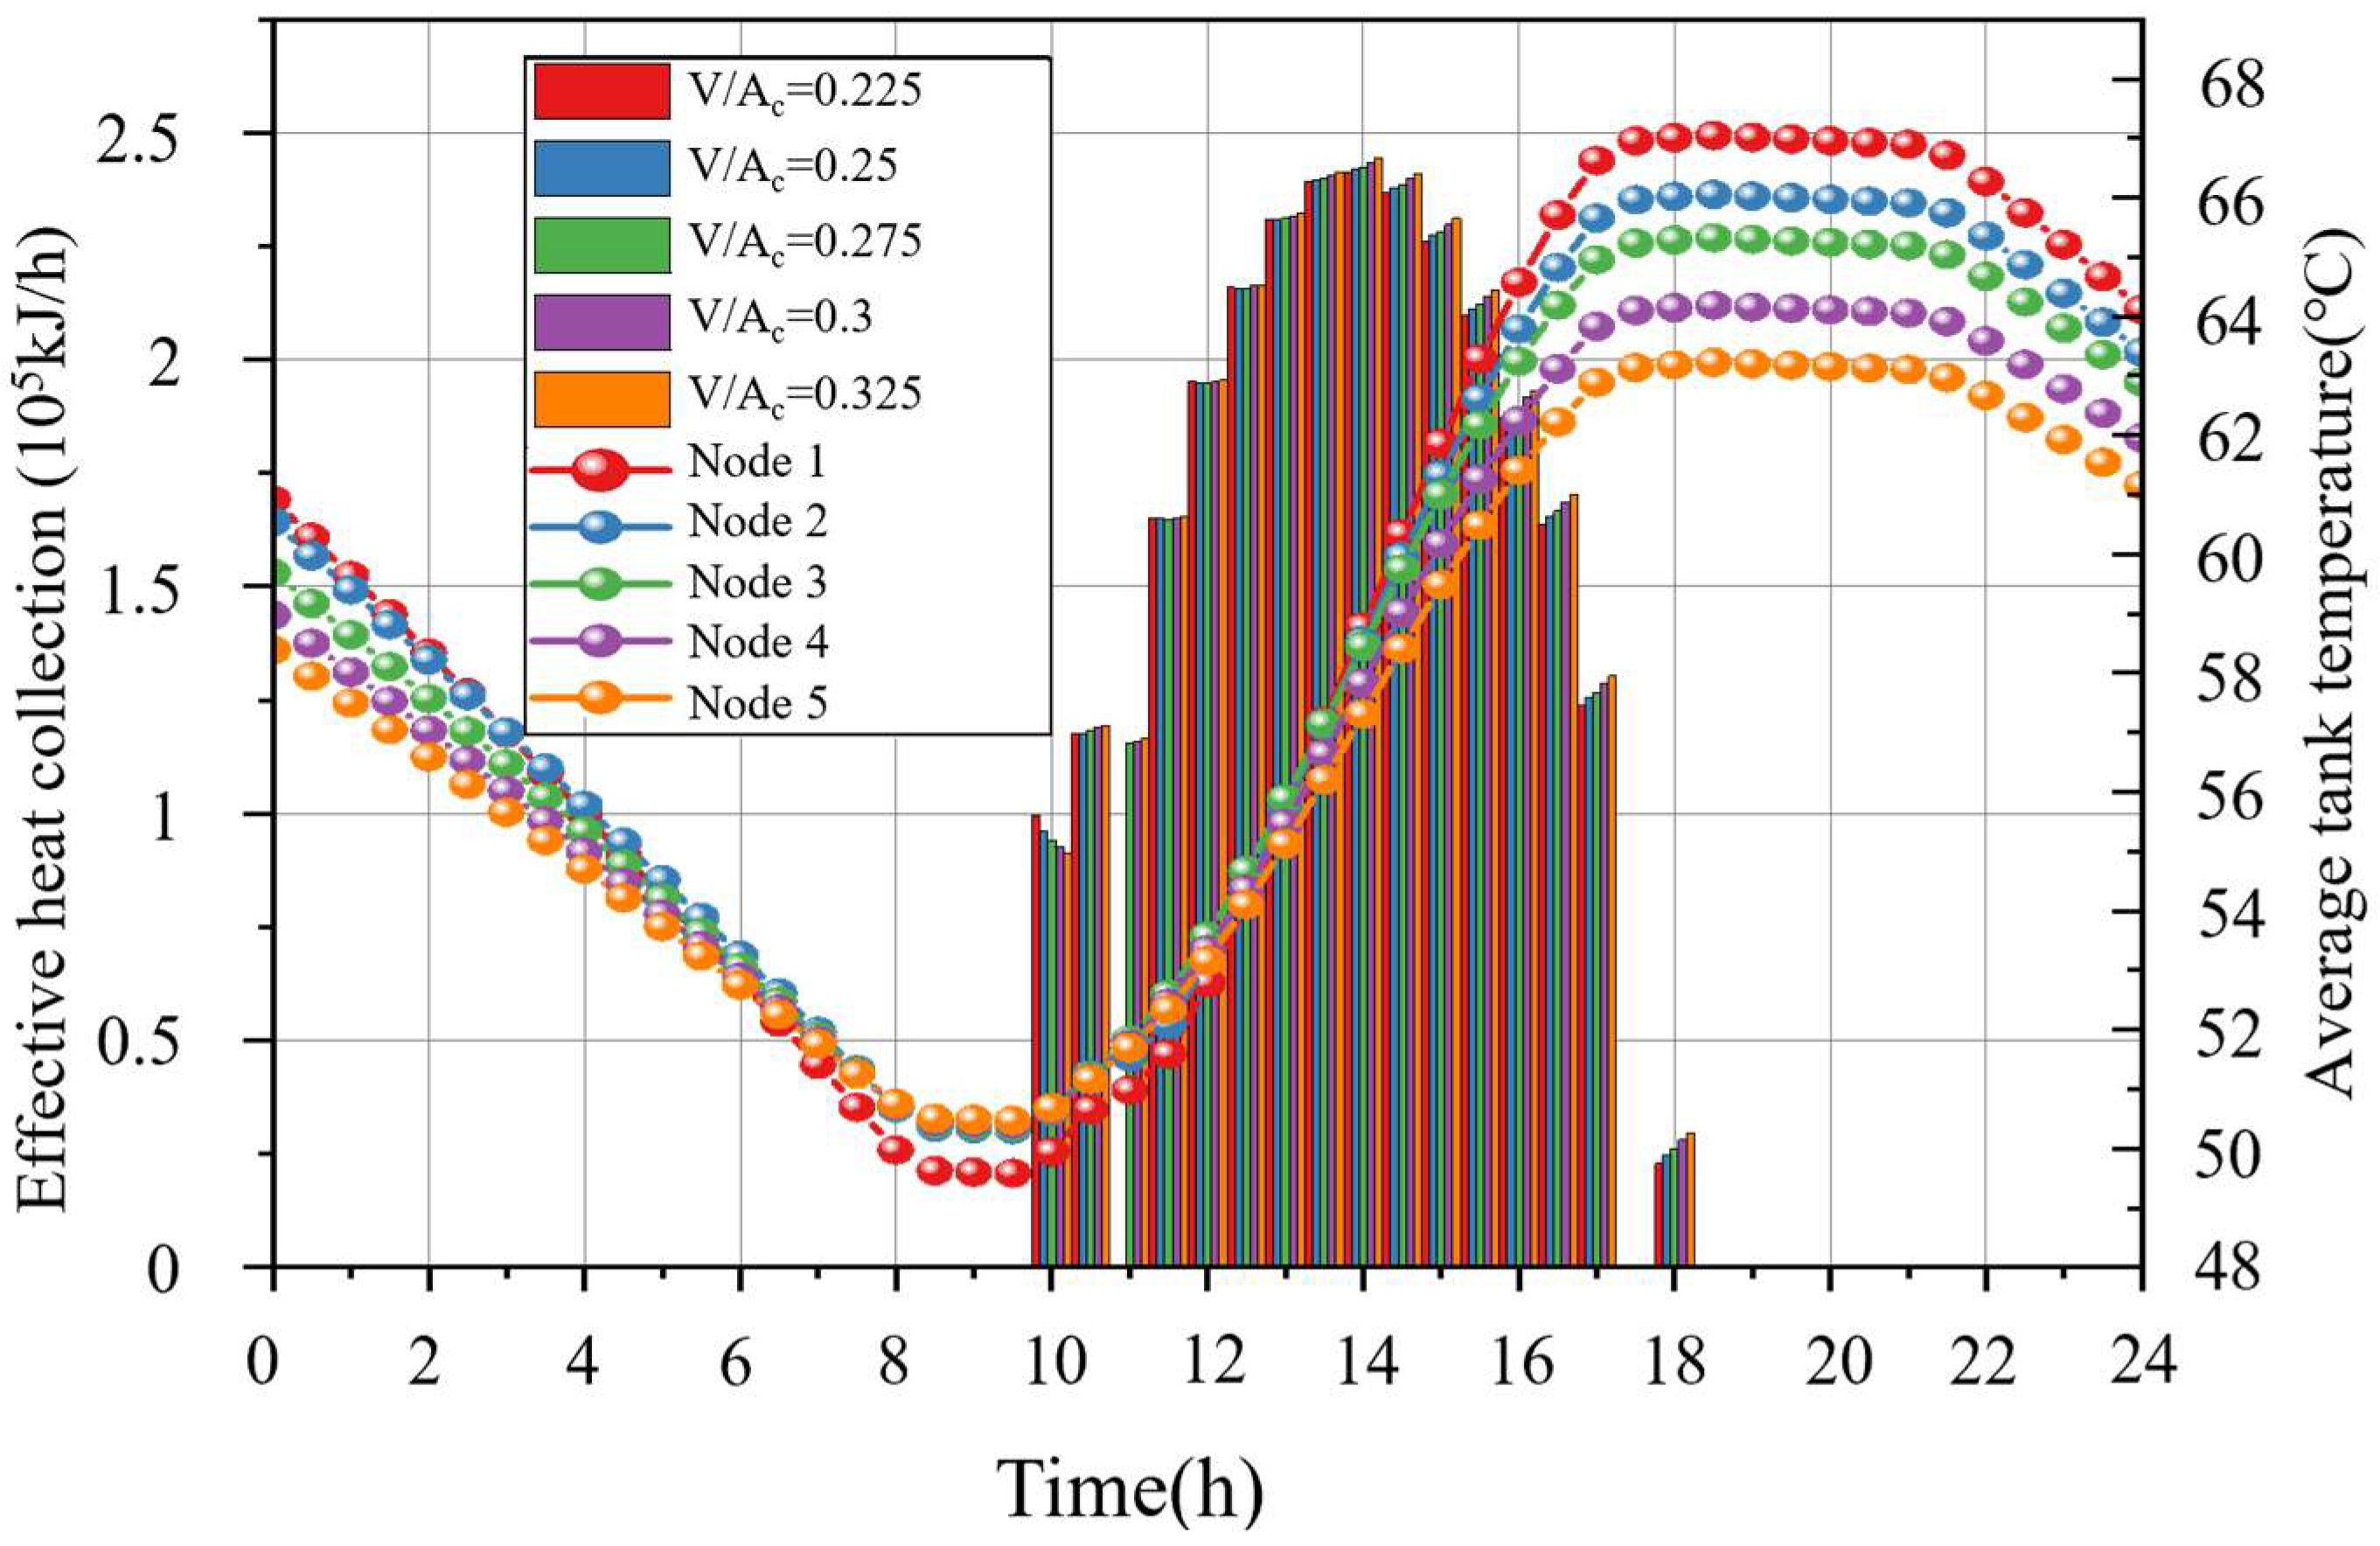
The dormitory building’s diurnal collection/nocturnal heating system, utilizing a fixed 113 m2 collector area, demonstrates optimal performance at V/Ac ratios of 0.21–0.32, as shown in Figure 13. Below this range (V/Ac < 0.21), insufficient storage capacity leads to high auxiliary heating demand and limited heat supply, while above it (V/Ac > 0.31), increased thermal losses offset greater collection capacity, resulting in reduced effective heat supply and rising auxiliary consumption. Detailed analysis of specific ratios (0.225, 0.25, 0.275, 0.3, 0.325) reveals hourly variations in tank temperature and effective heat collection, with the optimal range balancing heat collection, storage efficiency, and minimized auxiliary requirements.
Figure 14 illustrates the thermal dynamics of the storage system, showing gradual temperature increases during diurnal collection and decreases during nocturnal heating phases. As V/Ac increases, temperature fluctuations diminish proportionally, with each 0.05 increment reducing peak temperatures by approximately 2 °C. Specific analysis reveals daily fluctuations of 18 °C (V/Ac = 0.225: 49 °C at 09:00, 67 °C at 18:00) and 13 °C (V/Ac = 0.325: 50 °C at 09:00, 63 °C at 18:00). These fluctuations significantly impact flow regulation in quantity-controlled systems, particularly causing heating capacity deficiencies during early morning hours (02:00–08:00). Therefore, for diurnal collection/nocturnal heating systems, larger tank volumes are recommended to stabilize flow control and maintain consistent indoor temperatures.

4.2. Analysis of Operating Characteristics of Typical Day Simulation Conditions

To characterize seasonal operational patterns of the solar heating system, Lhasa’s heating season was divided into three phases, each represented by a typical week: early (November 8–14), middle (January 1–7), and late (March 1–7) periods, with corresponding meteorological data shown in Figure 6.
The heating season in Lhasa was divided into early, middle, and late periods for analysis, each exhibiting distinct solar radiation and temperature characteristics, as summarized in Table 7.

4.2.1. Operating Characteristics of the Heat Collector Side

(1) Day–Night Intermittent operating mode.
This study analyzes office buildings as archetypal Day–Night Intermittent heating structures, operating from 08:00 to 18:00 daily. TRNSYS simulations reveal distinct collector temperature profiles across heating season phases (Figure 14). Collector outlet temperatures demonstrate solar-driven increases from 10:00 to 17:00, peaking at 85 °C (early/late season) and 70 °C (mid-season). Return water temperatures exhibit characteristic diurnal patterns: initial decreases to ~40 °C during morning peak demand (08:00–10:00), followed by gradual increases as solar collection exceeds heating requirements, reaching maxima of 62 °C (mid-season) and 78 °C (late season) at 17:00. Early-season conditions present unique challenges, as low demand and strong solar input saturate the tank early, resulting in solar energy curtailment.
(2) Composite Intermittent heating mode.
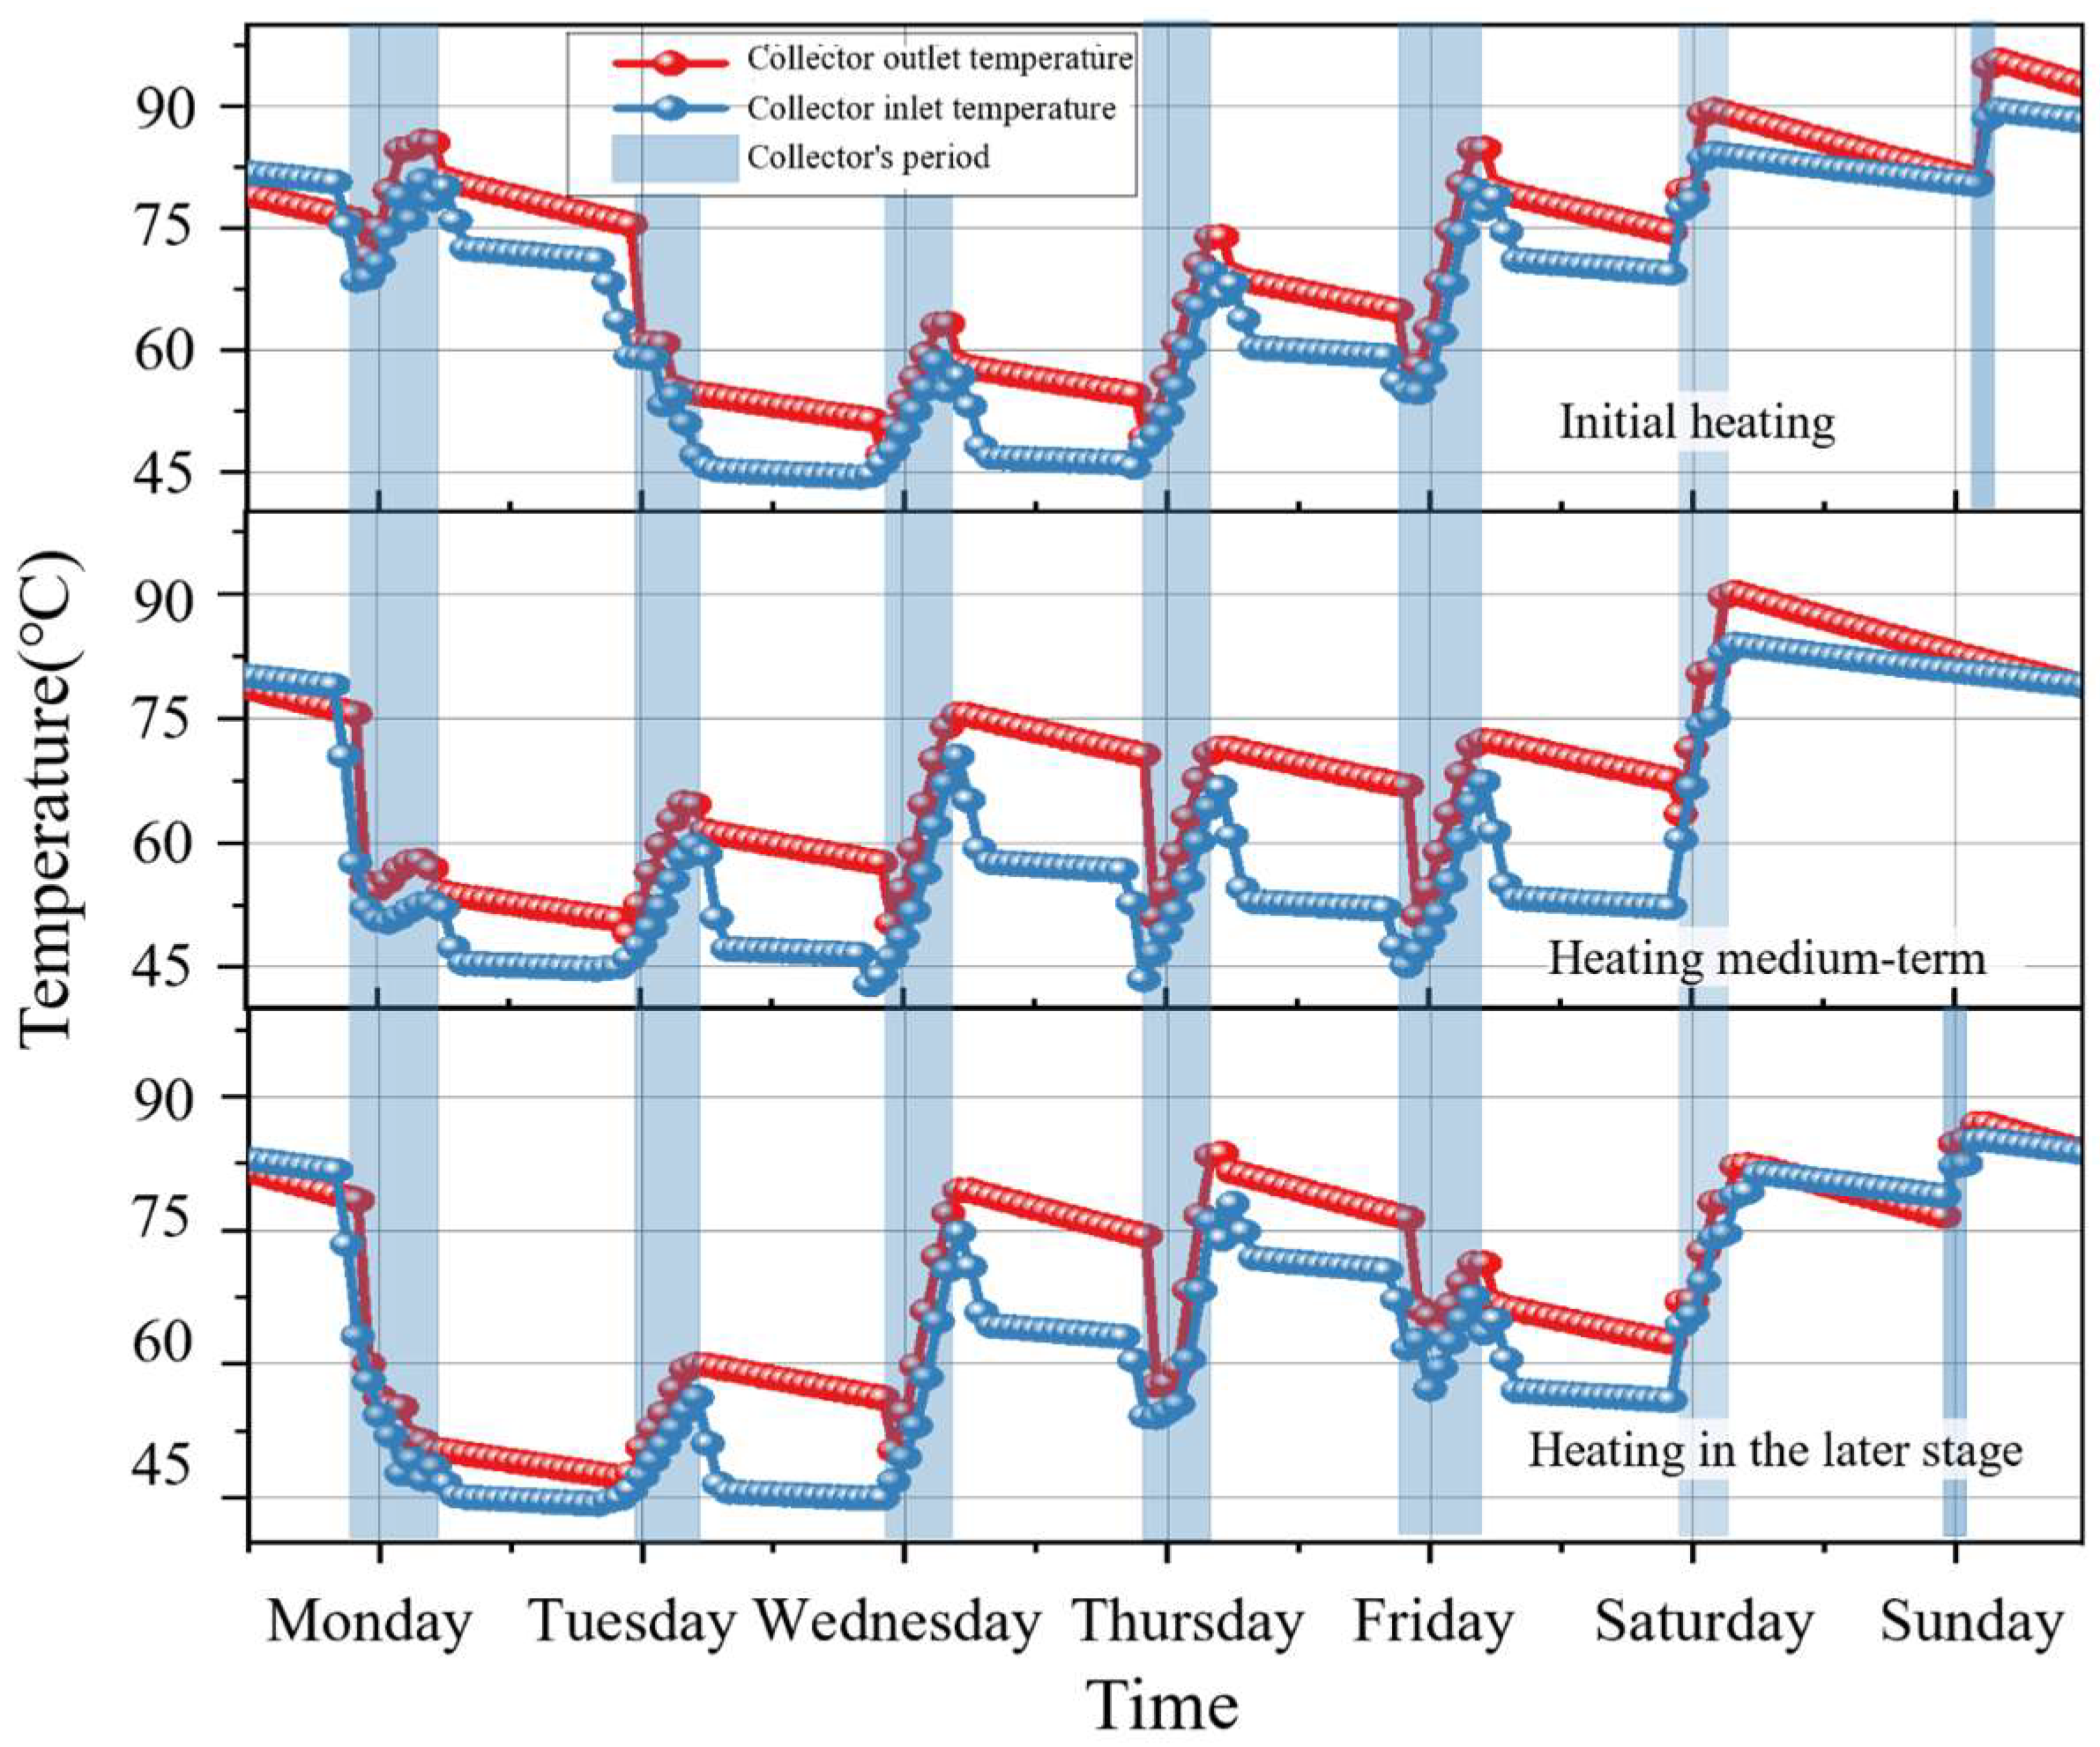
The classroom building’s multi-scale Composite Intermittent heating system, operating weekdays from 08:00 to 19:00 with weekend suspension, exhibits distinct thermal patterns as shown in Figure 15. Weekday operation demonstrates lower collector temperatures during simultaneous collection and storage, with Monday showing extended collection periods due to weekend thermal inertia loss, while Tuesday–Friday maintains consistent collection with temperatures gradually increasing from 45 to 75 °C as collection exceeds heating demands. Weekend operation features elevated collector temperatures (peaking at 85 °C) during exclusive heat storage, with significantly reduced collection periods and frequent Sunday cessation, reflecting the system’s adaptive response to varying building heat demands and solar availability throughout the weekly cycle.
(3) Day–Night + monthly intermittent heating mode.
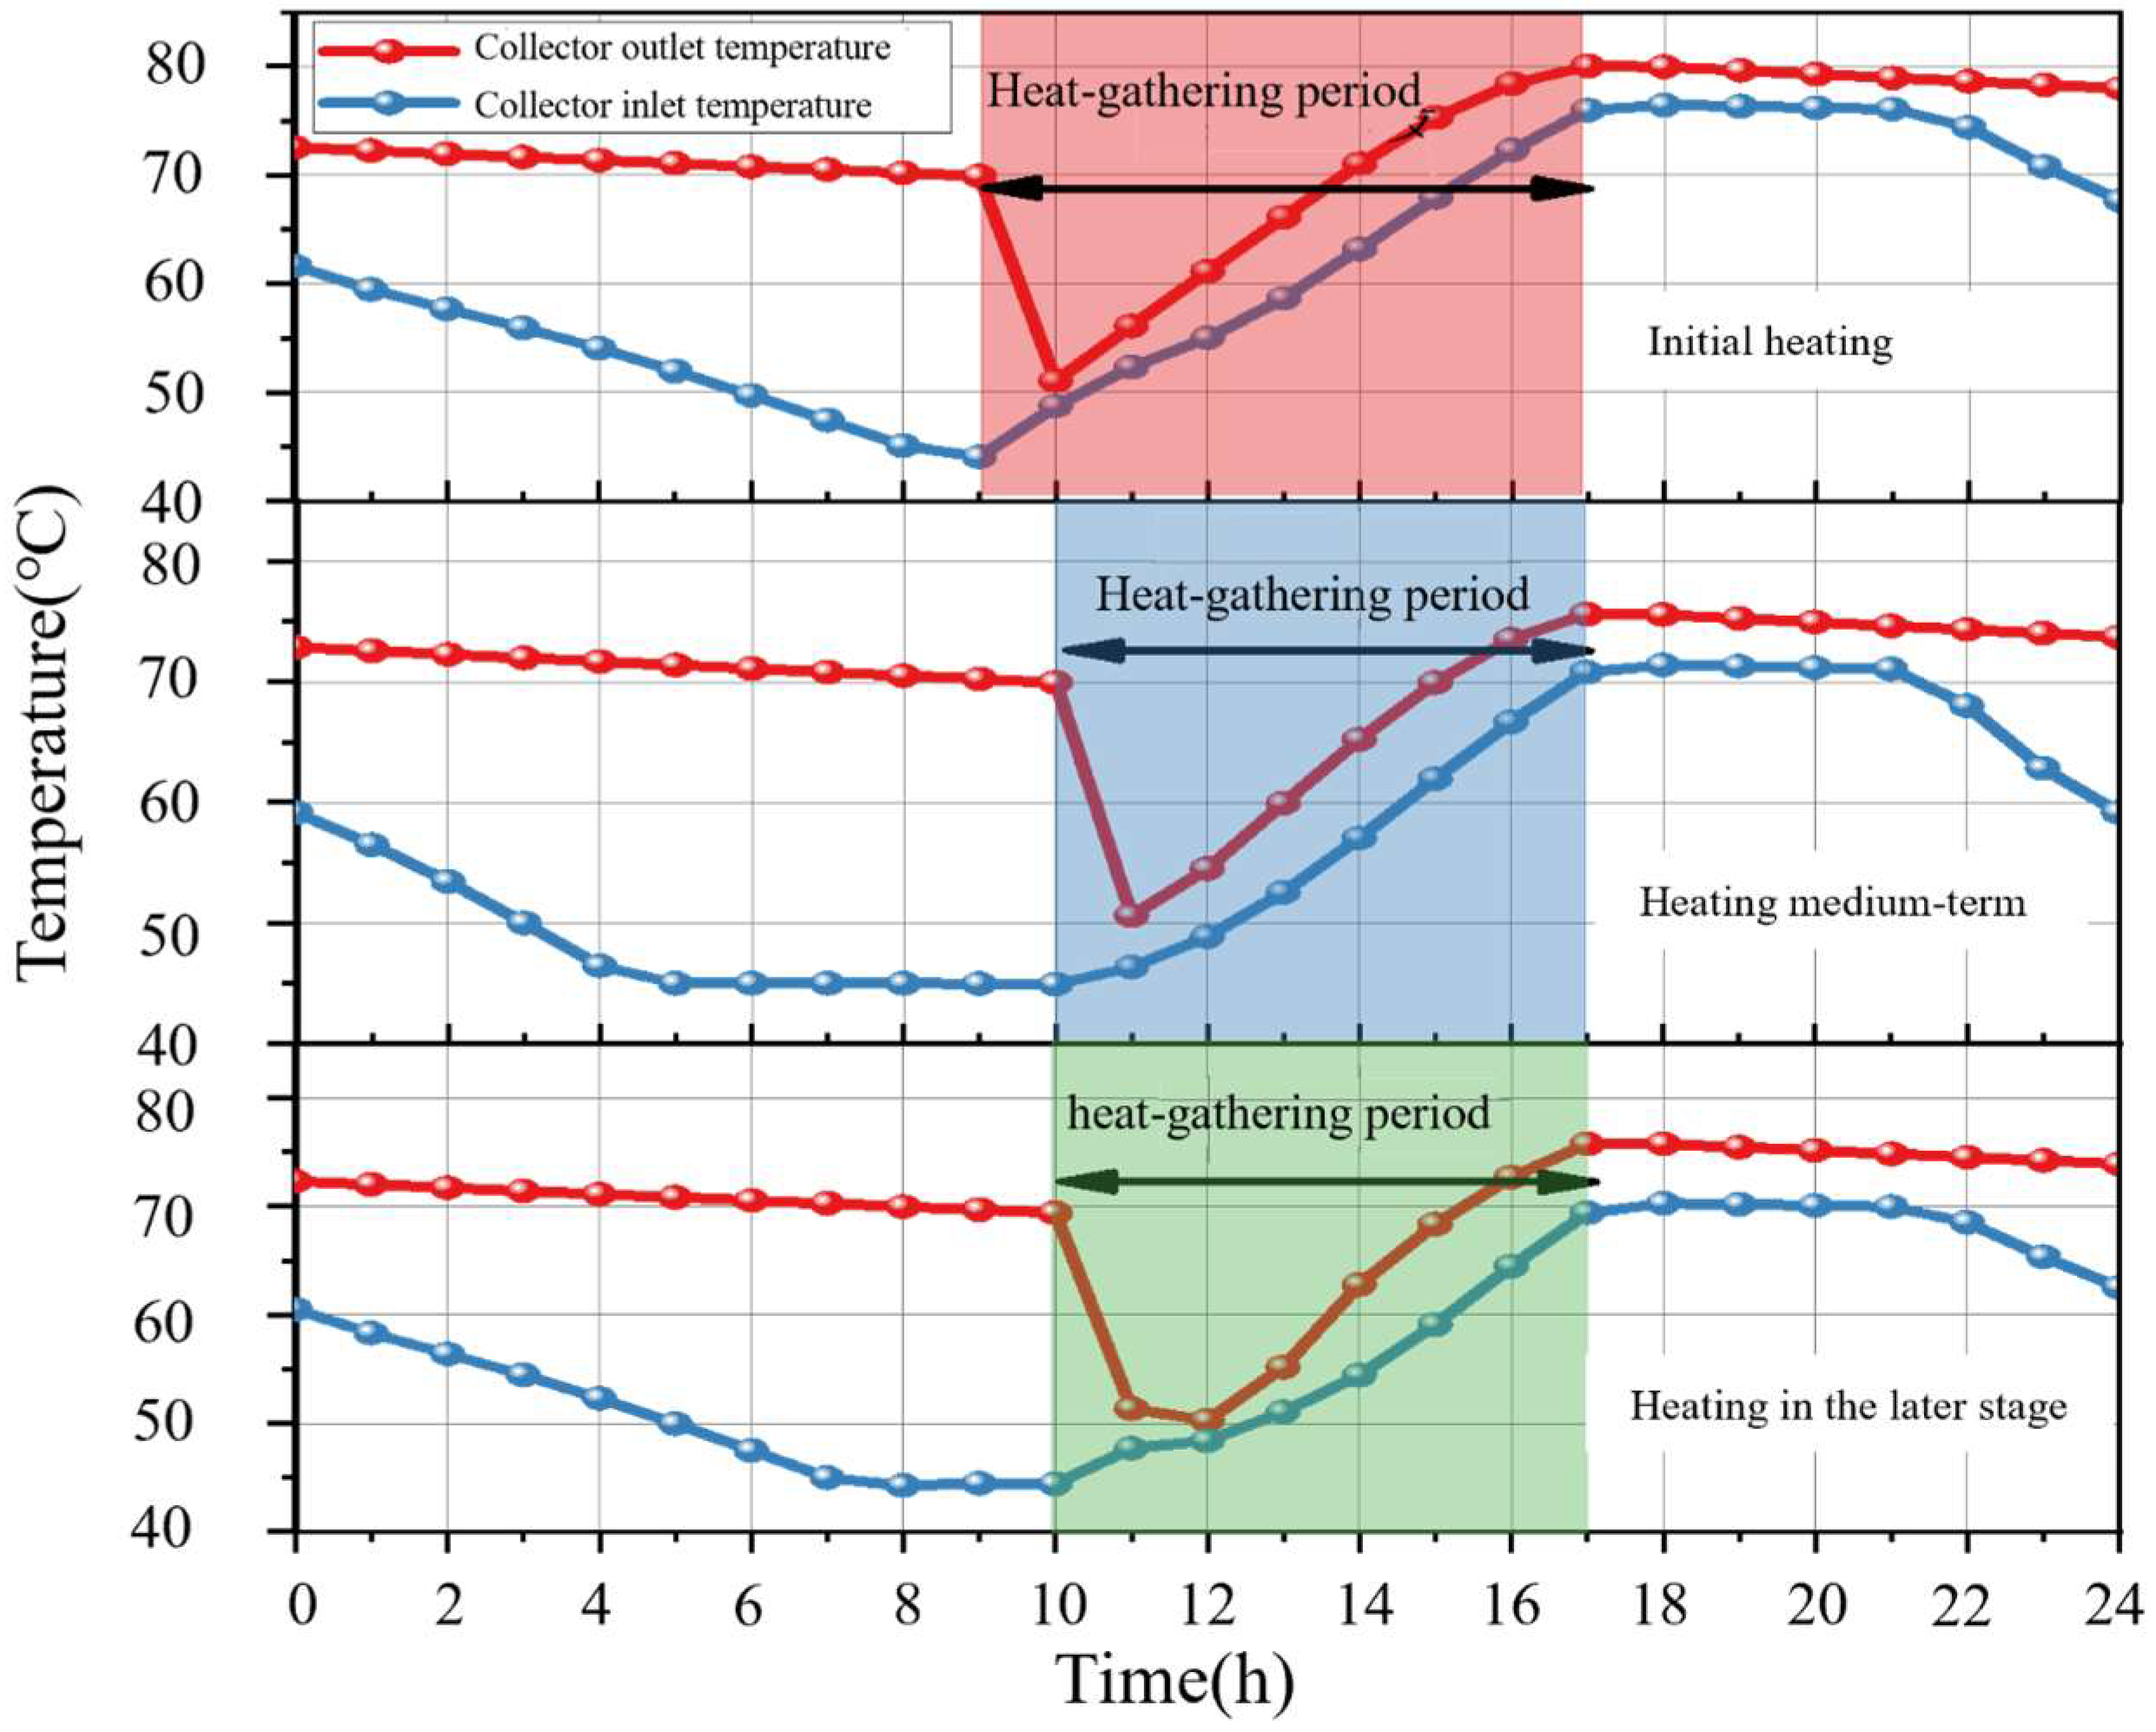
The dormitory building operates under a day–night + monthly intermittent heating regime, with nighttime heating from 21:00 to 08:00 and daytime solar collection. As shown in Figure 16, collector outlet temperatures follow characteristic solar radiation patterns, while return water temperatures demonstrate linear decreases during heating periods. Mid-season analysis reveals insufficient daily collection to meet nocturnal heating demands. The system shows significant daily temperature variations, peaking at 75–80 °C at 17:00. Collection starts at 09:00 in the early heating period and at 10:00 in mid and late seasons, ending consistently at 17:00. These patterns reflect adaptation to seasonal solar availability.

4.2.2. Thermal Storage Side Operating Characteristics

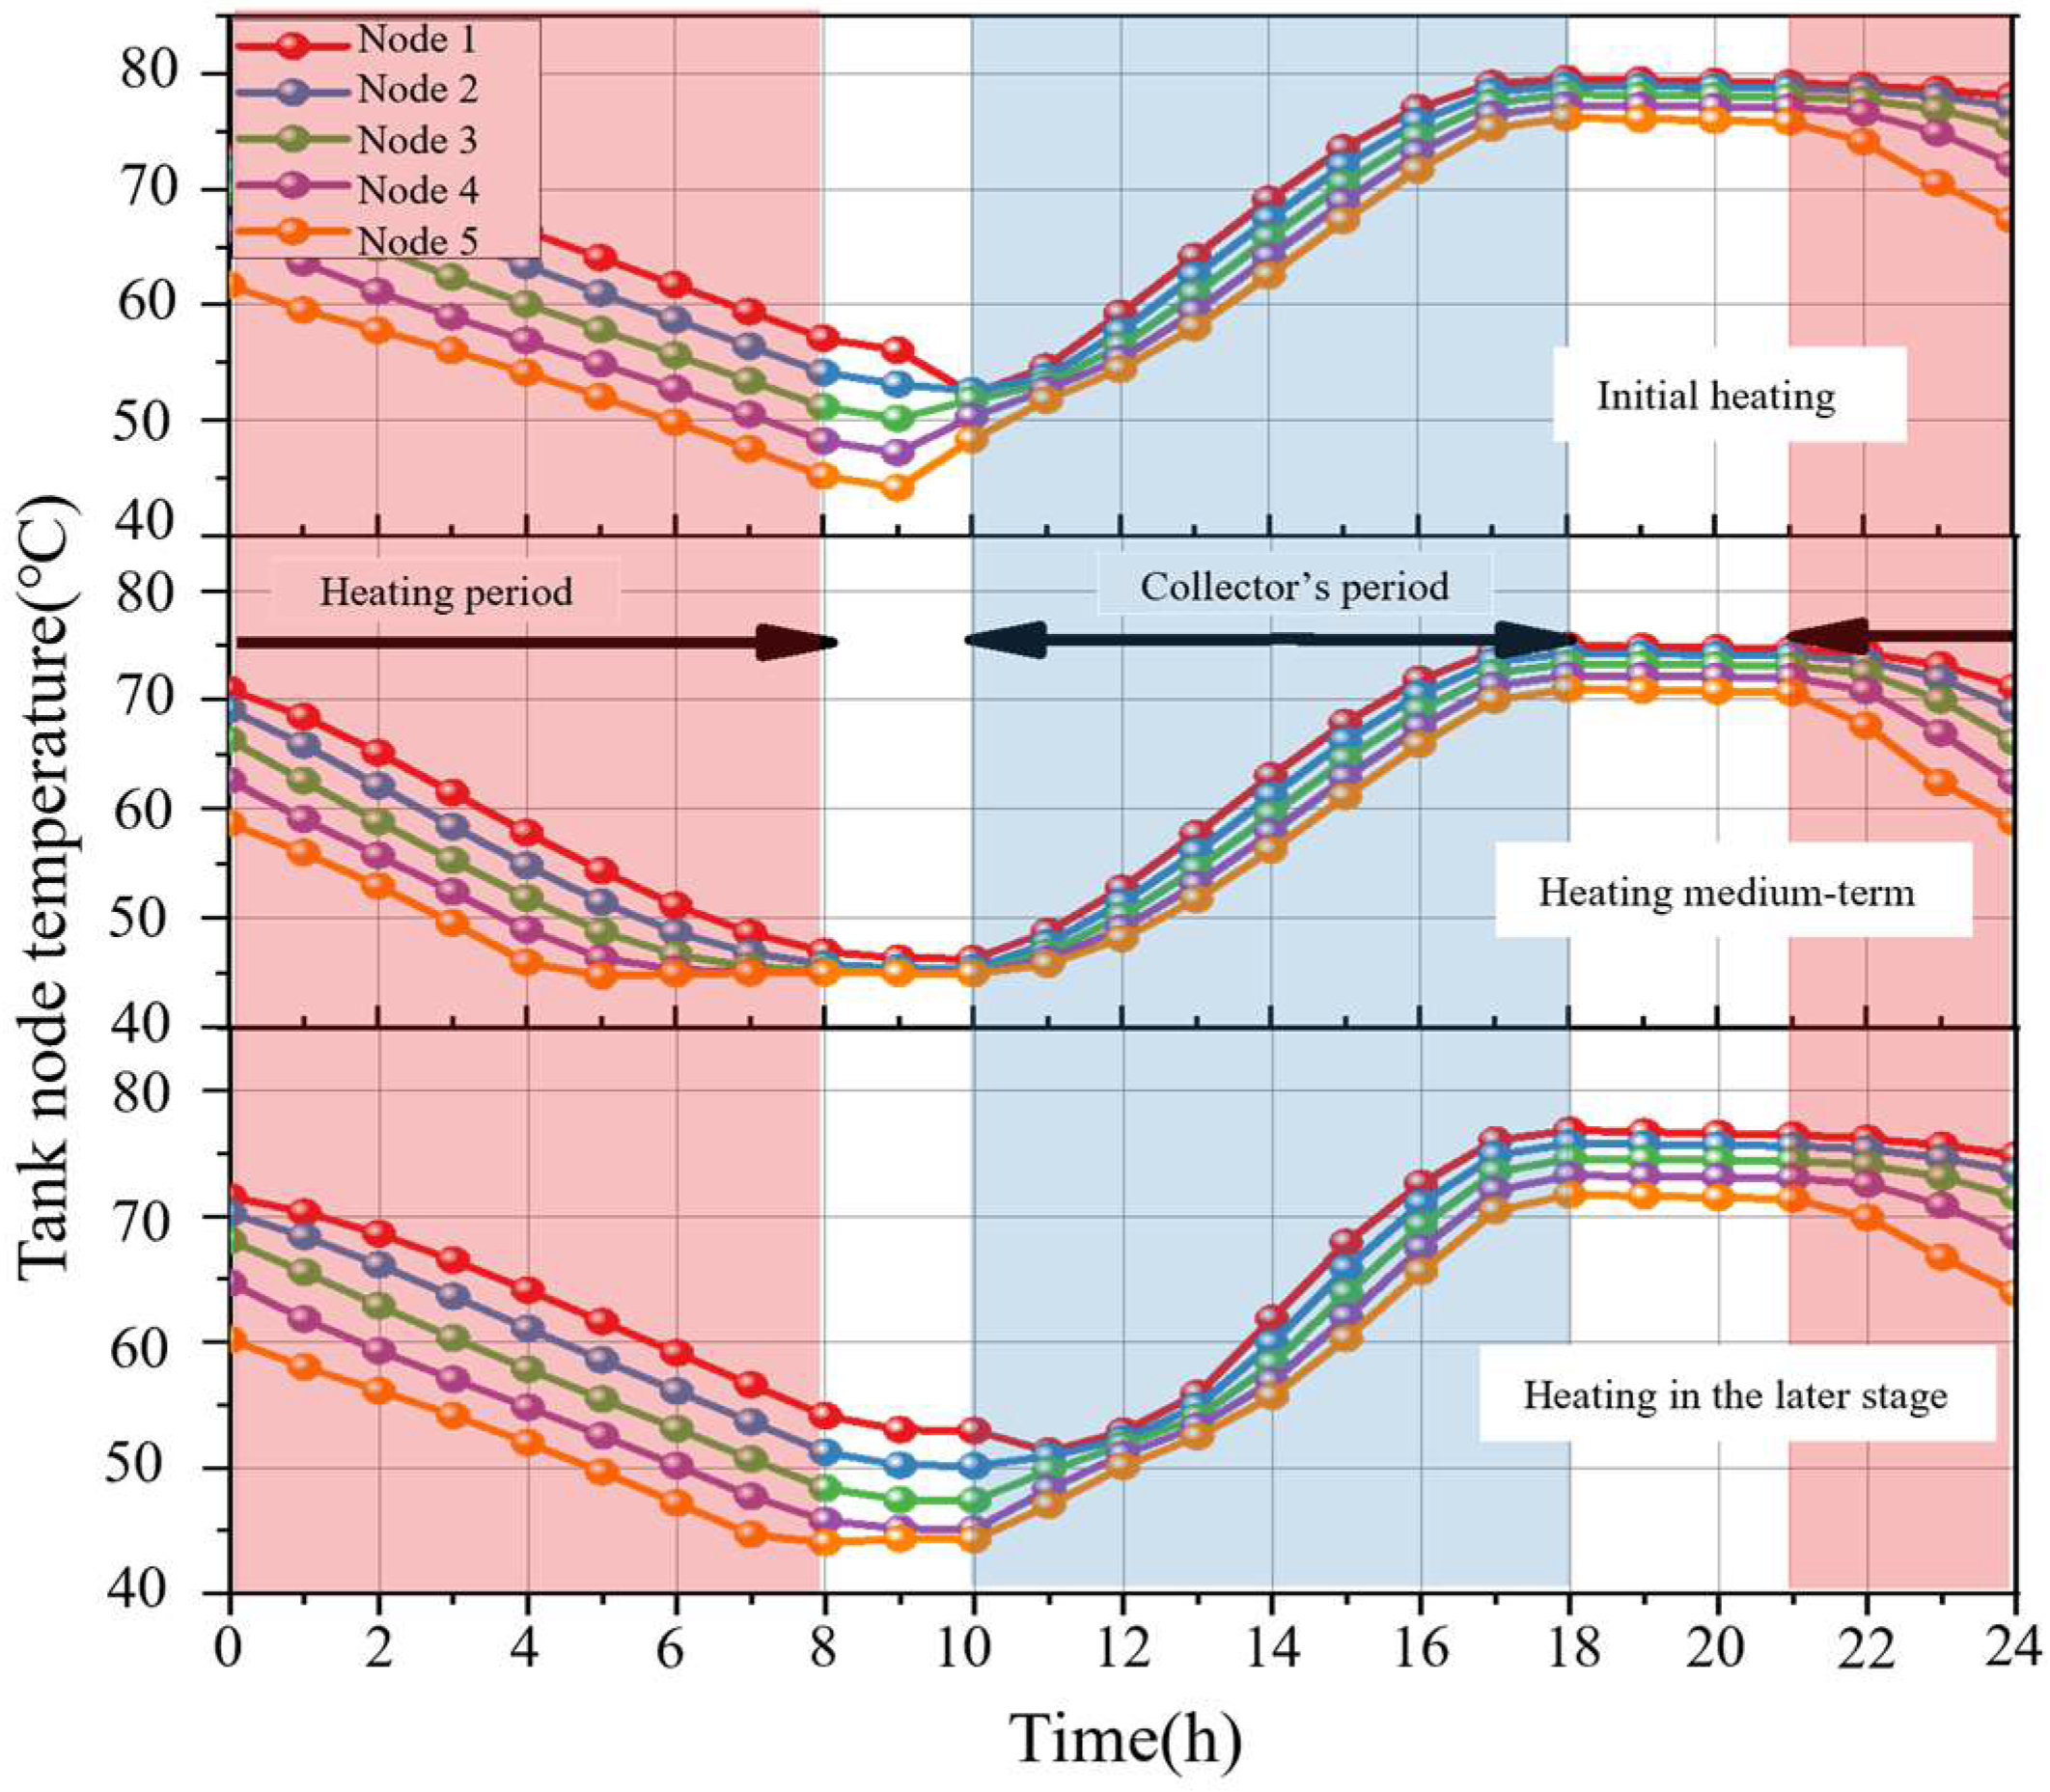
This study implements a five-node vertical stratification analysis to characterize thermal dynamics within the storage tank, with Node 1 representing the uppermost layer and Node 5 the base. Thermal energy transfers are quantified using a signed convention, where positive values indicate heat gain and negative values denote heat loss, enabling precise monitoring of thermal stratification and energy flow patterns.
(1) Day–Night Intermittent heating mode.
Figure 17 illustrates the Day–Night thermal behavior of the storage tank across heating season phases. Early and late seasons exhibit smaller temperature fluctuations (58–80 °C) due to reduced building loads and abundant solar radiation. Mid-season operation shows broader variations (40–70 °C) resulting from increased heating demands and diminished solar intensity. Daily analysis reveals characteristic temperature patterns: initial decreases during morning startup (08:00), with mid-season drops reaching 40 °C by 10:00 due to substantial heating loads, followed by gradual recovery to daily maxima at 17:00. Node temperature differentials indicate pronounced thermal stratification during mid-season, while early/late periods demonstrate more uniform temperature distributions throughout the tank.
(2) Composite Intermittent heating mode.
Figure 18 demonstrates the weekly thermal profile of the storage tank, exhibiting characteristic decrease–increase patterns. Monday shows significant temperature reduction due to elevated building heat demand, while Tuesday through Friday display gradual temperature recovery as heating requirements diminish. Throughout all heating phases, the tank maintains consistent temperature fluctuations between 45 °C (minimum) and 85 °C (maximum), reflecting stable system operation across varying seasonal conditions.
(3) Day–Night + Monthly Intermittent Mode operation mode.
Figure 19 illustrates the day–night thermal dynamics of the storage tank under intermittent heating, characterized by a consistent decrease–increase cycle. The system collects solar energy from 10:00 to 18:00, elevating temperatures from a baseline of 40 °C to a peak of 70–80 °C, constrained by substantial heating demands. Nocturnal heating provision (21:00–08:00) induces gradual temperature reduction, with pronounced thermal stratification: the base experiences maximum cooling, while the upper layers maintain relatively stable temperatures, demonstrating effective thermal energy management throughout the operational cycle.

4.2.3. Thermal Performance of the Heating Side

(1) Day–Night Intermittent heating mode.
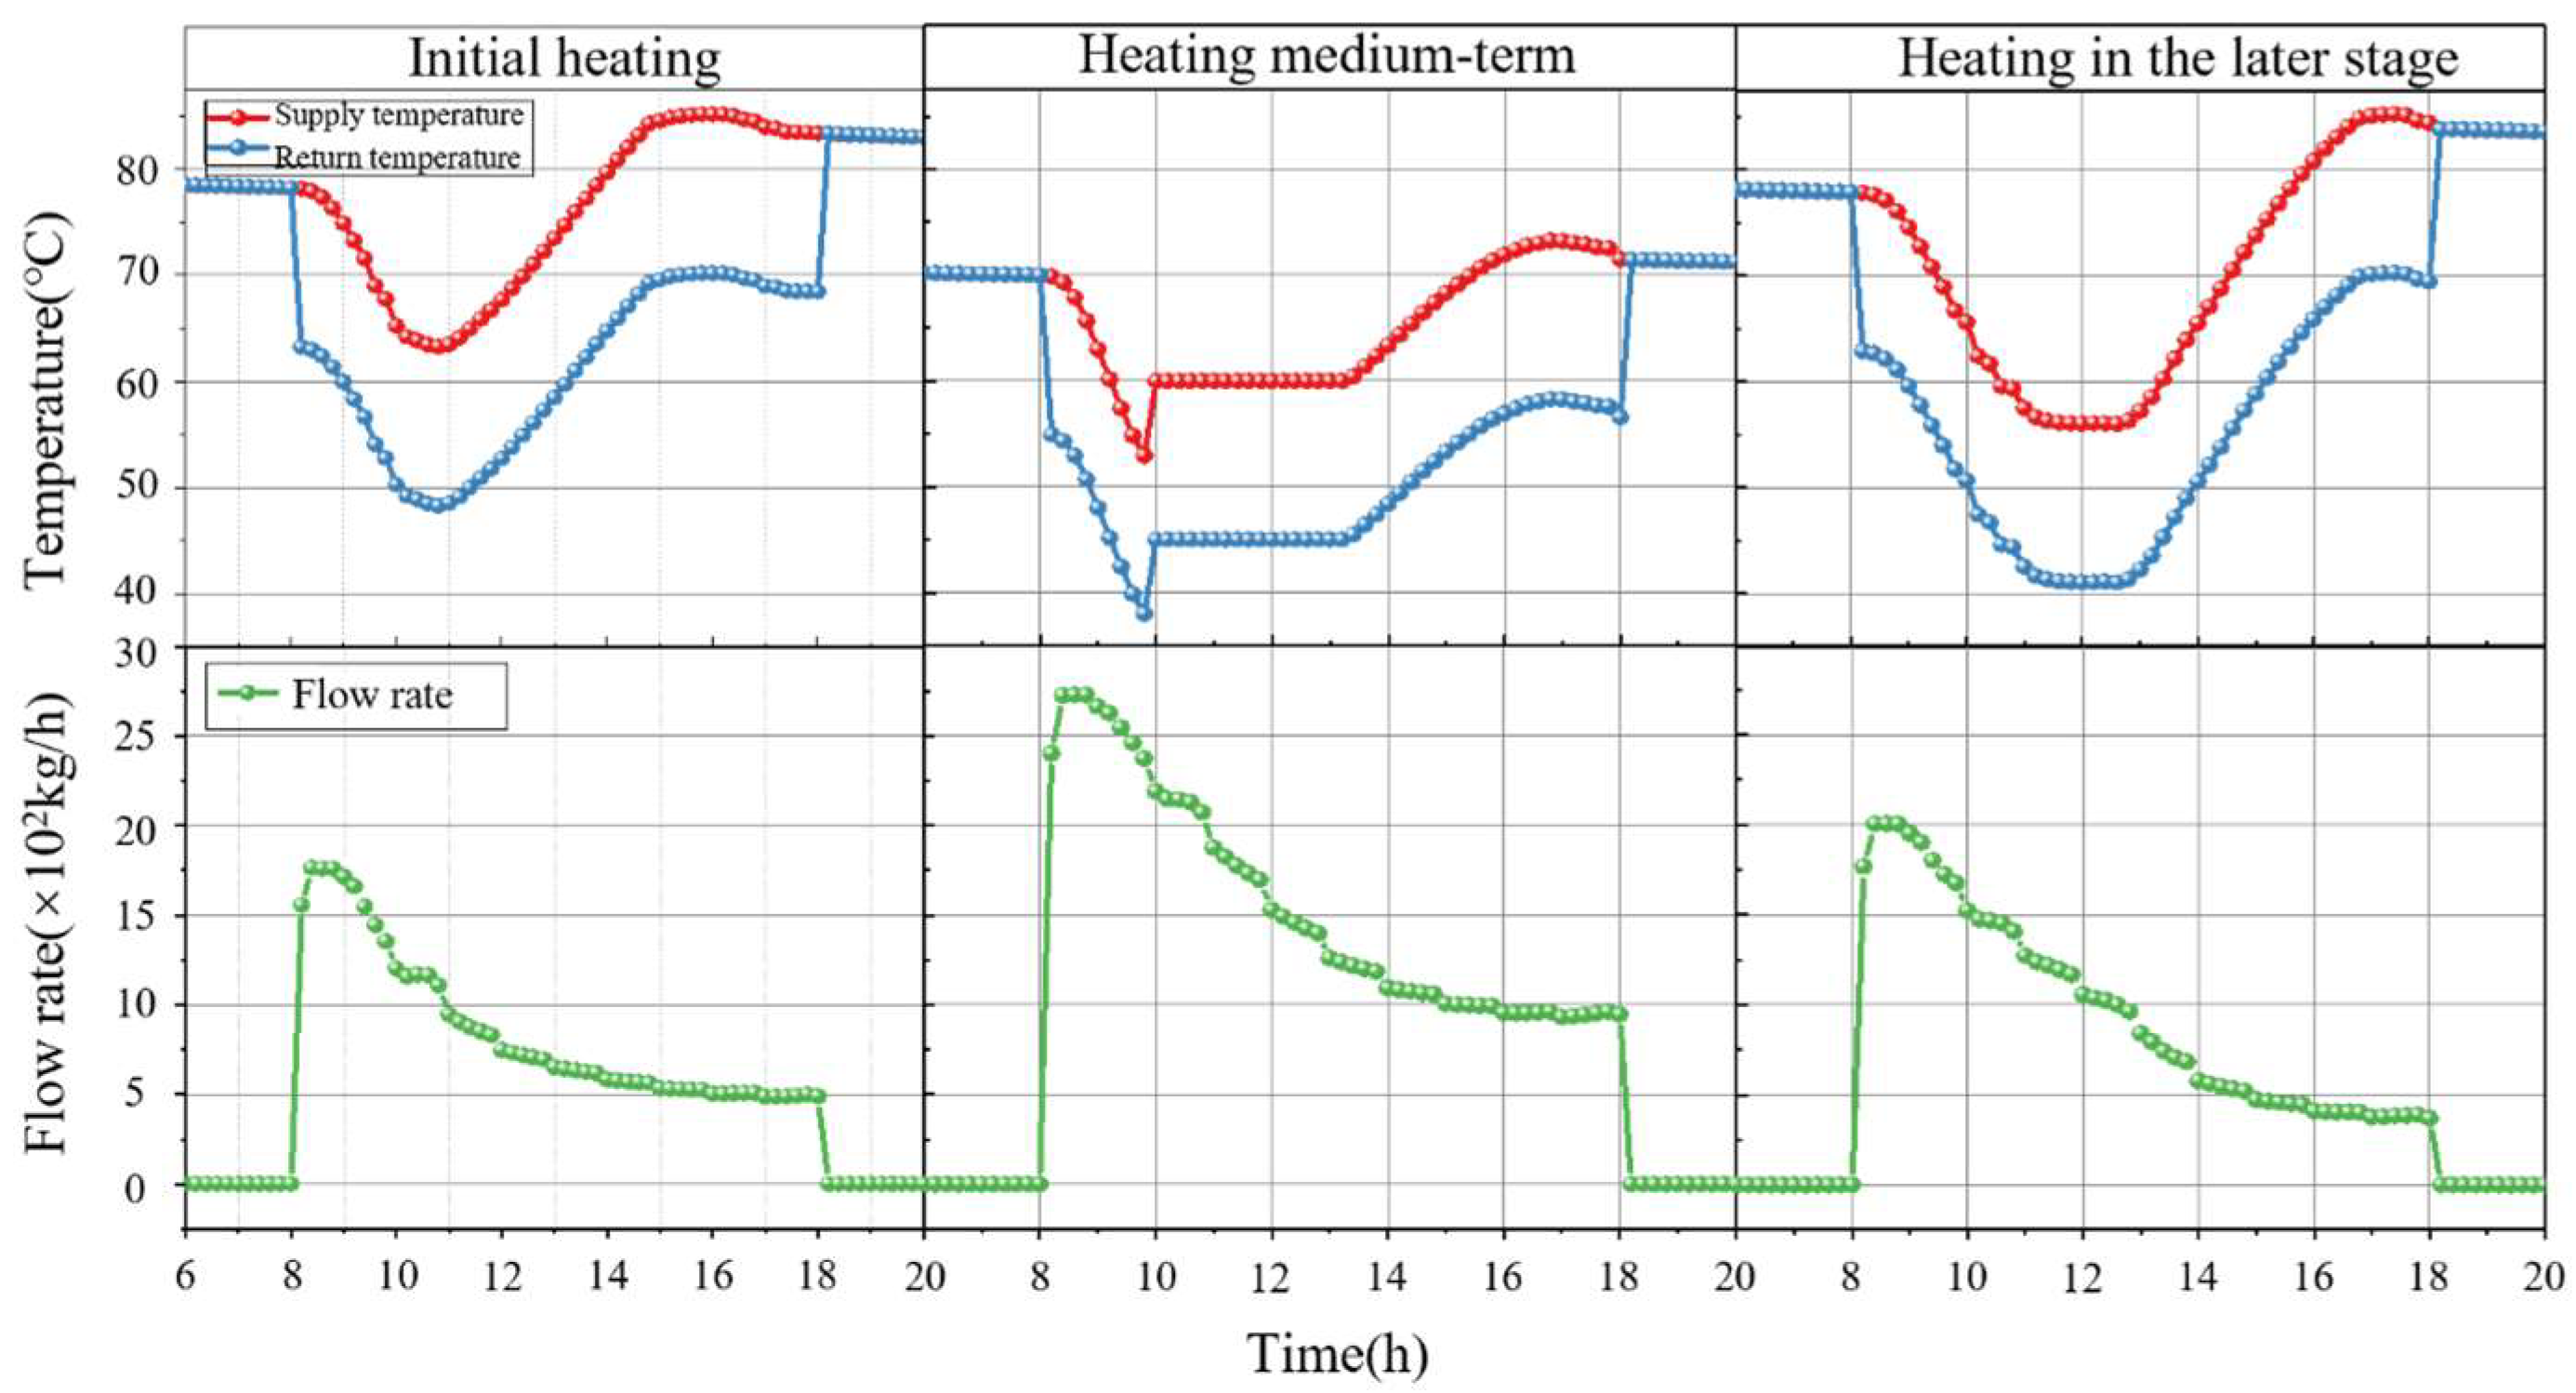
Figure 20 demonstrates the heating system’s hydraulic dynamics, showing flow rates directly correlated with building thermal demand. Initial morning operation (08:00) exhibits rapid flow increases to meet preheating requirements, maintaining elevated levels until 10:00 as supply–return temperatures gradually decrease. Subsequent solar collection reduces building loads, decreasing flow rates accordingly. Early and late heating phases show increasing supply–return temperatures, indicating solar collection exceeds building demand, while mid-season operation requires auxiliary heating supplementation. System shutdown coincides with minimum flows and maximum temperatures, with flow rates varying significantly across heating phases: early (500–1850 kg/h), middle (900–2700 kg/h), and late (450–2000 kg/h) seasons, demonstrating substantial Day–Night flow variability.
(2) Composite Intermittent heating mode.
Figure 21 illustrates the hydraulic characteristics of the multi-scale Composite Intermittent heating system, showing flow rates precisely tracking thermal load variations. Daily operations demonstrate flow fluctuations corresponding to short-term load changes, while intraweek patterns exhibit decreasing flow peaks as loads decrease. Weekend operation elevates storage temperatures to maximum levels, resulting in Monday’s substantial preheating demands and corresponding peak flows. Weekly supply temperatures range from 60 °C to 85 °C, with flow rates varying seasonally: early (1000–3200 kg/h), middle (2200–6300 kg/h), and late (1000–4300 kg/h) heating periods. The system’s initial high flow rates during Monday startup can be mitigated through strategic preheating, simultaneously reducing peak flows and startup thermal loads.
(3) Day–Night + Monthly Intermittent heating mode.
Figure 22 demonstrates the operational characteristics of the diurnal collection/nocturnal heating system, showing distinct thermal patterns during heating cycles. Supply temperatures peak at 75 °C during system startup, maintaining relative stability from 21:00 to 00:00 before gradually decreasing as nocturnal heating demands increase, reaching 60 °C by 04:00 during mid-season operation. This temperature decline necessitates auxiliary heating activation from 04:00 to 08:00 when solar collection proves insufficient. These trends suggest using staged flow control for better performance. Flow rates exhibit moderate fluctuations across heating phases: early (1000–1500 kg/h), middle (1800–2300 kg/h), and late (1200–1600 kg/h) periods, with seasonal increases corresponding to outdoor temperature decreases.

4.3. Annual Energy Consumption Analysis of Intermittent Solar Heating System

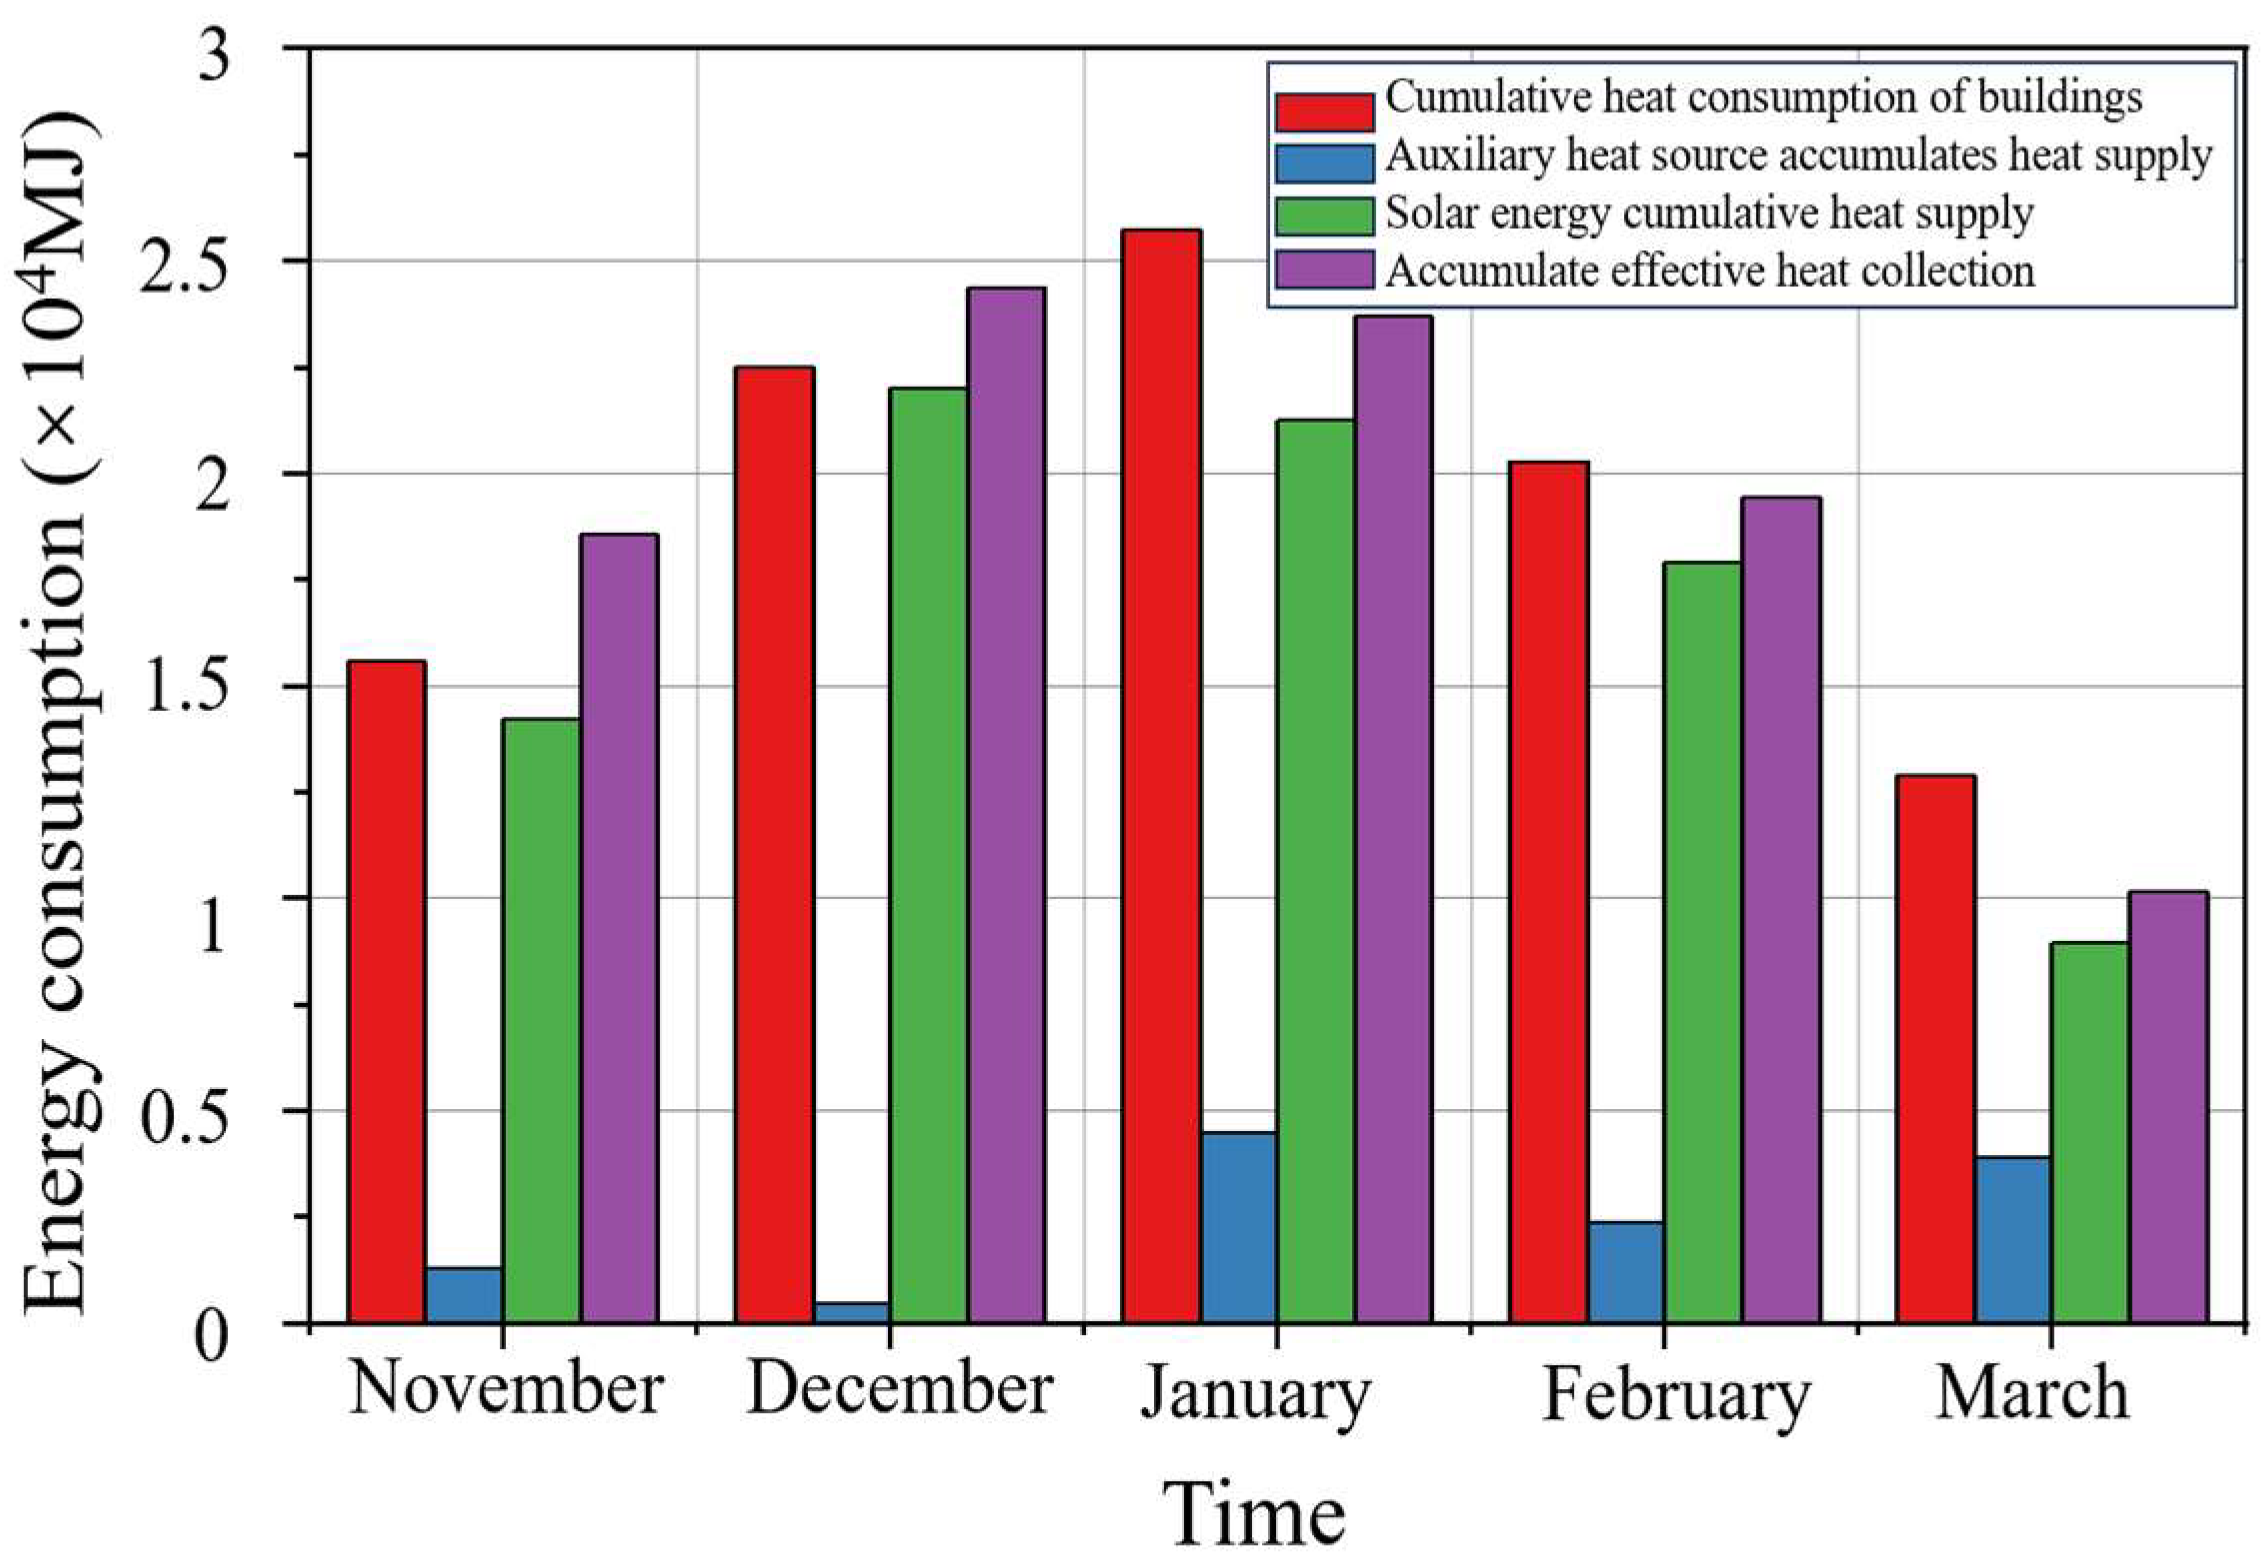
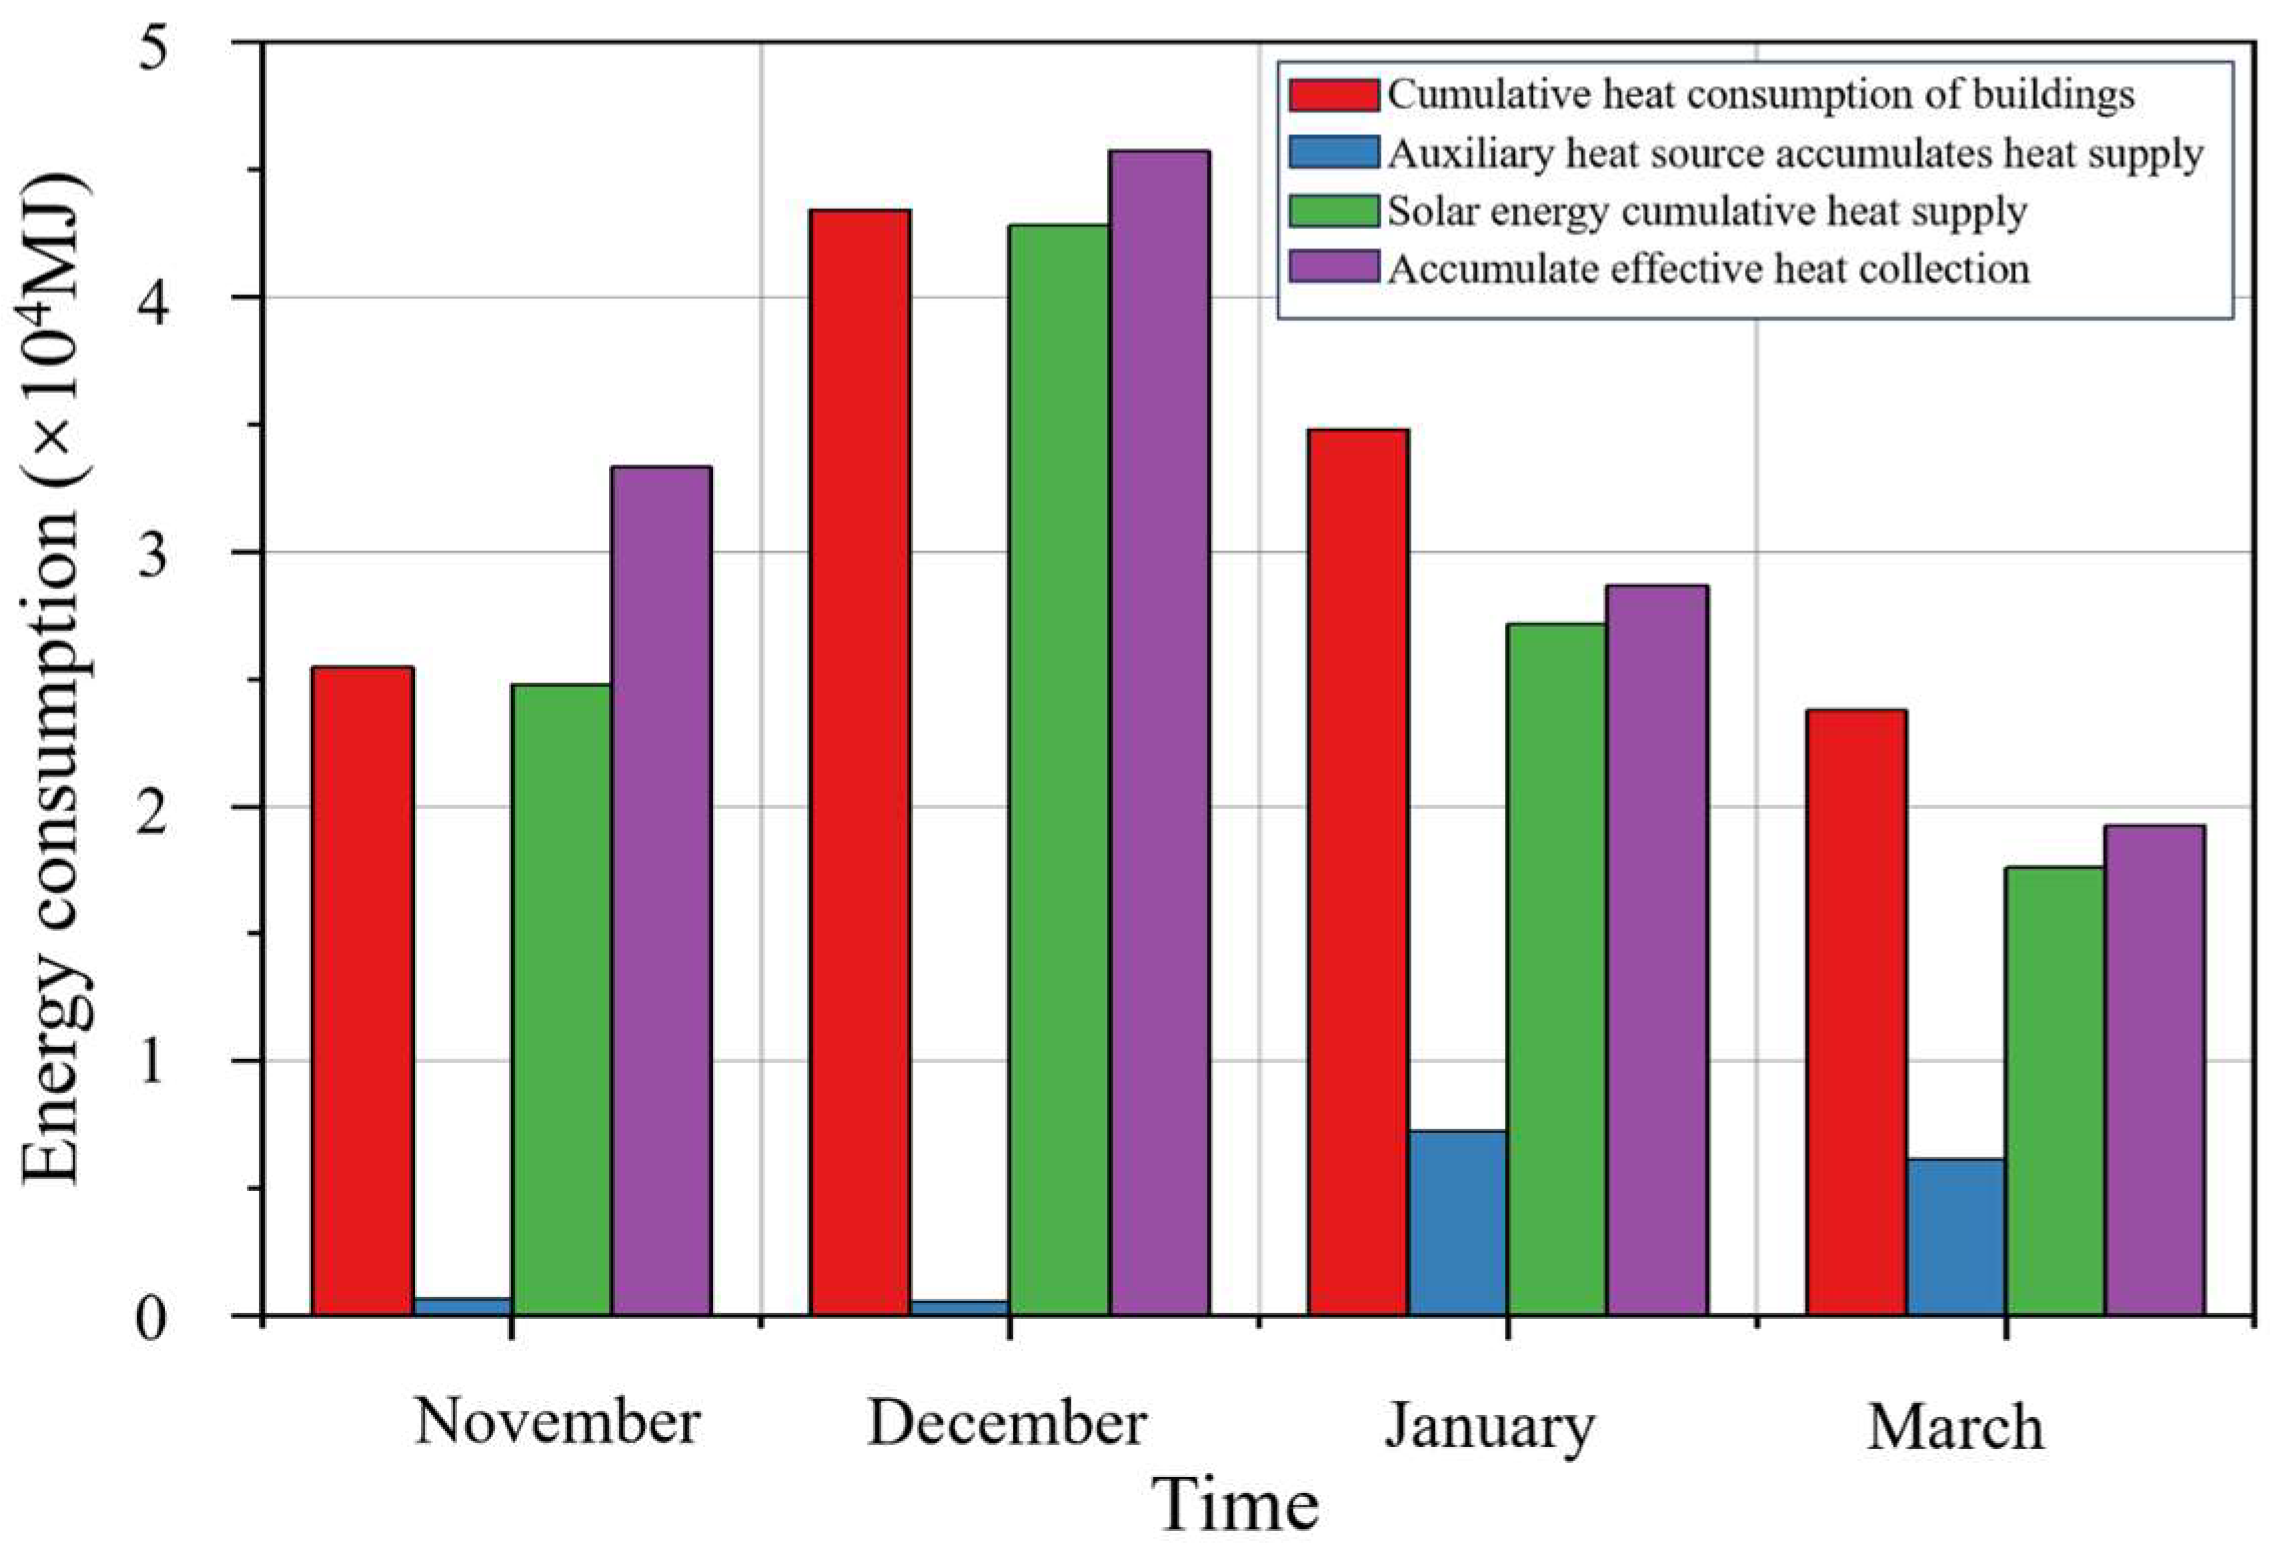
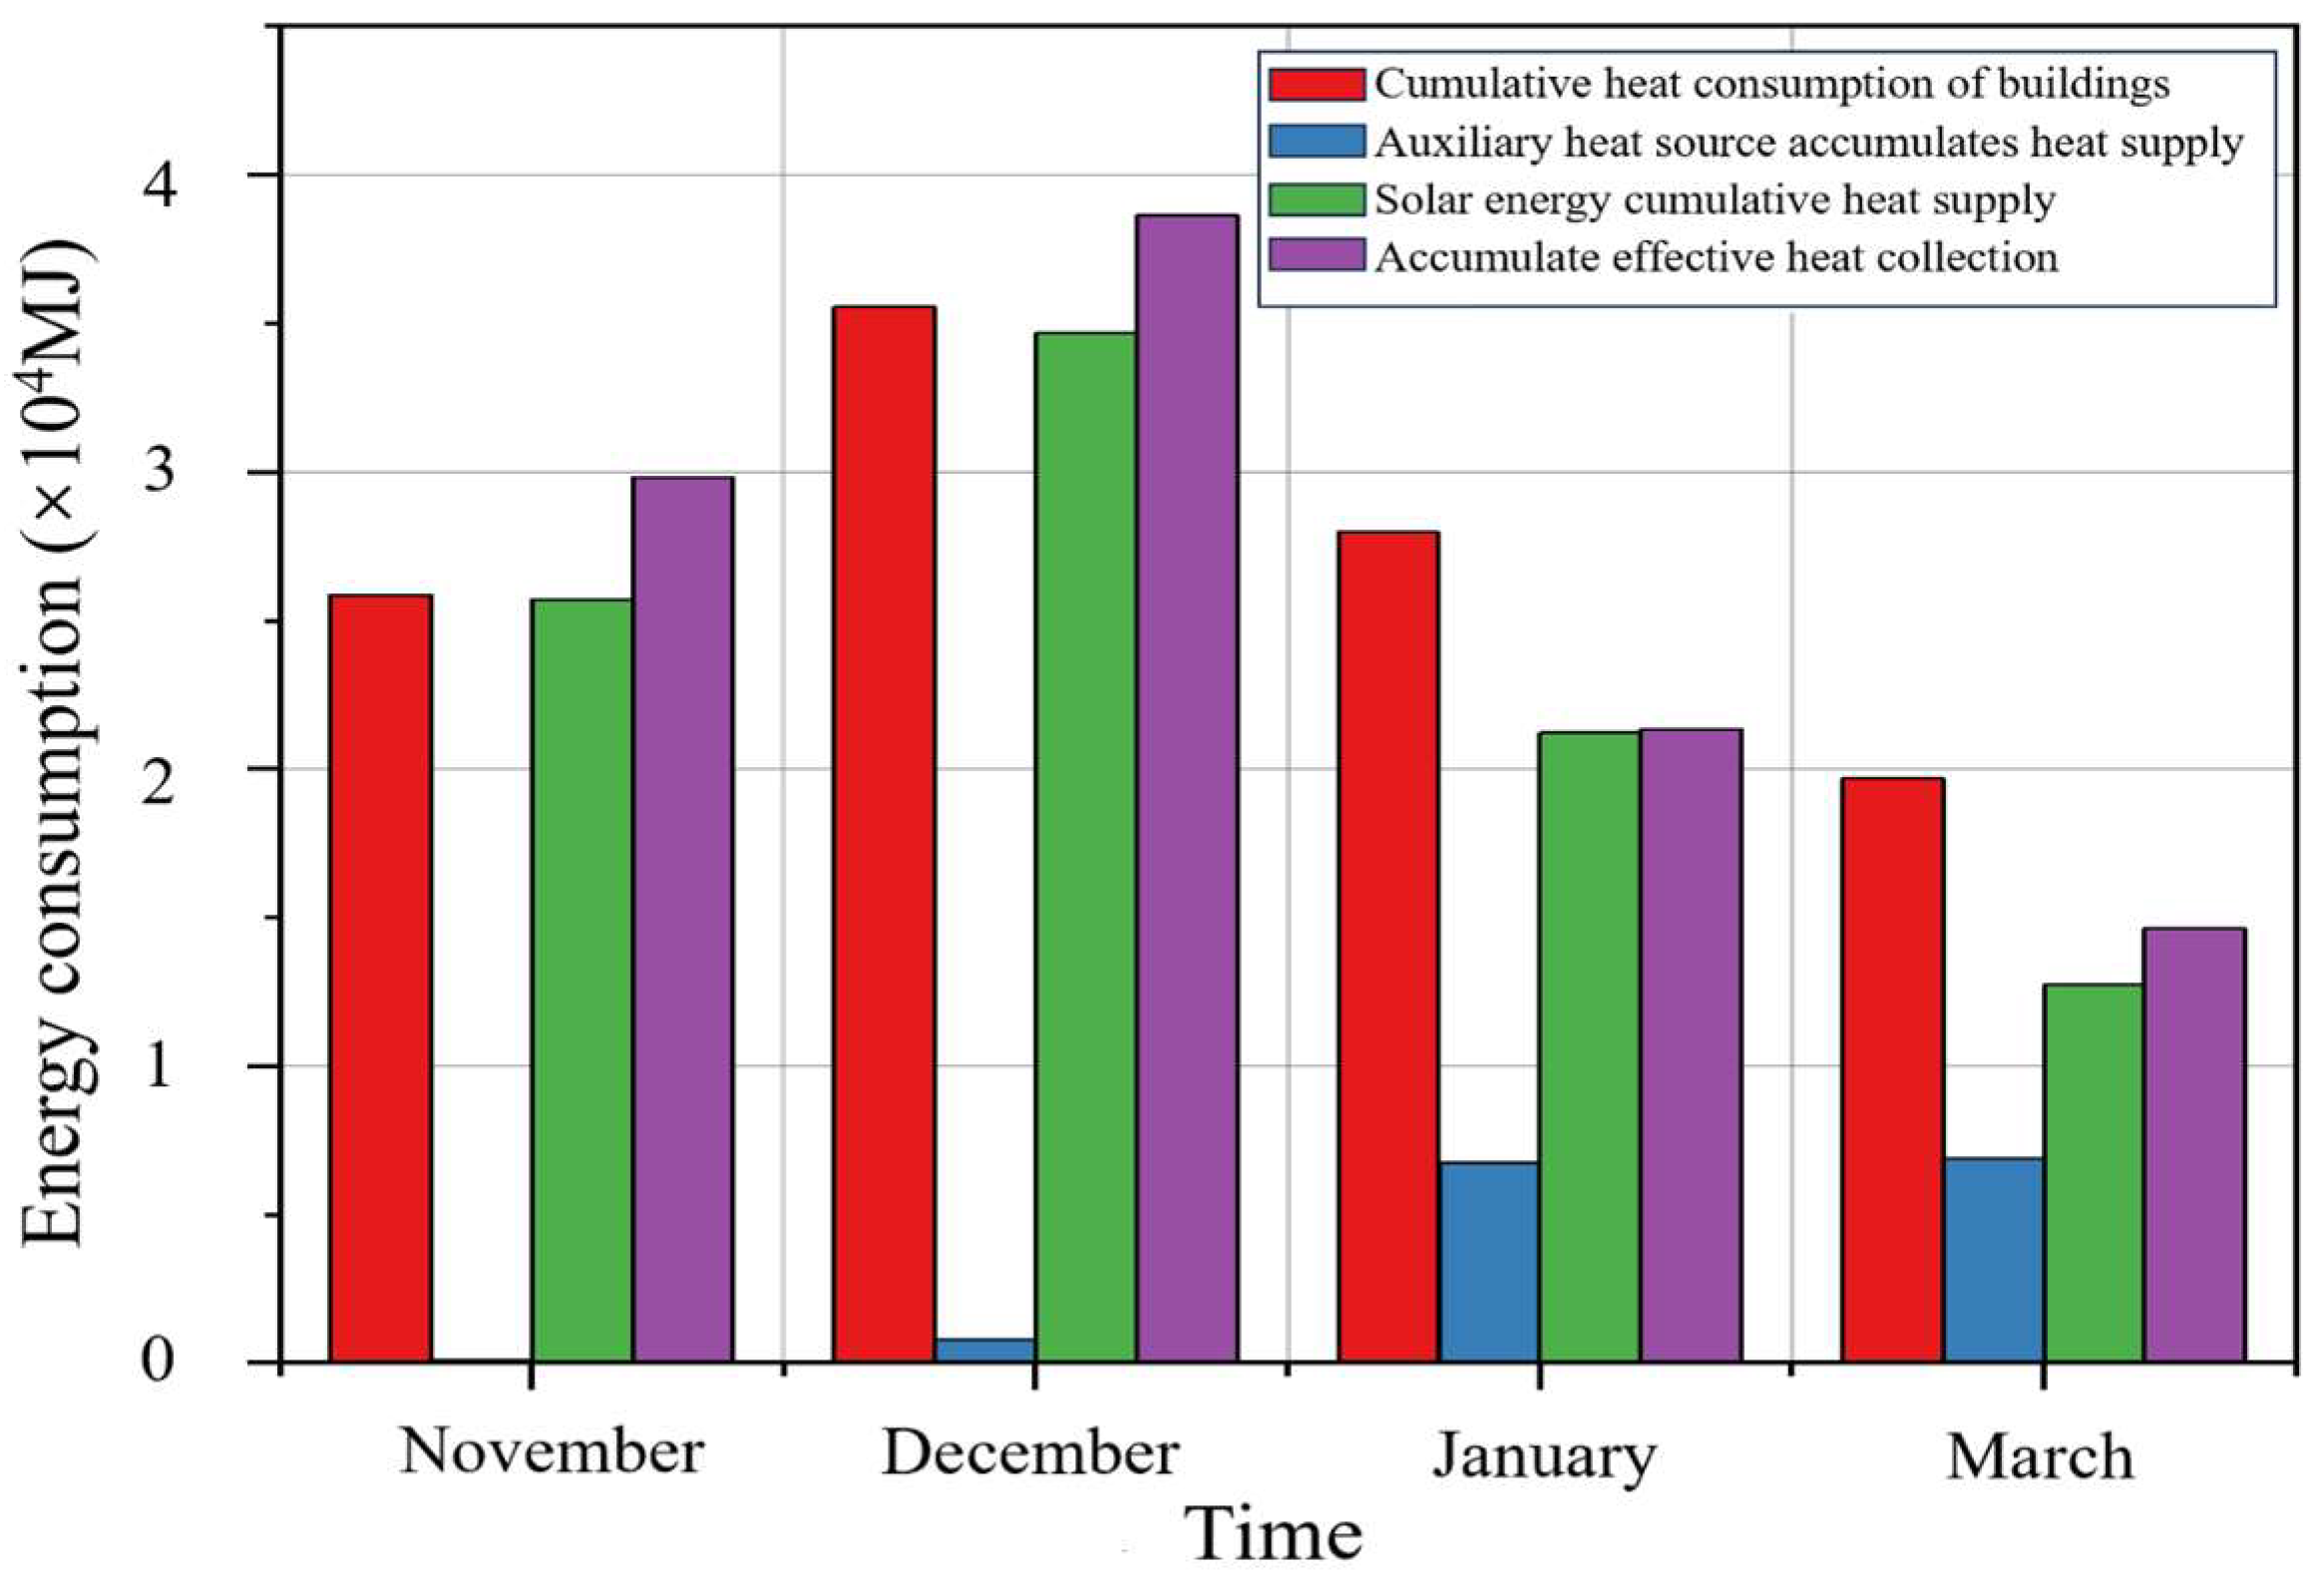
Figure 23, Figure 24 and Figure 25 present the seasonal performance metrics of intermittent solar heating systems, quantifying monthly cumulative values for building heat demand, effective solar collection, and auxiliary heating requirements throughout the heating season.
As shown in Figure 6, solar radiation intensity in Lhasa increases toward the late heating season; however, the cumulative monthly solar heat collection in Figure 23 and Figure 24 declines in March due to reduced heating demand, earlier system cut-offs at high tank temperatures, and variable daily radiation patterns typical of March’s rapidly changing weather conditions.
Figure 23 illustrates significant seasonal variations in solar fraction across the heating period. Early-season operation (November–December) achieves high solar fractions of 91.0% and 97.7%, respectively, benefiting from intense solar radiation and minimal heating demands. Mid-season performance (January–February) shows reduced solar fractions of 82.5% and 88.3% due to increased building loads and diminished solar availability. Late-season operation (March) demonstrates further reduction to 69.4% despite decreased heating requirements, resulting from variable solar radiation patterns. The overall heating season maintains an 86.9% solar fraction for Day–Night intermittent heating.
Figure 24 demonstrates substantial seasonal variations in solar fraction, with November and December achieving 97.4% and 98.5%, respectively. November’s performance benefits from abundant solar collection opportunities during minimal heating demands, while December shows increased effective heating despite higher building loads. January’s solar fraction decreases to 78.0% due to reduced solar availability and heating suspension during winter break, with March maintaining 74.0% despite improved conditions. The multi-scale Composite Intermittent heating achieves an 88.2% seasonal solar fraction, demonstrating effective solar utilization across varying operational conditions.
In the late heating season (March), despite an increase in average daily solar radiation intensity (Figure 6), cumulative monthly solar heat collection (Figure 23 and Figure 24) decreases. This is because rising ambient temperatures reduce heating demand and shorten operating hours, high tank temperatures cause earlier cut-offs, and frequent short-term cloud cover limits effective daily collection even under high peak radiation.
Figure 25 illustrates seasonal performance variations, showing significant heating demand reductions during January–February due to winter break. November–December operation achieves exceptional solar fractions exceeding 97%, fully meeting building requirements through abundant solar radiation. January’s performance decreases to 75.8% due to diminished solar availability, while March demonstrates further reduction to 64.7% resulting from variable radiation patterns. The Day–Night + Monthly Intermittent Mode maintains an 86.4% seasonal solar fraction, demonstrating reliable solar utilization across diverse operational conditions.
Comparative analysis reveals that classroom buildings achieve the highest solar fraction (88.2%) due to winter break suspension and immediate daytime heat usage, which minimizes thermal losses. Dormitory buildings demonstrate slightly reduced performance (86.4%) because nocturnal heating increases heat loss through storage. Office buildings maintain a solar fraction of 86.9% but are constrained by reduced solar availability during short-term intermittent heating. This is due to differences in heating schedules and thermal storage timing, which determine how effectively solar energy can be collected, stored, and utilized. These variations highlight the significant impact of operational patterns on solar utilization efficiency across different building types.

4.4. Comparative Analysis of Heat Storage Capacity with Traditional Design Methods

Traditional solar collector sizing employs a solar fraction methodology, calculating collector area based on the ratio between daily effective heat collection and building thermal demand. Table 8 outlines thermal storage capacity parameters for intermittent solar heating systems, categorized as short-term storage configurations with recommended tank volumes of 50–150 L/m2. For daytime heating/nighttime collection systems, reduced storage needs justify a 100 L/m2 capacity under conventional design principles. Conversely, systems operating in daytime collection/nighttime heating modes require increased storage capacity (150 L/m2) to compensate for temporal mismatches between solar availability and heating demands, ensuring uninterrupted thermal supply during non-collection periods.
Applying standardized design parameters from established specifications, this study calculates key system parameters—thermal loads, solar collector dimensions, and thermal storage capacities—for representative building types. The methodological framework systematically compares conventional continuous operation with optimized intermittent heating configurations, deriving critical design specifications for both approaches. Comparative analysis of solar collector surface areas and thermal storage requirements between these operational paradigms is quantitatively presented in Table 9 and Table 10, revealing significant efficiency improvements achievable through intermittent system design optimization.
Table 11 presents a comparative analysis of thermal storage capacities derived from conventional steady-state design methodologies versus dynamic intermittent heating optimization approaches, highlighting significant capacity reductions achievable through time-dependent system modeling and operational pattern integration.
The comparative analysis demonstrates that intermittent heating operation significantly reduces solar thermal system capacity requirements, reducing collector area and storage volume by 50–60%. These capacity reductions enable substantial initial cost savings without compromising thermal performance during building occupancy periods, validating the technical and economic advantages of intermittent heating system design.
Comparative analysis reveals that dynamic intermittent heating design significantly optimizes system parameters compared to traditional steady-state methods, with office buildings showing collector area reduction from Ac/m = 0.16 to 0.12 due to higher daytime temperatures, classroom buildings decreasing from 0.12 to 0.10 despite weekly load variations, and dormitory buildings achieving minimal reduction from 0.16 to 0.15 due to lower nighttime temperatures and monthly cycling effects. Storage requirements vary substantially, with daytime heating systems (office/classroom) showing minor capacity deviations, while nocturnal heating systems (dormitory) require significantly larger tanks under dynamic design to accommodate monthly cycling demands, demonstrating the method’s superior capacity to integrate temporal heating patterns and environmental variability.

5. Conclusions

This study developed an optimized design methodology for intermittent solar heating systems by integrating thermal load characterization, revised capacity calculation, and performance evaluation across multiple operational modes. The main conclusions are as follows:
(1) Intermittent heating systems reduce annual cumulative heat loads by 13–33% compared with conventional continuous heating, underscoring their strong potential for energy conservation in cold-climate buildings.
(2) The study proposes an optimized design methodology for intermittent solar heating systems by incorporating typical thermal load characteristics. Based on revised calculations for collector area and storage tank volume, the recommended design parameters are as follows: For the Day–Night Intermittent Mode, Ac/m = 0.119 and V/Ac = 0.12–0.32; for the Day-Night + Monthly Mode, Ac/m = 0.158 and V/Ac = 0.21–0.31; and for the Composite Mode, Ac/m = 0.1 and V/Ac = 0.07–0.22.
(3) Intermittent solar heating systems achieve consistent solar fractions of 86–88% across operational modes.
(4) The study establishes an optimized design framework for solar-rich regions, focusing on office buildings, dormitories, and educational facilities. The proposed intermittent heating correction methodology provides valuable design references for solar thermal applications in Tibet, addressing regional-specific heating requirements and solar availability patterns.

Author Contributions

X.H. and M.D. conceived and designed the study; X.H. and P.B. developed the methodology; P.B. and Y.W. performed the software development and formal analysis; Y.W. and M.D. conducted the investigation; X.H. and Y.W. wrote the original draft; all authors X.H., P.B., Y.W., and M.D. contributed to the review and editing of the manuscript; M.D. was responsible for visualization; X.H. provided supervision and acquired funding. All authors have read and agreed to the published version of the manuscript.

Funding

This research received the Department of Housing and Urban–Rural Development, Tibet Autonomous Region, key research and development and transformation of Tibet Autonomous Region science and technology programs, sub-topic project, the Tibet Autonomous Region, The Tibet Autonomous Region, The Tibet Autonomous Region (XZ202501ZY0121, funding amount CNY 480,000) and Yulin Science and Technology Bureau, Yulin Municipal Science and Technology Program Projects (2024-CXY-161, funding amount CNY 150,000).

Data Availability Statement

Due to the qualitative and confidential nature of the interview data, they are not publicly available. However, anonymized excerpts may be shared upon reasonable request, subject to ethical approval.

Conflicts of Interest

The authors declare no conflict of interest.

Abbreviations

The following abbreviations are used in this manuscript:
TRNSYSTransient System Simulation Tool
TMYTypical Meteorological Year
SHSSolar Heating Systems
TCEstandard coal equivalent
COMSOLCOMSOL Multiphysics
Nomenclature
AcCollector area, m2
AcTotal solar collector area, m2
Aj, Aj−1heat loss surface area of the storage tank, m2
a0Empirical coefficient (intercept)
a1First-order temperature coefficient, K−1
a2Second-order temperature coefficient, K2
Cpspecific heat capacity of the fluid, kJ/kg·K
Csheat capacity of the radiator, J/°C
CtankHeat capacity of the thermal storage tank, kJ/K
f parproportion of pump electrical power converted to heat, kW
FRSolar collector heat transfer factor
Fsheat transfer area, m2
fnSolar fraction, %
GTotal solar irradiance, W/m2
HCumulative heat, kJ
Iθ(τ) Solar irradiance on inclined surfaces, W/m2
Lcond,jThickness of layer j, m
Lcond, j−1Thickness of layer j−1, m
Mass flow rate, kg/s
Ppump power consumption, kW
Q′LCumulative heat consumption during heating period, kJ
QuTotal radiation during heating operation period, kJ
Qu(τ) Fitting curve of effective solar heat collection
Ql(τ) Hourly heat load fitting curve of the building
Qinputheat supplied to the fluid by the auxiliary heat source
Qg(τ) Water-side thermal load, kW
Qin,tankHeat flow into the tank, kW
Qout,tankHeat flow out of the tank, kW
Qcond,jConductive heat transfer in direction j, kW
QlossTotal heat loss from the tank, kW
Qloss, topHeat loss from the top of the tank, kW
Qloss, bottomHeat loss from the bottom of the tank, kW
Qiu(τ) Upper-bound heat flow in group I, kJ
Qil(τ) Lower-bound heat flow in group i, kJ
Qloss,jHeat loss from direction j, kW
Qloss, edgesHeat loss from the sides/edges, kW
ql(τ) Hourly heat load of building, kW
Tenvambient temperature surrounding the storage tank, °C
To, Tioutlet and inlet temperatures, respectively, °C
Tg, ThRadiator inlet and outlet water temperature, °C
Tj, Tj−1Temperatures at layer j and j−1, °C
Ttank,jtemperature at node j of the storage tank, m2
tlInitial temperature of hot water tank, °C
tendHot water tank termination temperature, °C
UOverall heat transfer coefficient, W/m2·K
V′The volume of the hot water storage tank, m3
τ1, τ2Daily solar radiation time period
τa, τbIntermittent heating start and stop periods
ηoverallTotal pump efficiency
ηmotorMotor efficiency
ηpumpingPump operating efficiency
ηLheat loss rate of the storage tank and piping
ηcdaverage collector efficiency during the heating period
ΔQheat storage capacity, kJ
ΔTTemperature difference, K
εheaterthermal efficiency of the auxiliary heater
(τα)eEffective Projection Absorption Factor
Cumulative solar thermal energy supplied to the buildingTotal useful heat delivered from the solar heating system to meet building demand over a given period, kJ or kWh.
Cumulative effective solar thermal energyTotal useful thermal energy collected by the solar collectors over a given period, after accounting for system efficiency and losses, kJ or kWh.

References

  1. Abbasi, K.R.; Shahbaz, M.; Zhang, J.; Irfan, M.; Alvarado, R.; Zahid, A.; Khan, Z.A. Analyze the environmental sustainability factors of China: The role of fossil fuel energy and renewable energy. Renew. Energy 2022, 187, 390–402. [Google Scholar] [CrossRef]
  2. Pan, J.; Chen, X.; Luo, X.; Wang, Y.; Li, Z.; Hu, S.; Liu, Y. Analysis of the impact of China’s energy industry on social development from the perspective of low-carbon policy. Energy Rep. 2022, 8, 14–27. [Google Scholar] [CrossRef]
  3. China Building Energy Conservation Association. China Building Energy Consumption Annual Report 2020. J. BEE 2021, 49, 1–6. [Google Scholar]
  4. Xu, S.; Ge, J. Sustainable development of clean heating in rural northern China: Locally tailored energy options. Sustain. Prod. Consum. 2023, 35, 655–667. [Google Scholar] [CrossRef]
  5. Jiang, Y.; Hu, S.; Liu, X.; Chen, Y.; Zhou, D. Decarbonize Public and Commercial Buildings: China Building Energy and Emission Yearbook 2022; Springer: Singapore, 2022. [Google Scholar] [CrossRef]
  6. Jiang, Y.; Hu, S. Paths to carbon neutrality in China’s building sector. Heat. Vent. Air Cond. 2021, 51, 1–13. [Google Scholar]
  7. Wang, X.; Huang, J.; Liu, H. Can China’s carbon trading policy help achieve carbon neutrality?—A study of policy effects from the Five-Sphere Integrated Plan perspective. J. Environ. Manag. 2022, 305, 114357. [Google Scholar] [CrossRef] [PubMed]
  8. Hepburn, C.; Qi, Y.; Stern, N.; Ward, B.; Xie, C.; Zenghelis, D.; Teng, F.; Jia, J. Towards carbon neutrality and China’s 14th Five-Year Plan: Clean energy transition, sustainable urban development, and investment priorities. Environ. Sci. Ecotechnol. 2021, 8, 100130. [Google Scholar] [CrossRef] [PubMed]
  9. Ye, A.; Guan, B.; Liu, X.; Chen, L.; Wu, Y.; Wang, Q. Using solar energy to achieve near-zero energy buildings in the Tibetan Plateau. Renew. Energy 2023, 218, 119347. [Google Scholar] [CrossRef]
  10. Gao, J.; Li, S.; Wu, F.; Wang, Y.; Zhang, H. Study on efficient heating method by solar coupled air source heat pump system with phase change heat storage in severe cold region. Appl. Energy 2024, 367, 123206. [Google Scholar] [CrossRef]
  11. Georgiev, A.; Popov, R.; Toshkov, E. Investigation of a hybrid system with ground source heat pump and solar collectors: Charging of thermal storage and space heating. Renew. Energy 2020, 147, 2774–2790. [Google Scholar] [CrossRef]
  12. Wang, Z.; Luo, M.; Geng, Y.; Lin, B.; Hong, J. A model to compare convective and radiant heating systems for intermittent space heating. Appl. Energy 2018, 215, 211–226. [Google Scholar] [CrossRef]
  13. Zhang, Z.; Zhou, Y.; Zhao, N.; Zhou, J.; Chen, X.; Song, X. Clean heating during winter season in Northern China: A review. Renew. Sustain. Energy Rev. 2021, 149, 111339. [Google Scholar] [CrossRef]
  14. Dear, R.J.; Akimoto, T.; Arens, E.A.; Brager, G.; Candido, C.; Cheong, K.W.D.; Cheong, B.; Li, N.; Nishihara, S.C.; Sekhar, S.; et al. Progress in thermal comfort research over the last twenty years. Indoor Air 2013, 23, 442–461. [Google Scholar] [CrossRef] [PubMed]
  15. Pineau, D.; Rivière, P.; Stabat, P.; Marchio, D. Performance analysis of heating systems for low energy houses. Energy Build. 2013, 65, 45–54. [Google Scholar] [CrossRef]
  16. Liu, G.; Zhou, X.; Yan, J.; Zhang, W.; Liu, M. A temperature and time-sharing dynamic control approach for space heating of buildings in district heating systems. Energy 2021, 221, 119835. [Google Scholar] [CrossRef]
  17. Yu, H.; Liu, Z.; Li, C.; Xu, X.; Zhang, H.; Wang, Y. Study on pricing mechanism of cooling, heating, and electricity considering demand response in the stage of park integrated energy system planning. Appl. Sci. 2020, 10, 1565. [Google Scholar] [CrossRef]
  18. Andersen, R.V.; Toftum, J.; Andersen, K.K.; Olesen, B.W. Survey of occupant behavior and control of indoor environment in Danish dwellings. Energy Build. 2009, 41, 11–16. [Google Scholar] [CrossRef]
  19. Yang, B.; Liu, Y.; Liu, P.; Li, H.; Zhang, X. A novel occupant-centric stratum ventilation system using computer vision: Occupant detection, thermal comfort, air quality, and energy savings. Build. Environ. 2023, 237, 110332. [Google Scholar] [CrossRef]
  20. Zhou, R.; Gao, P.; Wang, J.; Li, Z.; Zhang, M. Analysis of time-sharing and zoning heat load demand and research on heating control of large heating buildings. Int. J. Heat Technol. 2022, 40, 1105–1113. [Google Scholar] [CrossRef]
  21. Meng, X.; Huang, Y.; Cao, Y.; Zhang, J.; Li, X. Optimization of the wall thermal insulation characteristics based on the intermittent heating operation. Case Stud. Constr. Mater. 2018, 9, e00188. [Google Scholar] [CrossRef]
  22. Badran, A.A.; Jaradat, A.W.; Bahbouh, M.N. Comparative study of continuous versus intermittent heating for local residential building: Case studies in Jordan. Energy Convers. Manag. 2013, 65, 709–714. [Google Scholar] [CrossRef]
  23. Wang, S.; Kang, Y.; Yang, Z.; Zhang, X.; Huang, Y. Numerical study on dynamic thermal characteristics and optimum configuration of internal walls for intermittently heated rooms with different heating durations. Appl. Therm. Eng. 2019, 155, 437–448. [Google Scholar] [CrossRef]
  24. Wang, D.; Liu, Y.; Wang, Y.; Li, M.; Zhang, Y. Numerical and experimental analysis of floor heat storage and release during an intermittent in-slab floor heating process. Appl. Therm. Eng. 2014, 62, 398–406. [Google Scholar] [CrossRef]
  25. Zhu, Y.; Li, W.; Zhou, B.; Wang, Y.; Zhang, L. Energy saving effect of different wall structures based on intermittent energy use characteristics in a hot summer and cold winter zone. In Proceedings of the Heat Transfer Summer Conference, Washington, DC, USA, 10–14 July 2016; American Society of Mechanical Engineers: New York, NY, USA, 2016; Volume 50336, p. V002T20A001. [Google Scholar] [CrossRef]
  26. Sun, S.; Wang, J.; Li, R.; Zhang, T.; Liu, H. Estimation of preheating time for building intermittent heating subject to changes in outdoor temperature and solar radiation. Energy Build. 2024, 317, 114405. [Google Scholar] [CrossRef]
  27. Tsilingiris, P.T. Wall heat loss from intermittently conditioned spaces—The dynamic influence of structural and operational parameters. Energy Build. 2006, 38, 1022–1031. [Google Scholar] [CrossRef]
  28. Liu, J.; Xin, Z.; Huang, Y.; Chen, H.; Li, X. Climate suitability assessment on the Qinghai-Tibet Plateau. Sci. Total Environ. 2022, 816, 151653. [Google Scholar] [CrossRef] [PubMed]
  29. Dordonnat, V.; Koopman, S.J.; Ooms, M.; Dessertaine, A.; Thomas, M. An hourly periodic state space model for modelling French national electricity load. Int. J. Forecast. 2008, 24, 566–587. [Google Scholar] [CrossRef]
  30. Wang, Z.; Ji, Y.; Su, X. Influence of outdoor and indoor microclimate on human thermal adaptation in winter in the severe cold area, China. Build. Environ. 2018, 133, 91–102. [Google Scholar] [CrossRef]
  31. An, S.; Chen, X.; Zhang, X.; Zhang, Y.; Zhang, J.; He, C. Precipitation and minimum temperature are primary climatic controls of alpine grassland autumn phenology on the Qinghai-Tibet Plateau. Remote Sens. 2020, 12, 431. [Google Scholar] [CrossRef]
  32. Li, J.; Zhang, Y.; Yue, T. A new approach for indoor environment design of passive solar buildings in plateau areas. Sustain. Energy Technol. Assess. 2024, 63, 103669. [Google Scholar] [CrossRef]
  33. Si, P.; Feng, Y.; Lv, Y.; Li, J.; Wang, C. An optimization method applied to active solar energy systems for buildings in cold plateau areas—The case of Lhasa. Appl. Energy 2017, 194, 487–498. [Google Scholar] [CrossRef]
  34. Lin, B.; Wang, Z.; Liu, Y.; Hong, J.; Zhu, Y. Investigation of winter indoor thermal environment and heating demand of urban residential buildings in China’s hot summer–cold winter climate region. Build. Environ. 2016, 101, 9–18. [Google Scholar] [CrossRef]
  35. Huang, J.; Wang, S.; Teng, F.; Liang, Q.; Liu, X. Thermal performance optimization of envelope in the energy-saving renovation of existing residential buildings. Energy Build. 2021, 247, 111103. [Google Scholar] [CrossRef]
  36. Kim, H.; Hong, T.; Kim, J.; Lee, M.; Koo, C. A psychophysiological effect of indoor thermal condition on college students’ learning performance through EEG measurement. Build. Environ. 2020, 184, 107223. [Google Scholar] [CrossRef]
  37. Wargocki, P.; Wyon, D.P. Providing better thermal and air quality conditions in school classrooms would be cost-effective. Build. Environ. 2013, 59, 581–589. [Google Scholar] [CrossRef]
  38. Zhang, X.; Zhao, C.; Zhang, T.; Li, Y.; Zhang, L. Association of indoor temperature and air quality in classrooms based on field and intervention measurements. Build. Environ. 2023, 229, 109925. [Google Scholar] [CrossRef]
  39. Bakó-Biró, Z.; Clements-Croome, D.J.; Kochhar, N.; Awbi, H.B.; Williams, M.J. Ventilation rates in schools and pupils’ performance. Build. Environ. 2012, 48, 215–223. [Google Scholar] [CrossRef]
  40. Xie, M.; Wang, M.; Zhong, H.; Zhang, J.; Liu, P. The impact of urban morphology on the building energy consumption and solar energy generation potential of university dormitory blocks. Sustain. Cities Soc. 2023, 96, 104644. [Google Scholar] [CrossRef]
  41. Ghiaus, C. Causality issue in the heat balance method for calculating the design heating and cooling load. Energy 2013, 50, 292–301. [Google Scholar] [CrossRef]
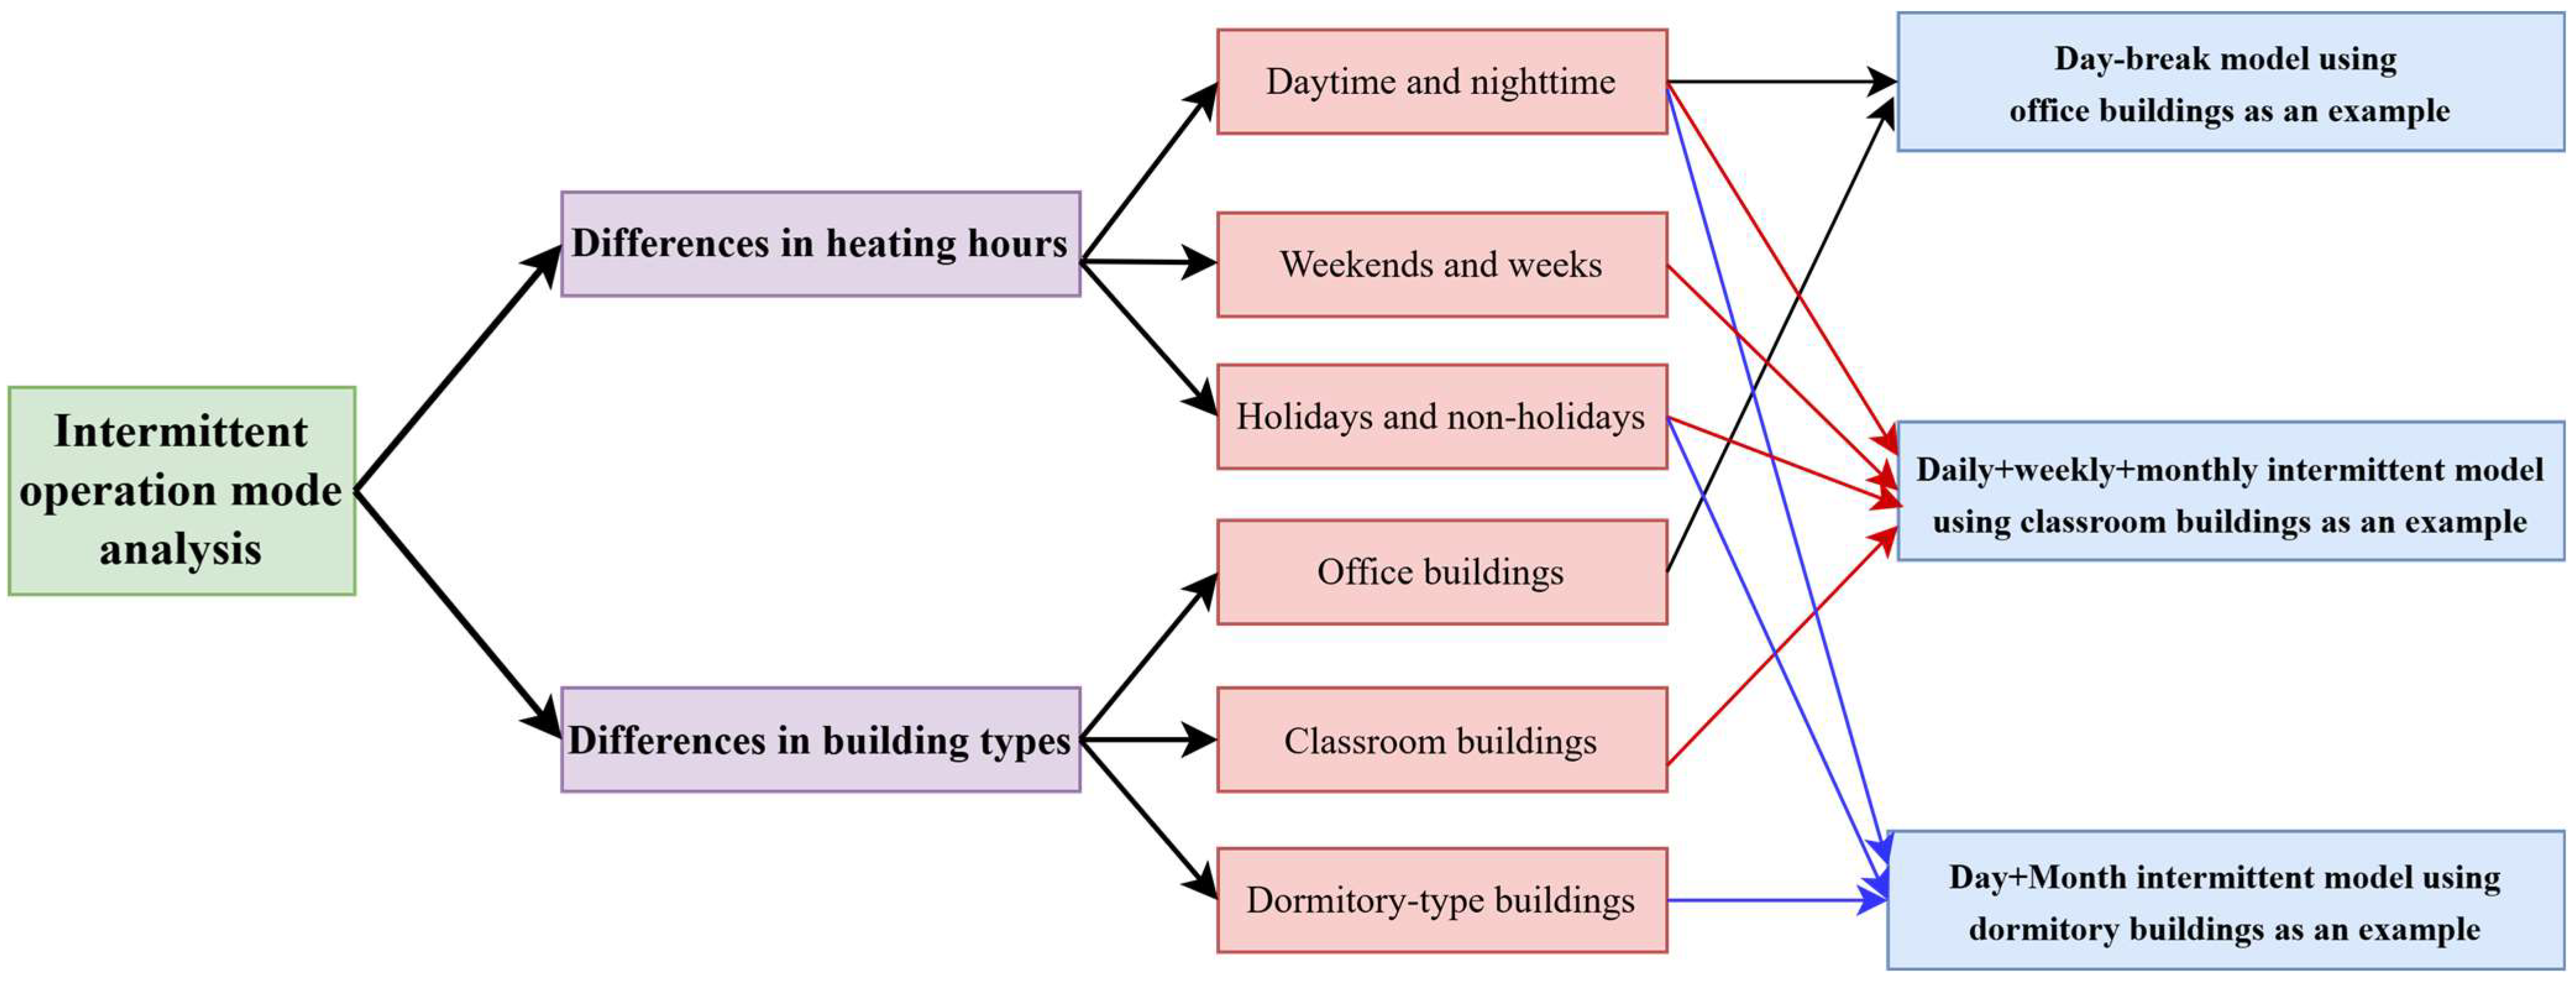
Figure 1. Intermittent heating building classification based on temporal patterns.
Buildings 15 02908 g001
Figure 2. Typical building intermittent heating operational patterns for the three modes.
Buildings 15 02908 g002
Figure 3. Hourly heat load profiles of three typical buildings (office, classroom, and dormitory) during the heating season.
Buildings 15 02908 g003
Figure 4. Building heat load under different heating operation modes.
Buildings 15 02908 g004
Figure 5. Hourly heat load fluctuations under the three intermittent heating modes: (a) Day–Night + Monthly Intermittent Mode; (b) Composite Intermittent Mode; (c) Day–Night Intermittent Mode.
Buildings 15 02908 g005
Figure 6. Outdoor meteorological parameters in Lhasa.
Buildings 15 02908 g006
Figure 7. Typical architectural SketchUp model: (a) Office buildings; (b) Classroom buildings; (c) Dormitory buildings.
Buildings 15 02908 g007
Figure 8. Water tank optimization operation control strategy.
Buildings 15 02908 g008
Figure 9. Changes in indoor temperature and heat load under two control strategies: (a) Indoor temperature variation during a weekend; (b) Hourly heat load changes over a typical week.
Buildings 15 02908 g009
Figure 10. System performance changes in Day–Night Intermittent Mode.
Buildings 15 02908 g010
Figure 11. Water tank operation characteristics in Day–Night Intermittent Mode.
Buildings 15 02908 g011
Figure 12. System performance changes in the Day–Night + Monthly Intermittent Mode.
Buildings 15 02908 g012
Figure 13. Day–Night + Monthly water tank operation characteristics.
Buildings 15 02908 g013
Figure 14. Inlet and outlet temperatures of collectors for Day–Night Intermittent Mode.
Buildings 15 02908 g014
Figure 15. Inlet and outlet temperatures of collectors for Composite Intermittent Mode.
Buildings 15 02908 g015
Figure 16. Collector inlet and outlet temperatures for Day–Night + Monthly Intermittent Mode.
Buildings 15 02908 g016
Figure 17. Temperature of each node of the water tank in Day–Night Intermittent heating mode.
Buildings 15 02908 g017
Figure 18. The temperature of each node of the Composite Intermittent water tank.
Buildings 15 02908 g018
Figure 19. Day–Night + Monthly Intermittent Heat storage tank temperature.
Buildings 15 02908 g019
Figure 20. Temperature and flow distribution on the daytime intermittent heating side.
Buildings 15 02908 g020
Figure 21. Temperature and flow distribution on the Day, Mid-Month, and Month Intermittent heating side.
Buildings 15 02908 g021
Figure 22. Temperature and flow distribution on the Day–Night + Monthly Intermittent Mode heating side.
Buildings 15 02908 g022
Figure 23. Monthly cumulative solar thermal energy supplied to the building supplied to the building in day–night intermittent mode.
Buildings 15 02908 g023
Figure 24. Monthly cumulative effective solar thermal energy in composite intermittent mode.
Buildings 15 02908 g024
Figure 25. Monthly cumulative heat consumption of the day–night and the monthly intermittent solar heating system.
Buildings 15 02908 g025
Table 1. Typical building collector design parameters.
Intermittent Heating ModeDay–Night Intermittent ModeComposite Intermittent ModeDay–Night + Monthly Intermittent Mode
Cumulative heat load during heating season (MJ)100,648137,170121,570
Total radiation during operation period (MJ/m2)3489.92672.52675.1
Required collector area (m2)72128113
The ratio of collector area required per unit heating area is (Ac/m)0.1190.0990.158
Table 2. Description of three typical building models.
Building TypeOffice BuildingClassroom BuildingDormitory Building
Architectural featuresThe volume is small, so natural ventilation and natural lighting can be usedCentral corridor building, large rooms, good lighting, low floorsSquare building, simple structure, and layout
construction area610 m21296 m2700 m2
Window to wall ratio0.40.50.3
Building height3 floors above ground, 3 m high3 floors above ground, 3 m high3 floors above ground, 3 m high
Table 3. Building envelope structure.
StructureMain Material NameThickness (mm)Heat Transfer Coefficient (W/(m2·K))
External WallCement mortar200.42
EPS insulation board76
Clay brick200
Interior WallGypsum mortar20
Clay porous brick2002.57
Cement mortar20
FloorReinforced concrete2000.89
Cement mortar20
Fine stone concrete200.63
RoofingExtruded polystyrene board40
Reinforced concrete120
External windowsThermal break aluminum window-1.4
Double-layered glass24
Table 4. Modeling methods and steps.
Serial NumberModuleProcedure
aBuilding EnvelopeUtilize the TYPE56 module with SketchUp for architectural modeling
bMeteorological DataImplement Type15 for TMY weather data processing
cSolar CollectionConfigure Type1b flat-plate collector module
dThermal StorageEstablish a Type158 vertical cylindrical tank with 5-node temperature stratification
eHeat DistributionConnect TYPE1231 radiator module to the TYPE56 for indoor heat transfer
fTemporal Control(1) Type14: Intermittent heating cycle regulation; (2) Type95: Weekend/holiday operation control
gData OutputConfigure Type65 for parameter monitoring at specified intervals
hPerformance AnalysisEmploy Type24 for heating output, energy consumption, and cumulative load calculations
Table 5. Comparison of control strategies.
Control ModeControl Principle
A (Traditional Control)When the maximum temperature of the heat storage tank is greater than Tdiff,H °C, turn off the heat collection circulation pump. When it is lower than Tdiff,L, turn on the heat collection circulation pump.
B (Traditional Control)When the maximum temperature of the hot water tank is greater than Tdiff,H °C, the heating circulation water pump is turned on; when it is lower than Tdiff,L, the heating circulation pump is turned off.
Table 6. System annual energy consumption under two control strategies.
Cumulative Energy Consumption of the Traditional Operation Strategy Throughout the Year (kWh)Optimized Operation Strategy for the Cumulative Energy Consumption Throughout the Year (kWh)
Heat collector circulation pump805813
Heating circulation pump573690
Auxiliary heat source87547024
Total system energy consumption10,1328527
Table 7. Outdoor meteorological conditions during early, middle, and late heating periods in Lhasa.
PeriodSolar Radiation (W/m2)Temperature Range (°C)Mean Temperature (°C)
Early Season600–800−2~146
Mid Season500–700−14~8−2
Late Season60–1200−5~13-
Note: The mean temperature for the late period is not provided, as short-term fluctuations and abrupt solar variations reduce its representativeness despite a narrower overall temperature range.
Table 8. Recommended hot water storage tank capacity ranges for different solar energy system types.
System FormSmall Solar Water Heating SystemShort-Term Thermal Storage Solar Heating SystemSeasonal Heat Storage Solar Heating System
Hot water tank capacity range (L/m2)40–10050–1501400–2100
Table 9. Design of continuous heating heat storage capacity under the system steady-state design method.
Typical BuildingsSolar Thermal System Heat Supply (kJ)Solar Energy Guarantee RateAverage Daily Solar Radiation (kJ/m2·d)Recommended Water Tank Volume (m3/m2)Collector Area (m2)Water Tank Capacity (m3)
Office building2,233,440100%25,0250.122322.3
Classroom Building3,449,8650.134434.4
Dormitory Building2,542,8380.125425.4
Table 10. Design of heat storage capacity for intermittent heating under the system steady-state design method.
Typical BuildingsSolar Thermal System Heat Supply (kJ)Solar Energy Guarantee RateAverage Daily Solar Radiation (kJ/m2·d)Recommended Water Tank Volume (m3/m2)Collector Area (m2)Water Tank Capacity (m3)
Office building930,600100%25,0250.1939.3
Classroom Building1,581,2280.115815.8
Dormitory Building1,165,4670.1511617.4
Table 11. Comparison of system heat storage capacity under different design methods.
Comparison of Two Design Methods Office BuildingClassroom BuildingDormitory Building
Collector area required per unit heating area (m2/m2)Traditional steady-state continuous heating0.370.270.36
Traditional steady-state intermittent heating0.160.120.16
Dynamic intermittent heating method0.120.100.15
Water tank volume required per unit collector area (m3/m2)Traditional steady-state continuous heating0.100.100.10
Traditional steady-state intermittent heating0.100.100.15
Dynamic intermittent heating method0.120.070.22
Disclaimer/Publisher’s Note: The statements, opinions and data contained in all publications are solely those of the individual author(s) and contributor(s) and not of MDPI and/or the editor(s). MDPI and/or the editor(s) disclaim responsibility for any injury to people or property resulting from any ideas, methods, instructions or products referred to in the content.