Article

A Study on the Effects of Distinct Visual Elements and Their Combinations in Window Views on Stress and Emotional States

1
School of Architecture & Art Design, Hebei University of Technology, Tianjin 300130, China
2
Urban and Rural Renewal and Architectural Heritage Protection Center of Hebei University of Technology, Tianjin 300130, China
3
Hebei Key Laboratory of Healthy Living Environment, Tianjin 300130, China
4
Policy Research Department, Tianjin Institute of Medical Science and Technology Information Center, Tianjin 300041, China
5
Tianjin Fire Science and Technology Research Institute of MEM, Tianjin 300381, China
6
College of Economics and Management, Beijing University of Technology, Beijing 100124, China
*
Author to whom correspondence should be addressed.
Buildings 2025, 15(15), 2804; https://doi.org/10.3390/buildings15152804
Submission received: 20 June 2025 / Revised: 1 August 2025 / Accepted: 4 August 2025 / Published: 7 August 2025
(This article belongs to the Section Architectural Design, Urban Science, and Real Estate)

Abstract

As people spend extended periods of time indoors, stress and negative emotions caused by work have become increasingly difficult to ignore. Observing window views is widely considered an effective method to alleviate stress and promote mental health. However, the specific visual elements within these views that contribute to stress reduction and the differential restorative benefits across varying compositions remain insufficiently understood. This study focuses on four major visual elements commonly seen through windows: sky, buildings, greenery, and roads. Using a horizontal layering approach, nine window views were created based on different proportions of these elements. Participants were exposed to these views, and their responses were evaluated through the positive and negative affect scale (PANAS), as well as electroencephalographic (EEG) data acquisition. The findings indicate that greenery exhibits the most pronounced positive effect on stress mitigation and the enhancement of positive affect, while the presence of roads is more likely to elicit negative emotional responses. Additionally, the visual richness and structural completeness of the window scenes are found to significantly impact restorative outcomes. These findings provide empirical insights for landscape and architectural design aimed at improving psychological well-being.

1. Introduction

With the rapid progression of urbanization, individuals spend the majority of their time indoors for work and daily life. Prolonged exposure to high-stress environments can inevitably lead to mental fatigue [1], manifested in symptoms such as impaired concentration, memory decline, and reduced work efficiency [2]. If left unaddressed, such fatigue may further develop into Chronic Fatigue Syndrome (CFS). Thus, identifying effective methods to alleviate fatigue and reduce stress is of paramount importance. Numerous studies have verified that interacting with outdoor environments can effectively mitigate stress and promote physical and mental health [3,4,5,6]. However, people do not always have opportunities to access outdoor environments. During the COVID-19 pandemic, many countries implemented strict public health measures, including restrictions on residents’ mobility and the isolation of high-risk groups, which significantly affected daily life and led many individuals to shift to working from home. Studies have reported that residents who experienced restricted mobility or isolation commonly faced mental health issues, including depression, anxiety, mood disorders, psychological distress, post-traumatic stress disorder, insomnia, and other adverse mental health outcomes [7]. For individuals residing indoors, windows serve as the sole medium for perceiving outdoor settings. The visual content presented through windows plays a crucial role in shaping spatial perception and the environmental experience [8]. Prevailing curtain wall designs—driven by industrialized construction paradigms—prioritize economic efficiency and standardized production to such an extent that they fundamentally conflict with window design guidelines [9] grounded in the experiential needs of building occupants. This misalignment often comes at the cost of users’ spatial experience. In response to this issue, the present study aims to identify specific visual characteristics of window views that effectively promote positive emotional states and reduce stress levels. Furthermore, we examine the restorative benefits associated with these visual elements and their combinations, thereby offering empirical evidence to inform design practice.
A “Window View” refers to the external visual environment perceived through the architectural boundary of a window. These views may include natural elements such as greenery, bodies of water, and the sky; artificial components like architectural masses and roadway infrastructure; and dynamic visual information generated through their interaction, including light and shadow variations and the movement of pedestrians and vehicles [10]. Ulrich’s seminal 1984 study found that post-operative patients with access to natural window views recovered more rapidly and required fewer analgesics compared to those viewing blank walls, marking a foundational exploration of the health implications of window views [11].
Subsequent research has affirmed that window views influence health outcomes across diverse indoor contexts. For instance, comparative studies show that views of nature improve thermal comfort, enhance positive emotions, reduce negative affect, and facilitate cognitive performance [12]. In office settings, natural views through windows have been linked to improved mood [13]. In classrooms, students exhibit a preference for window views with higher concentrations of natural elements, which enhance satisfaction, comfort, reduce stress, and support concentration [14]. In residential settings, individuals report higher psychological satisfaction when a greater portion of the external environment is visible through the window, whereas visibility below 20% may result in dissatisfaction [15]. In hospitals, brighter rooms with greener views have been associated with expedited recovery and reduced hospitalization time [16].
Most theoretical frameworks suggest that the restorative benefits of window views are primarily attributable to their natural components. Among the most cited are Stress Reduction Theory (SRT) [11] and Attention Restoration Theory (ART) [4], which posit a general human preference for natural settings and the associated cognitive and emotional recovery benefits. Empirical research supports the view that natural elements—particularly sky [17] and greenery [3,6,18]—are preferred over artificial components and that a higher proportion of natural content correlates with enhanced restorative effects [19]. Views with greenery demonstrate the strongest restorative potential, as they significantly interact with brainwave activity [20] to enhance positive affect, visual satisfaction, subjective well-being, and attention while mitigating noise-related annoyance [21] and improving cognitive efficiency [22]. Conversely, research on the restorative capacity of artificial elements remains limited. One study in high-density urban contexts found that compositional quality, surface characteristics, and maintenance of buildings influence perceptual responses to views [23]. Incorporating natural elements into artificial settings—such as rooftop gardens—has been shown to enhance restorative outcomes significantly compared to pitched or flat rooftops [24]. Urban street scenes with initially adverse effects can also be improved through increased greenery, diverse plant species, and clear traffic signage [25]. Although discrepancies exist across studies due to variations in participant demographics and experimental conditions, the overall trend affirms that natural elements are more restorative than artificial ones.
The use of psychometric scales is one of the most common research methods in current studies. Typically, large datasets are collected through questionnaires and interviews, followed by correlation analyses to explore relationships between variables. Questionnaire surveys have become a mature and widely applied approach in psychology, particularly for evaluating perceptions of the environment. The psychometric tools cover multiple dimensions, including overall physical and mental well-being, emotions, and stress. Some researchers design questionnaires tailored to their specific research objectives [10,17,26], while others employ validated questionnaires that can be directly used for assessment, such as the Self-Assessment Manikin (SAM) [27], the Self-Rating Depression Scale (SDS) [28], the Zuckerman Inventory of Personal Reactions (ZIPERS) [29], and the positive and negative affect schedule (PANAS) [30], as summarized in Table 1.
The experimental results derived from subjective assessments can be influenced by participants’ cultural backgrounds, cognitive levels, and other personal factors, which may lead to variability in outcomes. In recent years, with advancements in science and technology, various instruments have been introduced to measure physiological indicators. By combining subjective psychological perceptions with objective physiological data, the restorative benefits of window views can be evaluated more effectively. Existing studies have confirmed that certain physiological parameters are correlated with psychological characteristics, such as emotion and cognition [22,31,32,33]. However, due to the complexity of variables across different studies, further analyses and validation based on specific datasets and research contexts are necessary before these parameters can be considered reliable references; they should not be used as fixed indicators directly. Commonly used measures include surface potential signals, such as electroencephalography (EEG), electrocardiography (ECG), electromyography (EMG), and electrodermal activity (EDA), as well as internal physiological dynamics, such as salivary cortisol levels, blood pressure, heart rate, body temperature, and blood oxygen concentration, as summarized in Table 2.
Most existing studies dichotomize window views into natural and urban environments, generally confirming that natural views are more beneficial through comparative experimentation [34,35,36,37]. However, this binary classification may be reductive. Real-world views often consist of a mixture of elements that do not fall neatly into “natural” or “artificial” categories. The compositional ratio of multiple visual elements may yield varied restorative outcomes. In summary, existing research suggests that four key visual elements—sky, greenery, buildings, and roads—have significant effects on stress and emotion. However, most evaluations rely heavily on subjective assessment scales, indicating the need to integrate objective indicators for a more comprehensive and detailed analysis. Moreover, the study of visual elements in window views can be further refined. The restorative benefits of different visual elements and their combinations remain unclear and warrant deeper investigation, as the potential advantages of window views have yet to be fully explored. Accordingly, this study employs both subjective emotional assessments and objective EEG data collection to examine the restorative benefits of four visual elements and their composite effects on emotional states and stress levels. The research posits the following hypotheses: (1) The higher the proportion of natural elements in a window view, the more significant the restorative effects post-exposure; (2) Window views characterized by more visual elements produce better restoration.

2. Materials and Methods

2.1. Environmental Setting

2.1.1. Laboratory Design

Window-view representation methods can generally be divided into two categories: (1) direct observation of real window views on-site; (2) the use of digital images to simulate real environments for evaluation. While real-world experiments allow for more authentic and intuitive experiences, they often introduce excessive uncontrolled variables. For example, in this study, the window view changes with the time of day, and dynamic environmental factors, such as surrounding activity and noise interference, make the experiment less controllable. Moreover, it is often challenging to collect sufficient samples in real settings; thus, real-world experiments are more suitable for studies with simpler setups and fewer constraints, for instance, comparing subjective experiences in office environments with and without windows [12]. Although using digital images limits the capture of certain dynamic information, it offers greater control over variables while still providing a relatively realistic visual experience. A meta-analysis has confirmed a strong correlation between evaluations using digital images and those conducted in real environments [38], and digital-image-based evaluations have been validated as effective in landscape research [39]. Many studies on window views have also employed digital images for evaluation [18,19,40,41], confirming that such experiments can produce restorative benefits.
In this experiment, the use of EEG equipment alongside VR devices was found to cause operational interference, creating practical difficulties. Therefore, we opted to construct a laboratory setup where digital images are displayed on a screen for evaluation. The laboratory, with a ceiling height of 3 m, was outfitted with movable partitions to delineate a 4 m × 3 m working space, as shown in Figure 1, simulating a typical single-user workspace. The setup included a desk and chair for task execution and featured a 65-inch Seewo S65EB screen embedded within a partition to simulate various types of window views.
To minimize interference from extraneous variables, all experiments were conducted between May and August 2024 during the hours of 2:00 p.m. to 6:00 p.m. Windows and doors were isolated using partitions, and artificial lighting was employed to maintain an illumination level of approximately 950 lux, thereby eliminating the influence of natural sunlight. Temperature was controlled at approximately 24 °C using air conditioning, and humidity was maintained around 40%. Noise levels did not exceed 60 dB. Participants maintained a fixed viewing distance of 2.5 m with a horizontal viewing angle of 14°, facing the screen directly throughout the experimental exposure. These conditions ensured a stable indoor environment, thereby reducing confounding variables that might otherwise affect the experimental results.

2.1.2. Construction of Window-View Types

Given the variety of visual elements involved, the experiment first applied a horizontal stratification method to categorize them. As shown in Figure 2, the concept of horizontal stratification, introduced by Markus [42], refers to visually perceptible horizontal layers, namely, sky, landscape, and ground layers. The sky layer comprises the sky element; the landscape layer includes buildings and greenery elements; and the ground layer encompasses road elements. Different types of window views can be systematically constructed based on the spatial configuration of visual layers and the proportional composition of individual visual elements.
Field data were collected in the form of window-view images from urban areas in North China to simulate views commonly encountered in daily work environments. Field investigations revealed that it is rare for real urban window views to contain only a single visual element. Moreover, by conducting comparative analyses of combined multiple elements, it is possible to indirectly infer the restorative benefits associated with individual elements [19]. Therefore, window views incorporating two or more layers were ultimately selected as the primary subjects of this study.
Additionally, window views containing both ground and sky layers but lacking a landscape layer are seldom observed in urban contexts. Accordingly, based on the principle of horizontal stratification, the following compositional categories were established:
(1)
Window views containing both the sky layer and the landscape layer, further subdivided into (i) sky and building group; (ii) sky and greenery group; (iii) sky, building, and greenery group.
(2)
Window views containing both the ground layer and the landscape layer, further subdivided into (i) road and building group; (ii) road and greenery group; (iii) road, building, and greenery group.
(3)
Window views containing all layers simultaneously, further subdivided into (i) sky, building, and road group; (ii) sky, greenery, and road group; (iii) sky, building, greenery, and road group.
The collected images were standardised according to the aforementioned classification scheme. Using a pre-trained DeepLabV3+ model, the proportion of each visual element within the window-view images was identified. Representative images were then selected to serve as simulated stimuli for the experiment, following the criteria outlined below:
(1)
Clear demarcation among the layers must be visually observable, facilitating hierarchical segmentation.
(2)
The composition of visual elements should be relatively balanced. For instance, in window views containing only sky and building elements, the proportions of sky and building should be approximately equivalent to minimize potential bias arising from disproportionate representation. These two visual elements occupy the majority of the window view. Furthermore, when any element occupies less than 10% of the frame, it is deemed an invalid element [43].
Finally, nine representative groups of window-view images were selected. For clarity of description, the nine experimental groups were labeled I-SL1, II-SL2, III-SL, IV-GL1, V-GL2, VI-GL, VII-SGL1, VIII-SGL2, and IX-SGL, corresponding to the combinations formed through horizontal stratification, as summarized in Table 3. In this naming convention, “S” represents the sky element, “G” represents the road element, “L1” represents the building element, “L2” represents the greenery element, and “L” represents a combination of greenery and buildings. For example, the VI-GL group indicates that the window view primarily includes roads, buildings, and greenery, while the VII-SGL1 group indicates that the window view primarily includes the sky, roads, and buildings. Among these nine groups, two are relatively distinctive: The II-SL2 group features a view dominated by the natural elements of sky and greenery, whereas the IV-GL1 group is dominated by the artificial elements of buildings and roads.

2.2. Measures

Stress Reduction Theory [11] emphasizes that individuals can rapidly decrease stress levels and shift toward more positive emotional states following exposure to restorative environments. Accordingly, this study assesses the restorative potential of window views by examining changes in both stress levels and emotional states. By integrating subjective evaluations with objective physiological indicators, a comprehensive assessment of individual stress responses can be achieved.

2.2.1. Subjective Perception

Emotion constitutes a central topic in psychological research and is generally classified into two domains: positive affect and negative affect. Contemporary medical studies have demonstrated that emotional fluctuations can directly influence the body’s physiological regulation systems, including the endocrine system, neural transmission, and immune response. As such, emotional changes are recognized as a critical factor affecting individual stress levels, exerting significant influence not only on psychological adaptation but also on broader physiological functioning.
Positive affect has been shown to restore cognitive performance and behavioral capability. Prior research has highlighted the important role of positive emotions in disease prevention and recovery, noting their ability to attenuate subjective stress perception, thereby enhancing overall health outcomes and improving quality of life [44]. In contrast, negative affect can disrupt normal functioning across multiple physiological and psychological domains. It may impair biological processes, destabilize immune function, and increase the risk of psychosomatic disorders and mental health conditions, leading to a cascade of adverse consequences [45].
To assess emotional responses in this study, the positive and negative affect scale (PANAS) was selected. Developed by Watson and colleagues based on the two-dimensional structure of emotion, the PANAS is one of the most widely used tools in affective research [30]. It is concise, user-friendly, and has demonstrated strong reliability and validity across diverse populations. The instrument comprises 20 items, equally divided into two subscales measuring positive and negative affect. Each subscale consists of ten adjectives that describe corresponding emotional states, and responses are rated using a five-point Likert scale.

2.2.2. Electroencephalographic (EEG) Data

Electroencephalography (EEG) refers to the technique of recording electrical signals generated by populations of neurons in the brain, captured through electrodes placed on the scalp. As one of the earliest neuroimaging modalities, EEG holds a critical position in neuroscience due to its exceptional temporal resolution. It effectively addresses the temporal limitations inherent in other imaging techniques, such as positron emission tomography (PET) and functional magnetic resonance imaging (fMRI), and is now widely employed for monitoring and analyzing dynamic brain activity [46].
The endogenous electrical activity generated by the brain, commonly known as spontaneous electroencephalographic (EEG) activity, spans a broad frequency spectrum and is characterized by waveform patterns associated with specific frequency bands. These frequency bands are conventionally categorized as Delta (<4 Hz), Theta (4–8 Hz), alpha (8–13 Hz), beta (13–30 Hz), and Gamma (>30 Hz). Each band exhibits distinct spatial distributions across the scalp and is associated with specific neurobiological functions [47].
This study included the following EEG indicators: Theta, alpha, beta, and Gamma waves, as well as derived indices including alpha/beta, beta/Gamma, Theta/beta, and frontal alpha asymmetry. Theta activity is typically linked to anxiety and depressive states; increased frontal Theta activity under stress is associated with impaired prefrontal executive function and reduced decision-making capacity. Alpha activity reflects psychological relaxation and tends to increase significantly during eyes-closed or meditative states. Moderate elevations in beta activity indicate attentional engagement, whereas excessive beta is often associated with anxiety and tension. Gamma activity is inversely associated with cognitive decline, although abnormally high Gamma may be indicative of psychiatric pathology. The beta/Gamma ratio tends to rise during task-related cognitive engagement, with higher values indicating greater attentional focus. The alpha/beta index serves as a proxy for anxiety proneness, where higher values suggest a more relaxed state. An elevated Theta/beta ratio is indicative of diminished cognitive performance. Frontal alpha asymmetry—the power difference between the right and left prefrontal regions—has been extensively studied in affective neuroscience and is considered a neurophysiological marker in interventions for depression and emotional disorders; larger asymmetry values are generally interpreted as reflecting better mental health [48].
The EEG system utilized in this study was the NeuroHub EEG system, developed by Neuracle Technology (Shanghai, China). The system comprises a multimodal data terminal, a 64-channel wet electrode EEG cap, a multimodal synchronization unit, a central synchronization controller, and the JellyFishV2.03 data acquisition and analysis software. The EEG cap follows the international 10–20 electrode placement system, and for this experiment, 16 electrode sites were selected to record signals from the frontal, parietal, temporal, and occipital lobes.

2.3. Participants

To ensure adequate statistical power for subsequent analyses, the minimum required sample size was first calculated using G*Power_3.1.9.7 [49]. A one-way analysis of variance (ANOVA: fixed effects, special, main effects and interactions) was selected for the power analysis, with parameters set as follows: effect size f = 0.3, α error probability = 0.05, statistical power (1 − β error probability) = 0.8, numerator degrees of freedom = 4, and number of groups = 9. The analysis indicates that a minimum of 138 observations was required, with at least 15 participants per experimental condition across the nine window-view groups.
Accordingly, participants were recruited from enrolled university students aged 18 to 28. All participants were right-handed, free from color vision deficiencies, and in good physical health, with no history of physiological, psychological, or neurological disorders. Participants were also instructed to abstain from consuming any substances that could affect the central nervous system, such as alcohol or caffeine, on the day of the EEG experiment.
All participants signed an informed consent form before the start of the experiment. The study was conducted in accordance with the Declaration of Helsinki, and the protocol was approved by the Ethics Committee of Hebei University of Technology (HEBUThMEC2024031).
A total of 61 participants were initially recruited. The nine experimental window-view conditions were categorized into three broader types according to horizontal stratification principles. Each participant was assigned to experience three scenes within one stratification category (for example, Participant 1 experienced the three window views I-SL1, II-SL2, and III-SL, which include both the sky and landscape layers), in order to examine intra-type restorative differences. To mitigate potential order effects, the sequence of scene exposure was randomized for each participant. Data from one participant were excluded due to significant signal fluctuation caused by environmental or technical instability during EEG acquisition, resulting in a final sample of 60 participants and 180 valid experimental sessions. Each of the nine scene conditions was thus experienced exactly 20 times.

2.4. Procedure

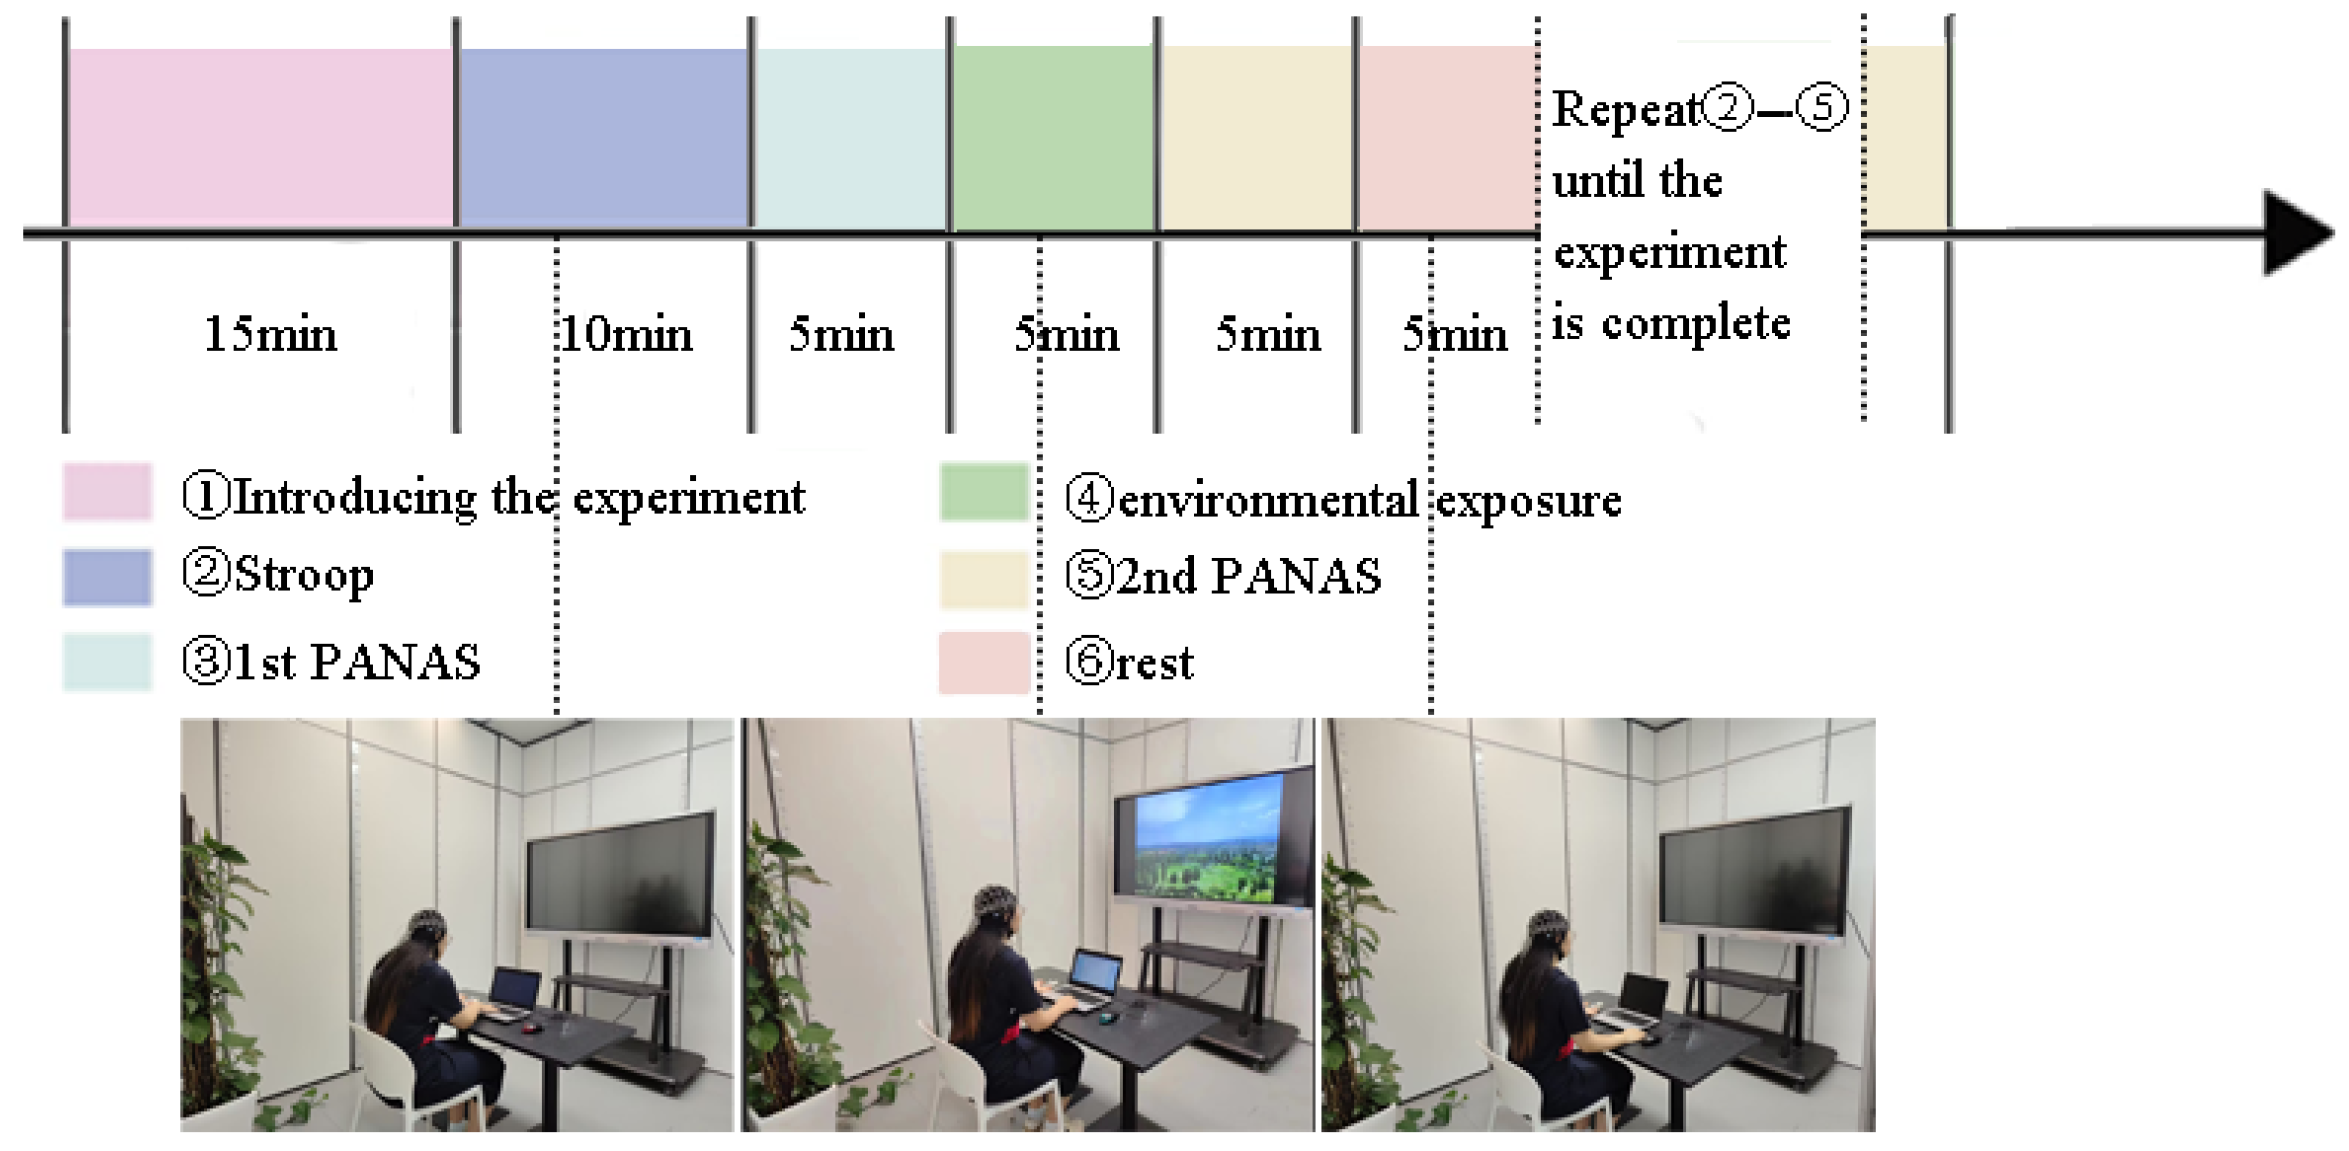
A pretest–posttest design was employed in this experiment, with each participant undergoing evaluation both before and after exposure to the experimental condition. Restorative effects were inferred by comparing outcome measures collected at these two time points. The experimental procedure was divided into three sequential phases: pre-exposure preparation, the environmental exposure phase, and post-exposure assessment. A schematic representation of the protocol is provided in the accompanying Figure 3.
(1)
Pre-Experiment Preparation
Before the experiment began, the researchers introduced the participants to the experimental procedure and relevant precautions. Participants were also briefed on the cognitive testing task and given time to practice. This study employed the classic psychological experiment—the Stroop Test—developed by American psychologist John Ridley Stroop [50]. During the task, a stimulus word appeared in the center of the screen (e.g., the word “blue” in red ink), accompanied by two white-font color names presented on either side. Participants were instructed to identify the color in which the word was printed, not the semantic meaning of the word. The program for this section was designed using PsychoPy-2024.1.4 software and adapted from an open-source Stroop model. After signing an informed consent form, participants were escorted to the testing area and fitted with the EEG cap. Once the software confirmed acceptable impedance levels across all channels and stable signal quality, the experiment formally commenced. Participants first completed a 10 min Stroop task to induce mental fatigue and elevate attentional load. Following this cognitive stressor, they completed the positive and negative affect scale (PANAS) for the first time, providing a baseline measure of emotional state prior to recovery.
(2)
Environmental Exposure Phase
The core of the experiment—the environmental exposure phase—then began. Participants were instructed to rest for five minutes while viewing a simulated window scene presented on the front-facing screen. The five-minute duration was selected to ensure adequate exposure time for observable restorative effects while also avoiding participant disengagement or fatigue [51]. This duration also mirrors typical rest periods following work or study in real-life contexts.
(3)
Post-Exposure Phase
After completing the environmental exposure, participants filled out the PANAS a second time, marking the completion of one full-scene experience. Following a five-minute break, participants were required to perform the Stroop test again and repeat the subsequent experimental steps until all three scenarios within the same stratification level had been experienced. The experiment concluded once all sessions were completed.

2.5. Statistical Analysis

EEG data preprocessing and analysis were conducted using MATLAB R2021a and the EEGLAB toolbox developed for that platform [52]. After importing the raw EEG signals and electrode location files, non-informative electrodes were excluded. The data were then subjected to bandpass filtering to remove high- and low-frequency noise. A high-pass filter was set at 1 Hz and a low-pass filter at 30 Hz, retaining data within the 1–30 Hz frequency range. To further eliminate power-line interference, a notch filter was applied between 48 Hz and 52 Hz. Subsequently, channel data were visually inspected. Channels with abnormal data were interpolated using the spherical spline algorithm, while abnormal time segments were removed directly. The data were then re-referenced using the reference electrode standardization technique (REST) proposed by Professor Yao Dezhong and his team [53], which effectively captures cortical surface activity. After re-referencing, the EEG data were segmented to extract the final minute of the fatigue-induction task and the final minute of the environmental exposure phase. These periods theoretically represent the moments of peak fatigue and optimal recovery, respectively, and were selected for further analysis. Independent Component Analysis (ICA) was performed, and components classified as typical artifacts (e.g., eye movements, ECG, and EMG) with >90% probability, as identified by ICLabel, were removed. This process yielded the EEG data for evaluating restorative differences across scenarios. To eliminate inter-individual differences, relative power was adopted as a feature metric, calculated as the ratio of the power within the target frequency band to the total power across the entire frequency range. For instance, alpha wave power was obtained by averaging the spectral estimates of all frequency points in the 8–13 Hz range, whereas relative alpha wave power was defined as the ratio of alpha wave power to the total power of the EEG signal.
Statistical analysis was performed using IBM SPSS Statistics 26. Both within-group and between-group comparisons were conducted. As the PANAS scores represent ordinal discrete data, non-parametric tests were applied. Between-group differences were analyzed using the Kruskal–Wallis test, followed by Mann-Whitney U tests for post hoc pairwise comparisons when significant differences were detected. The Benjamini–Hochberg false discovery rate (FDR) correction was applied to control for multiple comparisons, with a significance threshold set at q = 0.05, to determine statistically significant differences between groups. Within-group analyses were conducted using the Wilcoxon signed-rank test, with FDR correction (q < 0.05) applied to assess differences between pre- and post-exposure values. For EEG and related data, between-group analyses were conducted using one-way ANOVA. Post-hoc pairwise comparisons for significant results were performed using the Tukey–Kramer multiple comparisons tests, based on adjusted p-values (q < 0.05). Within-group analyses were conducted using paired t-tests, with FDR correction (q < 0.05) applied to evaluate differences before and after environmental exposure. All results were visualized using Origin 2022, with box plots used to display the distribution of key indicators across experimental conditions.

3. Results

3.1. Emotions

The PANAS scale was utilized to evaluate changes in emotional states before and after exposure to different window-view conditions. To evaluate the reliability of the PANAS across both pre-exposure and post-exposure assessments, Cronbach’s alpha coefficients were calculated. In all experimental groups, both the pretest and posttest PANAS scores yielded α coefficients exceeding 0.7, indicating that the scale demonstrated high internal consistency. Therefore, PANAS was applicable to this study.
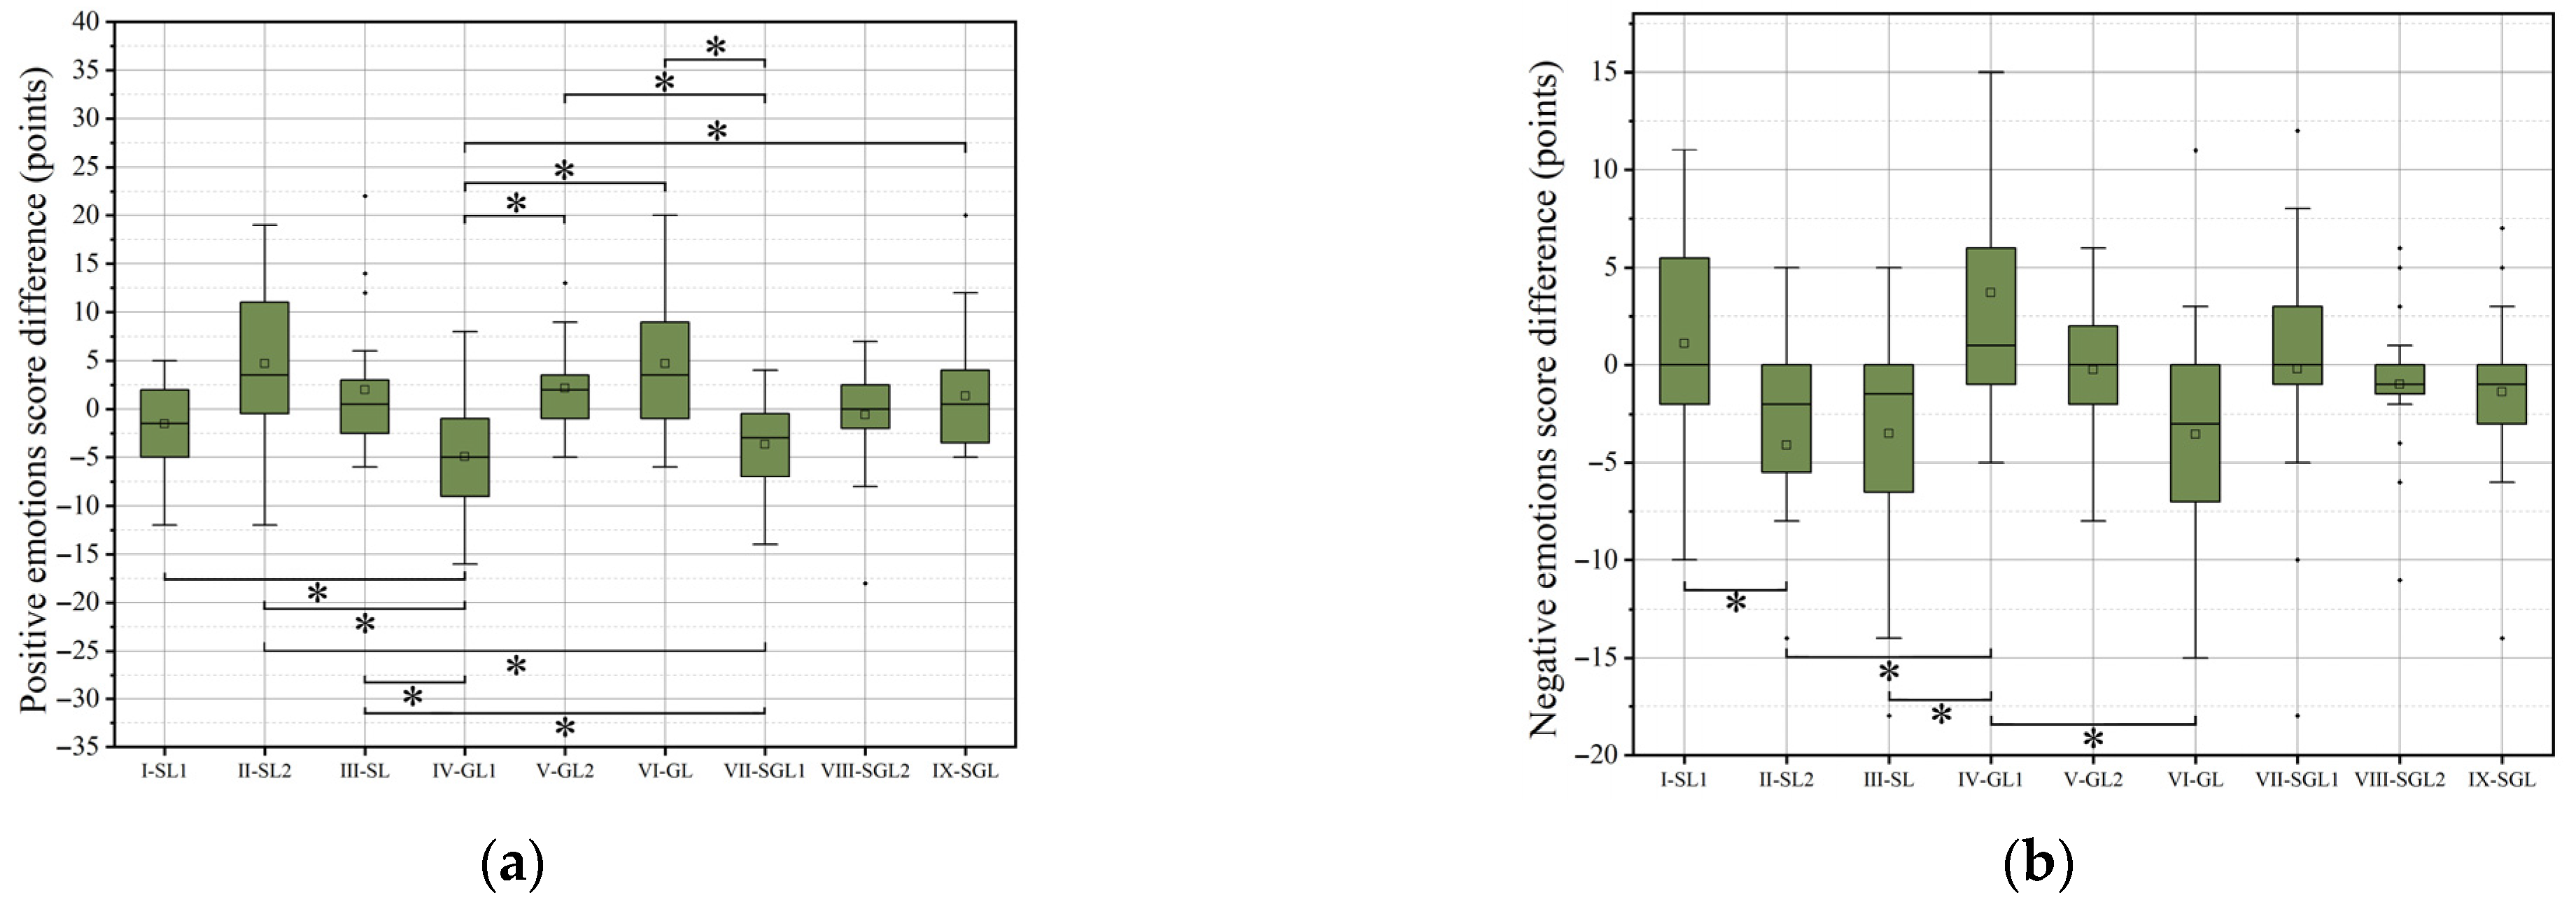
The Kruskal–Wallis test reveals significant effects of the nine window-view scenarios on positive affect (H(8) = 37.944, p < 0.001) and negative affect (H(8) = 25.800, p = 0.001). Pairwise comparisons were further conducted using the Mann–Whitney U test for both positive and negative affect, with false discovery rate (FDR) correction applied using the Benjamini–Hochberg (BH) procedure (q < 0.05), as shown in Figure 4.
For positive affect, significant differences were observed between the following pairs of groups: I-SL1 and VI-GL (q = 0.030), II-SL2 and IV-GL1 (q = 0.007), II-SL2 and VII-SGL1 (q = 0.012), III-SL and IV-GL1 (q = 0.014), III-SL and VII-SGL1 (q = 0.049), IV-GL1 and V-GL2 (q = 0.006), IV-GL1 and VI-GL (q = 0.006), IV-GL1 and IX-SGL (q = 0.022), V-GL2 and VII-SGL1 (q = 0.012), and VI-GL and VII-SGL1 (q = 0.006). For negative affect, significant differences were found between I-SL1 and II-SL2 (q = 0.046), II-SL2 and IV-GL1 (q = 0.011), III-SL and IV-GL1 (q = 0.020), and IV-GL1 and VI-GL (q = 0.013).
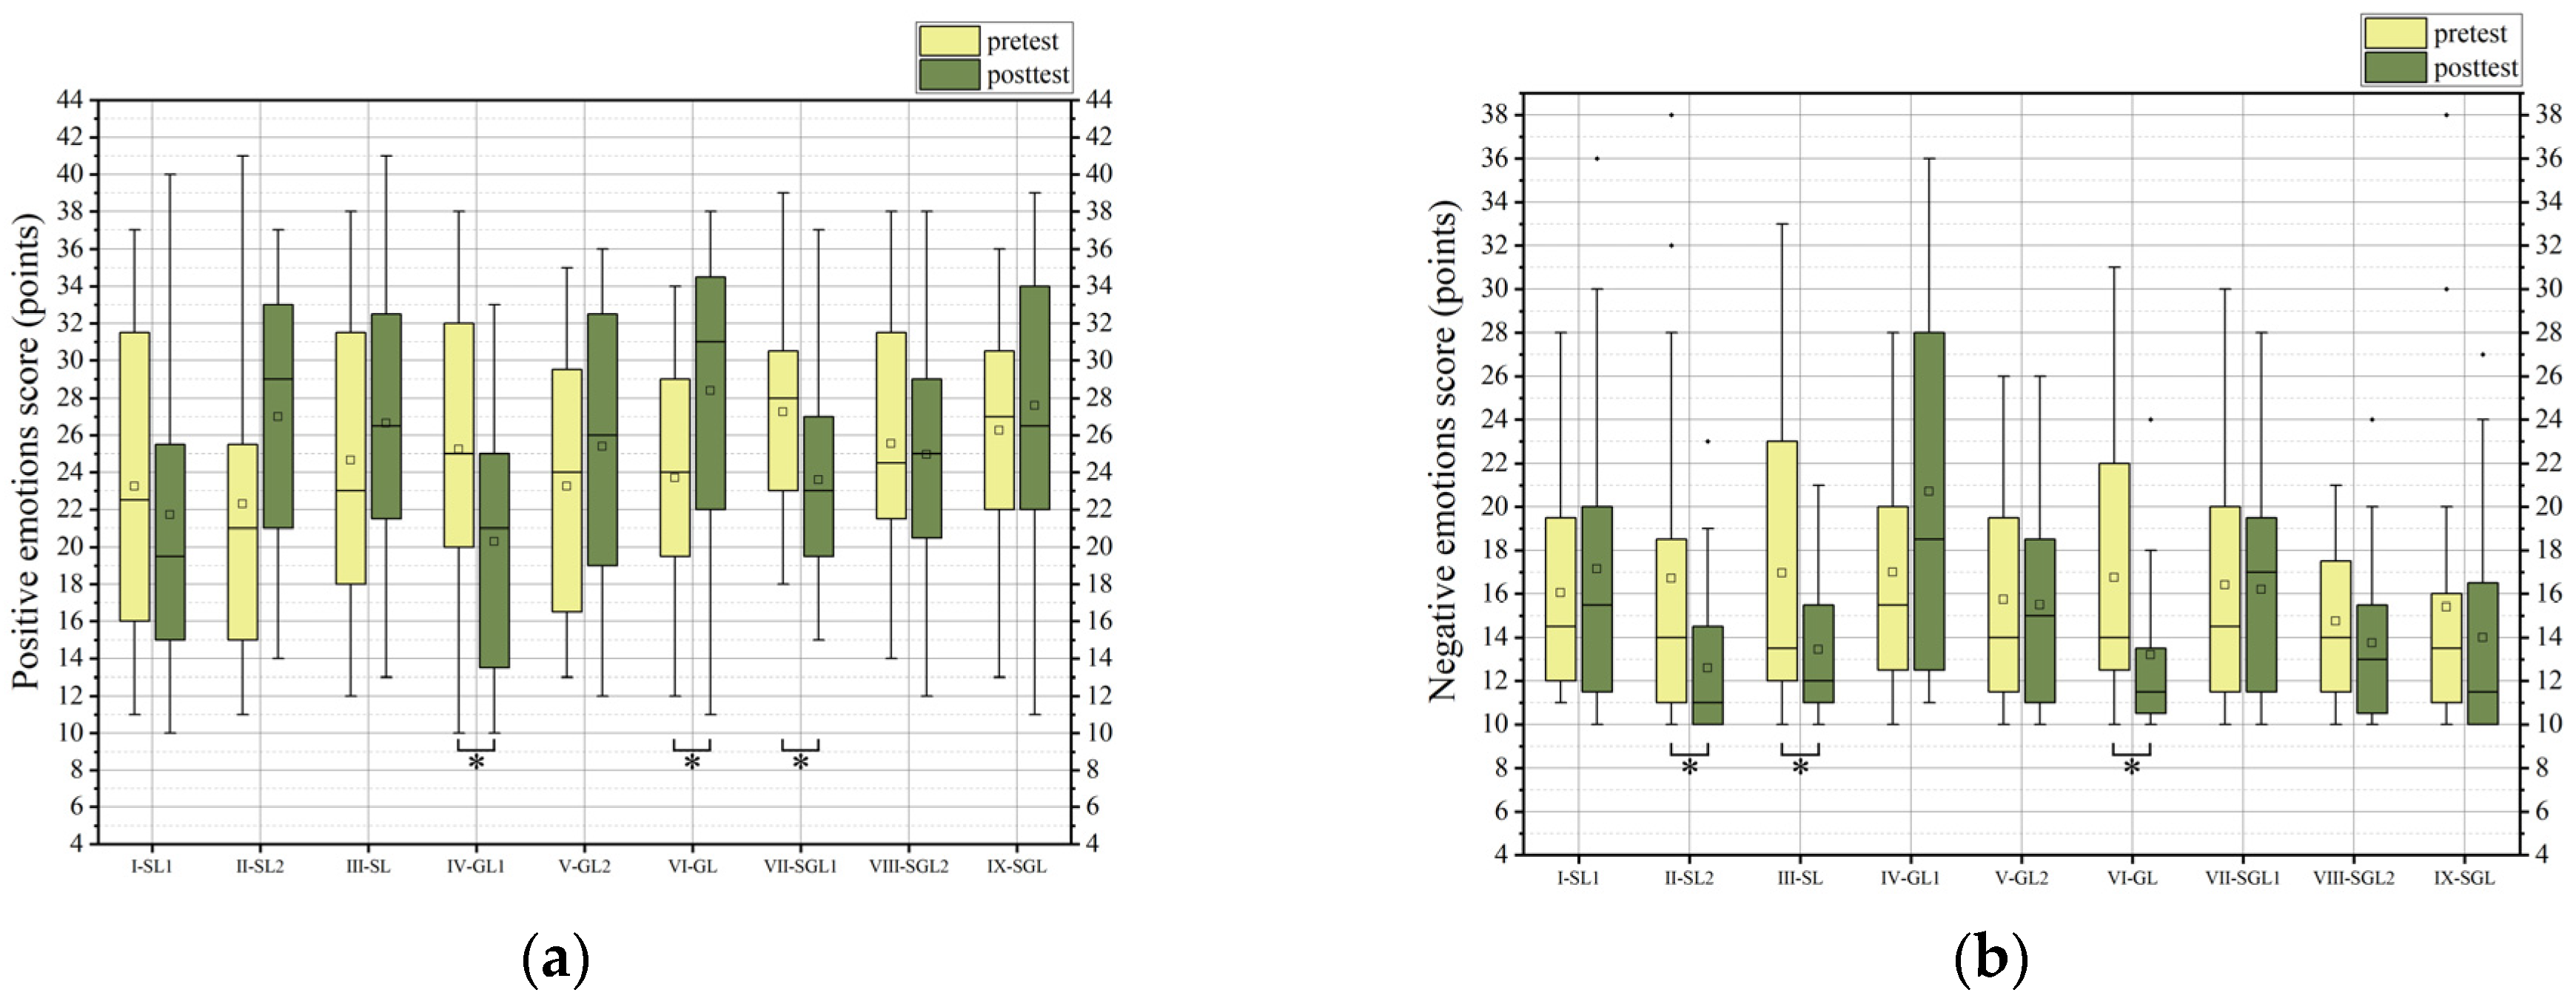
Additionally, Wilcoxon signed-rank tests were conducted on pre- and post-exposure positive and negative affect scores for each of the nine scenarios, with FDR correction using the BH procedure (q < 0.05), as shown in Figure 5. Significant differences in positive affect scores between pre- and post-exposure were observed for IV-GL1 (q = 0.028), VI-GL (q = 0.045), and VII-SGL1 (q = 0.028). Significant differences in negative affect scores between pre- and post-exposure were observed for II-SL2 (q = 0.028), III-SL (q = 0.048), and VI-GL (q = 0.036).

3.2. EEG Data

To control for inter-individual variability, this study employed relative power to quantify EEG signal strength before and after environmental exposure. Mirroring the analysis of subjective emotional responses, changes in relative EEG power between the pre- and post-exposure phases were used as physiological indicators of restorative effect.
One-way analysis of variance (ANOVA) reveals that the relative power of Theta waves (F = 2.922, p = 0.004) and alpha waves (F = 4.061, p < 0.001) exhibited statistically significant differences across groups, whereas beta waves (F = 1.129, p = 0.346) and Gamma waves (F = 0.822, p = 0.584) did not reach significance. Detailed data can be found in Appendix A. These findings indicate that the Theta and alpha bands demonstrated meaningful variation in pre- to post-exposure changes among the different window-view conditions. As shown in Figure 6, post hoc pairwise comparisons of Theta power revealed significant differences in the change scores between group II-SL2 and VI-GL (q = 0.050), II-SL2 and VII-SGL1 (q = 0.009), and II-SL2 and IX-SGL (q = 0.025). Similarly, for alpha power, significant differences were found between I-SL1 and VII-SGL1 (q = 0.050) and between I-SL1 and IX-SGL (q = 0.050), as well as between II-SL2 and VII-SGL1 (q = 0.004). Additional differences were observed between II-SL2 and VIII-SGL2 (q = 0.010) and between II-SL2 and IX-SGL (q = 0.005), indicating that changes in alpha activity also varied substantially depending on the specific visual composition of the window scenes.
Among all EEG and EEG-related indicators, paired t-tests were conducted on seven measures (excluding frontal alpha asymmetry), followed by false discovery rate (FDR) correction using the Benjamini–Hochberg (BH) procedure (q < 0.05). The results show that only the II-SL2 group exhibited a significant difference in Gamma wave power between pre- and post-exposure (q < 0.001), as shown in Figure 7. Detailed data can be found in Appendix A. From the data and figures, it can be observed that Theta wave power decreased across all groups after environmental exposure, with the II-SL2 group showing the most pronounced reduction. For alpha waves, the II-SL2 group again demonstrated the greatest decrease in power, whereas the VII-SGL1 group showed the largest increase. In terms of beta waves, participants in the IV-GL1, VI-GL, and IX-SGL groups exhibited an upward trend in beta wave power after exposure, while the remaining six groups displayed a downward trend, with the IV-GL1 group showing the most prominent increase. For Gamma waves, participants in the II-SL2, III-SL, IV-GL1, VI-GL, and IX-SGL groups demonstrated an increase in Gamma power post-exposure, while the other groups showed a decrease. Among these, the IV-GL1 group had the largest increase, and the V-GL2 group had the largest decrease.

3.3. EEG-Derived Composite Indicators

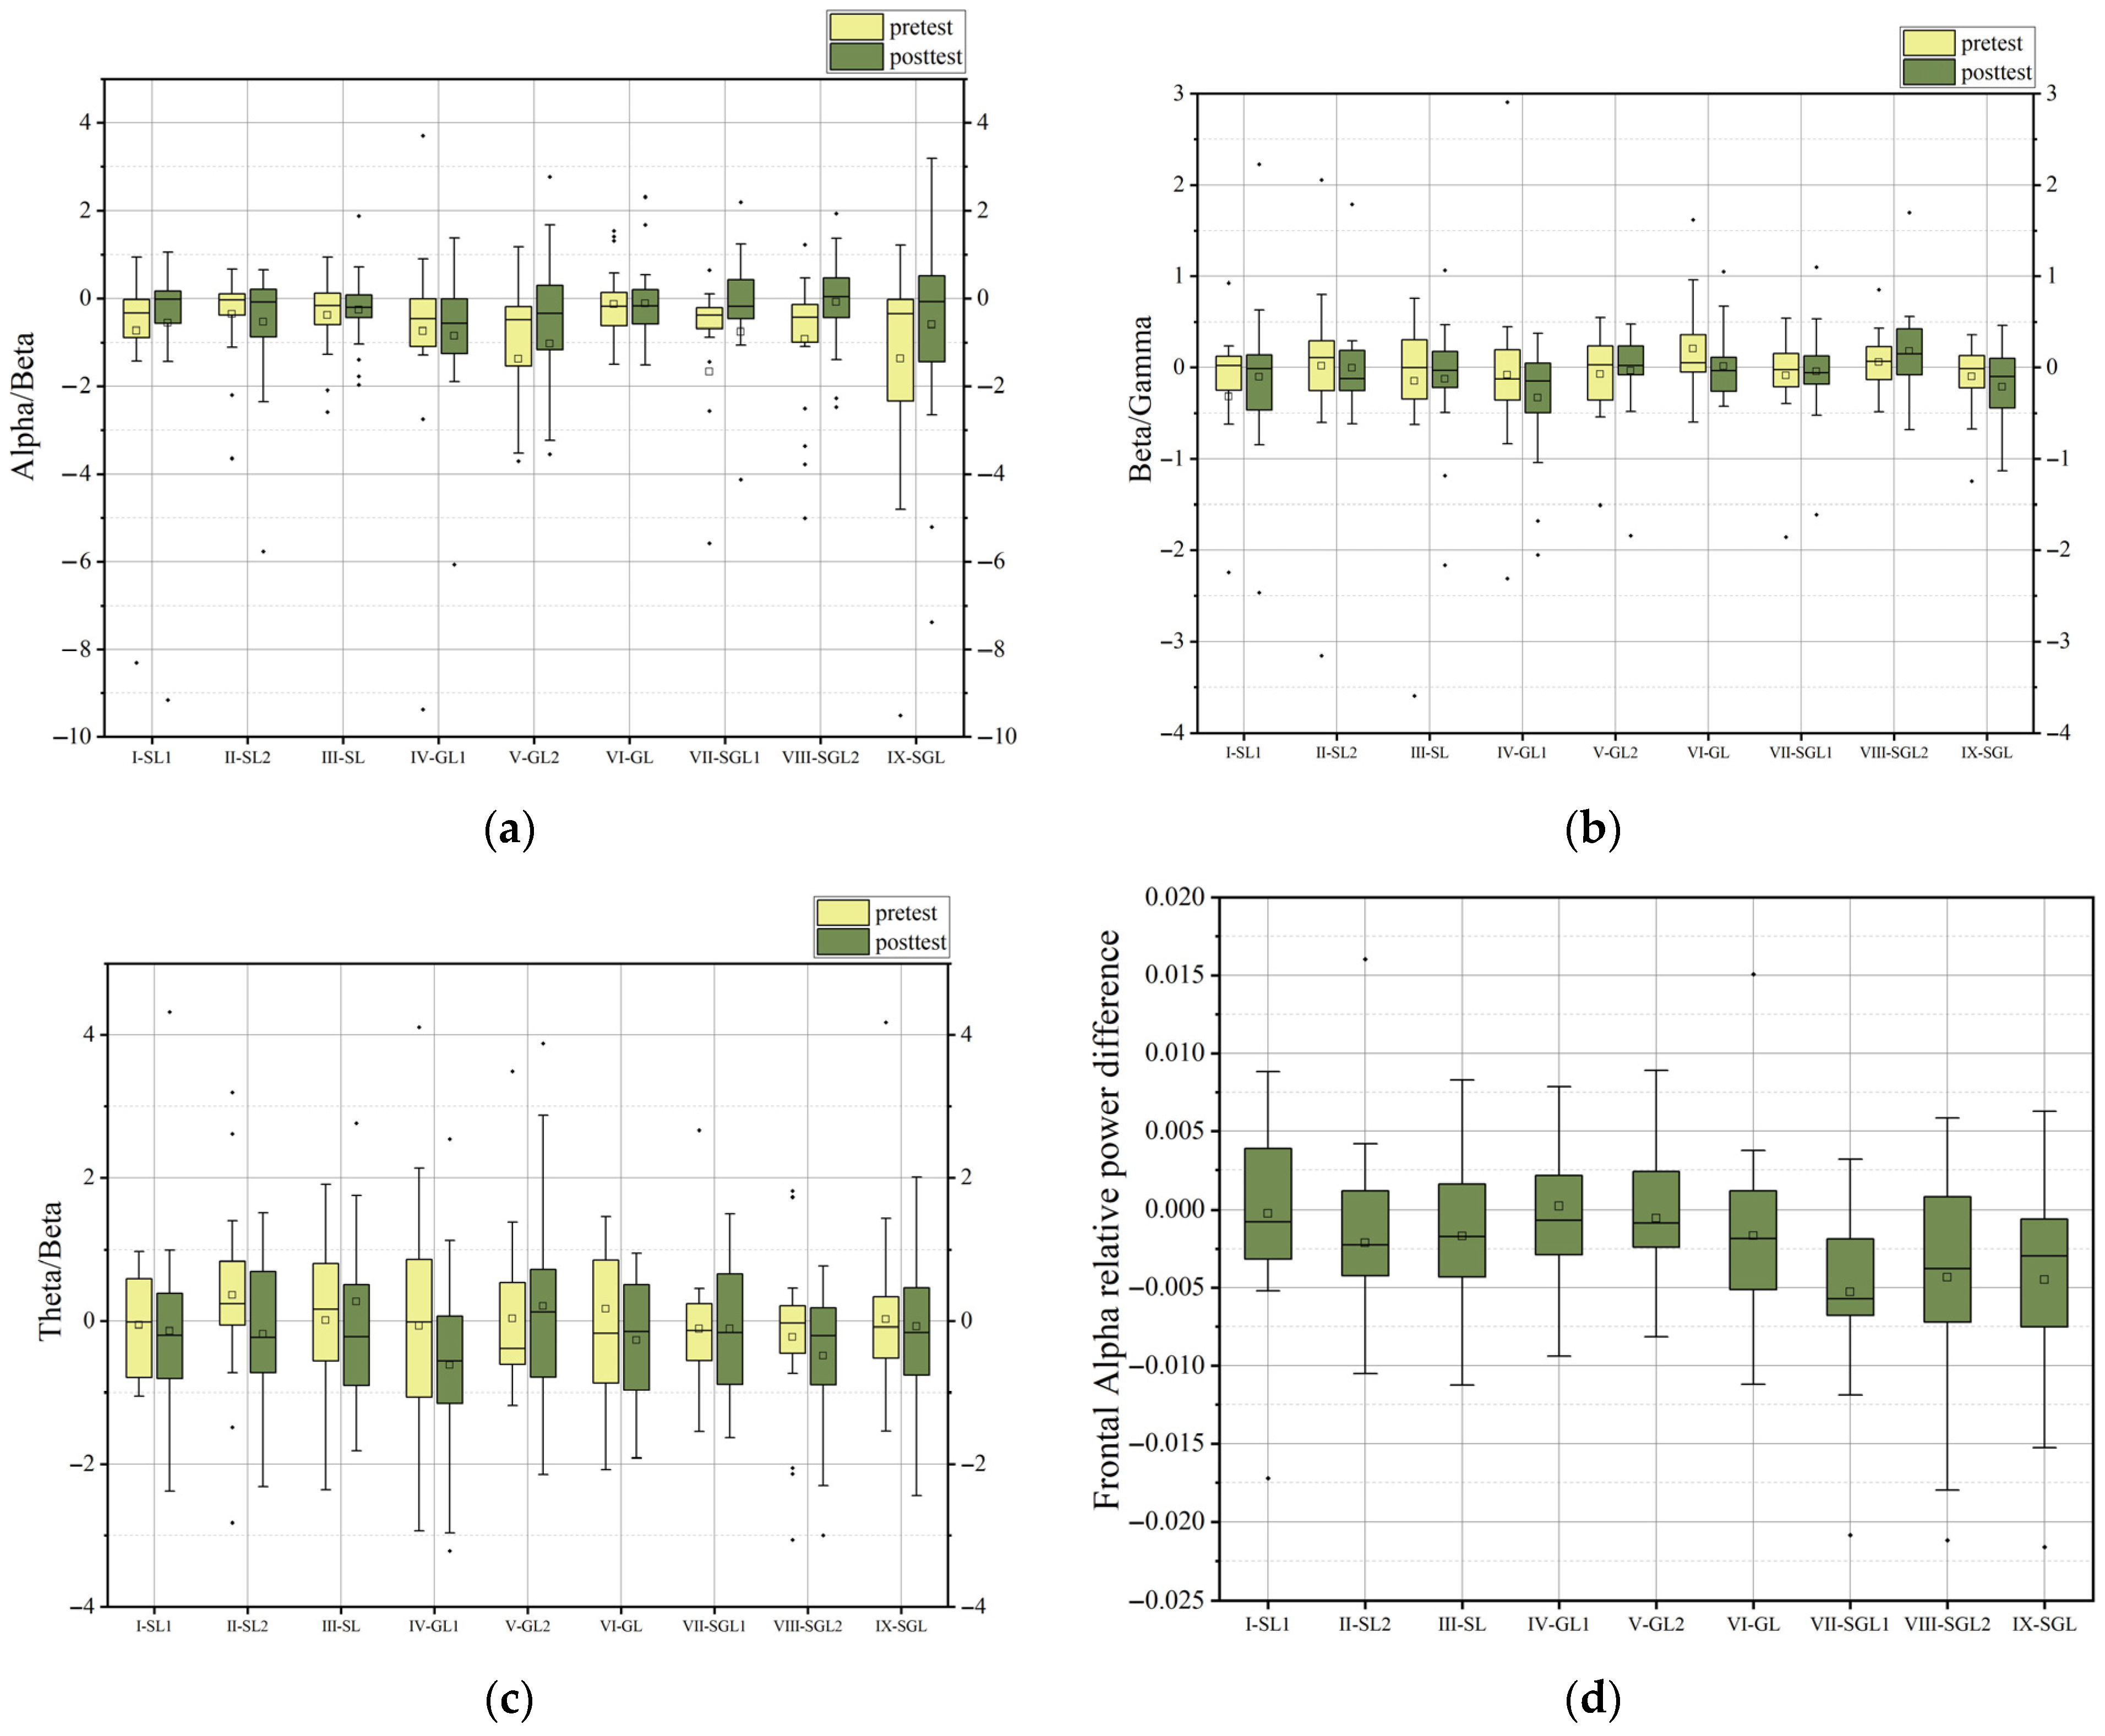
As shown in Figure 8, one-way analysis of variance (ANOVA) shows that the alpha/beta ratio demonstrated statistically significant differences across groups (F = 2.389, p = 0.018), indicating that this index varied meaningfully between experimental conditions. Detailed data can be found in Appendix A. However, post hoc pairwise comparisons reveal no statistically significant differences between any two specific groups. In contrast, the beta/Gamma ratio (F = 0.636, p = 0.747) and the Theta/beta ratio (F = 0.802, p = 0.601) did not reach significance, suggesting no meaningful between-group differences in these indices.
Paired t-tests were conducted for the alpha/beta, beta/Gamma, and Theta/beta ratios, followed by false discovery rate (FDR) correction using the Benjamini–Hochberg (BH) procedure (q < 0.05). Detailed data can be found in Appendix A. No significant pre- to post-exposure differences were observed across any groups, indicating that the beta/Gamma and Theta/beta ratios were not significantly associated with the outcomes of this study.
Frontal alpha asymmetry, an index increasingly used in neurofeedback interventions for mood disorders such as depression, was also analyzed. This metric is typically calculated as the difference in alpha power between the right and left prefrontal cortex (right minus left), with larger values interpreted as indicative of greater mental well-being or therapeutic response. EEG asymmetry values were computed using three symmetrical electrode pairs: AF3–AF4, F3–F4, and F7–F8. Among them, only the F7–F8 pair demonstrated statistically significant group differences (F = 2.668, p = 0.009) according to ANOVA results. As shown in Table 4, no significant between-group differences were observed in subsequent post hoc comparisons.
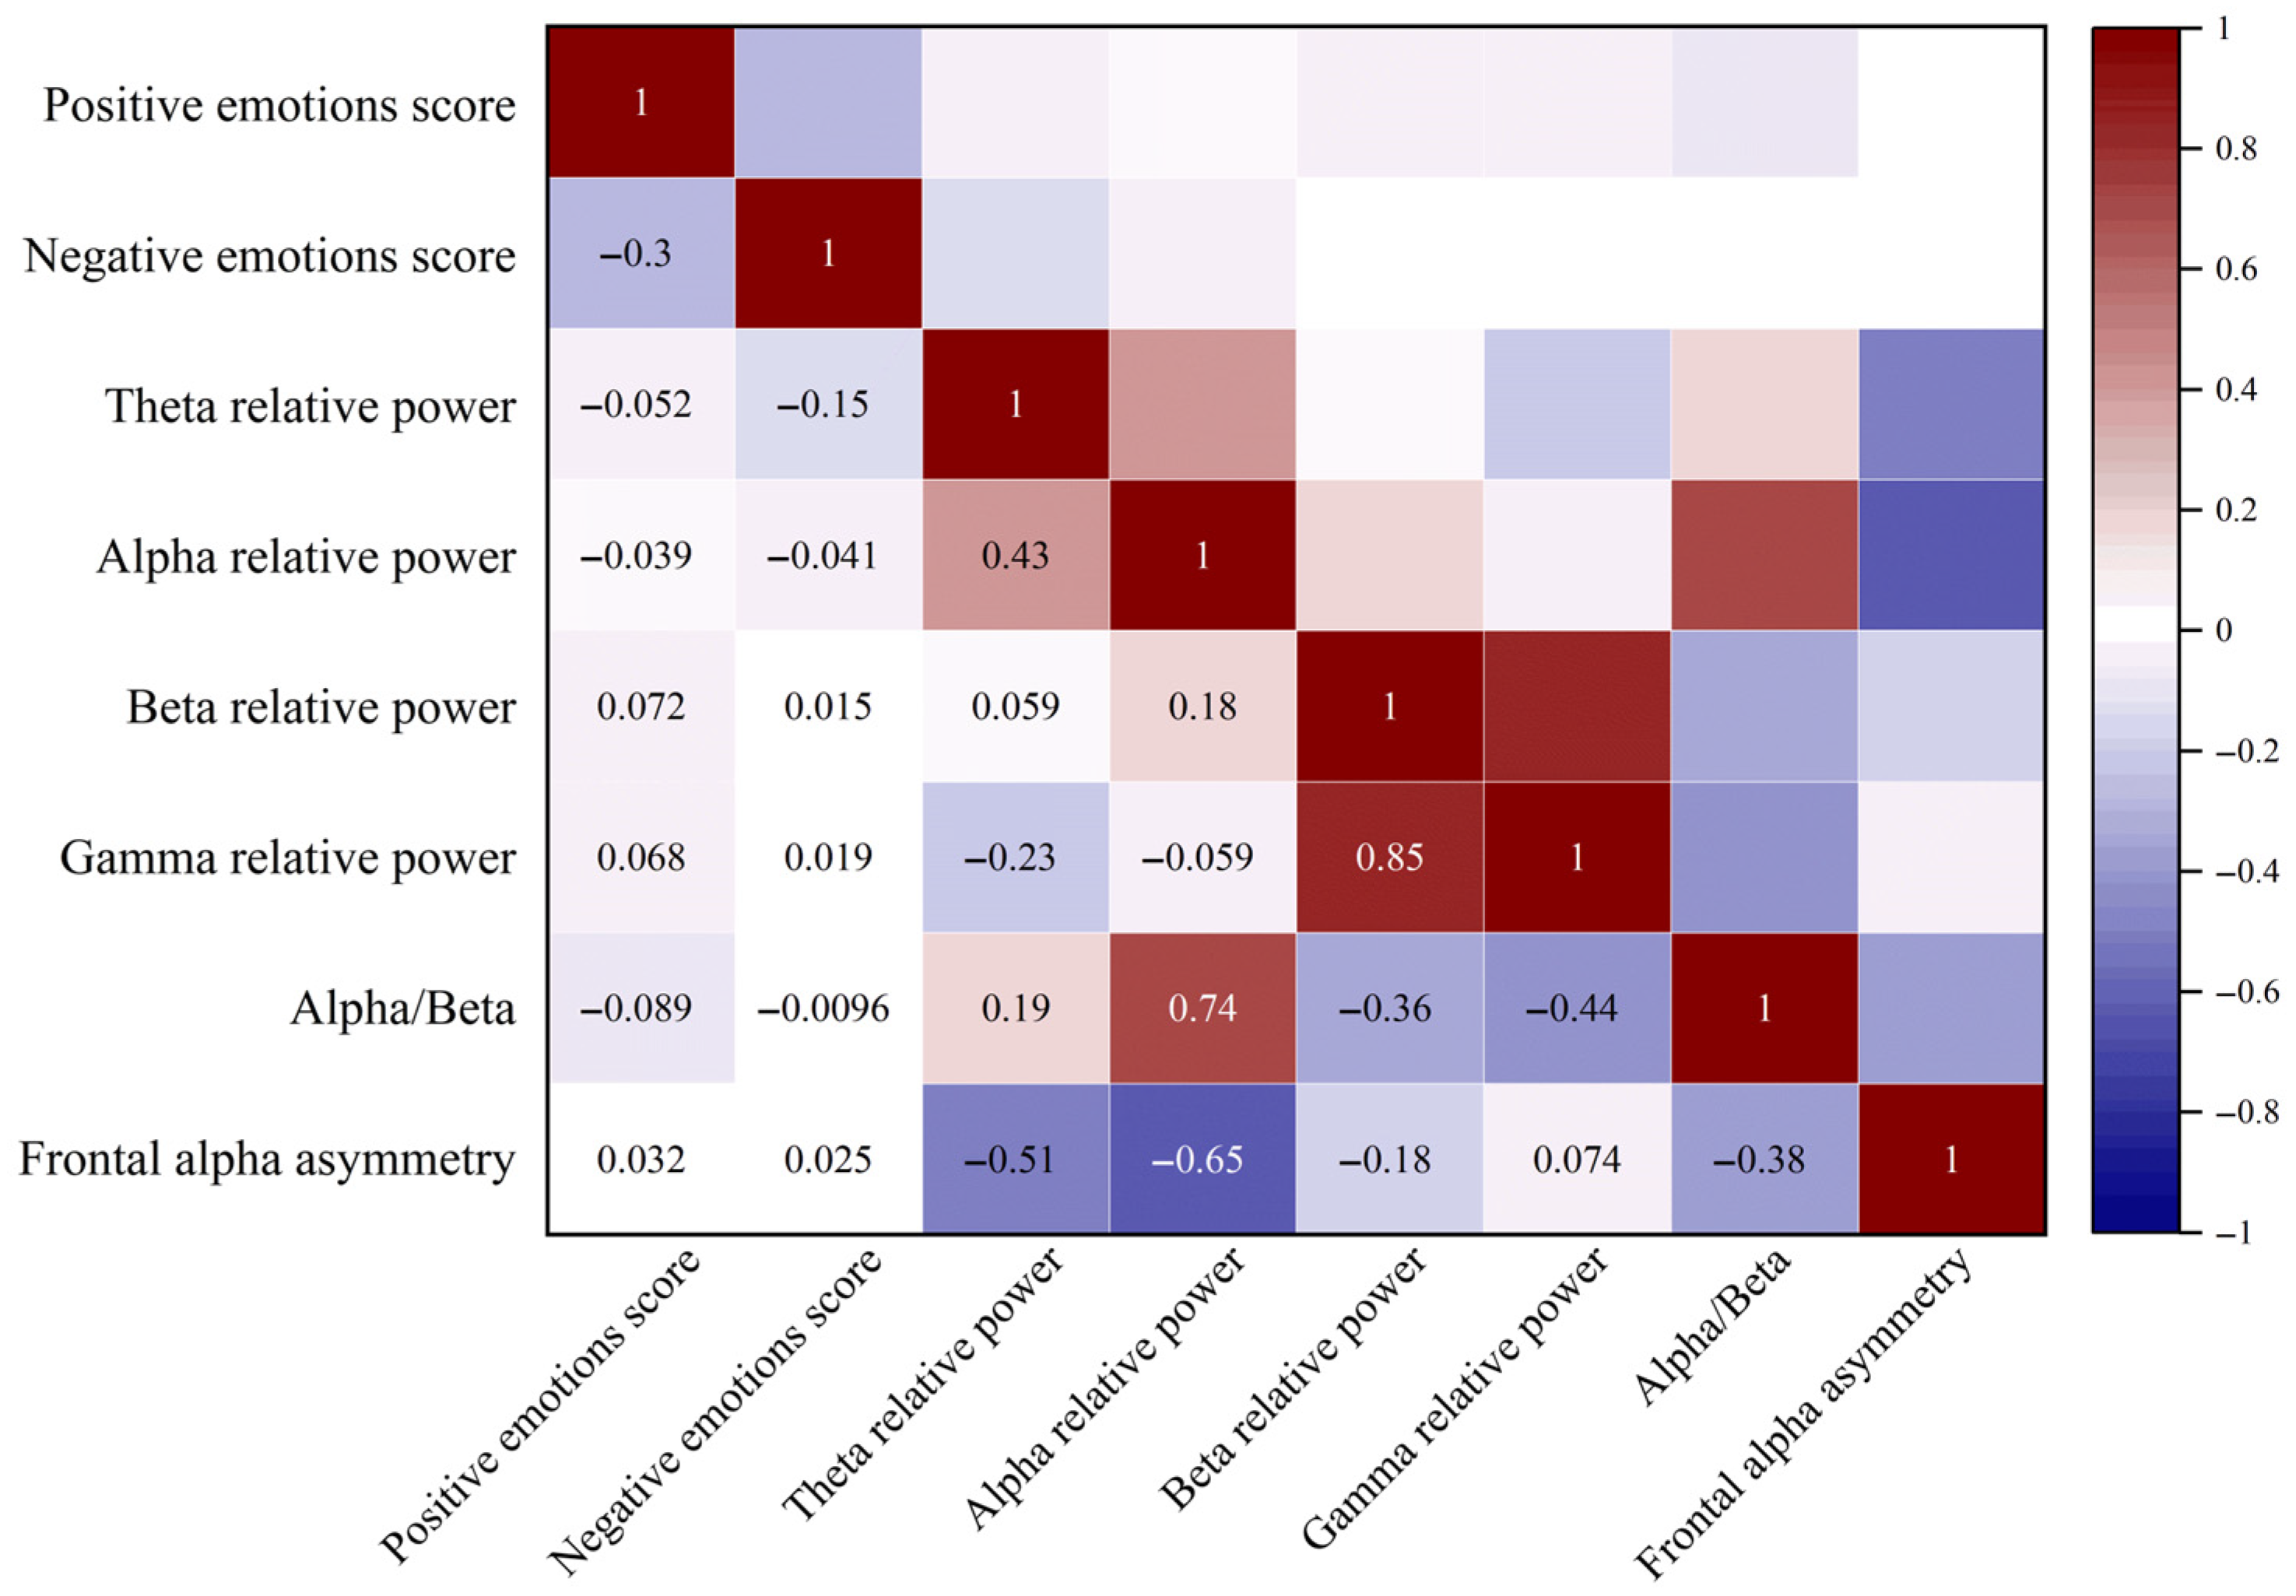
Finally, to explore the relationship between subjective emotional changes and objective EEG-derived physiological indicators, a Pearson correlation analysis was conducted. The Pearson correlation coefficient (r), ranging from −1 to 1, measures the strength and direction of linear association between two variables. Correlations with |r| < 0.3 are considered weak or negligible, those with 0.3 ≤ |r| < 0.8 are regarded as moderate, and |r| ≥ 0.8 indicates a strong linear relationship [54].
As shown in Figure 9, excluding beta/Gamma and Theta/beta—both determined to be irrelevant to the present study—the analysis revealed several noteworthy associations. A strong positive correlation was found between beta and Gamma power (r = 0.849, p < 0.001). Moderate positive correlations were observed between Theta and alpha (r = 0.429, p < 0.001) and between alpha and alpha/beta (r = 0.738, p < 0.001). In contrast, a set of negative correlations emerged: Theta and frontal alpha asymmetry (r = −0.506, p < 0.001), alpha and frontal alpha asymmetry (r = −0.645, p < 0.001), beta and alpha/beta (r = −0.355, p < 0.001), Gamma and alpha/beta (r = −0.439, p < 0.001), and alpha/beta and frontal alpha asymmetry (r = −0.381, p < 0.001). These findings offer insight into the interplay between neural activity and affective responses under varying environmental conditions.

4. Discussion

4.1. Restorative Effects of Individual Visual Elements in Window Views

This study examined ten indicators in total, among which six demonstrated significant differences between pre- and post-exposure conditions across experimental groups. In terms of positive affect, participants exposed to scenes from groups IV-GL1 and VII-SGL1 showed a significant decline in positive emotion scores. Groups I-SL1 and VIII-SGL2 also exhibited slight reductions. In contrast, other groups showed increases in positive affect, with particularly notable improvements observed in groups VI-GL. These results suggest that window views lacking greenery or with minimal natural elements are less effective in promoting positive emotions. Interestingly, while group II-SL2 featured purely natural elements, group VI-GL also contained building and road elements yet produced a comparable increase in positive affect. This pattern may be attributable to subjective differences in landscape preference, as suggested by the post hoc analysis. Negative affect scores, which are inversely related to perceived restoration, yielded results consistent with those of positive affect. Following exposure to scenes from group I-SL1 and IV-GL1, participants reported a significant increase in negative affect. In contrast, all other groups did not elicit increases in negative affect, and significant reductions were found in groups II-SL2, III-SL, and VI-GL. Overall, seven of the nine groups showed no increase in negative affect after exposure, indicating a generally high tolerance for various types of window views. These findings suggest that as long as the view contains a moderate amount of natural elements, particularly greenery, it is unlikely to evoke discomfort or psychological distress.
The EEG results provide further insight. Although groups IV-GL1 and I-SL1 performed poorly across multiple indicators, they ranked relatively high in Theta power, while groups VI-GL, VII-SGL1, and IX-SGL ranked lowest. Given that Theta activity is often associated with sleep or meditative states, it is plausible that environments more likely to induce negative emotions may concurrently suppress Theta wave activity. Moreover, an increase in beta wave activity has been associated with heightened anxiety, and the IV-GL1 group exhibited the largest post-exposure increase in beta power among all groups. These EEG findings align closely with the results obtained from the affective measures.
Taken together, the indicators reveal a consistent pattern: the greater the proportion of natural elements in the visual scene, the more favorable the physiological and emotional responses. Conversely, scenes composed entirely of artificial elements tend to elicit negative responses, a conclusion that aligns with the prevailing research [55,56,57]. Notably, groups I-SL1 and VII-SGL1 frequently exhibited similar negative feedback as group IV-GL1 across multiple indices. This suggests that while sky elements may contribute some restorative benefit, participants generally express a stronger preference for greenery. Among the three types of window views composed of ground and landscape layers, the overall restorative outcomes were comparatively weaker across indicators, implying that road elements provide the least restorative benefit. In summary, when considering the restorative effects of the four primary visual elements in window views, greenery contributes the most to psychological and physiological recovery, followed by the sky. In contrast, building and road elements tend to exert negative influences, with road elements appearing to be the least restorative of all.

4.2. Restorative Effects of Different Types of Window Views

Although window views composed predominantly of natural elements are generally regarded as offering the greatest restorative benefits, this pattern does not hold consistently across all measured indicators. For example, in the alpha and alpha/beta ratio, groups VII-SGL1, VIII-SGL2, and IX-SGL—which feature all three visual layers (sky, landscape, and ground)—exhibited more favorable responses. When examining the FAA difference, it was observed that, except for group IV-GL1, which showed a reduction in frontal alpha asymmetry after exposure, all other groups experienced a marked increase in asymmetry. Notably, this increase was most prominent in groups II-SL2, VII-SGL1, VIII-SGL2, and IX-SGL.
Findings from the alpha, alpha/beta ratio, and frontal alpha asymmetry analyses indicate that the tri-layer window views of groups VII-SGL1, VIII-SGL2, and IX-SGL produced higher restorative effects than the window view composed exclusively of natural elements in group II-SL2, despite the inclusion of built features often associated with negative affect. This suggests that when a window view offers a sufficiently rich array of environmental information, it may be equally preferred by individuals and may afford comparable restorative potential to that of purely natural settings. Alexander, in his seminal work, also emphasized that individuals tend to prefer window views that offer a complete and enriched visual experience [9], and he proposed corresponding design principles for window placement and configuration. Supporting this notion, a separate study investigating the aesthetic value of natural landscapes reached a similar conclusion: within urban environments, views incorporating distinctive historical architecture were rated more favorably, whereas monotonous natural settings elicited relatively less preference [58]. Collectively, these findings suggest that the restorative effects of window views are governed by a complex set of mechanisms. No single visual element alone determines a view’s overall restorative capacity. Overall, window views containing a greater variety of visual elements and featuring three fully stratified layers demonstrate higher restorative effects.

4.3. Limitations and Future Work

Although this study has taken a realistic and multidimensional approach to exploring the restorative benefits of window views—yielding several conclusions that may inform future window-view design—there remain several limitations that should be acknowledged. First, in terms of the selected indicators, this study focused only on a subset of key visual elements within window views. Other potentially influential components, such as mountains, bodies of water, and dynamic visual stimuli, were not included in the present analysis. Future research may benefit from incorporating these additional elements to provide a more comprehensive understanding of window-view composition. Second, the sample size needs to be expanded, and window views from a wider range of regions should be investigated. Third, all participants in this experiment were university students, excluding other groups such as office workers or older adults, whose preferences and responses to window views may differ, thus limiting the generalizability of the findings. Finally, although the restorative potential of window views is primarily understood through visual perception, it is also influenced by multisensory factors such as auditory and olfactory cues—dimensions not addressed in the current experimental design.
Looking ahead, several directions can be pursued to deepen this line of research. The first involves the inclusion of a broader and more diverse range of environmental elements. Future studies may refine and further classify the restorative potential of existing components—such as examining the effects of different greenery configurations—and extend analysis to other visual elements. As suggested by the current findings, even built elements typically regarded as non-restorative may contribute positively to recovery when integrated into a visually rich and coherent scene. Therefore, more detailed investigations into the restorative benefits of specific visual features and their combinations are warranted. Second, research should include diverse regions and populations. Limiting the study to a single region and a homogeneous sample of university students reduces the universality of the conclusions. Expanding the study to a broader demographic and geographic scope would enhance the validity and credibility of the findings. Third, future research should adopt a multisensory perspective. A complete environmental experience involves the engagement of multiple sensory modalities. Studies that incorporate multisensory stimulation may offer deeper insights into the restorative capabilities of various window-view compositions. While such research is currently constrained by the challenges of simulating complex real-world environments—both in physical and virtual contexts—it is anticipated that technological advancements will enable more sophisticated and accurate experimentation in the future. Lastly, future studies should consider a more integrated framework for understanding the mechanisms through which window views exert restorative effects. The present study focused exclusively on the visual content of window views. However, incorporating additional influencing factors—such as observer position, window dimensions, and framing characteristics—would contribute to the development of a more comprehensive and holistic model of how window views affect psychological and physiological restoration.

4.4. Applications

This study uses human emotion and stress levels as key reference indicators, and its findings provide valuable insights and practical implications for architectural design. The results confirm that different types of window views can influence both emotional states and stress levels. Consequently, improving external environments to create high-quality window views can enhance indoor environmental quality and, in turn, improve overall quality of life.
In urban settings, strategies such as incorporating vertical greenery, designing rooftop gardens, creating high-quality landscapes, and optimizing building spacing can increase the proportion of natural elements in window views and enrich spatial layers. In indoor environments, careful design of window size, shape, and orientation, as well as optimizing interior layouts, can help provide better visual access and maximize the restorative benefits of window views.
These findings contribute meaningful evidence to green building standards (e.g., LEED) and have the potential to promote the development of healthy building practices, ultimately bringing greater well-being to individuals who spend extended periods living or working indoors.

5. Conclusions

This study investigated the restorative benefits of viewing window scenes in everyday life. Window views were categorized into four primary visual elements: greenery, sky, building, and road. Using a horizontal stratification method, nine representative combinations of these elements were constructed as experimental conditions. Through a controlled experimental design, participants’ stress levels and emotional states were assessed using both subjective (PANAS) and objective (electroencephalography, EEG) measures in order to examine the differential impact of individual visual elements and their combinations on emotional and stress responses.
The findings reveal that window views with a higher proportion of natural elements were more effective in alleviating stress and reducing negative affect, while those composed solely of artificial elements tended to induce adverse effects. Among the four visual components, the restorative potential was ranked from highest to lowest: greenery, sky, building, and road. However, artificial elements did not universally produce negative outcomes; window views that integrated a variety of visual features also demonstrated beneficial effects, including stress reduction and enhancement of positive emotions. This study offers a novel perspective for environmental design by addressing the often-overlooked perceptual needs of occupants within the context of industrialized construction paradigms. In doing so, it contributes to the enhancement of both psychological well-being and overall human health.

Author Contributions

Conceptualization, P.Z. and T.Y.; methodology, Y.B.; software, T.Y.; validation, W.N., W.G. and X.Q.; formal analysis, T.Y.; investigation, W.N. and W.G.; resources, T.Y.; data curation, W.L.; writing—original draft preparation, T.Y.; writing—review and editing, P.Z. and T.Y.; visualization, T.Y.; supervision, Y.B., W.S. and W.L.; project administration, P.Z.; funding acquisition, P.Z., W.S. and X.Q. All authors have read and agreed to the published version of the manuscript.

Funding

This research was funded by the National Natural Science Foundation of China (51508151), the Science and Technology Plan Project of Tianjin (22JCZDJC00870), and the Central Research Institutes of Basic Research and Public Service Special Operations (2024SJ09).

Institutional Review Board Statement

The study was conducted in accordance with the Declaration of Helsinki, and approved by Ethics Committee of Hebei University of Technology (protocol code HEBUThMEC2024031, approval date 7 May 2024).

Informed Consent Statement

All participants signed an informed consent form before the start of the experiment.

Data Availability Statement

The original contributions presented in the study are included in the article; further inquiries can be directed to the corresponding author.

Acknowledgments

We would like to express our gratitude to each participant for their active engagement.

Conflicts of Interest

The authors declare no conflicts of interest.

Appendix A

Table A1. One-way analysis of variance of EEG and its related indicators.
Variable Sum of SquaresdfMSFp-Value
ThetaBetween groups0.116%80.014%2.922 0.004
Within groups0.846%1710.005%
Total0.962%179
AlphaBetween groups0.270%80.034%4.062 <0.001
Within groups1.422%1710.008%
Total1.692%179
BetaBetween groups0.017%80.002%1.129 0.346
Within groups0.321%1710.002%
Total0.338%179
GammaBetween groups0.022%80.003%0.822 0.584
Within groups0.565%1710.003%
Total0.587%179
Alpha/BetaBetween groups28.269 83.534 2.389 0.018
Within groups252.952 1711.479
Total281.221 179
Beta/GammaBetween groups3.491 80.436 0.636 0.747
Within groups117.364 1710.686
Total120.855 179
Theta/BetaBetween groups14.222 81.778 0.802 0.601
Within groups378.854 1712.216
Total393.076 179
FAABetween groups0.064%80.008%2.668 0.009
Within groups0.515%1710.003%
Total0.579%179
Table A2. Paired t-tests of EEG and its related indicators (pretest and posttest).
Variable I-SL1II-SL2III-SLIV-GL1V-GL2VI-GLVII-SGL1VIII-SGL2IX-SGL
Thetamean−0.665%−0.804%−0.228%−0.219%−0.330%−0.125%−0.004%−0.381%−0.065%
std0.734%0.713%0.610%0.870%0.765%0.624%0.689%0.642%0.643%
median−0.564%−0.812%−0.207%−0.340%−0.407%−0.133%−0.031%−0.326%−0.204%
p-value0.619 0.038 0.272 0.826 0.460 0.407 0.774 0.548 0.283
Alphamean−0.194%−0.395%−0.098%0.054%−0.015%0.100%0.700%0.639%0.694%
std0.772%0.704%0.565%0.691%0.651%0.813%1.201%1.290%1.185%
median−0.102%−0.298%−0.130%0.221%−0.124%0.185%0.284%0.289%0.343%
p-value0.060 0.699 0.128 0.779 0.145 0.015 0.989 0.898 0.905
Betamean−0.150%−0.101%−0.099%0.113%−0.217%0.044%−0.039%−0.088%0.024%
std0.402%0.558%0.379%0.493%0.444%0.497%0.421%0.311%0.331%
median−0.132%−0.236%−0.160%0.187%−0.207%0.021%−0.033%−0.081%0.000%
p-value0.810 0.076 0.316 0.641 0.103 0.972 0.405 0.432 0.450
Gammamean−0.115%0.024%0.007%0.164%−0.163%0.139%−0.080%−0.106%0.070%
std0.407%0.734%0.409%0.779%0.633%0.669%0.445%0.487%0.459%
median−0.049%−0.062%0.083%0.359%−0.116%−0.006%0.019%−0.018%0.029%
p-value0.668 <0.0010.251 0.712 0.161 0.973 0.195 0.164 0.639
Alpha/Betamean0.163 −0.181 0.119 −0.103 0.351 0.011 0.910 0.841 0.770
std0.620 0.756 0.684 1.119 1.146 0.847 1.821 1.589 1.663
median0.038 −0.078 0.127 −0.167 0.185 0.063 0.334 0.128 0.178
p-value0.108 0.184 0.412 0.029 0.330 0.858 0.304 0.539 0.108
Beta/Gammamean0.211 −0.022 0.026 −0.247 0.039 −0.196 0.046 0.123 −0.111
std1.130 1.329 1.241 0.700 0.406 0.463 0.455 0.576 0.430
median−0.062 −0.100 −0.028 −0.142 0.006 −0.081 0.024 0.058 −0.042
p-value0.313 0.878 0.369 0.311 0.852 0.513 0.589 0.842 0.922
Theta/Betamean−0.083 −0.541 0.263 −0.550 0.176 −0.434 0.001 −0.266 −0.096
std1.561 1.663 1.744 1.447 1.788 1.717 1.109 0.925 1.171
median−0.486 −0.144 −0.139 −0.660 −0.134 −0.076 −0.090 −0.124 −0.032
p-value0.015 0.302 0.394 0.826 0.397 0.646 0.427 0.099 0.776

References

  1. Beehr, T.A. Stress, Workload, and Fatigue in Relation to Task, Technology, and Performance. PsycCRITIQUES 2002, 47, 747–749. [Google Scholar] [CrossRef]
  2. Möckel, T.; Beste, C.; Wascher, E. The Effects of Time on Task in Response Selection—An ERP Study of Mental Fatigue. Sci. Rep. 2015, 5, 10113. [Google Scholar] [CrossRef] [PubMed]
  3. Ulrich, R.S.; Simons, R.F.; Losito, B.D.; Fiorito, E.; Miles, M.A.; Zelson, M. Stress Recovery during Exposure to Natural and Urban Environments. J. Environ. Psychol. 1991, 11, 201–230. [Google Scholar] [CrossRef]
  4. Kaplan, S. The Restorative Benefits of Nature: Toward an Integrative Framework. J. Environ. Psychol. 1995, 15, 169–182. [Google Scholar] [CrossRef]
  5. Beute, F.; De Kort, Y.A.W. Natural Resistance: Exposure to Nature and Self-Regulation, Mood, and Physiology after Ego-Depletion. J. Environ. Psychol. 2014, 40, 167–178. [Google Scholar] [CrossRef]
  6. Gilchrist, K.; Brown, C.; Montarzino, A. Workplace Settings and Wellbeing: Greenspace Use and Views Contribute to Employee Wellbeing at Peri-Urban Business Sites. Landsc. Urban Plan. 2015, 138, 32–40. [Google Scholar] [CrossRef]
  7. Hossain, M.M.; Sultana, A.; Purohit, N. Mental Health Outcomes of Quarantine and Isolation for Infection Prevention: A Systematic Umbrella Review of the Global Evidence. Epidemiol. Health 2020, 42, e2020038. [Google Scholar] [CrossRef]
  8. Aries, M.B.C.; Veitch, J.A.; Newsham, G.R. Windows, View, and Office Characteristics Predict Physical and Psychological Discomfort. J. Environ. Psychol. 2010, 30, 533–541. [Google Scholar] [CrossRef]
  9. Alexander, C. A Pattern Language: Towns, Buildings, Construction; Oxford University Press: New York, NY, USA, 1977; pp. 1046–1055. ISBN 0-19-501919-9. [Google Scholar]
  10. Kent, M.G.; Schiavon, S. Predicting Window View Preferences Using the Environmental Information Criteria. LEUKOS 2023, 19, 190–209. [Google Scholar] [CrossRef]
  11. Ulrich, R.S. View through a Window May Influence Recovery from Surgery. Sci. New Ser. 1984, 224, 420–421. [Google Scholar] [CrossRef]
  12. Ko, W.H.; Schiavon, S.; Zhang, H.; Graham, L.T.; Brager, G.; Mauss, I.; Lin, Y.-W. The Impact of a View from a Window on Thermal Comfort, Emotion, and Cognitive Performance. Build. Environ. 2020, 175, 106779. [Google Scholar] [CrossRef]
  13. Kahn, P.H.; Friedman, B.; Gill, B.; Hagman, J.; Severson, R.L.; Freier, N.G.; Feldman, E.N.; Carrère, S.; Stolyar, A. A Plasma Display Window?—The Shifting Baseline Problem in a Technologically Mediated Natural World. J. Environ. Psychol. 2008, 28, 192–199. [Google Scholar] [CrossRef]
  14. Vásquez, N.G.; Felippe, M.L.; Pereira, F.O.R.; Kuhnen, A. Luminous and Visual Preferences of Young Children in Their Classrooms: Curtain Use, Artificial Lighting and Window Views. Build. Environ. 2019, 152, 59–73. [Google Scholar] [CrossRef]
  15. Yeom, S.; Kim, H.; Hong, T.; Park, H.S.; Lee, D.-E. An Integrated Psychological Score for Occupants Based on Their Perception and Emotional Response According to the Windows’ Outdoor View Size. Build. Environ. 2020, 180, 107019. [Google Scholar] [CrossRef]
  16. Mascherek, A.; Weber, S.; Riebandt, K.; Cassanello, C.; Leicht, G.; Brick, T.; Gallinat, J.; Kühn, S. On the Relation between a Green and Bright Window View and Length of Hospital Stay in Affective Disorders. Eur. Psychiatry 2022, 65, e21. [Google Scholar] [CrossRef]
  17. Domjan, S.; Arkar, C.; Medved, S. Study on Occupants’ Window View Quality Vote and Their Physiological Response. J. Build. Eng. 2023, 68, 106119. [Google Scholar] [CrossRef]
  18. Song, M.; Xu, M.; Wang, Y.; Lu, S.; Gong, X.; Si, R.; Xu, F. Is More Vegetation Always Better? Evaluation of Restorative Benefits and Preference for Window Views. Build. Environ. 2025, 272, 112660. [Google Scholar] [CrossRef]
  19. Lin, T.-Y.; Le, A.-V.; Chan, Y.-C. Evaluation of Window View Preference Using Quantitative and Qualitative Factors of Window View Content. Build. Environ. 2022, 213, 108886. [Google Scholar] [CrossRef]
  20. Olszewska-Guizzo, A.; Escoffier, N.; Chan, J.; Puay Yok, T. Window View and the Brain: Effects of Floor Level and Green Cover on the Alpha and Beta Rhythms in a Passive Exposure EEG Experiment. Int. J. Environ. Res. Public Health 2018, 15, 2358. [Google Scholar] [CrossRef]
  21. Van Renterghem, T.; Vermandere, E.; Lauwereys, M. Road Traffic Noise Annoyance Mitigation by Green Window View: Optimizing Green Quantity and Quality. Urban For. Urban Green. 2023, 88, 128072. [Google Scholar] [CrossRef]
  22. Elsadek, M.; Liu, B.; Xie, J. Window View and Relaxation: Viewing Green Space from a High-Rise Estate Improves Urban Dwellers’ Wellbeing. Urban For. Urban Green. 2020, 55, 126846. [Google Scholar] [CrossRef]
  23. Drobne, S.; Zbašnik-Senegačnik, M.; Kristl, Ž.; Koprivec, L.; Fikfak, A. Analysis of the Window Views of the Nearby Façades. Sustainability 2022, 14, 269. [Google Scholar] [CrossRef]
  24. Wang, F.; Munakata, J. Simulated Window Views from Different Building Floors: How Roof Types of Surrounding Buildings Associate with Subjective Restoration. Urban For. Urban Green. 2023, 89, 128096. [Google Scholar] [CrossRef]
  25. Zhao, J.; Wu, J.; Wang, H. Characteristics of Urban Streets in Relation to Perceived Restorativeness. J. Expo. Sci. Environ. Epidemiol. 2020, 30, 309–319. [Google Scholar] [CrossRef]
  26. Fošner, A.; Zbašnik-Senegačnik, M.; Kristl, Ž. Window View Preferences in Various Environmental and Activity Contexts. Sustainability 2023, 15, 16215. [Google Scholar] [CrossRef]
  27. Bradley, M.M.; Lang, P.J. Measuring Emotion: The Self-Assessment Manikin and the Semantic Differential. J. Behav. Ther. Exp. Psychiatry 1994, 25, 49–59. [Google Scholar] [CrossRef]
  28. Biggs, J.T.; Wylie, L.T.; Ziegler, V.E. Validity of the Zung Self-Rating Depression Scale. Br. J. Psychiatry 1978, 132, 381–385. [Google Scholar] [CrossRef]
  29. Zuckerman, M. Development of a Situation-Specific Trait-State Test for the Prediction and Measurement of Affective Responses. J. Consult. Clin. Psychol. 1977, 45, 513–523. [Google Scholar] [CrossRef]
  30. Watson, D.; Clark, L.A.; Tellegen, A. Development and Validation of Brief Measures of Positive and Negative Affect: The PANAS Scales. J. Personal. Soc. Psychol. 1988, 54, 1063–1070. [Google Scholar] [CrossRef]
  31. Cha, K. The Influence of Classroom Size and Window View on Young Children’s Executive Functions and Physiological Responses, Based on VR Technology. Behav. Sci. 2023, 13, 936. [Google Scholar] [CrossRef]
  32. Mihara, K.; Hasama, T.; Takasuna, H. Physiological and Psychological Responses and Cognitive Performance with a Window View. Sci. Technol. Built Environ. 2022, 28, 547–556. [Google Scholar] [CrossRef]
  33. Jang, D.; Kim, H.-J.; Choi, K. Enhancing Student Learning in Virtual Classrooms: Effects of Window View Content and Time of Day. IEEE Access 2024, 12, 152630–152638. [Google Scholar] [CrossRef]
  34. Elsadek, M.; Deshun, Z.; Liu, B. High-Rise Window Views: Evaluating the Physiological and Psychological Impacts of Green, Blue, and Built Environments. Build. Environ. 2024, 262, 111798. [Google Scholar] [CrossRef]
  35. Zhang, Y.; Tang, Y.; Wang, X.; Tan, Y. The Effects of Natural Window Views in Classrooms on College Students’ Mood and Learning Efficiency. Buildings 2024, 14, 1557. [Google Scholar] [CrossRef]
  36. Grinde, B.; Patil, G.G. Biophilia: Does Visual Contact with Nature Impact on Health and Well-Being? Int. J. Environ. Res. Public Health 2009, 6, 2332–2343. [Google Scholar] [CrossRef]
  37. Kent, M.; Schiavon, S. Evaluation of the Effect of Landscape Distance Seen in Window Views on Visual Satisfaction. Build. Environ. 2020, 183, 107160. [Google Scholar] [CrossRef]
  38. Stamps, A.E., III. Use of Photographs to Simulate Environments: A Meta-Analysis. Percept. Mot. Ski. 1990, 71, 907–913. [Google Scholar] [CrossRef]
  39. Palmer, J.F.; Hoffman, R.E. Rating Reliability and Representation Validity in Scenic Landscape Assessments. Landsc. Urban Plan. 2001, 54, 149–161. [Google Scholar] [CrossRef]
  40. Masoudinejad, S.; Hartig, T. Window View to the Sky as a Restorative Resource for Residents in Densely Populated Cities. Environ. Behav. 2020, 52, 401–436. [Google Scholar] [CrossRef]
  41. Sun, K.; Li, Z.; Zheng, S.; Qu, H. Quantifying Environmental Characteristics on Psychophysiological Restorative Benefits of Campus Window Views. Build. Environ. 2024, 262, 111822. [Google Scholar] [CrossRef]
  42. Markus, T.A. The Function of Windows— A Reappraisal. Build. Sci. 1967, 2, 97–121. [Google Scholar] [CrossRef]
  43. Ko, W.H.; Kent, M.G.; Schiavon, S.; Levitt, B.; Betti, G. A Window View Quality Assessment Framework. LEUKOS 2022, 18, 268–293. [Google Scholar] [CrossRef]
  44. Lyubomirsky, S.; King, L.; Diener, E. The Benefits of Frequent Positive Affect: Does Happiness Lead to Success? Psychol. Bull. 2005, 131, 803–855. [Google Scholar] [CrossRef] [PubMed]
  45. Gross, J.J. Emotion Regulation: Current Status and Future Prospects. Psychol. Inq. 2015, 26, 1–26. [Google Scholar] [CrossRef]
  46. Chang, C.-Y.; Chen, P.-K. Human Response to Window Views and Indoor Plants in the Workplace. HortScience 2005, 40, 1354–1359. [Google Scholar] [CrossRef]
  47. Koudelková, Z.; Strmiska, M. Introduction to the Identification of Brain Waves Based on Their Frequency. MATEC Web Conf. 2018, 210, 05012. [Google Scholar] [CrossRef]
  48. Baehr, E.; Rosenfeld, J.P.; Baehr, R. The Clinical Use of An Alpha Asymmetry Protocol in the Neurofeedback Treatment of Depression: Two Case Studies. J. Neurother. 1997, 2, 10–23. [Google Scholar] [CrossRef]
  49. Lan, L.; Lian, Z. Application of Statistical Power Analysis—How to Determine the Right Sample Size in Human Health, Comfort and Productivity Research. Build. Environ. 2010, 45, 1202–1213. [Google Scholar] [CrossRef]
  50. Stroop, J.R. Studies of Interference in Serial Verbal Reactions. J. Exp. Psychol. Gen. 1992, 121, 15–23. [Google Scholar] [CrossRef]
  51. Rhee, J.H.; Schermer, B.; Han, G.; Park, S.Y.; Lee, K.H. Effects of Nature on Restorative and Cognitive Benefits in Indoor Environment. Sci. Rep. 2023, 13, 13199. [Google Scholar] [CrossRef]
  52. Delorme, A.; Makeig, S. EEGLAB: An Open Source Toolbox for Analysis of Single-Trial EEG Dynamics Including Independent Component Analysis. J. Neurosci. Methods 2004, 134, 9–21. [Google Scholar] [CrossRef]
  53. Yao, D. A Method to Standardize a Reference of Scalp EEG Recordings to a Point at Infinity. Physiol. Meas. 2001, 22, 693–711. [Google Scholar] [CrossRef]
  54. Schober, P.; Boer, C.; Schwarte, L.A. Correlation Coefficients: Appropriate Use and Interpretation. Anesth. Analg. 2018, 126, 1763–1768. [Google Scholar] [CrossRef]
  55. Yin, Y.; Xia, T.; Shu, T.; Zhao, B.; Zhang, G.; Zhang, J. Watching Nature through the Window Cannot Be Overlooked! Nexus between Green Window View, Physical Activity Intention, and Intensity among Older Adults. Landsc. Urban Plan. 2025, 257, 105318. [Google Scholar] [CrossRef]
  56. Oh, D.; Heo, J.; Jang, H.; Kim, J. Evaluating Psychophysiological Responses Based on the Proximity and Type of Window View Using Virtual Reality. Build. Environ. 2025, 270, 112575. [Google Scholar] [CrossRef]
  57. Engell, T.; Lorås, H.W.; Sigmundsson, H. Window View of Nature after Brief Exercise Improves Choice Reaction Time and Heart Rate Restoration. New Ideas Psychol. 2020, 58, 100781. [Google Scholar] [CrossRef]
  58. Seresinhe, C.I.; Preis, T.; Moat, H.S. Using Deep Learning to Quantify the Beauty of Outdoor Places. R. Soc. Open sci. 2017, 4, 170170. [Google Scholar] [CrossRef] [PubMed]
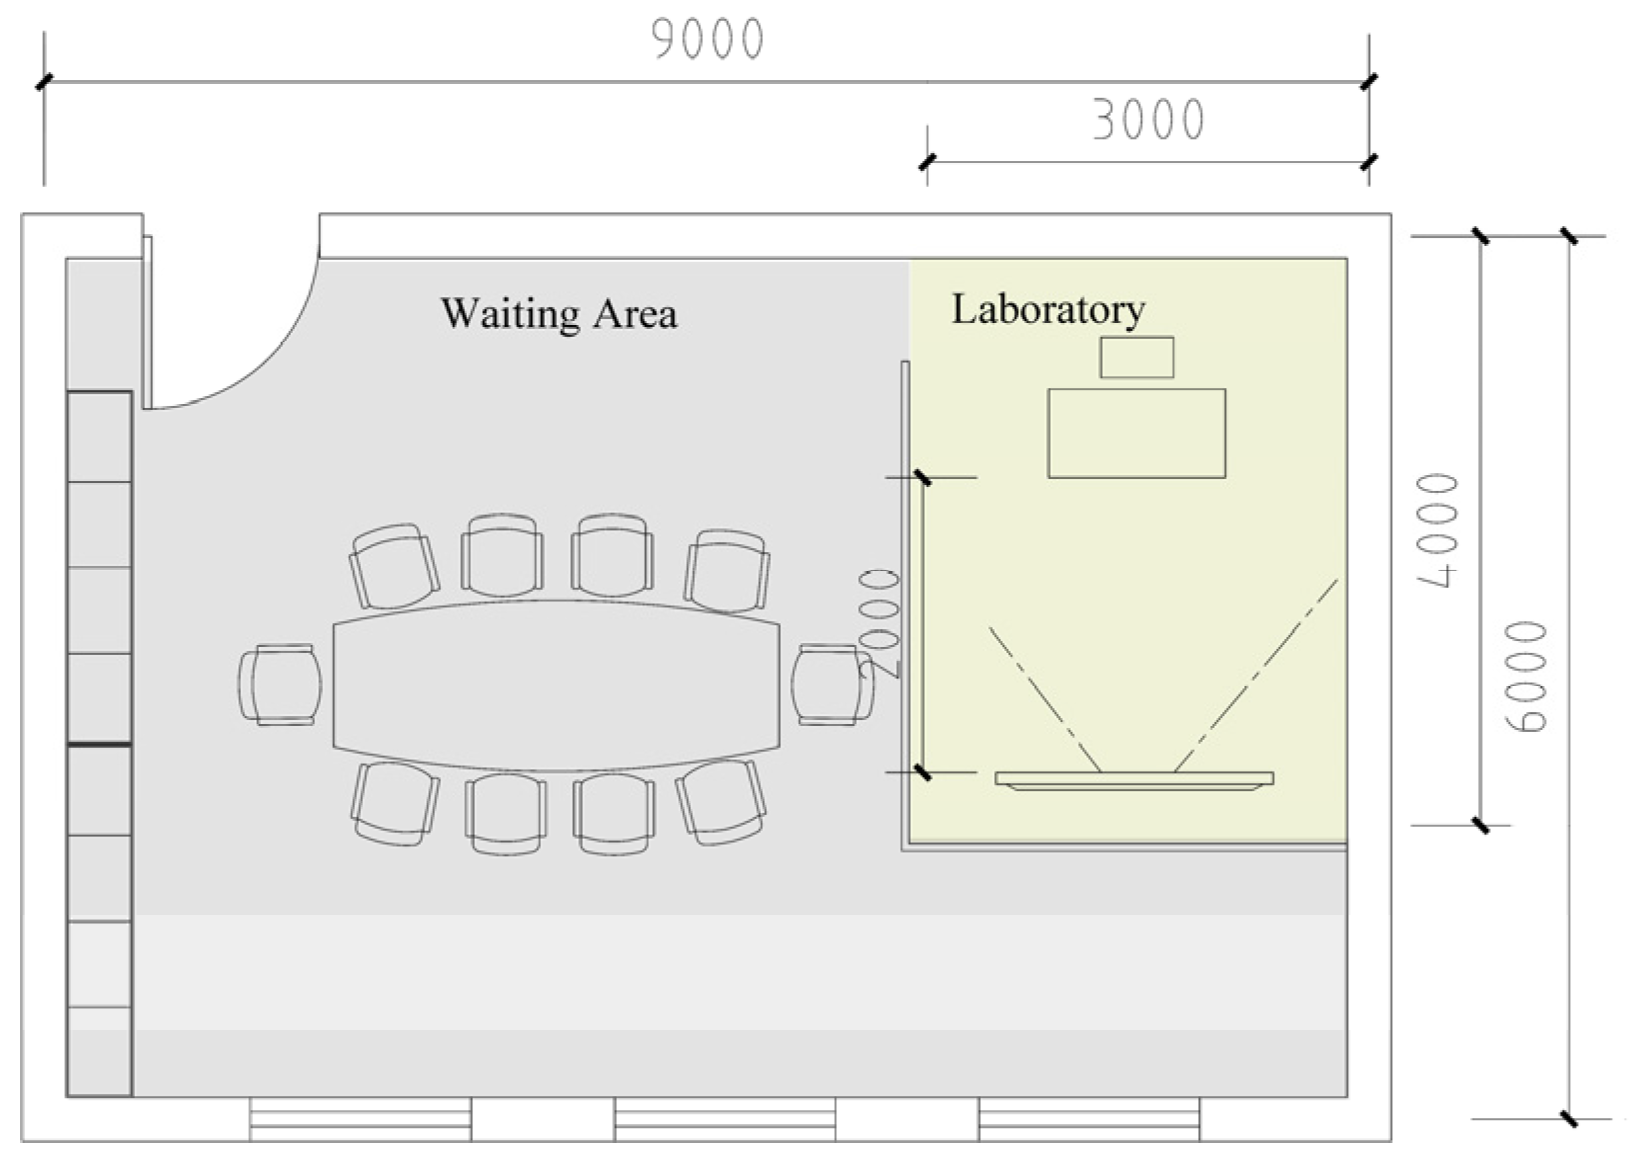
Figure 1. Laboratory plan.
Buildings 15 02804 g001
Figure 2. Three horizontal layers: (a) sky layer; (b) landscape layer; (c) ground layer.
Buildings 15 02804 g002
Figure 3. Experimental procedure.
Buildings 15 02804 g003
Figure 4. Boxplots of emotion score across nine groups before and after environmental exposure. (a) Positive emotions score difference; (b) Negative emotions score difference. * q < 0.05, determined by Kruskal–Wallis test and Mann–Whitney U test.
Buildings 15 02804 g004
Figure 5. Comparative boxplots of emotion scores before and after environmental exposure in nine groups. (a) Positive emotions score; (b) Negative emotions score. * q < 0.05, determined by Wilcoxon signed-rank test.
Buildings 15 02804 g005
Figure 6. Boxplots of EEG power across nine groups before and after environmental exposure. (a) Theta relative power difference; (b) alpha relative power difference. * q < 0.05, determined by one-way analysis of variance and Tukey–Kramer multiple comparisons tests.
Buildings 15 02804 g006
Figure 7. Comparative boxplots of EEG indices before and after environmental exposure in nine groups. (a) Theta relative power; (b) alpha relative power; (c) beta relative power; (d) Gamma relative power. * q < 0.05, determined by paired t-test.
Buildings 15 02804 g007
Figure 8. Boxplots of EEG-derived composite indices across nine groups before and after environmental exposure: (a) alpha/beta; (b) beta/Gamma; (c) Theta/beta; (d) frontal alpha relative power difference.
Buildings 15 02804 g008
Figure 9. Pearson correlation analysis results.
Buildings 15 02804 g009
Table 1. Psychometric scales.
Scale NameDescriptionApplicable Population
Self-Assessment Manikin (SAM)Assesses emotional arousal, valence (pleasure), and dominance by matching emotions to cartoon-like figures or patients. (e.g., from smiling faces to crying faces).Suitable for a wide range of populations or patients.
Self-Rating Depression Scale (SDS)Measures the severity of depression across 20 items, covering affective, somatic, and cognitive aspects.Primarily used for patients with depressive symptoms.
Zuckerman Inventory of Personal Reactions (ZIPERS)Evaluates short-term emotional states, including positive emotions, negative emotions, fatigue, and social withdrawal, with 32 items.Suitable for both patients and healthy individuals.
Positive and Negative Affect
Schedule (PANAS)
Consists of 20 items rated on a 5-point scale and measures current positive and negative affect.Applicable to the general population, with high universality.
Table 2. Physiological indicators.
Physiological IndicatorDescriptionMeasurement Method
Electroencephalography (EEG)Records the electrical activity of cortical neurons, reflecting neural oscillations (e.g., alpha and beta waves) across different brain regions.Silver chloride electrodes are placed on the scalp following the international 10–20 system to record microvolt (μV) potential changes.
Electrocardiography (ECG)Records the heart’s electrical activity, reflecting the periodic depolarization and repolarization of cardiac muscles.Electrodes are attached to the chest using standard 12-lead or simplified 3-lead configurations.
Electromyography (EMG)Records skeletal muscle electrical activity, reflecting muscle contraction intensity and neural control.Surface electrodes are placed on the skin, or intramuscular needle electrodes are used for deep muscle detection.
Electrodermal Activity (EDA)Measures skin conductance changes, indicating sympathetic nervous system arousal.Electrodes are placed on the fingers or palms.
Salivary Cortisol ConcentrationAssesses stress hormone (cortisol) levels via saliva, reflecting hypothalamic–pituitary–adrenal (HPA) axis activity.Participants chew on a cotton swab; saliva is extracted via centrifugation and analyzed using enzyme-linked immunosorbent assay (ELISA) or mass spectrometry.
Blood PressurePressure exerted on arterial walls, measured as systolic blood pressure (SBP) and diastolic blood pressure (DBP).Measured using the auscultatory method (Korotkoff sounds) with a stethoscope or the oscillometric method with an electronic sphygmomanometer.
Heart RateNumber of heartbeats per minute (bpm), reflecting autonomic nervous system regulation.Measured using ECG or photoplethysmography.
Body TemperatureReflects metabolic and health status; core temperature is of particular importance.Measured with mercury or digital thermometers or infrared sensors.
Blood Oxygen Saturation
(SPO2)
Percentage of oxygenated hemoglobin in blood, indicating respiratory function.Measured using a fingertip sensor that detects differences in red/infrared light absorption.
Table 3. Nine representative window-view groups.
Representative Window-View ImageScene TypeProportion of Each Visual Element
Sky/%Buildings/%Greenery %Roads/%Other/%
Buildings 15 02804 i001I-SL146.2149.7101.073.01
Buildings 15 02804 i002II-SL253.29044.650.51.56
Buildings 15 02804 i003III-SL36.5526.1531.723.961.62
Buildings 15 02804 i004IV-GL11.0253.610.0742.13.20
Buildings 15 02804 i005V-GL26.890.0246.3842.484.23
Buildings 15 02804 i006VI-GL4.624.2439.3730.90.89
Buildings 15 02804 i007VII-SGL136.2330.084.9527.581.16
Buildings 15 02804 i008VIII-SGL230.57038.4330.530.47
Buildings 15 02804 i009IX-SGL26.3918.8723.5627.393.79
Table 4. The frontal alpha asymmetry difference (%) before and after environmental exposure.
Scene TypeREpre (%)LEpre (%)REpost (%)LEpost (%)ΔIR (%)
I-SL1−0.1600.040−0.353−0.177−0.023
II-SL2−0.323−0.161−0.269−0.320−0.214
III-SL−0.2110.020−0.309−0.247−0.170
IV-GL10.0230.180−0.372−0.1930.021
V-GL2−0.676−0.265−0.691−0.336−0.055
VI-GL−0.009−0.0240.091−0.091−0.167
VII-SGL1−0.959−0.756−0.260−0.584−0.527
VIII-SGL2−0.456−0.2180.183−0.013−0.434
IX-SGL−1.040−0.816−0.346−0.571−0.449
Disclaimer/Publisher’s Note: The statements, opinions and data contained in all publications are solely those of the individual author(s) and contributor(s) and not of MDPI and/or the editor(s). MDPI and/or the editor(s) disclaim responsibility for any injury to people or property resulting from any ideas, methods, instructions or products referred to in the content.