A Cognition–Affect–Behavior Framework for Assessing Street Space Quality in Historic Cultural Districts and Its Impact on Tourist Experience

 ,
,  and
and
Abstract
1. Introduction
2. Related Work
2.1. Evaluation of Space Quality in Historic Cultural Districts
2.2. Research on Tourist Experience Effects Based on Computer Vision Technology
3. Method
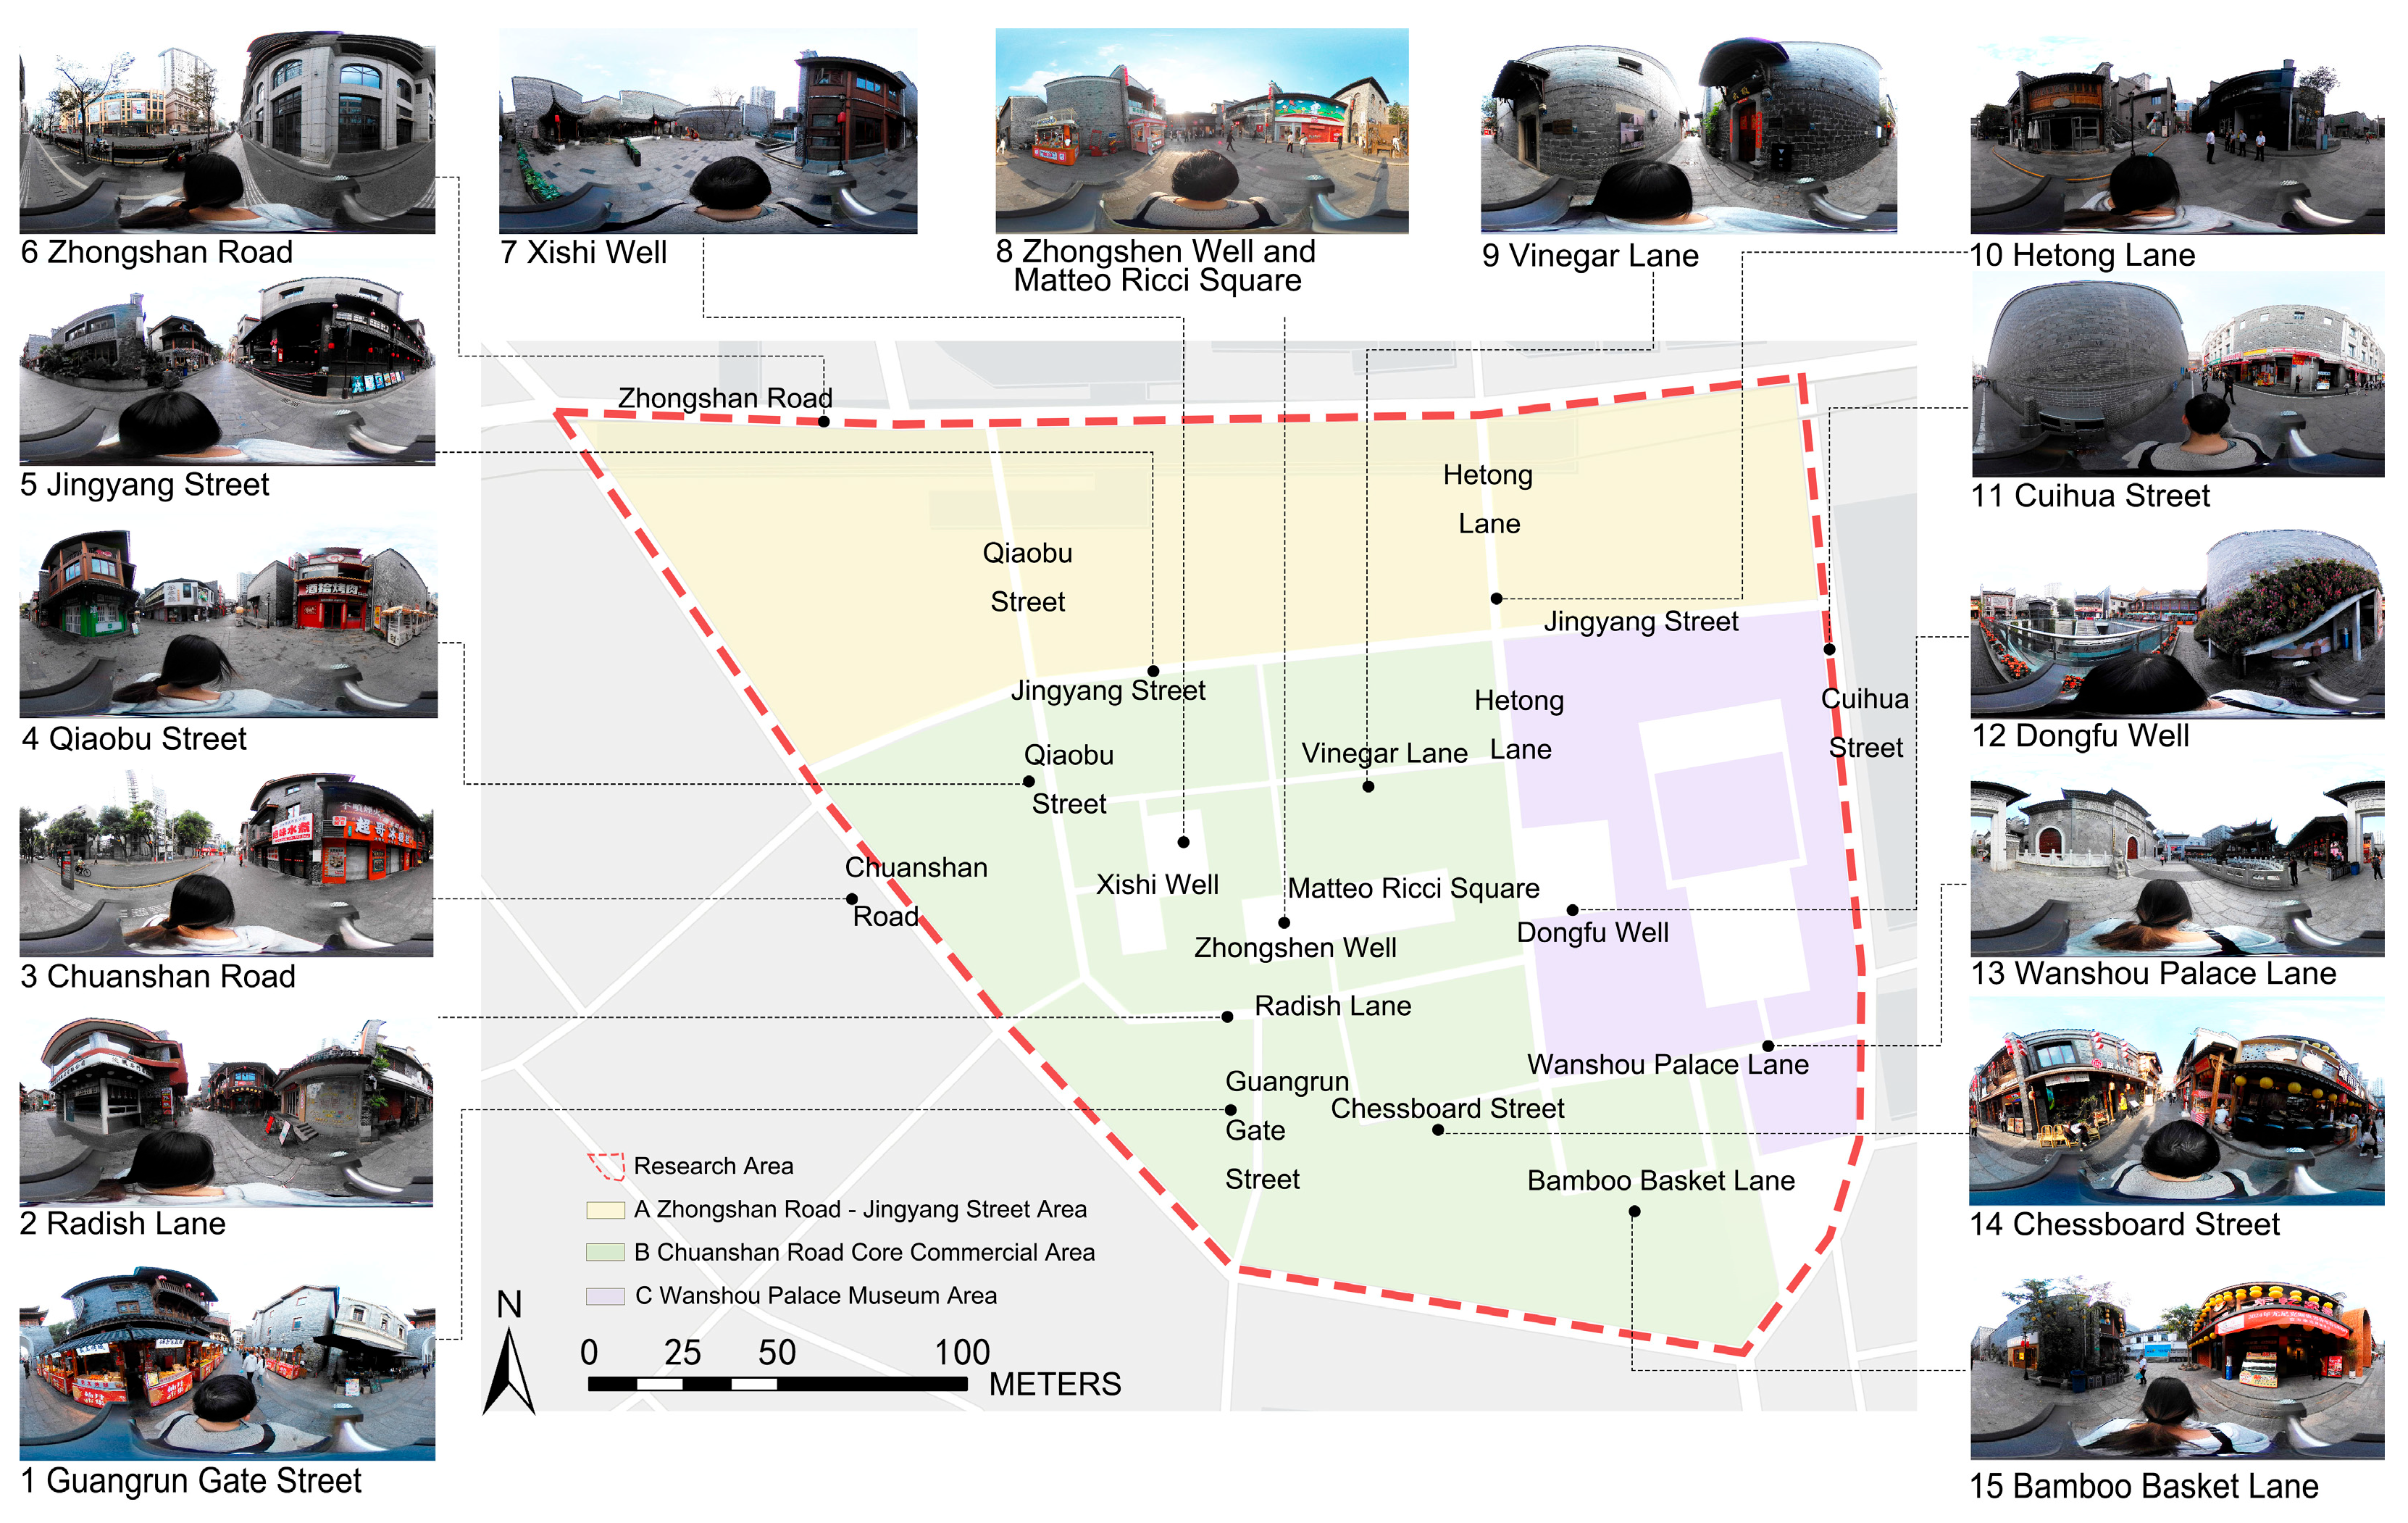
3.1. Research Area
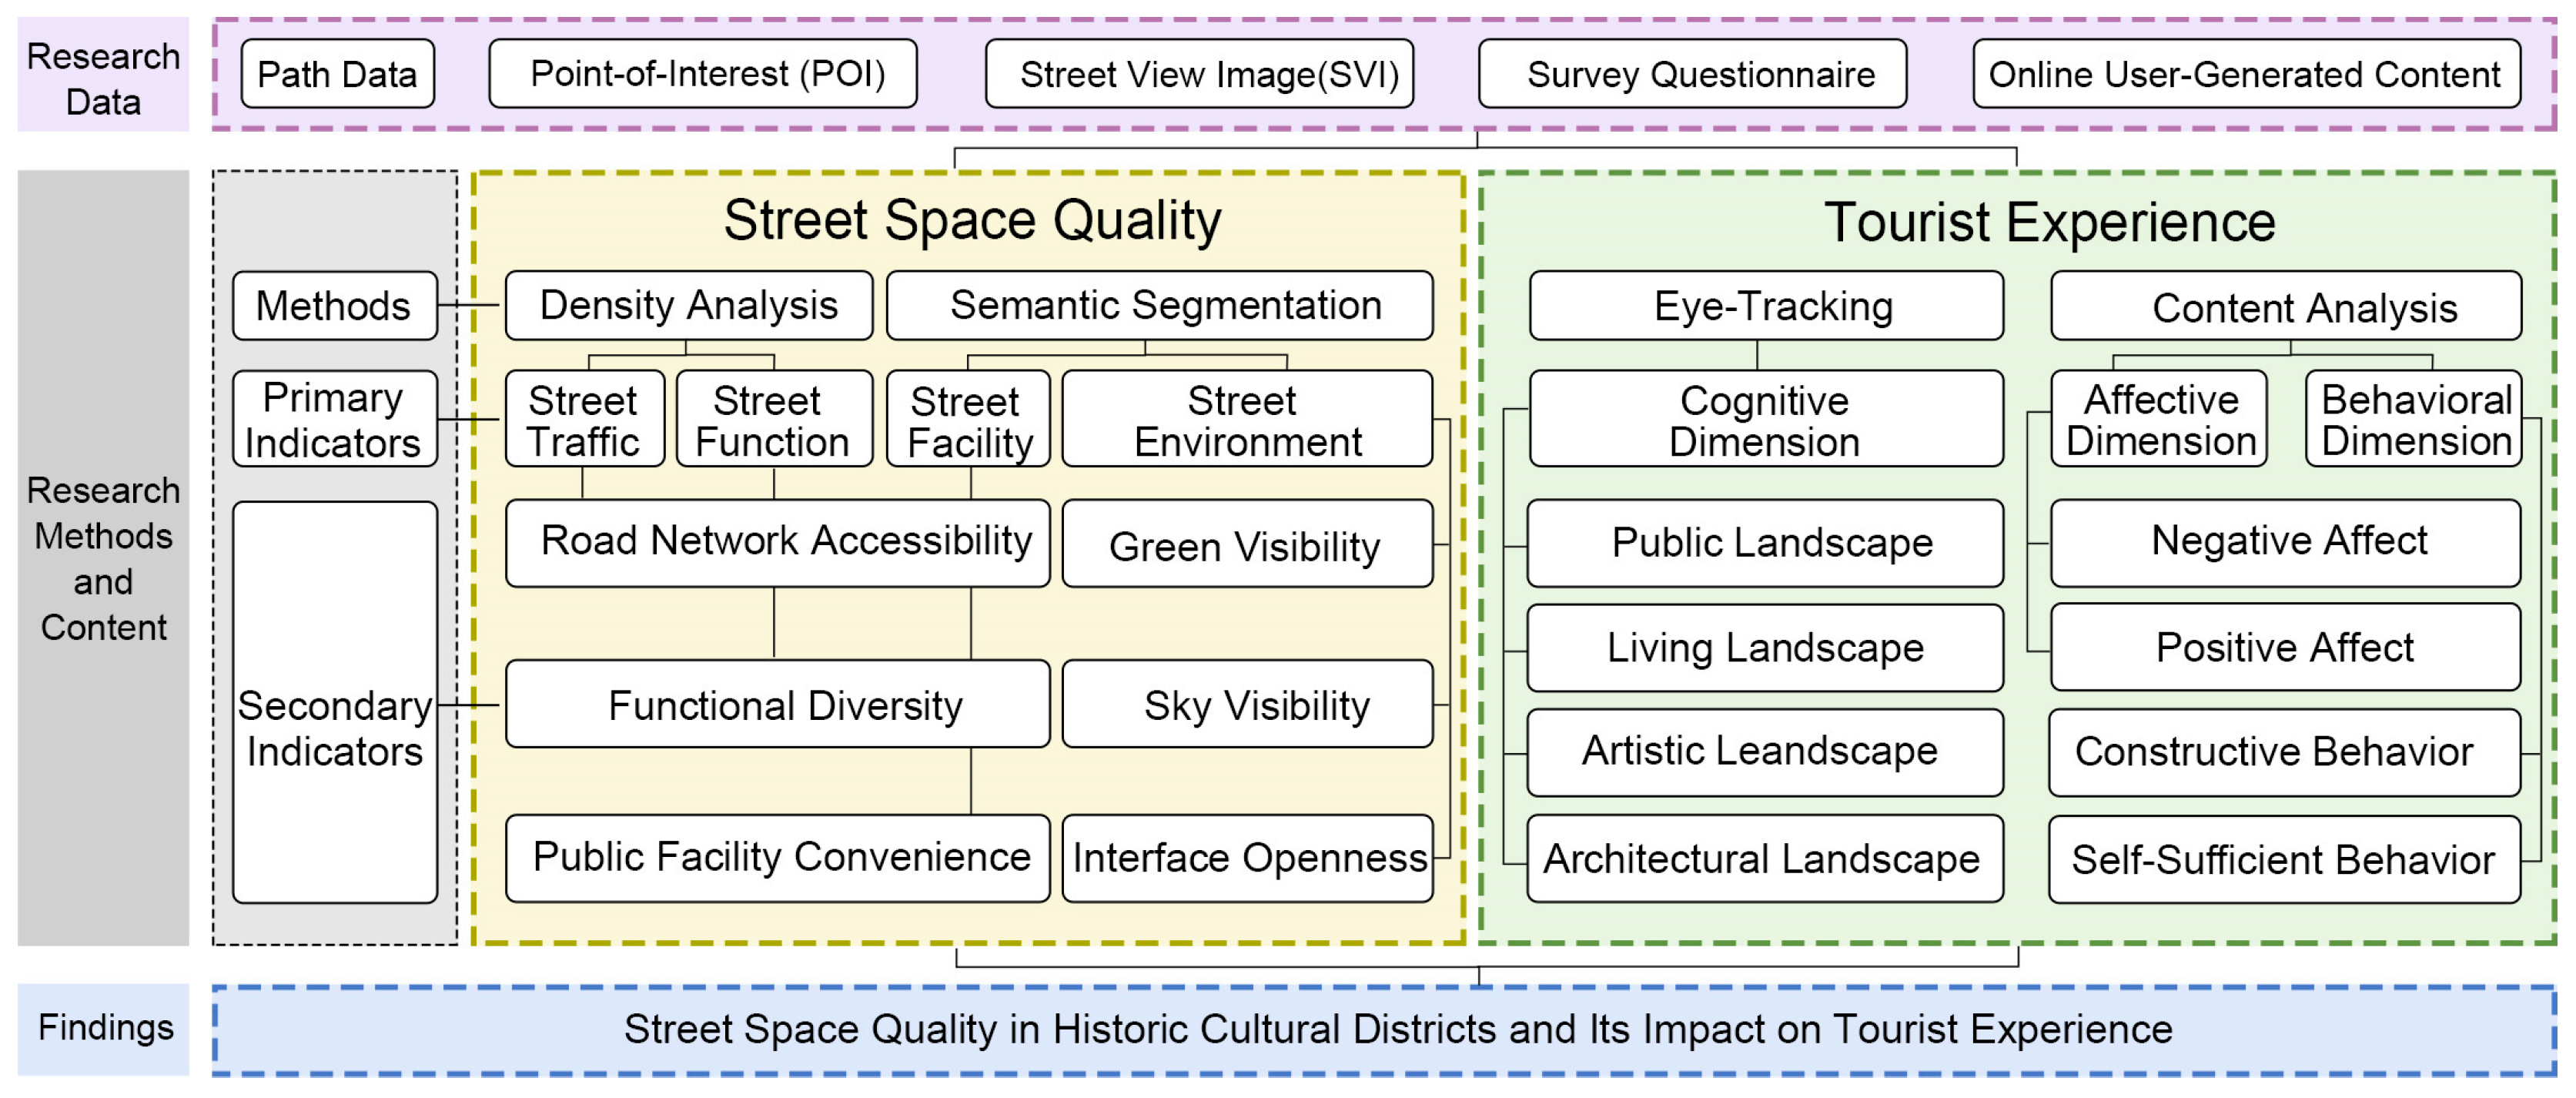
3.2. Research Framework
3.3. Construction and Evaluation Methods of the Space Quality Indicator System
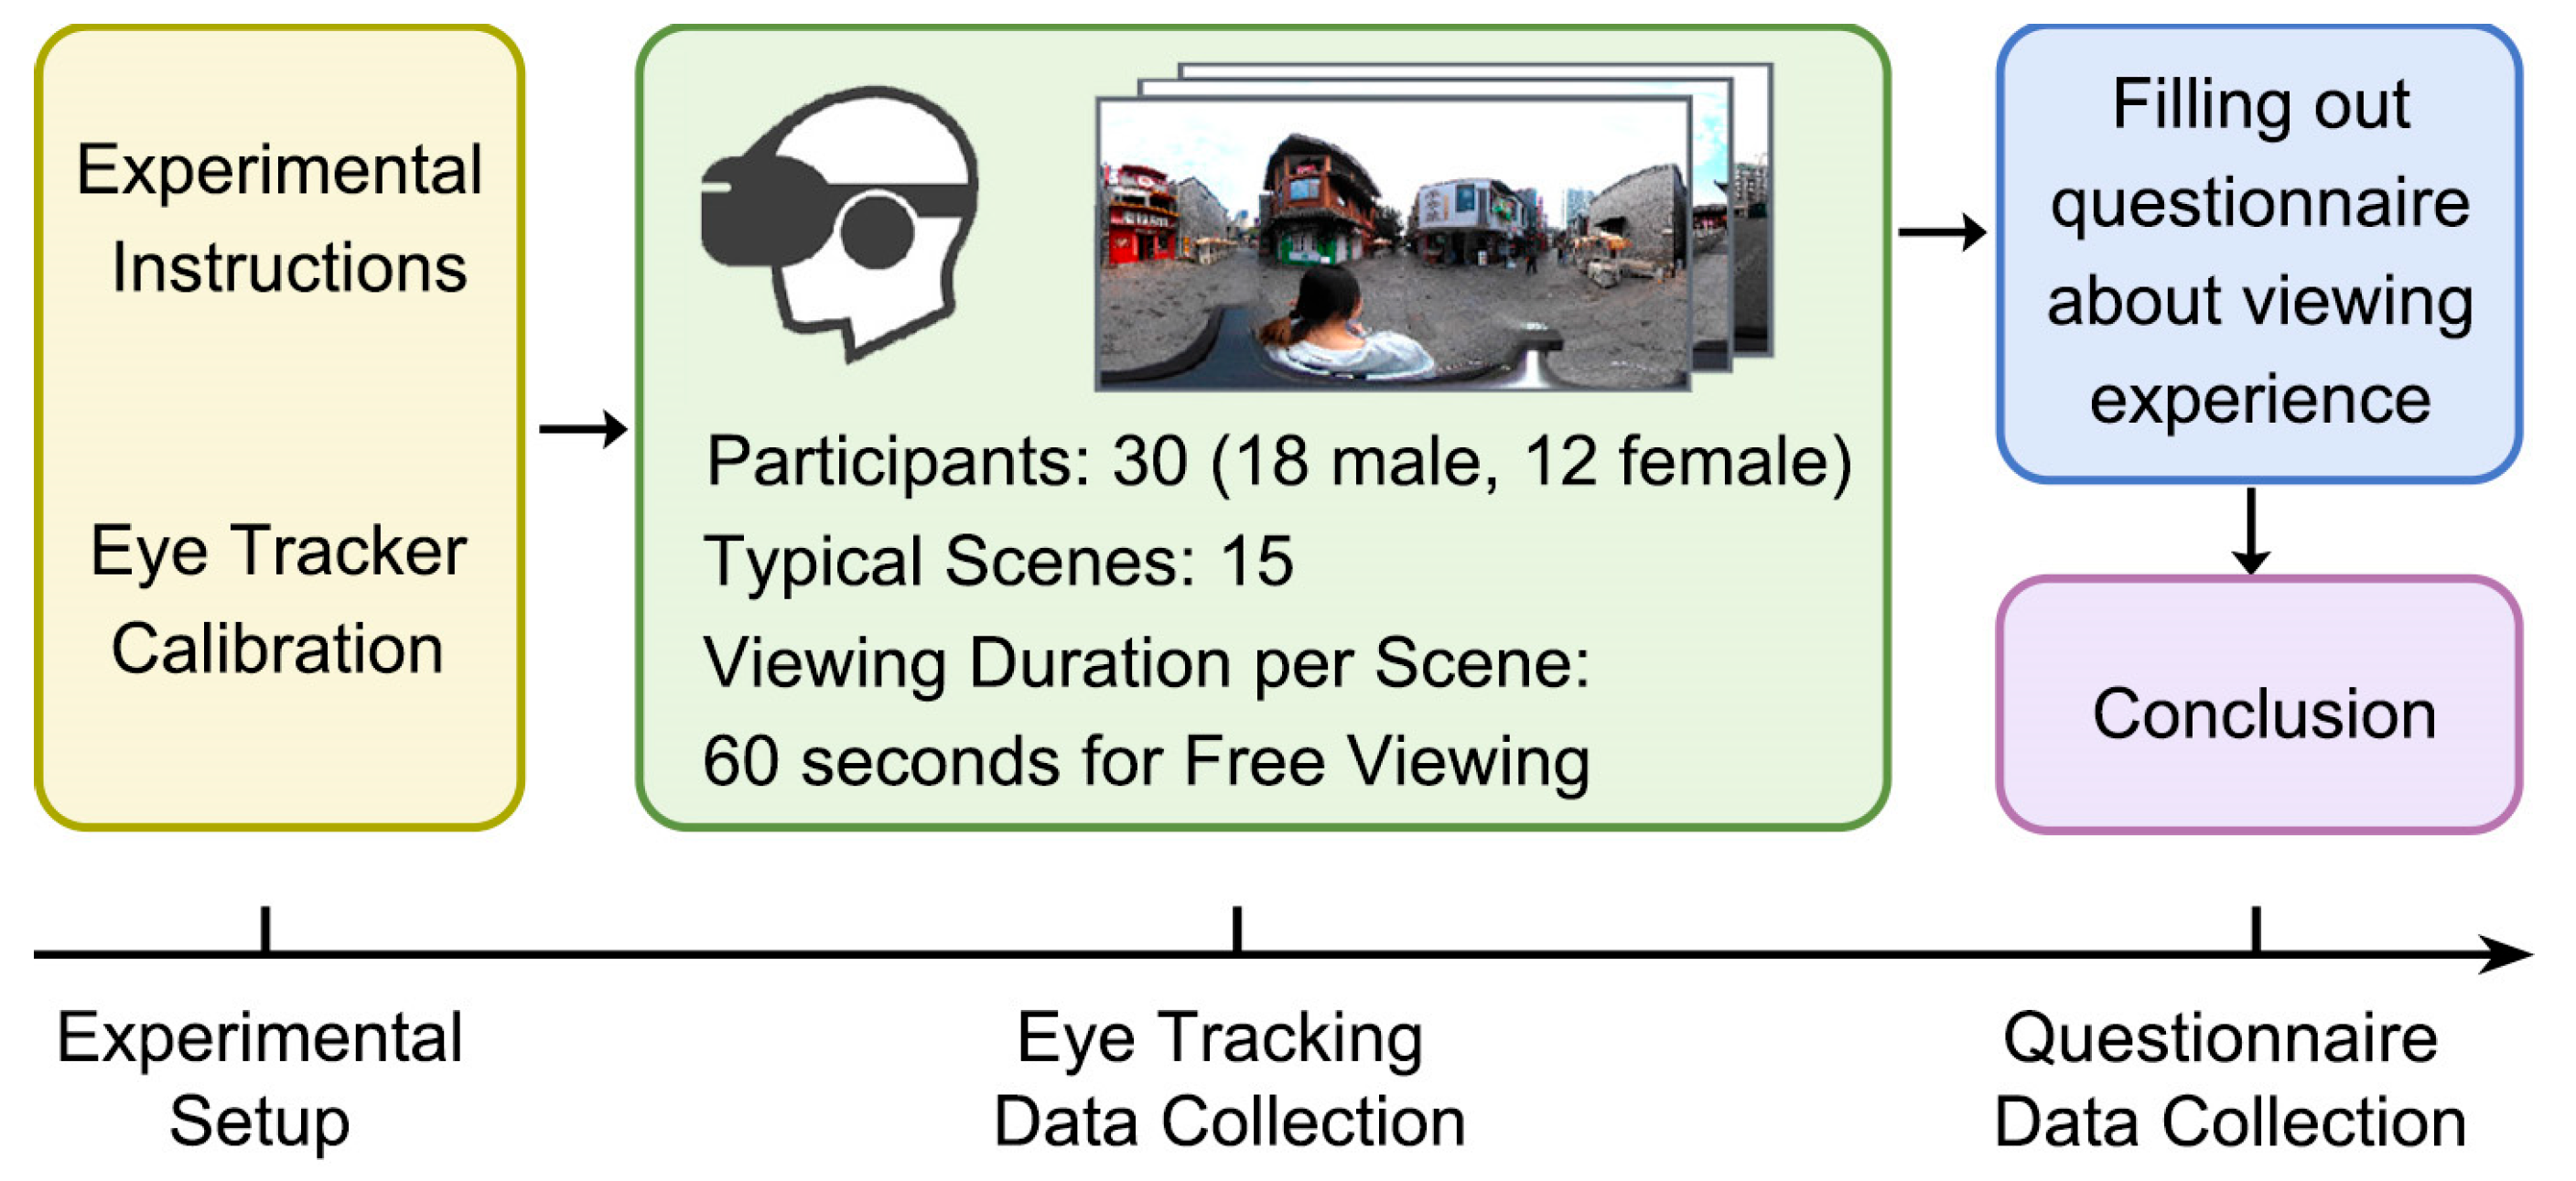
3.4. Tourist Experience Effect
4. Results and Discussion
4.1. Analysis of Space Quality Evaluation
4.2. Analysis of Tourist Experience Results
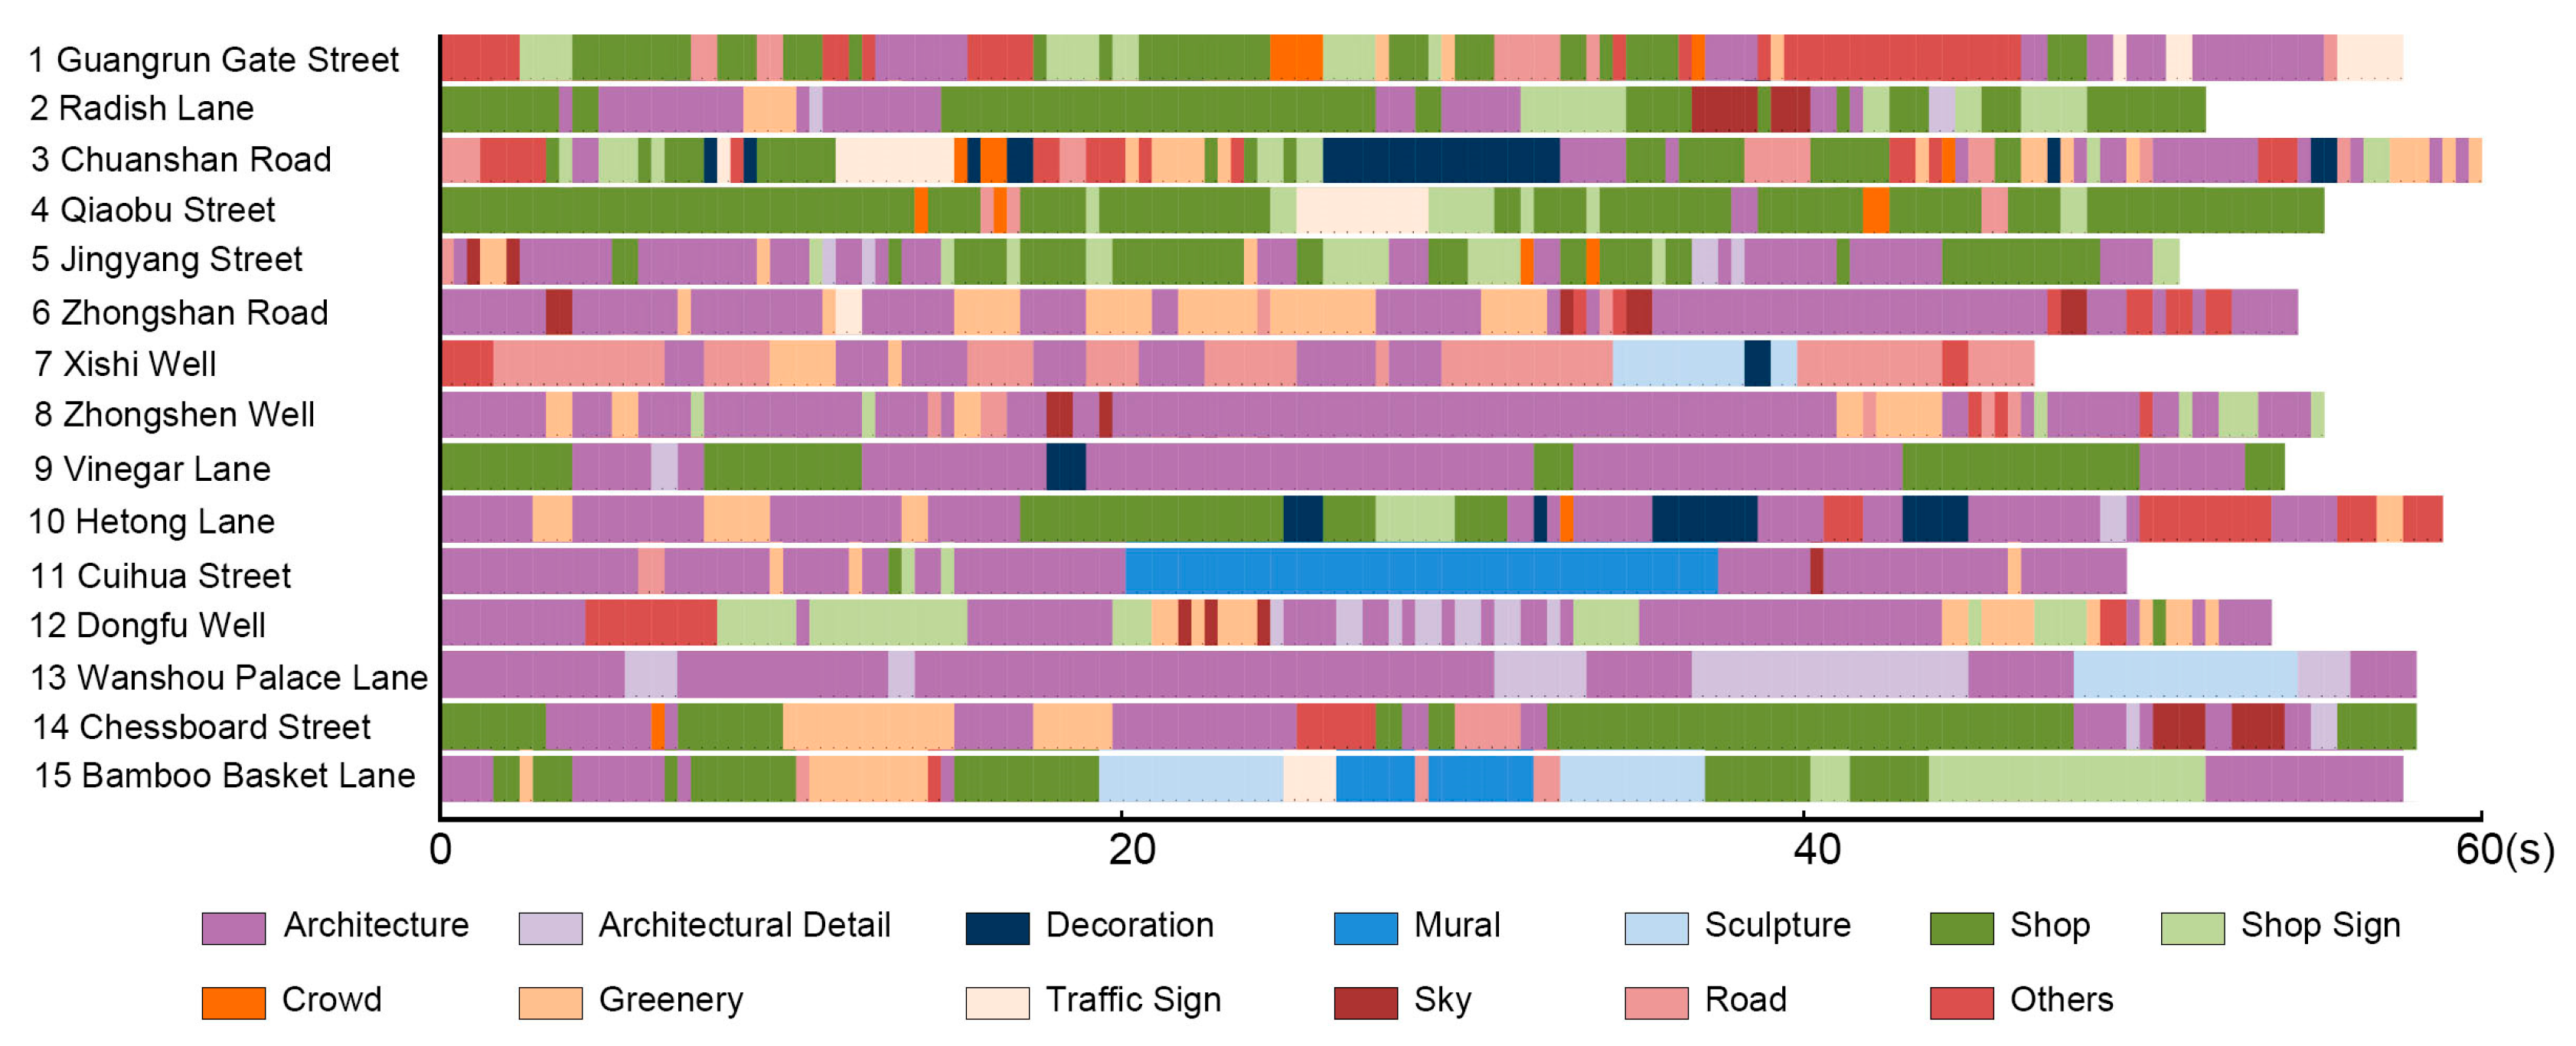
4.2.1. Analysis of the Cognitive Dimension
4.2.2. Analysis of the Affective Dimension
4.2.3. Analysis of the Behavior Dimension
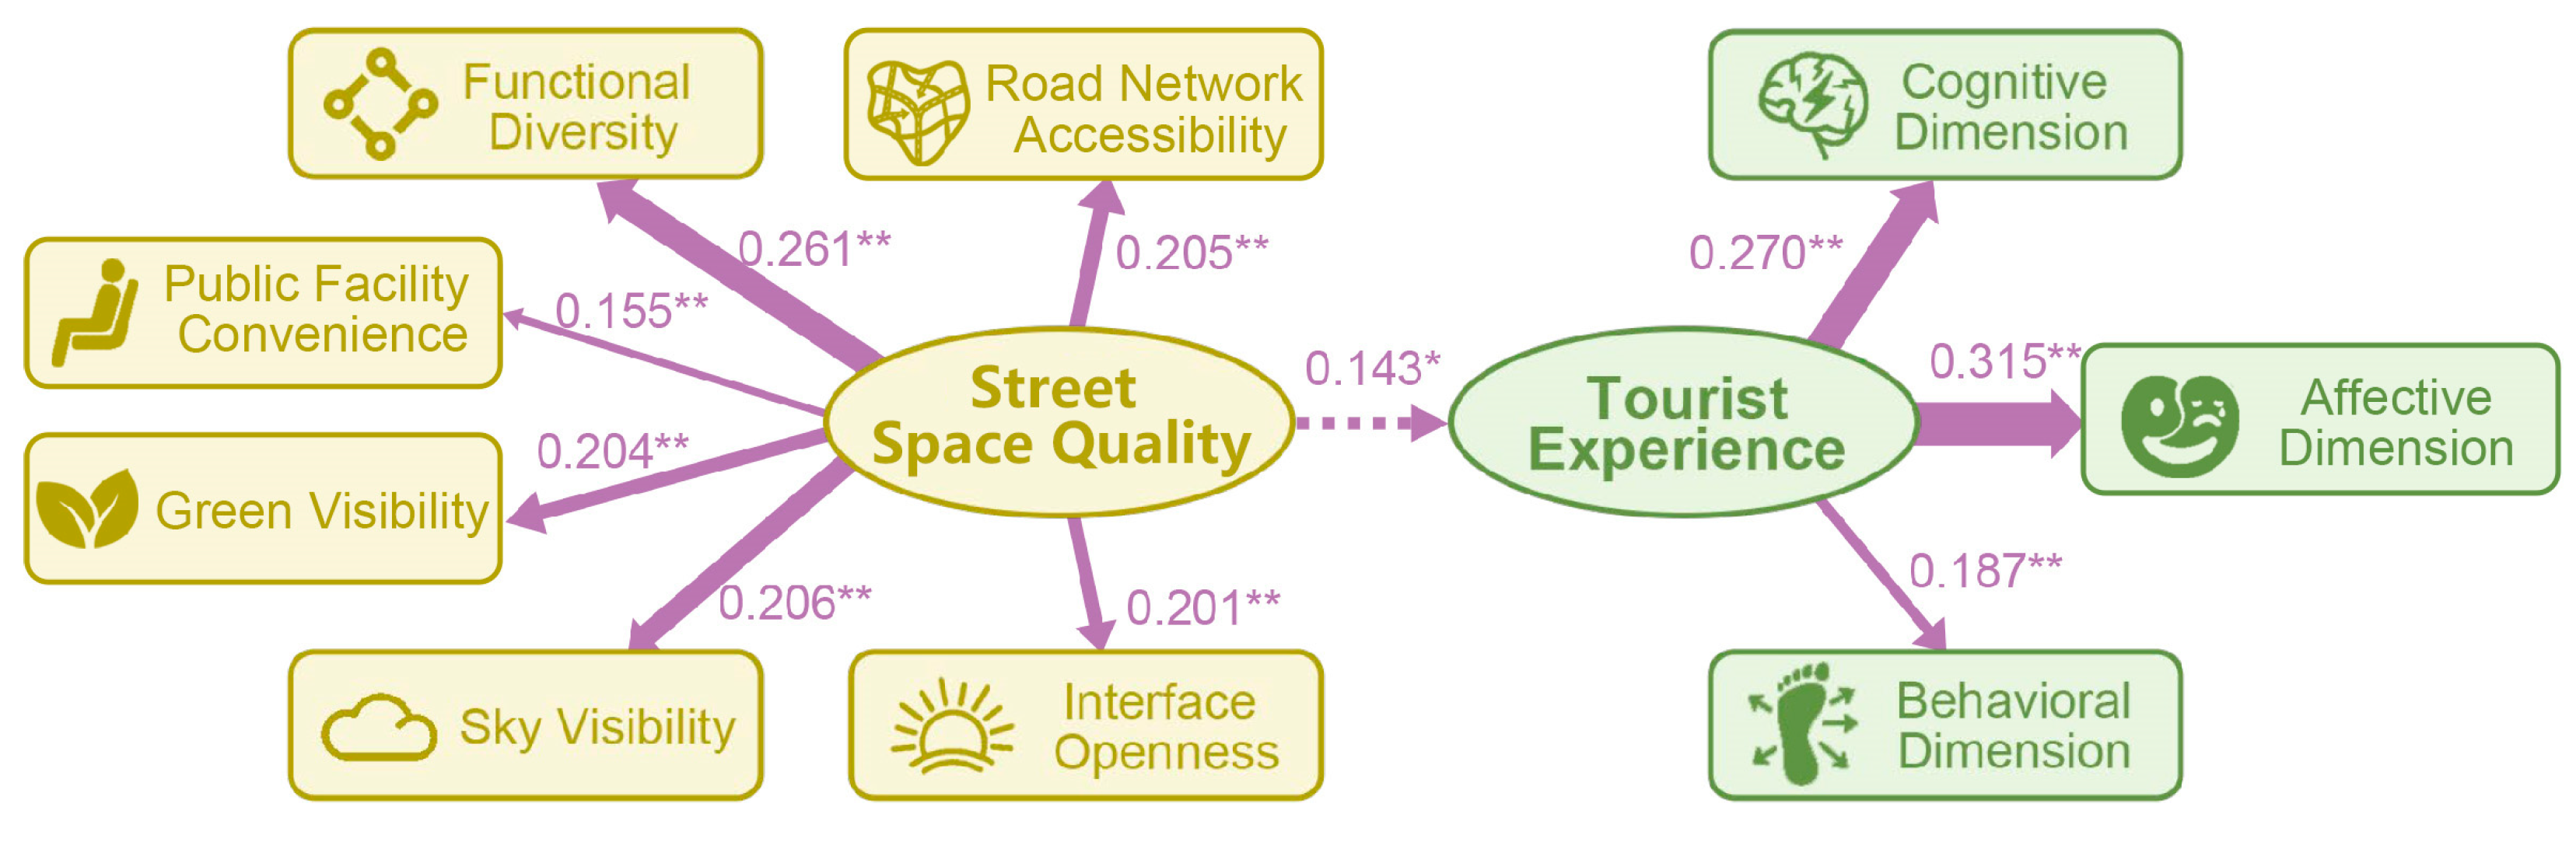
4.3. Space Quality Factors Influencing Tourist Experience
5. Conclusions and Outlook
Author Contributions
Funding
Data Availability Statement
Acknowledgments
Conflicts of Interest
References
- Wu, C.; Li, G.; Li, Y.; Pu, Y.; Zhang, Y. A Review of Research on Strategies and Methods for the Revitalization of Urban Historic Districts. IOP Conf. Ser. Earth Environ. Sci. 2022, 1101, 052021. [Google Scholar] [CrossRef]
- Chen, D. Examining Urban Design Strategies in Historic Districts: A Systematic Literature Review. Proc. Inst. Civ. Eng. Urban Des. Plan. 2024, 177, 232–239. [Google Scholar] [CrossRef]
- Du, X.; Di, W.; Ran, X. Inheritance of Historical Block Context Based on the Theory of Place Spirit: A Case Study of Nanjing Confucius Temple Historic Block. J. Landsc. Res. 2022, 14, 85–89. [Google Scholar]
- Zhang, Y.; Han, Y. Vitality Evaluation of Historical and Cultural Districts Based on the Values Dimension: Districts in Beijing City, China. Herit Sci 2022, 10, 137. [Google Scholar] [CrossRef]
- Accordino, J.; Adhikari, S. Balancing Act: Preserving Historic Fabric and Enhancing Economic Vitality in Towns in the Metropolitan Periphery. Plan. Pract. Res. 2021, 37, 95–110. [Google Scholar] [CrossRef]
- Zhao, Y.; Liu, J.; Zheng, Y. Preservation and Renewal: A Study on Visual Evaluation of Urban Historical and Cultural Street Landscape in Quanzhou. Sustainability 2022, 14, 8775. [Google Scholar] [CrossRef]
- Tiba, A.; Drugaș, M.; Sîrbu, I.; Simona, T.; Bora, C.; Miclăuș, D.; Voss, L.; Sanislav, I.; Ciurescu, D. The ABC Model of Positive Feelings: A Preliminary Test. J. Ration. Emotive Cogn. Behav. Ther. 2025, 43, 14. [Google Scholar] [CrossRef]
- Beck, A.T. A 60-Year Evolution of Cognitive Theory and Therapy. Perspect. Psychol. Sci. 2019, 14, 16–20. [Google Scholar] [CrossRef]
- Baloglu, S.; Brinberg, D. Affective Images of Tourism Destinations. J. Travel Res. 1997, 35, 11–15. [Google Scholar] [CrossRef]
- Wang, Z.; Zhou, Q.; Man, T.; He, L.; He, Y.; Qian, Y. Delineating Landscape Features Perception in Tourism-Based Traditional Villages: A Case Study of Xijiang Thousand Households Miao Village, Guizhou. Sustainability 2024, 16, 5287. [Google Scholar] [CrossRef]
- Zhai, Y.; Gong, R.; Huo, J.; Fan, B. Building Façade Color Distribution, Color Harmony and Diversity in Relation to Street Functions: Using Street View Images and Deep Learning. ISPRS Int. J. Geo-Inf. 2023, 12, 224. [Google Scholar] [CrossRef]
- Cucuzzella, C.; Rahimi, N.; Soulikias, A. The Evolution of the Architectural Façade since 1950: A Contemporary Categorization. Architecture 2023, 3, 1–32. [Google Scholar] [CrossRef]
- Zhao, G.; Ryan, C.; Deng, Z.; Gong, J. Creating a Softening Cultural-Landscape to Enhance Tourist Experiencescapes: The Case of Lu Village. Tour. Manag. Perspect. 2024, 53, 101245. [Google Scholar] [CrossRef]
- Downey, H.; Sherry, J.F. Public Art Tourism: Atmospheric Stories in City Margins. Ann. Tour. Res. 2023, 101, 103606. [Google Scholar] [CrossRef]
- Cai, Y.; Gao, J. Unearthing the Value of Wet Markets from Urban Housing Prices: Evidence from Beijing, China. Habitat Int. 2022, 122, 102532. [Google Scholar] [CrossRef]
- Hu, J.; Miao, L.; Jiang, T.; Chen, C. ‘Yanhuo Chi’: An Everyday Aesthetic Tourism Experience. Ann. Tour. Res. 2024, 109, 103850. [Google Scholar] [CrossRef]
- Zhou, L.; Li, Y.; Cheng, J.; Qin, Y.; Shen, G.; Li, B.; Yang, H.; Li, S. Understanding the Aesthetic Perceptions and Image Impressions Experienced by Tourists Walking along Tourism Trails through Continuous Cityscapes in Macau. J. Transp. Geogr. 2023, 112, 103703. [Google Scholar] [CrossRef]
- Kou, Y.; Xue, X. The Influence of Rural Tourism Landscape Perception on Tourists’ Revisit Intentions—A Case Study in Nangou Village, China. Humanit. Soc. Sci. Commun. 2024, 11, 620. [Google Scholar] [CrossRef]
- Huang, T.; Zhang, Y. ‘Roots’ Tourists’ Personal Heritage Experience: An Extended Cognitive-Affective-Conative Model. J. Hosp. Tour. Manag. 2024, 61, 212–223. [Google Scholar] [CrossRef]
- Liu, H.; Zhang, J.; Jia, Z.; Yan, H. The Impact of Amenities in Rural Bed and Breakfasts on Tourists’ Emotional Experience and Behavioral Intentions: Perspectives from Amenity Theory. Acta Psychol. 2025, 254, 104828. [Google Scholar] [CrossRef]
- Molz, J.G.; Buda, D.-M. Attuning to Affect and Emotion in Tourism Studies. Tour. Geogr. 2022, 24, 187–197. [Google Scholar] [CrossRef]
- Su, L.; Yang, X.; Huang, Y. How Do Tourism Goal Disclosure Motivations Drive Chinese Tourists’ Goal-Directed Behaviors? The Influences of Feedback Valence, Affective Rumination, and Emotional Engagement. Tour. Manag. 2022, 90, 104483. [Google Scholar] [CrossRef]
- Lalicic, L.; Garaus, M. Tourism-Induced Place Change: The Role of Place Attachment, Emotions, and Tourism Concern in Predicting Supportive or Oppositional Behavioral Responses. J. Travel Res. 2022, 61, 202–213. [Google Scholar] [CrossRef]
- Li, X.; Wang, C. Understanding the Relationship between Tourists’ Perceptions of the Authenticity of Traditional Village Cultural Landscapes and Behavioural Intentions, Mediated by Memorable Tourism Experiences and Place Attachment. Asia Pac. J. Tour. Res. 2023, 28, 254–273. [Google Scholar] [CrossRef]
- Li, N.; Meng, F.; Martin, D. The Influence of Travel Photo Editing on Tourists’ Experiences. Tour. Manag. 2023, 98, 104762. [Google Scholar] [CrossRef]
- Chen, X.; Lee, G.; Joo, D. Natural Landscape Performance: Environmental Restorativeness and Its Influence on Tourist Behavior. Int. J. Tour. Res. 2024, 26, e2636. [Google Scholar] [CrossRef]
- Wang, J.; Hu, Y.; Duolihong, W. Diagnosis and Planning Strategies for Quality of Urban Street Space Based on Street View Images. ISPRS Int. J. Geo-Inf. 2023, 12, 15. [Google Scholar] [CrossRef]
- Wojnowska-Heciak, M.; Suchocka, M.; Błaszczyk, M.; Muszyńska, M. Urban Parks as Perceived by City Residents with Mobility Difficulties: A Qualitative Study with In-Depth Interviews. Int. J. Environ. Res. Public Health 2022, 19, 2018. [Google Scholar] [CrossRef] [PubMed]
- Addas, A. Influence of Urban Green Spaces on Quality of Life and Health with Smart City Design. Land 2023, 12, 960. [Google Scholar] [CrossRef]
- LI, S.; Ma, S.; Tong, D.; Jia, Z.; Li, P.; Long, Y. Associations between the Quality of Street Space and the Attributes of the Built Environment Using Large Volumes of Street View Pictures. Environ. Plan. B Urban Anal. City Sci. 2022, 49, 1197–1211. [Google Scholar] [CrossRef]
- Wang, L.; Han, X.; He, J.; Jung, T. Measuring Residents’ Perceptions of City Streets to Inform Better Street Planning through Deep Learning and Space Syntax. ISPRS J. Photogramm. Remote Sens. 2022, 190, 215–230. [Google Scholar] [CrossRef]
- Kim, J.; Nirjhar, E.H.; Kim, J.; Chaspari, T.; Ham, Y.; Winslow, J.F.; Lee, C.; Ahn, C.R. Capturing Environmental Distress of Pedestrians Using Multimodal Data: The Interplay of Biosignals and Image-Based Data. J. Comput. Civ. Eng. 2022, 36, 04021039. [Google Scholar] [CrossRef]
- Kim, J.; Nirjhar, E.H.; Lee, H.; Chaspari, T.; Lee, C.; Ham, Y.; Winslow, J.F.; Ahn, C.R. Location-Based Collective Distress Using Large-Scale Biosignals in Real Life for Walkable Built Environments. Sci. Rep. 2023, 13, 5940. [Google Scholar] [CrossRef]
- Wang, M.; He, Y.; Meng, H.; Zhang, Y.; Zhu, B.; Mango, J.; Li, X. Assessing Street Space Quality Using Street View Imagery and Function-Driven Method: The Case of Xiamen, China. ISPRS Int. J. Geo-Inf. 2022, 11, 282. [Google Scholar] [CrossRef]
- Du, Y.; Huang, W. Evaluation of Street Space Quality Using Streetscape Data: Perspective from Recreational Physical Activity of the Elderly. ISPRS Int. J. Geo-Inf. 2022, 11, 241. [Google Scholar] [CrossRef]
- Wu, W.; Ma, Z.; Guo, J.; Niu, X.; Zhao, K. Evaluating the Effects of Built Environment on Street Vitality at the City Level: An Empirical Research Based on Spatial Panel Durbin Model. Int. J. Environ. Res. Public Health 2022, 19, 1664. [Google Scholar] [CrossRef] [PubMed]
- Ientile, S.; Bianne, G.; Chevalier, C.; Schmidt, F.; Rasol, M.; Orcesi, A.; Adelaide, L.; Nedjar, B. Measuring Road Network Resilience by Loss of Serviceability Index for Critical Road Links. Proc. Inst. Civ. Eng. Bridge Eng. 2022, 175, 160–171. [Google Scholar] [CrossRef]
- Fan, J.; Zheng, B.; Tang, Q.; Zhang, B.; Liu, N. The Changsha Historic Urban Area: A Study on the Changing Accessibility of the Road Network. Appl. Sci. 2022, 12, 2796. [Google Scholar] [CrossRef]
- Ma, S.; Wang, B.; Liu, W.; Zhou, H.; Wang, Y.; Li, S. Assessment of Street Space Quality and Subjective Well-Being Mismatch and Its Impact, Using Multi-Source Big Data. Cities 2024, 147, 104797. [Google Scholar] [CrossRef]
- Liu, B.; Liu, Z.; Fang, L. Innovative Approaches to Assessing Urban Space Quality: A Multi-Source Big Data Perspective on Knowledge Dynamics. J. Knowl. Econ. 2025, 16, 6803–6841. [Google Scholar] [CrossRef]
- Rasoolimanesh, S.M.; Seyfi, S.; Hall, C.M.; Hatamifar, P. Understanding Memorable Tourism Experiences and Behavioural Intentions of Heritage Tourists. J. Destin. Mark. Manag. 2021, 21, 100621. [Google Scholar] [CrossRef]
- Rasoolimanesh, S.M.; Seyfi, S.; Rather, R.A.; Hall, C.M. Investigating the Mediating Role of Visitor Satisfaction in the Relationship between Memorable Tourism Experiences and Behavioral Intentions in Heritage Tourism Context. Tour. Rev. 2021, 77, 687–709. [Google Scholar] [CrossRef]
- Zhu, Z.; Wang, R.; Hu, J. The Elements Identification and Model Construction of Rural Tourism Experience Based on User-Generated Content. Env. Dev Sustain. 2023, 8, 1–22. [Google Scholar] [CrossRef]
- Turkson, P.J.; Amoah, F.; van Eyk, M. Factors Influencing Customer Experience Value in Shopping Malls. J. Contemp. Manag. 2022, 19, 84–107. [Google Scholar] [CrossRef]
- Wang, L.; Ding, J.; Chen, M.; Sun, Y.; Tang, X.; Ge, M. Exploring Tourists’ Multilevel Spatial Cognition of Historical Town Based on Multi-Source Data—A Case Study of Feng Jing Ancient Town in Shanghai. Buildings 2022, 12, 1833. [Google Scholar] [CrossRef]
- Li, R.; Li, Y.-Q.; Liu, C.-H.; Ruan, W.-Q. How to Create a Memorable Night Tourism Experience: Atmosphere, Arousal and Pleasure. Curr. Issues Tour. 2022, 25, 1817–1834. [Google Scholar] [CrossRef]
- Sun, P.; Huang, S.; Yap, G. The Impact of Holiday Tourism Development on Tourism Total Factor Productivity: Evidence from China. Tour. Manag. Perspect. 2022, 43, 100993. [Google Scholar] [CrossRef]
- Hu, J.; Fan, T.; Tang, X.; Yang, Z.; Ren, Y. Nonlinear Relations of Urban Morphology to Thermal Anomalies: A Cross-Time Comparative Study Based on Grad-CAM and SHAP. Ecol. Indic. 2024, 162, 112024. [Google Scholar] [CrossRef]
- Zhang, Y.; Zhu, Y.; Liu, J.; Yu, W.; Jiang, C. An Interpretability Optimization Method for Deep Learning Networks Based on Grad-CAM. IEEE Internet Things J. 2025, 12, 3961–3970. [Google Scholar] [CrossRef]
- Zhang, J.; Li, Y.; Fukuda, T.; Wang, B. Urban Safety Perception Assessments via Integrating Multimodal Large Language Models with Street View Images. Cities 2025, 165, 106122. [Google Scholar] [CrossRef]
- Xia, Y.; Yabuki, N.; Fukuda, T. Development of a System for Assessing the Quality of Urban Street-Level Greenery Using Street View Images and Deep Learning. Urban For. Urban Green. 2021, 59, 126995. [Google Scholar] [CrossRef]
- Li, Y.; Yabuki, N.; Fukuda, T. Integrating GIS, Deep Learning, and Environmental Sensors for Multicriteria Evaluation of Urban Street Walkability. Landsc. Urban Plan. 2023, 230, 104603. [Google Scholar] [CrossRef]
- Wang, Z.; Shen, M.; Huang, Y. Combining Eye-Tracking Technology and Subjective Evaluation to Determine Building Facade Color Combinations and Visual Quality. Appl. Sci. 2024, 14, 8227. [Google Scholar] [CrossRef]
- Xing, Y.; Leng, J. Evaluation of Public Space in Traditional Villages Based on Eye Tracking Technology. J. Asian Archit. Build. Eng. 2024, 23, 125–139. [Google Scholar] [CrossRef]
- Zheng, S.; Zhang, J.; Zu, R.; Li, Y. Visual Perception Differences and Spatiotemporal Analysis in Commercialized Historic Streets Based on Mobile Eye Tracking: A Case Study in Nanchang Wanshou Palace, China. Buildings 2024, 14, 1899. [Google Scholar] [CrossRef]
- Beibei, Z.; Omar, A. A Study on the Rural Tourscape and Immersion Experience of Customers Based on UGC Metadata. Glob. Bus. Manag. Res. Int. J. 2024, 16, 1147–1169. [Google Scholar]
- Cuomo, M.T.; Tortora, D.; Foroudi, P.; Giordano, A.; Festa, G.; Metallo, G. Digital Transformation and Tourist Experience Co-Design: Big Social Data for Planning Cultural Tourism. Technol. Forecast. Soc. Change 2021, 162, 120345. [Google Scholar] [CrossRef]


| Environmental Elements | Percentage of Attention | ||
|---|---|---|---|
| Architectural Landscape | Architecture | 38.4% | 41.6% |
| Architectural Details | 3.2% | ||
| Artistic Landscape | Decoration | 2.3% | 7.6% |
| Mural | 2.8% | ||
| Sculpture | 2.5% | ||
| Living Landscape | Shop | 22.7% | 29.9% |
| Shop Sign | 7.2% | ||
| Public Landscape | Crowd | 0.8% | 8.9% |
| Greenery | 6.5% | ||
| Traffic Sign | 1.6% | ||
| Non-landscape Elements | Sky | 1.5% | 12.0% |
| Road | 5.3% | ||
| Others | 5.2% | ||
| Cognitive Entry | TF-IDF | Affective Entry | TF-IDF | Behavioral Entry | TF-IDF |
|---|---|---|---|---|---|
| Wanshou Palace | 0.08636 | Bustling | 0.04370 | Walking | 0.06519 |
| Historic Building | 0.04549 | Crowded | 0.04147 | Visiting Landmark | 0.06015 |
| Commercial Street | 0.04112 | Good | 0.03724 | Visiting a Night Market | 0.05318 |
| Delicacies | 0.03894 | Delicious | 0.03191 | Snacking | 0.04573 |
| Social Media Popular Shop | 0.02637 | Unique | 0.03103 | Taking Photos | 0.03647 |
| Subway | 0.02123 | Worthwhile | 0.02298 | Drinking Tea | 0.03455 |
| Night View | 0.02098 | Good-looking | 0.01955 | Show | 0.02715 |
| Taoism | 0.01470 | Convenient | 0.01656 | Singing | 0.02693 |
| Parking Lot | 0.01256 | Expensive | 0.01487 | Buying Cultural | 0.01185 |
| Temple | 0.00833 | Commercialized | 0.01130 | Sitting Quietly | 0.00872 |
| Zhongshan Road | 0.00723 | Enjoyable | 0.00842 | Listening to a Guided Tour | 0.00691 |
| Xu Xun | 0.00617 | Average | 0.00826 | Burning Incense and Praying | 0.00642 |
| AdaptationIndex | CMIN/DF | GFI | AGFI | NFI | RFI | IFI | TLI | CFI | RMSEA |
|---|---|---|---|---|---|---|---|---|---|
| Frontage Standard | <3 | >0.8 | >0.8 | >0.9 | >0.9 | >0.9 | >0.9 | >0.9 | <0.08 |
| Numerical Value | 1.375 | 0.994 | 0.982 | 0.993 | 0.987 | 0.998 | 0.996 | 0.998 | 0.029 |
| Matching Degree | Excellent | ||||||||
Disclaimer/Publisher’s Note: The statements, opinions and data contained in all publications are solely those of the individual author(s) and contributor(s) and not of MDPI and/or the editor(s). MDPI and/or the editor(s) disclaim responsibility for any injury to people or property resulting from any ideas, methods, instructions or products referred to in the content. |
© 2025 by the authors. Licensee MDPI, Basel, Switzerland. This article is an open access article distributed under the terms and conditions of the Creative Commons Attribution (CC BY) license (https://creativecommons.org/licenses/by/4.0/).
Share and Cite
Huang, D.; Gong, W.; Wang, X.; Liu, S.; Zhang, J.; Li, Y. A Cognition–Affect–Behavior Framework for Assessing Street Space Quality in Historic Cultural Districts and Its Impact on Tourist Experience. Buildings 2025, 15, 2739. https://doi.org/10.3390/buildings15152739
Huang D, Gong W, Wang X, Liu S, Zhang J, Li Y. A Cognition–Affect–Behavior Framework for Assessing Street Space Quality in Historic Cultural Districts and Its Impact on Tourist Experience. Buildings. 2025; 15(15):2739. https://doi.org/10.3390/buildings15152739
Chicago/Turabian StyleHuang, Dongsheng, Weitao Gong, Xinyang Wang, Siyuan Liu, Jiaxin Zhang, and Yunqin Li. 2025. "A Cognition–Affect–Behavior Framework for Assessing Street Space Quality in Historic Cultural Districts and Its Impact on Tourist Experience" Buildings 15, no. 15: 2739. https://doi.org/10.3390/buildings15152739
APA StyleHuang, D., Gong, W., Wang, X., Liu, S., Zhang, J., & Li, Y. (2025). A Cognition–Affect–Behavior Framework for Assessing Street Space Quality in Historic Cultural Districts and Its Impact on Tourist Experience. Buildings, 15(15), 2739. https://doi.org/10.3390/buildings15152739