Article

Intelligent ESG Evaluation for Construction Enterprises in China: An LLM-Based Model

School of Management, Fujian University of Technology, Fuzhou 350118, China
*
Author to whom correspondence should be addressed.
Buildings 2025, 15(15), 2710; https://doi.org/10.3390/buildings15152710 (registering DOI)
Submission received: 5 July 2025 / Revised: 26 July 2025 / Accepted: 29 July 2025 / Published: 31 July 2025

Abstract

Environmental, social, and governance (ESG) evaluation has become increasingly critical for company sustainability assessments, especially for enterprises in the construction industry with a high environmental burden. However, existing methods face limitations in subjective evaluation, inconsistent ratings across agencies, and a lack of industry-specificity. To address these limitations, this study proposes a large language model (LLM)-based intelligent ESG evaluation model specifically designed for the construction enterprises in China. The model integrates three modules: (1) an ESG report information extraction module utilizing natural language processing and Chinese pre-trained language models to identify and classify ESG-relevant statements; (2) an ESG rating prediction module employing XGBoost regression with SHAP analysis to predict company ratings and quantify individual statement contributions; and (3) an ESG intelligent evaluation module combining knowledge graph construction with fine-tuned Qwen2.5 language models using Chain-of-Thought (CoT). Empirical validation demonstrates that the model achieves 93.33% accuracy in the ESG rating classification and an R2 score of 0.5312. SHAP analysis reveals that environmental factors contribute most significantly to rating predictions (38.7%), followed by governance (32.0%) and social dimensions (29.3%). The fine-tuned LLM integrated with knowledge graph shows improved evaluation consistency, achieving 65% accuracy compared to 53.33% for standalone LLM approaches, constituting a relative improvement of 21.88%. This study contributes to the ESG evaluation methodology by providing an objective, industry-specific, and interpretable framework that enhances rating consistency and provides actionable insights for enterprise sustainability improvement. This research provides guidance for automated and intelligent ESG evaluations for construction enterprises while addressing critical gaps in current ESG practices.

1. Introduction

As sustainability receives growing attention globally, environmental, social, and governance (ESG) evaluation has emerged as a critical framework for assessing enterprise sustainability performance and long-term value creation. The global ESG investment market has experienced unprecedented growth, with assets under management exceeding USD 30 trillion globally [1]. The public focus on enterprises’ non-financial information has significantly intensified, driving investors to integrate ESG ratings into their investment processes [2,3,4]. Beyond informing investment decisions, ESG ratings drive company performance improvements [5] while incentivizing green innovation [6]. Companies with superior and improved ESG performance gain competitive advantages, fostering long-term value creation [7]. This shift is especially evident in China, where the government’s commitment to achieving carbon neutrality by 2060 and carbon peak by 2030 has catalyzed comprehensive ESG integration across industries. A-share listed companies have increasingly recognized the significance of ESG performance in demonstrating their sustainability capabilities, with the number of companies publishing ESG reports growing from 371 in 2009 to 2469 in 2025. The construction industry provides 6.67% of the gross domestic product in 2024, representing a significant component of China’s economy. However, these enterprises currently face substantial challenges in ESG disclosure that are significantly more complex than those of other industries [8,9]. The construction sector accounts for 37% of global greenhouse gas emissions, making it the largest emitter compared to other sectors [10]. The industry also faces disproportionately high social risks, with workplace safety concerns that include 1075 deaths in 2023 (the highest fatalities across all sectors [11]) and approximately 78,000 workers affected by work-related ill-health between fiscal years 2021/2022 and 2023/2024 [12]. These concerning safety records create obstacles for companies seeking to improve employee well-being and performance [13]. Unlike other industries with stable organizational structures, construction’s project-based nature and complex subcontracting arrangements intensify legal compliance risks and create heightened governance requirements for effective ESG implementation [14]. These governance challenges result in characteristically low ESG disclosure rates and poor ratings, which in turn create a negative feedback loop that further undermines construction companies’ motivation to actively participate in ESG reporting initiatives [15,16,17].
Current ESG ratings suffer from accuracy limitations due to heavy reliance on manual assessments by external agencies. This methodological limitation manifests in several critical ways. First, substantial variations exist among rating institutions regarding data collection sources, analytical frameworks [18], and information transparency levels [19,20]. Rating agencies frequently assign divergent scores to the same company [21], with correlations between ESG ratings ranging from 0.38 to 0.71 [22], indicating significant inconsistency in evaluation outcomes. Second, the standardization of ESG metrics remains underdeveloped, leading to a subjective interpretation of qualitative indicators and inconsistent weighting of environmental, social, and governance factors across different rating systems. Third, geographic and cultural biases embedded in rating methodologies may inadequately capture the ESG realities of emerging markets like China. Moreover, rating criteria should be industry-specific to account for sectoral differences [23]. For instance, construction companies face distinct ESG considerations, including carbon-intensive materials, worker safety protocols, green construction practices, and green building certifications that differ markedly from those in technology or financial services sectors. Therefore, there is a pressing need to develop an intelligent, objective, and industry-specific ESG evaluation model tailored to the characteristics of Chinese construction companies.
These limitations have been addressed in some previous studies. Studies regarding evaluation system improvements have focused on reconstructing and enhancing ESG assessment frameworks. Escrig-Olmedo et al. [24] conducted comprehensive evaluations of ESG rating agencies themselves, revealing how different agencies integrate sustainability principles and exposing methodological inconsistencies that contribute to rating disparities. Lou et al. [25] systematically reconstructed sustainable supplier evaluation criteria based on ESG requirements, identifying critical gaps between existing evaluation systems and regulatory demands. da Cunha et al. [26] and Yu et al. [27] developed comprehensive frameworks for ESG assessments, addressing measurement fragmentation through systematic reviews and multi-criteria decision-making approaches, respectively. Lee et al. [28] and Li et al. [29] developed industry-specific ESG evaluation approaches for container shipping and emerging sectors, respectively, demonstrating the necessity of sector-tailored assessment criteria.
Regarding computational methodology advancements, researchers have utilized traditional NLP techniques for ESG text analysis. Kang and Kim [30] and Schimanski et al. [31] demonstrated the potential of automated text processing for ESG assessments through an analysis of sustainability reports and company communications. Fischbach et al. [32] developed automated ESG assessment frameworks by mining media coverage data. Building on traditional NLP approaches, researchers have adopted more sophisticated pre-trained language models, with Zhang et al. [33] and Lee et al. [34] developing E-BERT and ESG2PreEM models, respectively, for an enhanced ESG-specific text analysis. The emergence of the large language model (LLM) has opened new possibilities for ESG evaluation. Bronzini et al. [35] derived structured insights from sustainability reports using large language models, demonstrating the capability of LLMs to extract meaningful information from complex sustainability documents. Shimamura et al. [36] evaluated the impact of report readability on ESG scores using a generative AI approach, revealing how document complexity affects ESG assessments. Wang [37] employed a generative AI-assisted evaluation of ESG practices in ESG ratings.
Although existing research has enhanced the transparency of ESG reporting, it lacks systematic evaluation mechanisms targeting the content of individual company reports, which are essential for guiding and enhancing companies’ internal ESG practices. To address this gap, this study proposes an LLM-based intelligent ESG evaluation model specifically designed from a Chinese construction industry perspective. This model includes three modules. The first is an ESG report information extraction module. Based on construction companies’ ESG reports, this module develops a model for extracting key ESG initiatives disclosed in construction companies’ reports by leveraging natural language processing techniques combined with an LLM. The model specifically identifies ESG key elements relevant to the construction industry, thereby establishing a more industry-adaptive ESG evaluation framework. The second is an ESG rating prediction module. Using machine learning methods, this module analyzes construction companies’ ESG information from different rating agencies’ perspectives and constructs predictive models to assess companies’ ESG ratings. The models predict ratings while analyzing how disclosures influence results, identifying key ESG drivers and enabling performance optimization. The third is an ESG intelligent evaluation module. This module constructs an ESG report sentence evaluation dataset to fine-tune an intelligent ESG evaluation LLM for construction companies. This provides construction companies with an ESG evaluation and recommendations, helping companies manage their ESG performance more effectively. This study aims to develop scientific evaluation methods and intelligent tools for construction companies’ ESG performance assessment, promoting sustainable development in the construction industry and enhancing their competitiveness in third-party ESG evaluations.
The rest of the paper is organized as follows: The model is described in detail in Section 2. Section 3 presents the data-based prototype development. The results are presented in Section 4 and discussed in Section 5. Finally, Section 6 concludes the study and outlines limitations.

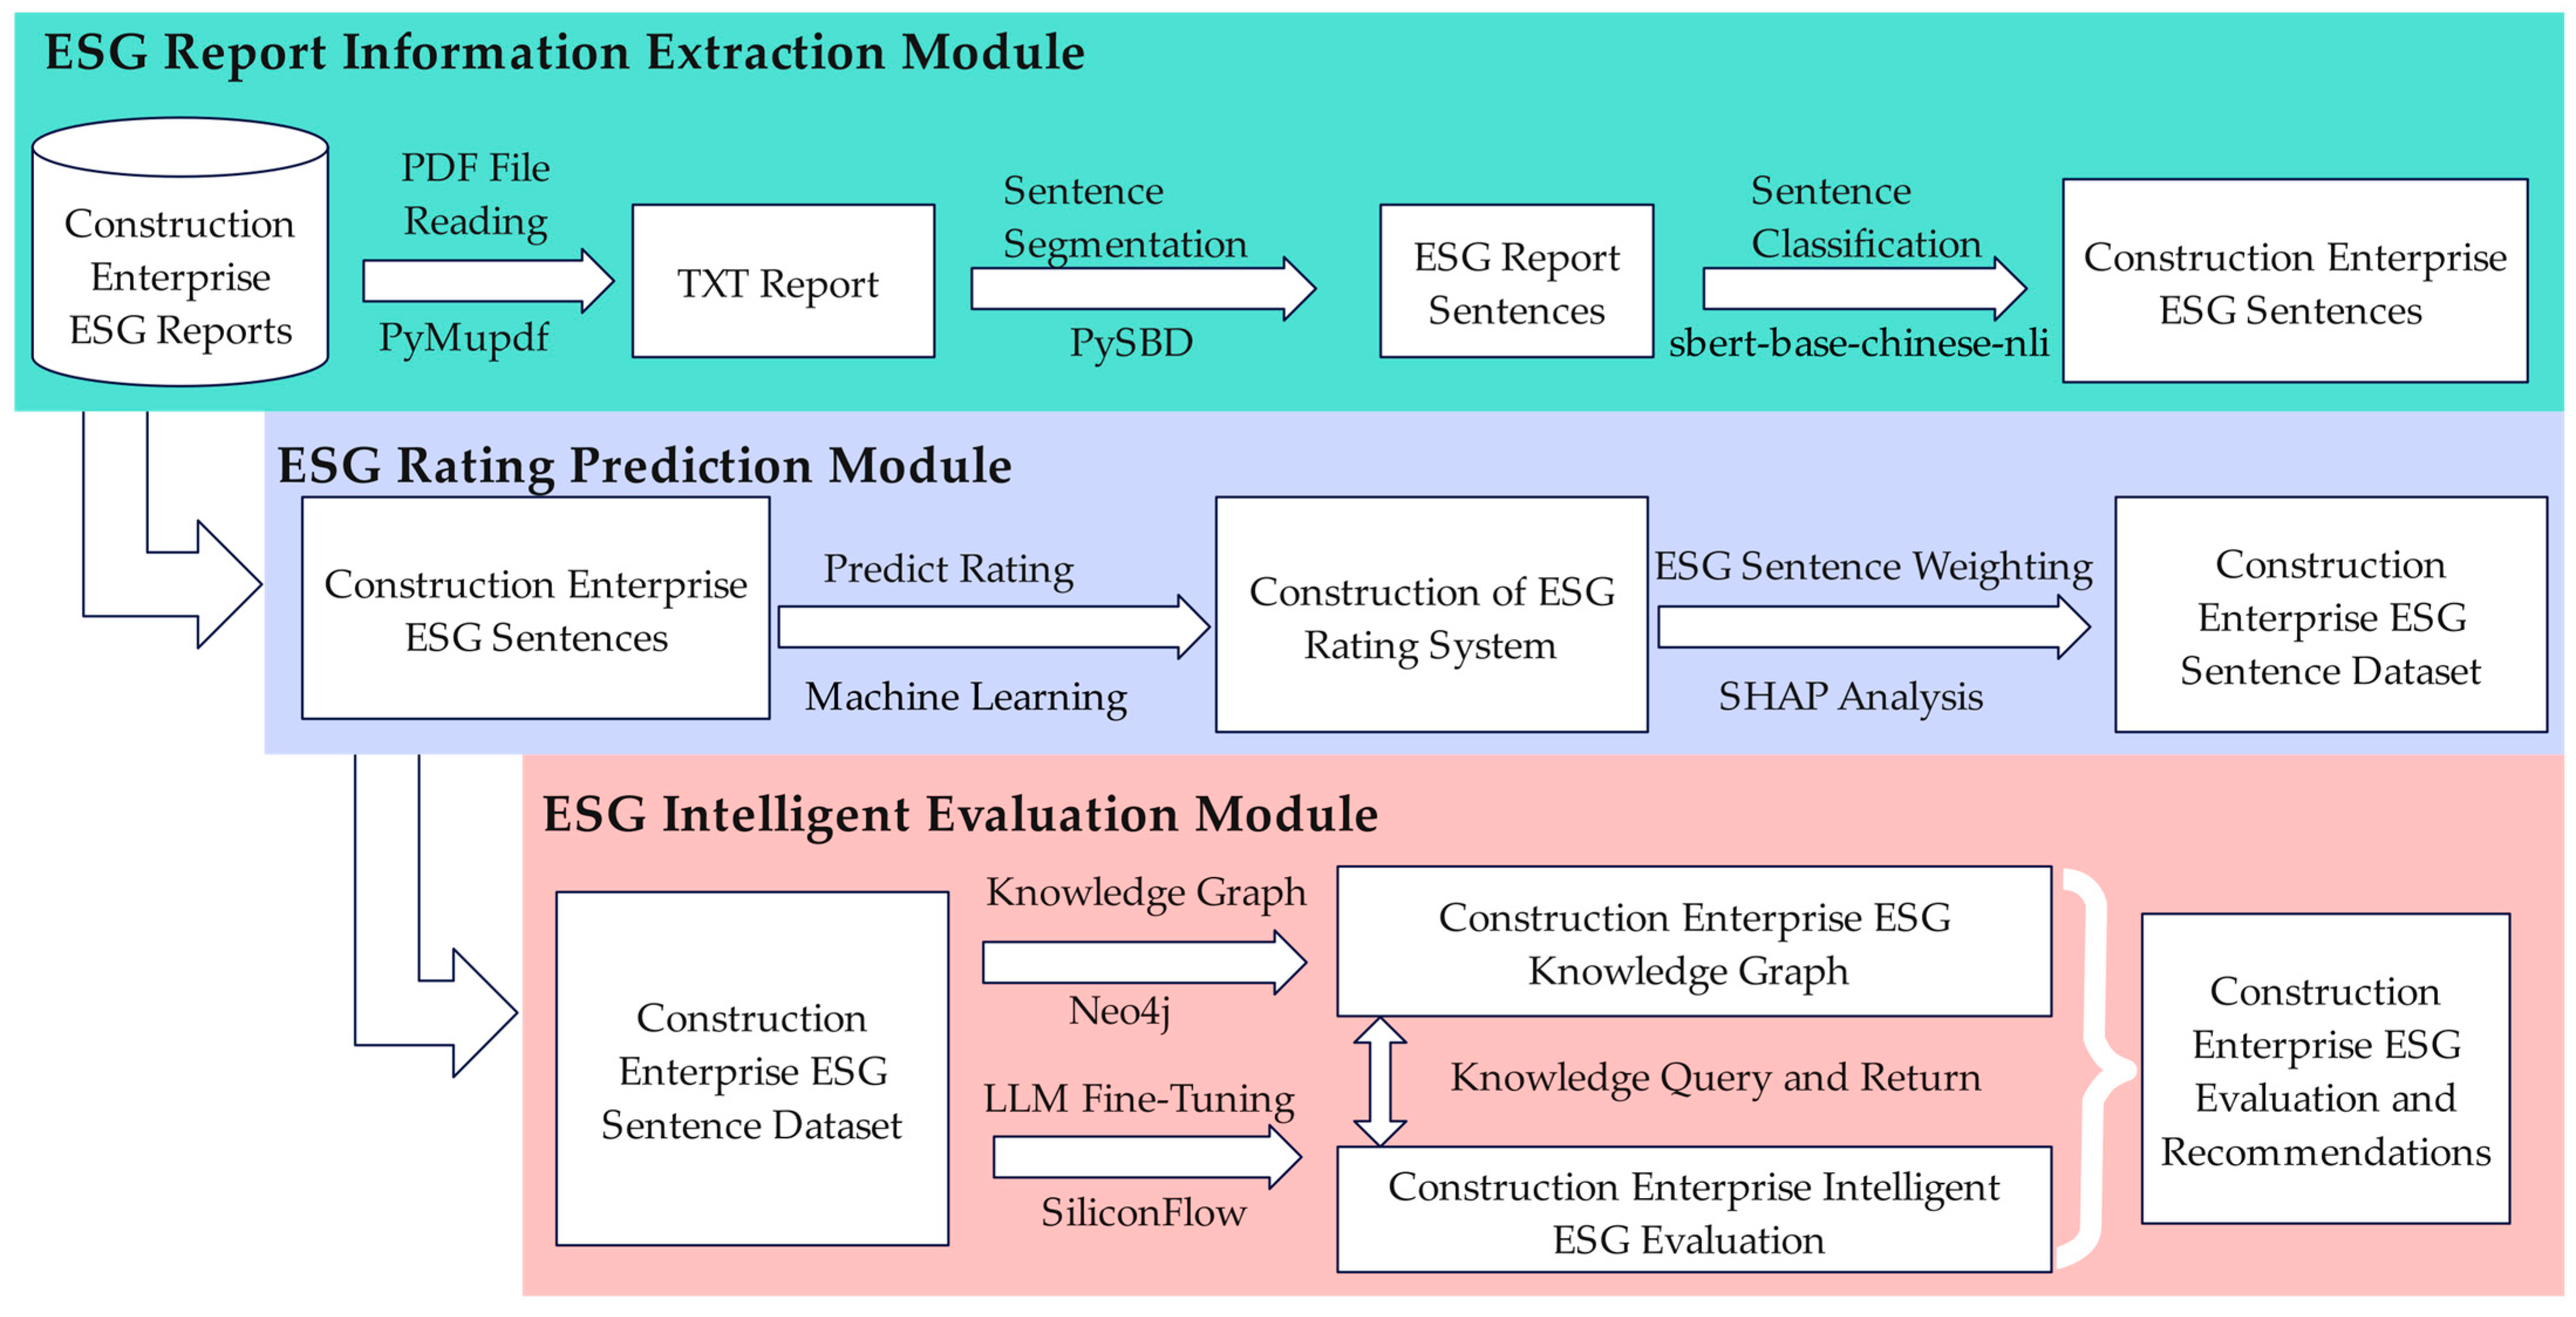
2. LLM-Based Intelligent ESG Evaluation Model

This section introduces the overall framework, component modules, and implementation methods of the LLM-based ESG intelligent evaluation model proposed in this study, as illustrated in Figure 1. The model comprises three key modules: an ESG report information extraction module, an ESG rating prediction module, and an ESG intelligent evaluation module.

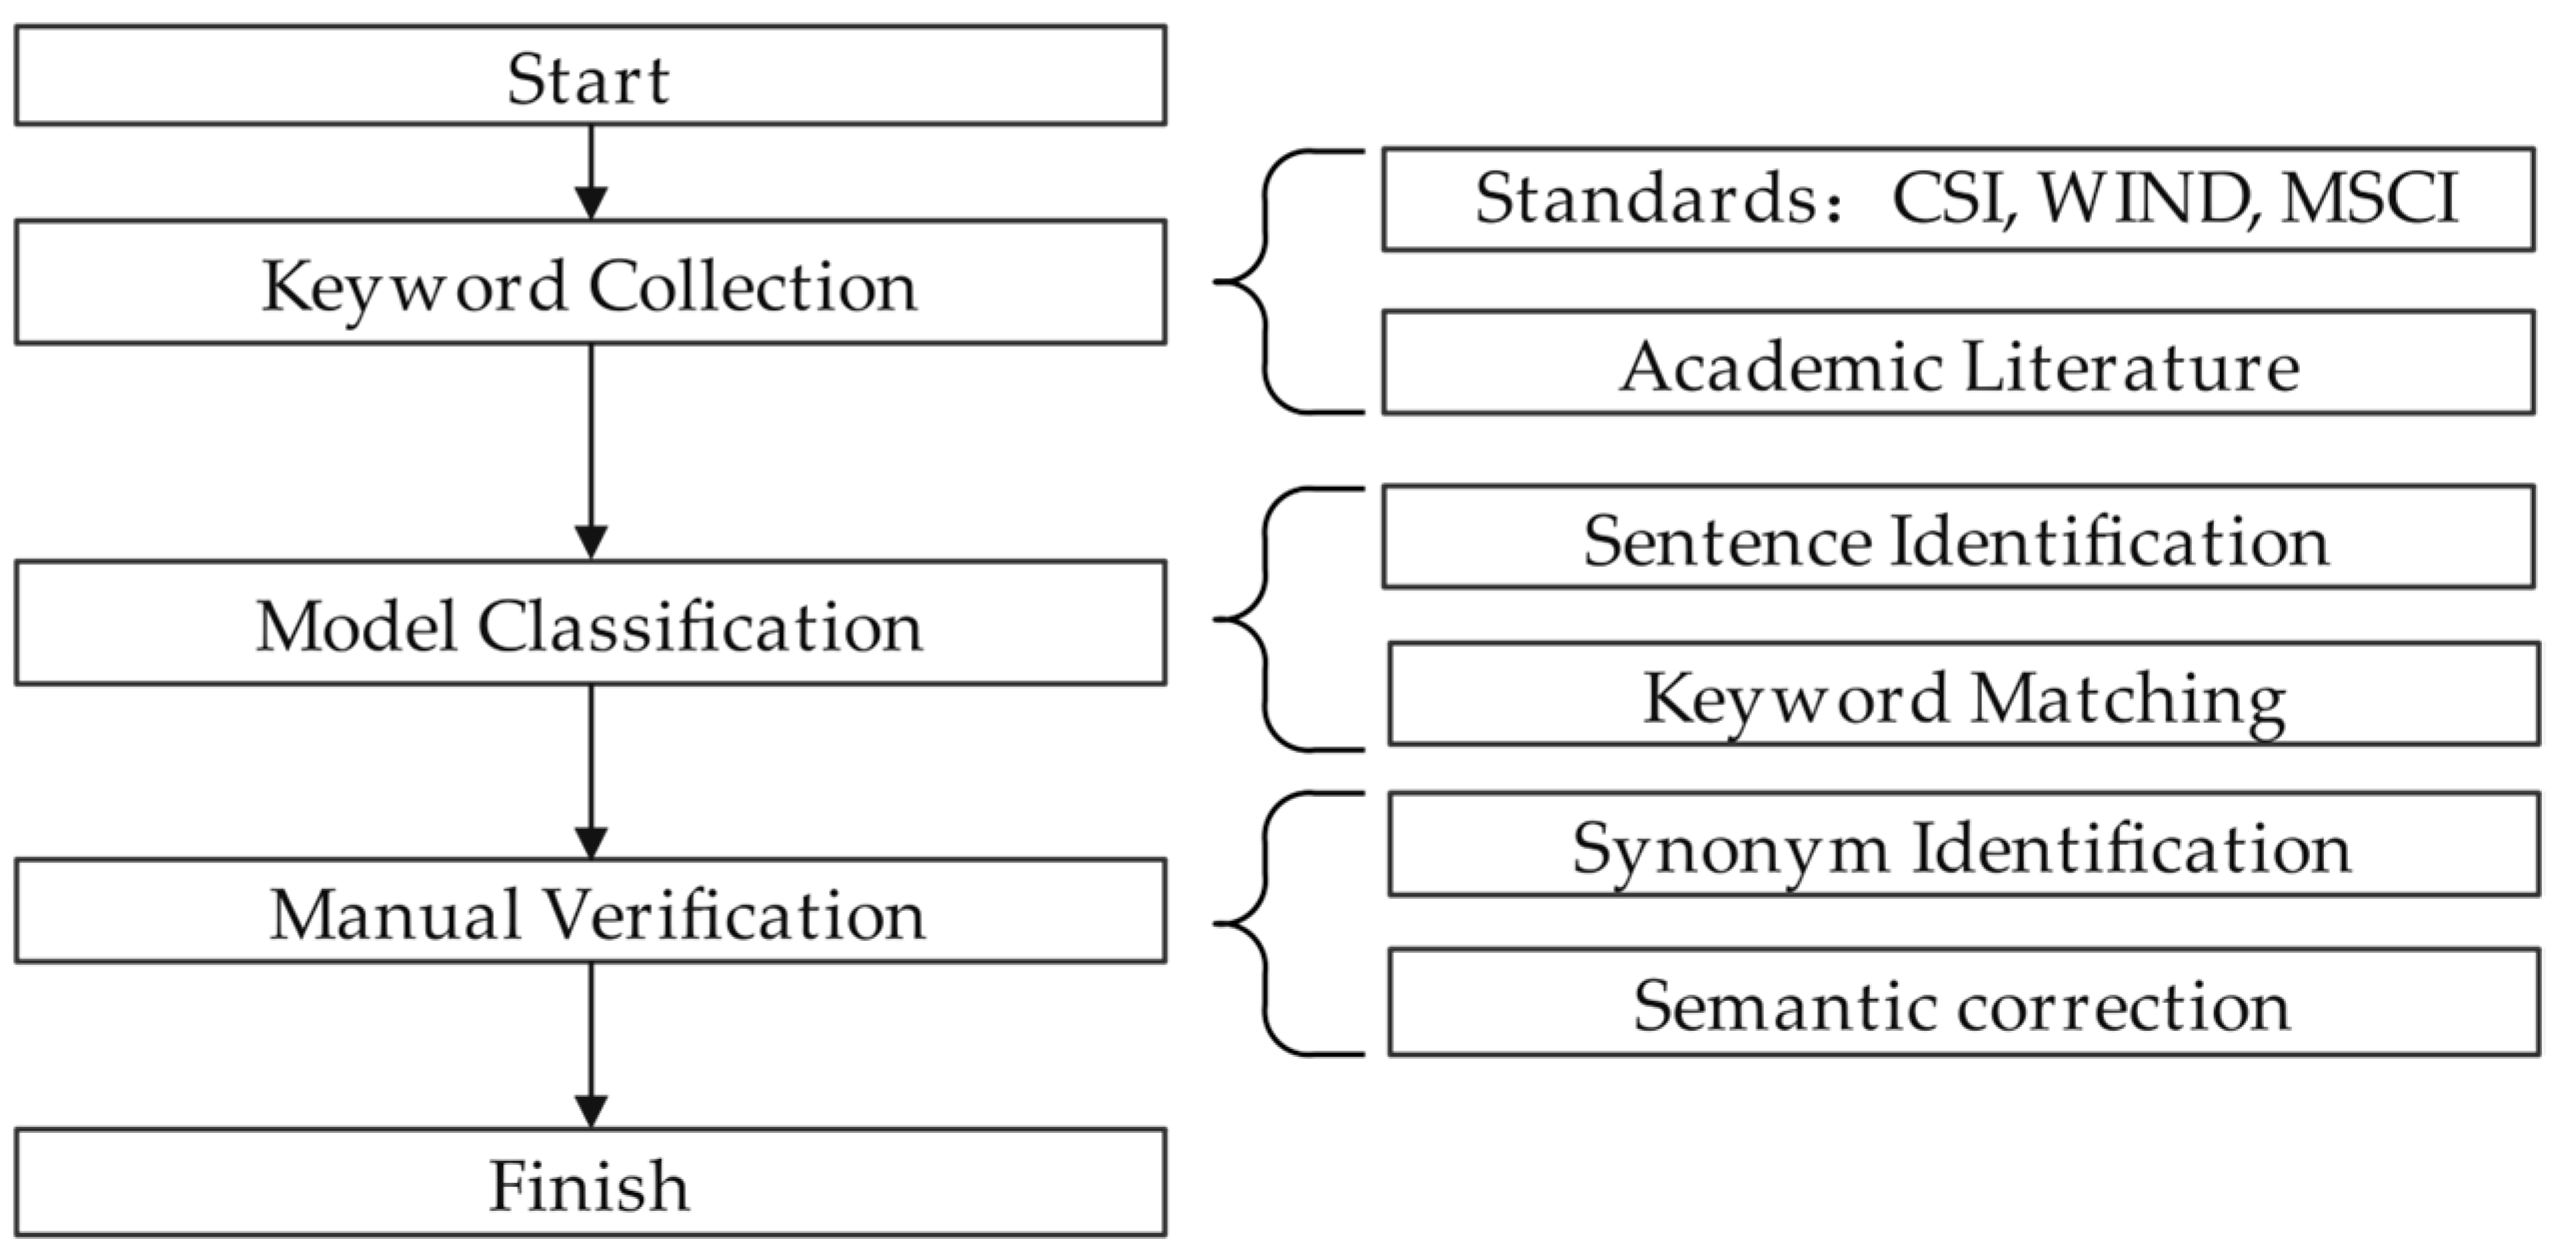
2.1. ESG Report Information Extraction Module

First, ESG reports disclosed by construction companies are obtained from listed companies and related financial websites. Since ESG reports typically contain large amounts of unstructured textual data and are published in PDF format, a PDF parser (PyMuPDF) is employed to convert reports into TXT format. Before data processing, text preprocessing is conducted, including the removal of irrelevant characters, punctuation marks, redundant spaces, and stop words [38].
Second, given that Chinese ESG disclosures often contain substantial non-ESG-related content, such as general policy statements, company slogans, or repetitive boilerplate language, sentence-level segmentation and filtering are applied to isolate ESG-relevant expressions [39]. This fine-grained segmentation is essential for enhancing the precision of ESG information extraction and reducing noise in the analytical process. This study employs a rule-based sentence boundary detection Python Sentence Boundary Disambiguation (PySBD) to segment text into sentences, generating segmented sentences from the original ESG report statements.
Third, to identify ESG relevance in statements, constructing a proprietary ESG dictionary including keywords under the following three major dimensions is necessary: environmental, social, and governance aspects [40,41]. Figure 2 illustrates the ESG dictionary construction process. This research combines current mainstream ESG institutional indicators from domestic and international sources, such as China Securities Index (CSI), WIND, and MSCI, and references cutting-edge research progress [42,43,44] to build an ESG dictionary for construction companies. ESG-related statements are then extracted and labeled with a “category–action” framework that associates each company’s name with its respective report statements, where the categories include environmental, social, and governance, with specific actions such as low-carbon emission reduction, inclusive livelihood improvement, company governance, among others. In this process, automated classification is employed using a Chinese pre-trained language model (sbert-base-chinese-nli) to classify statements according to the ESG dictionary, followed by manual verification to ensure accuracy, generating ESG-characteristic statements for construction companies. The automated classification model adopts a sentence embedding architecture with a Transformer network structure that maps sentences to vector representations in high-dimensional space through pre-training. Having been pre-trained on large-scale Chinese text corpora, the model can identify not only lexical similarities but also capture deeper semantic relationships between sentences.

2.2. ESG Rating Prediction Module

Building upon the ESG statement extraction and classification methodology established in the Section 2.1, this research develops a comprehensive ESG rating prediction module that integrates machine learning-based company-level rating forecasting with a granular sentence-level contribution analysis.
First, accurate ESG performance predictions are generated for construction companies through the utilization of aggregated semantic feature representations. The methodological foundation of the ESG rating prediction framework commences with the systematic transformation of sentence-level semantic representations into company-level feature vectors. The module leverages a Chinese-specific BERT model (sbert-base-chinese-nli) to generate high-dimensional semantic representations of ESG statements. Each sentence undergoes tokenization with a maximum length constraint of 128 tokens, followed by forward propagation through the pre-trained transformer architecture. The mathematical formulation of this aggregation process is expressed in Equation (1):
v s e n t e n c e = B E R T _ e n c o d e r t o k e n i z e s e n t e n c e s
where v s e n t e n c e represents the 768-dimensional embedding vector for each sentence. This approach captures contextual semantic information critical for understanding ESG disclosure nuances. Individual sentence embeddings are then aggregated at the company level through mean pooling to create comprehensive company representations, as shown in Equation (2):
v c o m p a n y = 1 n i = 1 n v s e n t e n c e
where v c o m p a n y denotes the company-level embedding vector, and n represents the total number of ESG sentences for a single company. This aggregation strategy ensures that companies with varying disclosure volumes are represented on an equal footing while preserving semantic richness. The module implements a three-tier rating system mapping qualitative ESG grades to quantitative scores: A (>75 points), B (65–75 points), and C (<65 points). This transformation enables regression-based modeling while maintaining interpretable grade boundaries at 80, 70 and 60 points. To quantify the differential contributions of individual ESG disclosure statements through the application of explainable artificial intelligence methodologies and to maximize prediction accuracy, two complementary ensemble algorithms are employed. Model selection is performed through cross-validation on an 80–20 training–test split, with the algorithm demonstrating superior R2 performance selected for final predictions.
  • Random Forest Regression—This approach employs an ensemble of 200 decision trees trained with bootstrap sampling. By constructing trees on random subsets of both data and features, the model captures complex, non-linear relationships inherent in ESG disclosures while exhibiting robustness to overfitting [45]. The Random Forest prediction can be expressed in Equation (3):
    P r e d i c t i o n S c o r e = f R F ( v c o m p a n y ) = 1 T t = 1 T h t ( v c o m p a n y )
    where f R F is the Random Forest prediction function, T is the number of trees, and h t represents the prediction of the t t h decision tree.
  • XGBoost Regression—This gradient boosting framework iteratively builds 200 regression trees, where each successive tree is trained to correct the residual errors of the ensemble. XGBoost incorporates L1 and L2 regularization terms to effectively control model complexity and prevent overfitting [46]. The prediction process can be formulated using Equation (4):
    P r e d i c t i o n S c o r e = f X G B ( v c o m p a n y ) = k = 1 K h k ( v c o m p a n y )
    where f X G B denotes the final XGBoost prediction, K is the number of f boosting iterations (trees), and h k is the output of the k t h regression tree.
Second, to address the “black box” limitation of ensemble methods, the module integrates SHAP (SHapley Additive exPlanations) analysis to provide transparent, interpretable explanations for ESG rating predictions. SHAP values decompose each prediction into additive feature contributions, satisfying the desirable properties of efficiency, symmetry, dummy feature handling, and additivity [47]. For each company’s prediction, SHAP values are calculated using Equation (5):
f ( x ) = φ 0 + i = 1 p φ i
where φ 0 represents the expected model output, and φ i denotes the SHAP value for feature i , representing its contribution to the prediction’s deviation from the baseline. For the multi-level contribution analysis, the module implements a hierarchical contribution analysis framework operating at three distinct levels.
Sentence-level Contributions: Individual sentence SHAP contributions are calculated through vector similarity weighting, as shown in Equation (6):
S H A P s e n t e n c e = v s e n t e n c e v S H A P | | v s e n t e n c e | |   ×   | | v S H A P | |
where v s e n t e n c e represents the sentence embedding vector and v S H A P represents the corresponding SHAP contribution vector.
Category-level Aggregation: Sentence-level contributions are aggregated by ESG categories (environmental, social, and governance) to identify domain-specific impact patterns, as shown in Equation (7):
W e i g h t c a t e g o r y   =   Σ s e n t e n c e s   i n   c a t e g o r y   S H A P s e n t e n c e   Σ a l l   s e n t e n c e s   S H A P s e n t e n c e
Action-level Analysis: This fine-grained analysis examines specific ESG actions within categories, providing actionable insights for company sustainability improvements, as shown in Equation (8):
W e i g h t a c t i o n   =   Σ s e n t e n c e s   i n   a c t i o n   S H A P s e n t e n c e   Σ s e n t e n c e s   i n   c a t e g o r y   S H A P s e n t e n c e
To assign appropriate weights to sentence-level indicators, a comprehensive scoring mechanism is implemented that considers both semantic relevance and contribution magnitude, as shown in Equation (9):
S e n t e n c e S c o r e = P r e d i c t i o n S c o r e   ×   C o n t r i b u t i o n i c o m p a n y C o n t r i b u t i o n i = P r e d i c t i o n S c o r e   ×   S H A P s e n t e n c e × W e i g h t c a t e g o r y × W e i g h t a c t i o n   i c o m p a n y ( S H A P i × W e i g h t c a t e g o r y i × W e i g h t a c t i o n i )
This comprehensive analytical framework enables both a macro-level ESG performance assessment and micro-level disclosure optimization, supporting evidence-based decision-making in company sustainability management.

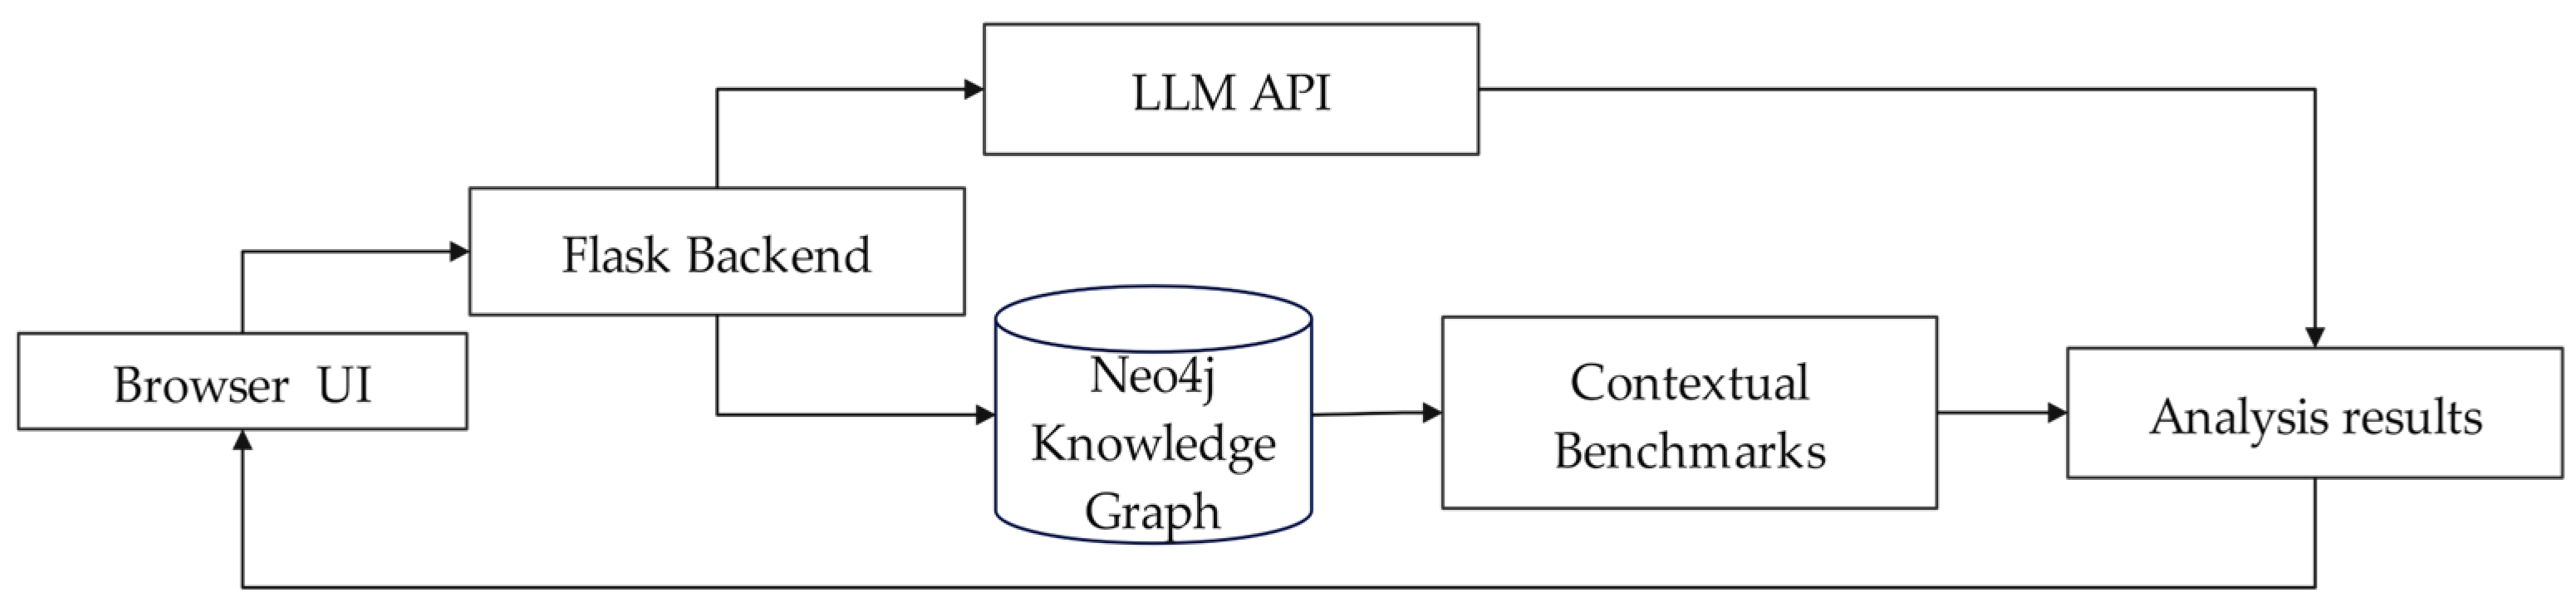
2.3. Intelligent ESG Evaluation Module

Building upon the extracted ESG statements and predictive ratings from the previous modules, the ESG intelligent evaluation module provides intelligent evaluation capabilities through the integration of knowledge graph construction and a fine-tuned LLM. This combined approach enhances the LLM’s capabilities by effectively integrating domain-specific knowledge to guide an accurate ESG evaluation, with the knowledge graph and carefully designed prompt templates improving the model’s reasoning abilities and evaluation accuracy [48]. This Retrieval-Augmented Generation (RAG) framework leverages a local Neo4j database to store and dynamically retrieve contextual information during the evaluation process. The local Neo4j database houses the ESG knowledge graph constructed from the dataset, containing interconnected entities, including companies, ESG statements, specific actions, categorical classifications, and SHAP-derived performance scores.
First, the foundation of intelligent evaluation lies in the systematic construction of a construction company ESG knowledge graph that captures complex relationships between entities, attributes, and ESG performance indicators [49]. The knowledge graph incorporates five primary entity types derived from our ESG analysis framework: (1) company entities, (2) ESG rating entities, (3) ESG sentence entities, (4) action entities, and (5) category entities, as shown in Table 1.
The knowledge graph employs a structured relationship schema that captures the hierarchical connections within the ESG framework. The mathematical representation follows the triple format, as shown in Equation (10):
R   =   { ( h ,   r ,   t )   |   h E ,   t E ,   r R }
where h represents the head entity, t the tail entity, r the relation type, E the entity set, and R the relation set. The extracted relationships are integrated into a comprehensive graph structure that preserves the multi-level hierarchy established in our analysis. Each company node connects to its ESG rating, associated sentences, and corresponding SHAP-derived scores, as shown in Table 2.
Second, to enable sophisticated ESG evaluation capabilities, the Qwen2.5 series Chinese language model is fine-tuned specifically for the construction industry ESG analysis. The Qwen2.5 model family, developed by Alibaba Cloud, demonstrates superior performance in Chinese language understanding and reasoning tasks, making it well-suited for processing Chinese ESG disclosures and generating contextually appropriate evaluations. Our fine-tuning methodology employs Low-Rank Adaptation (LoRA) techniques to maintain computational efficiency while preserving the pre-trained knowledge of Qwen2.5 [50]. This approach updates only a small subset of model parameters through Equation (11):
W   =   W 0 x   +   W x   =   W 0 x   +   B A x
where W 0 x represents the original pre-trained weights and W x   = B A x represents the low-rank decomposition with matrices B and A of much smaller dimensions. The LoRA configuration targets key attention layers within the transformer architecture, enabling efficient adaptation to ESG-specific reasoning patterns while significantly reducing training overhead.
During the conversational training process, we implement a comprehensive Chain-of-Thought (CoT) approach to enhance the model’s analytical reasoning capabilities [51]. The training data incorporate step-by-step reasoning sequences that guide the model through ESG evaluation processes, including problem decomposition and contextual understanding; evidence gathering and relevance assessment; multi-dimensional analysis across environmental, social, and governance factors; synthesis and conclusion generation; and recommendation formulation with justification. This CoT methodology ensures that the fine-tuned model can provide transparent, logically structured ESG evaluations rather than producing opaque assessments. Our training data generation process creates comprehensive multi-turn dialogue datasets where each conversation follows a structured analytical framework, beginning with system instructions that establish the model as an ESG analysis expert capable of a sentence-by-sentence evaluation of company ESG reports according to specific scoring rules: environmental dimension, social dimension, and governance dimension. The final ratings are classified as A (>75), B (65 ≤ score ≤ 75), and C (<65).

3. Data-Based Prototype

3.1. Data Collection and Processing

This study examines ESG reports from Chinese listed construction companies in 2023. Since these reports are typically published with a one-year delay, the corresponding ESG ratings from multiple rating agencies in 2024 were considered for analysis. From the 74 companies initially identified in the “Civil Engineering Construction” sector (per China’s Securities Regulatory Commission guidelines), 30 companies with multi-agency ESG ratings were selected. Similar sample sizes have been used in previous studies, such as ESG-KIBERT [23], which analyzed 20 companies per sector, and another work [52], which studied 14 companies across five industries. Due to divergent scoring methodologies across rating agencies, weighted average scores were calculated per agency criteria, categorizing enterprises into three performance groups: A (>75 points), B (65–75 points), and C (<65 points). The results are shown in Table 3. Within the construction sector, where overall scores are typically modest, Group A represents industry-leading performance, Group B denotes average performance, and Group C signifies performance below the industry average. This grouping provides relative benchmarking against peers.
PDF files of ESG reports disclosed by listed construction companies were obtained from the company websites and relevant financial platforms. These reports were processed through the ESG report information extraction module to extract structured data with sentence-level labels, generating more than 20,000 labeled sentences in total. Representative samples are shown in Table 4. The extracted data comprise three key components: “Sentence” contains the original text segments from the reports; “Category” indicates the primary ESG pillar (environmental, social, or governance); and “Action” specifies the detailed sub-indicators within each category.
Two machine learning algorithms are employed for the ESG rating prediction: Random Forest Regressor and XGBoost Regressor. Both models were configured with 200 estimators and a random state of 42 to ensure reproducibility. The choice of these ensemble methods was motivated by their proven effectiveness in handling high-dimensional feature spaces and capturing non-linear relationships in financial data. The experimental results demonstrate the effectiveness of XGBoost in predicting ESG ratings, as shown in Table 5.
The XGBoost algorithm achieved the highest R2 score of 0.5312, indicating that approximately 53.12% of the variance in ESG ratings can be explained by the semantic features extracted from company disclosures. The RMSE of 5.10 suggests that the model’s predictions deviate from the actual ratings by an average of 5.10 points on the rating scale. Subsequently, SHAP analysis was conducted on the XGBoost model to determine the weights of individual sentences and construct the dataset.

3.2. Prototype Building and Verification

The hardware environment includes a Lenovo G5000 IRH8 computer (manufactured by Lenovo Group Limited, Beijing, China) equipped with a 13th Gen Intel(R) Core(TM) i7-13700H CPU @ 2.40 GHz and 16 GB of RAM. The system is equipped with an NVIDIA RTX 4060 Laptop GPU with 8 GB of memory. In terms of the software environment, the system runs on the Windows 11 (64-bit) operating system with Python version 3.9. The GPU acceleration is supported by CUDA 11.7, and the deep learning framework used is PyTorch 1.13.0. Additionally, Neo4j Community Edition 5.21.0 was employed for graph database management, and the large language model fine-tuning was conducted using the SiliconFlow cloud platform.

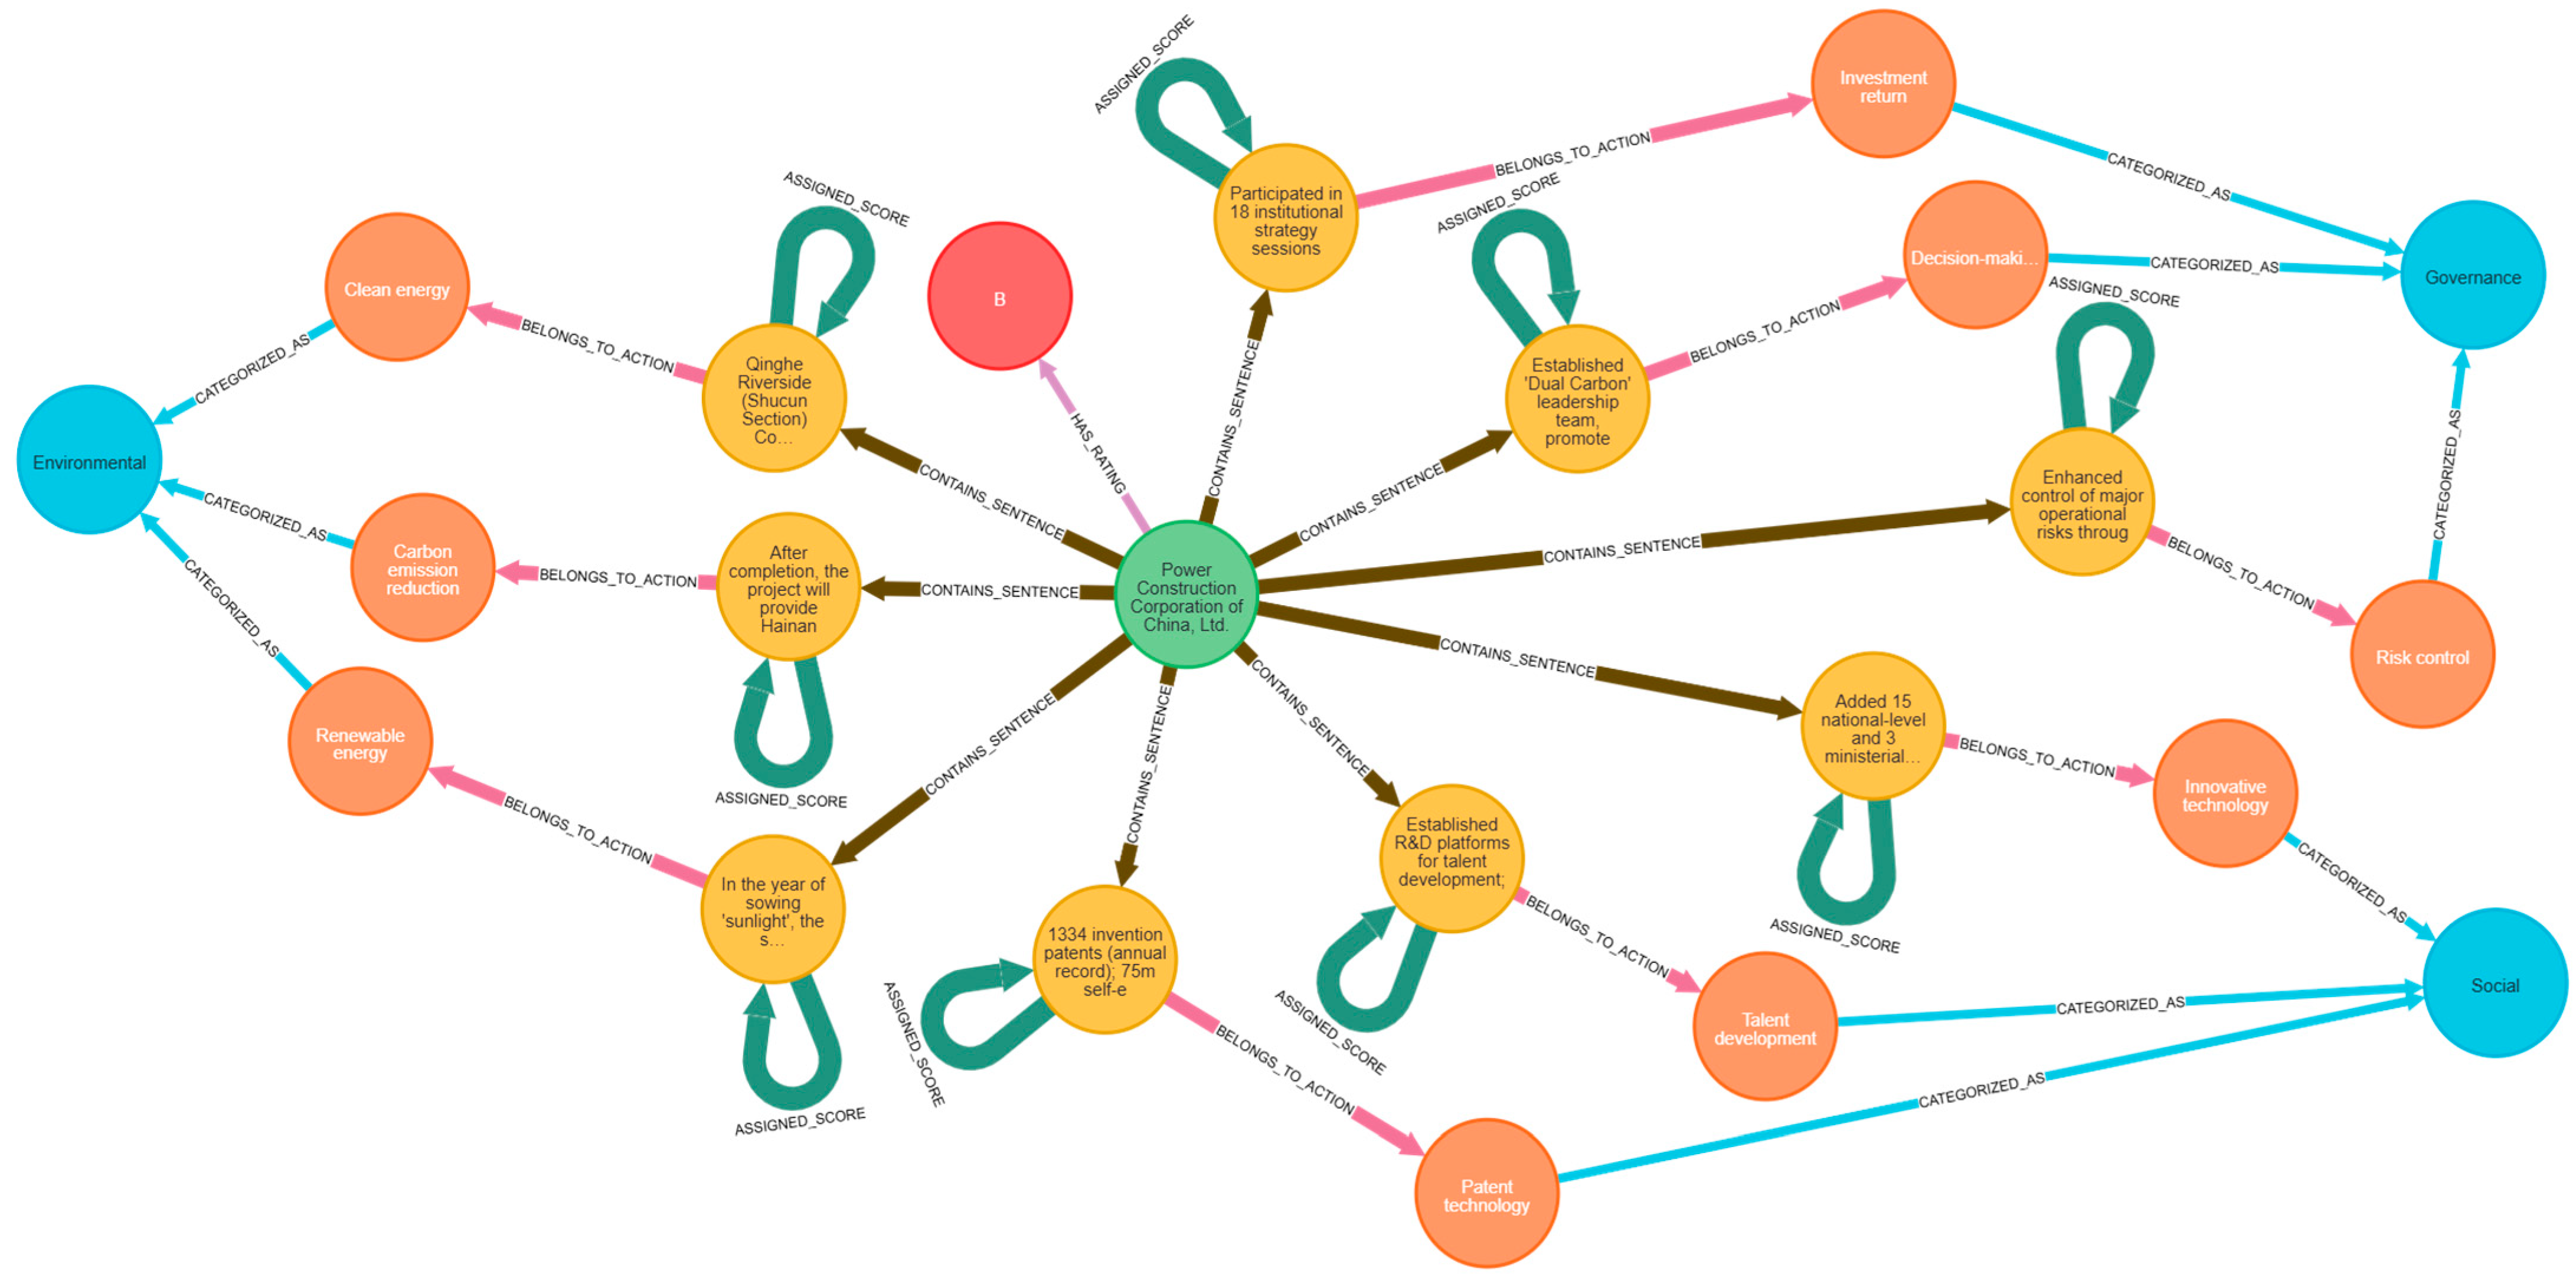
3.2.1. ESG Knowledge Graph Construction

Based on the knowledge graph framework established in Section 3.1, Cypher statements were constructed to query company ESG report sentences. The Cypher query statement and its corresponding results are illustrated in Figure 3 and Figure 4, respectively.

3.2.2. LLM Fine-Tuning

An ESG training dataset generator was developed to construct high-quality CoT training samples based on existing ESG rating data. Wei et al. [53] indicate that high-quality prompts should have clear task descriptions, accurate language expression, and appropriate example prompts. Based on these principles, the generator produces two types of training samples, as shown in Figure 5 and Figure 6.
  • Single-sentence analysis samples: These samples perform a six-step analysis for individual ESG statements, including sentence classification, key indicator identification, weight assessment, industry benchmarking, score calculation, and reasoning explanation.
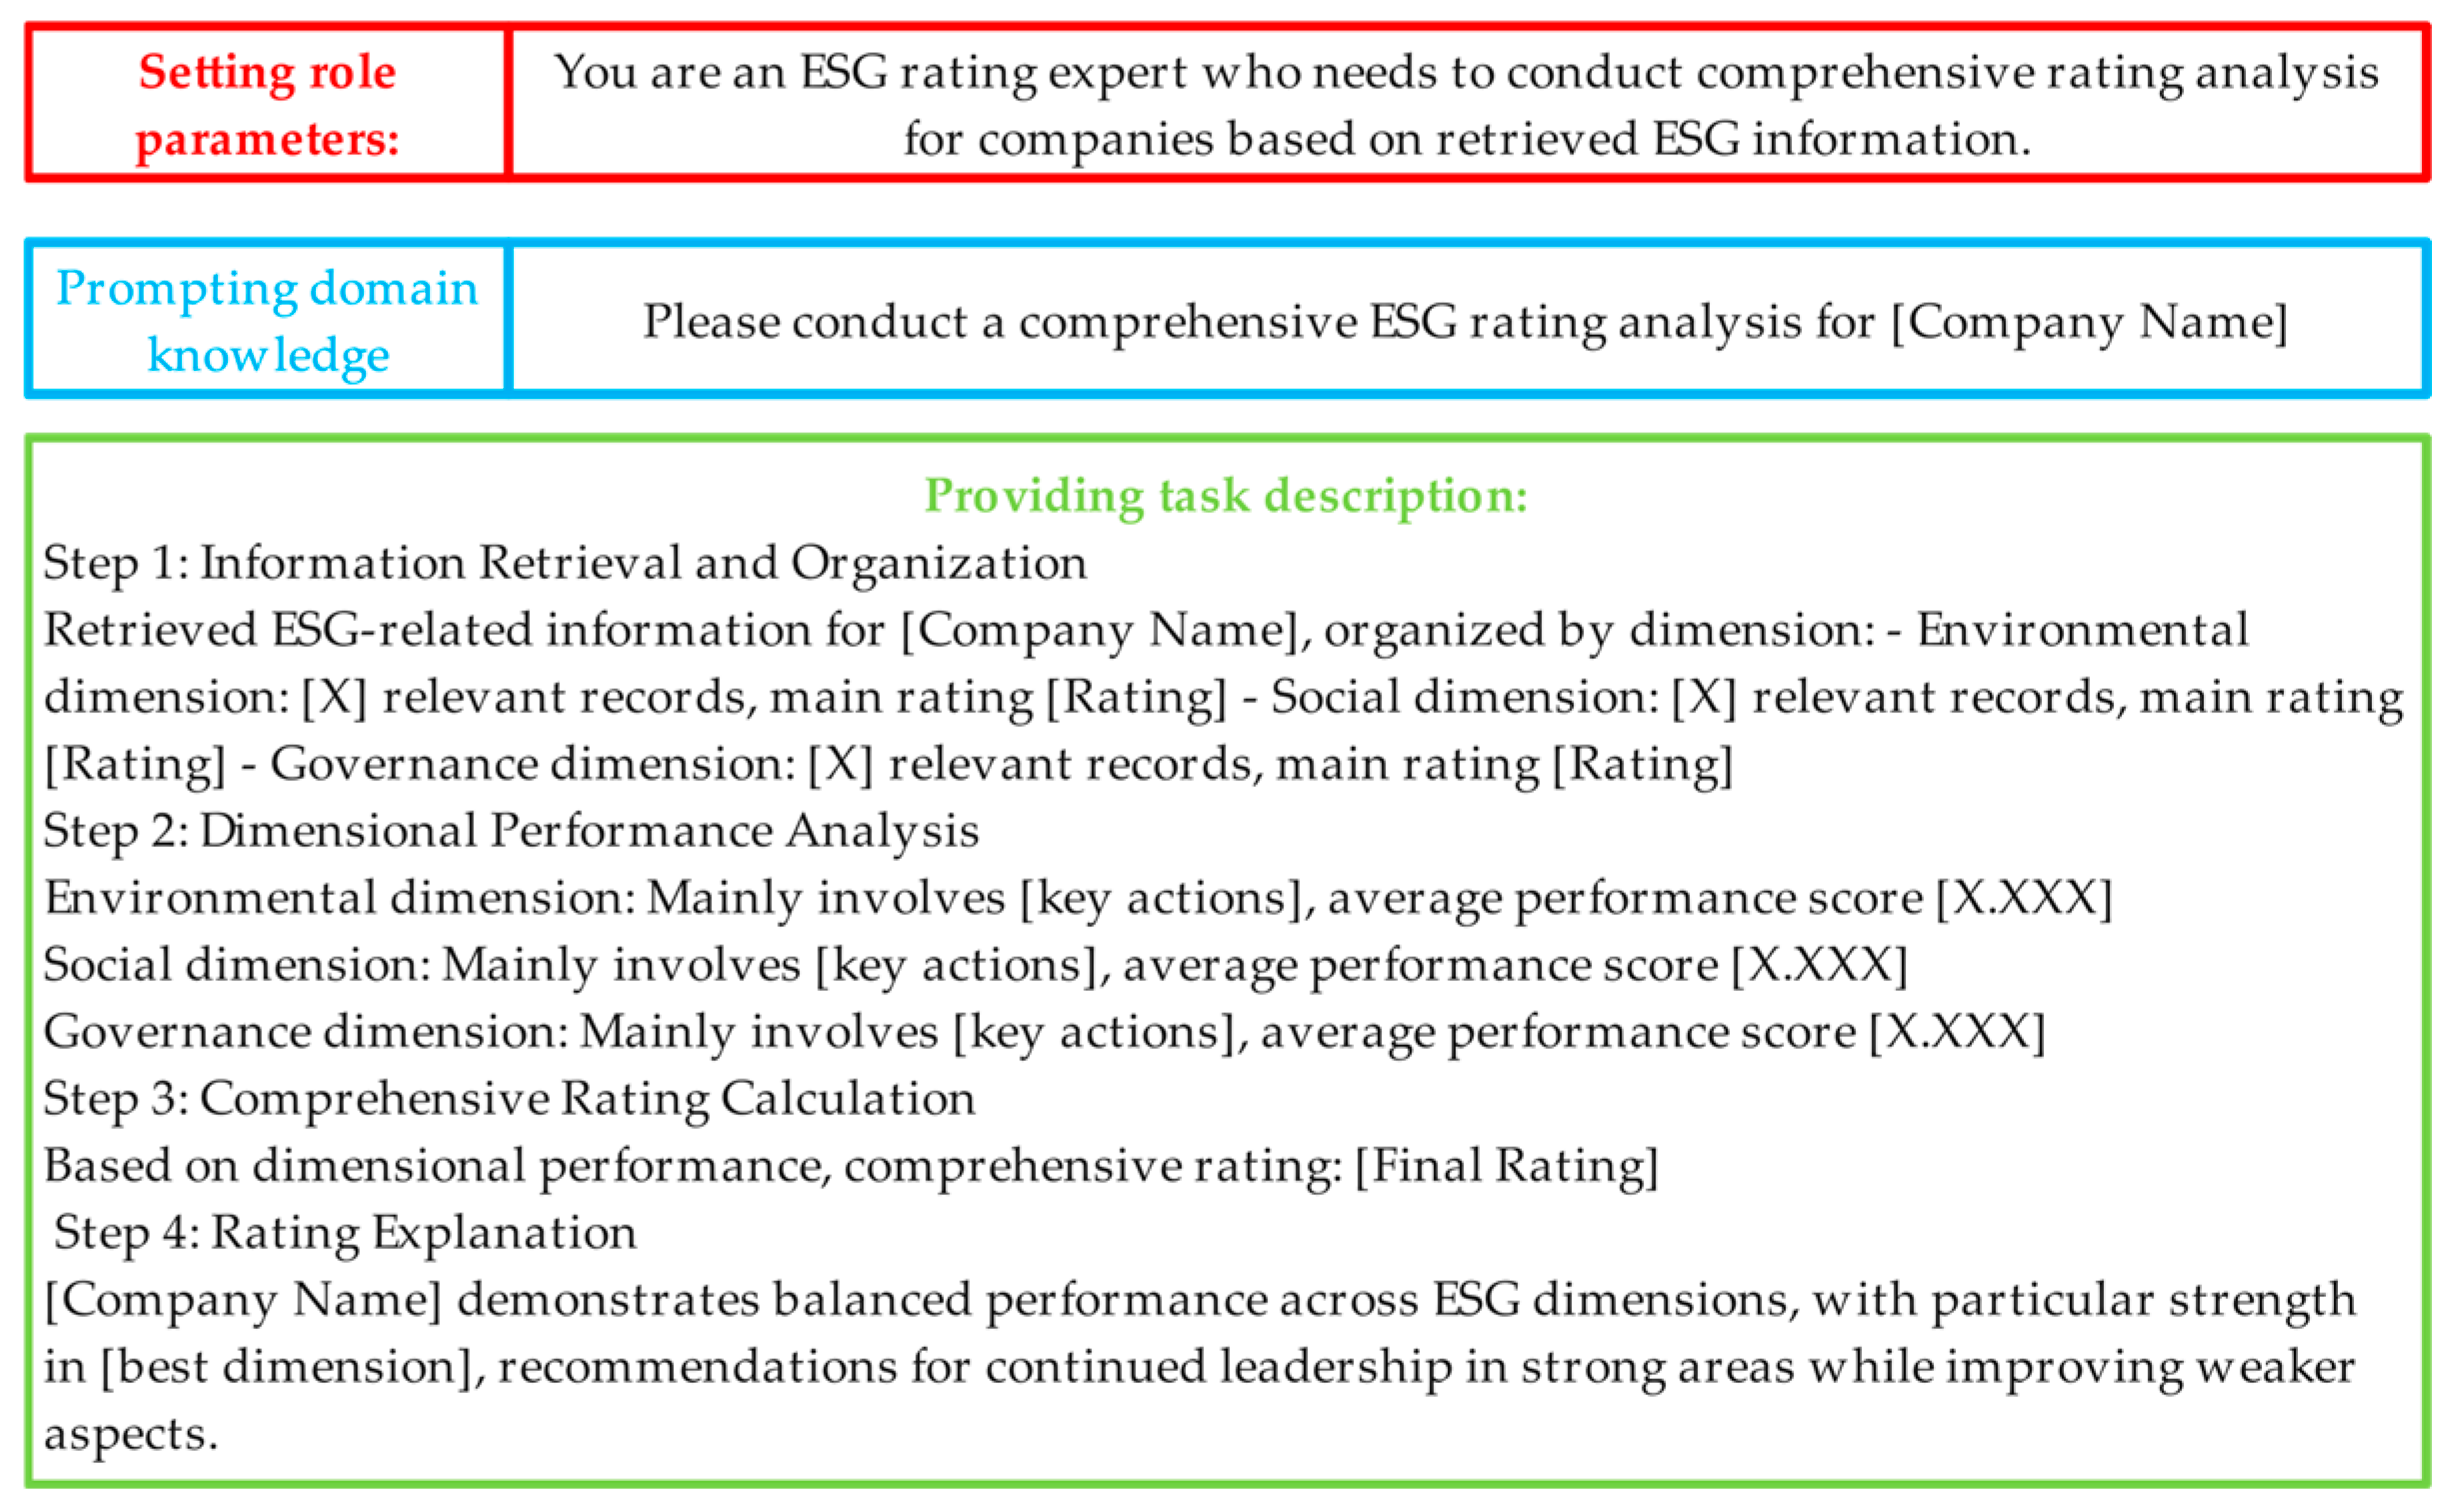
  • Comprehensive analysis samples: These samples simulate RAG scenarios by conducting a multi-dimensional comprehensive ESG rating analysis for companies, encompassing information retrieval and organization, dimensional performance analysis, comprehensive rating calculation, and rating justification.
The Qwen2.5-7B-Instruct model was fine-tuned using LoRA (Low-Rank Adaptation) for parameter-efficient training [54], as shown in Table 6. A moderate learning rate of 0.0001 balances training efficiency and stability, while five epochs prevent overfitting while ensuring adequate learning. A batch size of 16 accommodates GPU memory constraints while maintaining training efficiency. LoRA rank 16 provides sufficient adaptation capacity while keeping the parameter count manageable, with an alpha of 32 ensuring appropriate adaptation strength relative to the rank. A 10% dropout rate improves model generalization, and the extended token length of 32,768 supports the comprehensive ESG document analysis.

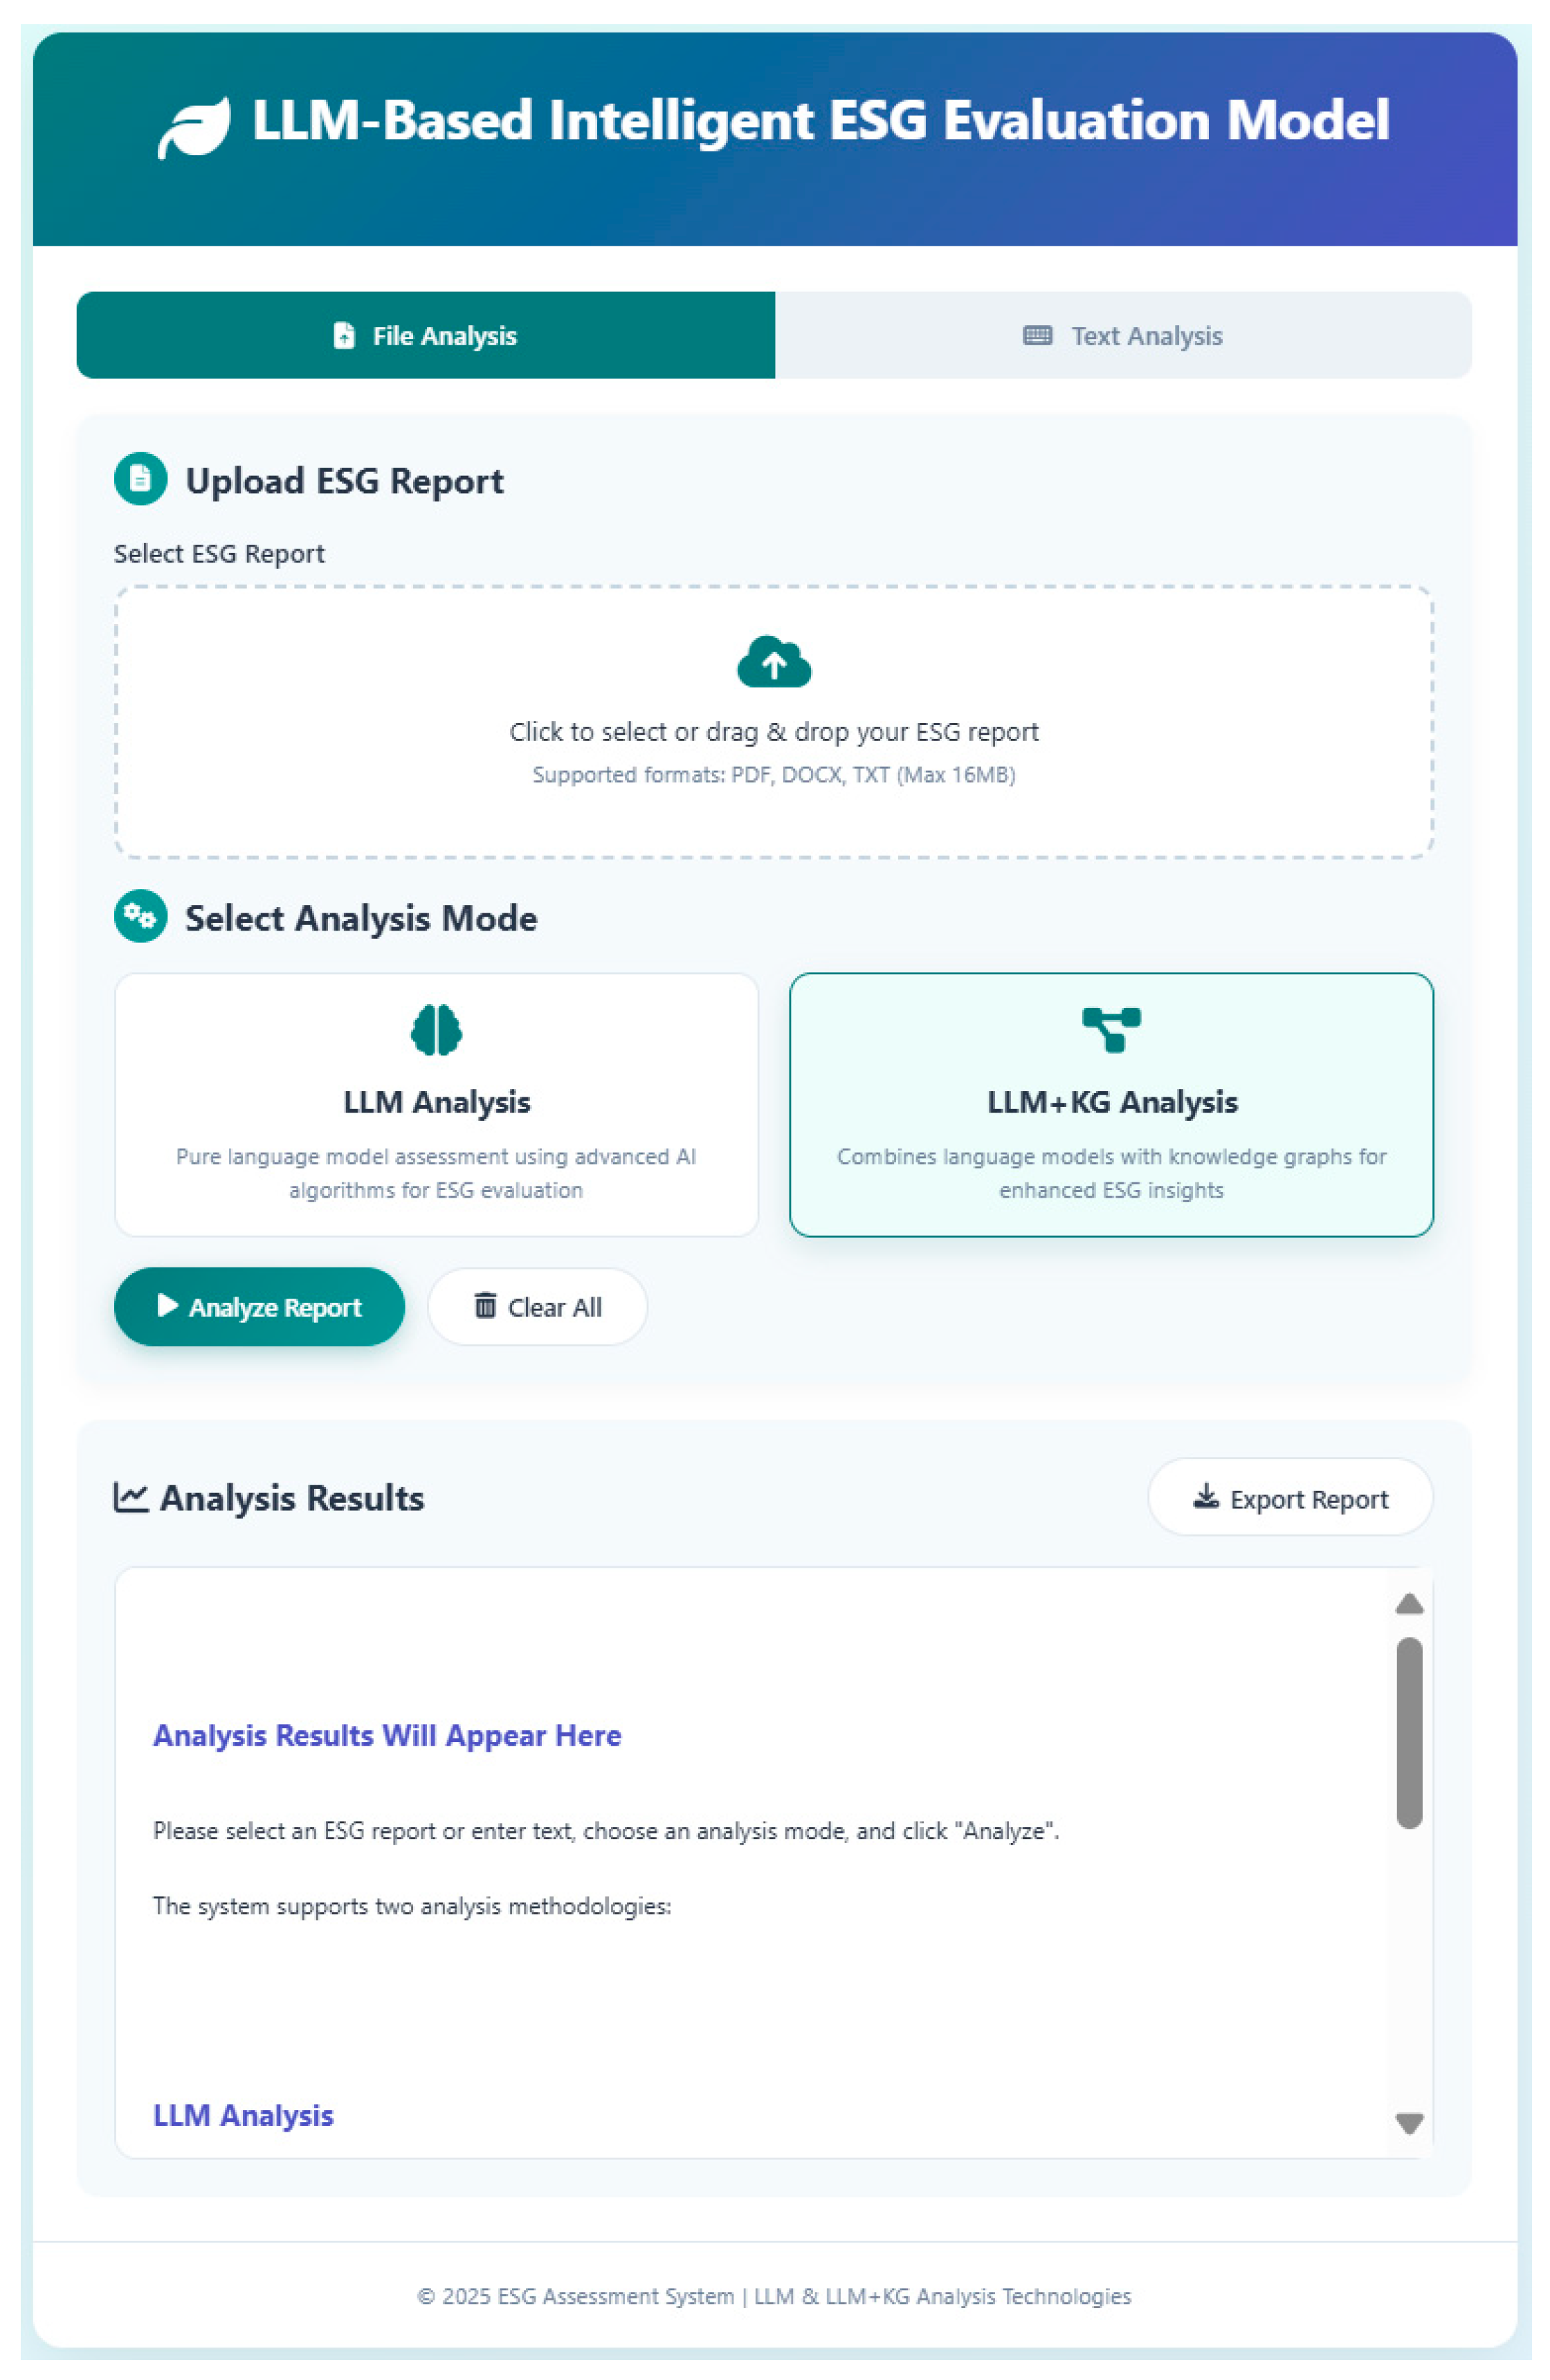
3.2.3. Prototype Verification

A functional prototype was developed to validate the ESG rating framework, integrating knowledge graph technology with the large language model through a local web application. This implementation features dual analysis methodologies accessible via an intuitive interface, with the system architecture illustrated in Figure 7.
The system comprises five core components: Browser UI for user interaction, Flask Backend for processing coordination, LLM API for natural language analysis, Neo4j database for structured ESG information storage, and contextual benchmarks for comparative analysis. The user interface supports PDF, DOCX, and TXT file uploads along with direct text input functionality. The analysis mode selection is presented through visually distinct cards, providing real-time feedback and expandable output sections for each ESG dimension.
Document processing includes text extraction, sentence segmentation using regular expressions, and ESG classification through keyword scoring. Knowledge graph integration utilizes Neo4j with optimized query performance through an ESG taxonomy dictionary. The prototype demonstrates seamless transitions between analytical methodologies, with the LLM+KG mode incorporating contextual knowledge from the database. Users receive incremental status updates during analysis, and the results feature benchmark comparisons against industry practices. The user interface is shown in Figure 8.

4. Results

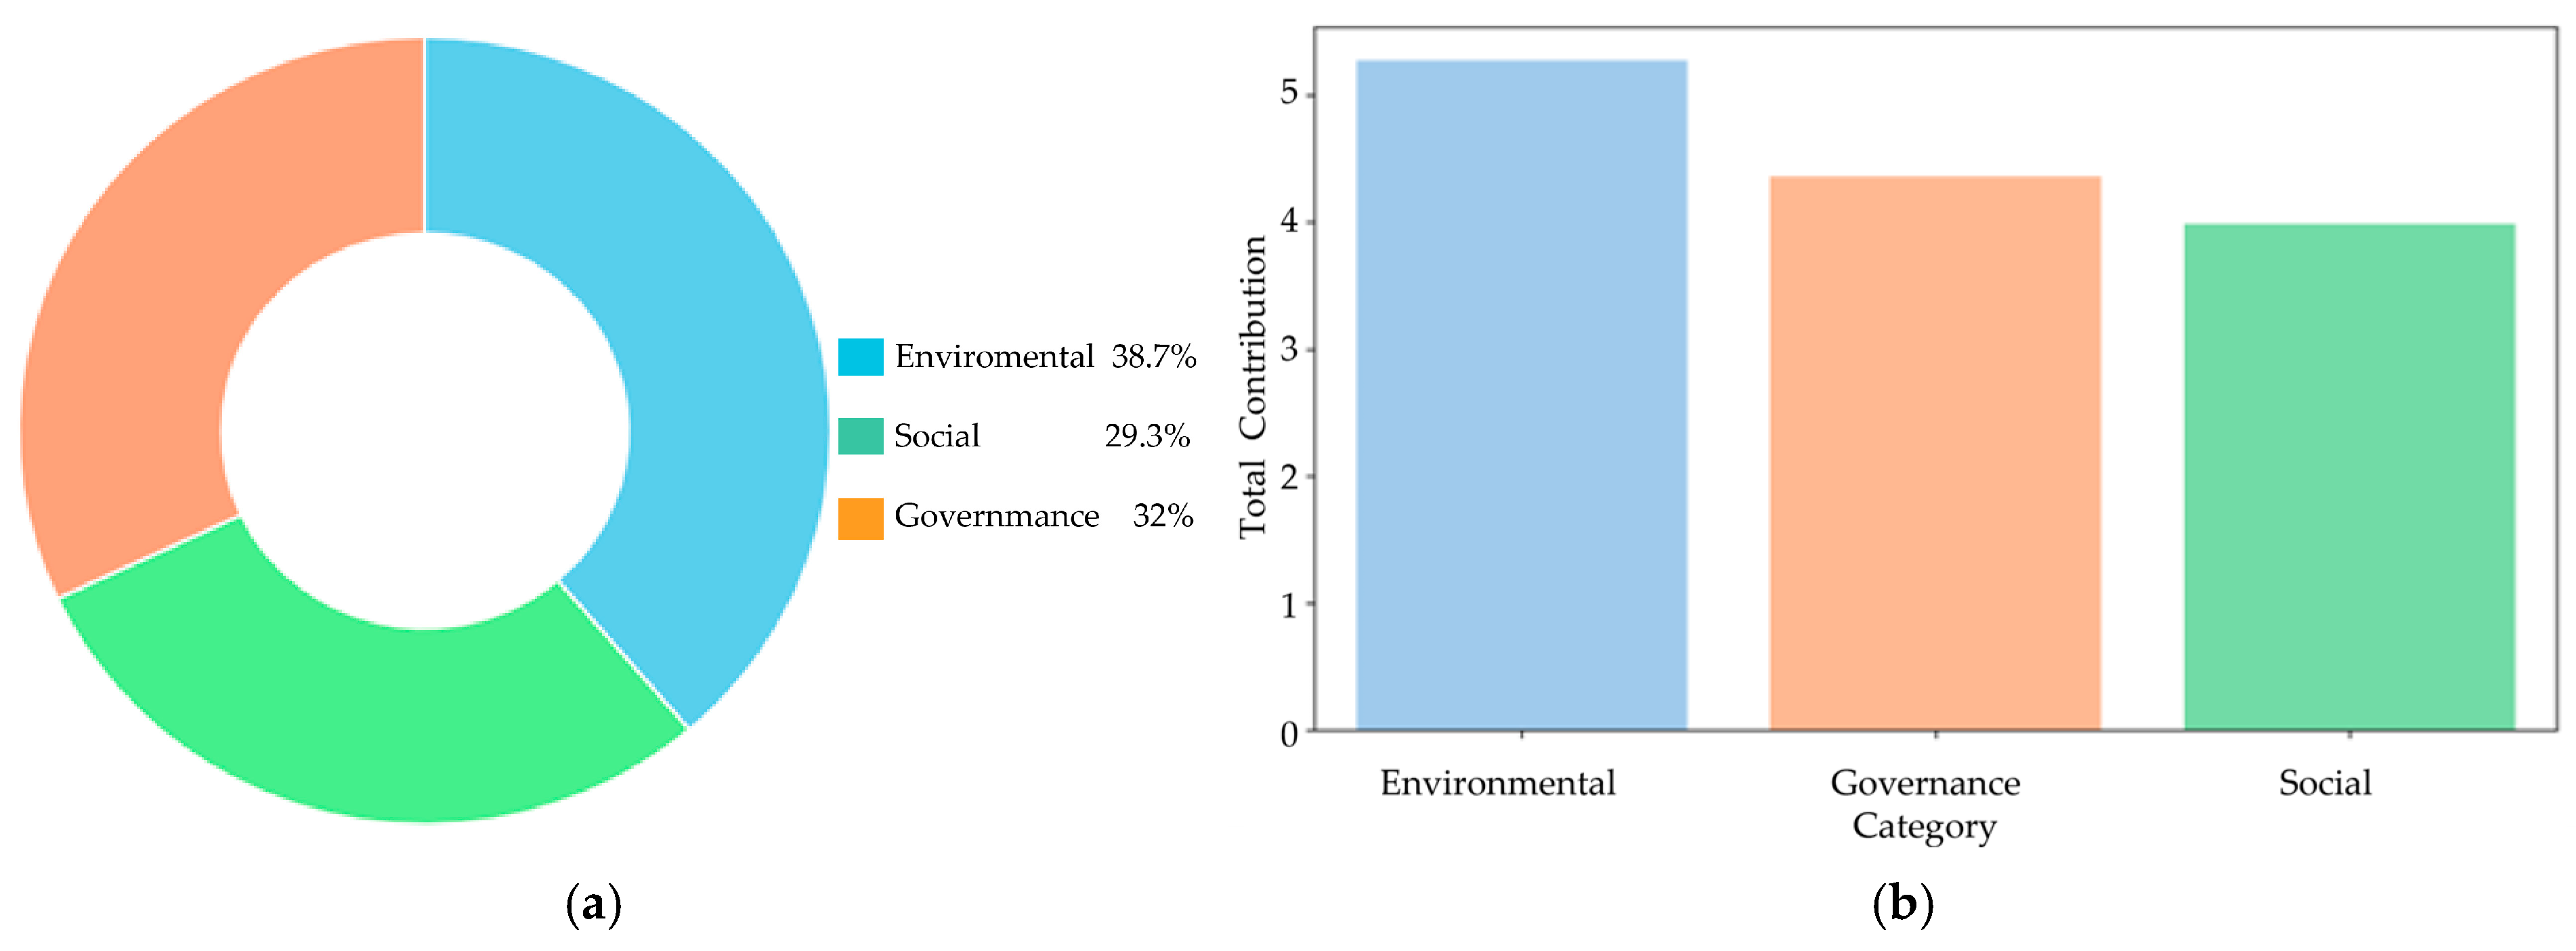
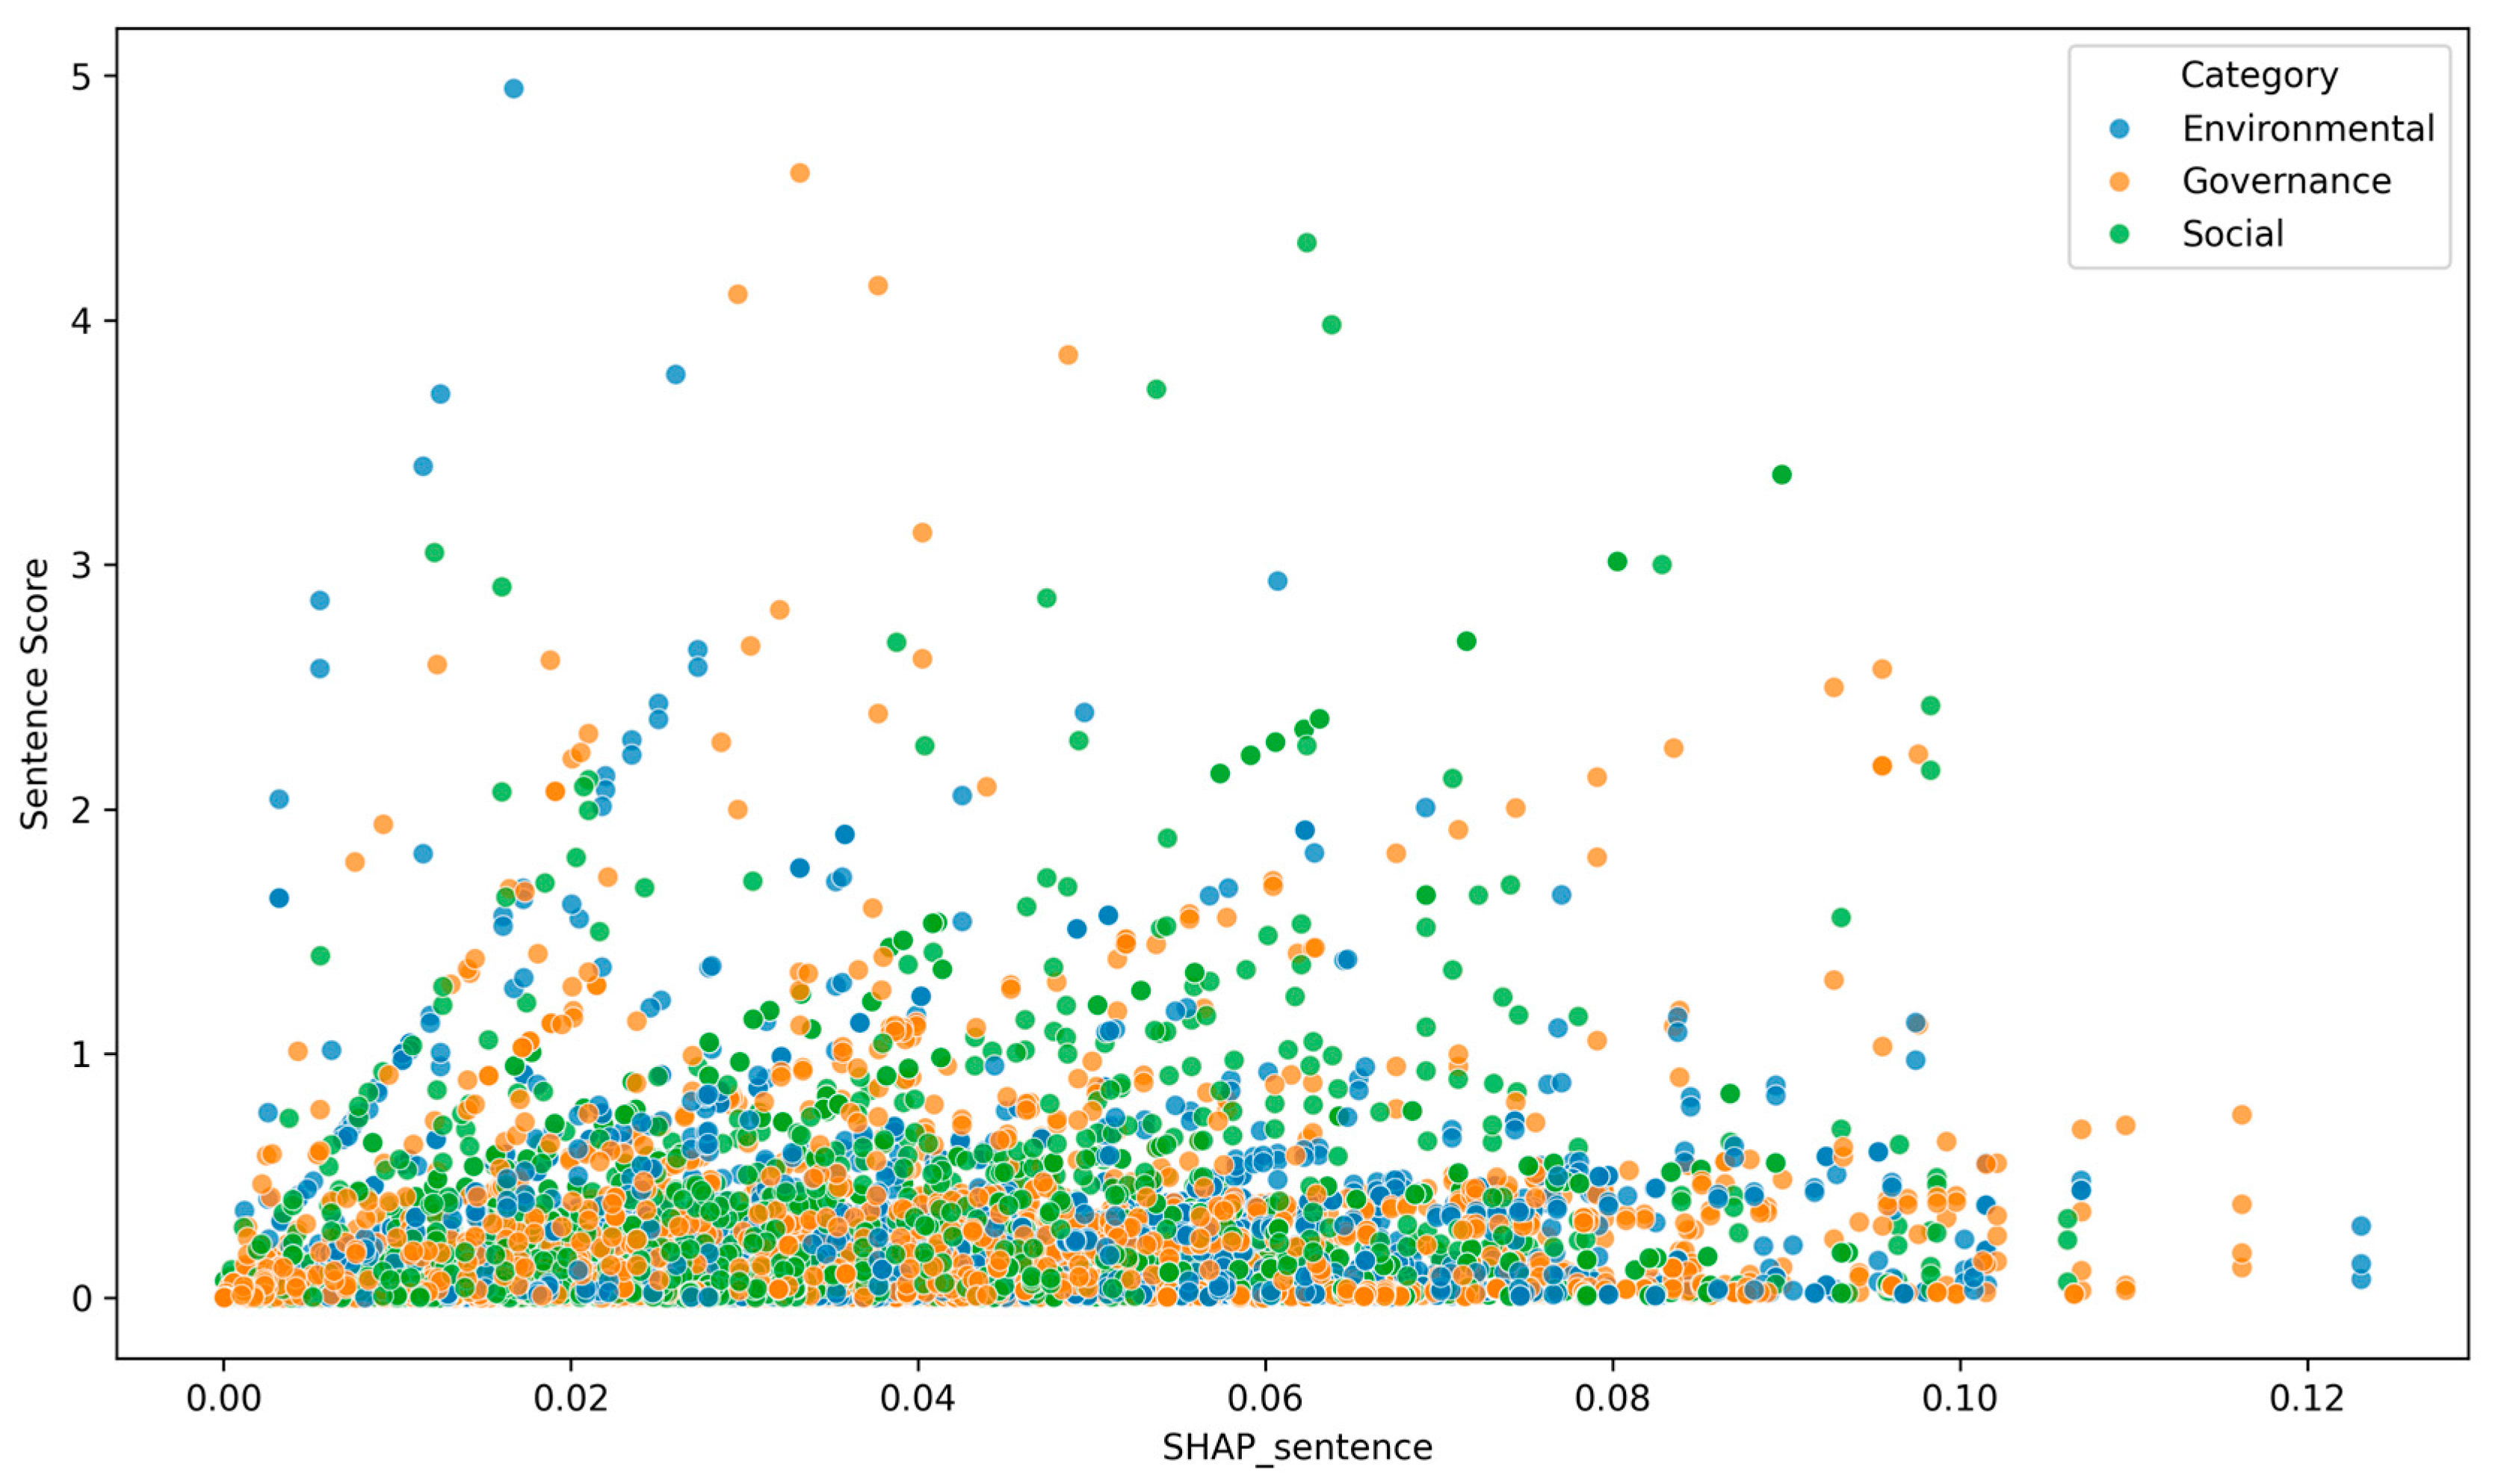
4.1. ESG Rating Prediction Results and SHAP Analysis

To evaluate the practical utility of our regression model, we assessed its performance in predicting ESG rating categories (A, B, and C) for 30 companies in our test dataset. As shown in Table 7, the XGBoost model demonstrated strong classification accuracy, with only two out of thirty companies receiving incorrect rating predictions, achieving an accuracy rate of 93.33% (28/30). This high classification accuracy demonstrates the model’s effectiveness in distinguishing between different ESG performance levels, which is crucial for practical ESG assessment applications. Based on these experimental results, XGBoost was selected as the optimal predictor for subsequent SHAP analysis.
To enhance the interpretability of ESG rating predictions and alleviate the “black-box” concerns associated with ensemble learning models, this study incorporates SHAP analysis to decompose model outputs into additive, transparent feature contributions. To identify the relative importance of broad ESG dimensions, sentence-level contributions were aggregated by category (environmental, social, and governance). Both a donut chart and a bar chart visualize the total SHAP contribution proportions for the three ESG categories, as shown in Figure 9.
The results indicate that the environmental dimension contributes the largest share of total SHAP values (38.7%), followed by the governance (32.0%) and social (29.3%) dimensions. This suggests that environmental-related textual content plays a dominant role in driving ESG rating predictions for the evaluated companies.
For more fine-grained insights, this study further aggregated contributions by specific ESG actions. Figure 10 depicts the top 20 actions ranked by SHAP contribution, presented in both a donut chart and a corresponding bar chart for direct comparison. Key observations include carbon emission reduction, clean energy, and internal audit and compliance management as the top three most influential actions. The cumulative contribution of these top actions accounts for a substantial proportion of the overall SHAP values, highlighting their critical impact on ESG ratings. The action-level analysis enables pinpointing of high-impact disclosure areas, providing actionable guidance for targeted ESG improvements.
To further investigate the contribution patterns of textual elements within ESG reports, we conducted a comprehensive sentence-level SHAP analysis and visualized the results in a scatter plot (Figure 11). The visualization employs a dual-axis approach: the horizontal axis represents the original SHAP values of each sentence, capturing their raw marginal contributions to the ESG rating prediction, while the vertical axis displays the final adjusted sentence scores derived through our multi-level weighting mechanism that incorporates category and action-level importance. The scatter plot excludes two types of data points: sentences with zero original SHAP scores (indicating no model-attributed contribution) and those with final adjusted scores exceeding five (representing potential outliers or cases of atypical weight amplification). This filtering approach ensures that the visualization focuses on meaningful contributions while avoiding distortion from extreme values. The sentence-level analysis illuminates the nuanced interplay between raw model attributions and hierarchical ESG structural weighting. The findings demonstrate that while initial sentence-level contributions vary significantly across ESG categories, the adjustment process effectively calibrates their influence within a reasonable and interpretable range, providing a more balanced and structurally informed assessment of textual contributions to ESG ratings.
This analysis reveals several distinct patterns across ESG dimensions. Environmental sentences typically exhibit relatively lower raw SHAP scores, suggesting that individual environmental-related statements contribute modestly at the micro-textual level. In contrast, social sentences generally cluster around the middle range of SHAP scores, while governance sentences demonstrate notably higher raw SHAP values on average. This pattern indicates that governance-related textual expressions exert a more substantial influence on the model’s rating decisions compared to environmental and social content. Following the application of our multi-level structural weighting system, a significant transformation occurs in the score distribution. The majority of sentences converge to final adjusted scores within the zero to one range, reflecting the natural attenuation of sentence-level influence when contextualized within the broader ESG structural framework. This normalization effectively prevents any single sentence from disproportionately dominating the overall company rating, ensuring a balanced contribution across the textual corpus.

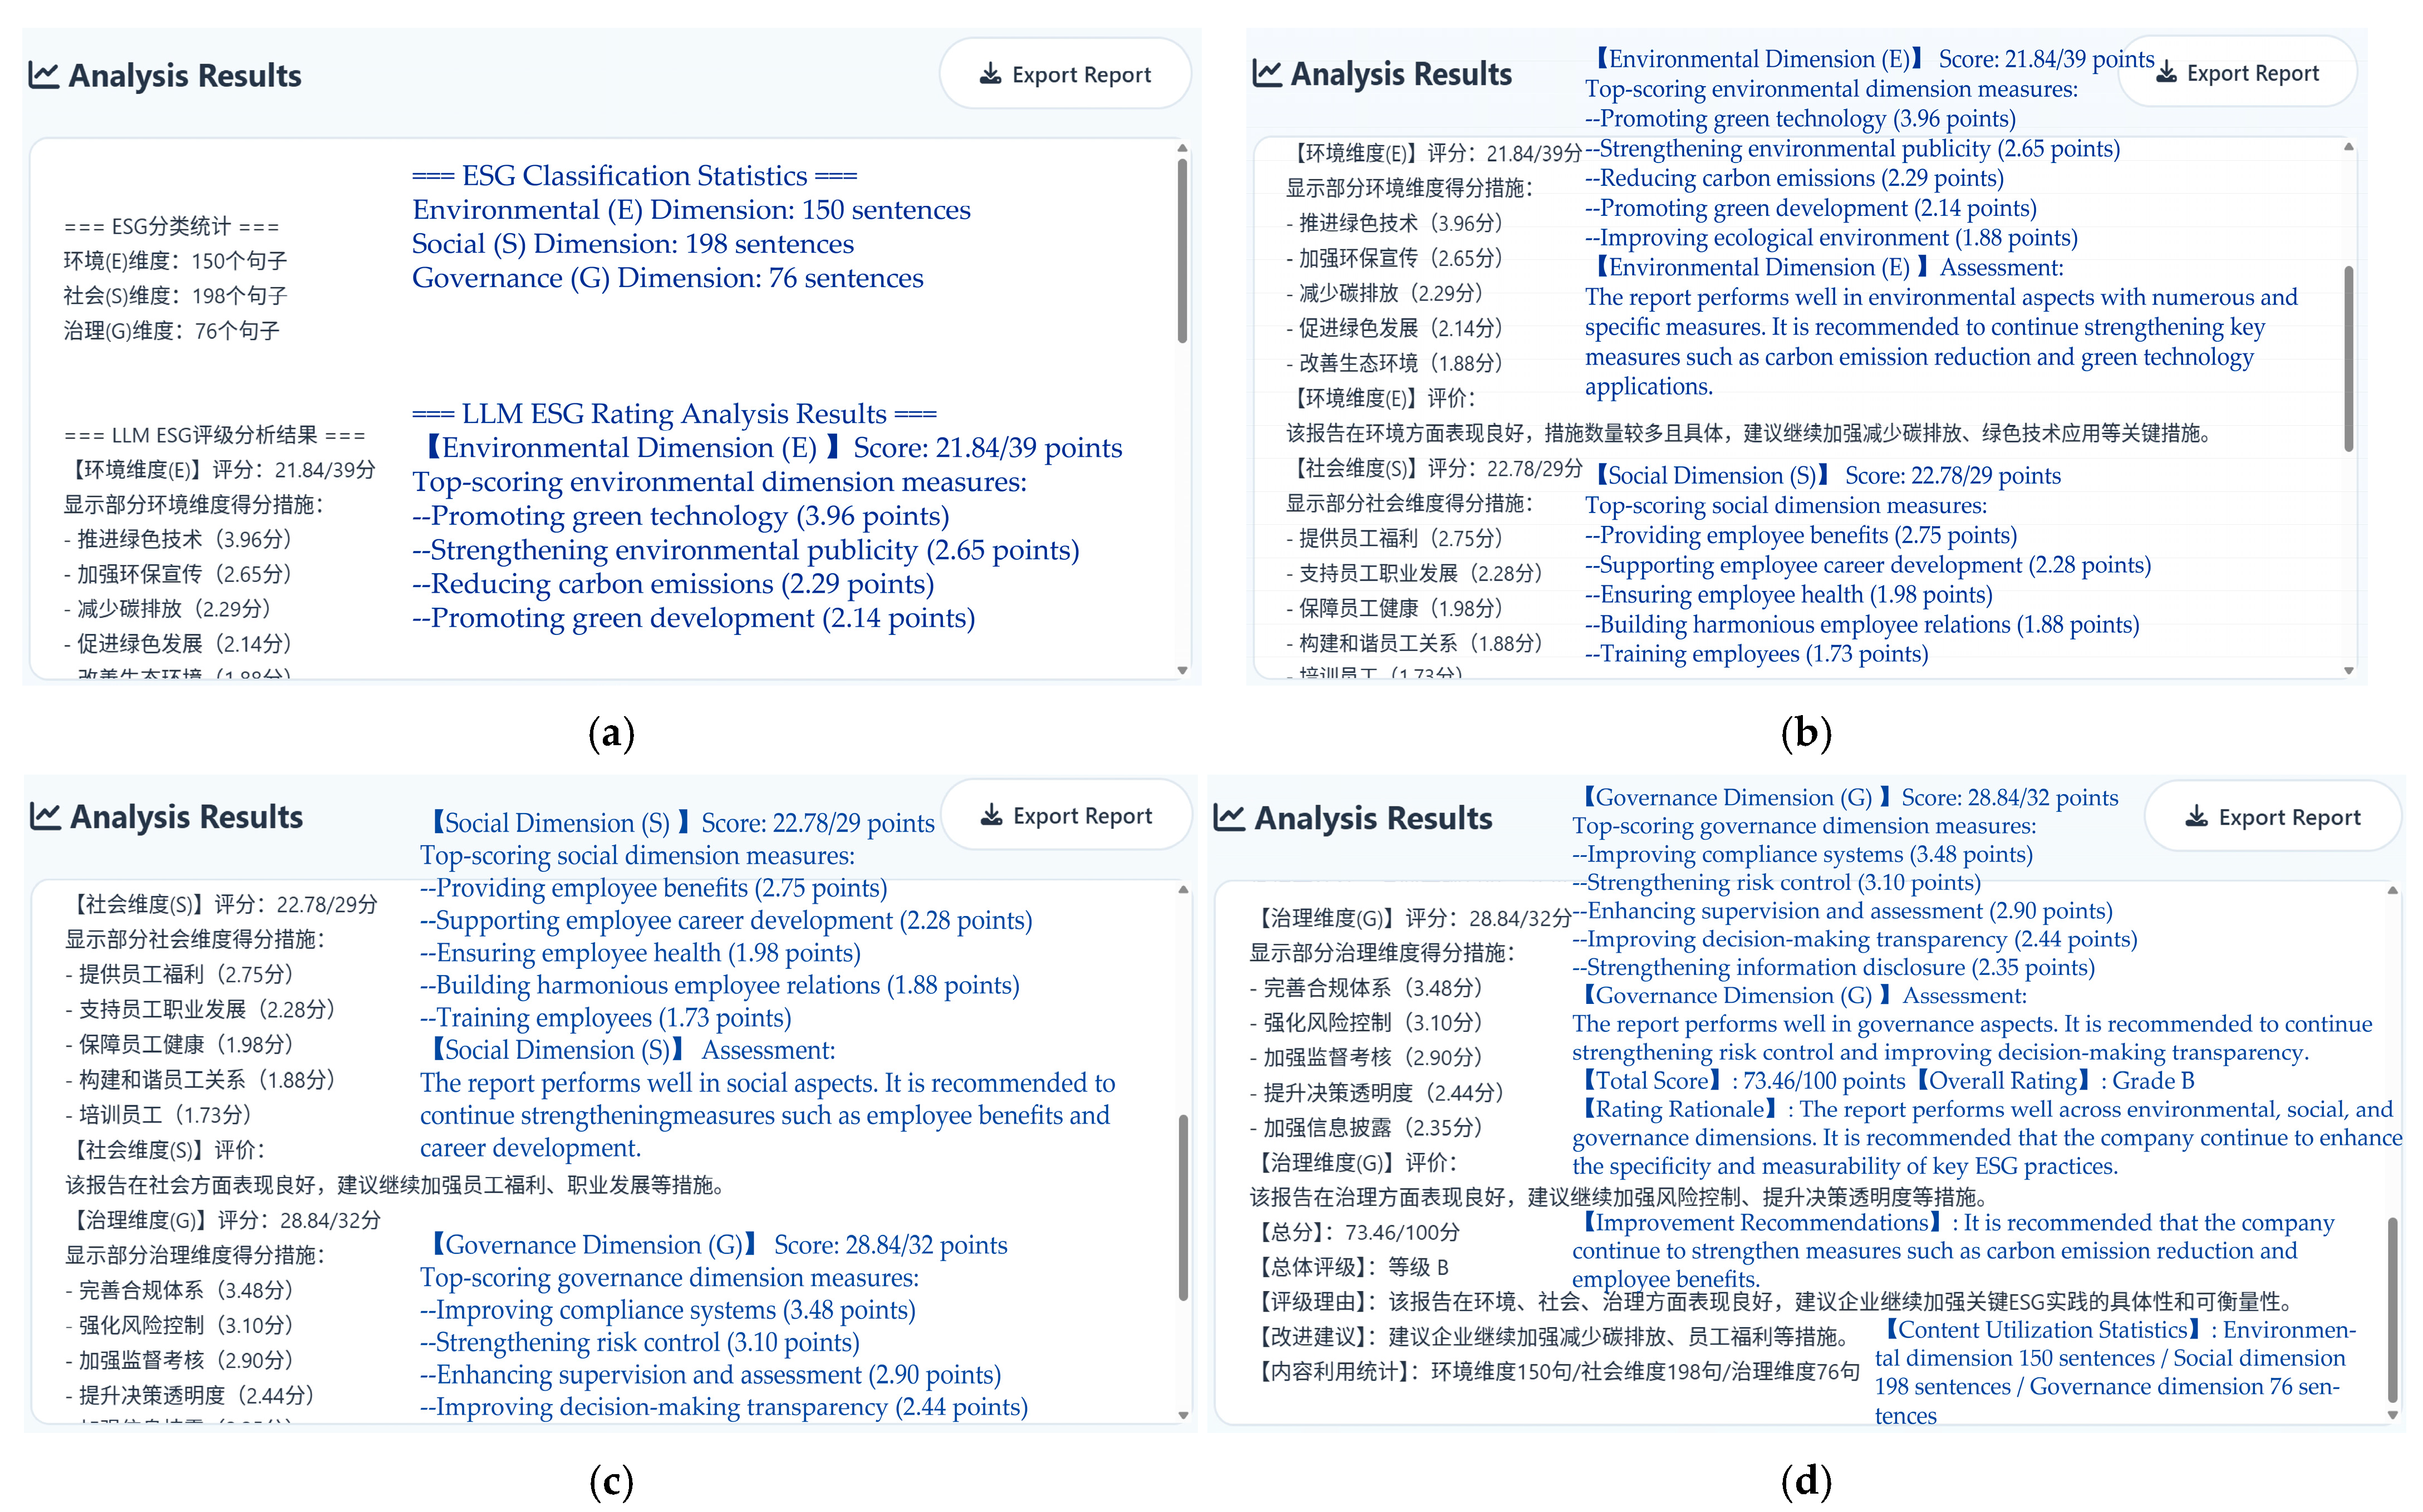
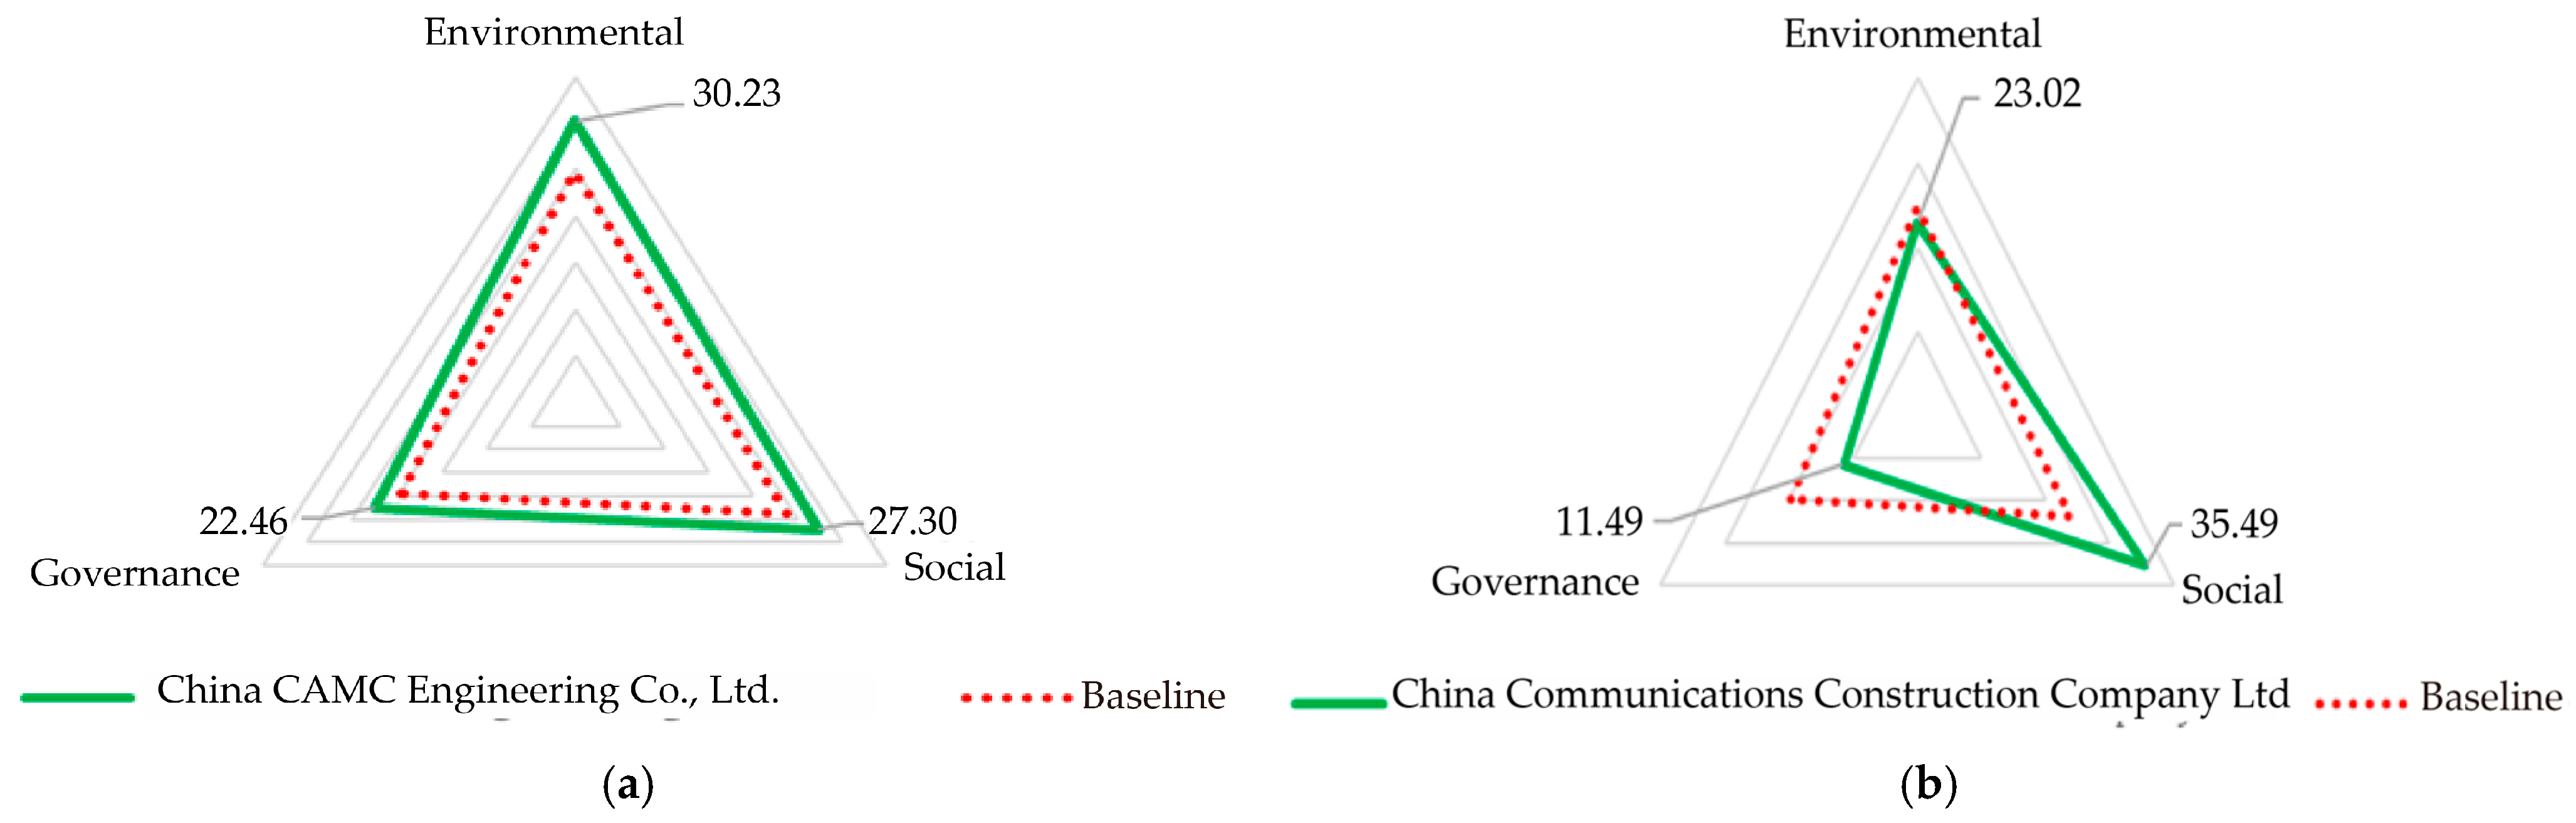
4.2. ESG Rating LLM Evaluation Results

To validate the effectiveness of the evaluation model, construction companies that have published their 2024 ESG reports were selected for empirical validation. This approach allows model predictions to be compared against 2025 company ratings and the practical applicability to be assessed. The LLM-based intelligent ESG evaluation model’s ESG evaluation results for East China Engineering Science and Technology Co., Ltd. in 2025 are shown in Figure 12.
By analyzing the model’s output, ESG report sentences were decomposed and classified, and sentence scores for different dimensions were calculated. Based on the SHAP contribution values for different ESG classifications obtained from Figure 8, which served as weight proportions for the three dimensions (environmental 39, social 29, and governance 32), the final score was derived and appropriate improvement recommendations were provided. The model’s effectiveness was demonstrated. Meanwhile, to validate the model’s stability, three distinct inference approaches were employed: (1) the original pre-trained LLM baseline, (2) a standalone fine-tuned LLM, (3) a fine-tuned LLM integrated with KG. Ten experiments were conducted for each company, as shown in Table 8.

5. Discussion

5.1. NLP-Based ESG Rating Framework

The application of NLP processing in this study significantly enhances the objectivity and consistency of the ESG evaluation. Traditional ESG assessments often rely on subjective judgment and manual scoring, which may introduce bias and inconsistency across different evaluators. By leveraging NLP techniques, this research establishes an objective evaluation framework that can systematically process large volumes of ESG report text and extract meaningful insights. Through the ESG information extraction module and ESG rating prediction module in this study, ESG-related sentences were extracted from ESG reports, and an accuracy rate of 93.3% was achieved through ESG rating prediction. The indicator selection in this paper is based on objective screening after natural language processing, demonstrating the rationality of current indicators in constructing ESG evaluation systems. Through SHAP analysis, the weights of each category and action were obtained, revealing an overall influence effect: environment > governance > society. In the construction industry, environmental actions have the greatest impact on rating predictions, with the highest number but relatively small average values. This indicates that most construction companies pay considerable attention to environmental protection, such as reducing carbon emissions and using clean energy, which aligns with the characteristics of the construction industry. In contrast, although the governance dimension has the second-highest impact on rating predictions after the environmental dimension, many sentences have relatively large SHAP values, indicating significant gaps in governance dimensions among many companies. Therefore, many companies can enhance their company governance measures to achieve better ESG rating results. After converting sentences’ SHAP contributions to sentence scores, the ESG performance of different companies can be clearly understood, and their performance in different ESG dimensions can be calculated. The radar chart under the industry baseline is shown in Figure 13, providing a valuable reference for companies to identify areas for improvement and enhance their ESG ratings.
An increasing body of research seeks to more objectively reflect companies’ ESG performance by mining diverse information sources related to enterprises, such as ESG reports and news articles [55,56,57]. These studies extract multi-dimensional data, including sentiment information [58], financial data [59], and qualitative indicators [60], to construct new ESG evaluation systems for more accurate company ESG ratings. Building upon this foundation, this study focuses on Chinese construction industry enterprises and, against the backdrop of significant divergences in ratings among existing evaluation institutions, attempts to deeply explore the genuine contributions of various dimensional scores in company ESG reports. By developing an LLM-based ESG rating model, this research provides empirical support for enterprises to enhance their ESG performance.
Although this study primarily uses the current state of ESG development in China as its background, the LLM-based intelligent ESG evaluation model developed here provides methodological references for ESG assessments across different countries and industries. The model demonstrates good adaptability and can achieve mining and evaluation of specific company ESG performance contributions within various industries by incorporating region-specific ESG rating standards and industry characteristics. In terms of computational cost, the model adopts a lightweight fine-tuning strategy and inference pipeline, making it feasible for deployment in enterprise-level or institutional environments without requiring large-scale computational resources. This ensures wider adoption in practical ESG evaluation scenarios, particularly in resource-constrained settings. Future ESG evaluations can develop more industry-specific ESG assessments based on industry characteristics. Future research directions could include (1) extending the framework to other industries, such as the manufacturing, finance, and technology sectors, to validate its generalizability and adaptability; (2) incorporating real-time data sources and dynamic evaluation mechanisms to capture ESG performance changes over time; and (3) integrating multi-modal data beyond textual reports, including financial data and social media, to provide more comprehensive ESG assessments.

5.2. Reasoning Ability of the LLM-Based Intelligent ESG Evaluation Model

Large language models possess powerful information retrieval and semantic reasoning capabilities and have been increasingly utilized for extracting information from ESG reports and identifying ESG performance indicators [61,62]. This study combines large language models to identify and analyze company ESG report information, and by fine-tuning large language models, enables them to have more professional ESG report analysis capabilities. Through the experiments described in Section 4.2, the effectiveness and potential of large language models in analyzing ESG reports and ESG rating prediction were validated.
The baseline model demonstrated a significant lack of assessment accuracy. When utilizing only the fine-tuned LLM for inference, the intelligent evaluation model achieved an overall reasoning accuracy of 53.33%. Notably, the model exhibited distinct performance patterns across different rating levels: the accuracy for high-grade A ratings was the lowest (40%), followed by low-grade C ratings (56.67%), while B-grade ratings achieved the highest accuracy (70%). This pattern suggests that the model faces greater challenges in evaluating extreme performance levels, where assessment criteria are either exceptionally stringent (A-grade) or require identification of significant deficiencies (C-grade).
Following the integration of knowledge graphs, the LLM+KG model maintained a similar performance distribution pattern across rating levels, with A-grade accuracy remaining the lowest (50%), C-grade following (60%), and B-grade achieving the highest performance (85%). However, the overall accuracy significantly improved by 21.88%, reaching 65%. Most remarkably, the accuracy for B-grade evaluations reached 85%, demonstrating the substantial enhancement achieved through knowledge graph integration. The incorporation of knowledge graphs not only significantly improved overall accuracy but also enhanced the stability of model outputs during the inference process. Through structured external knowledge supplementation, the model demonstrated a better understanding of the complex contexts and standards inherent in ESG evaluation, thereby reducing uncertainty in the reasoning process.
Due to the contextual constraints of large language models’ understanding capabilities and the existence of hallucination issues, this study combined CoT to construct language training sets and prompts, providing a cognitive framework for ESG report evaluation and building a knowledge graph-enhanced model suitable for a construction company ESG assessment. This approach enhances accuracy of model recognition and establishes a relatively objective and accurate ESG evaluation model, providing a new solution for Chinese construction enterprises to conduct their own ESG rating analysis, improve deficiencies, and maintain their ESG ratings.
However, the experimental results also reveal that current large language model applications still face certain accuracy challenges. Even when inputting identical ESG report content, the model’s internal analysis mechanisms may produce different understandings, resulting in varying evaluation outputs. This variability is particularly pronounced in A-grade and C-grade evaluations, where the assessment criteria are more complex and nuanced. The integration of knowledge graphs significantly improved output consistency, with evaluation sequences showing markedly reduced randomness compared to the standalone LLM inference.
The findings of this study highlight several promising avenues for future research: (1) developing more robust prompt engineering techniques to reduce output variability and improve consistency across different rating levels; (2) exploring advanced fine-tuning strategies such as parameter-efficient fine-tuning and domain adaptation to enhance model reliability, particularly for extreme rating categories; (3) investigating the optimal architecture for knowledge graph integration to maximize the enhancement effects while maintaining computational efficiency; and (4) developing specialized evaluation metrics that can better capture the nuanced differences in ESG performance across different rating tiers.

6. Conclusions

This study developed and validated an LLM-based intelligent ESG evaluation model tailored specifically for the Chinese construction industry, addressing critical gaps in ESG assessment methodologies. By integrating LLM with KG, a novel approach of ESG evaluation is developed, effectively combining the semantic understanding capabilities of the LLM with structured domain knowledge. This framework provides a comprehensive solution that spans information extraction, rating prediction, and intelligent evaluation, establishing a new paradigm for automated ESG assessments. For construction companies, the model provides objective and detailed ESG assessments that can effectively guide strategic sustainability initiatives. The sentence-level analysis capability enables targeted improvements in specific ESG dimensions, allowing companies to focus their resources on areas of greatest impact. For rating agencies, it offers a standardized approach to reduce cross-institutional inconsistencies.
There are several limitations of the current study that warrant further investigation. The restricted data diversity—relying primarily on self-reported ESG disclosures—could be expanded through multi-source incorporation of news analytics, regulatory filings, third-party audits, financial metrics, real-time energy consumption, supply chain traces, and social sentiment data. Additionally, while the current model demonstrates high accuracy, there remains potential for further improvement.
Future work will focus on the following areas: (1) enhancing data comprehensiveness and representativeness by expanding the model’s coverage to include a wider variety of construction enterprise types and integrating the aforementioned multi-source data beyond self-reports; (2) improving model accuracy and adaptability by further refining the model’s predictive accuracy and enhancing its ability to adapt dynamically to evolving policies and industry standards; and (3) enabling operational integration by connecting the model with enterprise management systems to monitor operational data (such as energy consumption anomalies), thereby closing the loop from assessment to corrective action. This integration will empower companies to proactively address ESG risks and drive continuous improvement.

Author Contributions

Methodology, Z.Y. and B.C.; software, Z.Y.; validation, B.C. and S.C.; resources, S.C.; writing—original draft, Z.Y.; writing—review and editing, B.C. and S.C. All authors have read and agreed to the published version of the manuscript.

Funding

This research was funded by the National Natural Science Foundation of China, grant number 72474047, and the Ministry of Education of China Humanities and Social Sciences Research Project, grant number 23YJA630004.

Data Availability Statement

The original contributions presented in the study are included in the article. Please contact the corresponding author for further information.

Acknowledgments

We thank the editor and anonymous reviewers who provided very helpful comments that improved this paper.

Conflicts of Interest

The authors declare no conflicts of interest.

Abbreviations

The following abbreviations are used in this manuscript:
ESGEnvironmental, Social, and Governance
LLMLarge Language Model
XGBoostExtreme Gradient Boosting
SHAPSHapley Additive exPlanation
CoTChain-of-Thought
NLPNatural Language Processing
RAGRetrieval-Augmented Generation
LoRALow-Rank Adaptation
KGKnowledge Graph
APIApplication Programming Interface

References

  1. Global ESG Assets Predicted to Hit $40 Trillion by 2030, Despite Challenging Environment, Forecasts Bloomberg Intelligence. 2025. Available online: https://www.bloomberg.com/company/press/global-esg-assets-predicted-to-hit-40-trillion-by-2030-despite-challenging-environment-forecasts-bloomberg-intelligence (accessed on 20 June 2025).
  2. Eccles, R.G.; Kastrapeli, M.D.; Potter, S.J. How to Integrate ESG into Investment Decision-Making: Results of a Global Survey of Institutional Investors. J. Appl. Corp. Financ. 2017, 29, 125–133. [Google Scholar] [CrossRef]
  3. van Duuren, E.; Plantinga, A.; Scholtens, B. ESG Integration and the Investment Management Process: Fundamental Investing Reinvented. J. Bus. Ethics 2016, 138, 525–533. [Google Scholar] [CrossRef]
  4. Yoo, S.; Managi, S. Disclosure or action: Evaluating ESG behavior towards financial performance. Financ. Res. Lett. 2022, 44, 102108. [Google Scholar] [CrossRef]
  5. Li, S. Enterprise Value Assessment Based on ESG Evaluation. Front. Bus. Econ. Manag. 2022, 4, 48–51. [Google Scholar] [CrossRef]
  6. Zeng, H.; Yu, C.; Zhang, G. How does green manufacturing enhance corporate ESG performance?—Empirical evidence from machine learning and text analysis. J. Environ. Manag. 2024, 370, 122933. [Google Scholar] [CrossRef] [PubMed]
  7. Chen, S.; Song, Y.; Gao, P. Environmental, social, and governance (ESG) performance and financial outcomes: Analyzing the impact of ESG on financial performance. J. Environ. Manag. 2023, 345, 118829. [Google Scholar] [CrossRef]
  8. Bezerra, R.R.R.; Martins, V.W.B.; Macedo, A.N. Validation of Challenges for Implementing ESG in the Construction Industry Considering the Context of an Emerging Economy Country. Appl. Sci. 2024, 14, 6024. [Google Scholar] [CrossRef]
  9. Adewumi, A.S.; Opoku, A.; Dangana, Z. Sustainability assessment frameworks for delivering Environmental, Social, and Governance (ESG) targets: A case of Building Research Establishment Environmental Assessment Method (BREEAM) UK New Construction. Corp. Soc. Responsib. Environ. Manag. 2024, 31, 3779–3791. [Google Scholar] [CrossRef]
  10. Building Materials and the Climate: Constructing a New Future. 2023. Available online: https://www.unep.org/resources/report/building-materials-and-climate-constructing-new-future (accessed on 21 July 2025).
  11. Construction Fatalities Hit Highest Number in More Than a Decade. 2024. Available online: https://www.newsweek.com/construction-fatalities-hit-highest-number-over-decade-2004244 (accessed on 21 July 2025).
  12. Construction Worker Deaths on the Rise, HSE Confirms. 2024. Available online: https://www.constructionnews.co.uk/health-and-safety/construction-worker-deaths-reach-four-year-high-hse-reveals-21-11-2024/ (accessed on 21 July 2025).
  13. Zhang, H.; Xia, B.; Li, Q.; Wang, X. The effect of self-enhancement motivation and political skill on the relationship between workplace exclusion and ingratiation. Curr. Psychol. 2025, 44, 5399–5412. [Google Scholar] [CrossRef]
  14. Dai, Y.; Tong, X.; Jia, X. Executives’ Legal Expertise and Corporate Innovation. Corp. Gov. Int. Rev. 2024, 32, 954–983. [Google Scholar] [CrossRef]
  15. Yang, Y.; Du, Z.; Zhang, Z.; Tong, G.; Zhou, R. Does ESG Disclosure Affect Corporate-Bond Credit Spreads? Evidence from China. Sustainability 2021, 13, 8500. [Google Scholar] [CrossRef]
  16. Bilivogui, P.; Iqbal, M.A. Do ESG scores matter? An empirical analysis of corporate financial performance in BRICS economies. Environ. Res. Commun. 2025, 7, 065023. [Google Scholar] [CrossRef]
  17. Gao, J.; Chu, D.; Zheng, J.; Ye, T. Environmental, social and governance performance: Can it be a stock price stabilizer? J. Clean. Prod. 2022, 379, 134705. [Google Scholar] [CrossRef]
  18. Gyönyörová, L.; Martin, S.; Stašek, D. ESG ratings: Relevant information or misleading clue? Evidence from the S&P Global 1200. J. Sustain. Financ. Investig. 2023, 13, 1075–1109. [Google Scholar] [CrossRef]
  19. Zhang, A.Y.; Zhang, J.H. Renovation in environmental, social and governance (ESG) research: The application of machine learning. Asian Rev. Account. 2024, 32, 554–572. [Google Scholar] [CrossRef]
  20. Higgins, C.; Tang, S.; Stubbs, W. On managing hypocrisy: The transparency of sustainability reports. J. Bus. Res. 2020, 114, 395–407. [Google Scholar] [CrossRef]
  21. Chatterji, A.K.; Durand, R.; Levine, D.I.; Touboul, S. Do ratings of firms converge? Implications for managers, investors and strategy researchers. Strateg. Manag. J. 2016, 37, 1597–1614. [Google Scholar] [CrossRef]
  22. Berg, F.; Kölbel, J.F.; Rigobon, R. Aggregate Confusion: The Divergence of ESG Ratings*. Rev. Financ. 2022, 26, 1315–1344. [Google Scholar] [CrossRef]
  23. Lee, H.; Kim, J.H.; Jung, H.S. ESG-KIBERT: A new paradigm in ESG evaluation using NLP and industry-specific customization. Decis. Support Syst. 2025, 193, 114440. [Google Scholar] [CrossRef]
  24. Escrig-Olmedo, E.; Fernández-Izquierdo, M.Á.; Ferrero-Ferrero, I.; Rivera-Lirio, J.M.; Muñoz-Torres, M.J. Rating the Raters: Evaluating how ESG Rating Agencies Integrate Sustainability Principles. Sustainability 2019, 11, 915. [Google Scholar] [CrossRef]
  25. Lou, S.; You, X.; Xu, T. Sustainable Supplier Evaluation: From Current Criteria to Reconstruction Based on ESG Requirements. Sustainability 2024, 16, 757. [Google Scholar] [CrossRef]
  26. da Cunha, Í.G.F.; Policarpo, R.V.S.; de Oliveira, P.C.S.; Abdala, E.C.; do Nascimento Rebelatto, D.A. A systematic review of ESG indicators and corporate performance: Proposal for a conceptual framework. Future Bus. J. 2025, 11, 106. [Google Scholar] [CrossRef]
  27. Yu, K.; Wu, Q.; Chen, X.; Wang, W.; Mardani, A. An integrated MCDM framework for evaluating the environmental, social, and governance (ESG) sustainable business performance. Ann. Oper. Res. 2024, 342, 987–1018. [Google Scholar] [CrossRef]
  28. Lee, J.; Lee, J.; Lee, C.; Kim, Y. Identifying ESG Trends of International Container Shipping Companies Using Semantic Network Analysis and Multiple Case Theory. Sustainability 2023, 15, 9441. [Google Scholar] [CrossRef]
  29. Li, H.; Yang, W.; Tang, S.; Yin, J.; Li, X. The ESG index evaluation system for idol economy is constructed based on the two levels of companies and individuals and the correlation is verified. BCP Bus. Manag. 2022, 23, 1342. [Google Scholar] [CrossRef]
  30. Kang, H.; Kim, J. Analyzing and Visualizing Text Information in Corporate Sustainability Reports Using Natural Language Processing Methods. Appl. Sci. 2022, 12, 5614. [Google Scholar] [CrossRef]
  31. Schimanski, T.; Reding, A.; Reding, N.; Bingler, J.; Kraus, M.; Leippold, M. Bridging the gap in ESG measurement: Using NLP to quantify environmental, social, and governance communication. Financ. Res. Lett. 2024, 61, 104979. [Google Scholar] [CrossRef]
  32. Fischbach, J.; Adam, M.; Dzhagatspanyan, V.; Mendez, D.; Frattini, J.; Kosenkov, O.; Elahidoost, P. Automatic ESG Assessment of Companies by Mining and Evaluating Media Coverage Data: NLP Approach and Tool. In Proceedings of the 2023 IEEE International Conference on Big Data (BigData), Sorrento, Italy, 15–18 December 2023; pp. 2823–2830. [Google Scholar]
  33. Zhang, M.; Shen, Q.; Zhao, Z.; Wang, S.; Huang, G.Q. Optimizing ESG reporting: Innovating with E-BERT models in nature language processing. Expert Syst. Appl. 2025, 265, 125931. [Google Scholar] [CrossRef]
  34. Lee, H.; Lee, S.H.; Park, H.; Kim, J.H.; Jung, H.S. ESG2PreEM: Automated ESG grade assessment framework using pre-trained ensemble models. Heliyon 2024, 10, e26404. [Google Scholar] [CrossRef]
  35. Bronzini, M.; Nicolini, C.; Lepri, B.; Passerini, A.; Staiano, J. Glitter or gold? Deriving structured insights from sustainability reports via large language models. EPJ Data Sci. 2024, 13, 41. [Google Scholar] [CrossRef]
  36. Shimamura, T.; Tanaka, Y.; Managi, S. Evaluating the impact of report readability on ESG scores: A generative AI approach. Int. Rev. Financ. Anal. 2025, 101, 104027. [Google Scholar] [CrossRef]
  37. Wang, Q. Generative AI-assisted evaluation of ESG practices and information delays in ESG ratings. Financ. Res. Lett. 2025, 74, 106757. [Google Scholar] [CrossRef]
  38. Jiang, L.; Gu, Y.; Dai, J. Environmental, Social, and Governance Taxonomy Simplification: A Hybrid Text Mining Approach. J. Emerg. Technol. Account. 2023, 20, 305–325. [Google Scholar] [CrossRef]
  39. Sun, Z.; Satapathy, R.; Guo, D.; Li, B.; Liu, X.; Zhang, Y.; Tan, C.A.; Filho, R.S.; Goh, R.S.M. Information Extraction: Unstructured to Structured for ESG Reports. In Proceedings of the 2024 IEEE International Conference on Data Mining Workshops (ICDMW), Abu Dhabi, United Arab Emirates, 9 December 2024; pp. 487–495. [Google Scholar]
  40. Liu, M.; Luo, X.; Lu, W.-Z. Public perceptions of environmental, social, and governance (ESG) based on social media data: Evidence from China. J. Clean. Prod. 2023, 387, 135840. [Google Scholar] [CrossRef]
  41. Zhang, H.; Zhang, Y.; Wang, X.; Zhang, L.; Ji, L. An interactive multi-task ESG classification method for Chinese financial texts. Appl. Intell. 2024, 55, 191. [Google Scholar] [CrossRef]
  42. Baier, P.; Berninger, M.; Kiesel, F. Environmental, social and governance reporting in annual reports: A textual analysis. Financ. Mark. Inst. Instrum. 2020, 29, 93–118. [Google Scholar] [CrossRef]
  43. Ignatov, K. When ESG talks: ESG tone of 10-K reports and its significance to stock markets. Int. Rev. Financ. Anal. 2023, 89, 102745. [Google Scholar] [CrossRef]
  44. O’Leary, D.E.; Yoon, Y. Using Machine Learning to Generate a Dictionary for Environmental Issues. In Machine Learning and Knowledge Extraction, Proceedings of the 7th IFIP TC 5, TC 12, WG 8.4, WG 8.9, WG 12.9 International Cross-Domain Conference, CD-MAKE 2023, Benevento, Italy, 29 August–1 September 2023, Proceedings; Springer: Cham, Switzerland, 2023; pp. 141–154. [Google Scholar] [CrossRef]
  45. D’Amato, V.; D’Ecclesia, R.; Levantesi, S. ESG score prediction through random forest algorithm. Comput. Manag. Sci. 2022, 19, 347–373. [Google Scholar] [CrossRef]
  46. Khan, M.H.; Zein Alabdeen, Z.; Anupam, A. Firm-level climate change risk and adoption of ESG practices: A machine learning prediction. Bus. Process Manag. J. 2024, 30, 1741–1763. [Google Scholar] [CrossRef]
  47. Ghallabi, F.; Souissi, B.; Du, A.M.; Ali, S. ESG stock markets and clean energy prices prediction: Insights from advanced machine learning. Int. Rev. Financ. Anal. 2025, 97, 103889. [Google Scholar] [CrossRef]
  48. Li, H.; Yang, R.; Xu, S.; Xiao, Y.; Zhao, H. Intelligent Checking Method for Construction Schemes via Fusion of Knowledge Graph and Large Language Models. Buildings 2024, 14, 2502. [Google Scholar] [CrossRef]
  49. Angioni, S.; Consoli, S.; Dessì, D.; Osborne, F.; Recupero, D.R.; Salatino, A. Exploring Environmental, Social, and Governance (ESG) Discourse in News: An AI-Powered Investigation Through Knowledge Graph Analysis. IEEE Access 2024, 12, 77269–77283. [Google Scholar] [CrossRef]
  50. Hu, E.J.; Shen, Y.; Wallis, P.; Allen-Zhu, Z.; Li, Y.; Wang, S.; Chen, W. Lora: Low-rank adaptation of large language models. ICLR 2022, 1, 3. [Google Scholar] [CrossRef]
  51. Zhong, W.; Huang, J.; Wu, M.; Luo, W.; Yu, R. Large language model based system with causal inference and Chain-of-Thoughts reasoning for traffic scene risk assessment. Knowl. Based Syst. 2025, 319, 113630. [Google Scholar] [CrossRef]
  52. Lee, J.; Kim, M. ESG information extraction with cross-sectoral and multi-source adaptation based on domain-tuned language models. Expert Syst. Appl. 2023, 221, 119726. [Google Scholar] [CrossRef]
  53. Wei, J.; Wang, X.Z.; Schuurmans, D.; Bosma, M.; Ichter, B. Chain-of-Thought prompting elicits reasoning in large language models. Adv. Neural Inf. Process. Syst. 2022, 35, 24824–24837. [Google Scholar] [CrossRef]
  54. Fine-Tuning—SiliconFlow. 2025. Available online: https://docs.siliconflow.cn/en/userguide/guides/fine-tune (accessed on 21 July 2025).
  55. Lagasio, V. ESG-washing detection in corporate sustainability reports. Int. Rev. Financ. Anal. 2024, 96, 103742. [Google Scholar] [CrossRef]
  56. Yu, H.; Liang, C.; Wang, W.; Liu, X. Does environmental, social, and governance news coverage affect the cost of equity? A textual analysis of media coverage. Front. Public Health 2025, 13, 1509167. [Google Scholar] [CrossRef]
  57. Lee, H.; Kim, J.H.; Jung, H.S. Deep-learning-based stock market prediction incorporating ESG sentiment and technical indicators. Sci. Rep. 2024, 14, 10262. [Google Scholar] [CrossRef]
  58. Hajek, P.; Sahut, J.-M.; Myskova, R. Predicting corporate credit ratings using the content of ESG reports. Ann. Oper. Res. 2024. [Google Scholar] [CrossRef]
  59. Lohmann, C.; Möllenhoff, S.; Lehner, S. On the Relationship Between Financial Distress and ESG Scores. Corp. Soc. Responsib. Environ. Manag. 2025; in press. [Google Scholar] [CrossRef]
  60. Kiriu, T.; Nozaki, M. A Text Mining Model to Evaluate Firms’ ESG Activities: An Application for Japanese Firms. Asia-Pac. Financ. Mark. 2020, 27, 621–632. [Google Scholar] [CrossRef]
  61. Zou, Y.; Shi, M.; Chen, Z.; Deng, Z.; Lei, Z.; Zeng, Z.; Yang, S.; Tong, H.; Xiao, L.; Zhou, W. ESGReveal: An LLM-based approach for extracting structured data from ESG reports. J. Clean. Prod. 2025, 489, 144572. [Google Scholar] [CrossRef]
  62. Wood, K.; Pyun, C.; Pham, H. Beyond Green Labels: Assessing Mutual Funds’ ESG Commitments through Large Language Models. Financ. Res. Lett. 2025, 74, 106713. [Google Scholar] [CrossRef]
Figure 1. The LLM-based intelligent ESG evaluation model framework.
Buildings 15 02710 g001
Figure 2. ESG dictionary construction flowchart.
Buildings 15 02710 g002
Figure 3. Cypher statements.
Buildings 15 02710 g003
Figure 4. Sample ESG knowledge graph for construction companies.
Buildings 15 02710 g004
Figure 5. Sample single-sentence analysis prompt template.
Buildings 15 02710 g005
Figure 6. Sample of the comprehensive analysis prompt template.
Buildings 15 02710 g006
Figure 7. Prototype system architecture.
Buildings 15 02710 g007
Figure 8. LLM-Based intelligent ESG evaluation model prototype.
Buildings 15 02710 g008
Figure 9. (a) Category-level SHAP contribution analysis donut chart; (b) category-level SHAP contribution analysis bar chart.
Buildings 15 02710 g009
Figure 10. (a) Action-level SHAP contribution analysis donut chart; (b) action-level SHAP contribution analysis bar chart.
Buildings 15 02710 g010
Figure 11. Sentence-level analysis scatter plot.
Buildings 15 02710 g011
Figure 12. (a) ESG report sentence classification; (b) environmental dimension score; (c) social dimension score; (d) governance dimension score, and overall rating and recommendations.
Buildings 15 02710 g012
Figure 13. (a) China CAMC Engineering Co., Ltd. ESG performance. (b) China Communications Construction Company Ltd. ESG performance.
Buildings 15 02710 g013
Table 1. ESG knowledge graph entity types.
Entity TypeDescriptionExamples/Details
CompanyConstruction companies in the dataset30 companies analyzed
ESG RatingClassification system for ESG performanceA/B/C rating classifications
ESG SentenceTextual content from company disclosures, includes the sentence score as an attributeRaw text data from company reports
ActionSpecific ESG activities and initiativesConcrete ESG actions mentioned in disclosures
CategoryESG framework dimensionsEnvironmental, social, and governance
Calculated contribution valuesSHAP analysis-derived scores
Table 2. ESG knowledge graph relationship type.
Relationship TypeConnectionDescription
has_ratingCompany → ESG RatingLinks companies to their ESG performance ratings
contains_sentenceCompany → ESG SentenceAssociates companies with their disclosure sentences
belongs_to_actionESG Sentence → ActionMaps sentences to specific ESG actions
assigned_scoreESG Sentence →ESG SentenceLinks sentences to their SHAP contribution scores
categorized_asAction → CategoryClassifies actions into ESG dimensions
Table 3. ESG rating data for Chinese construction companies in 2024.
Company
(In Chinese)
CompanySinoSec
ESG
Rating 2024
Wind
ESG
Rating 2024
SynTao
ESG
Rating 2024
Average
ESG
Rating 2024
东华科技East China Engineering Science and Technology Co., Ltd.BBBBB+B
中国中冶China Metallurgical Group CorporationBBBAB+A
中国中铁China Railway Group LimitedBAB+B
中国交建China Communications Construction Company Ltd.BBAB+B
中国化学China National Chemical Engineering Co., Ltd.BBBBBB+B
中国建筑China State Construction Engineering CorporationBBBBBB+B
中国核建China Nuclear Engineering & Construction Corporation Ltd.CCCBBBC
中国海诚China Haisum Engineering Co., Ltd.BBBBBB+B
中国电建Power Construction Corporation of China, Ltd.CCCBBBB+B
中国能建China Energy Engineering Group Co., Ltd. ABBBB+B
中国铁建China Railway Construction Corporation LimitedBBBBB+B
中工国际China CAMC Engineering Co., Ltd.AAA−A
中材国际Sinoma International Engineering Co., Ltd.AAAA−A
中船科技CSSC Steel Structure Engineering Co., Ltd.BBBBBBA−A
中钢国际SINOSTEEL CORPORATIONBBBBBB+B
中铝国际China Aluminum International Engineering Co., Ltd.BBBBA−B
北方国际Norinco International Cooperation Ltd.BBBAA−A
国机重装SINOMACH−HE Heavy Equipment Group Co., Ltd.BBBBBBA−A
天健集团Shenzhen Tagen Group Co., Ltd.CCCBBBC
宏润建设Hong Run Construction Group Co., Ltd.CCBBB−C
山东路桥Shandong High-Speed Road & Bridge Co., Ltd.CCCBBBC
普邦股份Pubang Landscape Architecture Co., Ltd.BBB+C
棕榈股份Palm Eco-Town Development Co., Ltd.CCBBB+C
汇绿生态Hui Lyu Ecological Technology Groups Co., Ltd.BBBBC
浙江交科Zhejiang Communications Technology Co., Ltd.BBAB+B
浙江建投Zhejiang Construction Investment Group Co., Ltd.BBBBBB+B
浦东建设Shanghai Pudong Construction Co., ltd.BBAA−A
空港股份Beijing Airport High-Tech Park Co., Ltd.CCBB−C
苏文电能Suwen Electric Energy Technology Co., Ltd.BBBAB+A
龙建股份Longjian Road & Bridge Co., Ltd.BAB+B
Table 4. Construction company ESG sentence sample.
CompanySentenceCategoryAction
East China Engineering Science and TechnologyThe company’s key green office initiatives include installing infrared sensors for switches, setting air conditioning temperatures to no lower than 26 °C in summer and no higher than 20 °C in winter, centrally turning off AC systems after work hours while keeping windows closed when AC operates, and powering off office appliances after hours and during holidays to reduce standby energy consumption.EnvironmentGreen office,
Energy-saving, Low consumption
SINOMACH-HE Heavy EquipmentUpon completion, the project will actively contribute to promoting local infrastructure development, enhancing agricultural growth and the green economy, ensuring South Africa’s national energy security, while simultaneously creating substantial employment opportunities, driving economic development, and enhancing social well-being.SocialJob creation,
Public welfare, Sustainable development
China MetallurgicalMCC Group ensures timely information disclosure through shareholder meetings and roadshows, maintains transparent information sharing, improves investment returns, and strengthens company risk management and internal control systems.GovernanceInformation transparency,
Risk control
Table 5. Comparison of the two machine learning algorithms’ performance.
AlgorithmRMSER2 Score
Random Forest6.290.2875
XGBoost5.100.5312
Table 6. LLM fine-tuning parameters.
ParameterValueDescription
Learning Rate0.0001Controls the step size for parameter updates during training
Number of Epochs5Number of complete passes through the training dataset
Batch Size16Number of samples processed simultaneously
LoRA Rank16Dimensionality of low-rank decomposition matrices
LoRA Alpha32Scaling factor that controls the magnitude of LoRA adaptations
LoRA Dropout0.1Regularization technique that randomly zeroes LoRA parameters during training
Max Tokens32,768Maximum sequence length the model can process
Table 7. 2024 ESG rating prediction results for Chinese construction companies.
Company
(In Chinese)
CompanyAverage
ESG
Rating 2024
Prediction ScorePrediction ESG
Rating
东华科技East China Engineering Science and Technology Co., Ltd.B69.99997711B
中国中冶China Metallurgical Group CorporationA72.61679077B
中国中铁China Railway Group LimitedB69.99997711B
中国交建China Communications Construction Company Ltd.B70.00016022B
中国化学China National Chemical Engineering Co., Ltd.B70.01068878B
中国建筑China State Construction Engineering CorporationB70.00011444B
中国核建China Nuclear Engineering & Construction Corporation Ltd.C60.00028229C
中国海诚China Haisum Engineering Co., Ltd.B69.99997711B
中国电建Power Construction Corporation of China, Ltd.B70.00011444B
中国能建China Energy Engineering Group Co., Ltd.B69.99997711B
中国铁建China Railway Construction Corporation LimitedB69.99997711B
中工国际China CAMC Engineering Co., Ltd.A79.99990845A
中材国际Sinoma International Engineering Co., Ltd.A79.9997406A
中船科技CSSC Steel Structure Engineering Co., Ltd.A79.99973297A
中钢国际SINOSTEEL CORPORATIONB69.99997711B
中铝国际China Aluminum International Engineering Co., Ltd.B70.00011444B
北方国际Norinco International Cooperation Ltd.A77.22226715A
国机重装SINOMACH-HE Heavy Equipment Group Co., Ltd.A79.998703A
天健集团Shenzhen Tagen Group Co., Ltd.C60.00028229C
宏润建设Hong Run Construction Group Co., Ltd.C60.00028229C
山东路桥Shandong High-Speed Road & Bridge Co., Ltd.C70.16632843B
普邦股份Pubang Landscape Architecture Co., Ltd.C60.00028229C
棕榈股份Palm Eco-Town Development Co., Ltd.C60.00028229C
汇绿生态Hui Lyu Ecological Technology Groups Co., Ltd.C60.00028229C
浙江交科Zhejiang Communications Technology Co., Ltd.B70.00000000B
浙江建投Zhejiang Construction Investment Group Co., Ltd.B69.99983978B
浦东建设Shanghai Pudong Construction Co., Ltd.A79.99988556A
空港股份Beijing Airport High-Tech Park Co., Ltd.C60.00028229C
苏文电能Suwen Electric Energy Technology Co., Ltd.A77.21237946A
龙建股份Longjian Road & Bridge Co., Ltd.B69.99997711B
Table 8. ESG rating evaluation for Chinese construction companies in 2025.
Company
(In Chinese)
CompanyAverage
ESG
Rating 2025
Baseline
Evaluation
LLM
Evaluation
LLM+KG
Evaluation
Evaluation
Results
AccuracyEvaluation
Results
AccuracyEvaluation
Results
Accuracy
中国中冶China Metallurgical Group CorporationABBBBB
CBBCB
0%ABBBB
ACABA
40%BBBAA
BAABA
50%
中国交建China Communications Construction Company Ltd. ABBABB
ABBBB
20%CBBCB
ABBAA
30%BBCAA
BAAAB
50%
东华科技 East China Engineering Science and Technology Co., Ltd.BCCBCB
CBCCC
30%BBCBB
CBABC
60%BABBB
ABBBB
80%
中国建筑China State Construction Engineering CorporationBABABA
BABAB
50%BBBBC
BCBBB
80%BBBBA
BBBBB
90%
中国核建China Nuclear Engineering & Construction Corporation Ltd.CBBBBB
BBBCB
10%BCCBC
CBCBC
60%BCBBC
CCCCA
60%
中钢国际SINOSTEEL CORPORATIONCABBBC
ABCBC
30%BBCBC
CBCCB
50%BACCC
CCCAB
60%
Disclaimer/Publisher’s Note: The statements, opinions and data contained in all publications are solely those of the individual author(s) and contributor(s) and not of MDPI and/or the editor(s). MDPI and/or the editor(s) disclaim responsibility for any injury to people or property resulting from any ideas, methods, instructions or products referred to in the content.

