Article

Influence of Friction on Pre-Stressing Construction of Suspen-Dome Structures

1
School of Civil Engineering, Liaoning Technical University, Fuxin 123000, China
2
China Construction Sixth Engineering Division Decoration Co., Ltd., Taicang 215400, China
*
Author to whom correspondence should be addressed.
Buildings 2025, 15(15), 2697; https://doi.org/10.3390/buildings15152697 (registering DOI)
Submission received: 20 June 2025 / Revised: 18 July 2025 / Accepted: 20 July 2025 / Published: 31 July 2025
(This article belongs to the Section Building Structures)

Abstract

Suspension dome structures are widely utilized due to their superior performance compared to conventional structures. The condition of the cables, particularly the forces they experience, is critical for ensuring the safety of the overall structures. However, friction between cables and joints significantly disrupts cable force distribution, particularly during pre-stressing construction. This paper integrates a tension-compensation method with a numerical approach that accurately accounts for friction effects. A computational flowchart was introduced and subsequently applied to analyze a practical suspension dome structure. We assessed the impact of friction on cable forces, structural deformations, and the mechanical state of the cable–strut system. Furthermore, we quantified the consequences of excessive tensioning. The findings demonstrate that the method presented in this paper can efficiently be employed for the analysis of large-scale complex structures and is readily accessible to structural designers.

1. Introduction

The suspen-dome represents an innovative form of space reticulated structure, created through the fusion of a single-layer reticulated shell and a cable–strut system. In contrast to conventional single-layer reticulated shell structures, suspen-domes exhibit a more even distribution of spatial stiffness, place less load on supports, and possess enhanced spanning capabilities [1]. Cables are the key components in suspen-dome structures [2,3].
To date, numerous researchers have undertaken investigations into the mechanical properties of cables. Despite the widespread adoption of suspen-dome structures globally, certain challenges persist within this structural system, such as the impact of friction between hoop cables and cable–strut joints. Chen [4,5] and Liu [6,7,8] conducted research on the effects of cable sliding and friction. Chen introduced the concept of a multi-node sliding cable element to account for cable sliding, but this element did not incorporate friction considerations. Liu [6,7] proposed a method to consider friction by adopting Euler’s equation. The application of the dynamic relaxation (DR) method was expanded to address friction effects in tensioned structures, particularly those involving continuous cables, in [9].
In the majority of numerical analyses, cables are represented by an intermittent tensioning element within finite element software [10,11,12,13,14]. However, in practical scenarios, cables can experience sliding through joints, particularly during the pre-stressing construction phase. Consequently, modeling cables as intermittent elements can introduce errors into the analysis results. To address this issue and prevent inaccuracies caused by intermittent cables, numerous researchers have conducted studies. Some have utilized isoparametric elements to model continuous cables in cable-supported structures [15,16], while others have adopted catenary elements to address cable sliding problems [17,18]. Fan [19] took friction into account using a friction element. Nevertheless, the primary focus was on suspen-dome structures with ellipsoidal shapes, and the over-tensioning process was not considered.
None of the aforementioned studies fully addressed the practical challenge of efficiently quantifying friction effects in large-scale suspen-dome pre-stressing. While Liu [20] introduced an iterative algorithm for friction loss, it lacks integration with construction simulation. Wei [21] and Chen [22] proposed friction elements, but their reliance on complex programming limits application in industry. Recent work by Fan et al. [19] highlights the impact of friction on ellipsoidal suspen-domes but did not provide a user-friendly computational framework. This study fills this gap by combining a simplified iterative friction program with the tension-compensation method, enabling the accurate, efficient analysis of large structures without extensive coding.
Based on the aforementioned research background, this study integrates the author’s proposed iterative friction calculation algorithm with the tension-compensation method, establishing a comprehensive numerical simulation approach that accurately accounts for friction effects throughout the entire pre-stressing construction process of suspen-dome structures. This research addresses the core scientific question of how to precisely quantify the influence mechanisms of friction on cable force distribution, structural deformation, and over-tensioning effects during suspen-dome pre-stressing construction using an engineer-accessible methodology. The study further incorporates analysis of over-tensioning scenarios to provide theoretical support for engineering practice.
A critical challenge in suspen-dome pre-stressing is friction-induced cable force loss, which disrupts load distribution and threatens structural safety. During tensioning, sliding between hoop cables and joints generates friction, causing uneven force transmission. Existing methods either ignore friction (leading to inaccuracies) or use complex models (inaccessible to designers). This study addresses this challenge by developing a practical numerical tool to quantify friction’s impact on cable forces, deformations, and over-tensioning strategies. Unlike Abaqus-based models requiring custom user elements or SOFiSTiK’s simplified friction assumptions, our approach balances accuracy and efficiency. It performs well in complex scenarios (e.g., multi-node sliding in large-span domes where Abaqus fails to converge) while maintaining favorable computational efficiency and error control.

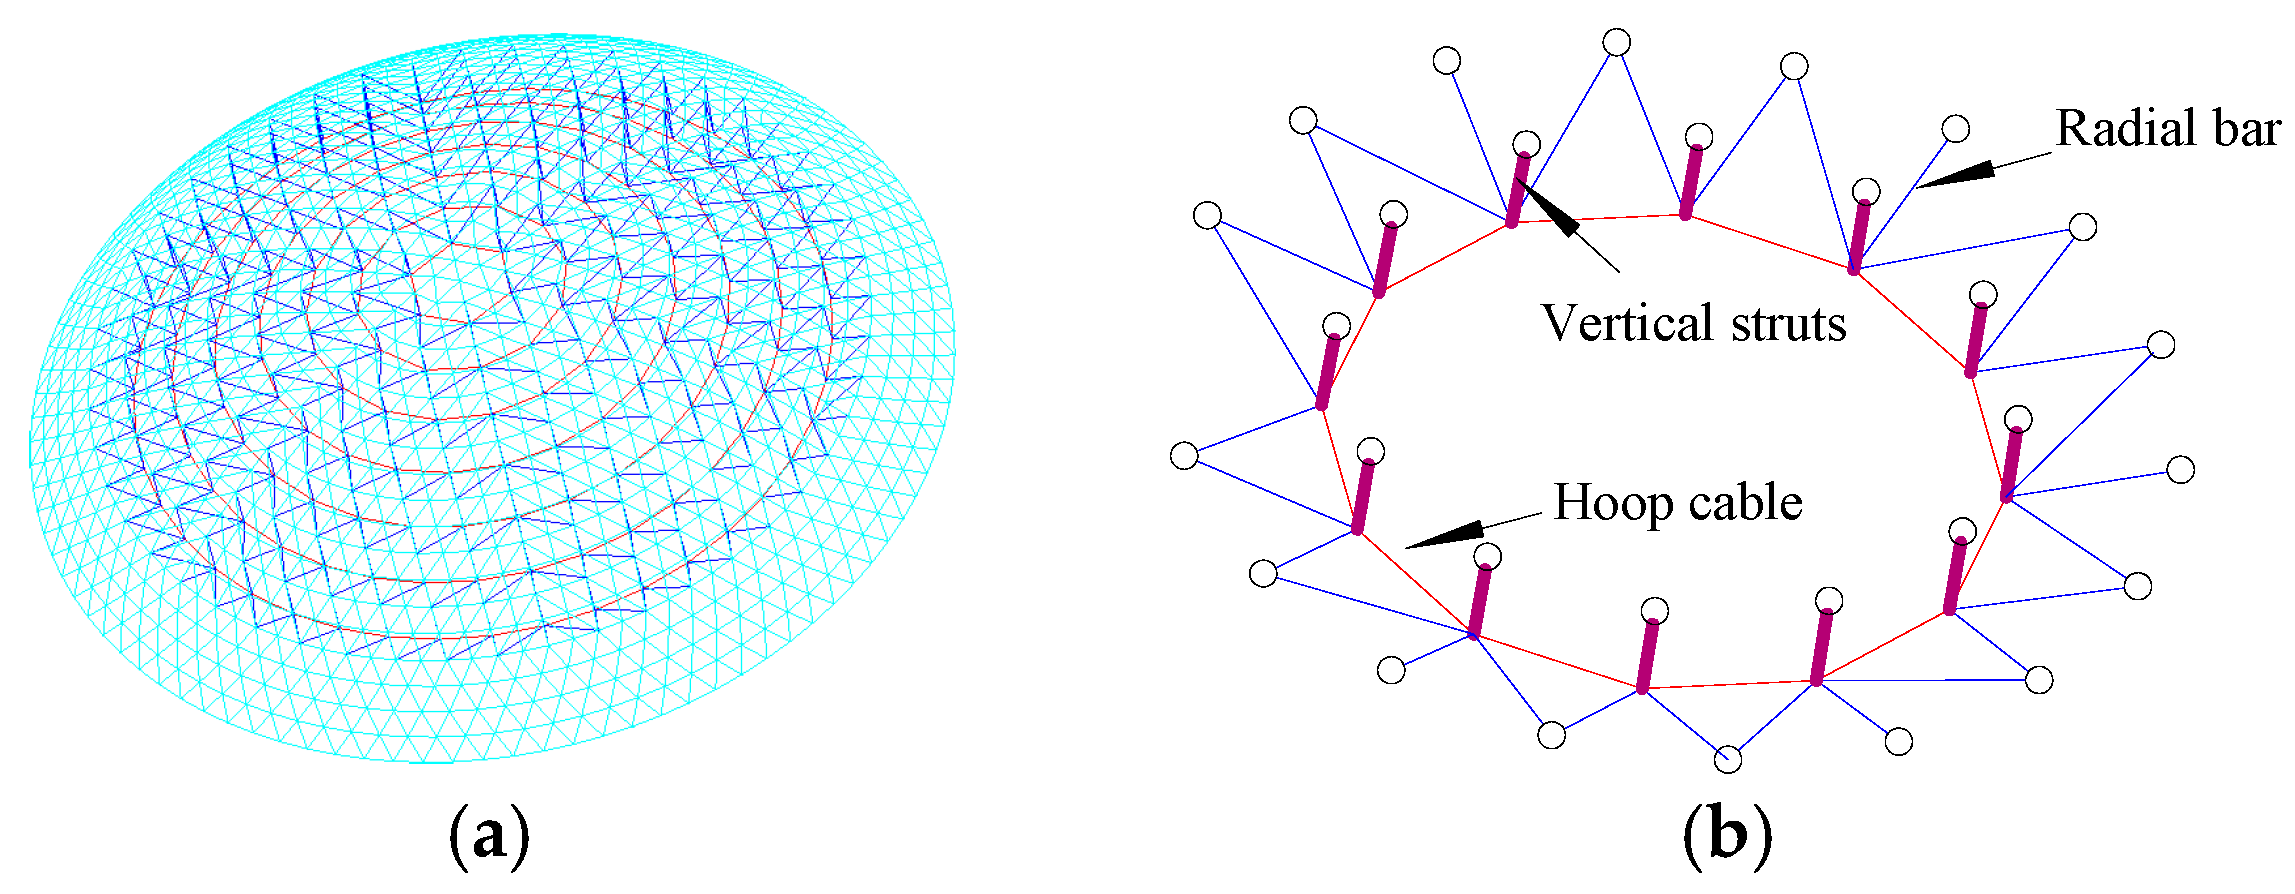
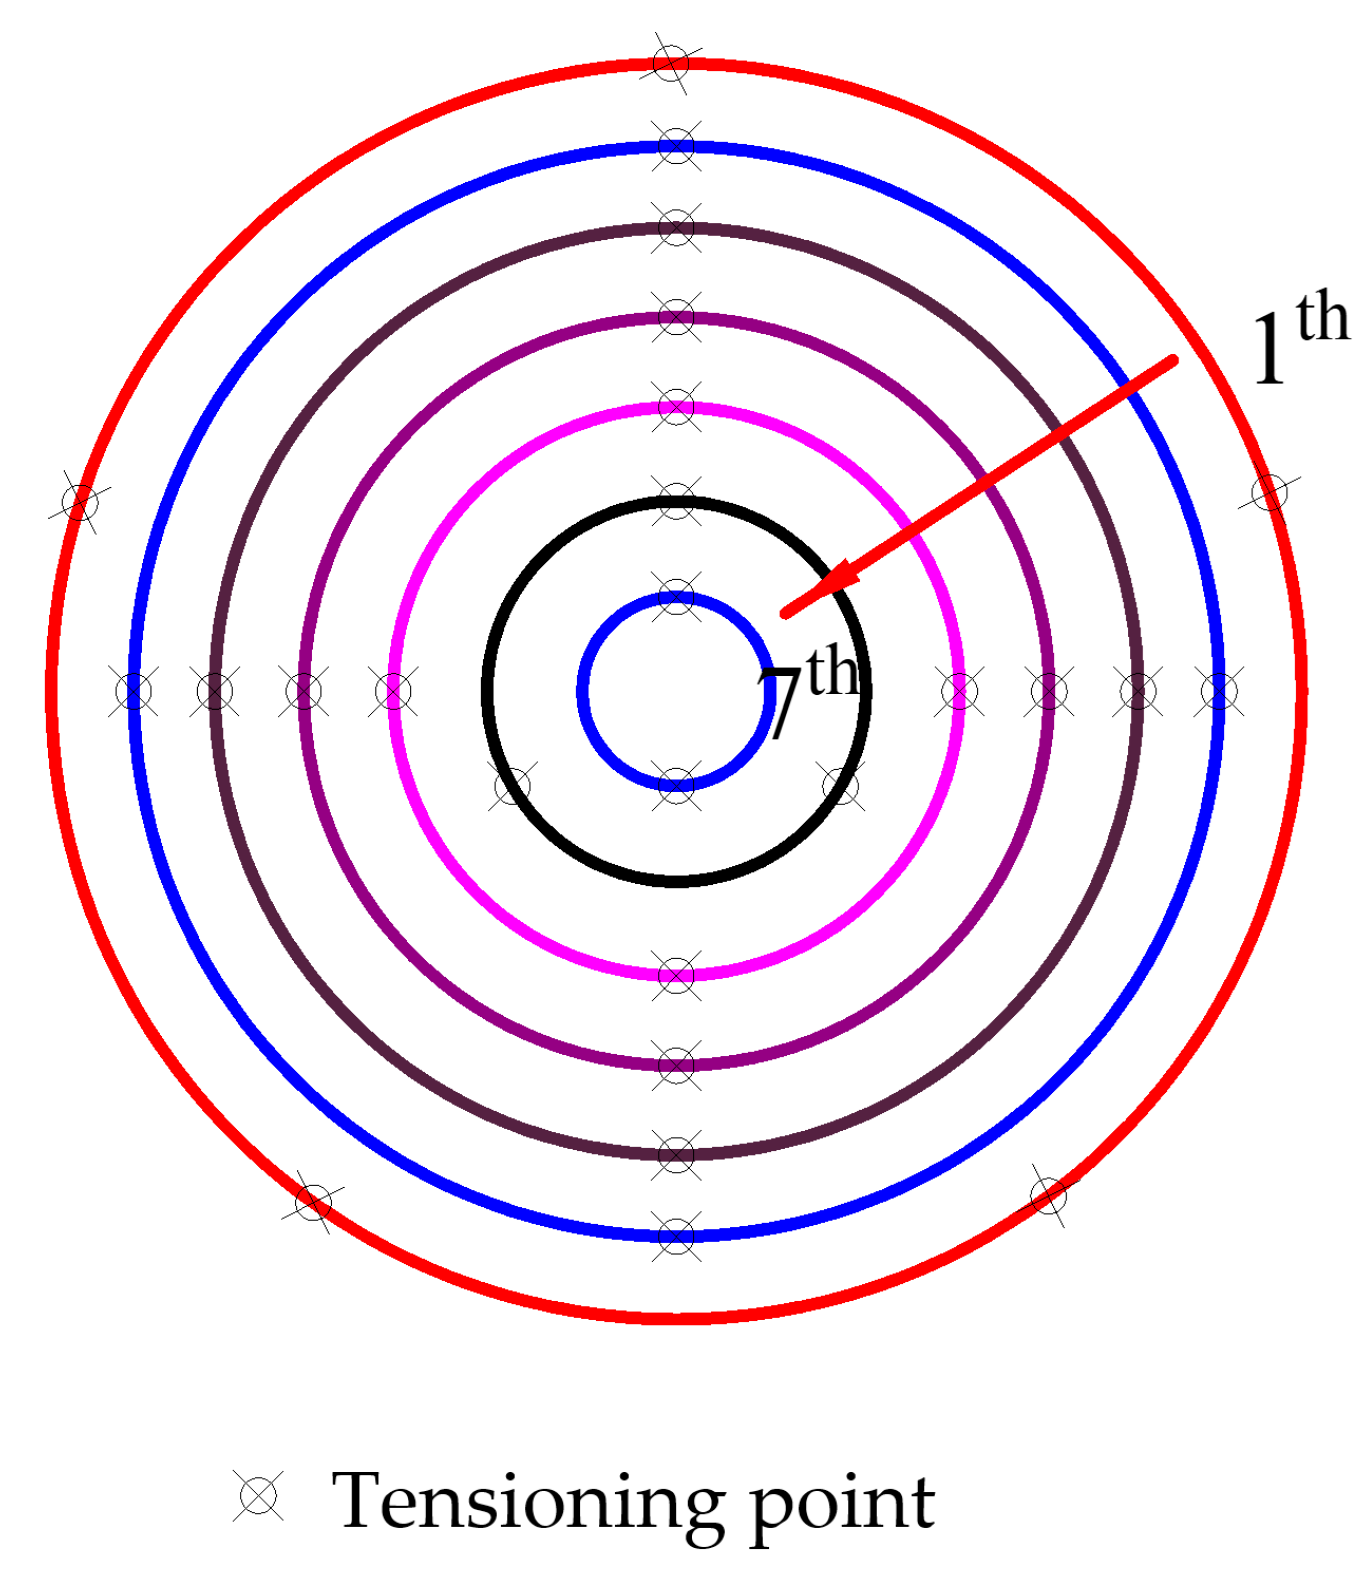
2. The Studied Model

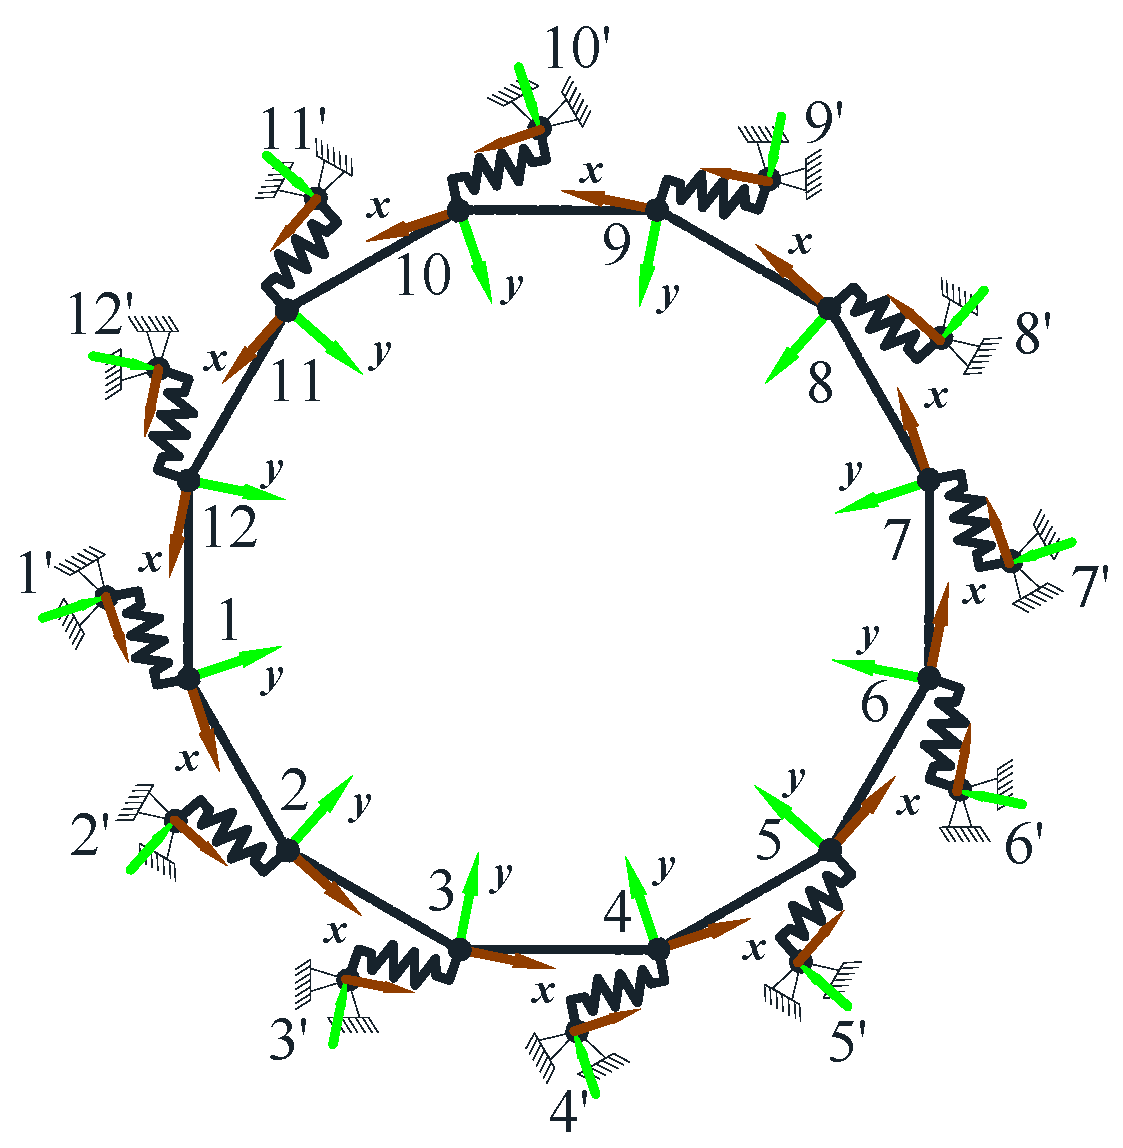
2.1. The Establishment of Numerical Model

The properties of the suspen-dome structure, including material parameters and structural configuration, are primarily based on references [23,24], with adjustments made to suit the specific research focus on friction effects. The same model and friction element are utilized to conduct a construction analysis of suspen-dome structures.
To investigate friction’s impact, a representative large-span suspen-dome was designed, mimicking practical engineering applications. The 108 m-diameter spherical roof with a 25.5 m vector height aligns with typical spans in public infrastructure. The Lamella–Kiewit composite lattice shell and seven cable–strut rings were selected based on industry standards, ensuring the model reflects real-world structural behavior. Material properties (Q345 steel, cables) and boundary conditions (simply supported with radial movement) were chosen to match common construction practices. The suspen-dome employed the Lamella–Kiewit composite single-layer lattice shell design, spanning 108 m. Seven rings of cable–strut systems were arranged under the single-layer lattice shell, with steel pipes of φ 203 mm × 6 mm, φ 219 mm × 7 mm, φ 245 mm × 7 mm, φ 273 mm × 8 mm, φ 299 mm × 8 mm as the principal members of the single-layer shell. In the lower suspen-dome, steel pipes of φ 219 mm × 7 mm were used as vertical struts; steel bars with a diameter of 80 mm were used as the radial bars; steel cables of φ 7 mm × 121 mm acted as four outer hoop cables; and steel cables of φ 7 mm × 73 were used as the three inner hoop cables. Pre-stresses in the hoop cables were uniformly set as 127, 420, 390, 530, 810, 1242, and 2060 kN. The upper arches were constructed using steel pipes with dimensions of φ 1000 mm × 16 mm and φ 1500 mm × 24 mm, while the struts connecting the suspen-dome to the arches utilized steel pipes with dimensions of φ 325 mm × 8 mm, φ 377 mm × 10 mm, and φ 426 mm × 10 mm. The elastic moduli for the steel (Q345) and the cables were 2.06 × 10⁵ N/mm2 and 1.8 × 10⁵ N/mm2, respectively. The structural boundary conditions were assumed as simply supported. The design included two sets of bearing rings: one at the outermost ring and another at the fourth outermost ring. The bearings allowed radial movement, while vertical movement was fixed, and hoop direction movement was elastically restrained with a stiffness coefficient of 2800 kN/m. The finite element model, as well as the cable and strut system, are depicted in Figure 1.
As illustrated in Figure 1b, the configuration of the hoop cable in suspen-dome structures takes the form of a broken line. In this section, we examine the suitability of the proposed numerical method. The stress distribution at the lower end of the vertical struts is depicted in Figure 2. The equilibrium equations in two horizontal directions can be derived as shown in Equation (1).
f n + T 2 sin α = T 1 sin α N = T 1 cos α + T 2 cos α
where f is the friction force and it can be calculated through Equation (2). The symbol μ indicates friction coefficient, N is normal force at the joint. The friction coefficient is influenced by surface conditions and material properties and can be considered constant when the hoop cable slides across the joint. Then, it can be concluded that the friction is just dependent on normal force. However, the normal force is dependent on cable force, so the friction can be calculated from cable force, which is shown as in Equation (3). The assumption of a constant friction coefficient (μ) is valid under stable environmental conditions (e.g., room temperature, dry surfaces). However, in practical scenarios, μ may vary with factors such as temperature fluctuations, surface contamination, or material wear. Thus, the model is most applicable to controlled construction environments where these factors are minimized.
f = μ N
f = μ ( T 1 cos α + T 2 cos α )
Since the spring element operates within the nodal coordinate system, adjustments to the nodal coordinates are necessary to accurately account for the friction’s influence. Figure 3 provides an illustration featuring a hoop cable with 12 joints. In this representation, the x-axis of the nodal coordinate system is aligned with the tangent direction of the hoop cable, while the y-axis aligns with the normal direction. The spring element’s KEYOPT (3) was configured as 0, enabling activation of UX (displacement along the nodal x-axis). This nonlinear spring element connects the hoop cable joint to an additional node, with the coordinate of the additional node matching that of the corresponding joints. For instance, node 1 and 1′ share identical coordinates, and their nodal coordinate systems align as well.
The nodes positioned at JHV need to adhere to specific criteria to ensure the accuracy of results obtained through this numerical model. Specifically, it is essential that the nodal displacement in both the x and z directions are identical. Achieving this requirement is facilitated by employing the “CP” command within the ANSYS (v2003) [25] code, which couples the translational freedom in these two directions. This allows the nonlinear spring element to operate in the nodal x direction, ensuring the integrity of the hoop cables, thus aligning with the actual conditions.

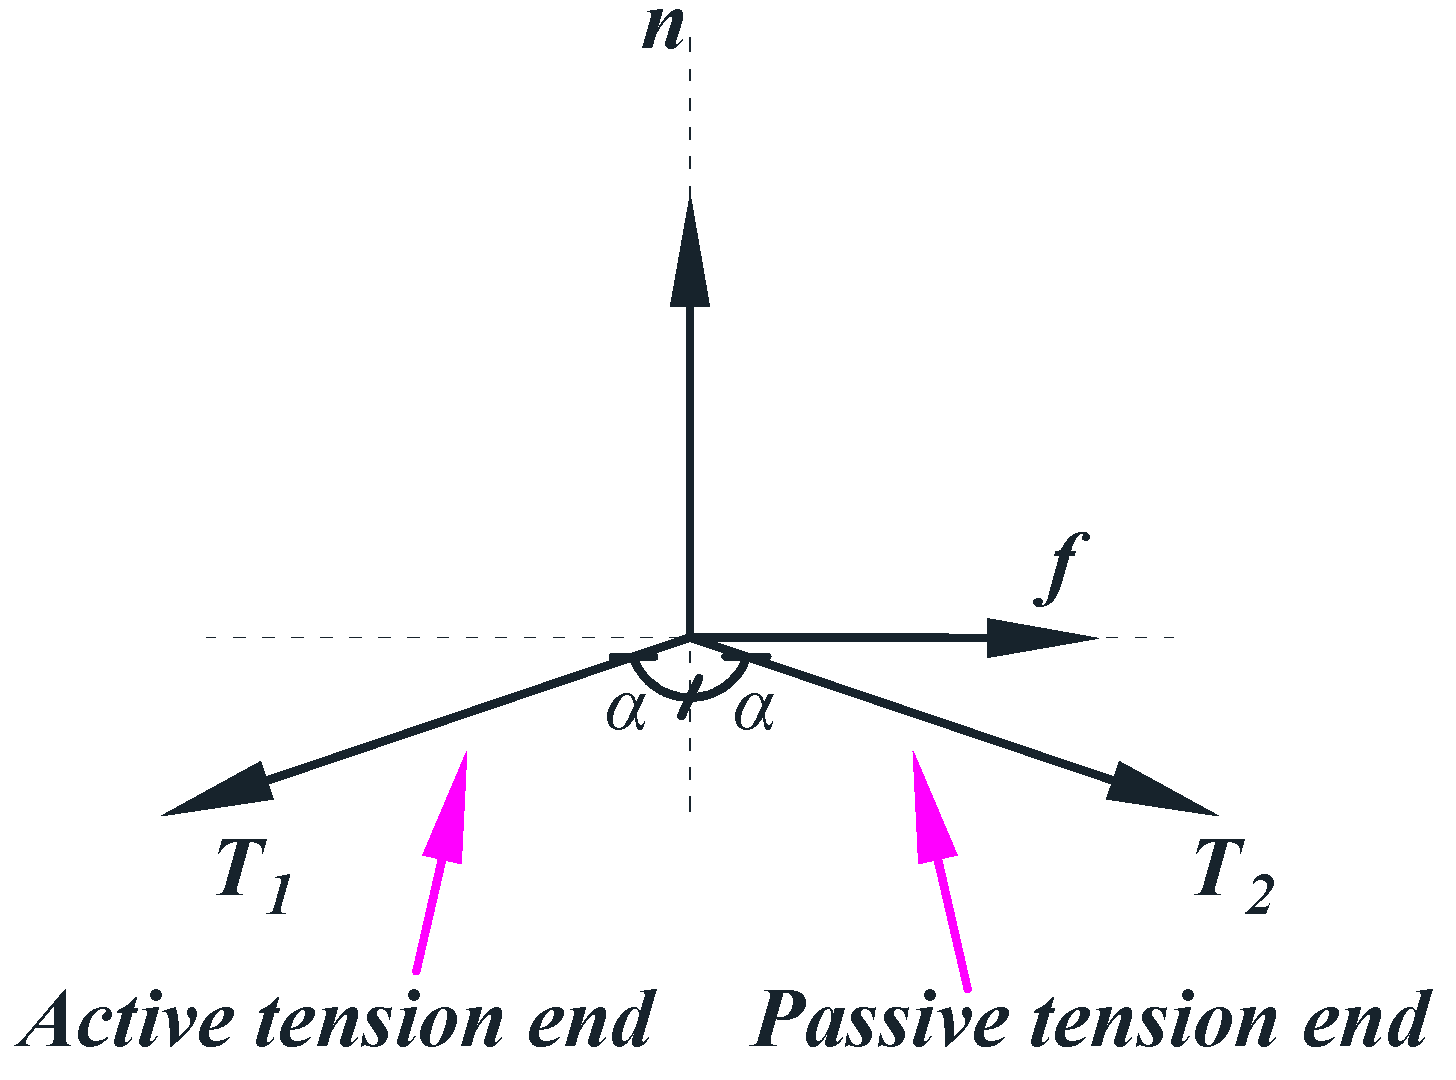
2.2. Verification of Friction Element

Experimental results were employed to verify the reliability of the proposed frictional element. The friction coefficient of the cable–strut joint, as depicted in Figure 4, was adjusted using an experimental device. This experimental work is divided into three groups based on different friction coefficient values. The experimental model is presented in Figure 4a. The value of T2 could be determined after the application of T1. Subsequently, the friction coefficient was calculated based on T1 and T2. This friction coefficient was then integrated into the numerical model, and T2 was determined through numerical analysis. The results are presented in Table 1. It can be concluded from these results that the proposed method aligns closely with the outcomes of the experimental work, thereby rigorously validating the reliability of the proposed numerical model. The experimental validation (μ = 0.1060, 0.1675, 0.2243) focuses on typical friction scenarios of steel cables and metal joints in practical engineering, which is consistent with the friction coefficient range of similar structures in the existing literature (e.g., engineering cases in ref. [21]). This supports the reliability of the model under conventional working conditions. The analysis involving high friction coefficients (μ = 0.5~2.0) in calculations aims to explore the theoretical influence of extreme friction conditions on structural responses, belonging to parametric research. Although high values are not directly covered by experiments, the core logic of the model (nonlinear relationship between friction and normal force, Equation (3)) has been verified through typical values. Moreover, the convergence of the numerical method (Figure 11 and Figure 12) indicates that the calculation results remain internally consistent under high friction coefficients.

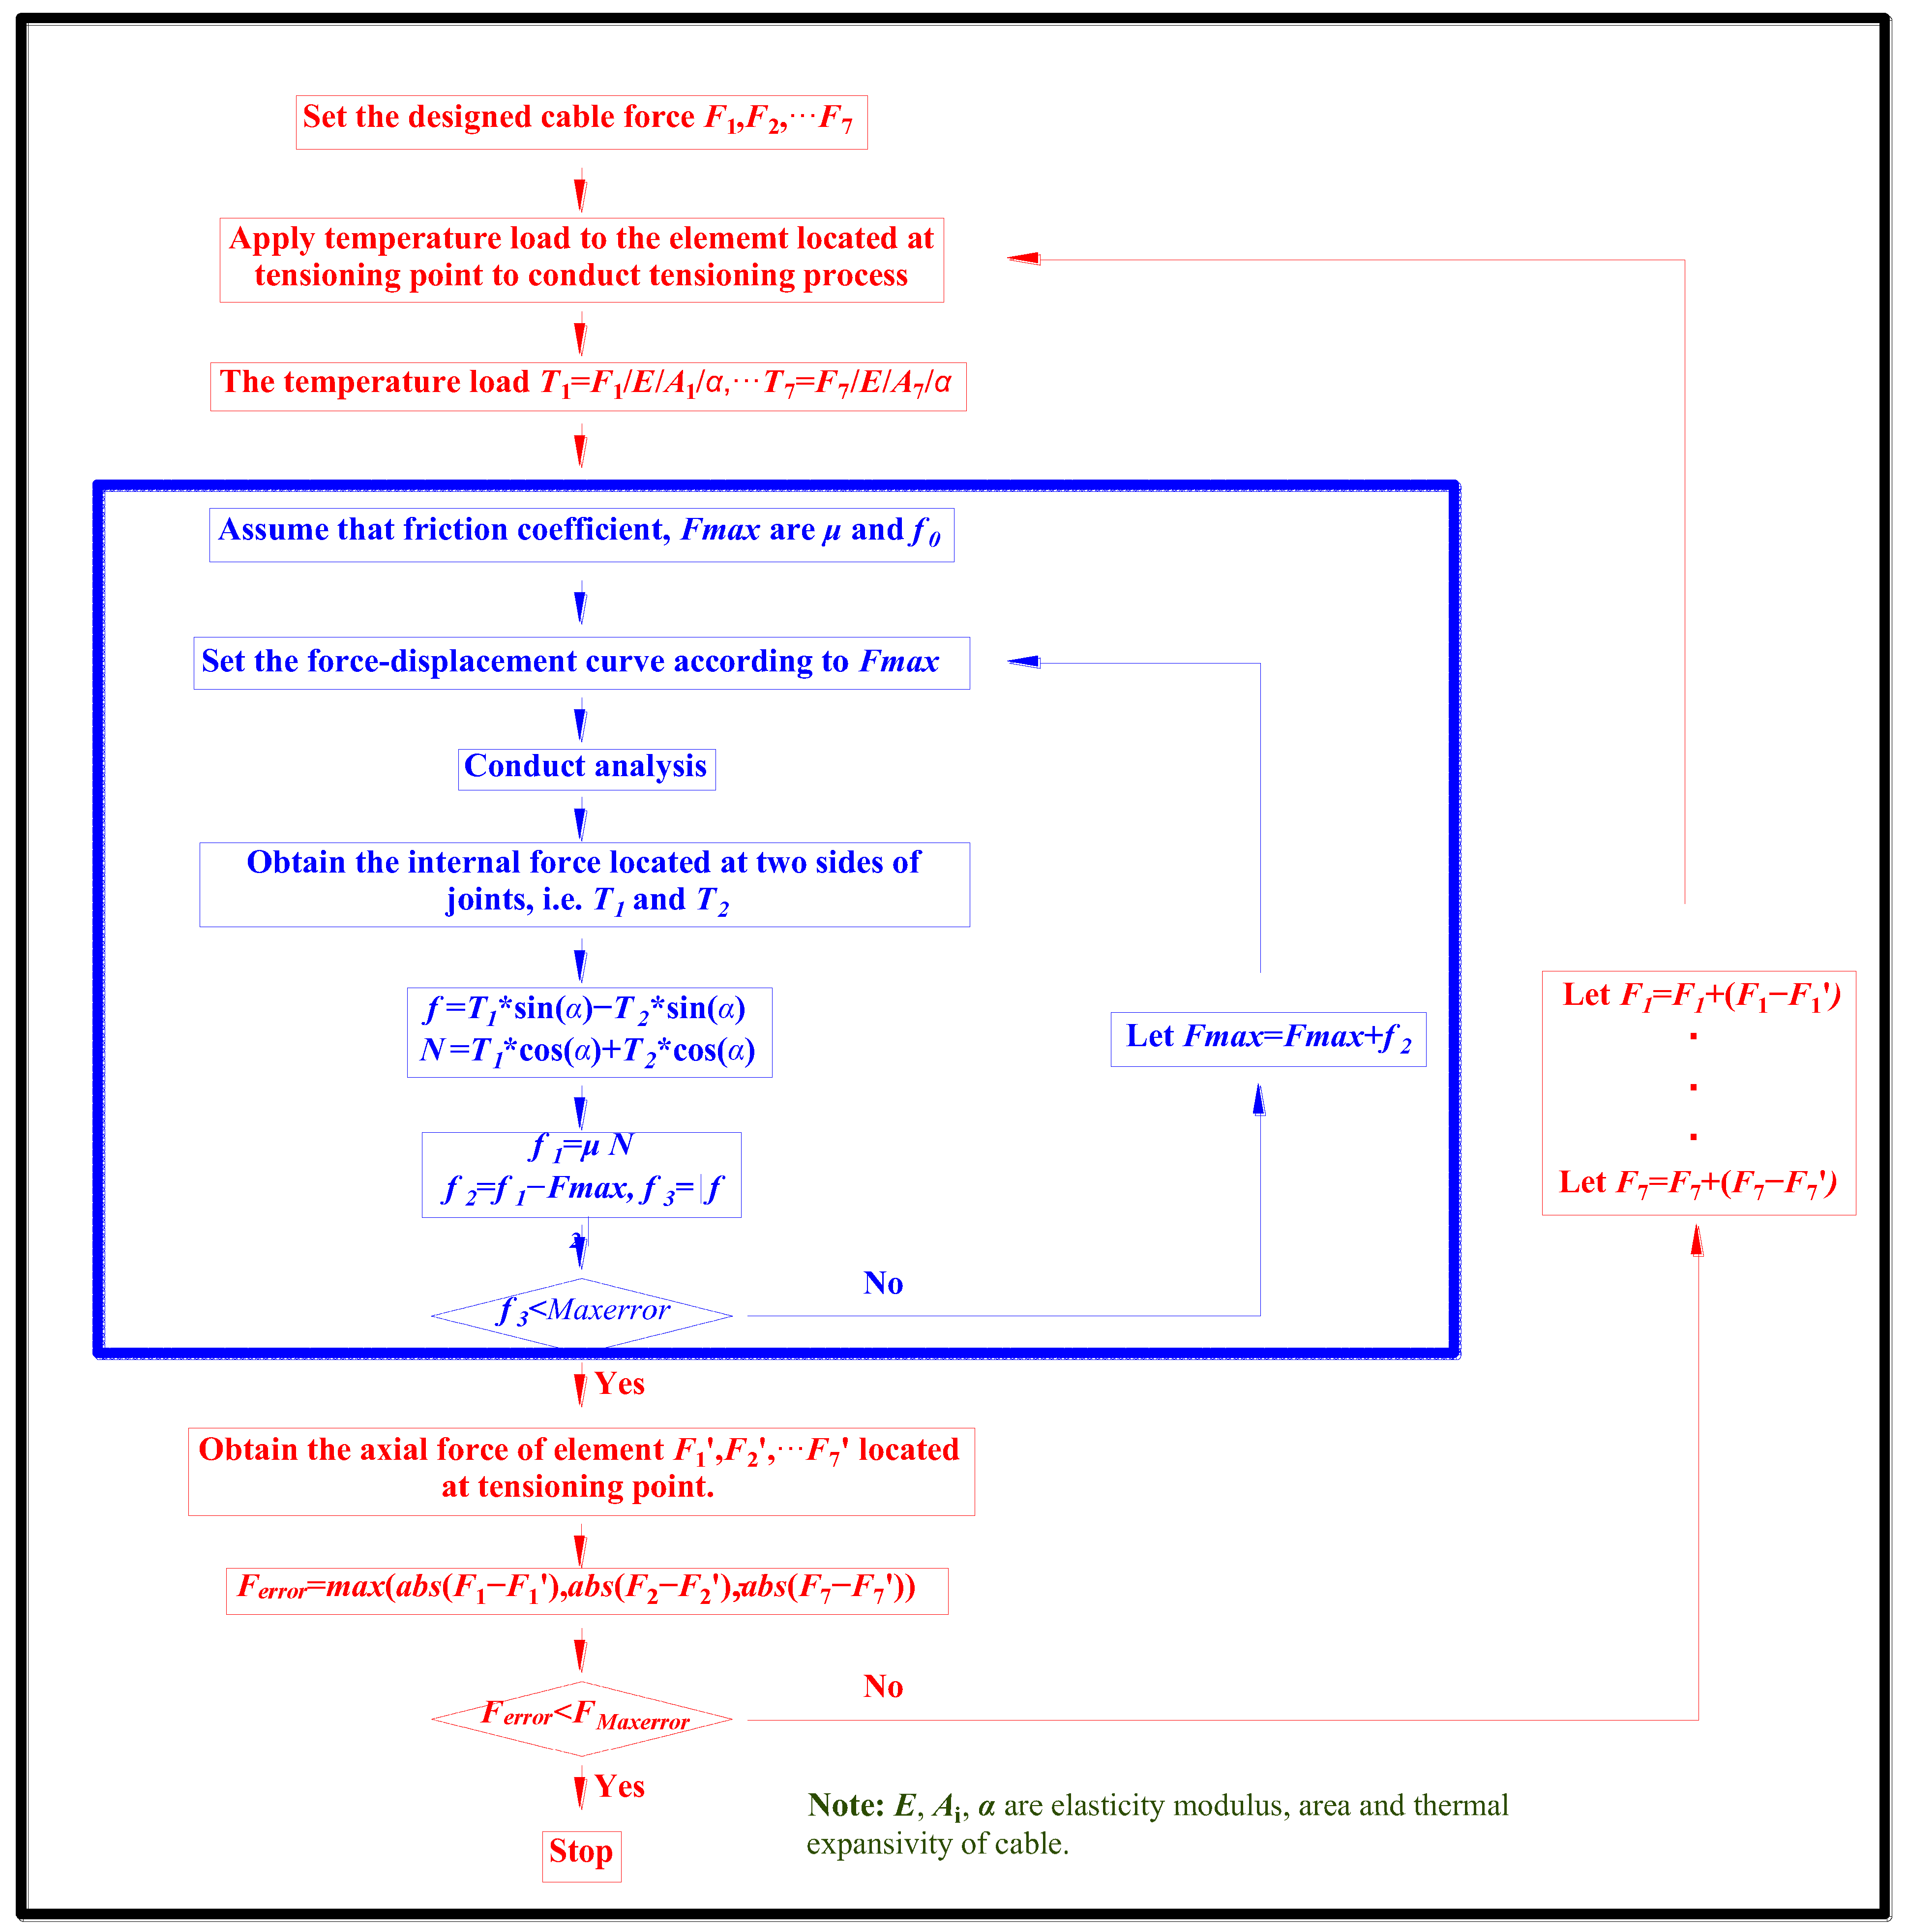
3. Flow Chart of Numerical Simulation

Pre-stressing construction of suspen-dome structure was always conducted by dividing the whole construction process into several steps. The cable force can reach thirty percent of the design value if the whole construction process is divided into three steps, for example. The tension-compensation method has been always adopted in numerical analyses of the pre-stressing construction of suspen-dome structures. Then, the controlling value of cable force of each cable at the end of every step can be derived by an iterative process.
Friction is a type of highly nonlinear behavior. It closely depends on the frictional coefficient and normal force between cable and joints. So, the friction changes from one constructional step to the next constructional step. So, iterative computation is also needed to obtain accurate friction.
An iterative program proposed by the author used for the calculation of friction was combined with the tension-compensation method described in this section. The whole pre-stressing construction of suspen-dome structures can be numerically simulated by accurately considering friction.

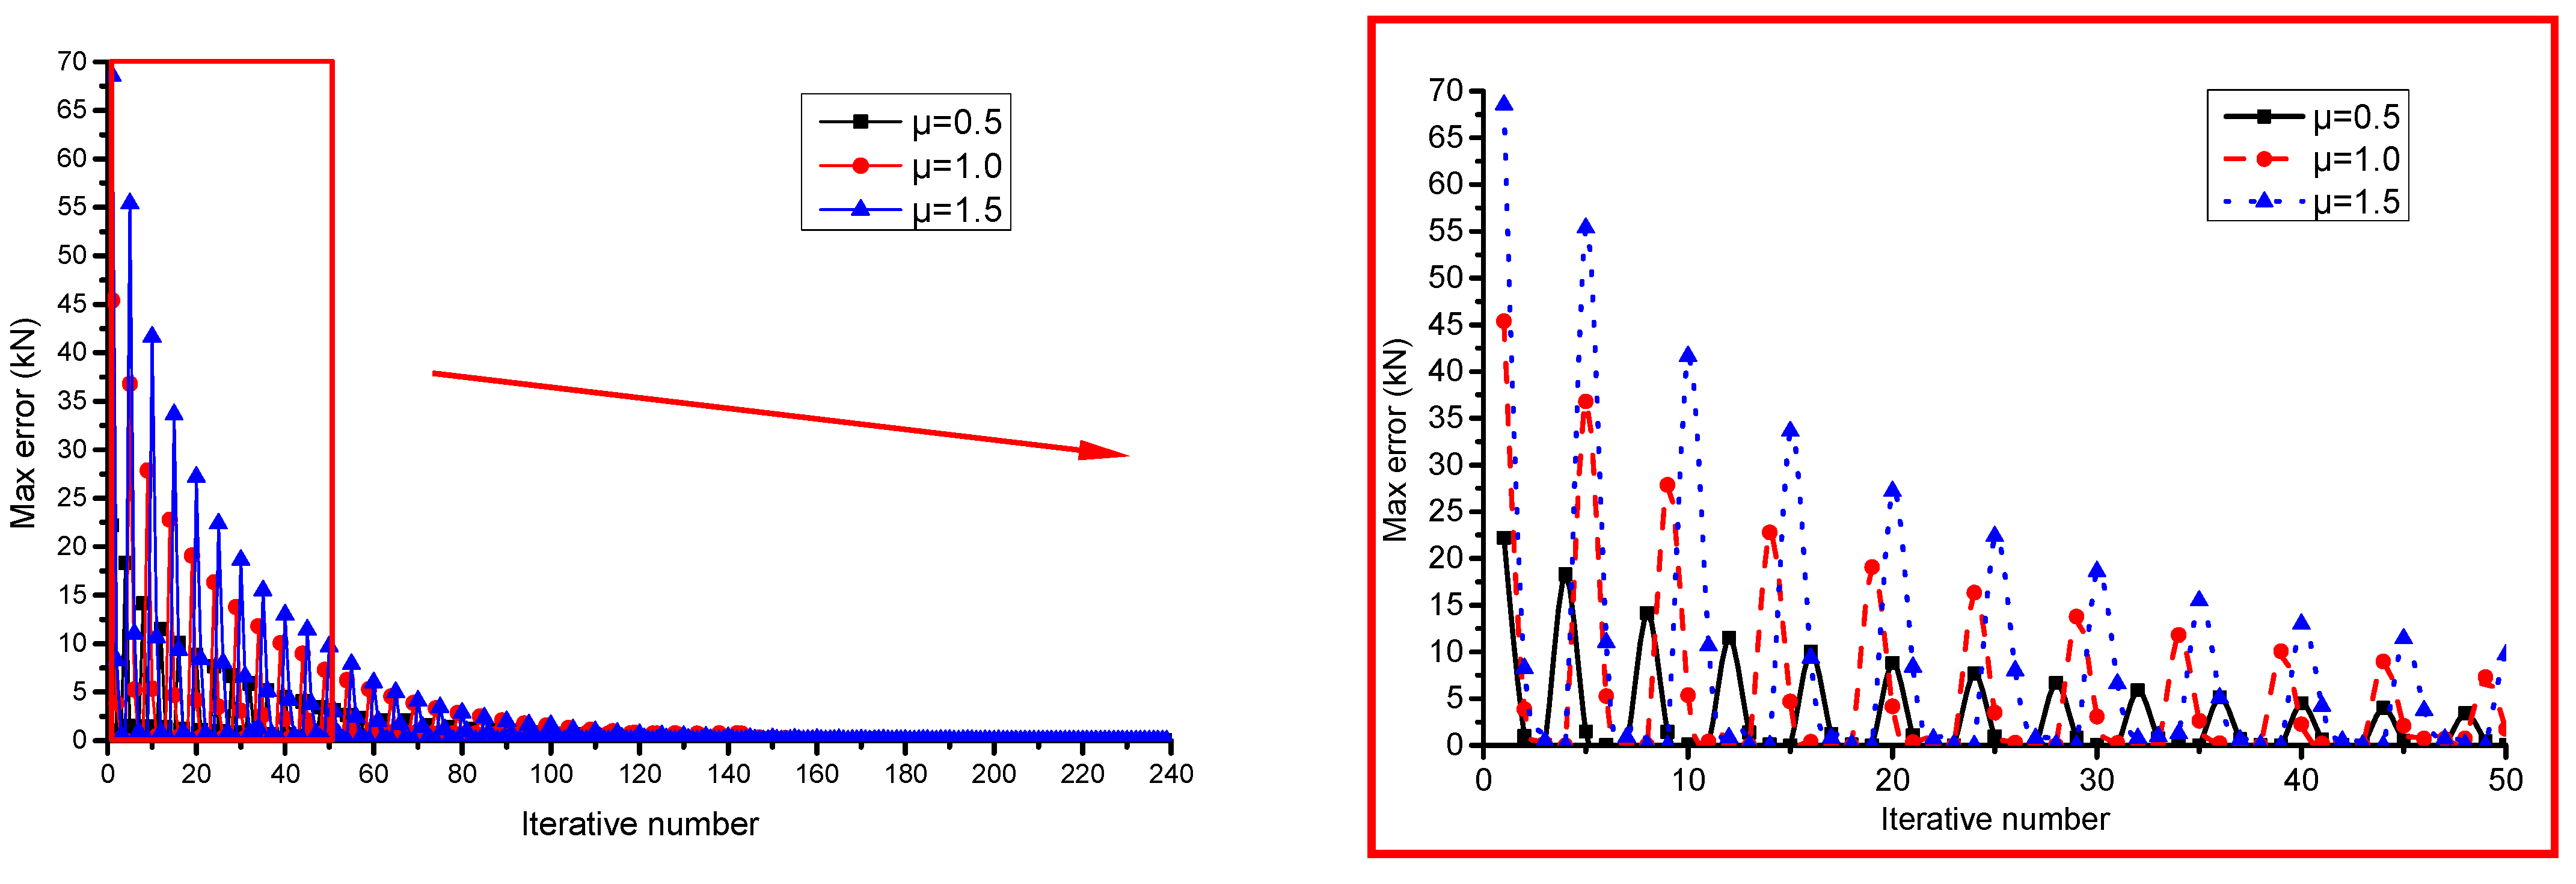
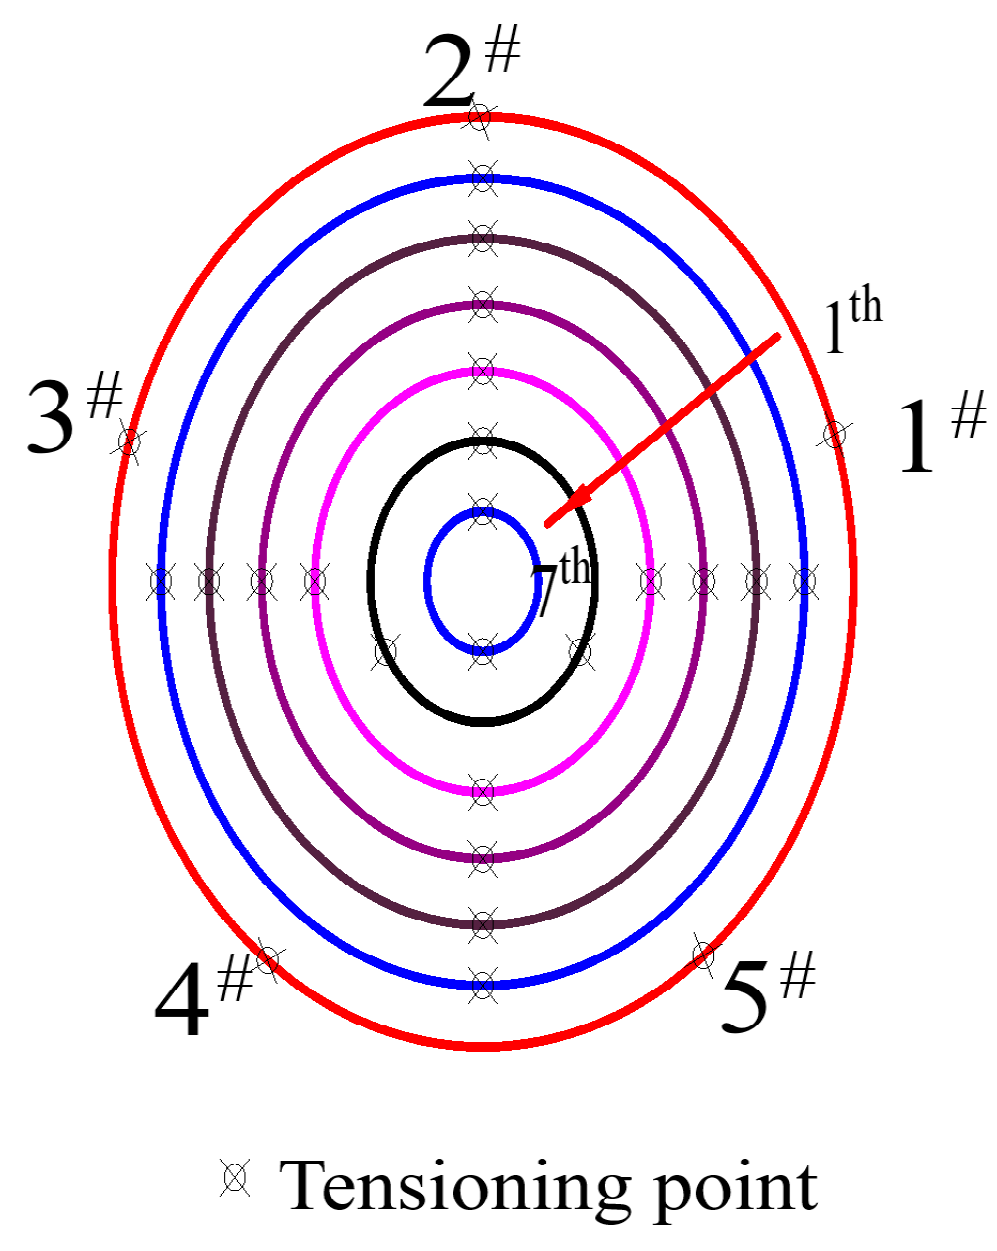
3.1. Calculation of the Friction

In practical projects, the friction is not known in advance as it is related to the cable force and friction coefficient (Figure 5).
As the friction force must satisfy Equations (1) and (2), the equilibrium equation for joint 1 can be derived as Equation (4). The T1 in Equation (4) is known, as it is the tensioning end. Then, the f1 and T2 can be obtained. Similarly, T2 is known for joint 2, so T3 and f2 can also be derived. The rest can be identified in the same manner. So, the cable force and friction are accurately determined when the tensioning force is determined. Notably, the algorithm does not account for temperature-induced cable slippage, which may occur due to thermal expansion/contraction of materials. This limitation should be considered in projects with significant temperature variations, where additional thermal analysis may be required.
f 1 + T 2 sin α = T 1 sin α f 1 = μ × ( T 1 cos α + T 2 cos α )
Based on this, an iterative program was proposed. A detailed flow chart of the iterative program is shown as in the blue part in Figure 6. The friction is first assumed as a constant value f0. Then, the internal force and two friction forces, f and f1, can be derived. If the two values are equal, it indicates that the friction forces are f, or the Fmax is modified, and the program is repeated until the result converges.

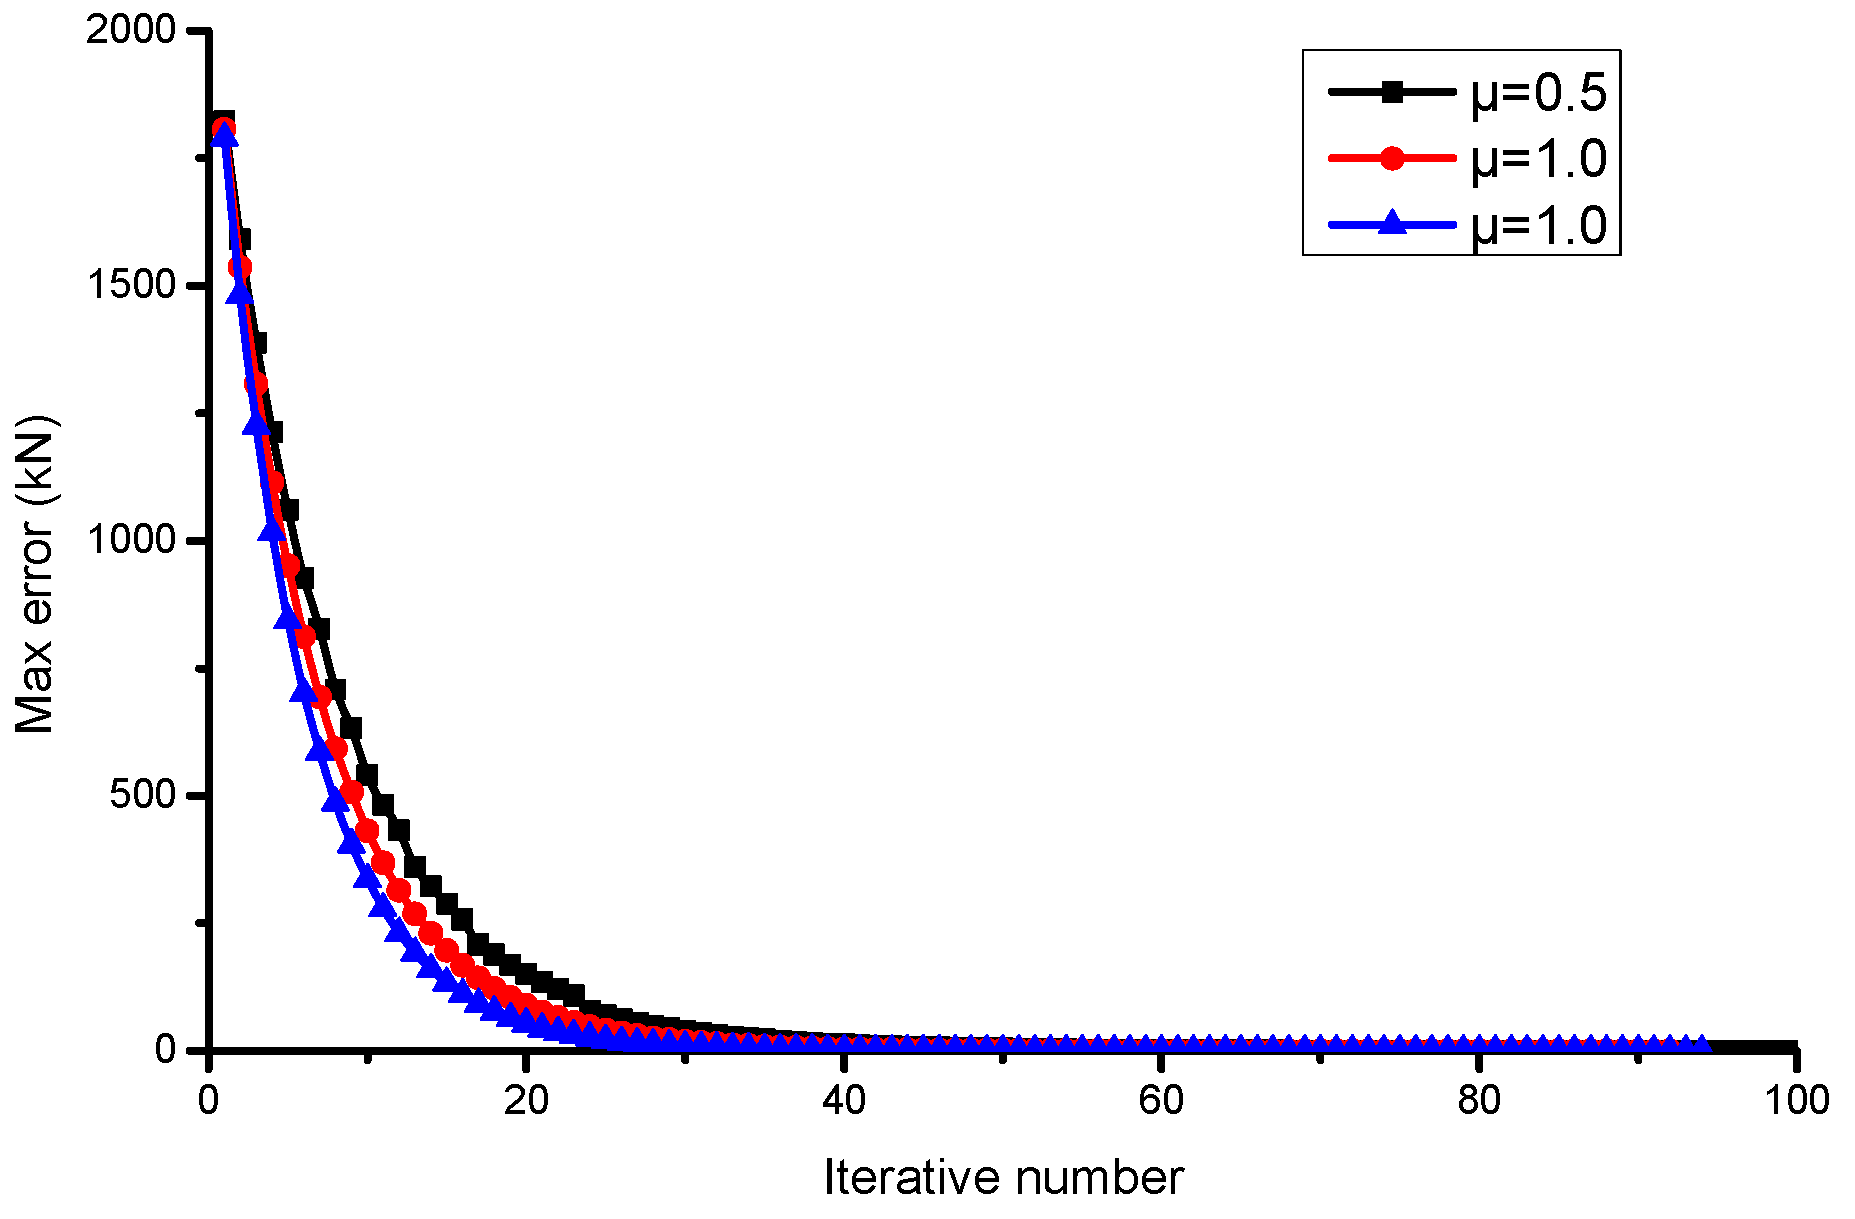
3.2. Tension-Compensation Method

The tension-compensation method is a gradual approach. The computation continues until the preassigned error is satisfied. The design value of cable force, F1, F2···Fi, was determined before construction. Then, the pretension force of the cable could be introduced by applying a temperature load to the element located at the tensioning point. But the cable force should be far less than the target value due to tension release caused by the deformation of upper latticed shell structure and the cable itself. So, the deviation between the actual value and target value was added to the original cable force to compute temperature load, which should be applied. This process continued until the preassigned error was satisfied.

4. Results and Discussions

The method presented in the previous section was adopted for the pre-stressing construction analysis of the model mentioned in Section 3. The number and detailed location of tensioning points is shown in Figure 7. The number of tensioning points was 5, 4, 4, 4, 4, 3, 2 for the cables located from the outermost to the innermost ring.

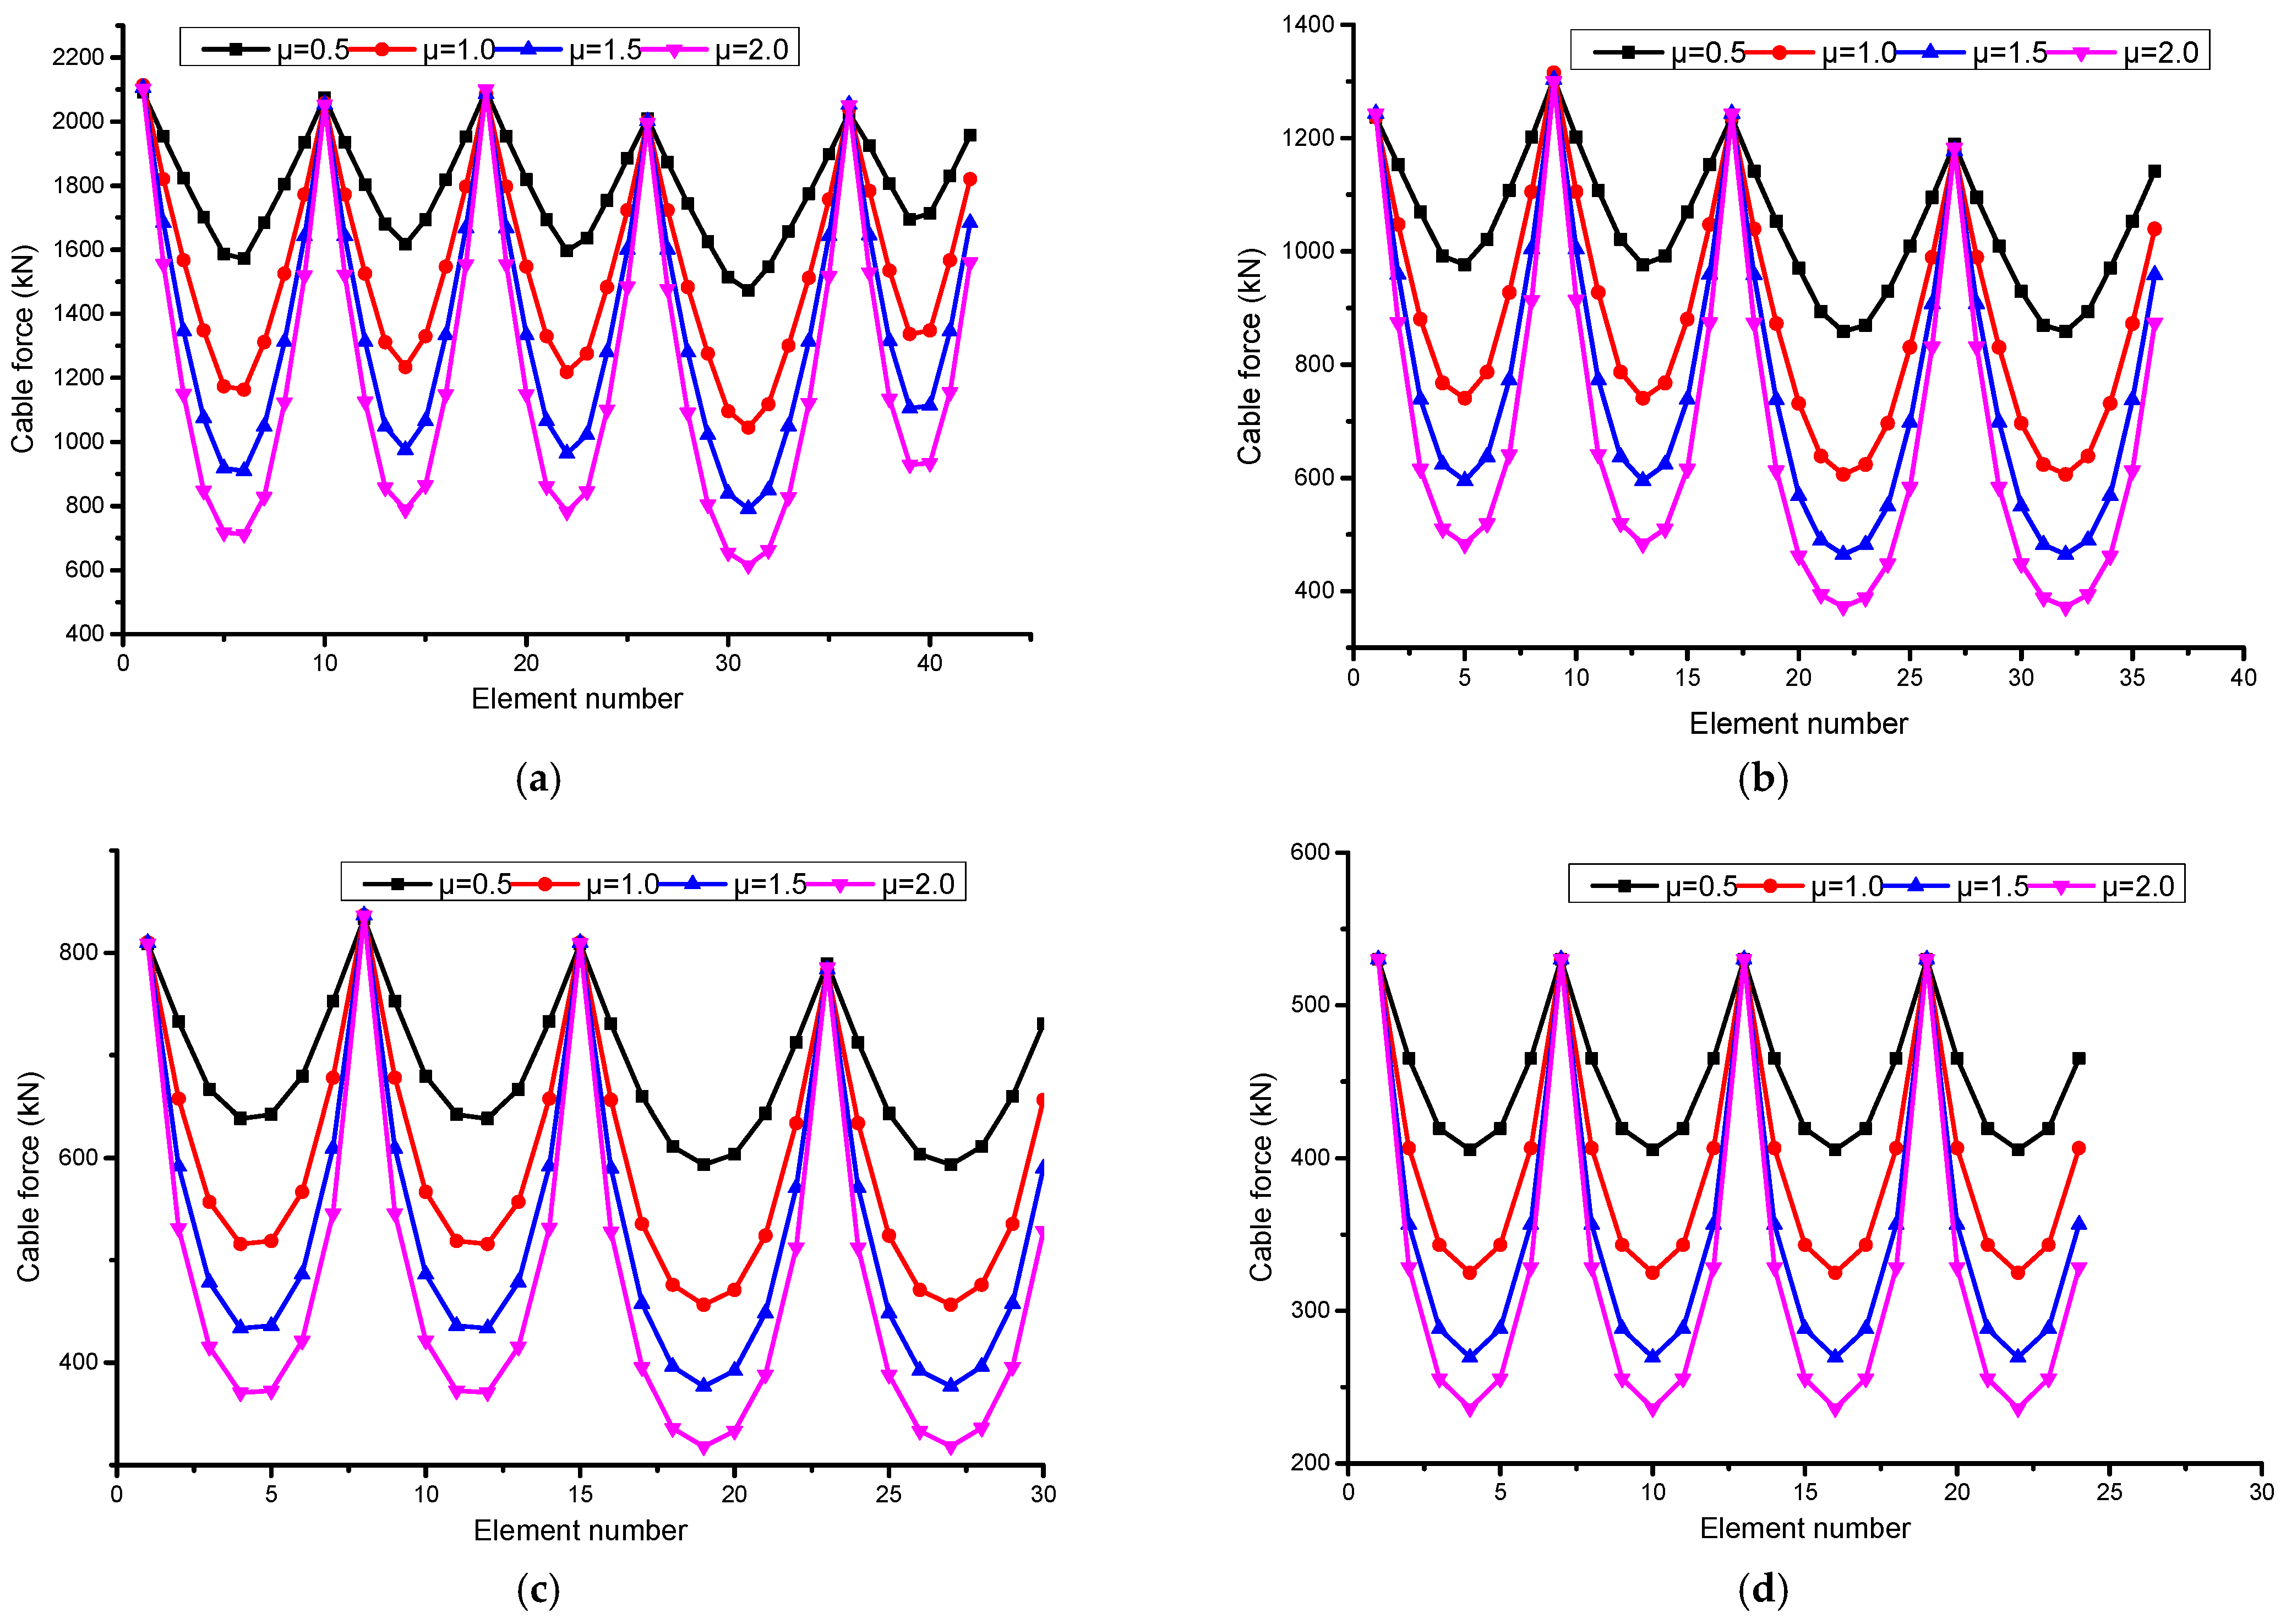
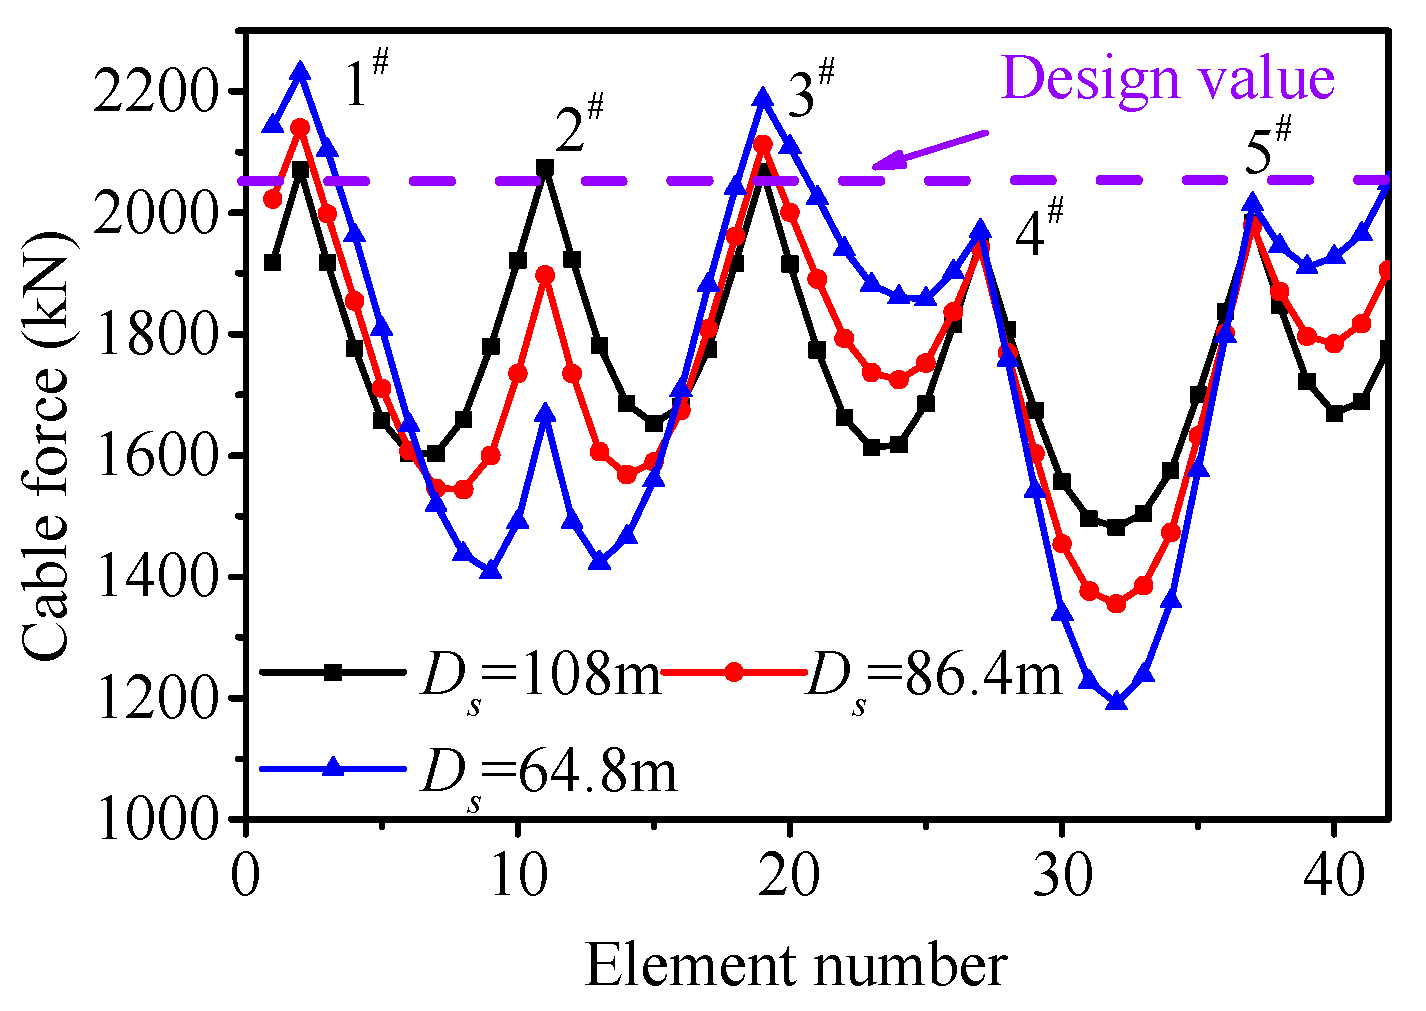
4.1. Influence of Friction on Cable Force Distribution

Friction between cable and joints will cause cable force loss during the pre-stressing construction process. The cable pre-stressing loss caused by friction is analyzed in this section. The frictional coefficient μ was assumed to be 0.5, 1.0, 1.5 and 2.0, respectively.
The distribution of cable force in each hoop cable is shown in Figure 8. It can be concluded from the results that the loss ratio of cable force was about 20%, 19%, 21%, 23%, 19.7%, 21.4% and 9.4% for cables from the first to seventh ring when the friction coefficient was 0.5. The loss rate of the seventh hoop cable is low due to its short length. The cable force only needs to pass through on joint. The length of first hoop cable was the longest but had the least curvature, so the loss ratio of cable force was not the largest.
The loss ratios of cable force for the first hoop cable were 20%, 44%, 56%, 66% when the frictional coefficient μ was assumed to be 0.5, 1.0, 1.5 and 2.0, respectively. It can be concluded that the ratio of cable force loss almost linearly changed with the variation in friction coefficient. This linear trend aligns with the findings of Liu et al. [19], who observed similar behavior for μ < 0.5 in suspen-dome structures. This linearity arises from the direct proportionality between friction force and normal force (Equation (3)), which dominates under moderate friction coefficients. In addition, the contour of cable force is shown in Figure 9 in detail.
The influence of cable force loss on structural displacement in the vertical direction was also analyzed. Detailed contour of displacement is shown in Figure 10. It can be concluded from the results that distribution of displacement was changed due to the loss of cable force. The maximal displacement was reduced by 10 mm due to the loss of cable force.
The convergence curves of cable force are shown in Figure 11. The cable force reached a design value after 50 iterations. The max error of cable force was 1800 kN and it decreased quickly along with the number of iterations. The frictional coefficient almost has no influence on convergent results. The results indicated that the method proposed in this paper had a high efficiency in finding cable force.
The number of iterations needed to derive convergent results of friction was 150 and the convergence curves of friction are shown in Figure 12. It can be concluded that the number of iterations needed for friction was larger than that needed for cable force, but the computational efficiency was still high. It only needs about one hour to complete the numerical analysis once. In addition, the results indicate that the frictional coefficient has no influence on convergent speed of friction. The max error of friction increased along with the increase in frictional coefficient, but this did not affect convergence. Figure 12 shows the residual error distribution across joints, indicating that local discrepancies are within 5% of the maximum friction force, confirming uniform convergence.

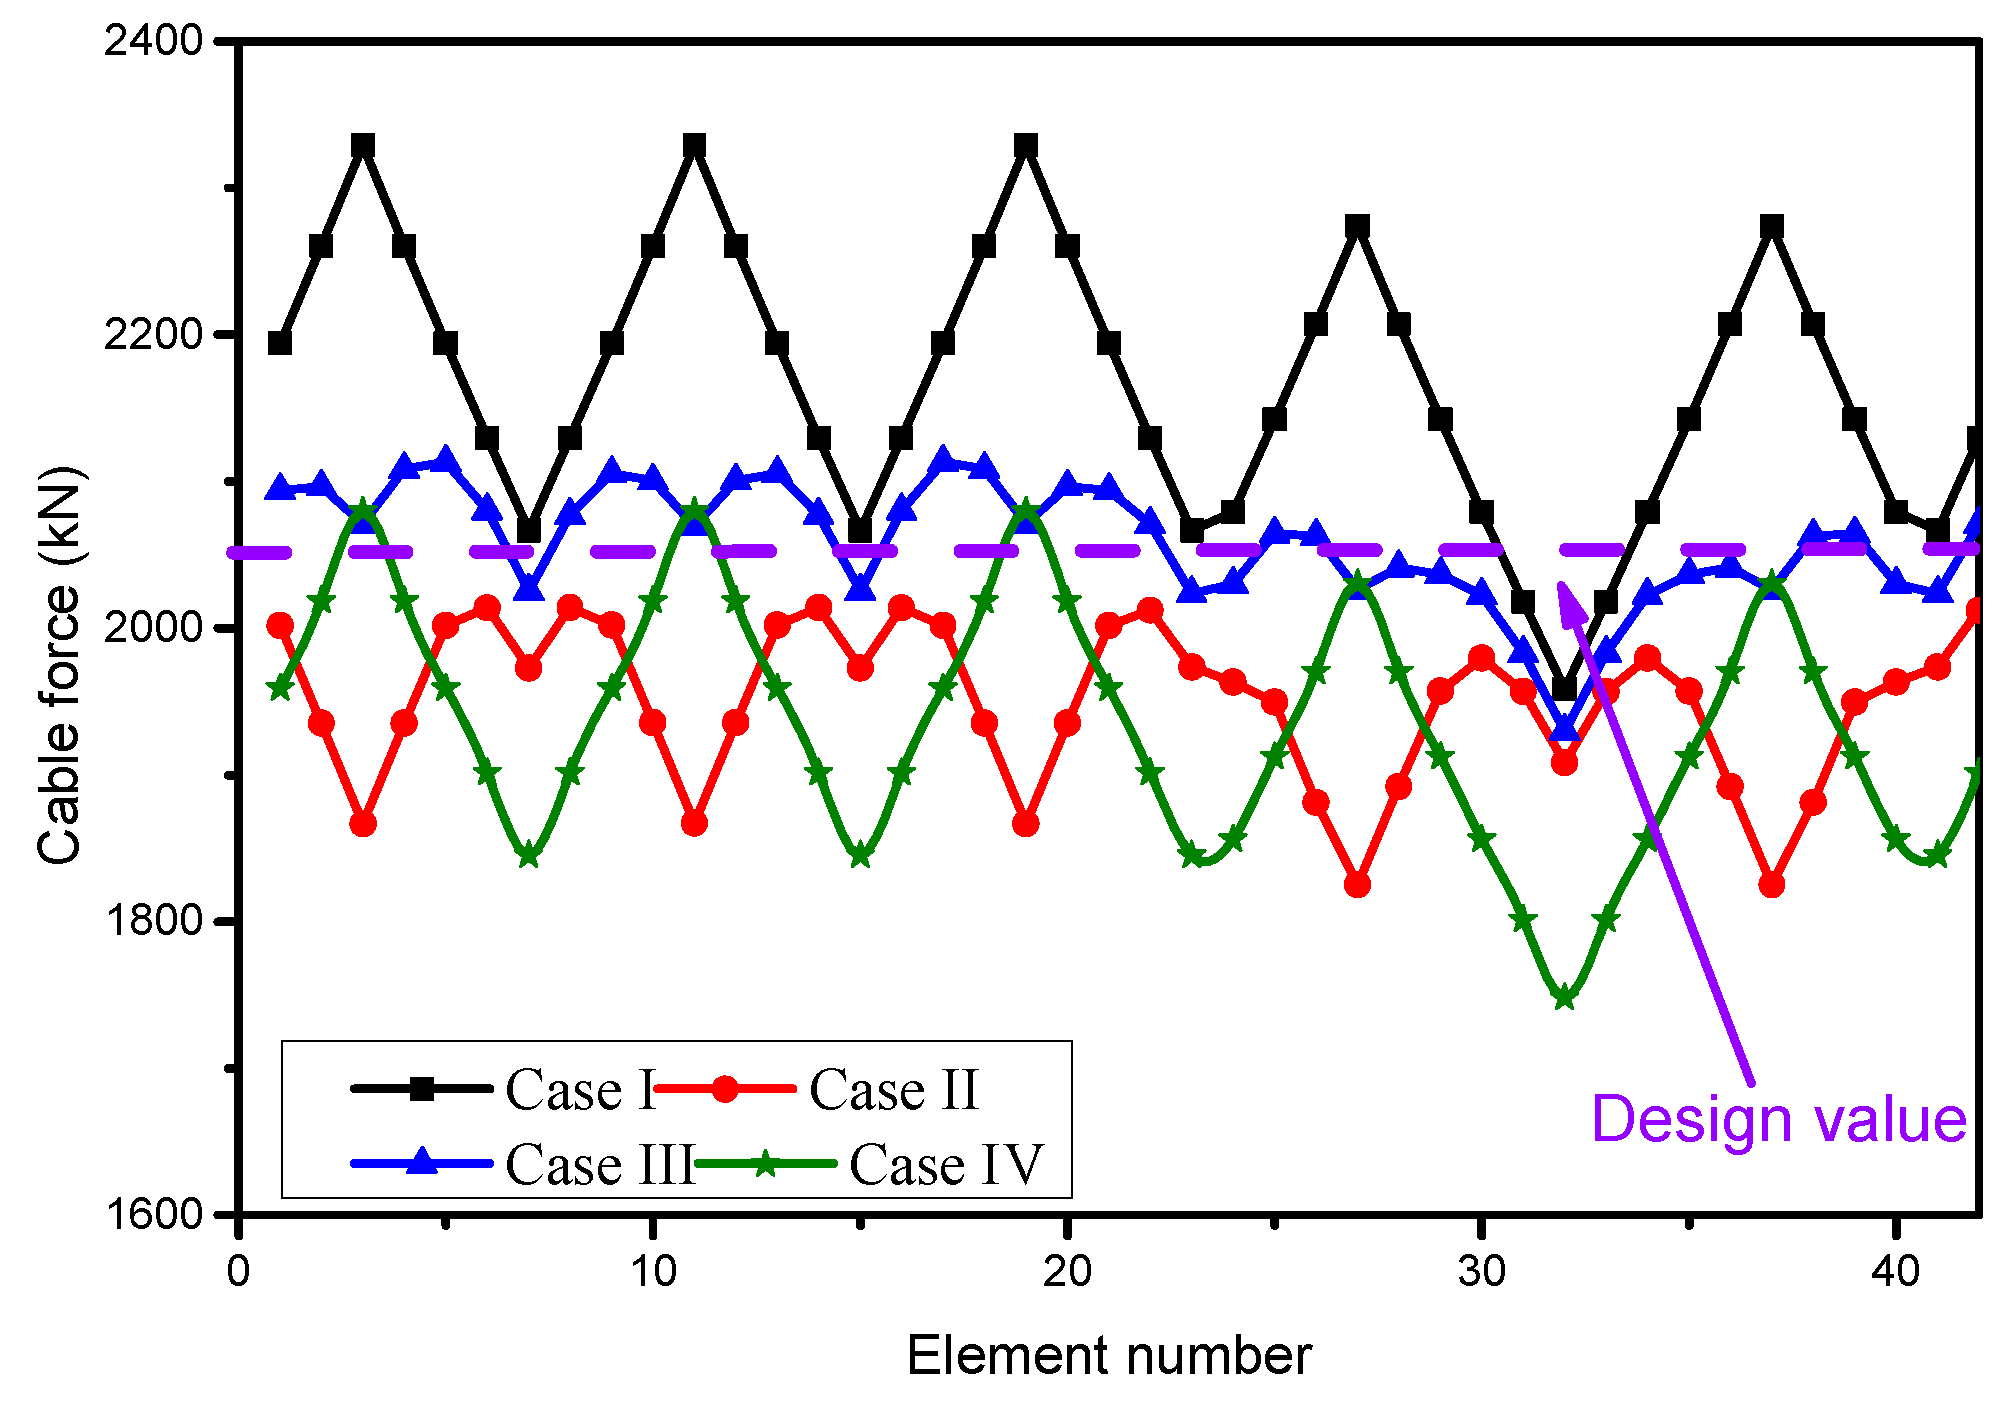
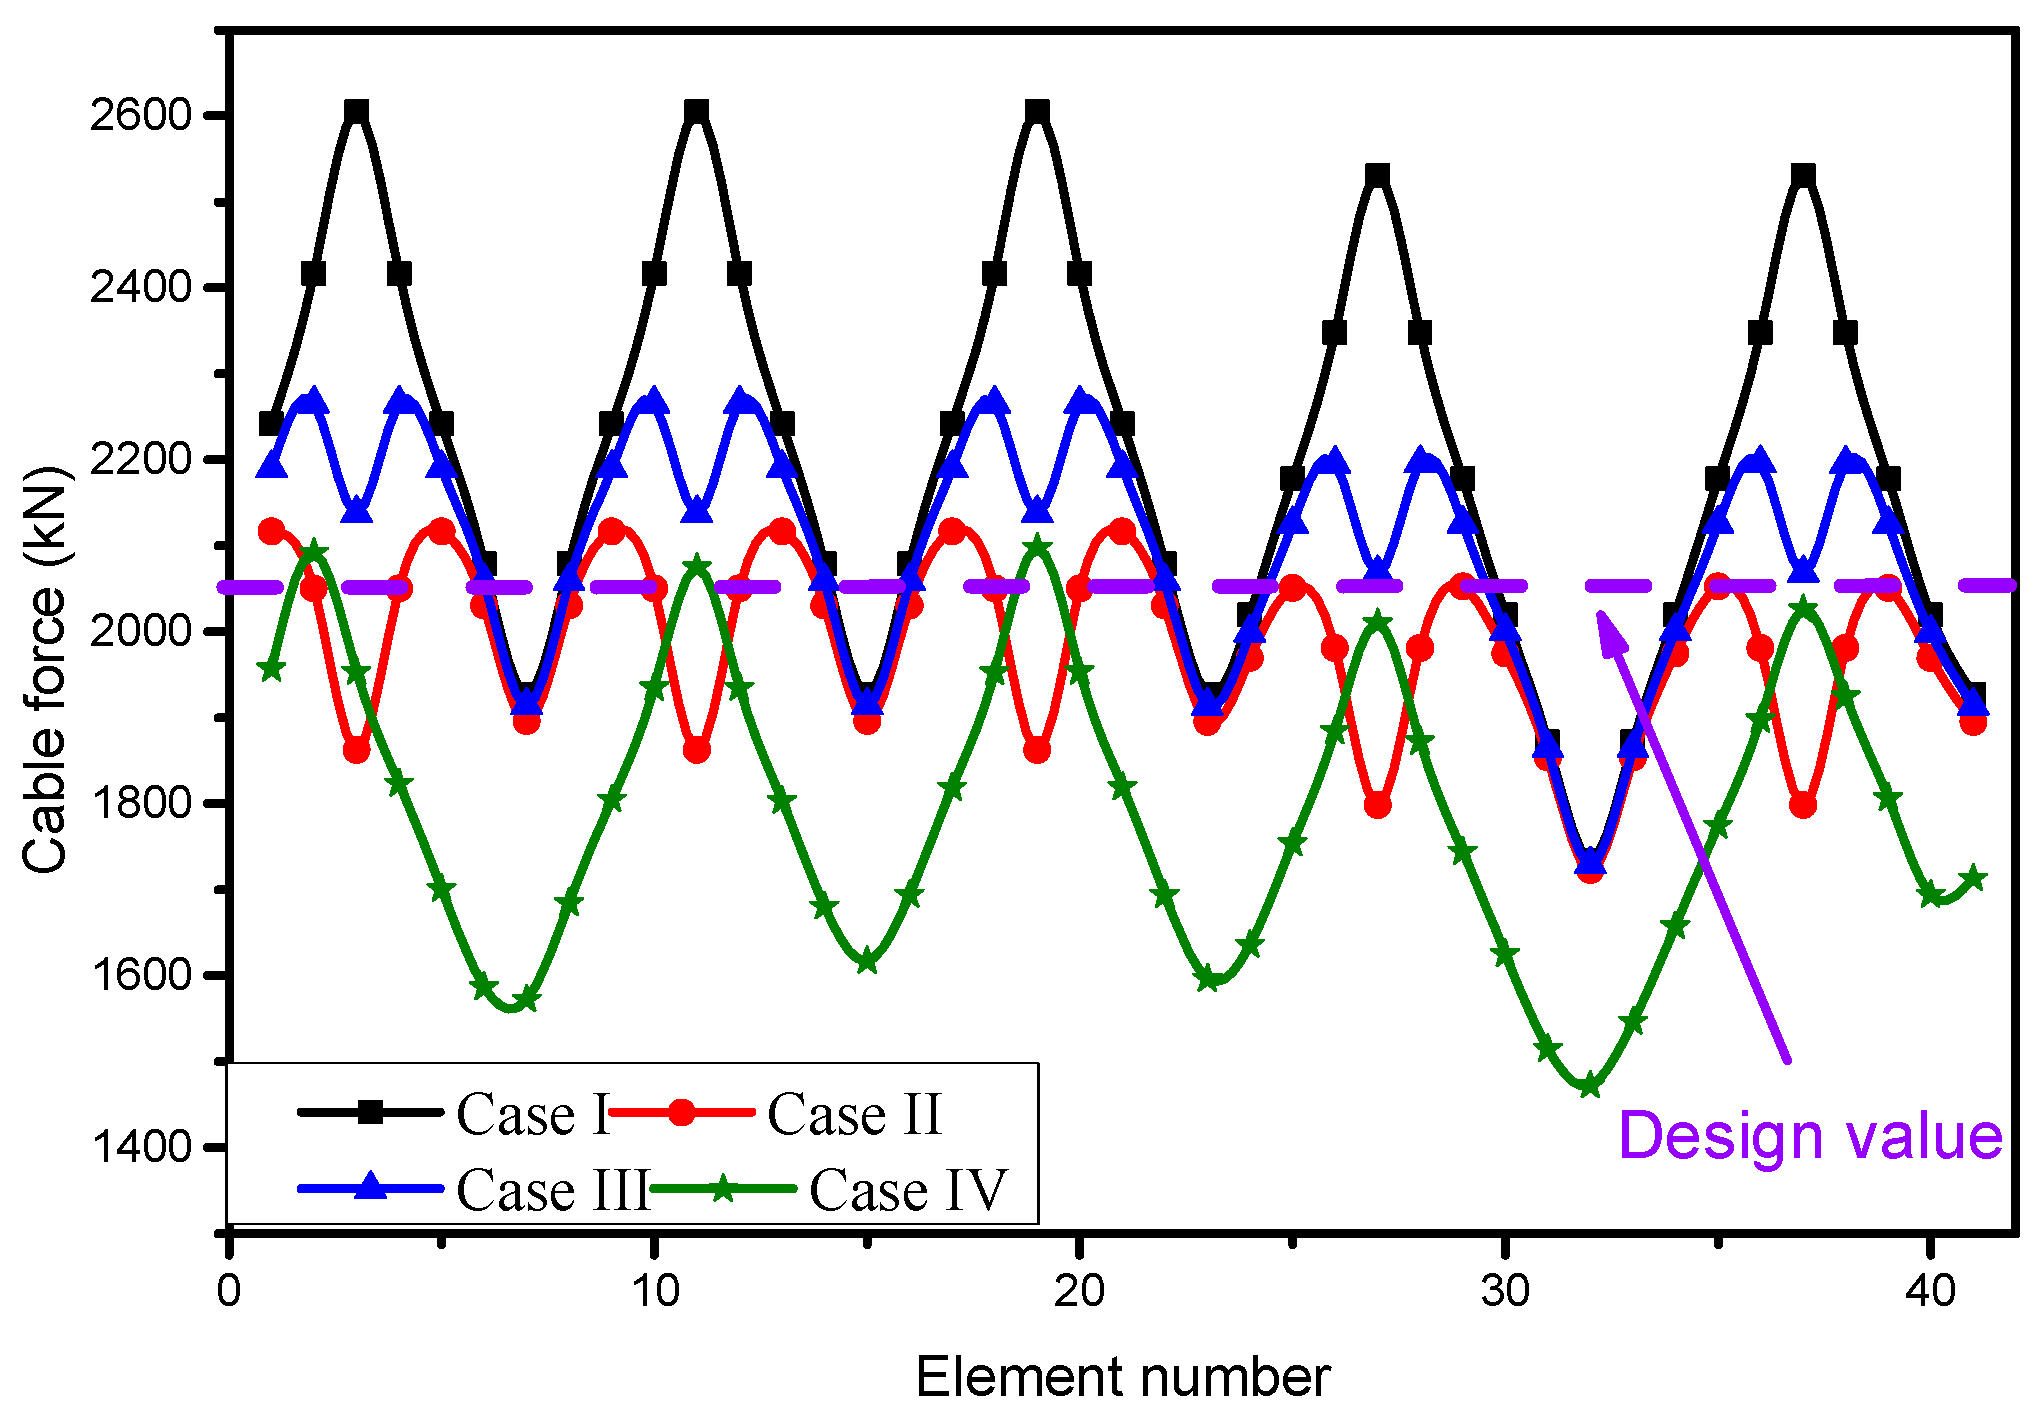
4.2. Influence of Over-Tensioning

The over-tensioning method has always been adopted to reduce the loss of cable force caused by friction, but the influence of over-tensioning on cable force has not been quantified. The method proposed in this paper was adopted for analyzing the influence of over-tensioning.
The analysis was conducted under four conditions. Four cases were designed as follows:
Case I:
The cables were tensioned 12% and 25% higher than the design value (2060 kN) when μ was set as 0.2 and 0.5, respectively.
Case II:
The cables were tensioned 12% and 25% higher than the design value, and then the cable force was reduced to 95% of the design value.
Case III:
The cables were tensioned 12% and 25% higher than the design value, and then the cable force was reduced to 90% of the design value.
Case IV:
The cables were tensioned directly to the design value.
The distribution of cable force in different conditions is shown in Figure 13 and Figure 14. The loss ratio of cable force was 2.5% and 5% when μ was set as 0.2 and 0.5, respectively. It can be concluded from the results shown in Figure 13 that it was reasonable to improve cable force by 12% when μ was 0.2 and then reduced to 95% of the design value. In this case, the cable force was very close to the design value.
It can be concluded from the results shown in Figure 13 that it was reasonable to improve cable force by 25% when μ was 0.5 and then reduce it to 90% of the design value.

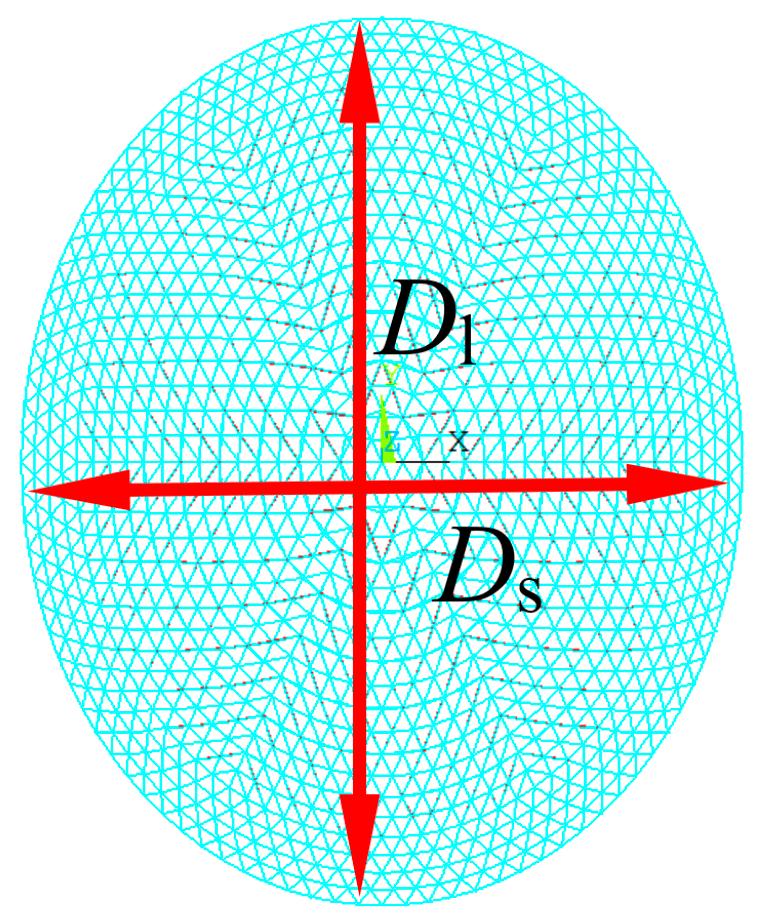
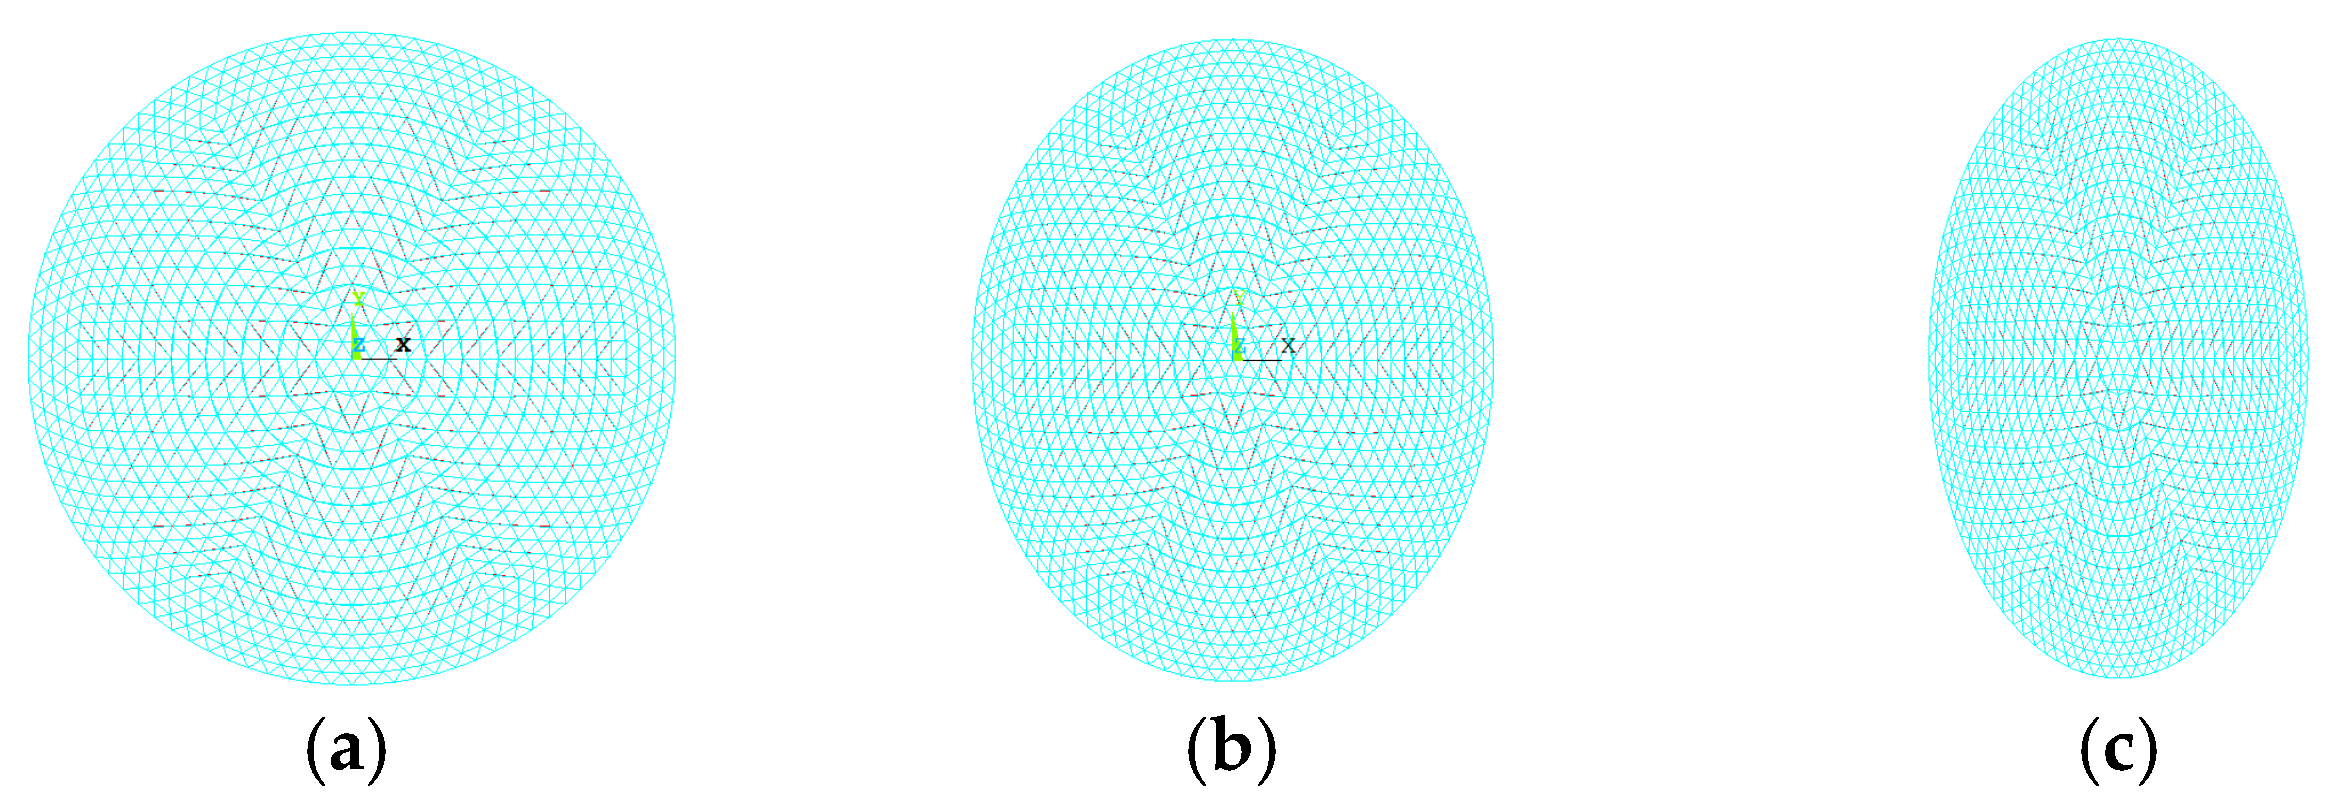
4.3. Influence of Geometrical Size of Dome

The results mentioned above were derived based on the specified structure shown in Section 3. However, the geometrical size and shape of the upper reticulated shell structures may affect the loss ratio of cable force. The size of the upper reticulated shell structures of suspen-dome was adjusted to investigate its influence on cable force distribution. The diameter of the reticulated shell was 108 m and remained unchanged. The vertical coordinate of the nodes was scaled to adjust the height of reticulated shell structure. The vector height of was set to 30.6, 25.5, 20.4 and 15.3 m. The height of the vertical struts was also scaled according to vector height. The other geometrical sizes were consistent with the condition described in Section 3. The FE model of suspen-dome structures with different vector heights were shown in Figure 15. The cable force distribution of the first hoop cable derived based on different conditions was shown in Figure 16. It can be concluded from the results that the shape of the upper reticulated shell has a slight influence on the cable force loss ratio. The cable force loss ratio increased with the decrease in vector height to span ratio. The cable force loss ratio increased by 5.3% when the vector height changed from 30.6 m to 15.3 m. It can be seen that this influence is very slight compared to the change in vector height, which can be ignored.
The reticulated shell in ellipsoidal shape has always been adopted for the upper structures for suspen-dome. The symbols Ds and Dl were utilized to indicate the short and long axes, respectively, as shown in Figure 17. The nodal coordinate in x direction was scaled to adjust the shape of the reticulated shell structure. The value of Dl is 108 and remained unchanged during the entire analysis. The Ds was set to 64.8, 86.4, and 108 m, as shown in Figure 18. The tensioning point number of the first hoop cable is shown in Figure 19. The derived cable force distribution is shown in Figure 20. It can be concluded that the shape of upper shell structure has a significant influence on the cable force distribution. The cable force loss ratio increased by 15% when Ds changed from 108 m to 64.8 m. The cable force loss ratio increased with the decrease in Ds/Dl ratio. The contour of cable force of the first hoop cable is shown in Figure 21.

5. Conclusions

The tension-compensation method was combined with a numerical method which can accurately consider friction, and a computational flow chart was proposed. The influence of friction on cable force, structural deformation, and the mechanical state of cable–strut system was estimated. In addition, the influence of over-tensioning was quantified. The results indicate that the method proposed in this paper can be efficiently adopted for the analysis of complex large-scale structures. It can be easily utilized by structural designers, and the conclusions can be summarized as follows:
(a)
The loss ratio of cable force was about 20% when the friction coefficient was 0.5 and almost linearly changed with the variation in friction coefficient.
(b)
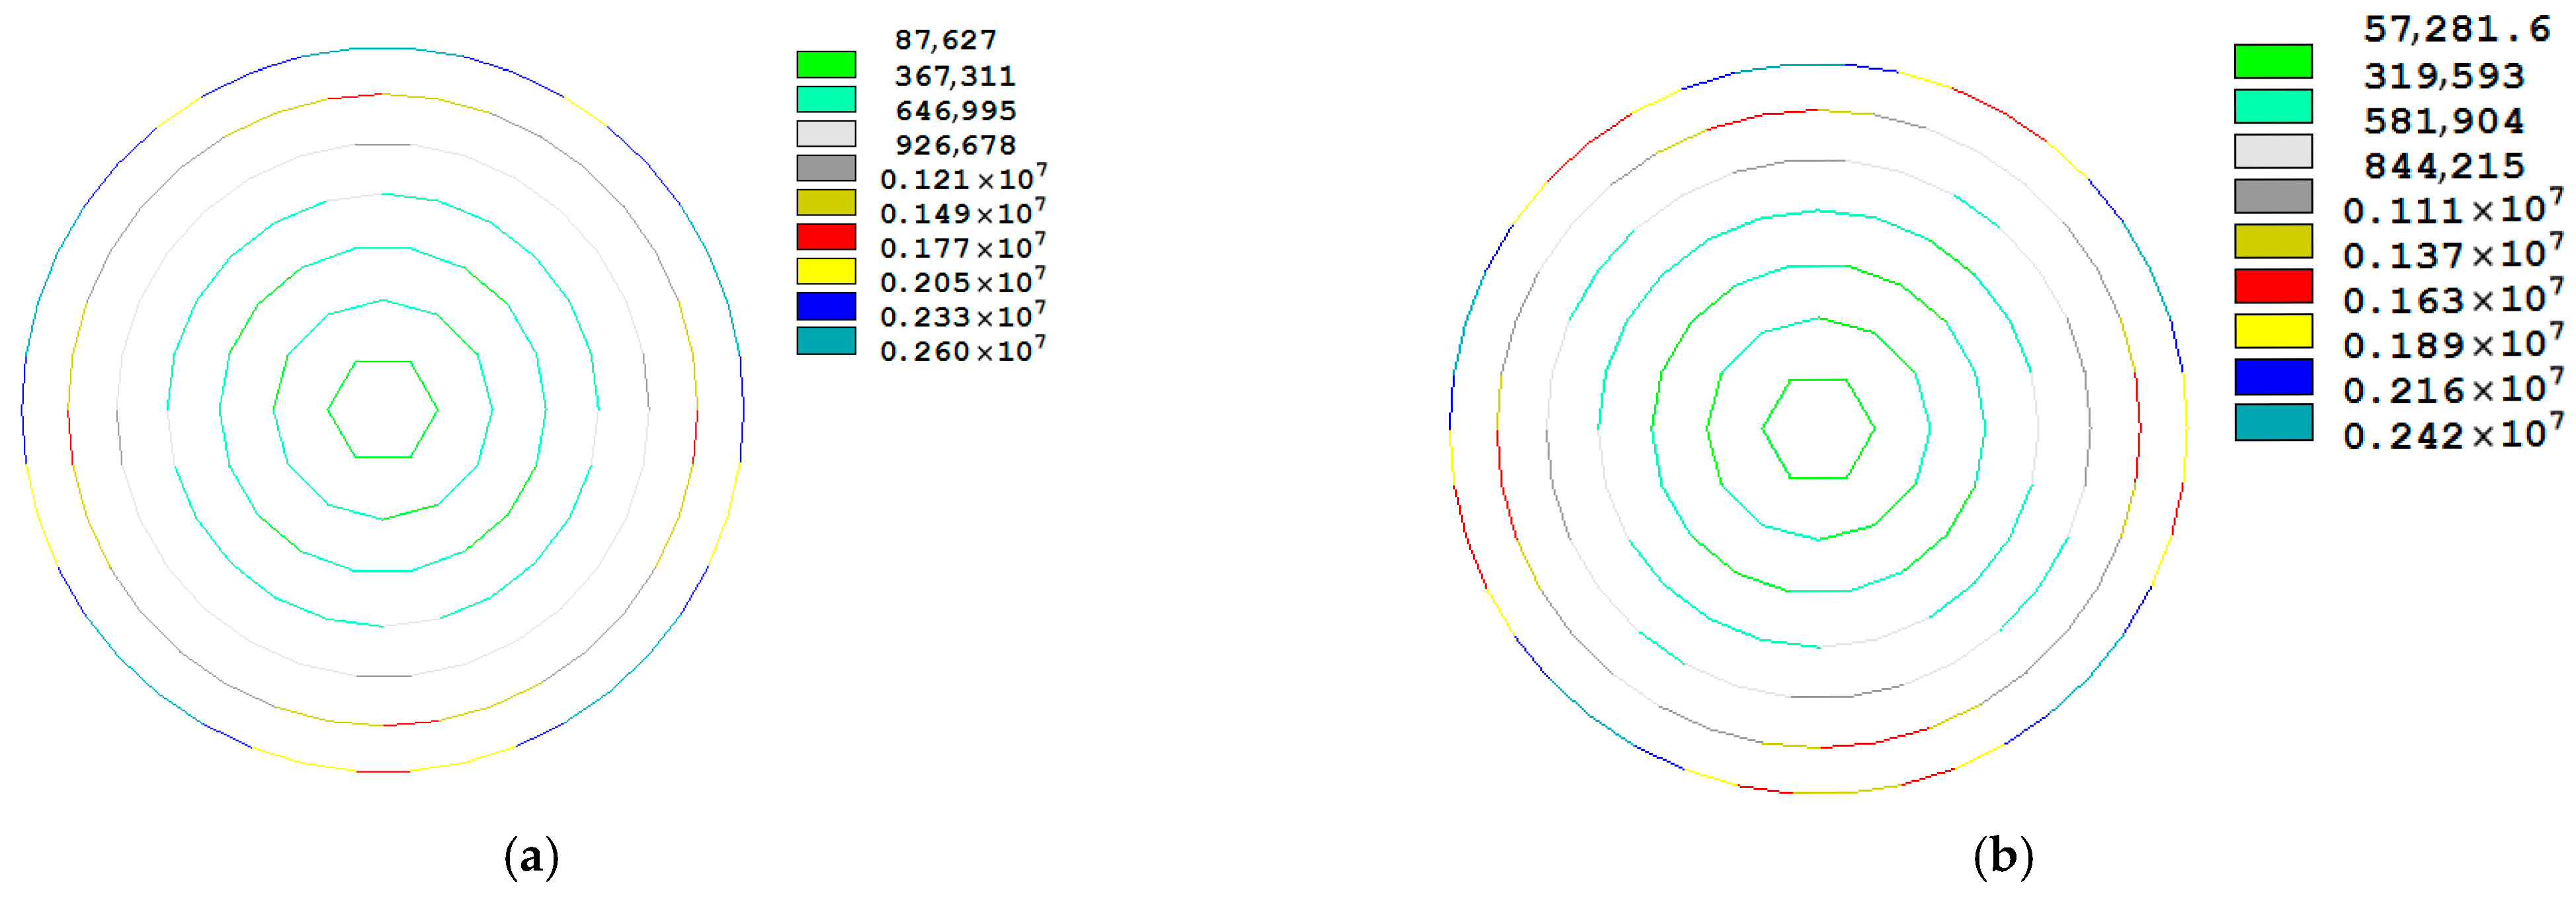
The maximal displacement was reduced by 10 mm due to loss of cable force.
(c)
Friction has almost no influence on the stress distribution of vertical struts, but friction has a large influence on the stress of diagonal members. The axial stress of diagonal members increased by about 18 MPa.
(d)
The over-tensioning method can be effectively utilized to weaken the influence of friction, but the optimal value of improved cable force is relevant to the frictional coefficient.
(e)
The spherical reticulated shell has little influence on the cable force loss ratio; however, ellipsoidal reticulated shell structures have significant influence on the cable force loss ratio.
(f)
In practical design applications, the adoption of a friction coefficient range of 0.2–0.5 is recommended for preliminary calculations. Note that this model is limited to static conditions and does not account for time-dependent effects (e.g., creep, stress relaxation), which should be considered in long-term structural analysis. Furthermore, ellipsoidal dome geometries demonstrate advantages in minimizing force loss variations and should be preferentially considered in structural configurations. The proposed method is currently implemented as an ANSYS script and will be developed into a plugin for engineering applications.

Author Contributions

Conceptualization, M.L.; Software, P.L.; Investigation, M.L.; Resources, Z.L.; Data curation, P.L.; Writing—review & editing, N.Z.; Supervision, Z.L.; Funding acquisition, N.Z. All authors have read and agreed to the published version of the manuscript.

Funding

This work received support from the Education Department of Liaoning Province (No. LJ242410147068).

Data Availability Statement

Some or all data, models, or code that support the findings of this study are available from the corresponding author upon reasonable request.

Conflicts of Interest

Author Zhancai Lao was employed by China Construction Sixth Engineering Division Decoration Co., Ltd. The remaining authors declare that the research was conducted in the absence of any commercial or financial relationships that could be construed as a potential conflict of interest.

References

  1. Zhou, Z.; Wu, J.; Meng, S. Influence of member geometric imperfection on geometrically nonlinear buckling and seismic performance of suspen-dome structures. Int. J. Struct. Stab. Dyn. 2014, 14, 1350070. [Google Scholar] [CrossRef]
  2. Liu, X.; Zhang, A.; Fu, W. Cable tension preslack method construction simulation and engineering application for a prestressed suspended dome. Adv. Mater. Sci. Eng. 2015, 2015, 651041. [Google Scholar] [CrossRef]
  3. Zhao, Z.; Wang, W.; Yan, R.; Zhao, B. Tensile capacity degradation of randomly corroded strands based on a refined numerical model. Reliab. Eng. Syst. Saf. 2025, 253, 110512. [Google Scholar] [CrossRef]
  4. Chen, Z.; Wu, Y.; Yin, Y.; Shan, C. Formulation and application of multi-node sliding cable element for the analysis of suspen-dome structures. Finite Elem. Anal. Des. 2010, 46, 743–750. [Google Scholar] [CrossRef]
  5. Chen, Z.; Liu, H.; Wang, X.; Zhou, T. Establishment and application of cable-sliding criterion equation. Adv. Steel Constr. 2011, 7, 131–143. [Google Scholar]
  6. Liu, H.; Chen, Z. Research on effect of sliding between hoop cable and cable-strut joint on behavior of suspen-dome structures. Adv. Steel Constr. 2012, 8, 359–365. [Google Scholar]
  7. Liu, H.; Chen, Z. Influence of cable sliding on the stability of suspen-dome with stacked arches structures. Adv. Steel Constr. 2012, 8, 54–70. [Google Scholar]
  8. Liu, H.; Han, Q.; Chen, Z.; Wang, X.; Yan, R.Z.; Zhao, B. Precision control method for pre-stressing construction of suspen-dome structures. Adv. Steel Constr. 2014, 10, 404–425. [Google Scholar]
  9. Ali, N.B.H.; Sychterz, A.C.; Smith, I.F.C. A dynamic-relaxation formulation for analysis of cable structures with sliding-induced friction. Int. J. Solids Struct. 2017, 126, 240–251. [Google Scholar]
  10. Ni, Y.Q.; Ko, J.M.; Zheng, G. Dynamic analysis of large-diameter sagged cables taking into account flexural rigidity. J. Sound Vib. 2002, 257, 301–319. [Google Scholar] [CrossRef]
  11. Wang, Y.Q.; Wu, L.L.; Shi, Y.J.; Sun, F.; Luo, K.Y.; Xu, Y. FEM analysis and experimental study on monolayer cable net for glass facades: Static performance. Adv. Struct. Eng. 2007, 10, 371–382. [Google Scholar] [CrossRef]
  12. Zhu, M.L.; Dong, S.L.; Yuan, X.F. Failure analysis of a cable dome due to cable slack or rupture. Adv. Struct. Eng. 2013, 16, 259–271. [Google Scholar] [CrossRef]
  13. Thai, H.T.; Kim, S.E. Nonlinear static and dynamic analysis of cable structures. Finite Elem. Anal. Des. 2011, 47, 237–246. [Google Scholar] [CrossRef]
  14. Li, J.J.; Chan, S.L. An integrated analysis of membrane structures with flexible supporting frames. Finite Elem. Anal. Des. 2004, 40, 529–540. [Google Scholar] [CrossRef]
  15. Tang, J.M.; Dong, M.; Qian, R.J. A finite element method with five isoparametric elements for nonlinear analysis of tension structures. Chin. J. Comput. Mech. 1997, 14, 108–113. [Google Scholar]
  16. Tang, J.M.; Shen, Z.Y. A nonlinear analysis method with sliding cable elements for cable structures. Chin. J. Comput. Mech. 1999, 16, 143–149. [Google Scholar]
  17. Zhang, Z.H.; Dong, S.L. Slippage analysis of continuous cables in tension structures. Spat. Struct. 2001, 7, 26–32. [Google Scholar]
  18. Wei, J.D. Sliding cable elements for the analysis of cable structures. Eng. Mech. 2004, 21, 172–177. [Google Scholar]
  19. Fan, X.; Zhao, Z.; Xu, H.; Liu, H.; Zhang, N.; Wu, X. The tensioning process of ellipsoidal suspen-dome structures considering the friction of cable-strut joints. Structures 2021, 34, 3757–3775. [Google Scholar] [CrossRef]
  20. Liu, H.B.; Chen, Z.H.; Zhou, T. Prestress loss induced by friction in suspendome construction. J. Tianjin Univ. 2009, 42, 1055–1060. [Google Scholar]
  21. Wei, J.D. Friction gliding cable elements in the analysis of gliding cable structures. Eng. Mech. 2006, 23, 66–70. [Google Scholar]
  22. Yan, R.Z.; Chen, Z.H.; Wang, X.D.; Liu, H.B.; Xiao, X. A new equivalent friction element for analysis of cable-supported structures. Steel Compos. Struct. 2015, 18, 947–970. [Google Scholar] [CrossRef]
  23. Zhao, Z.; Wu, J.; Liu, H.; Liang, B. Influence of friction on buckling and dynamic behavior of suspen-dome structures. Struct. Eng. Int. 2020, 30, 262–269. [Google Scholar] [CrossRef]
  24. Zhao, Z.; Liang, B.; Yan, R. A novel numerical method for considering friction during pre-stressing construction of cable-supported structures. Int. J. Steel Struct. 2021, 18, 1699–1709. [Google Scholar] [CrossRef]
  25. Ansys Inc. ANSYS Multiphysics, version 10.0; Ansys Inc.: Canonsburg, PA, USA, 2003. [Google Scholar]
Figure 1. Schematic diagram of suspen-dome structures: (a) overall structure; (b) cable and strut system.
Buildings 15 02697 g001
Figure 2. Stress diagram at lower end of vertical struts.
Buildings 15 02697 g002
Figure 3. Numerical model of hoop cable considering friction.
Buildings 15 02697 g003
Figure 4. Experimental device [21]: (a) experimental model; (b) cable–strut joint; (c) on-site test.
Buildings 15 02697 g004
Figure 5. Schematic diagram of block and tackle system.
Buildings 15 02697 g005
Figure 6. Flow chart of iterative program.
Buildings 15 02697 g006
Figure 7. Distribution of the tensioning points.
Buildings 15 02697 g007
Figure 8. Distribution of cable force: (a) 1st hoop cable; (b) 2nd hoop cable; (c) 3rd hoop cable; (d) 4th hoop cable.
Buildings 15 02697 g008
Figure 9. Contour of cable force. (a) μ = 0.5; (b) μ = 1.0.
Buildings 15 02697 g009
Figure 10. Contour of vertical displacement (Uint: m). (a) μ = 0.0; (b) μ = 0.5.
Buildings 15 02697 g010
Figure 11. Convergence curves of cable force.
Buildings 15 02697 g011
Figure 12. Convergence curves of friction.
Buildings 15 02697 g012
Figure 13. Influence of over-tensioning (μ = 0.2).
Buildings 15 02697 g013
Figure 14. Influence of over-tensioning (μ = 0.5).
Buildings 15 02697 g014
Figure 15. The FE model of suspen-dome structures with different vector heights. (a) f = 30.6 m; (b) f = 25.5 m; (c) f = 20.4 m; (d) f = 15.3 m.
Buildings 15 02697 g015
Figure 16. The cable force distribution corresponding to different vector heights.
Buildings 15 02697 g016
Figure 17. Schematic of Ds and Dl..
Buildings 15 02697 g017
Figure 18. The FE model of suspen-dome structures in ellipsoidal shapes. (a) Ds = 108 m; (b) Ds = 86.4 m; (c) Ds = 64.8 m.
Buildings 15 02697 g018
Figure 19. Distribution of tensioning point for ellipsoidal suspen-dome.
Buildings 15 02697 g019
Figure 20. Cable force distribution for ellipsoidal suspen-dome.
Buildings 15 02697 g020
Figure 21. Contour of cable force corresponding to Ds = 64.8 m (unit: N).
Buildings 15 02697 g021
Table 1. Comparison of results II.
ConditionTensioning Force T1 (kN)Tensioning Force at Fixed End T2 (kN)Friction Coefficient μT2 (kN) (Computational Value in This Paper)
Condition I40.0033.350.167533.07
Condition II40.0035.660.106035.62
Condition III40.0031.340.224331.29
Note: μ = ( T 1 T 2 ) sin 67.5 ° ( T 1 + T 2 ) cos 67.5 ° .
Disclaimer/Publisher’s Note: The statements, opinions and data contained in all publications are solely those of the individual author(s) and contributor(s) and not of MDPI and/or the editor(s). MDPI and/or the editor(s) disclaim responsibility for any injury to people or property resulting from any ideas, methods, instructions or products referred to in the content.

