1. Introduction
Comfort is a balanced physical and psychological state in which the surrounding environment causes no unpleasant sensations; indoors, it is traditionally divided into thermal, air, acoustic, and visual components, with thermal comfort exerting the greatest influence on well-being and productivity [
1]. Achieving it is difficult because conventional HVAC systems use fixed set points and static control, overlook individual needs and changing conditions, and therefore leave many occupants thermally dissatisfied, lowering performance and health [
2,
3]. Standard assessment models based on group averages may also misrepresent personal sensations [
4,
5].
The challenge is acute in multiuser spaces such as offices and classrooms, where divergent preferences make compromise temperatures elusive. Current research therefore explores technologies that respect individual differences. Wearable devices recording skin temperature and heart rate variability (HRV) enable minimally invasive, personalized comfort evaluation in real offices [
4], while long life wireless IoT sensors that track temperature, humidity, and motion stream real time data for adaptive microclimate control [
6].
Factors shaping thermal comfort fall into three interacting groups. Environmental characteristics include air temperature, relative humidity, air velocity, mean radiant temperature, and CO
2 concentration [
7,
8,
9,
10]. Poor indoor air quality (CO
2 > 1000 ppm) exacerbates heat sensation and stuffiness [
8,
9], yet heat recovery ventilation, though energy saving, can struggle with outdoor temperature dependence and airflow balance in transitional seasons [
11]. Physiological traits—body temperature, HRV, heart rate, metabolic rate and age [
4,
10,
12,
13,
14]—are equally critical; facial and hand skin temperatures track comfort well [
14], and HRV reflects both thermal stress and work-related pressure [
15], with clear correlations between these metrics and subjective votes [
12]. Behavioral aspects such as activity level, clothing insulation [
13], and adaptive actions like opening windows also modulate comfort [
16]. Research examined children’s thermal comfort perception in school classrooms through a structured questionnaire approach adapted for 9–11-year-olds. A total of 2116 valid responses were obtained from repeated surveys conducted throughout the day to capture diurnal variations in thermal sensation. Results indicate that children consistently preferred lower temperatures than those predicted by standard adult-based models. Notably, thermal sensation responses varied between morning and afternoon at the same operative temperature, suggesting a time-of-day effect independent of clothing insulation changes [
17]. A related study assessed thermal comfort perceptions of preschool children and their caregivers in Wuhan’s urban parks using questionnaires and meteorological measurements across seasons. Results showed that children have slightly wider thermal comfort ranges and are less sensitive to environmental changes than caregivers, with notable differences in adaptive behaviors and preferences [
18]. University students (mean age 20.9) in London were surveyed during the spring season to assess their thermal comfort using questionnaires and environmental data. Results showed a high thermal sensitivity and a preference for cooler conditions, with a neutral temperature of 23.9 °C. Most classrooms did not meet comfort standards due to poor insulation and ventilation in older buildings [
19].
Surveys employing Thermal Sensation Vote (TSV), Thermal Comfort Vote (TCV), or Thermal Preference Vote (TPV) capture occupants’ impressions; yet model accuracy drops when TPV replaces immediate sensation scales [
20], and small laboratory cohorts limit generalizability [
21,
22,
23]. Widely used indices PMV (Predicted Mean Vote) and PPD (Predicted Percentage Dissatisfied) for indoors [
24] and UTCI for outdoors [
25] offer valuable benchmarks, but extensions are still proposed; for example, a PMV modified for low atmospheric pressure [
24].
Objective physiological monitoring has expanded with consumer wearables: smartwatches, fitness trackers, and dedicated sensor bands provide continuous records of body temperature, HRV, and heart rate [
26]. More granular studies add ECG [
27], EEG [
28], electrodermal activity [
29], photoplethysmography [
30], and respiratory sensors [
27], or employ infrared thermography for contact-free temperature mapping [
20] and RGB/IR camera fusion to infer thermal state [
13]. For outdoor pedestrians, computational fluid dynamics models paired with machine learning help predict comfort [
31].
Experimental work illustrates methodological evolution. In a test office with 15 volunteers exposed to 22 °C, 25 °C, and 28 °C, researchers recorded skin temperature and HRV to link physiological change with perceived comfort [
20]. Climate chamber trials spanning 22–36 °C and 30–80% RH measured core and skin temperature, heart rate, and HRV under tightly controlled conditions [
32]. Moving closer to practice, experiments used multi-point wrist thermistors [
33], heart rate straps [
34], or HRV wearables [
35] in near-real offices to develop personalized comfort models. Three representative office-like studies show variety: one achieved high accuracy predicting current sensation from combined wrist and fingertip temperatures [
33]; another separated stress from thermal discomfort with a Random Forest classifier reaching 99.25% accuracy on ECG-derived HRV [
36]; the third linked staged temperature shifts to wrist skin temperature, forehead thermography, and smartwatch HRV, feeding machine learning models [
37]. Despite different protocols, all found that integrating skin temperature and HRV boosts predictive power, though small convenience samples, passive desk activity, and sensor limitations temper conclusions.
Field research complements lab findings. In occupied offices, environmental monitoring and surveys revealed CO
2 within guidelines yet frequent PM
2.5/PM
10 exceedances in naturally ventilated rooms, while mechanical systems lowered both fine particulates and CO
2 [
3,
38]. An urban park study detected strong associations between microclimate (air temperature, solar radiation), physiological signals (skin temperature, HRV, heart rate), and thermal votes [
39]. A low-cost IoT platform proved practical for gathering such paired data in real time [
38]. Elsewhere, natural ventilation tactics in university classrooms were assessed during exams [
40], residential studies compared ventilation alternatives against pollutant loads [
41,
42], and separate temperature regime datasets were shown to restrict model applicability when conditions vary continuously [
43,
44].
Modern predictive thermal comfort models have evolved to include a broader range of environmental and adaptive variables than classical approaches. Historically, widely used models such as Fanger’s Predicted Mean Vote (PMV) focused primarily on air temperature and air velocity, treating humidity as a secondary parameter based on the assumption that its influence on thermal sensation is limited. However, increasing evidence now indicates that humidity plays a crucial role in modulating human thermal responses, particularly by affecting evaporative cooling and sweat dynamics. The aim of this report is to provide a deeper discussion of the importance of humidity in thermal comfort prediction through a synthesis of mechanistic data, statistical findings, and recent modeling advances [
45,
46].
At the physiological level, the human body relies heavily on evaporative cooling via sweat evaporation as the primary mechanism for dissipating excess metabolic heat in warm conditions. As ambient humidity increases, the vapor pressure gradient between the saturated skin surface and surrounding air is significantly reduced, which lowers sweat evaporation rate and diminishes the efficiency of this cooling pathway. This means that under high-humidity conditions, even if air temperature remains constant, reduced evaporation leads to higher skin wetness and, ultimately, greater sensations of heat and discomfort [
45].
Statistical analysis of large datasets from field studies and climate-chamber experiments increasingly demonstrates that humidity contributes significantly to observed variations in thermal sensation and comfort responses. Advanced statistical methods, including gradient-boosted regression and machine-learning algorithms such as Random Forest, have shown that when humidity is considered alongside traditional predictors like temperature and air velocity, its predictive power becomes more pronounced [
45]. When models include humidity as an interactive parameter, the variance in thermal sensation votes and subjective comfort ratings increases markedly, especially when relative humidity exceeds approximately 70% in warm conditions [
47].
A study developed personal thermal comfort models using lab-grade wearable sensors and machine learning, collecting physiological and environmental data from 14 participants over 2–4 weeks. The models achieved a median predictive power of 78% accuracy, 0.79 AUC, and 24% Cohen’s kappa, with best performance outside thermal neutrality [
48].
In recent thermal comfort prediction research [
49], variable selection still frequently begins with classical filter and wrapper approaches such as
t-tests, ANOVA, correlation-based filters, Principal Component Analysis (PCA), and Recursive Feature Elimination (RFE). These methods are widely used to reduce data dimensionality and mitigate overfitting; however, they rely heavily on linear or monotonic assumptions, which limits their capacity to uncover complex multivariate interactions. The combined use of RFE and PCA can reduce the original set of variables significantly, but often fails to adequately interpret how the most “influential” features—such as lighting intensity, workstation type, and outdoor air temperature—function within the predictive model [
49]. In other studies, climate chamber experiments using Gradient Boosting Regressors and Permutation Importance have identified dominant variables such as net metabolic heat exchange, radiant temperature, and evaporative heat flux, but the method’s evaluation of each variable in isolation prevents detection of cross-feature dependencies or interaction effects [
50].
From 2023 to 2025, research increasingly adopted Shapley Additive Explanations (SHAP) as a core interpretability framework for feature selection in thermal comfort modeling [
51,
52,
53]. Applications of SHAP with LightGBM on real-world datasets have demonstrated that SHAP-based rankings can double the estimated importance of key environmental variables like outdoor air temperature and relative humidity compared to traditional correlation-based methods, while also revealing context-dependent sensitivities such as those related to CO
2 [
54]. Other implementations combining CatBoost with SHAP have shown that air temperature and mean radiant temperature may contribute three to five times more to comfort prediction than conventional PMV-based metrics, while enabling both local and global explanatory insights [
55]. SHAP offers model-specific attribution of feature importance, preserves nonlinear effects and synergistic interactions, and supports both population-level and personalized modeling. Its visualization tools, such as force plots and bee swarm plots, further enhance interpretability for technical and multidisciplinary teams.
Beyond model transparency, SHAP has evolved into a practical tool for optimizing sensor configurations. By ranking features according to their average absolute SHAP values, researchers have been able to reduce input sets from over 20 variables down to six core parameters—indoor air temperature, relative humidity, outdoor temperature, CO
2 concentration, diastolic blood pressure, and muscle mass—while increasing prediction accuracy and simultaneously reducing hardware costs by approximately 30% [
56]. Additional studies within digital twin frameworks have demonstrated that using as few as four input features (Ta, RH, CO
2, and wrist temperature) can still improve test accuracy and reduce HVAC energy consumption by nearly 9% [
57]. Earlier experimental setups have also shown that eliminating low-impact sensors, such as infrared cameras and O
2 monitors, after Permutation Importance analysis can reduce device weight and energy use without compromising prediction reliability [
50].
While classical methods like PCA, RFE, and ANOVA serve as useful starting points for dimensionality reduction, their model-agnostic nature limits their ability to capture the full complexity of nonlinear and interactive effects inherent in physiological–environmental systems. Permutation Importance partially addresses this issue, but SHAP—grounded in cooperative game theory—provides more nuanced, model-aware insights into feature contribution. SHAP-based pipelines have demonstrated their ability to improve prediction accuracy, reduce sensor infrastructure, and support scalable, interpretable thermal comfort models. This framework offers a comprehensive response to the reviewer’s question by highlighting both the methodological advancement and the practical benefits of the proposed feature selection strategy.
This pilot study develops and validates a high-accuracy, context-aware thermal comfort classification model that fuses environmental variables (air temperature, relative humidity, CO
2) with physiological and anthropometric signals (heart rate variability, blood pressure, body composition). Using three machine learning algorithms—Random Forest, XGBoost, and an Artificial Neural Network—we predict occupants’ votes on the seven point ASHRAE scale. In line with the increasing adoption of model-aware interpretability frameworks from 2023–2025 [
51,
52,
53], we interpret feature contributions with Shapley Additive Explanations (SHAP) analysis. The goal is to demonstrate a transparent end-to-end pipeline that can be embedded in smart building HVAC controllers. This approach bridges the gap between “one-size-fits-all” set points and occupant-centric climate control by creating a practical pathway toward the enhanced energy efficiency, such as HVAC energy savings of nearly 9% [
57], demonstrated in recent literature [
49].
The novelty of this pilot study lies in its integration of a wide range of environmental and physiological parameters to develop a robust data-driven framework for thermal comfort classification, with the goal of identifying the most influential features among them. Unlike most previous research that focused on either environmental or physiological factors alone, this study combines both categories in a unified dataset to better capture their complex, non-linear interactions—a known limitation of classical analysis methods. Our dataset included 24 distinct features, all objectively measured through sensors, while the target variable was subjective, based on participants’ self-reported thermal sensation votes. We initially trained machine learning models on the full feature set, then applied SHAP analysis to identify the most important features. This methodology follows best practices established in recent research for optimizing sensor configurations [
56]. Each model was then retrained using its own set of top ten features, which led to improved predictive performance, with accuracy reaching up to 94%. By aggregating the top-ranked features across all models, we identified a shared subset of key predictors: indoor temperature, humidity, outdoor temperature, CO
2 concentration, diastolic blood pressure, and muscle mass. Notably, this empirically derived subset of predictors precisely mirrors the six core parameters identified in other recent studies that used SHAP for feature reduction [
56], powerfully validating our results. These findings, supported by a body of research demonstrating the potential for significant hardware cost reductions [
56], will guide future studies involving larger and more diverse populations to focus on the most valuable parameters, reduce feature dimensionality, and build more efficient and cost-effective occupant-centric comfort systems, providing a foundational step toward true personalization.
2. Materials and Methods
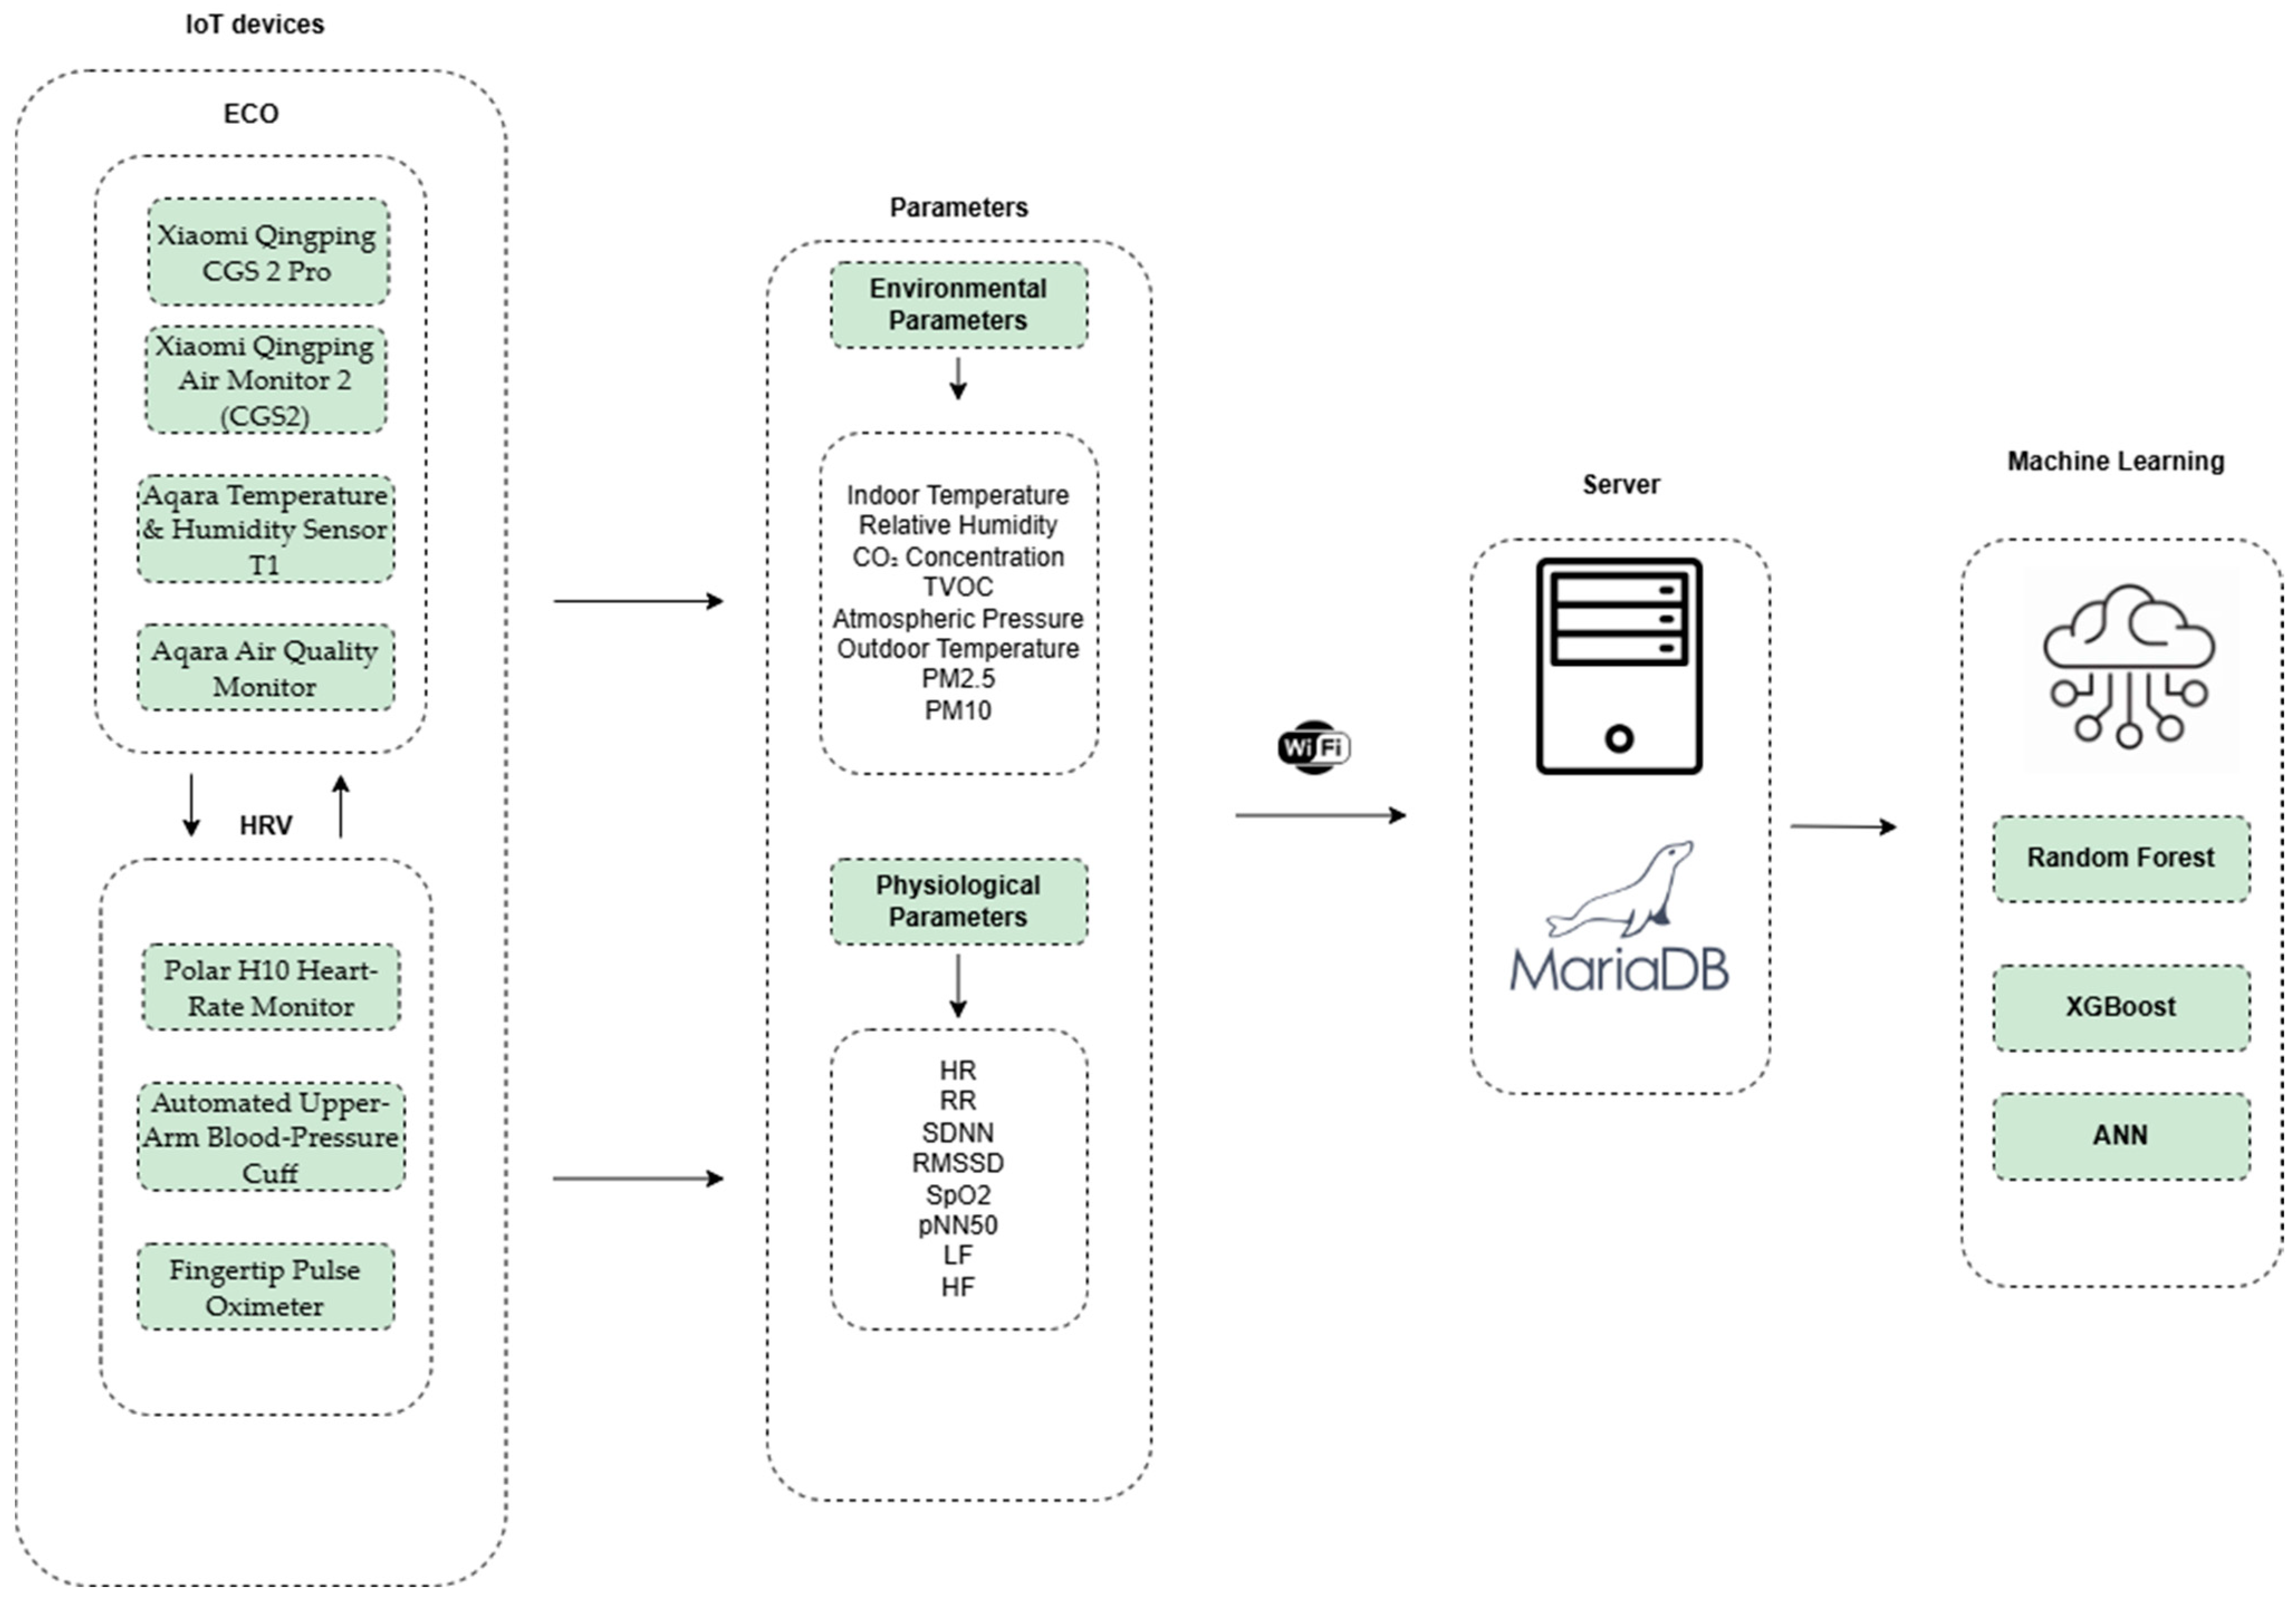
This study follows a seven-stage architecture that traces every signal from the volunteer to the final prediction, as illustrated in
Figure 1. The process began with recruitment and profiling of participants, who were then guided through a series of controlled experiments in a purpose-built laboratory. To ensure reliable implementation, the research team equipped the laboratory with three isolated rooms fitted with systems to precisely manage temperature, humidity, CO
2 concentration, and other microclimate parameters [
58]. The laboratory was specifically designed to enable reproducible scenarios and fine-grained control of environmental conditions [
59]. Following methodologies from prior studies, two types of rooms were defined: an experimental room, where all tests were carried out, and a neutral room, which provided minimal physiological interference [
60]. In this study, Room A served as the experimental environment, while Room B functioned as the neutral space to stabilize participants’ measurements before testing.
During each session, a network of wearable and room-mounted sensors streamed physiological and environmental readings to a centralized database [
61], while live dashboards allowed researchers to monitor conditions in real time [
62]. The multimodal dataset collected comprised both environmental and physiological variables, captured via a network of IoT-enabled devices. Environmental parameters—including indoor temperature, relative humidity, CO
2 concentration, total volatile organic compounds (TVOC), atmospheric pressure, outdoor temperature, PM
2.5, and PM
10—were measured using Xiaomi Qingping CGS 2 Pro, Xiaomi Qingping Air Monitor 2 (CGS2), Aqara Temperature and Humidity Sensor T1, and the Aqara Air Quality Monitor. Physiological signals were collected using a Polar H10 heart-rate monitor, an automated upper-arm blood pressure cuff, and a fingertip pulse oximeter. These devices provided continuous or interval-based measurements of heart rate (HR), respiratory rate (RR), blood pressure, blood oxygen saturation (SpO
2), and heart rate variability features including SDNN, RMSSD, pNN50, LF, and HF.
All sensor streams were synchronized and transmitted over Wi-Fi to a centralized MariaDB server, where the time-aligned data were stored in a structured format. This ensured consistent storage of multimodal sensor streams and facilitated subsequent processing. After each trial, the raw data passed through a preprocessing pipeline to clean, align, and prepare it for model training.
The cleaned dataset then fed a suite of machine learning algorithms. Three supervised classifiers were implemented: Random Forest, XGBoost, and a feedforward artificial neural network (ANN). These models were trained to perform seven-class classification of thermal sensation levels based on the ASHRAE thermal comfort scale, enabling automated prediction of subjective comfort states from objective sensor data. The performance and key drivers of each model were evaluated using established metrics [
63].
Collectively, these interconnected stages—participant recruitment, sensing, data storage, preprocessing, modeling, and interpretation—formed a closed-loop system that converted every recorded signal into a transparent, occupant-centric prediction of thermal comfort [
64].
2.1. Participants
As this was a pilot study designed to test the feasibility of the experimental protocol, a small and homogeneous group of eight male volunteers, aged 18 to 23, was intentionally recruited (see
Table 1). While this sample size is limited, it aligns with comparable experimental protocols in thermal comfort research where small participant groups are common due to the resource-intensive nature of controlled microclimate studies. Similar studies include Wang et al. [
20], which used 15 volunteers, Sim et al. [
32] which conducted thermal sensation experiments with eight participants, and Nkurikiyeyezu et al. [
36] which included only 10 participants. The homogeneous age range was deliberately selected to minimize age-related physiological variations that could confound the primary variables under investigation, following methodological approaches established in previous thermal comfort research [
33,
37]. Participants were organized into two groups of three participants and one group of two to better mirror the dynamics of larger office teams and facilitate real-world interpretation of the findings. All participants received a detailed briefing on the experimental procedures in advance. To ensure consistent thermal insulation (I
cl), each participant was required to wear only a T-shirt and trousers throughout every trial.
2.2. Experimental Set-Up
The study’s protocol comprised four distinct conditions: (1) cold discomfort with moderate CO
2 levels, (2) cold discomfort with elevated CO
2 levels, (3) hot discomfort with moderate CO
2 levels, and (4) hot discomfort with elevated CO
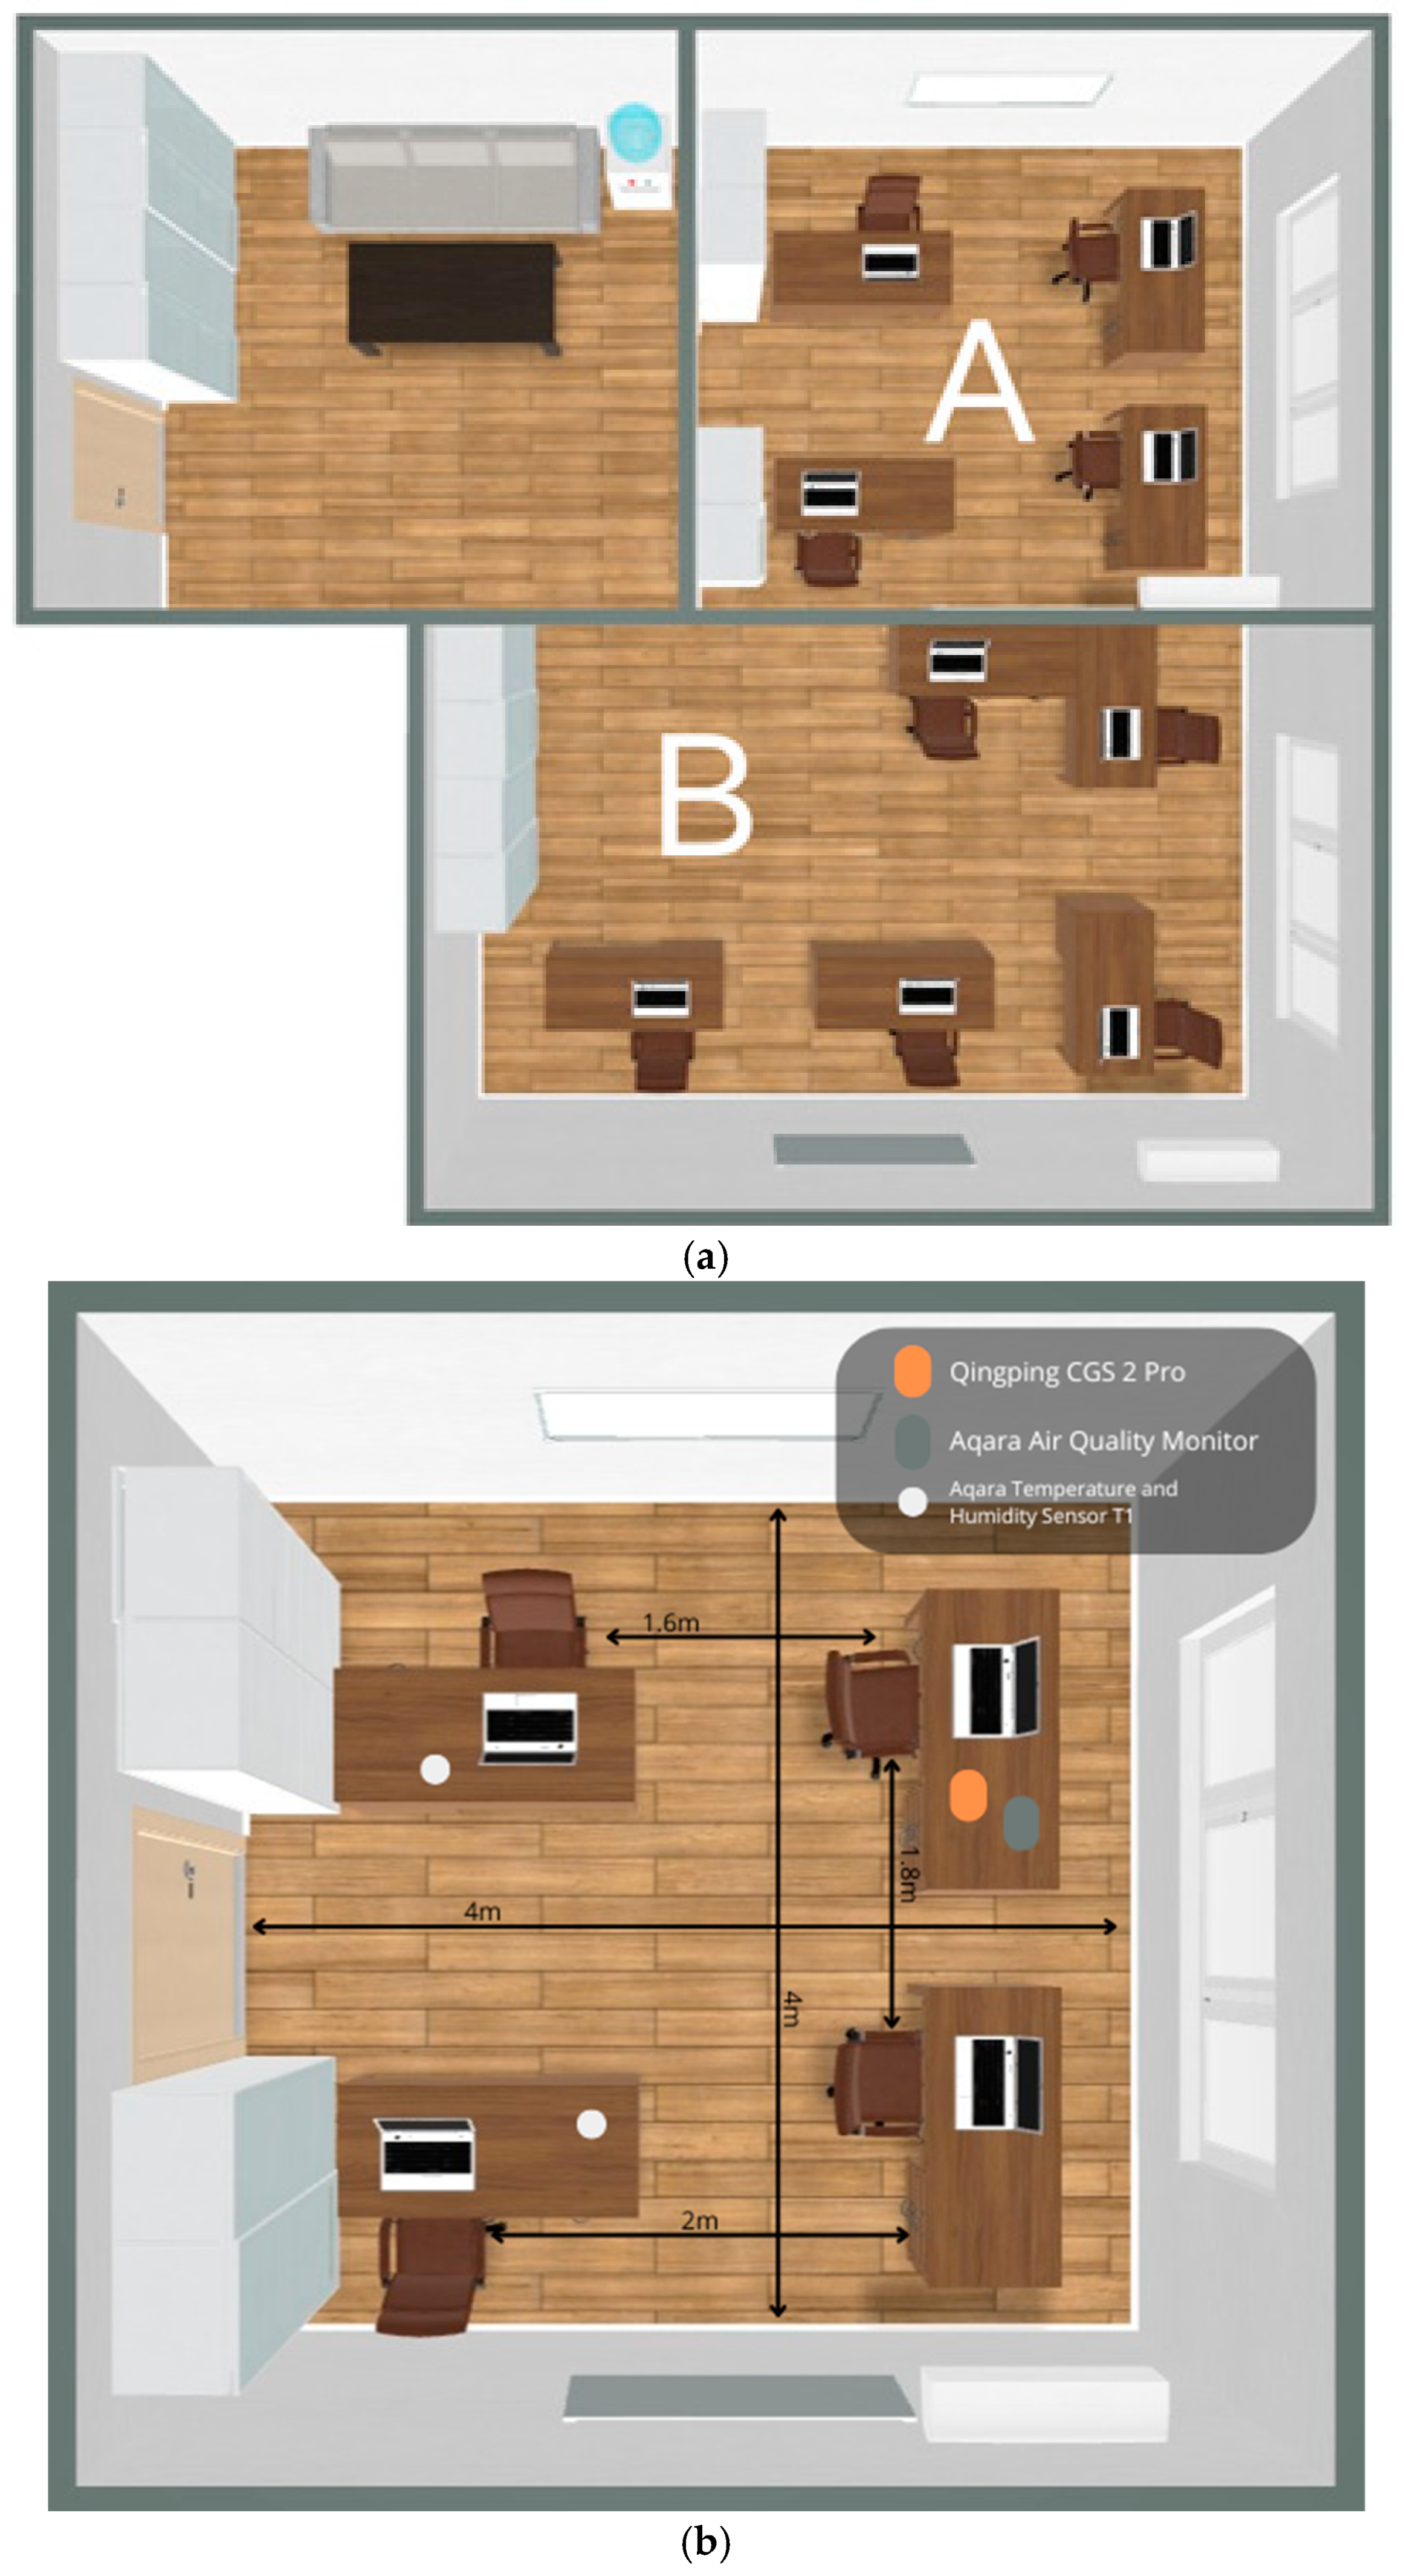
2 levels. Each trial began in Room B, where participants were acclimated to baseline conditions, and then continued in Room A under the assigned discomfort scenario. Both rooms were furnished with desks, chairs, and laptops to mimic a typical office setting and support seated work throughout the session as shown in
Figure 2a [
65]. Before each trial, all wearable sensors were fitted and calibrated in the adjacent preparation room [
66]. A detailed account of each experimental procedure is provided in the following sections.
Aqara Air Quality Monitor (Lumi United Technology Co., Ltd. (brand name Aqara), Shenzhen, China); Aqara Temperature & Humidity Sensor (Lumi United Technology Co., Ltd. (brand name Aqara), Shenzhen, China))Every measurement was taken by sensors listed in
Table 2 for environmental variables and by devices in
Table 3 for physiological signals. The spatial distribution of these sensors within the experimental spaces is illustrated in
Figure 2b, which shows the laboratory floor plan with precise sensor placements. As depicted, both rooms were configured to replicate office environments with workstations strategically positioned to ensure consistent environmental exposure for all participants. Environmental sensors were placed at standardized heights to capture conditions at the breathing zone level, while maintaining sufficient distance from participants to avoid interference with natural air movement patterns. All sensors were calibrated according to manufacturer guidelines, and both monitoring systems were fully integrated into Home Assistant for centralized data collection and automated control of Gree 09 Bora air conditioners and VAKIO Base exhaust fans via MQTT [
67].
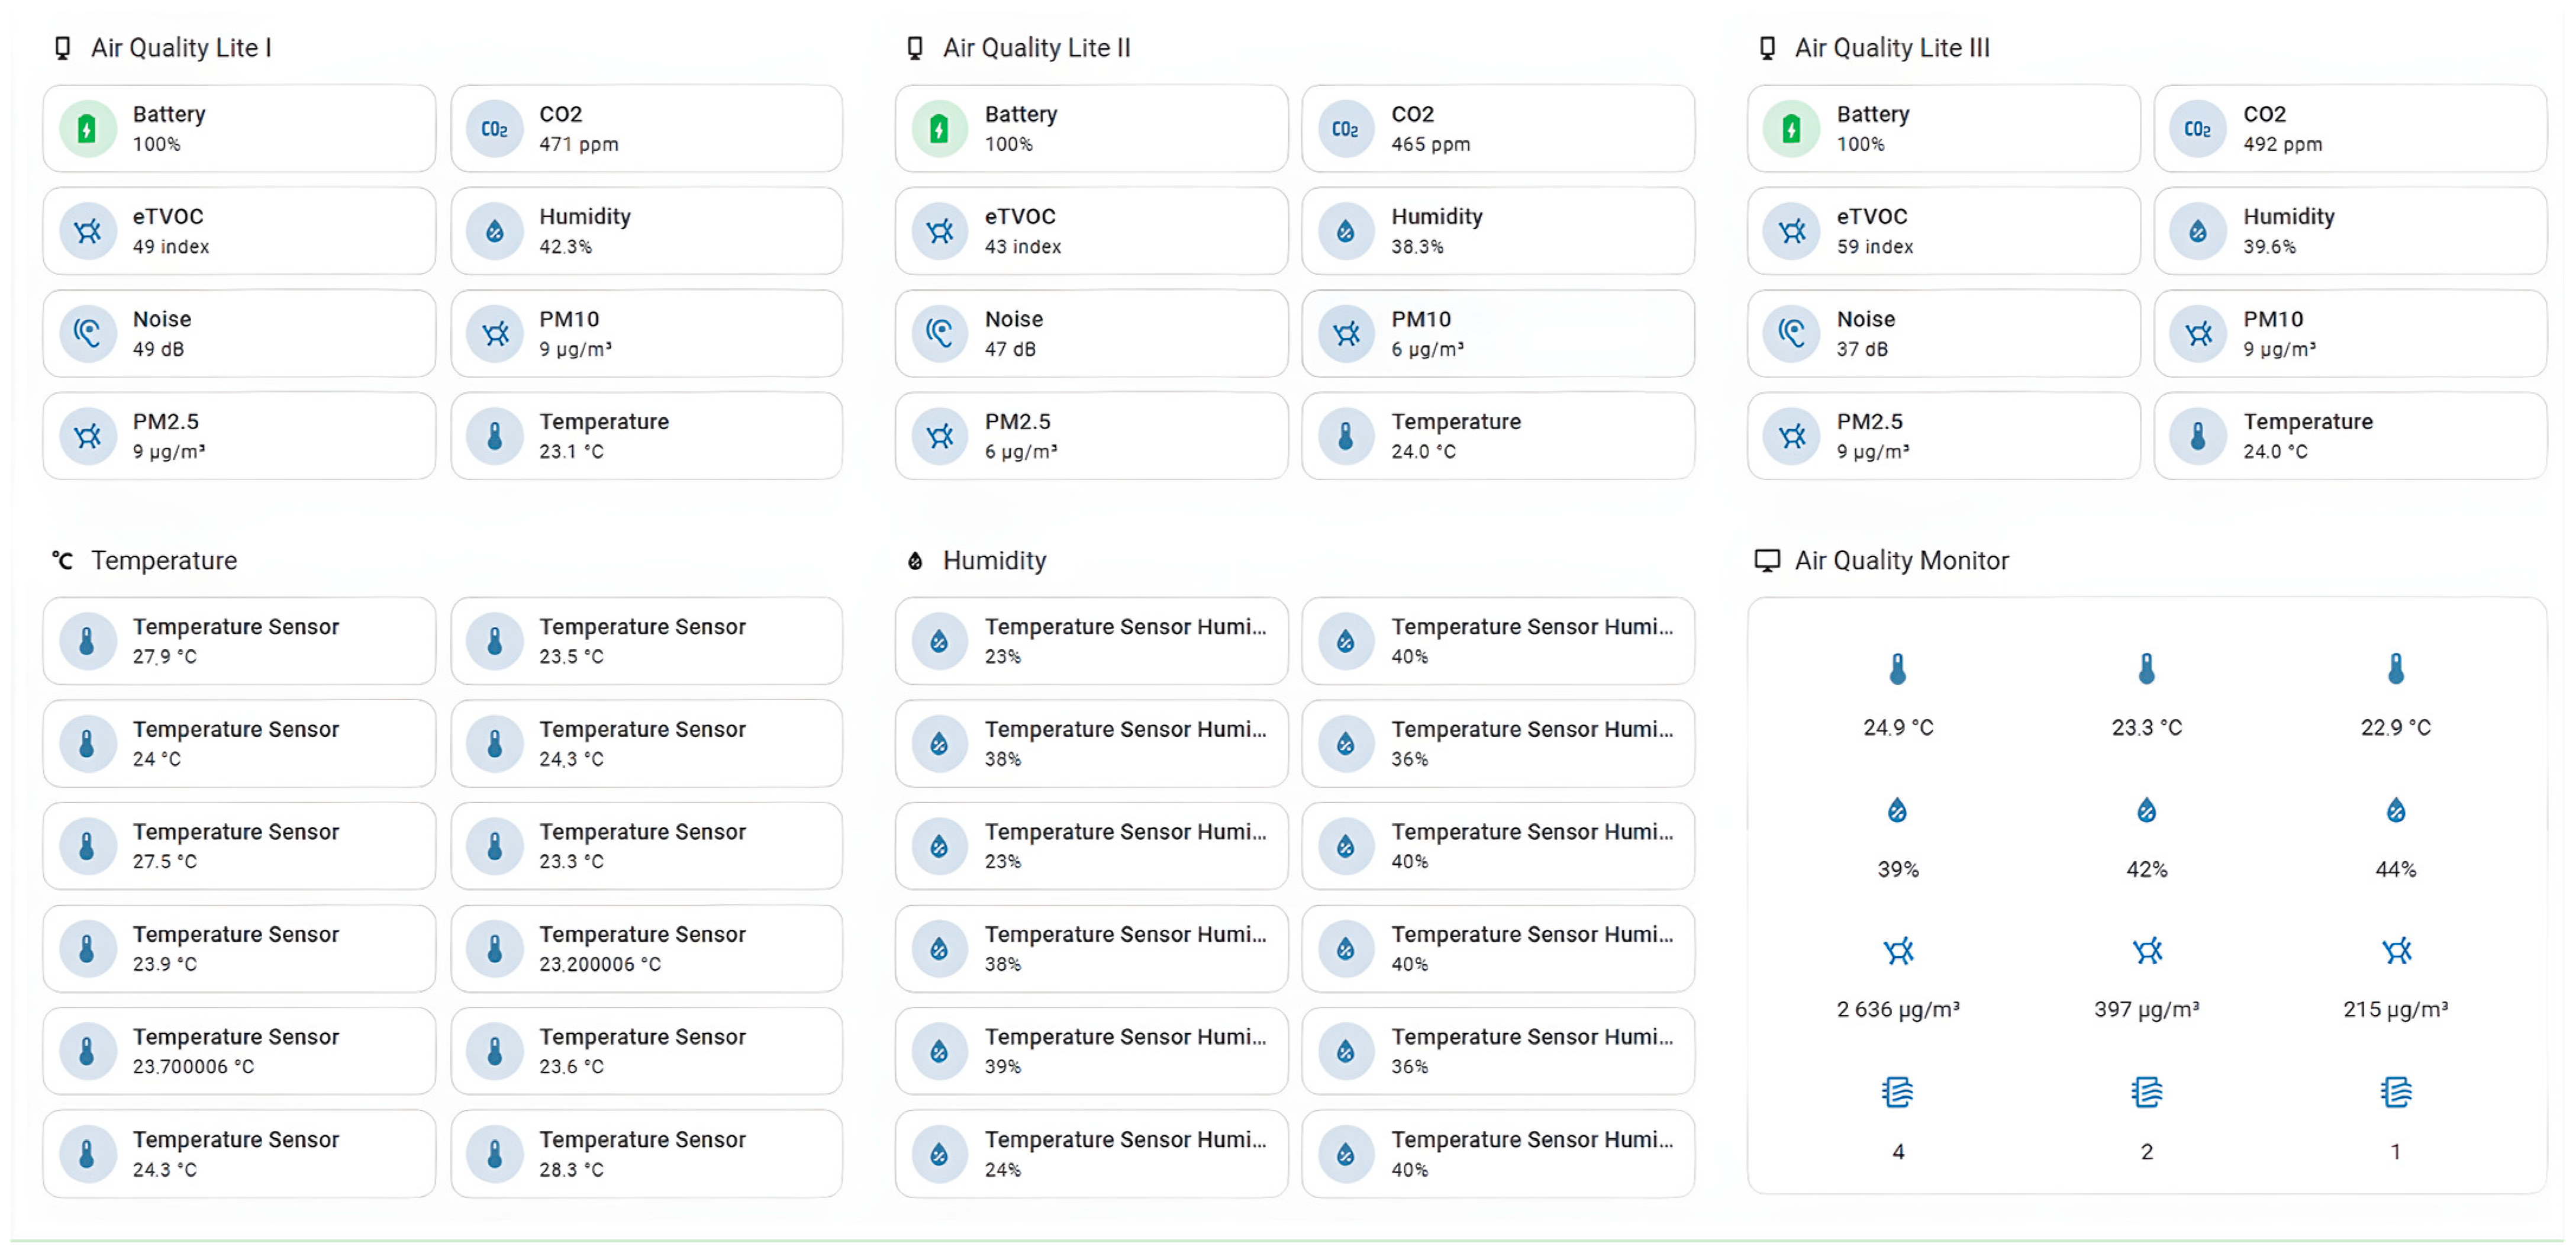
Figure 3 presents the custom-modified Home Assistant dashboard that was used to monitor and control the experiment in real time. The interface adapted specifically for this study, groups sensor tiles by room zone and variable, showing temperature, relative humidity, CO
2, and composite air-quality indices side by side. This layout let the research team track environmental conditions across both test rooms briefly and confirm that every phase remained inside its target bounds. Consolidating all streams into a single view guaranteed consistent protocol enforcement for every participant group and provided instant numerical readouts for each parameter.
Table 2 presents the complete technical specifications of the environmental monitoring equipment used in the study. The selection of these specific devices was based on their high measurement accuracy, reliability, and ability to integrate with the central monitoring system. Particularly important was the CO
2 measurement precision (±50 ppm), which enabled reliable differentiation between our moderate and elevated concentration conditions.
Environmental data were sampled at 1 Hz and streamed continuously; heart rate and SpO2 were recorded at 1 Hz, while blood pressure measurements were logged at the start and end of each trial. All device clocks were synchronized via NTP to within ±10 ms to ensure precise temporal alignment of every data stream.
2.3. Description of Experiments
The experimental sessions were held on 12, 13, and 20 April. Participants experienced thermal discomfort throughout each session and had been fully briefed on the procedure beforehand. During all four trials, they recorded their blood oxygen saturation and blood pressure to capture each participant’s subjective impression of warmth or coolness, The American Society of Heating, Refrigerating, and Air-Conditioning Engineers (ASHRAE) seven-point thermal sensation scale was employed. At six-minute intervals alongside their physiological measurements, participants provided a Thermal Sensation Vote (TSV) on a scale from −3 to +3, where −3 indicated cold, −2 cool, −1 slightly cool, 0 neutral, +1 slightly warm, +2 warm, and +3 hot [
68].
The study was carried out in two purpose-built rooms. The Comfort Room was designed to provide a baseline indoor environment under stable and thermally comfortable conditions:
The study was conducted within two purpose-built environments. The first, designated as the Comfort Room, was designed to provide a stable baseline indoor setting under thermally comfortable conditions. In this room, the air temperature was consistently maintained between 21–22 °C, and CO
2 concentration levels were kept between 500 and 1000 ppm, a range generally associated with acceptable indoor air quality and comfort [
69,
70]. The room’s dimensions were 4 m by 6 m with a 3 m ceiling height.
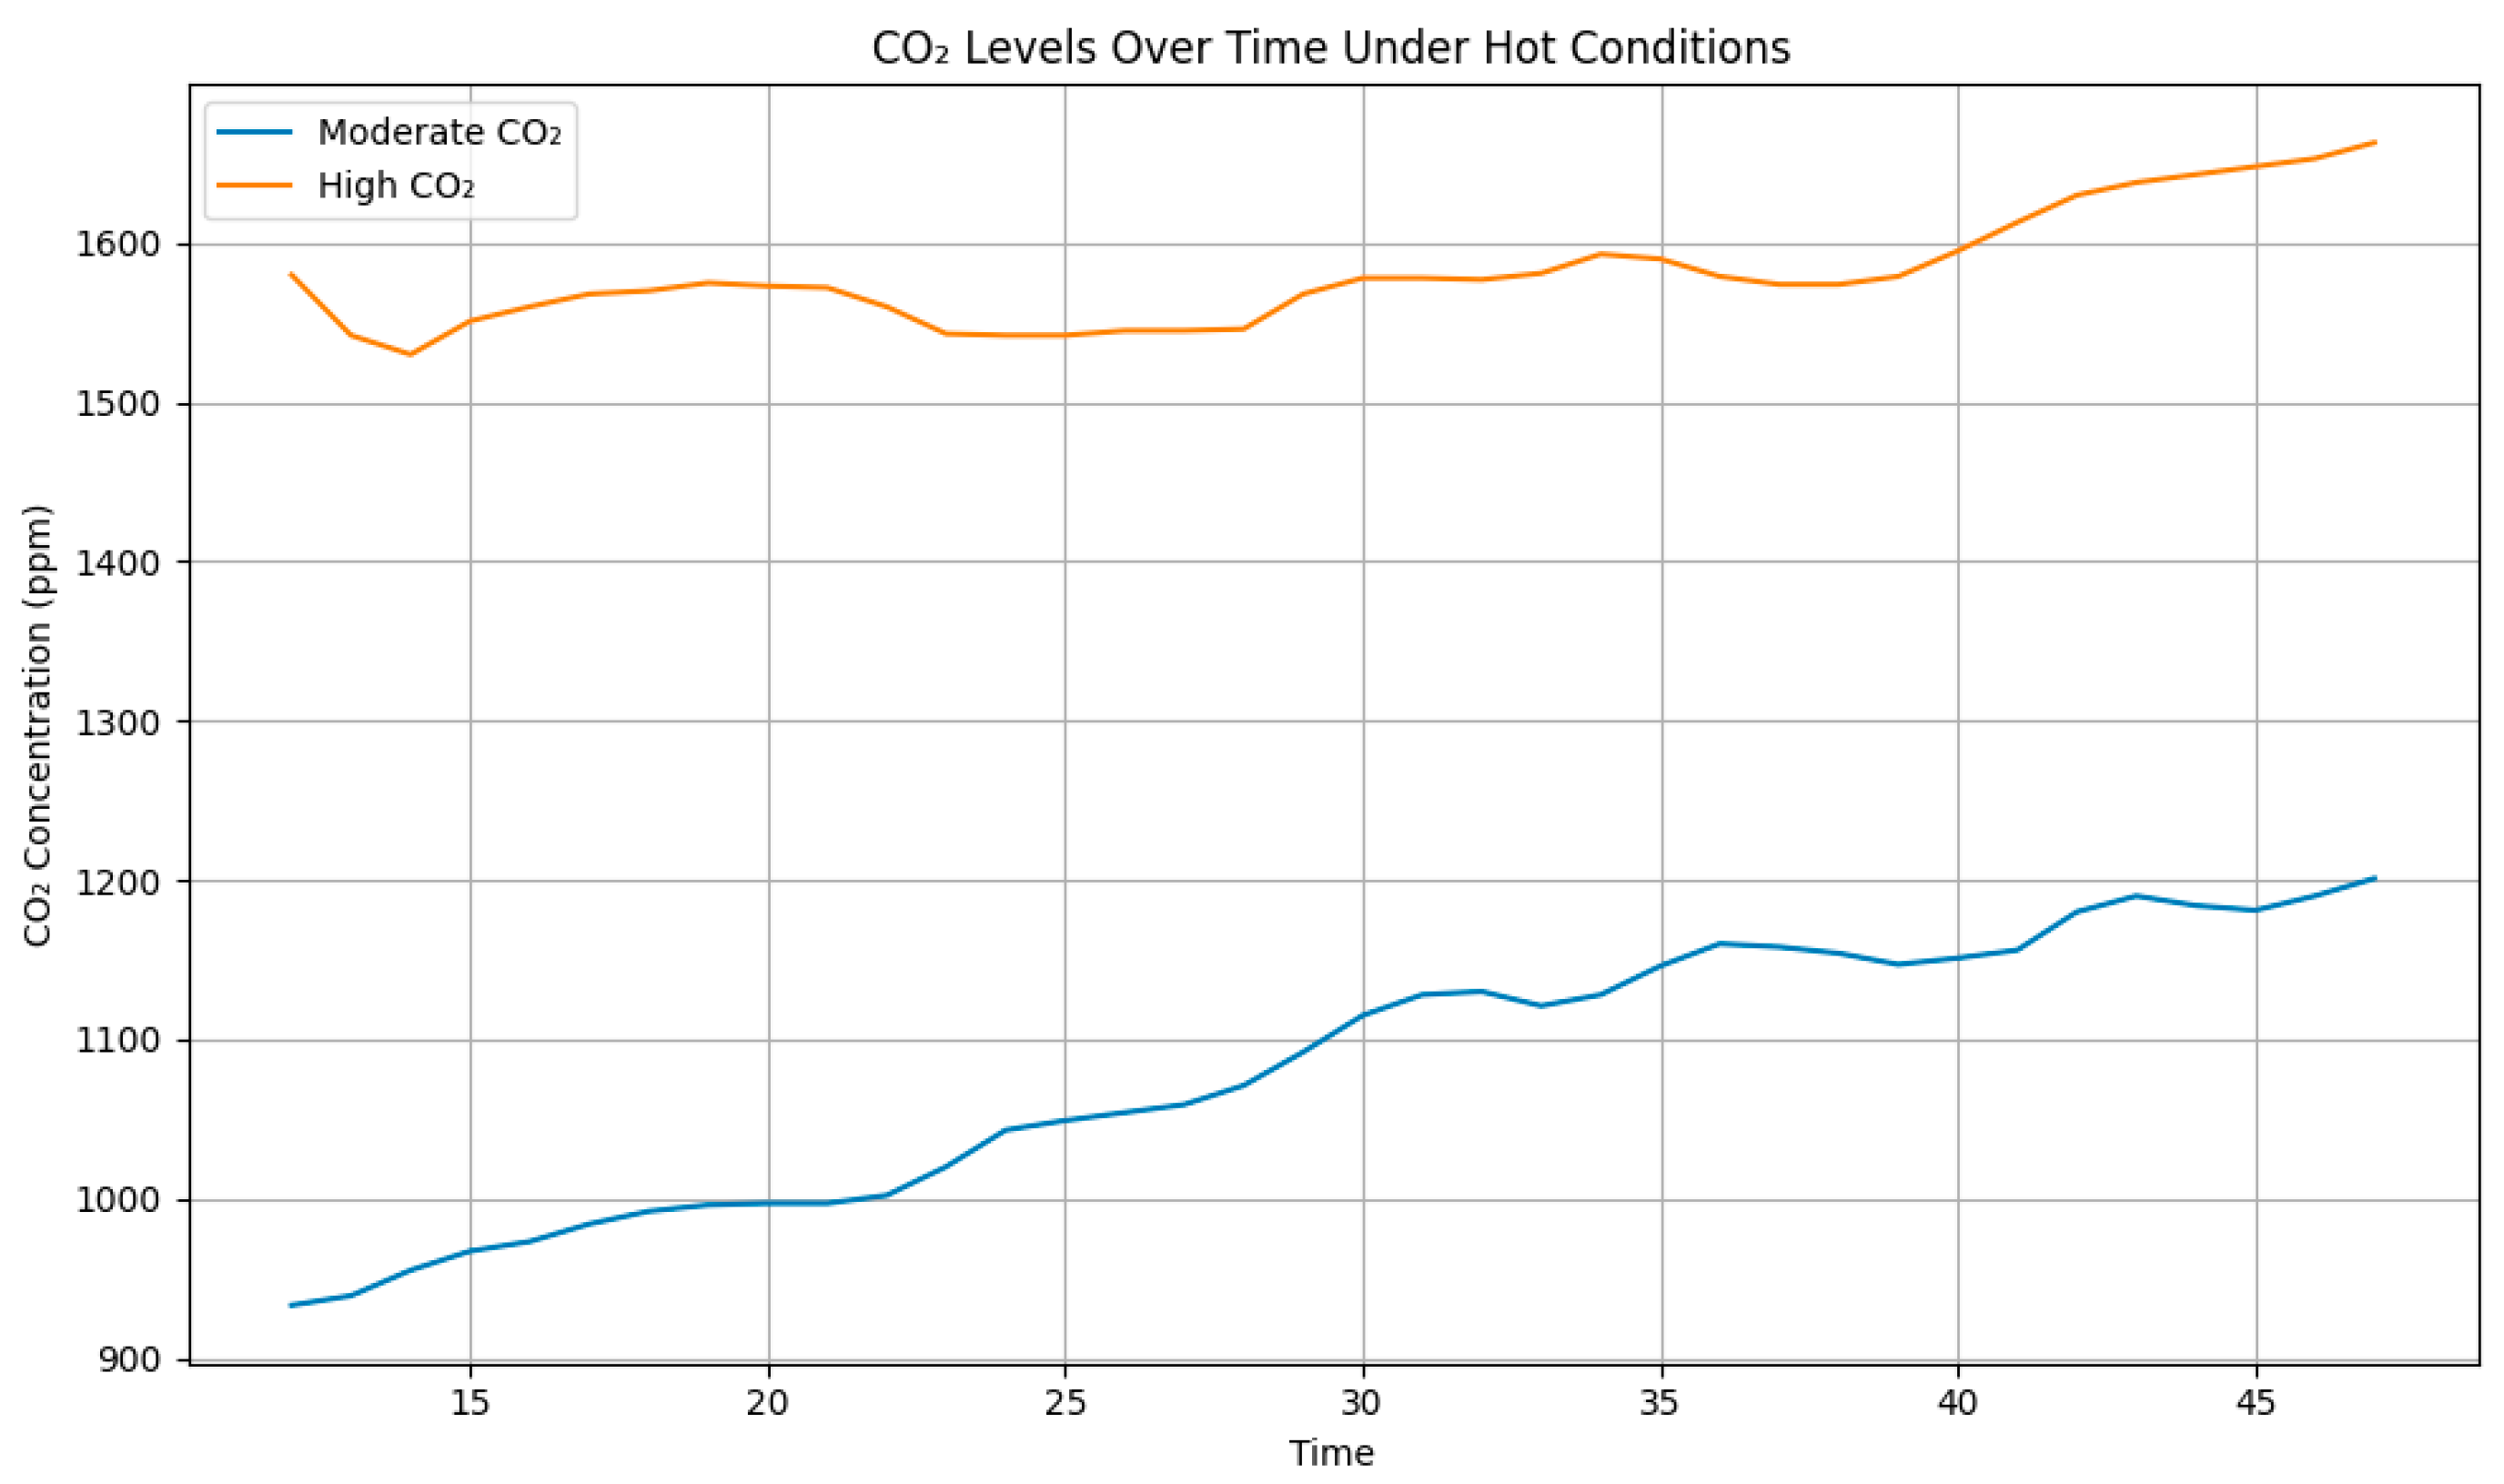
In contrast, the Experimental Room was configured to simulate less comfortable and more variable indoor environments, allowing for the controlled manipulation of thermal and air quality conditions. Here, the air temperature was systematically varied to create both cold (14–16 °C) and hot (30–32 °C) scenarios, in line with previous studies investigating the extremes of indoor thermal conditions [
71]. Similarly, CO
2 levels were managed at two distinct setpoints: a moderate range of 500–1200 ppm and a high concentration of 1500+ ppm, with specific measurements illustrated in
Figure 4. This room had the same 3 m ceiling height but a footprint of 4 m by 4 m.
Room A was configured to provoke cold- and heat-discomfort votes while remaining within safe limits for sedentary adults. The 14–16 °C band sits just below the lower boundary of the ASHRAE comfort zone, where a large share of occupants start reporting “cool” to “cold” sensations [
7]. The 30–32 °C band lies above the upper boundary, eliciting “warm” to “hot” sensations without risking heat stress in a seated task lasting under one hour [
20]. Room B served as a neutral baseline; 21–22 °C coincides with the midpoint of the comfort envelope for light office activity and allows physiological variables to stabilize before each trial [
7].
A wider 2 °C bracket in Room A helps the HVAC controller hold set-points under dynamic metabolic and door-opening disturbances, ensuring the target thermal category is maintained even if the instantaneous value drifts by ±1 °C. In Room B, the goal was strict neutrality, so the controller was tuned to a narrower 1 °C band.
Relative humidity in both rooms was maintained at 45 ± 5% RH using a steam humidifier–dehumidifier pair monitored by the CGS2 sensors; this level minimizes confounding effects of very dry or very humid air on thermal sensation [
72]. Air velocity at head height was kept below 0.15 m s
−1, measured with a hot-wire anemometer, to avoid draught perception that could bias votes [
10].
Twelve minutes in Room B allowed skin temperature and cardiovascular markers to plateau after sensor attachment, based on settling-time observations in similar protocols. Each 36 min exposure in Room A covers three full 12 min measurement cycles, long enough for core–skin heat exchange to approach steady state yet short enough to prevent fatigue or acclimation that would mask initial sensations [
32]. Six-minute sampling aligns with the typical latency of heart-rate–variability responses to thermal shifts and keeps participant workload manageable while still yielding eight labelled data points per trial for model training [
20].
Each experimental session comprised two phases. In the baseline and Comfort phase, participants remained in the Comfort Room for 12 min, during which blood pressure and oxygen saturation were measured every six minutes and subjective thermal sensation votes were recorded at the same intervals. In the Discomfort phase, participants entered the Experimental Room and completed four trials of 36 min each. During each trial measurements were taken at six-minute intervals under the following conditions: cold with moderate CO
2 (14 to 16 °C, 500 to 1200 ppm), cold with high CO
2 (14 to 16 °C, 1500+ ppm), hot with moderate CO
2 (30 to 32 °C, 500 to 1200 ppm), and hot with high CO
2 (30 to 32 °C, 1500+ ppm) (see
Table 4). Although studies indicate that indoor CO
2 concentrations above 1000 ppm negatively affect comfort [
5], limitations of our ventilation system meant levels occasionally rose to 1200 ppm. This factor is taken into account when interpreting the comfort data.
Throughout all phases, physiological measurements were recorded at the prescribed intervals: heart rate variability every minute and blood pressure/oxygen saturation every six minutes.
2.4. Data Processing
Since data collection occurred at different frequencies—with some measurements taken continuously, such as temperature and humidity, while others were sampled discretely at six-minute intervals, such as blood pressure and oxygen saturation—the resulting dataset contained misaligned time series of varying densities. Additionally, since each 48 min trial yielded only 8 discrete measurement points for manually recorded parameters, the overall dataset size was insufficient for robust machine learning model training, particularly for complex multi-class classification. This temporal sparsity and misalignment between continuous and discrete measurements created challenges for establishing reliable correlations between all variables (see
Table 5). Similar issues of time alignment and incomplete data are common in physiological and environmental datasets and require careful preprocessing to support downstream analysis [
73,
74].
To augment the effective sample size without generating fully synthetic data, we applied two complementary preprocessing methods. Each method preserves the intrinsic structure of the original measurements while smoothing or filling gaps in the time series. To prepare our diverse data streams for modeling, we implemented a multi-stage pre-processing pipeline. First, to address the high temporal resolution of microclimate signals like CO
2 concentration and relative humidity, which arrived faster than our physiological measurements, we applied a windowed averaging procedure. This method harmonized the sampling rates by defining non-overlapping time windows that matched the interval of our slowest sensor and then averaging all raw readings within each window. The resulting downsampled, smoothed series preserved the essential longer-term trends while removing rapid fluctuations that our models could not meaningfully exploit. This aligns with previous approaches to handling asynchronous time series and controlling volatility in heterogeneous streams [
74].
Conversely, for physiological and manually recorded parameters that were sampled infrequently, such as blood-oxygen saturation and blood pressure, we used piecewise cubic spline interpolation to generate a more continuous signal without fabricating data. In this approach, each original measurement timestamp served as a “knot” for the spline. A cubic spline was then fitted across these successive knots, ensuring the continuity of the value as well as its first two derivatives. We then evaluated the spline at intermediate time points corresponding to our primary microclimate sampling rate. Spline-based methods are widely applied in biomedical signal preprocessing to approximate missing values while preserving temporal coherence [
73,
75].
Finally, to place all inputs on a common scale and accelerate model convergence, we applied min-max normalization. Normalization is particularly crucial when training neural models on multimodal physiological inputs to prevent high-magnitude variables from dominating the gradient updates [
74,
76]. Each feature x was transformed according to the Equation (1) to scale the data into a common [−1, 1] range. In a parallel step, the target variable—the thermal comfort vote, originally on an ordinal scale from −3 to +3—was linearly transformed to the interval [0, 6]. This was carried out to align its scale with the normalized feature space and further promote faster convergence during model training:
2.5. Machine Learning Models
After adjusting the dataset size, models were trained on the entire dataset rather than on condition-specific subsets as in previous studies. Since the target variable thermal comfort comprises seven discrete levels, the task was formulated as multi-class classification.
The predictive framework employs three advanced classifiers: an artificial neural network (ANN), Random Forest, and XGBoost. Random Forest and XGBoost undergo exhaustive grid search for hyperparameter tuning and are evaluated using stratified cross-validation, while the ANN is trained using a held-out validation split to monitor performance. All three models are capable of learning complex non-linear mappings from high-dimensional physiological and environmental features to discrete comfort categories. Their ability to leverage shared structures across class boundaries enhances classification robustness and generalization, particularly in settings with low data volume or class imbalance [
77]. The algorithms are briefly described below:
Random Forest is an ensemble of decision trees that enhances generalization and mitigates overfitting by aggregating predictions from multiple bootstrap sampled trees [
46].
XGBoost is an optimized gradient boosting implementation that sequentially adds trees to minimize a regularized loss function delivering high efficiency and accuracy via parallelized training and built in regularization [
47].
In parallel, an Artificial Neural Network (ANN) was implemented and trained, with its performance continuously monitored on a held-out validation set [
48]. The network was configured to accept the 23 input features and produce seven output logits corresponding to the defined comfort levels.
Its architecture consists of five fully connected layers with decreasing widths (256, 128, 64, 64, and 32 neurons). Each hidden layer is followed by a sequence of batch normalization, ReLU activation function, and a 30% dropout rate to mitigate overfitting. The final linear layer maps the resulting 32-unit feature representation to the seven target classes.
The model was trained for up to 1000 epochs using mini-batches of 32 samples. The Adam optimizer, with a learning rate of 0.001, and cross-entropy loss were used to guide weight updates. Key hyperparameters, such as the learning rate schedule and dropout amount, were fine-tuned based on validation performance before the final evaluation on the test set. This hybrid approach—combining deep learning with ensemble tree methods—has been shown to outperform standalone classifiers in complex biomedical signal contexts by balancing expressive power and generalizability [
77].
Although cubic spline interpolation is frequently used in the preprocessing of biosignals and is known to potentially distort key signal characteristics, it is important to note that its application to sparsely sampled parameters—such as arterial pressure measured only a few times over a 36 min session (as indicated in the initial problem description but not clarified in the sources)—introduces modeling assumptions and may generate artifacts. This preprocessing step, while necessary for aligning input dimensionality, thus represents a trade-off between data continuity and signal fidelity that may influence model behavior.
2.5.1. Evaluation Metrics
Model performance was assessed using standard classification metrics that provide insight into how accurately the classifiers distinguished among the seven comfort levels on both training and test data. Accuracy was calculated as the proportion of correct predictions out of all predictions. Precision for each class measured the ratio of true positives to the sum of true positives and false positives, indicating how many of the instances predicted for a given class were correct. Recall for each class was the ratio of true positives to the sum of true positives and false negatives, showing how many actual instances of a class were correctly identified. The F1-score combined precision and recall into a single metric by taking their harmonic mean, providing a balanced view of each model’s ability to avoid both false positives and false negatives. In addition to per-class results, macro-averaged and weighted-averaged precision, recall, and F1-scores were computed to summarize overall performance across all seven comfort levels. Finally, normalized confusion matrices were examined to visualize patterns of correct and incorrect predictions, revealing that most misclassifications occurred between adjacent comfort levels and helping to identify any systematic bias or signs of overfitting.
2.5.2. Cross Validation
A ten-fold cross validation scheme was applied to obtain a robust estimate of model performance. The dataset was split into ten equal parts, and in each iteration the model was trained on nine parts and tested on the remaining one. After repeating this process ten times so that every part served once as the test set the performance metrics were averaged across all folds. This approach mitigates bias from any single train-test split and provides a more statistically stable and generalizable performance estimate, especially in smaller or imbalanced datasets [
78].
2.5.3. Grid Search
Hyperparameter tuning was carried out using grid search, a systematic method that evaluates every combination of specified hyperparameter values. Each candidate configuration was assessed via ten-fold cross validation to determine its effectiveness. For each model, a grid of relevant hyperparameters was defined. The grid search trained and validated the model on each hyperparameter combination, ultimately selecting the set that achieved the highest average performance across all folds. This exhaustive strategy is widely used in biomedical and clinical applications to ensure optimal generalization and avoid overfitting, particularly when dealing with noisy or imbalanced datasets [
79,
80]. Despite its computational intensity, grid search offers transparent and reproducible hyperparameter selection compared to stochastic or Bayesian alternatives [
81].
The next section presents the results of these modelling experiments, comparing classifier performance and discussing their relative strengths in predicting thermal comfort levels.
2.5.4. SHapley Additive exPlanations
SHAP (SHapley Additive exPlanations) was employed to interpret model predictions and identify the most influential features driving thermal comfort classification. Drawing on the Shapley value framework from cooperative game theory, SHAP assigns each feature
i that represents its
i average marginal effect on the model output across all possible feature subsets:
where
N is the set of all features,
S is any subset containing
i, and
denotes the model’s expected output given only features in
S. This formulation guarantees axiomatic properties efficiency, symmetry, the null player condition, and additivity, ensuring fair, consistent, and locally accurate attributions for each prediction.
In practice, SHAP values were computed for each model using TreeExplainer for Random Forest, XGBoost, and GradientExplainer for the ANN, and summary plots were generated to rank features by their overall importance. Then models were retrained using only the top-ranked features to compare their performance against models trained on the full feature set, thereby assessing the potential for dimensionality reduction without compromising predictive accuracy.
3. Results
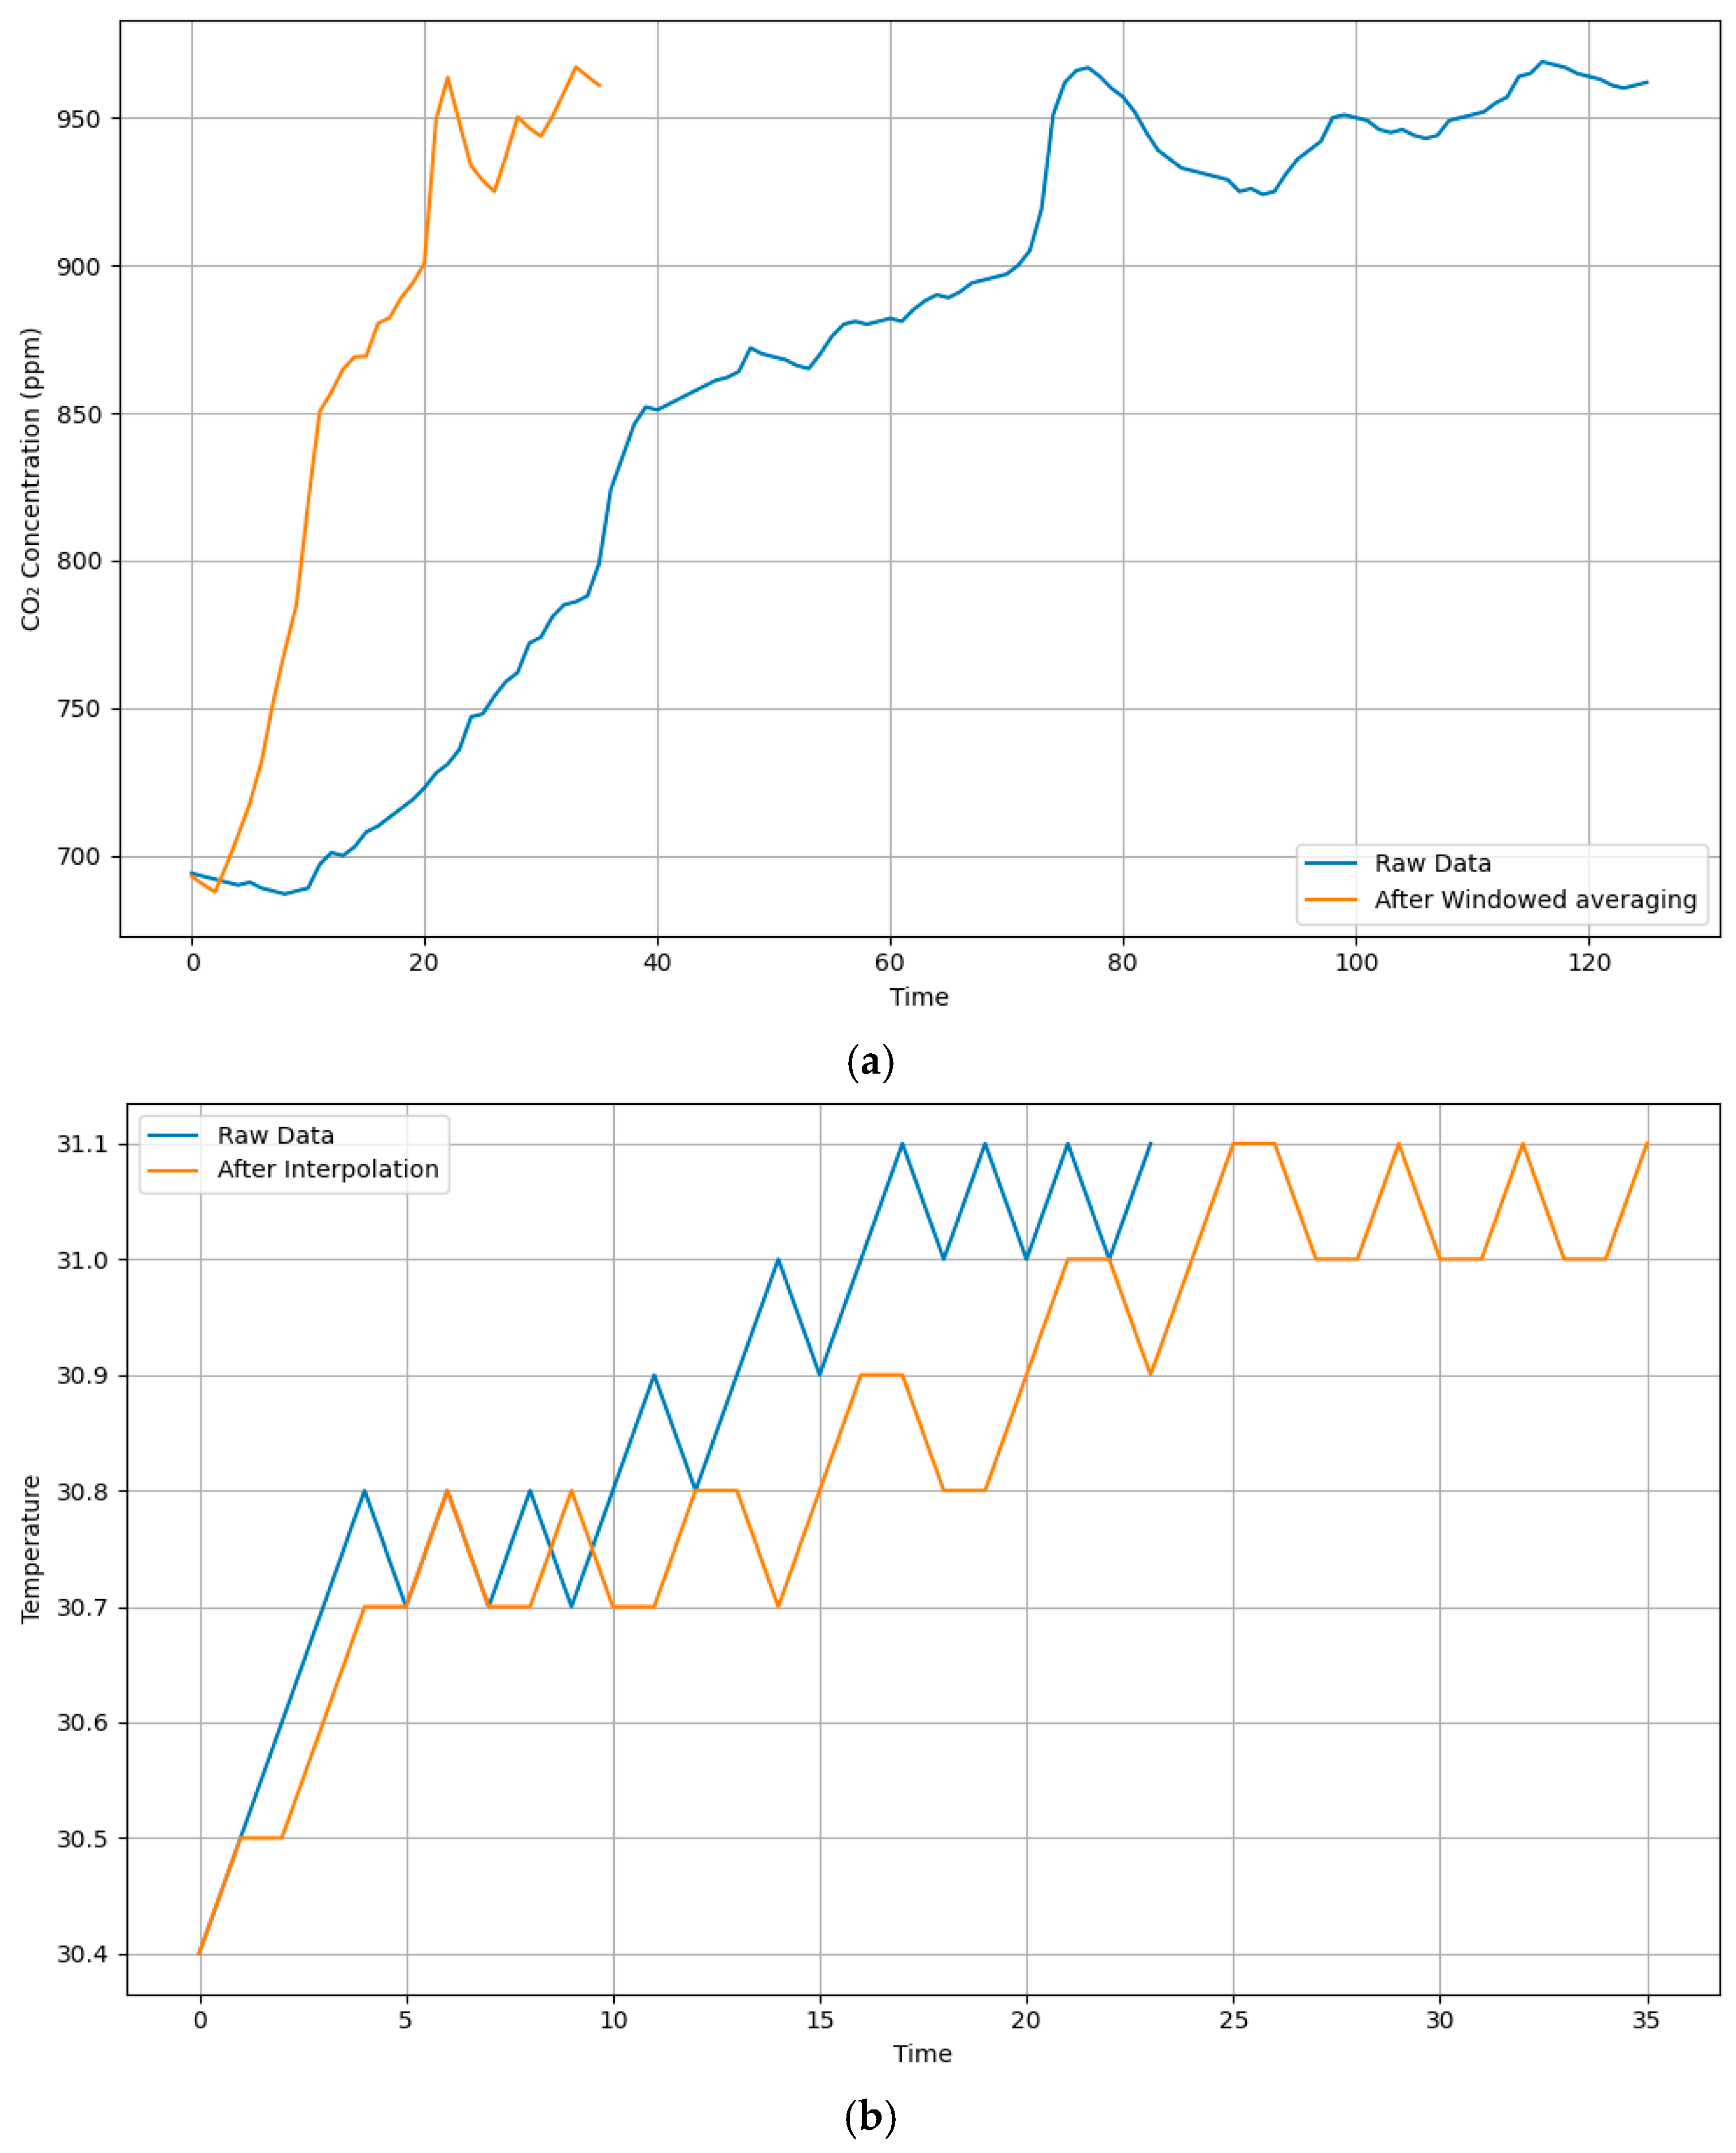
Once data from all devices and sensors were collected, they were preprocessed using windowed averaging for high-frequency signals and spline interpolation for sparse measurements to align precisely with the 48-min experimental trials (see
Figure 5a,b).
(a) The graph illustrates the temporal variation of CO2 concentration. The raw data (blue line) exhibit considerable noise and short-term fluctuations, which complicate trend detection and time-based analysis. Applying the windowed averaging method (orange line) allows for effective noise suppression and clearly reveals the underlying signal dynamics. This approach is particularly important for analyzing time-dependent trends and enables the data to serve as a stable and reliable source for visualization and automation within the Home Assistant platform.
(b) The second graph shows the temperature measurements before (blue line) and after (orange line) interpolation. Spline interpolation fills in missing data points and ensures signal continuity. This is essential for integrating the data into machine learning models or real-time control systems. However, interpolation can introduce flattened segments that do not accurately reflect natural variability.
After data collection and preprocessing were complete, a final dataset comprising 1536 samples with 24 features each was assembled. Fully cleaned and normalized, it was ready for model training. First, 100 points were randomly selected and set aside for a subsequent validation stage on data entirely unseen during model training or initial testing. The remaining 1436 samples were then used for model development. This subset was split using a stratified 80/20 ratio to maintain class distribution, resulting in 1148 samples for training and 288 samples for testing. Model performance was evaluated on this held-out test set of 288 samples.
Table 6 presents the full classification reports after training on the full feature set; key observations are summarized below.
Random Forest (RF) achieved an overall accuracy of 0.90. Its macro-averaged precision was 0.90, with a macro-averaged recall of 0.89, and a macro-averaged F1-score of 0.89. When mapped to the −3 to +3 comfort levels, RF demonstrated strong performance for neutral conditions (level 0, class 3.0) with a recall of 0.96. It also achieved perfect recall (1.00) for the slightly warm (level +1, class 4.0) and hot (level +3, class 6.0) conditions. However, its lowest recall was 0.77 for the cool condition (level −2, class 1.0), indicating more difficulty distinguishing this specific comfort level.
XGBoost emerged as the top-performing model with an overall accuracy of 0.91. It achieved macro-averaged precision, recall, and F1-score of 0.91, 0.90, and 0.90, respectively. XGBoost showed robust recall across most classes, notably achieving perfect recall (1.00) for the hottest level (+3, class 6.0) and a high recall of 0.96 for neutral conditions (level 0, class 3.0). Its lowest recall was 0.81 for the slightly warm level (+1, class 4.0), though it maintained a precision of 0.86 for this class.
The Artificial Neural Network (ANN) yielded an overall accuracy of 0.89. Its macro-averaged precision, recall, and F1-score were all 0.88. The ANN performed well in identifying neutral conditions (level 0, class 3.0) with a recall of 0.95 and perfect precision (1.00). It also demonstrated good recall for the cool condition (level −2, class 1.0) at 0.91 and the hot condition (+3, class 6.0) at 0.93. The lowest recall for the ANN was 0.77 for the warm level (+2, class 5.0).
Overall, XGBoost demonstrated the most consistent and highest performance across the evaluated metrics. While Random Forest also provided strong results, XGBoost showed a slight edge in overall accuracy and maintained robust recall across various comfort levels. The ANN, while competitive, trailed slightly behind the ensemble methods in its macro-averaged scores.
With model training complete and performance results obtained (see
Table 7), the study pivoted to a per-modal SHAP analysis to quantify feature importance (see
Appendix A Figure A1,
Figure A2 and
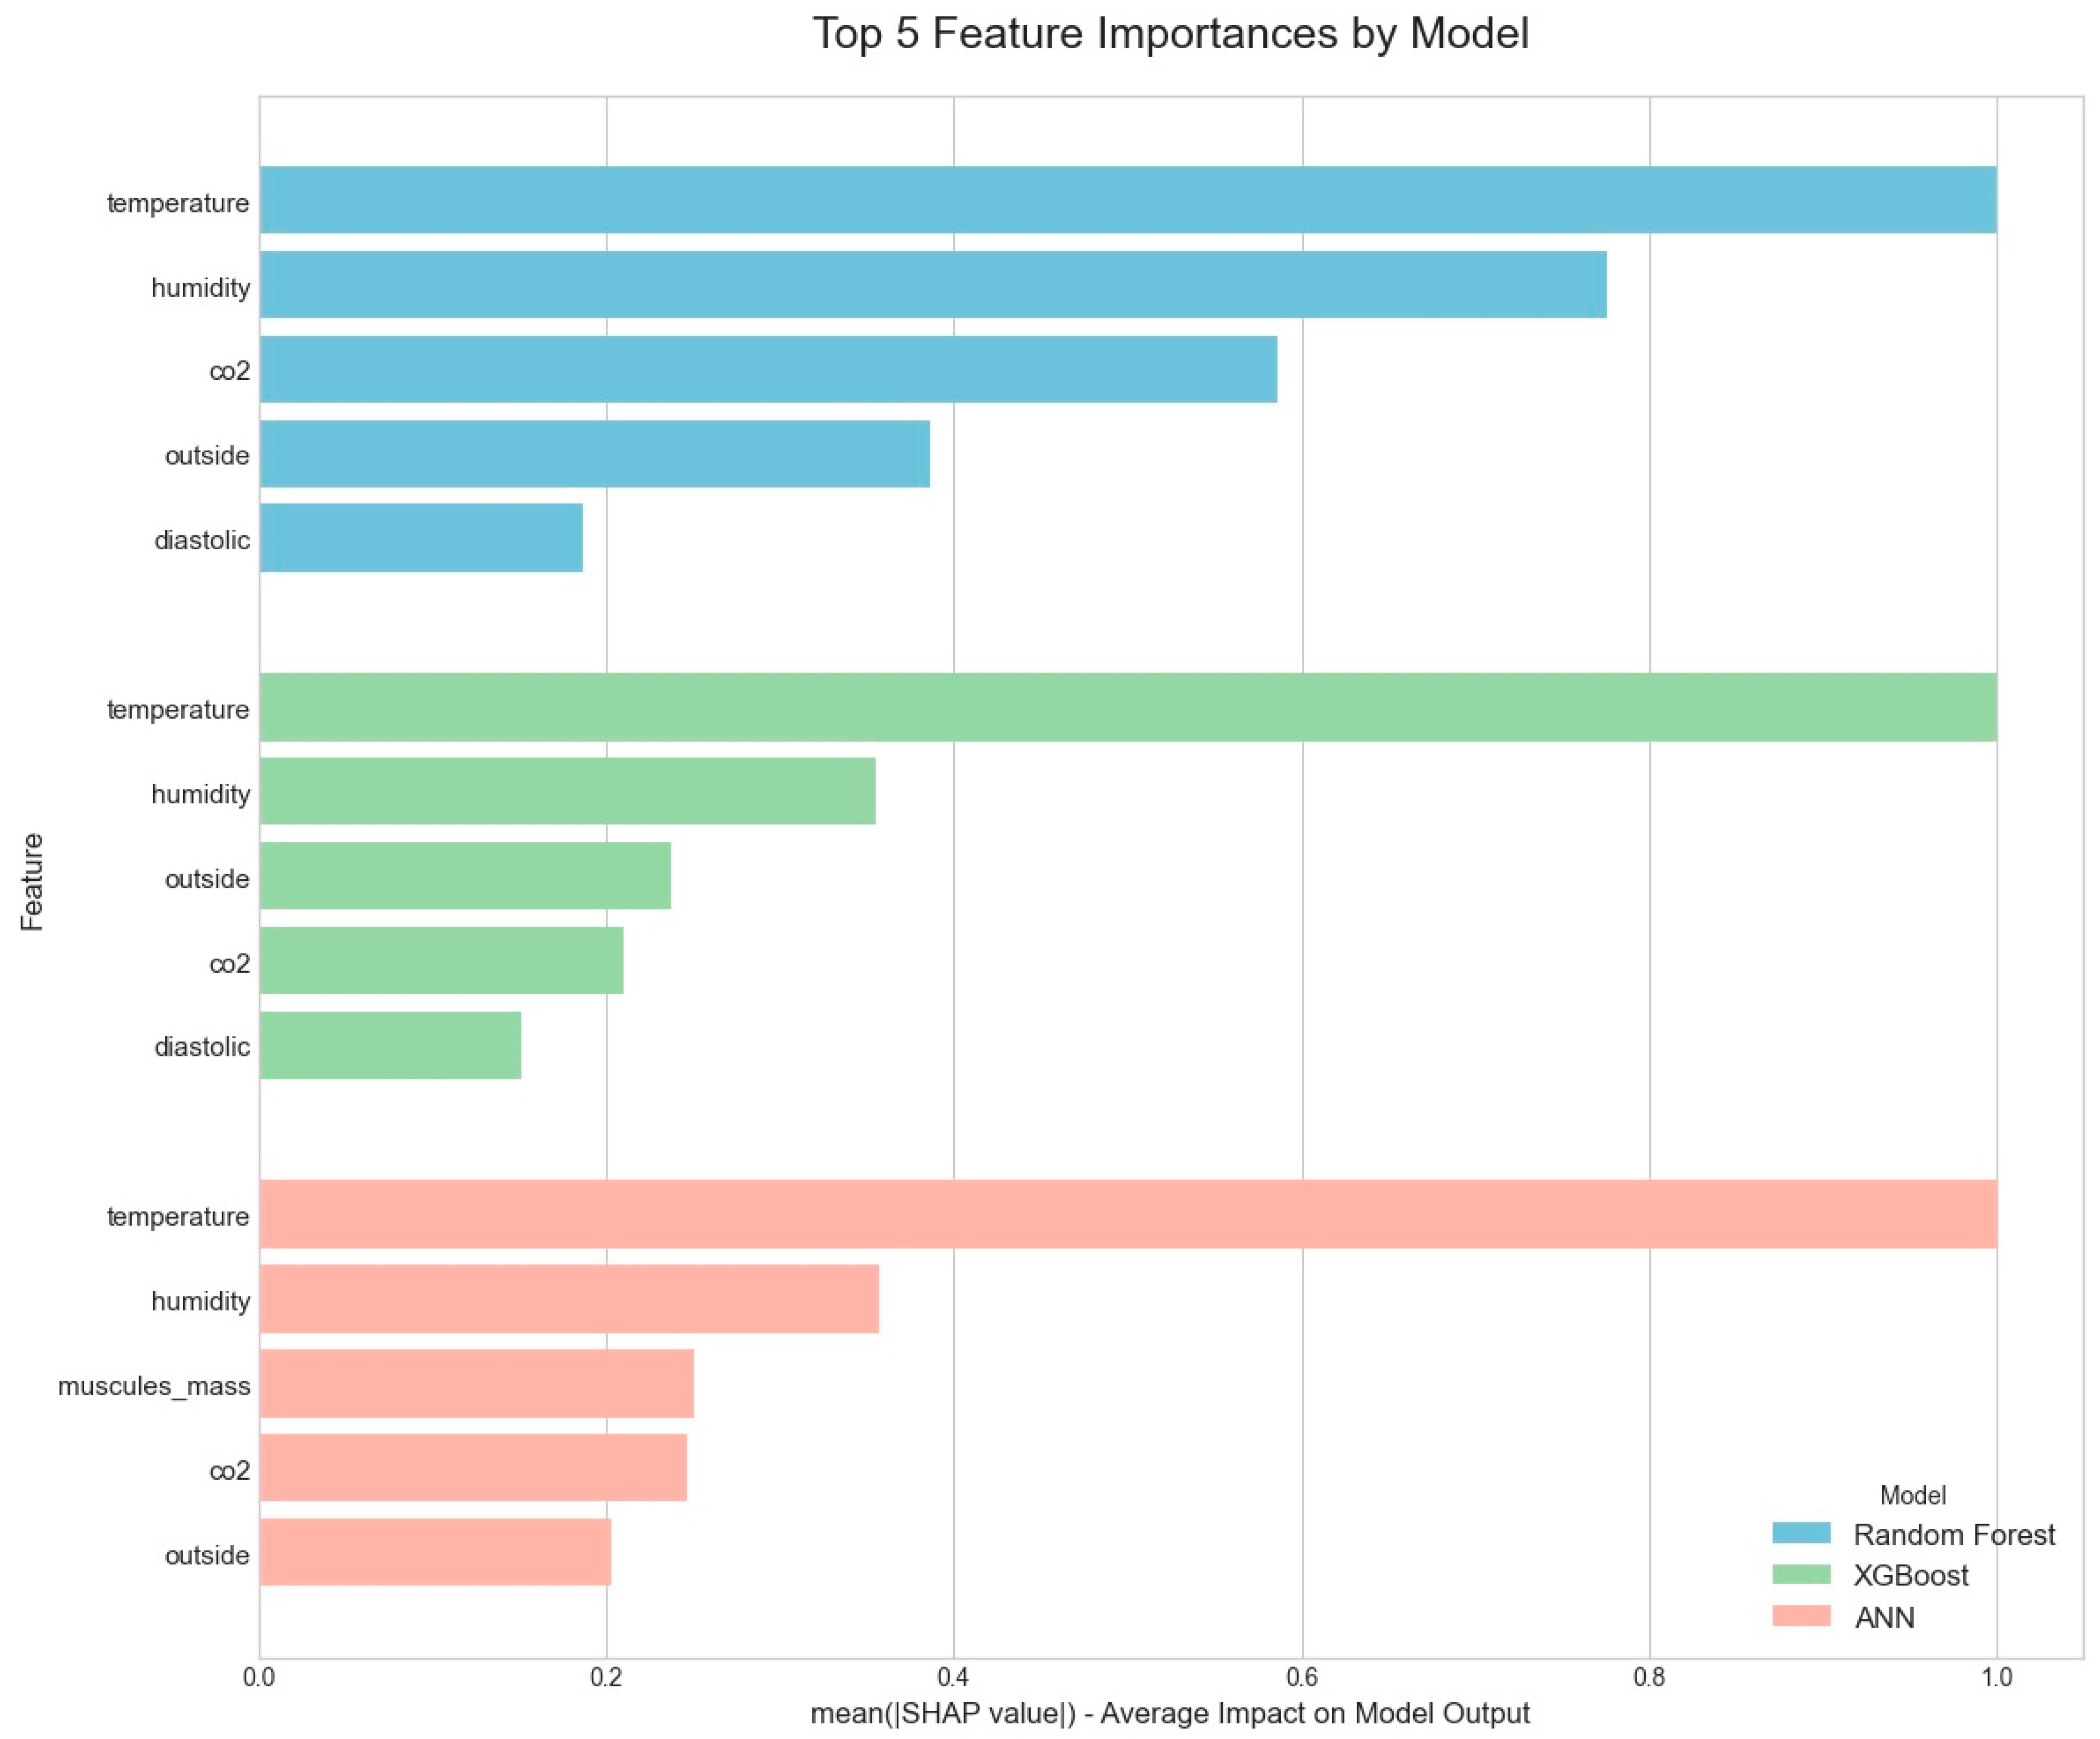
Figure A3). From this analysis, we identified the ten features with the highest mean absolute SHAP values for each classifier. These top-ranked features were then used to retrain new, more streamlined models to assess the impact of dimensionality reduction on predictive accuracy. To visualize the most critical of these inputs,
Figure 6 illustrates the top five most important parameters for each model,
Table 1, etc.
Random Forest (RF) showed improved performance, achieving an overall accuracy of 0.94. Its macro-averaged precision rose to 0.95, with macro-averaged recall and F1-score both at 0.94. This enhancement underscores the model’s ability to capitalize on a more focused feature set. Notably, RF achieved perfect recall (1.00) for neutral (level 0, class 3.0) and hot (level +3, class 6.0) conditions, and perfect precision (1.00) for the coldest level (−3, class 0.0). The lowest recall was 0.89, for both the coldest (−3, class 0.0) and warm (+2, class 5.0) levels, still indicating strong performance across all classes.
XGBoost also benefited from feature reduction, with its overall accuracy increasing to 0.93. The macro-averaged precision was 0.93, macro-averaged recall was 0.91, and the macro-average F1-score reached 0.92. XGBoost demonstrated perfect precision (1.00) for the coldest level (−3, class 0.0) and maintained high recall across most categories, such as 0.98 for neutral conditions (level 0, class 3.0). Its lowest recall was 0.77 for the slightly warm (+1, class 4.0) category.
Conversely, the Artificial Neural Network (ANN) experienced a decline in performance when trained on the reduced feature set, with overall accuracy dropping to 0.83. Its macro-averaged precision and recall were 0.82, and the macro-averaged F1-score fell to 0.80. While it achieved perfect recall (1.00) for the hottest level (+3, class 6.0) and a high recall of 0.93 for the coldest level (−3, class 0.0), its performance significantly suffered for the warm condition (+2, class 5.0), with recall plummeting to 0.46.
These results align with the initial findings, where ensemble models like Random Forest and XGBoost improved with dimensionality reduction by focusing on the most impactful features. The neural network, however, seemed to rely on a broader set of feature interactions, and its performance deteriorated when less globally important features were removed. Random Forest emerged as the top performer on the reduced feature set.
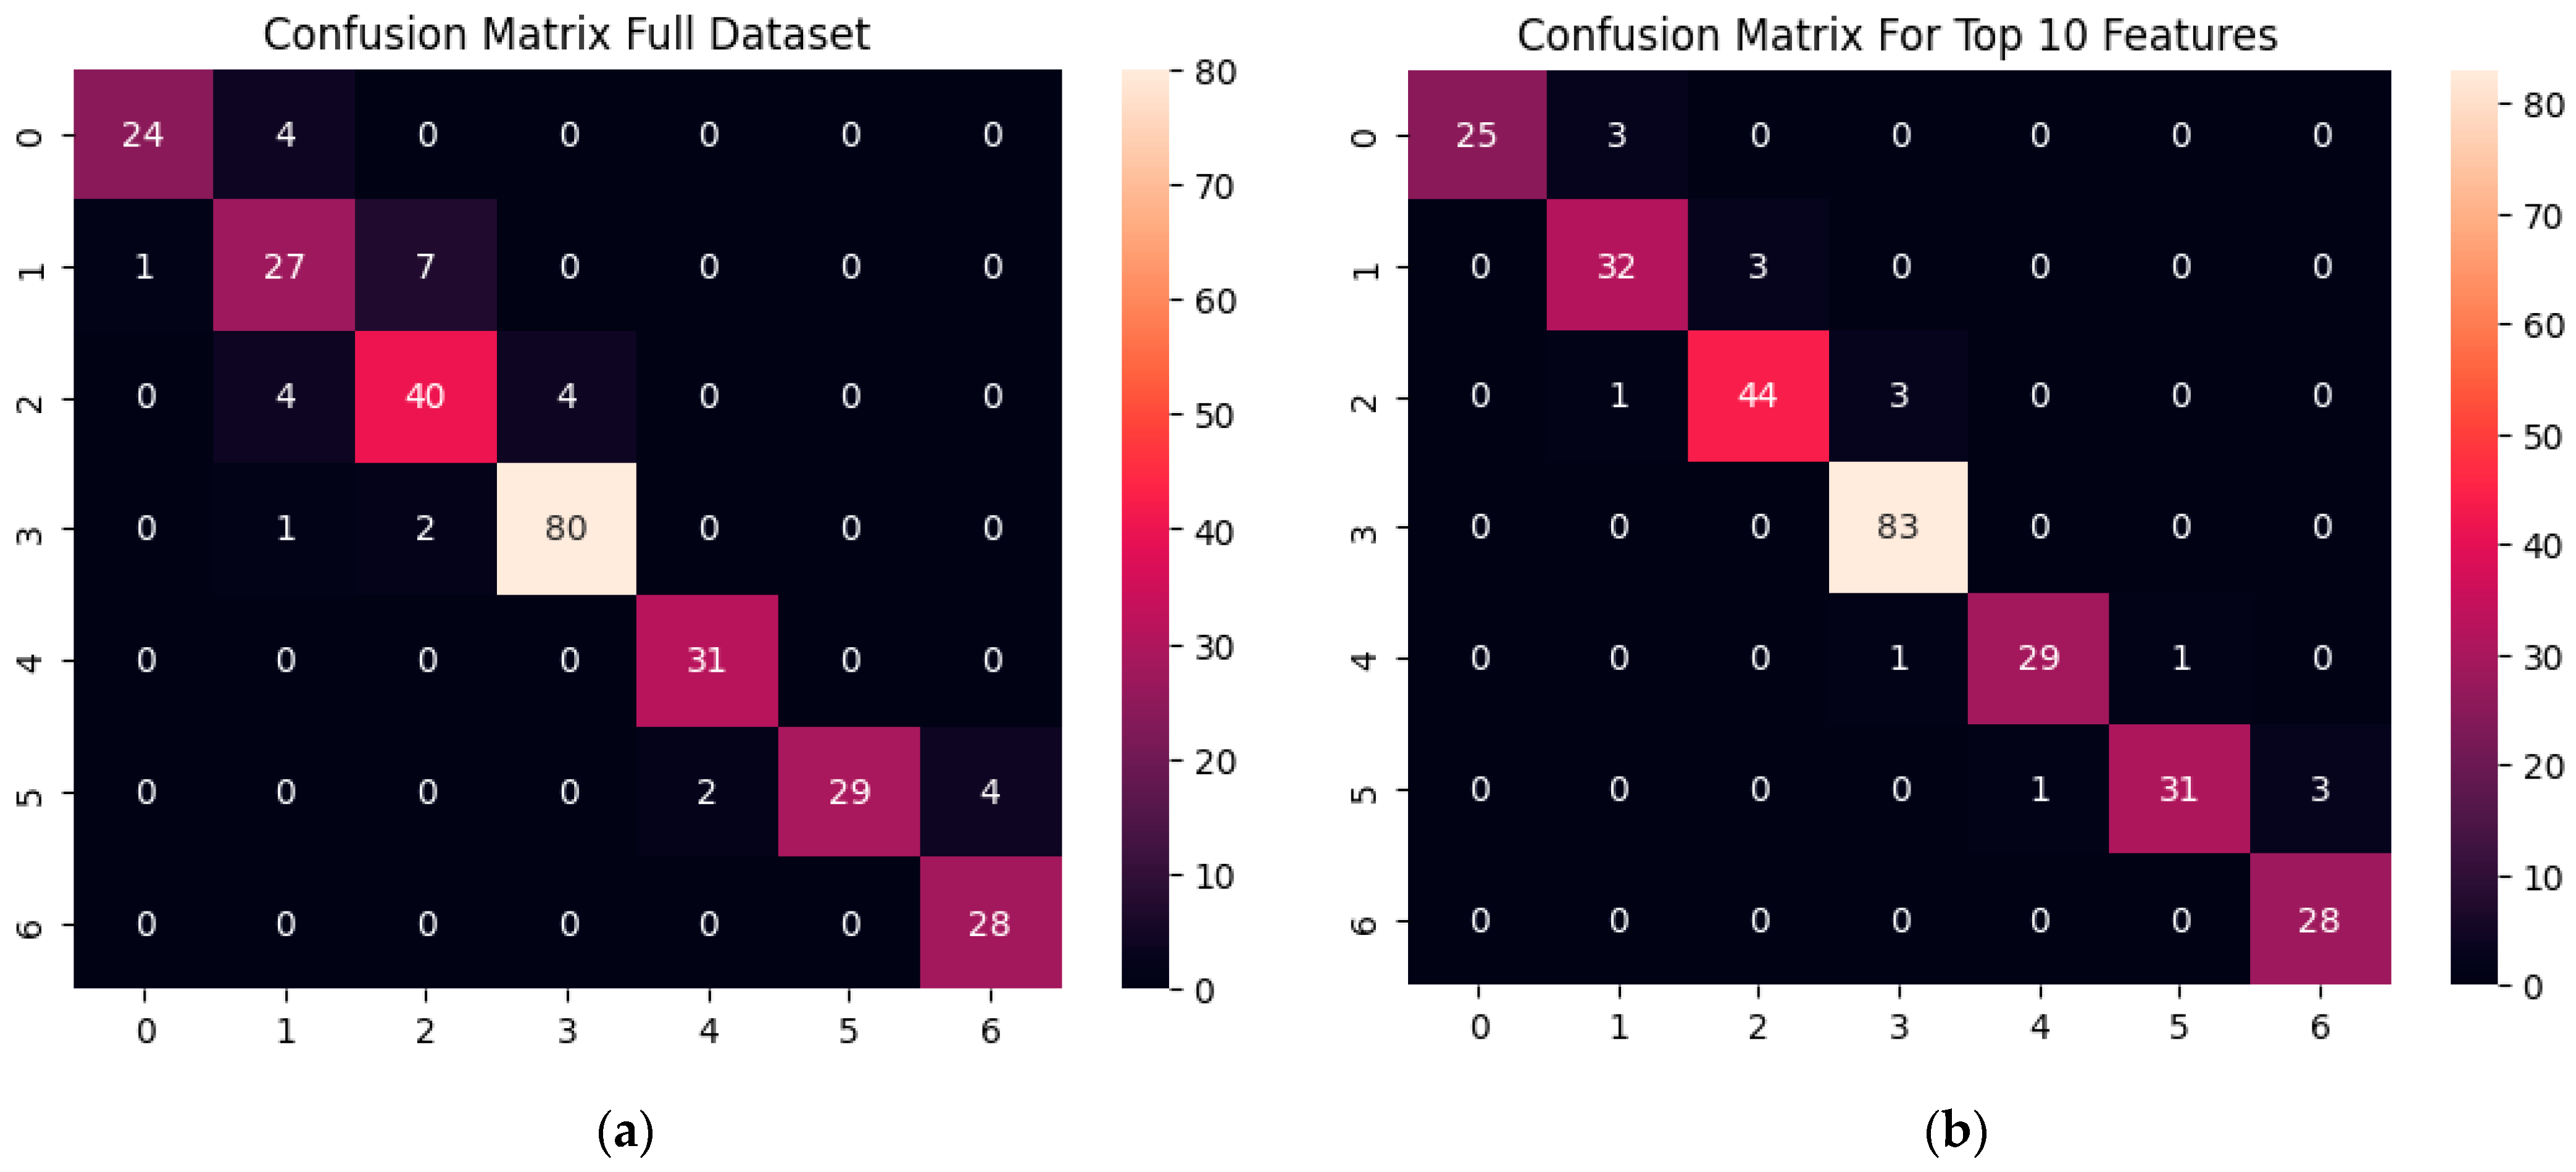
Since Random Forest (RF) demonstrated strong predictive accuracy and benefited from using a reduced feature set, its classification performance is further examined using its confusion matrices. The confusion matrix for the RF model, in
Figure 7, trained on the full dataset shows that 259 out of 288 test samples (89.9%) were correctly classified. The 29 misclassifications were predominantly between adjacent comfort levels, though a few instances occurred across two levels (for example, some ‘neutral’ samples were predicted as ‘cool’). In comparison, when the RF model was trained using only the top 5 features, its overall accuracy improved to 94.4% (272 out of 288 samples correctly classified). Notably, with this top-5 feature model, all 16 misclassifications occurred strictly between neighboring comfort levels (e.g., three samples of the ‘−3’ coldest state were classified as ‘−2’). This focused model also reduced misclassifications at the extreme ‘cold’ comfort level.
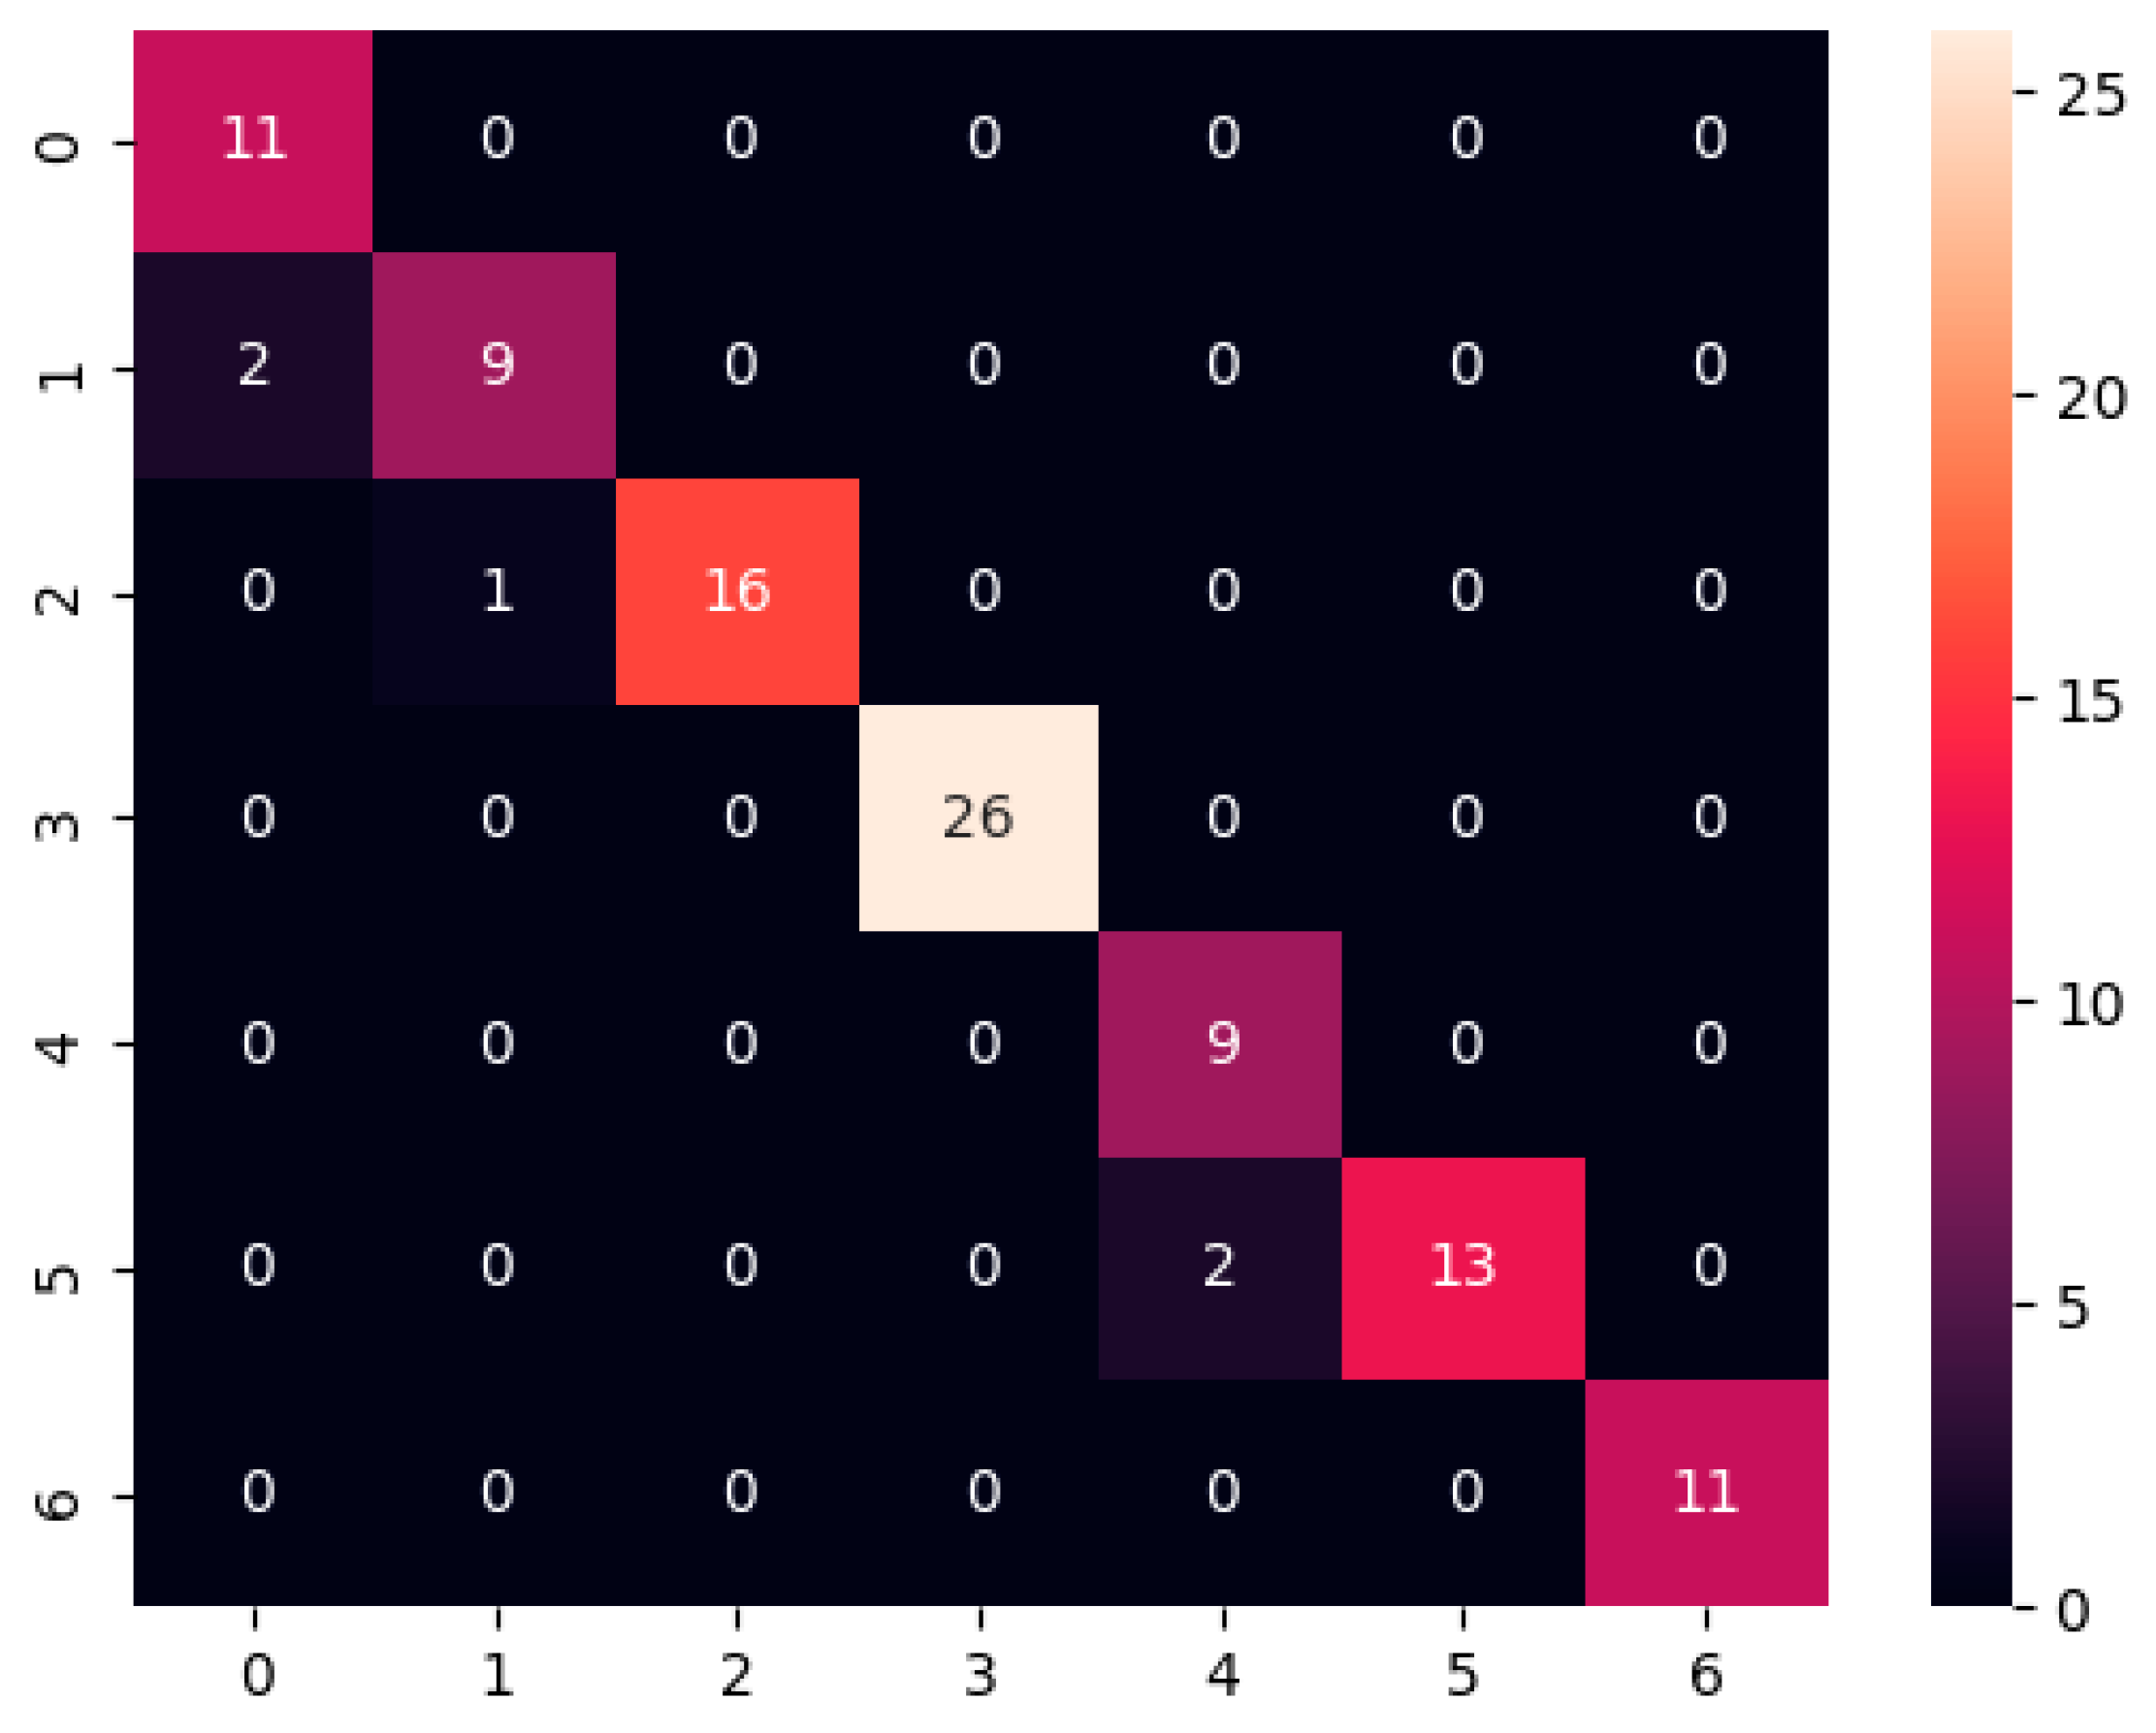
Given its superior performance, the Random Forest (RF) model trained with the top five SHAP ranked features which achieved 94% accuracy on the initial test set with this reduced feature configuration was selected for a final, rigorous validation. This test was conducted using a dedicated 100-sample hold-out dataset. These samples were randomly segregated from the total dataset at the project’s outset and remained entirely untouched during all model training, hyperparameter tuning, and initial evaluation stages, ensuring they constituted genuinely unseen data.
The final validation yielded highly encouraging results (see
Table 8 and
Figure 8), with an overall accuracy of 95% and a macro F1-score of 0.939. The model perfectly classified neutral (thermal sensation vote ‘0’) and hot (thermal sensation vote ‘+3’) thermal sensations, and the five misclassifications observed were exclusively between adjacent comfort levels.
This robust performance on entirely novel data is critical for an unbiased understanding of its real-world generalization, strongly affirming its potential for reliable occupant-centric thermal comfort prediction in practical scenarios.
4. Discussion
This study demonstrated that combining physiological, environmental, and subjective data can effectively model occupant-centric thermal comfort. Among the evaluated models, XGBoost showed the highest performance, with Random Forest and the artificial neural network (ANN) also achieving strong results. Notably, ensemble models improved in accuracy when trained on the top 5 most important SHAP-ranked features, whereas ANN performance declined under the same condition.
The ANN used in this study may have depended on relationships between less important individual features that were removed during dimensionality reduction. As a result, its sensitivity at the extreme comfort levels, particularly cold discomfort (−3), deteriorated. This suggests that deeper or differently configured networks may be required to preserve performance when feature sets are reduced.
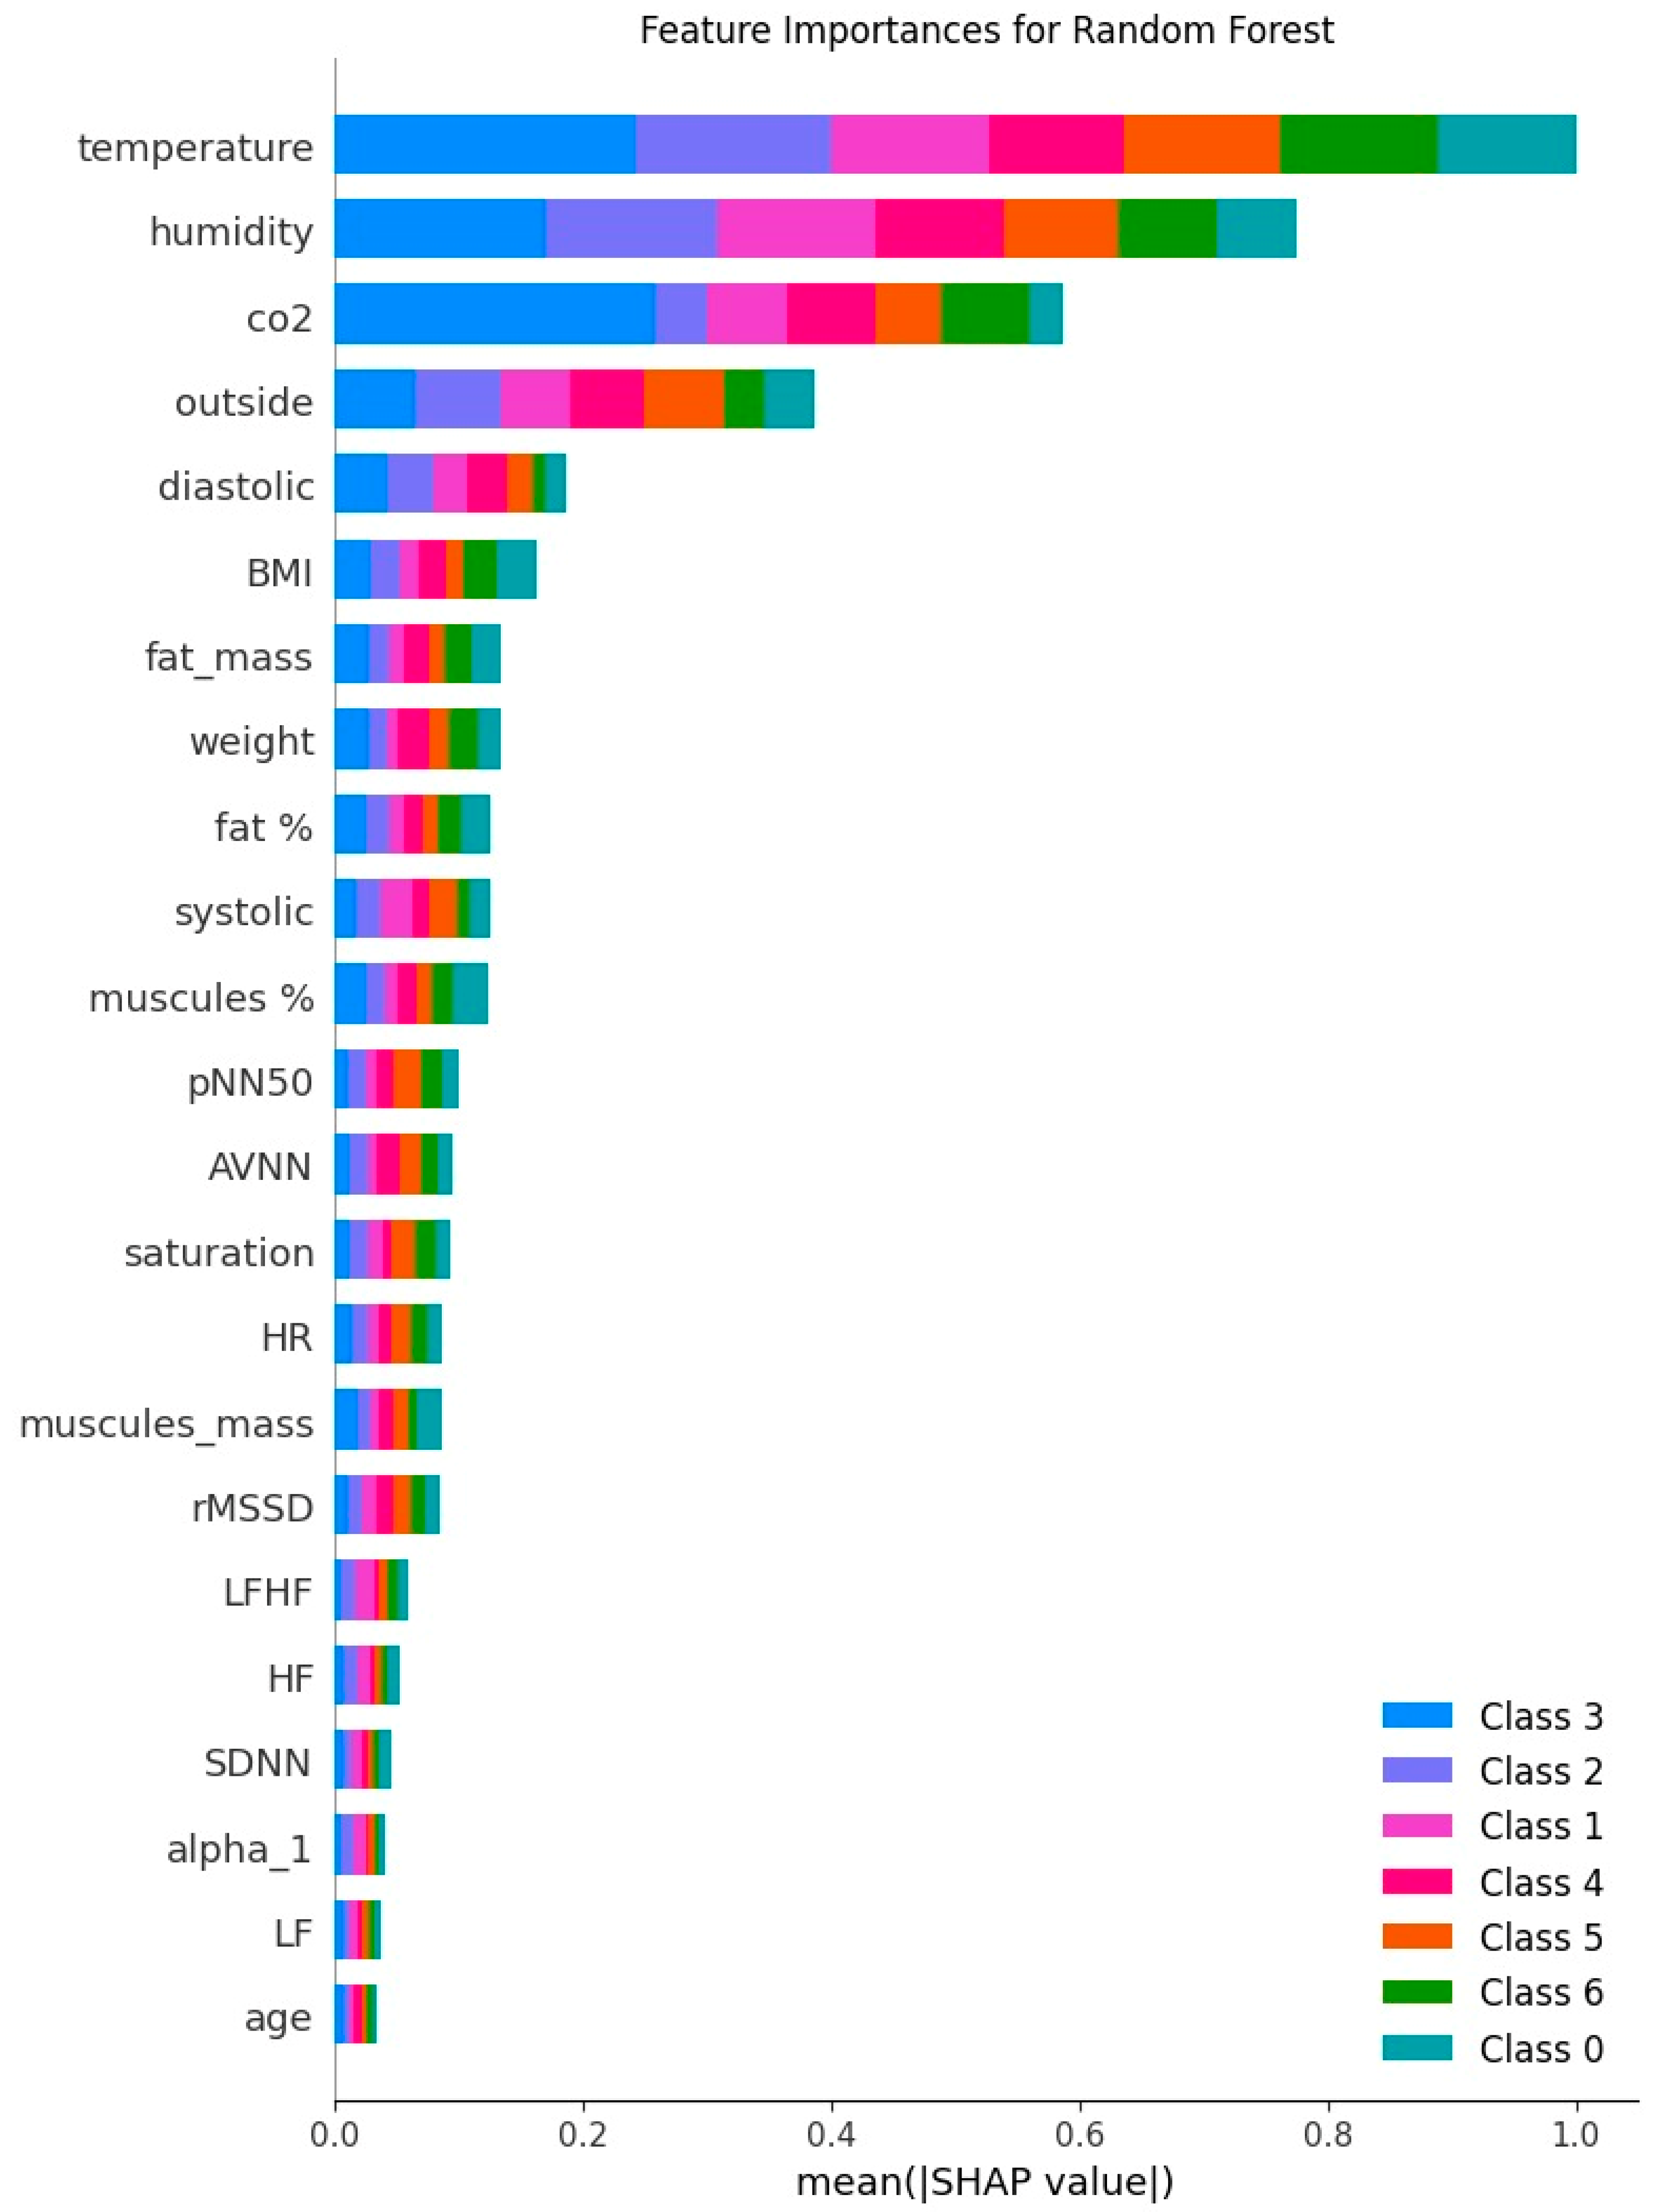
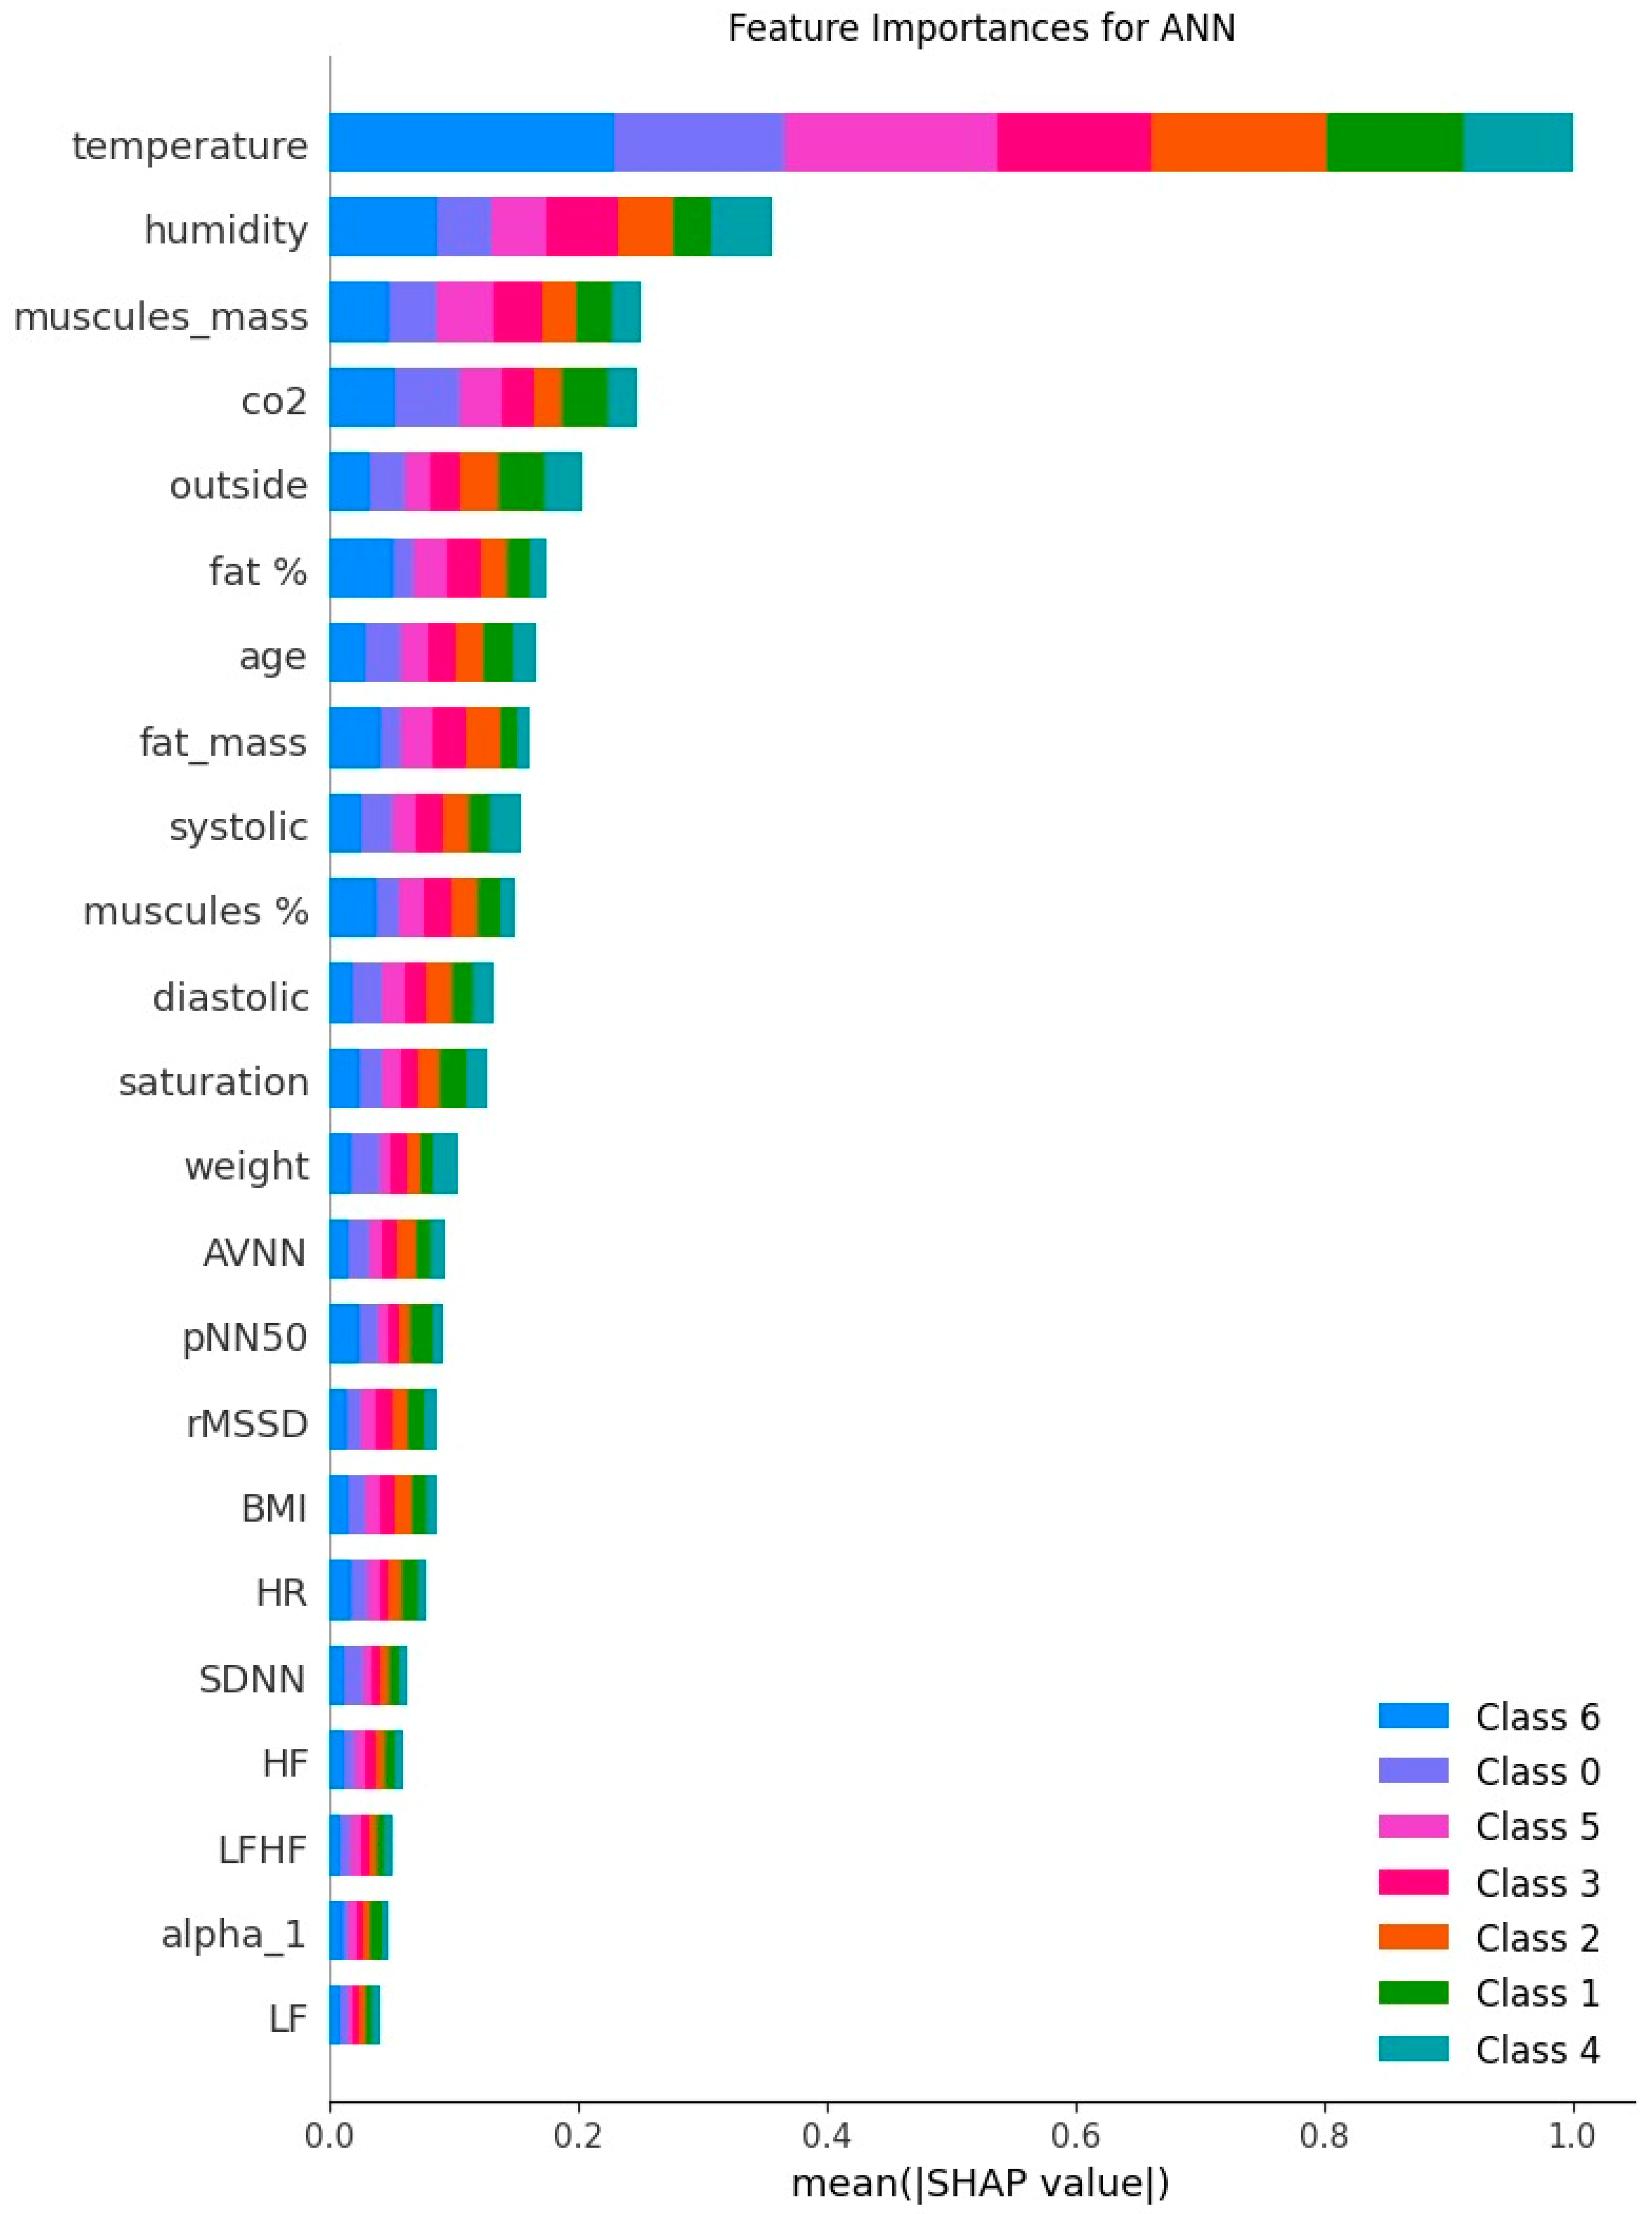
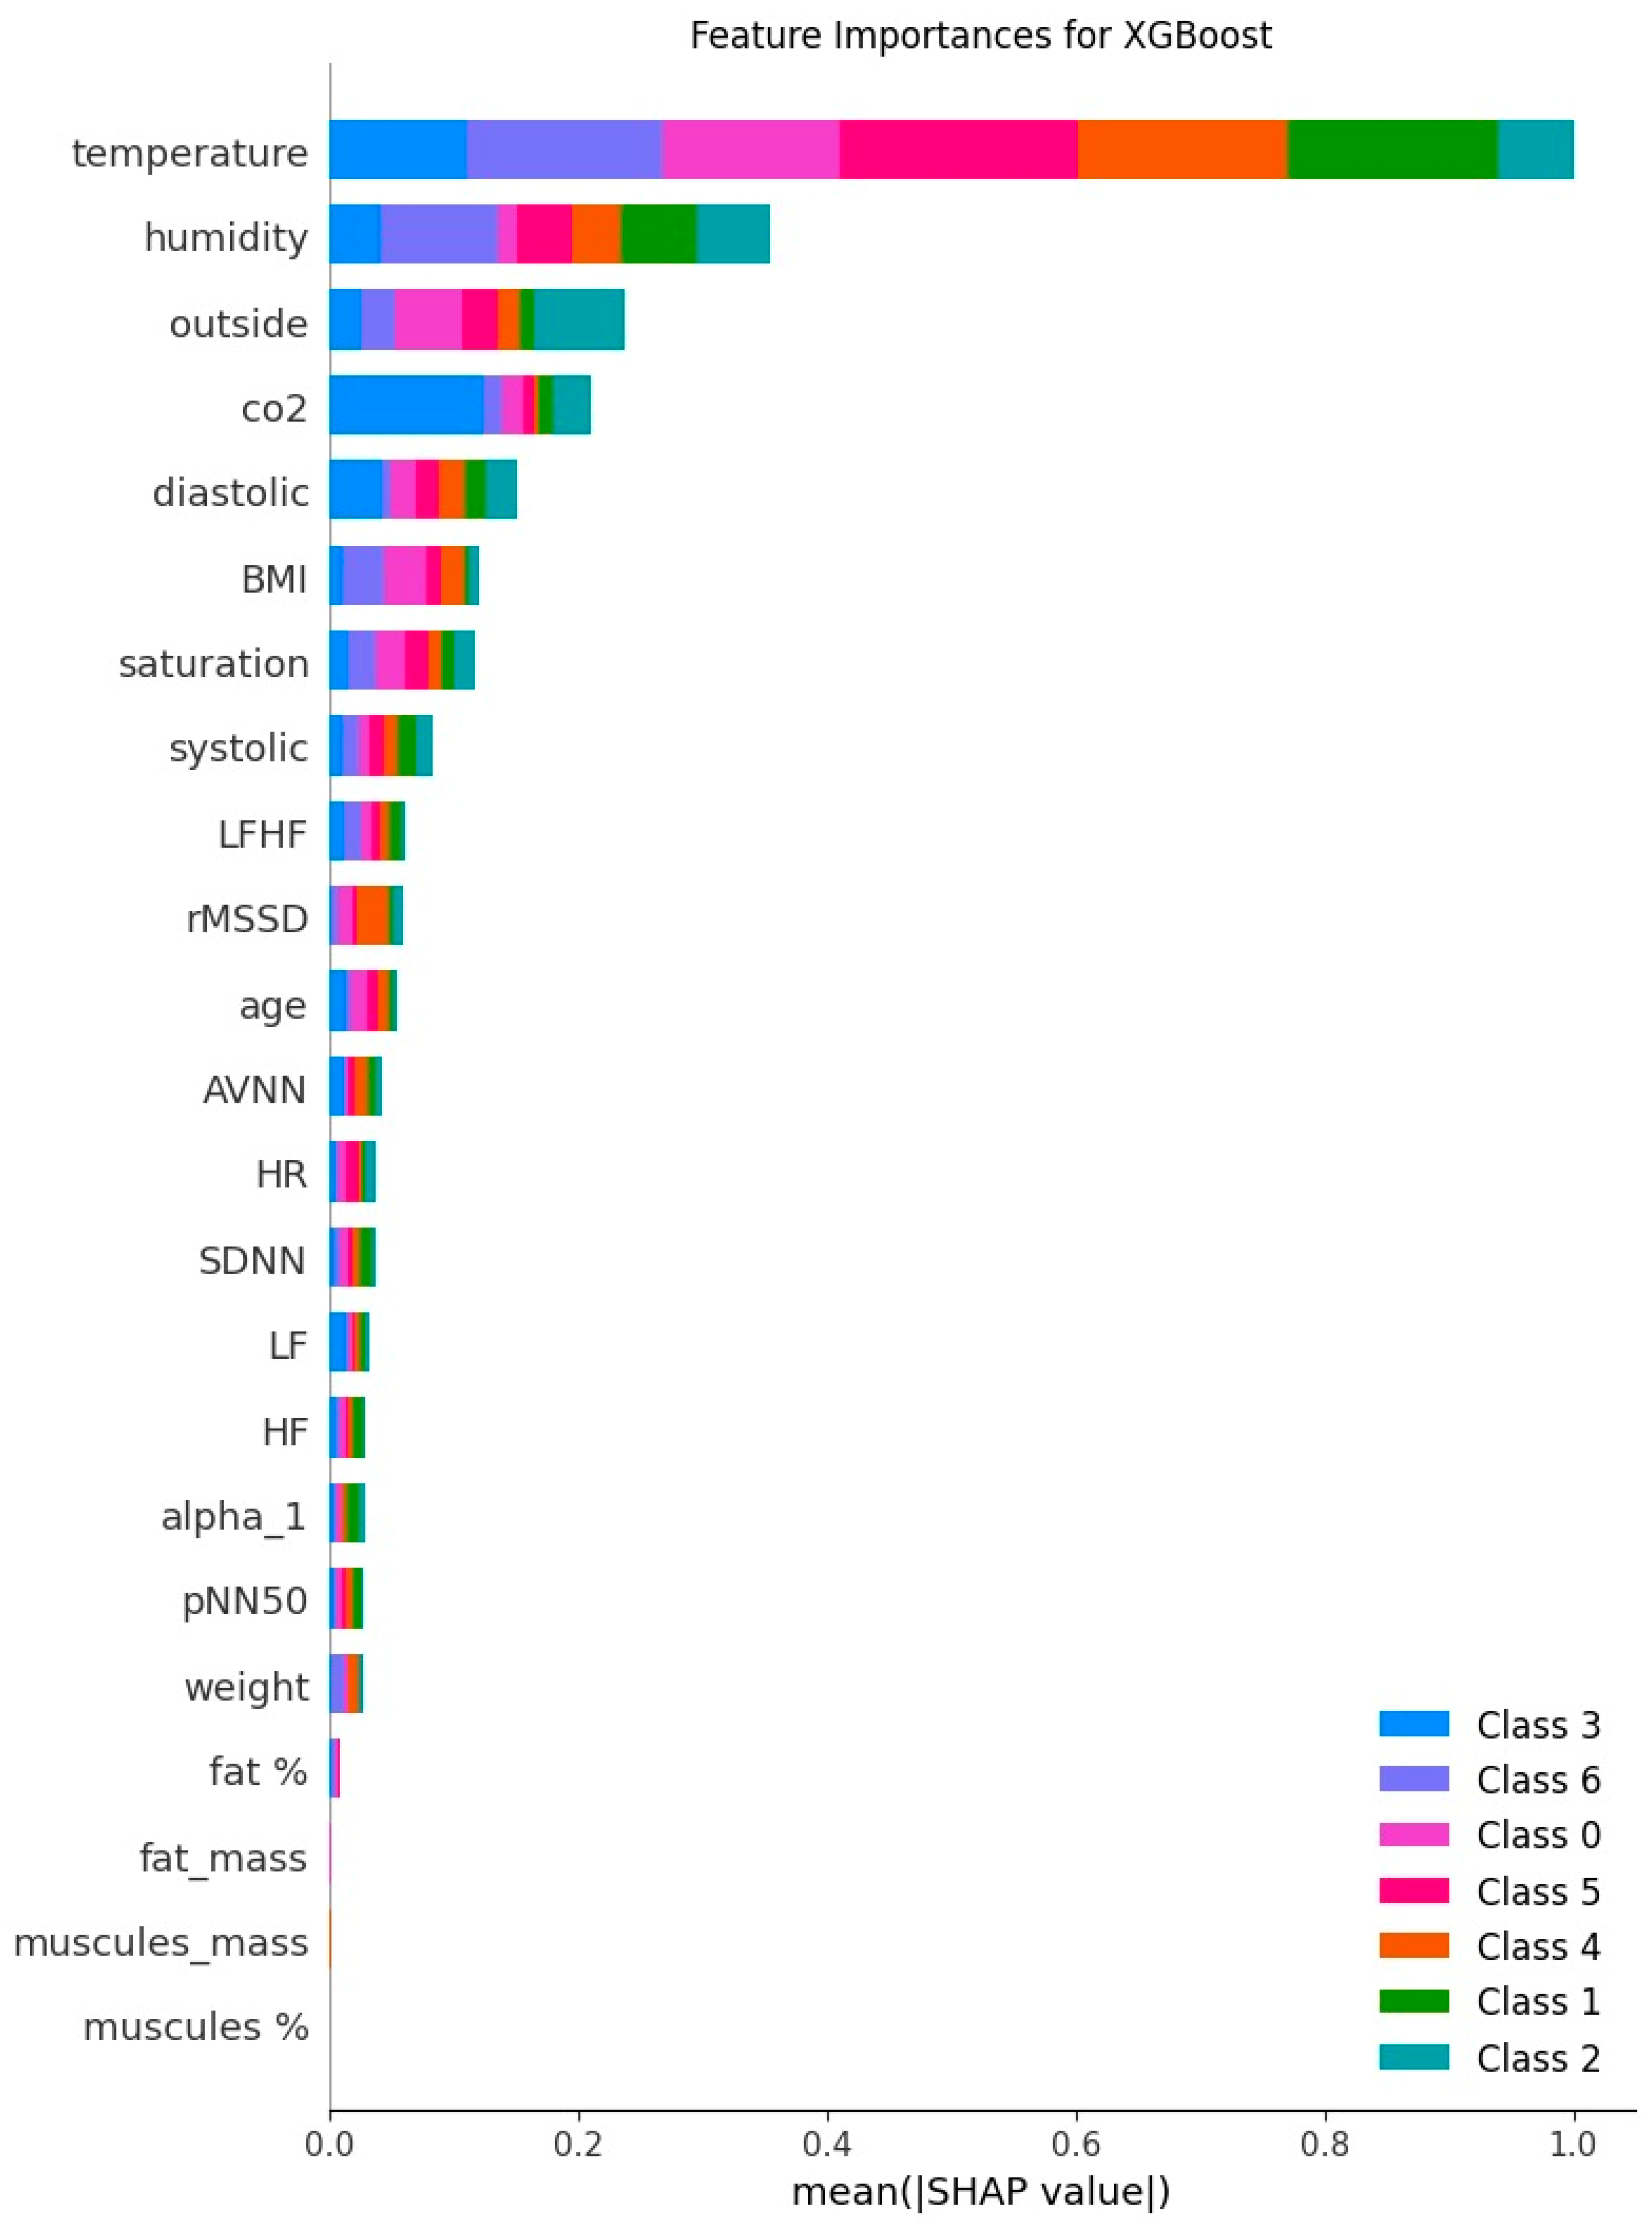
The SHAP analysis provided valuable insights into feature importance across different models (
Figure A1,
Figure A2 and
Figure A3). Five environmental features consistently appeared in the top 5 important predictors across all models: temperature, humidity, CO
2 concentration, outdoor temperature, and diastolic blood pressure. Indoor temperature emerged as the single most influential factor for all three classifiers, with approximately two to three times greater impact magnitude than the second-ranked feature. When examining the top five features, environmental parameters dominated the rankings (4 out of 5) for both Random Forest and XGBoost, while ANN uniquely incorporated muscle mass as a significant anthropometric predictor. Notably, HRV parameters despite being emphasized in prior thermal comfort studies showed relatively modest influence, with only rMSSD and LFHF appearing in XGBoost’s top 10 features. This finding supports our observation that when richer physiological and environmental data are available, the predictive importance of HRV becomes less central than previously assumed. The quantitative impact of feature reduction varied markedly between model types: ensemble methods improved (RF accuracy increased from 90% to 94%, XGBoost from 91% to 93%), while the neural network declined (from 89% to 83%), suggesting different dependencies on feature interactions. Our Random Forest model has achieved 95% accuracy, which is an improvement over the 90% accuracy obtained in the [
49] study.
The results of our study highlight the complex, multifactorial nature of thermal comfort and demonstrate that machine learning models are capable of effectively capturing the hierarchy of its influencing variables. The dominant role of air temperature in our models is expected and confirms their physical adequacy, as temperature is the primary driver of convective heat exchange between the body and the environment [
81].
The significant influence of humidity on thermal comfort, which our results highlight, requires a deeper explanation, especially in light of prior studies that often considered its effect on thermal sensation to be limited. The key to understanding this discrepancy lies in the fundamental physiological mechanism of human thermoregulation: evaporative cooling. The body primarily relies on the evaporation of sweat to dissipate excess heat. However, as the relative humidity of the air increases, its capacity to absorb additional moisture decreases, which severely impedes the evaporation process [
82]. This is precisely why humidity begins to dominate the sensation of discomfort once its level exceeds critical thresholds. Modern studies using high-resolution temporal data confirm this by identifying non-linear relationships and threshold effects where humidity becomes the primary driver of occupant discomfort [
46]. These findings are crucial as they show that thermal comfort is not merely a function of static temperature values but rather the result of the interaction between temperature, humidity, air movement, and individual adaptive responses. The acknowledgment of humidity’s strong influence challenges the traditional notion that climate control systems can rely solely on temperature regulation to achieve comfort. Instead, it becomes clear that integrated strategies controlling both temperature and humidity are vital for creating truly comfortable indoor environments. The adaptive nature of human thermal comfort, reflected in recent field studies and meta-analyses, underscores the importance of incorporating variability in both humidity and temperature into predictive models [
47]. This comprehensive perspective is now embodied in the latest generation of thermal comfort standards and modeling tools, which combine mechanistic physiological models with robust statistical methods to produce predictions that align more accurately with observed occupant responses [
45].
A more nuanced but important finding is the consistently moderate influence of CO
2 concentration. Our findings confirm that CO
2 acts not as a direct thermal parameter but as a key indicator of indoor air quality (IAQ), influencing comfort through psychophysiological responses to poor ventilation [
83]. The inclusion of physiological data, particularly blood pressure, marks an important step from purely environmental models to biometrically adaptive ones, as blood pressure serves as a reliable objective biomarker of the body’s response to thermal stress [
84]. The analysis of individual characteristics, such as BMI and muscle mass, confirms that a one-size-fits-all approach is insufficient, as BMI affects thermal sensation and preference [
85], while muscle mass determines metabolic heat production [
54]. Finally, the low performance of most HRV metrics is explained by the fact that they are complex indicators of the autonomic nervous system, not direct factors in heat exchange [
7], although they can be useful in specific conditions [
8].
Although SHAP analysis revealed that environmental variables have the largest global weight, this does not conflict with the concept of context-aware thermal comfort. “Occupant-centric” in our system refers to the subject-specific mapping between these environmental stimuli and each person’s subjective assessment. Since our pilot cohort was intentionally homogeneous, inter-individual physiological differences were muted; we expect that in larger and more diverse populations, the relative feature rankings will change. Moreover, data on heart rate variability (HRV) and blood pressure from wearable devices remain vital for real-time adaptation: they can signal thermal stress, allowing the HVAC controller to dynamically change a person’s comfort setpoint.
Importantly, although environmental features demonstrated the highest predictive power, the personalization aspect of the model lies in its capacity to capture individual variability in responses to identical environmental conditions, where different individuals may perceive the same environment as comfortable or uncomfortable based on their unique characteristics.
Another notable finding relates to the role of HRV parameters. Prior studies, such as [
43], have treated HRV as a central input for predicting thermal comfort, often in isolation. However, our SHAP analysis revealed that HRV features, while useful, were not the primary drivers of prediction accuracy when richer physiological and environmental data (blood oxygen saturation, blood pressure, air temperature, CO
2) were available. This finding calls for a more integrated approach to modeling comfort that accounts for multiple interacting systems rather than relying on a narrow physiological focus.
Despite efforts to control microclimate conditions precisely, limitations in the ventilation system occasionally allowed CO
2 concentrations to exceed the 1000 ppm threshold even in experiments labeled as “moderate” CO
2. Since previous research [
58] indicates that elevated CO
2 can negatively affect perceived comfort, this should be taken into account when interpreting thermal sensation ratings under these conditions.
Additional methodological limitations became apparent during data collection. Several participants who reported poor or insufficient sleep the previous night showed thermal sensations that deviated from expected comfort patterns under controlled conditions. This observation, while not formally quantified in our study protocol, aligns with established research on how physiological and psychological states can influence thermal perception [
86]. The potential impact of sleep quality represents an important confounding variable that was not controlled for in the current experimental design. Future studies would benefit from systematically tracking sleep parameters alongside comfort metrics to better account for this relationship.
The findings of this research should be interpreted within the context of its design as a pilot study. The use of a homogeneous group of young male volunteers was a deliberate methodological choice aimed at validating our complex sensor and data analysis framework in a controlled manner. While this was crucial for testing feasibility, it naturally means the results are not yet generalizable to a wider population. The success of this pilot study, however, strongly indicates the need for a future, full-scale investigation. Studies show women often exhibit distinct thermal dynamics—such as differing metabolic heat production and skin-temperature response [
87]. Moreover, frail elderly individuals exhibited heightened temperature sensitivity. It indicates that as frailty increases, the ability to tolerate thermal variations decreases [
88]. Both gender and age significantly predict thermal comfort [
89]. Missing these cohorts likely distorts feature importance and biases model performance. Additionally, the use of cubic spline interpolation for rarely measured parameters—such as blood pressure values recorded only a few times during a 36-min session—may introduce artifacts and relies on the assumption of smooth physiological variation [
90], which may not reflect real-world dynamics. This introduces further uncertainty into model interpretation and limits robustness.
Future research should address these and other limitations by expanding the participant pool to include more diverse age and gender groups, systematically tracking sleep parameters alongside comfort metrics, and incorporating continuous real-world data collection. A key future direction is the integration of this model into a broader AI platform under the concept of “Artificial Intelligence in Smart Buildings for Occupant Comfort.” This would enable building automation systems, including IoT devices and HVAC controls, to dynamically adapt to occupants based on comfort predictions, thereby improving both well-being and energy efficiency in indoor environments.
5. Conclusions
This pilot study successfully demonstrated the feasibility and effectiveness of a comprehensive approach to thermal comfort prediction by integrating environmental, physiological, and anthropometric data. The key outcome was the validation of a methodology capable of achieving high predictive accuracy within a controlled demographic, yielding several important insights for future work. Initially, on the full feature set, both Random Forest and XGBoost performed strongly, with XGBoost showing a slight edge with 91% accuracy. A critical finding emerged after dimensionality reduction: retraining on the top 5 SHAP-ranked features significantly improved the performance of the ensemble models. This step increased Random Forest’s accuracy to 94% and XGBoost’s to 93%, establishing Random Forest as the superior model. To rigorously validate this outcome, the optimized Random Forest model was tested on a dedicated hold-out dataset, where it confirmed its robustness by achieving a final accuracy of 95%.
Environmental parameters, particularly indoor temperature, humidity, and CO2 concentration, emerged as the dominant predictors across all models, with physiological parameters like diastolic blood pressure also showing significant influence. The dominance of these environmental factors is a key finding in itself, confirming that for a demographically homogeneous population, context-aware adjustments are the primary drivers of comfort. This demonstrates that our methodology correctly identifies the most significant sources of variance within a given dataset. The dominance of temperature, humidity, and CO2 at the cohort level therefore reflects sample homogeneity rather than a limitation of the personalized paradigm. Future deployments will exploit the continuous physiological feedback from smartwatches to fine-tune individual comfort ranges, closing the loop between easily measurable environmental variables and the occupant’s moment-to-moment physiological state.
Contrary to previous research that emphasized HRV as a primary predictor of thermal comfort, our SHAP analysis revealed that when a richer array of physiological and environmental measurements is available, HRV parameters contribute relatively less to prediction accuracy. This finding suggests that thermal comfort assessment frameworks should adopt a more holistic approach rather than relying predominantly on a single physiological system.
The demonstrated ability to reduce input dimensionality while maintaining or even improving model performance for ensemble methods offers practical benefits for real-world thermal comfort prediction systems, potentially enabling more efficient implementations with fewer required sensors. The robust performance achieved in this pilot study warrants a subsequent, large-scale investigation with a diverse population, providing a clear path toward developing effective, occupant-centric, and adaptive HVAC control systems. Such systems, built on an understanding of core environmental drivers, represent the foundational layer required to achieve true personalization in more diverse settings while optimizing energy usage.


 ,
, 
