Article

Localized Compression Behavior of GFRP Grid Web–Concrete Composite Beams: Experimental, Numerical, and Analytical Studies

1
State Key Laboratory of Mountain Bridge and Tunnel Engineering, Chongqing Jiaotong University, Chongqing 400074, China
2
School of Civil Engineering, Chongqing Jiaotong University, Chongqing 400074, China
3
CSSC Science Technology Co., Ltd., Shanghai 200023, China
4
CSSC Haizhuang Windpower Co., Ltd., Chongqing 401123, China
*
Author to whom correspondence should be addressed.
Buildings 2025, 15(15), 2693; https://doi.org/10.3390/buildings15152693
Submission received: 25 June 2025 / Revised: 18 July 2025 / Accepted: 29 July 2025 / Published: 30 July 2025

Abstract

Glass fiber-reinforced polymer (GFRP) composites exhibit significant advantages over conventional structural webbing materials, including lightweight and corrosion resistance. This study investigates the localized compression performance of the proposed GFRP grid web–concrete composite beam through experimental and numerical analyses. Three specimen groups with variable shear-span ratios (λ = 1.43, 1.77) and local stiffener specimens were designed to assess their localized compressive behavior. Experimental results reveal that a 19.2% reduction in shear-span ratio enhances ultimate load capacity by 22.93% and improves stiffness by 66.85%, with additional performance gains of 77.53% in strength and 94.29% in stiffness achieved through local stiffener implementation. In addition, finite element (FE) analysis demonstrated a strong correlation with experimental results, showing less than 5% deviation in ultimate load predictions while accurately predicting stress distributions and failure modes. FE parametric analysis showed that increasing the grid thickness and decreasing the grid spacing within a reasonable range can considerably enhance the localized compression performance. The proposed analytical model, based on Winkler elastic foundation theory, predicts ultimate compression capacities within 10% of both the experimental and numerical results. However, the GFRP grid strength adjustment factor βg should be further refined through additional experiments and numerical analyses to improve reliability.

1. Introduction

Glass fiber-reinforced polymer (GFRP) is fabricated by integrating glass fiber with matrix in specified ratio, followed by manufacturing processes such as pultrusion and extrusion [1]. Owing to its lightweight, high strength, corrosion resistance, and design flexibility [2,3,4,5], GFRP has been extensively applied in the design and construction of new structures [6,7,8,9]. However, the application of GFRP is constrained by its relatively low elastic modulus, which induces excessive deformation and buckling under service loads [10]. To address this challenge, GFRP is often used in combination with other materials to form composite beams [11]. Such GFRP composite beams exhibit multiple advantages, including lightweight, corrosion resistance, and low long-term maintenance costs [12,13,14,15,16,17].
The feasibility of GFRP–concrete composite beams has been confirmed, and yet their wide application remains limited due to several factors. Madenci et al. [18] revealed that the weak interlaminar shear strength of GFRP stems from the matrix-dominated properties perpendicular to fiber orientation. The shear resistance of GFRP–concrete composite beams is critically constrained by this low interlaminar shear strength, resulting in a negative impact on structural effectiveness and material utilization. Iskander et al. [19] found that GFRP profiles in composite beams often fail due to interlaminar shear at the corners under high shear force, despite reliable GFRP–concrete connections. To prevent interlaminar shear failure at the corners of GFRP composite beam, optimal connector design is critical [20].
Nevertheless, the connection of GFRP to concrete is complicated by its anisotropy, which requires complex design solutions in engineering practice. GFRP composite structures rely on these primary connection systems: chemical bonding, mechanical connections, and hybrid connections [21]. Chemical bonding commonly employs epoxy adhesion, which can effectively achieve bonding between GFRP and concrete through simple construction processes. However, bonding quality is influenced by the quality of construction and fluctuations in environmental temperature [22]. Mechanical connections typically involve steel bolts [23], FRP ribs [24], and shear keys [25]. But the inherent limitations of these connection methods, such as low shear stiffness and stress concentration at joints, have constrained the advancement of GFRP composite structural systems. Hybrid connection methods integrate mechanical connections with chemical bonding. Csillag et al. [26] found that the shear stiffness of interfacial bonding could be improved through the injection of epoxy adhesion into bolt holes. Kong et al. [27] devised a composite interface integrating GFRP tubing with epoxy adhesion, subjecting its shear response to systematic experimental and computational characterization. Even though hybrid connections can address the limitations in mechanical performance of the two connection methods, their implementation is still hindered by sophisticated construction processes.
Zou et al. [28] proposed an innovative GFRP grid web–concrete composite beam, which ensures a reliable connection between GFRP and concrete through a straightforward construction method. This design not only enhances the utilization efficiency of GFRP materials, but also significantly improves the stiffness and ductility of the composite beam. Taking advantage of the lightweight and corrosion-resistant properties of GFRPs, this novel structural system demonstrates significant potential for practical applications in specific engineering scenarios such as coastal, marine, and lightweight prefabricated bridges. The advantages of FRP grid–concrete composite structures have also been emphasized in other studies. Zeng et al. [29], in their investigation of FRP grid-reinforced ultra-high-performance concrete (UHPC) composite plates, reported that FRP grids significantly enhance the flexural capacity of the composite system. Their results also demonstrate a strong interfacial bond between the FRP grids and the UHPC matrix, underscoring the structural benefits of FRP-based reinforcement systems. Similarly, Wu et al. [8] examined GFRP grid–UHPC composite plates without steel reinforcement and found that reducing the centroid height of the grid substantially improved both strength and stiffness, with up to a 32.5% increase in ultimate capacity. Their study further confirmed reliable bonding between the GFRP grid and concrete without the need for additional connectors.
As a vertical component connecting the upper and lower flanges, the web is primarily subjected to shear forces and partial bending moments. The web undergoes concentrated stresses induced by localized compression, potentially leading to local buckling when critical limits are exceeded. Li et al. [30] found that the failure of web beams under concentrated loads primarily stems from local buckling of the web, with the underlying mechanisms influenced by factors such as the type of web and geometric parameters. Jáger et al. [31] identified three buckling modes in corrugated web beams and introduced a simplified design approach using effective width, adjusting the flange buckling coefficient to reflect the effects of the web geometry. The rational design of the web is critical under localized compression. Recommendations are provided by existing codes for improving web compressive performance. ACI 318 [32] specifies that local stiffeners can improve the compressive performance of webs and reduce the risk of buckling.
Experimental and numerical studies [28,33] have already confirmed the feasibility and bending performance of this composite beam, demonstrating its potential for practical applications. However, the mechanical behavior of localized compression is still uncertain. GFRP grid webs exhibit lower stiffness compared to conventional structural webbing components. This characteristic makes the load transfer mechanism of GFRP grid webs different under localized compression. The localized compression performance of GFRP grid web–concrete composite beams has become a critical concern. This study aims to deepen the understanding of such behavior by investigating the failure modes, stress transfer characteristics, and overall compressive response of the composite system. To this end, a comprehensive analysis framework is established, combining targeted experiments with validated numerical simulations to quantify the influence of key parameters such as shear-span ratio and local stiffeners. Based on the findings, a theoretical method is further proposed to predict the ultimate localized compression capacity of the composite beams, providing a foundation for improved designs and applications of this novel structural form.

2. Experimental Program

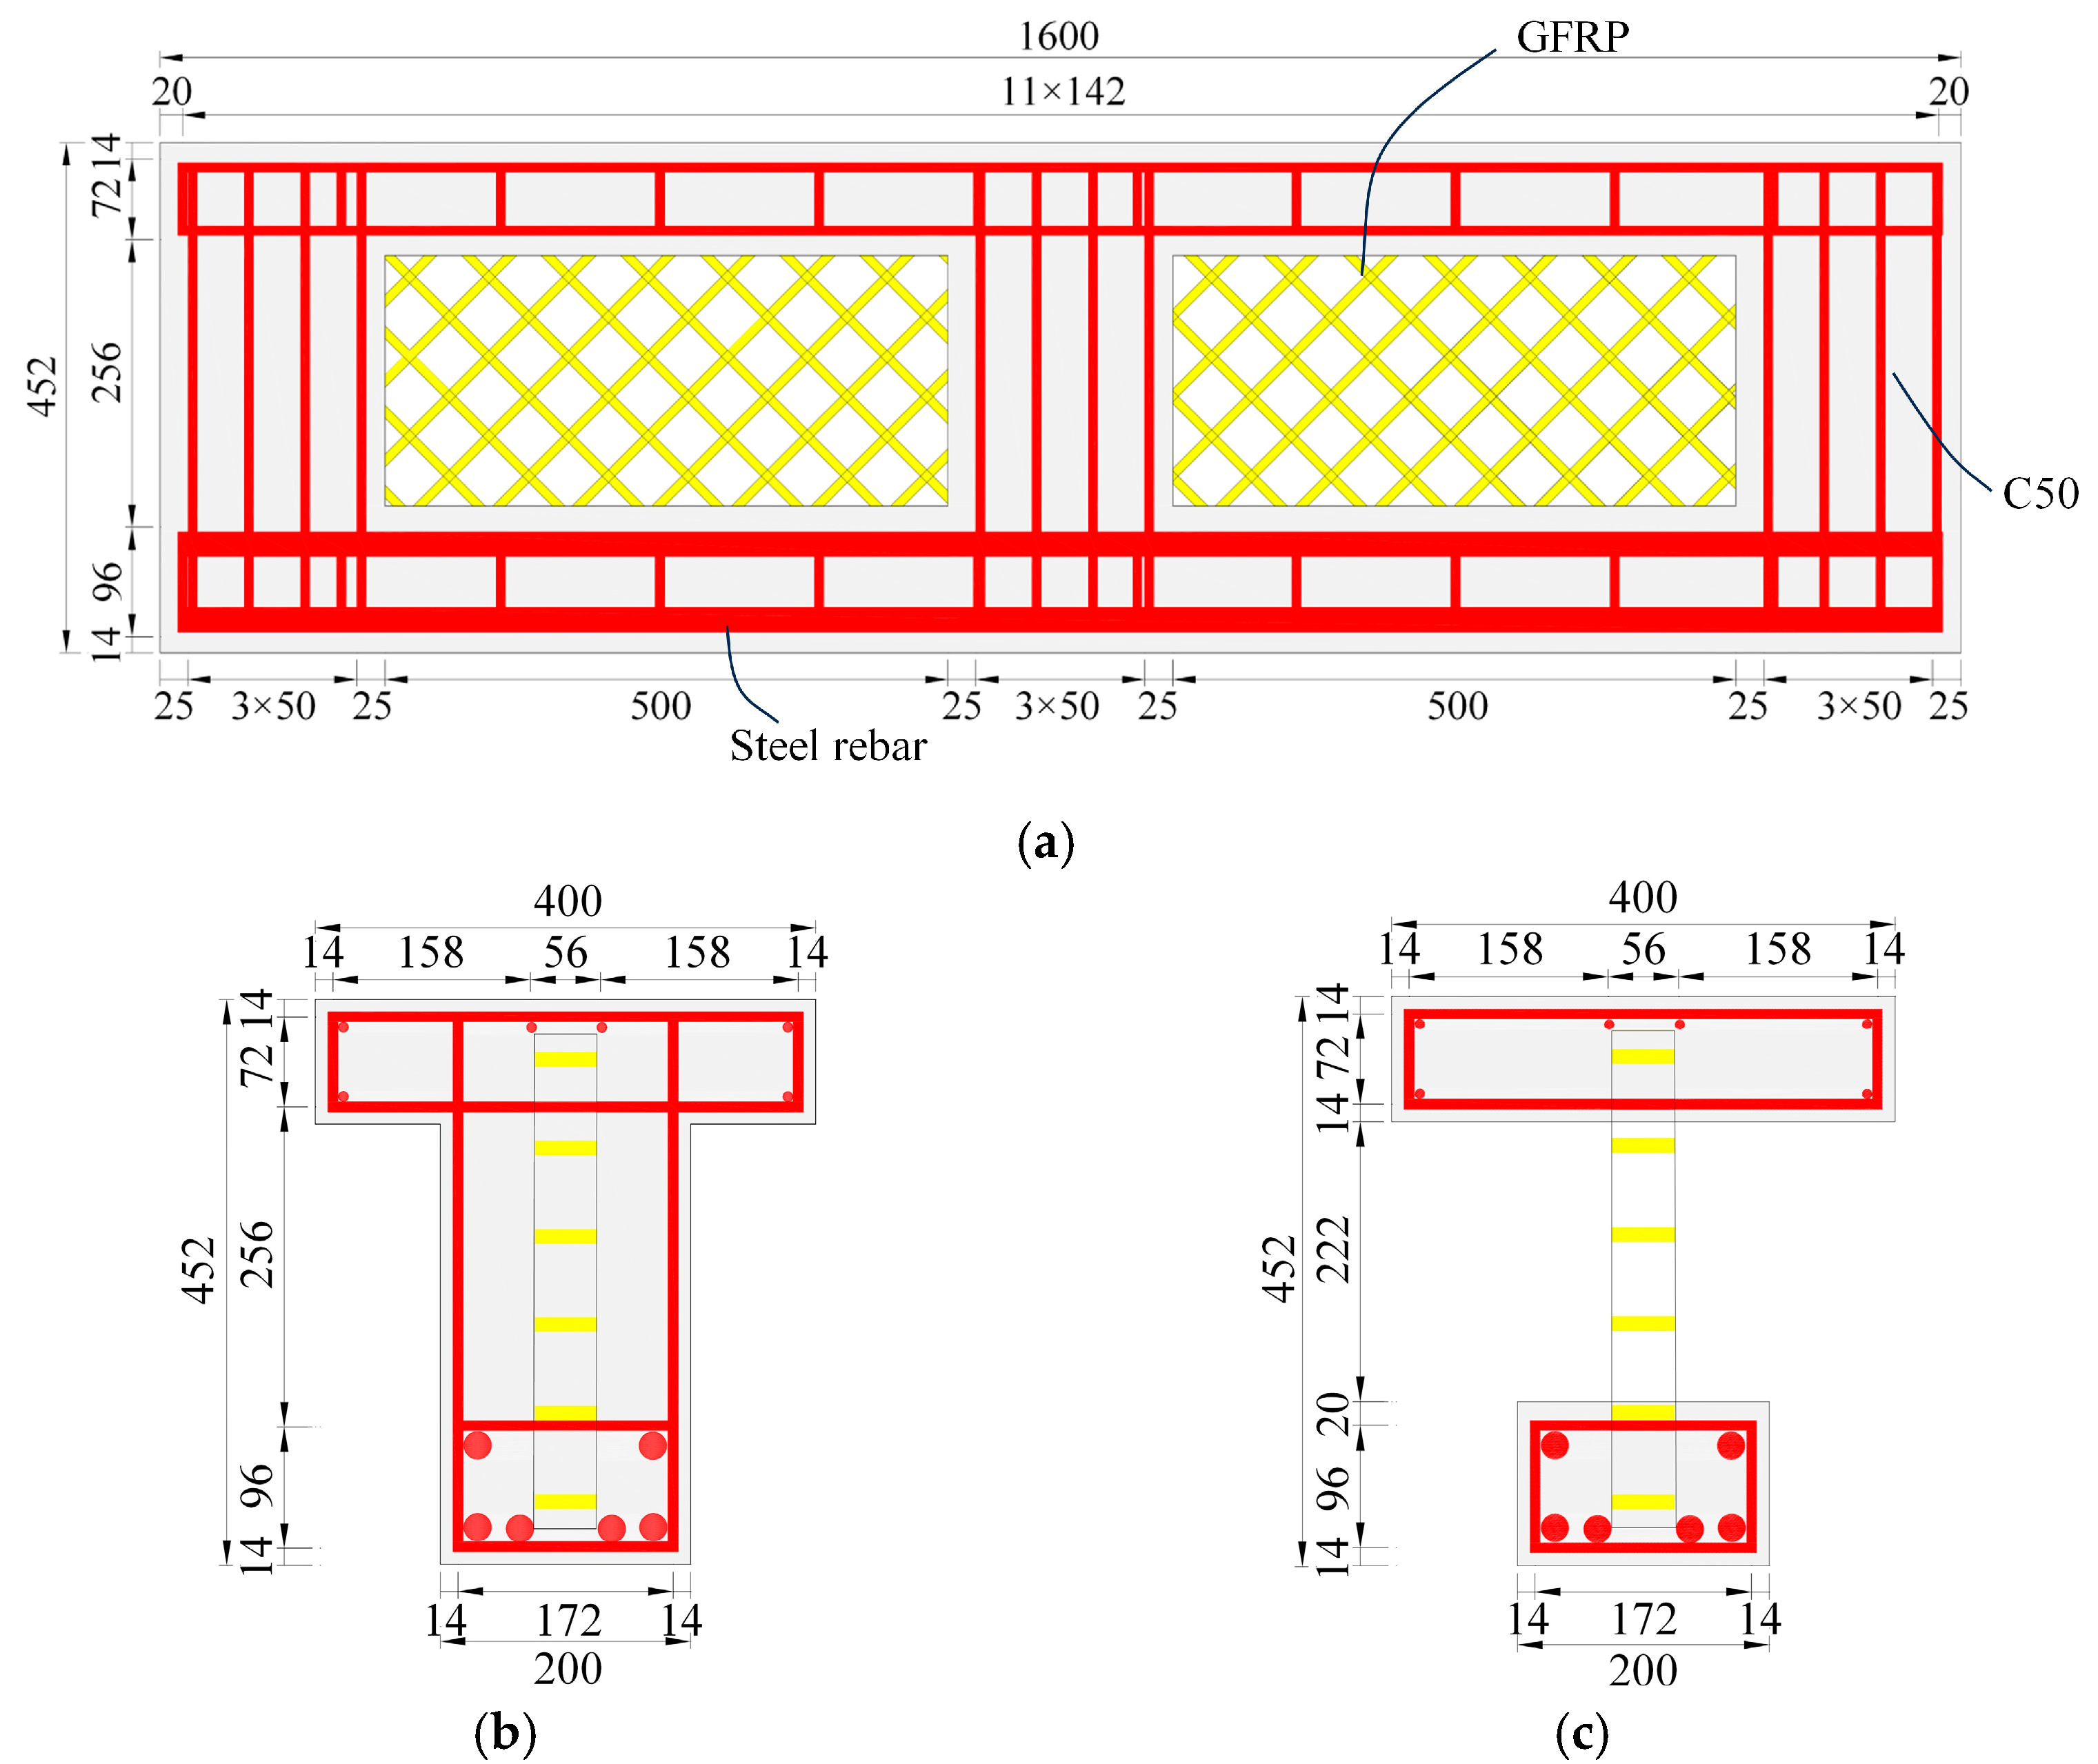
2.1. Specimen Features and Preparation

The experimental program comprised three specimens (C-1, C-2, and C-3). As shown in Figure 1, all experimental specimens used identical GFRP grid units with dimensions A = B = H = 50 mm and thicknesses t1 = 5 mm, t2 = 7 mm. The dimensions and reinforcement of the specimens are shown in Figure 2 and Figure 3. Specimens C-1 and C-2 measured 2300 mm in length, while C-3 was 1600 mm, all with heights of 452 mm. The lower flanges of the specimens were reinforced with longitudinal bars of 12 mm (C-1, C-2) and 22 mm (C-3) in diameter, and the upper flanges were reinforced with bars 8 mm in diameter.
The fabrication process of specimens, as shown in Figure 4, involved the following steps: (a) cutting GFRP grid plates; (b) steel skeleton binding; and (c) concrete pouring. The upper flange concrete is poured first, followed by the lower flange and vertical ribs after the upper-flange concrete is initially formed and inverted.

2.2. Materials

The specimens employed C50 concrete with mix proportions in accordance with GB/T 50448-2015 [34]. Compressive strength and elastic modulus tests were conducted following GB/T 50081-2019 [35] to determine the mechanical properties of the concrete. In addition, all specimens were cast and cured under the same conditions as the beam specimens. HRB400 steel rebars were tested according to the Chinese standard GB/T 228.1-2010 [36]. The mechanical property tests are illustrated in Figure 5, with the results summarized in Table 1 (concrete and steel rebar) and Table 2 (GFRP properties provided by the manufacturer).

2.3. Test Setup and Instrumentation

Three-point loading tests were conducted on all specimens using a hydraulic jack installed under a reaction frame. A load cell was placed between the jack and the frame to record the applied load. The test specimen was simply supported on the hinged supports, and the test setup is shown in Figure 6. Before the formal loading phase, three preloading cycles at 0.2Pu (Pu is the ultimate carrying capacity) were applied to eliminate external influences. The load was initially applied at a rate of 5 kN/s, and, after entering the plastic deformation phase, it was switched to displacement control in increments of 0.5 mm until failure. Loading parameters were designed to investigate the effects of the shear-span ratio and local stiffener on the local compression performance, and they are listed in Table 3. Dimensional variables included a (distance from loading point to nearest support), b (distance from support to beam end), and L (beam length). Deflection profiles during loading were monitored by five displacement meters (from W-1 to W-5), with their arrangements detailed in Figure 7a,b. Three cross-sectional strain groups (1#–3#) were measured across all specimens to capture the strain distributions of concrete and GFRP grids. The cross-section of the strain gauge layout is shown in Figure 7c.

3. Experimental Results and Discussion

3.1. Failure Mode

Table 4 summarizes the test results of composite beams. In the table, Su is the loading point deflection under ultimate capacity and Pu/Su is the secant stiffness corresponding to the ultimate capacity. Pel/Sel is the secant stiffness corresponding to elastic stage. In addition, energy absorption (J) quantifies the total energy dissipated before ultimate load, while the stiffness degradation rate (%) reflects the reduction in stiffness from the elastic stage to failure. Three specimens demonstrated three different failure modes: flexural failure, local collapse, and flexural-shear failure.
The failure modes of the three test beams are illustrated in Figure 8. As shown in Figure 8a, flexural failure dominated specimen C-1, evidenced by vertical cracking patterns in the lower flange and local concrete crushing in the upper flange adjacent to the loading zone. Yielding of the longitudinal reinforcements and stirrups in the upper flange was observed, as shown in Figure 9a. Notably, the GFRP grid web remained intact, with only minor cracks observed at the grid nodes (Figure 9b). This phenomenon could be attributed to the GFRP grid web primarily resisting shear forces and possessing low longitudinal stiffness. Consequently, the GFRP grid web is subjected to free compression under bending loads, contributing minimally to the flexural strength of the composite beams, and thus no significant damage was observed.
Specimen C-2 exhibited a localized collapse failure mode, as illustrated in Figure 8b. Extensive vertical cracks were observed in the lower flange concrete, while transverse cracks developed beneath the loading zone in the upper flange (Figure 9c). Localized compressive stresses were transferred downward from the loading point, resulting in compression failure in the lower GFRP grid web and partial node damage in the mid-region of the web (Figure 9d). Ultimately, the concrete in the upper flange near the loading point crushed, leading to abrupt structural failure. Tests on specimens C-1 and C-2 revealed that reducing the shear-span ratio from 1.77 to 1.43 shifted the failure mode from flexural failure to localized collapse. The reduction in shear-span ratio diminished flexural moments and increased stress diffusion angles under applied loading, which amplified compressive stress concentration beneath the loading area. This stress concentration exacerbated local concrete compression while triggering load redistribution toward the GFRP grid web, thereby improving the compressive strength utilization efficiency of the GFRP grid web through optimized force transfer paths.
As shown in Figure 8c, the specimen C-3 exhibited a flexural-shear combined failure mode with differential damage progression in the concrete flange, GFRP grid web, and stiffener component. The lower flange of the composite beam had a significant number of vertical cracks, primarily attributed to the bending moment. Under high shear forces, the upper flange failed in diagonal shear, accompanied by localized compressive failure of the GFRP grids. With the addition of stiffener below the loading area, the failure mode transformed from localized collapse to flexural-shear combined failure. This transition was mainly attributed to the stiffener providing rigid support beneath the loading area, which redistributed the load transfer path and distributed the concentrated load to larger areas. At the same time, the structural integrity of both the upper and lower flanges was enhanced. Consequently, vertical cracks appeared in the moment-dominated lower flange, while shear failure developed in the high-shear-stressed upper flange.
All specimens maintained stable interfacial bonding between the GFRP grid web and concrete with no measurable slip and delamination, confirming effective composite action.

3.2. Load–Displacement Curve

Figure 10 presents the load–displacement curves of the three test beams. As shown in Figure 10, the load–displacement curves are categorized into three stages for discussion: (I) linear elastic phase, (II) post-cracking stiffening phase, and (III) failure phase.
Before concrete cracking, all specimens showed linear elastic behavior, with the deflection increasing linearly with the load. Specimen C-2 demonstrated a 26.1% higher elastic stiffness and a 28.2% increase in cracking load compared to C-1. This improvement was primarily caused by the decreased shear-span ratio, which changed the internal force distribution by reducing the bending moment, thus resulting in reducing bending deformation and delaying concrete cracking. Moreover, the significant strengthening effect of local stiffening was clearly demonstrated by the enhanced stiffness and deformation resistance of specimen C-3 compared to C-1 and C-2.
Subsequently, the slope of the load–displacement curve decreased significantly, and the test beam entered the post-cracking stiffening phase. After entering this phase, specimen C-1 demonstrated a plastic plateau in its load–displacement curve, indicating excellent plastic deformation capacity and resistance to brittle failure. In contrast, specimen C-2 exhibited some plastic deformation capability, but failed abruptly after reaching ultimate load, showing limited ductility. Specimen C-3 showed no distinct plastic plateau and experienced rapid load decline after reaching ultimate load, reflecting brittle failure behavior and lower ductility.
The Pu and Pu/Su of specimen C-2 increased by 22.9% and 67.4% compared to C-1, but ductility decreased by 26.3%. Reducing the shear-span ratio improved the load-bearing capacity of the beam, but concurrently decreased its deformation capacity. This highlights that, for a GFRP grid web–concrete composite beam with an identical cross-sectional design, local compression capacity surpasses flexural failure capacity. Furthermore, the installation of stiffener below the loading point significantly improved the load-bearing capacity of the beam. Specimen C-3 displayed a 77.5% increase in Pu and a 94.1% increase in Pu/Su compared to C-2. This result confirms that the local stiffener effectively improves the compressive resistance of localized compression zones, optimizes load transfer through stress redistribution, and eventually improves both the structural stiffness and the ultimate capacity.
Energy absorption was defined as the area under the load–deflection curve up to the ultimate load, representing the capacity of the structure to dissipate energy before failure. According to the results in Table 4, specimen C-3 showed the highest energy absorption, reaching 13,030.96 J, followed by C-1 with 11,337.58 J and C-2 with 9007.47 J. Although C-3 failed in a brittle manner, its high load-carrying capacity enabled the largest energy absorption before failure. The excellent energy absorption of specimen C-3 was mainly due to the significantly increased ultimate load resulting from the addition of local stiffeners, which compensated for its relatively low ductility. Although specimen C-3 failed in a brittle mode, its high load-carrying capacity enabled the largest energy absorption before failure. Specimen C-1 exhibited a plastic plateau, allowing for continuous energy dissipation through reinforcement yielding. In contrast, due to local collapse, specimen C-2 showed lower energy absorption before failure.
Regarding stiffness degradation, specimen C-1 experienced the greatest reduction of 79.6%, caused by concrete cracking and load transfer to the reinforcement after concrete damage. Specimen C-2 had a degradation rate of 70.48%, which resulted from cracking in the bottom flange prior to the failure of the GFRP grid web, leading to an early loss of stiffness. Specimen C-3 exhibited the lowest degradation rate of 41.31%. This was attributed to the addition of local stiffener, which increased the stiffness of the specimen. However, after reaching the peak load, the specimen failed suddenly in a brittle manner, without a gradual stiffness reduction stage.
In summary, both reducing the shear-span ratio and adding local stiffeners enhance the ultimate load capacity and stiffness of GFRP grid web–concrete composite beams. The local stiffener significantly improving compressive resistance, although it may also introduce brittle failure modes.
In the absence of local stiffener, the composite beam develops a displacement difference between the upper and lower flanges due to the compressive deformation of the GFRP grid web. Figure 11 shows the upper–lower flange relative displacement in specimens C-1 and C-2. Notably, under identical loading conditions, the relative displacement of specimen C-1 was significantly greater than that of C-2. This discrepancy arises because the flange of specimen C-2 mainly subjects to shear force and experience reduced bending moments, which leads to mitigated overall structural deformation and thereby reducing the accumulation of relative displacement. In contrast, specimen C-1 experiences significant elastoplastic deformation before reaching ultimate load, with the relative displacement between the upper and lower flanges continually increasing as the plastic hinge develops. The 34.9% larger relative displacement between the upper and lower flange of specimen C-2 compared to C-1 at ultimate load was primarily attributed to localized crushing failure of the GFRP grid web in C-2. This failure mechanism removed the constraint on the upper flange, resulting in an abrupt load drop and concurrent displacement increase immediately after reaching ultimate load.

3.3. Section Shear Force and Strain Analysis

The strain distribution and shear behavior of Sections 1#, 2#, and 3# of specimens C-1 and C-2 and Section 2# of C-3 were analyzed. Figure 12, Figure 13 and Figure 14 show the strain distribution and shear force under varying load conditions. Specifically, those on the left depict the shear force at the GFRP grid web nodes, while the figures on the right present the measured strain. In these figures, the horizontal axis represents both the shear force and strain, and the vertical axis indicates the locations of the measurement points. The shear force at the GFRP grid web nodes was calculated using the strain data from the adjacent grid elements, as described in Equation (1).
F s = A g ( E t ε t + E c ε c ) sin 45 °
where Fs is the shear force at the node; Et is the tensile modulus of the GFRP; εt is the tensile strain of the GFRP; Ec is the compressive modulus of the GFRP; εc is the compressive strain of the GFRP; and Ag is the cross-section area of GFRP rib.
As shown in Figure 12, Figure 13 and Figure 14, the shear distribution in the web decreased from the upper flange to the lower flange. The 3# section exhibited significantly higher strain values compared to the 2# section, indicating that grids closer to the loading points experienced higher shear forces. With the load increasing, the shear force in the GFRP grid web demonstrated a significant increase. This phenomenon originates from the progressive shear redistribution: while the upper flange of the composite beam initially resisted partial shear forces, its shear-bearing capacity substantially diminished after concrete cracking, resulting in predominant shear transfer to the web section. Moreover, the GFRP grid demonstrated markedly elevated strain levels relative to the concrete flanges, owing to its reduced cross-sectional area, which amplifies stress under identical loading conditions.
The reduction in shear-span ratio increased the shear force in the web of specimen C-2 compared to C-1. Compressive force was transferred from the upper flange to the lower flange under localized compression, with the compressive strain at the upper portion of the web exceeding that at other areas. Meanwhile, both the lower flange and the bottom of the upper flange experienced tensile stress. Additionally, the rate of compressive strain development in each section of specimen C-2 was more pronounced than in C-1, indicating that the GFRP grid web in specimen C-2 sustained a greater pressure.
The strain distribution in the grid nodes of specimen C-3 alternated between positive and negative values, indicating that the nodes were subjected to both tensile and compressive stresses. The upper and lower flanges experienced minimal strain values. As the load increased, the contrast between the tensile and compressive strains in the GFRP grids became more pronounced. Compressive strain increased more significantly compared to tensile strain after reaching 300 kN. This phenomenon was mainly attributed to the reduction in tensile strain caused by the development of microcracks in the GFRP grids.

4. Numerical Analysis

4.1. Finite Element Model

For specimen C-2, after a preliminary validation of the contact definitions and mesh size, finite element modeling of the GFRP grid web–concrete composite beam was conducted using ABAQUS v6.14. The details of the finite element model (FEM) are shown in Figure 15. Concrete was simulated using three-dimensional eight-node elements (C3D8R) with mesh sizes of 25 mm. The reinforcement bars were modeled using beam elements (B31; mesh size 30 mm). The reinforcement skeleton was embedded in the concrete beam, and the slip between them was ignored. Four-node shell elements (S4R) represented the GFRP grid web with a size of 20 mm. Steel supports were installed at both the support locations and the loading points, and were connected to the beam body. Reference points were coupled with steel plates to establish pinned boundaries and apply displacement-controlled loading. Since no significant slip was observed between the GFRP grid and concrete, the GFRP grid web was embedded in the concrete. Considering the symmetry of the structure, a half-model was developed to reduce computational effort and improve efficiency.
The material properties were defined according to Table 3. The GFRP material and steel used in this study match the properties reported by Zou et al. [28,33]. The commonly used concrete damage plasticity (CDP) model in ABAQUS was applied to simulate the nonlinear behavior of concrete. The stress–strain curve of concrete was obtained using the calculation method defined in GB 50010-2010 [37]. Based on this and the “ABAQUS User Manual” [38], the tensile and compressive damage parameters of concrete were calculated to simulate its damage behavior.

4.2. Numerical Verification

Figure 16 compares the experimental and numerical load–deflection curves of composite beams. The numerical predictions demonstrate excellent agreement with experimental measurements, confirming the reliability of the FEM. Table 5 compares the ultimate loads between the FEM and experimental results. It can be seen that the ultimate capacities calculated by the FEM for specimens C-1, C-2, and C-3 are 351.1 kN, 425.6 kN, and 757.1 kN, respectively. The observed higher initial stiffness may be attributed to the neglected bond-slip behavior between the reinforcing bars and concrete. The deviation between numerically predicted and experimental ultimate capacities is within 5%, confirming the accuracy of the model in predicting the ultimate capacity of composite beams.
Figure 17 compares the crack distribution patterns of C-2-FEM with those observed in the test. It can be observed that the concrete in the lower flange of C-2-FEM experiences significant vertical cracking due to tensile stress, as well as through cracks at the bottom of the upper flange. By comparing the tensile damage state in the failure mode of specimen C-2, these numerical results precisely reproduce the damage progression observed in the test beam, confirming the capability of the numerical model to simulate composite beam failure mechanisms.

4.3. Localized Compressive Transfer Mechanism of GFRP Grid

C-2-FEM is used to clarify the transfer mechanism of the GFRP grid web under localized compression. The stress distribution of the GFRP grid under different load levels is extracted along the paths shown in Figure 18, and the results are presented in Figure 19.
As shown in Figure 19a, the stress state of the GFRP grid web aligns with experimental observations. The web is predominantly governed by compressive stress, with both the node beneath the loading point and the left-side web reaching the compressive strength design value of GFRP. The left web adjacent to the loading point demonstrates significantly higher compressive stresses than the right-side web, indicating a pronounced uneven distribution. Under concentrated loading, compressive stresses diffuse from the loading zone toward the supports. The left web develops a high-stress concentration zone due to its proximity to the constrained support end, reflecting intensified load transfer efficiency near constraints. Tensile stresses develop in the GFRP grid within the lower flange zone directly under the loading point, resulting from cooperative deformation between the GFRP and concrete.
As shown in Figure 19b,c, the stress in the GFRP grid near the loading area is higher than in other regions and is primarily compressive. The stress gradually decreases from the upper flange downward. The stress in the grid exhibits nonlinear growth with the load increasing, which is attributed to the cracking of the concrete, leading to a stress redistribution and an uneven stress distribution. The farther the GFRP grid web is from the loading point, the less it is affected by localized pressure. In this region, the stress distribution in the grid web follows an alternating pattern of positive and negative values, as shown in Figure 19d. Additionally, the compressive stress in the grid web near the lower flange is higher than in the upper part along Path-3. This is because this path is closer to the support, causing the GFRP grid along the inclined compression path to bear higher stress.
In summary, under localized compression, the GFRP grid web primarily experiences compressive stress. Compressive stress is concentrated within a specific area, which is notably larger than the loaded area as a result of the stress diffusion effect from the upper flange. Beyond this core area, the stress value exhibits a progressively decreasing trend along the beam span direction. Meanwhile, compressive stress transmits diagonally downward along the 45° grid members to the lower flange, and the values near the upper flange exceed those near the lower flange. The grid nodes suffer severe stress concentrations, which govern potential failure initiation points for localized compression damage.

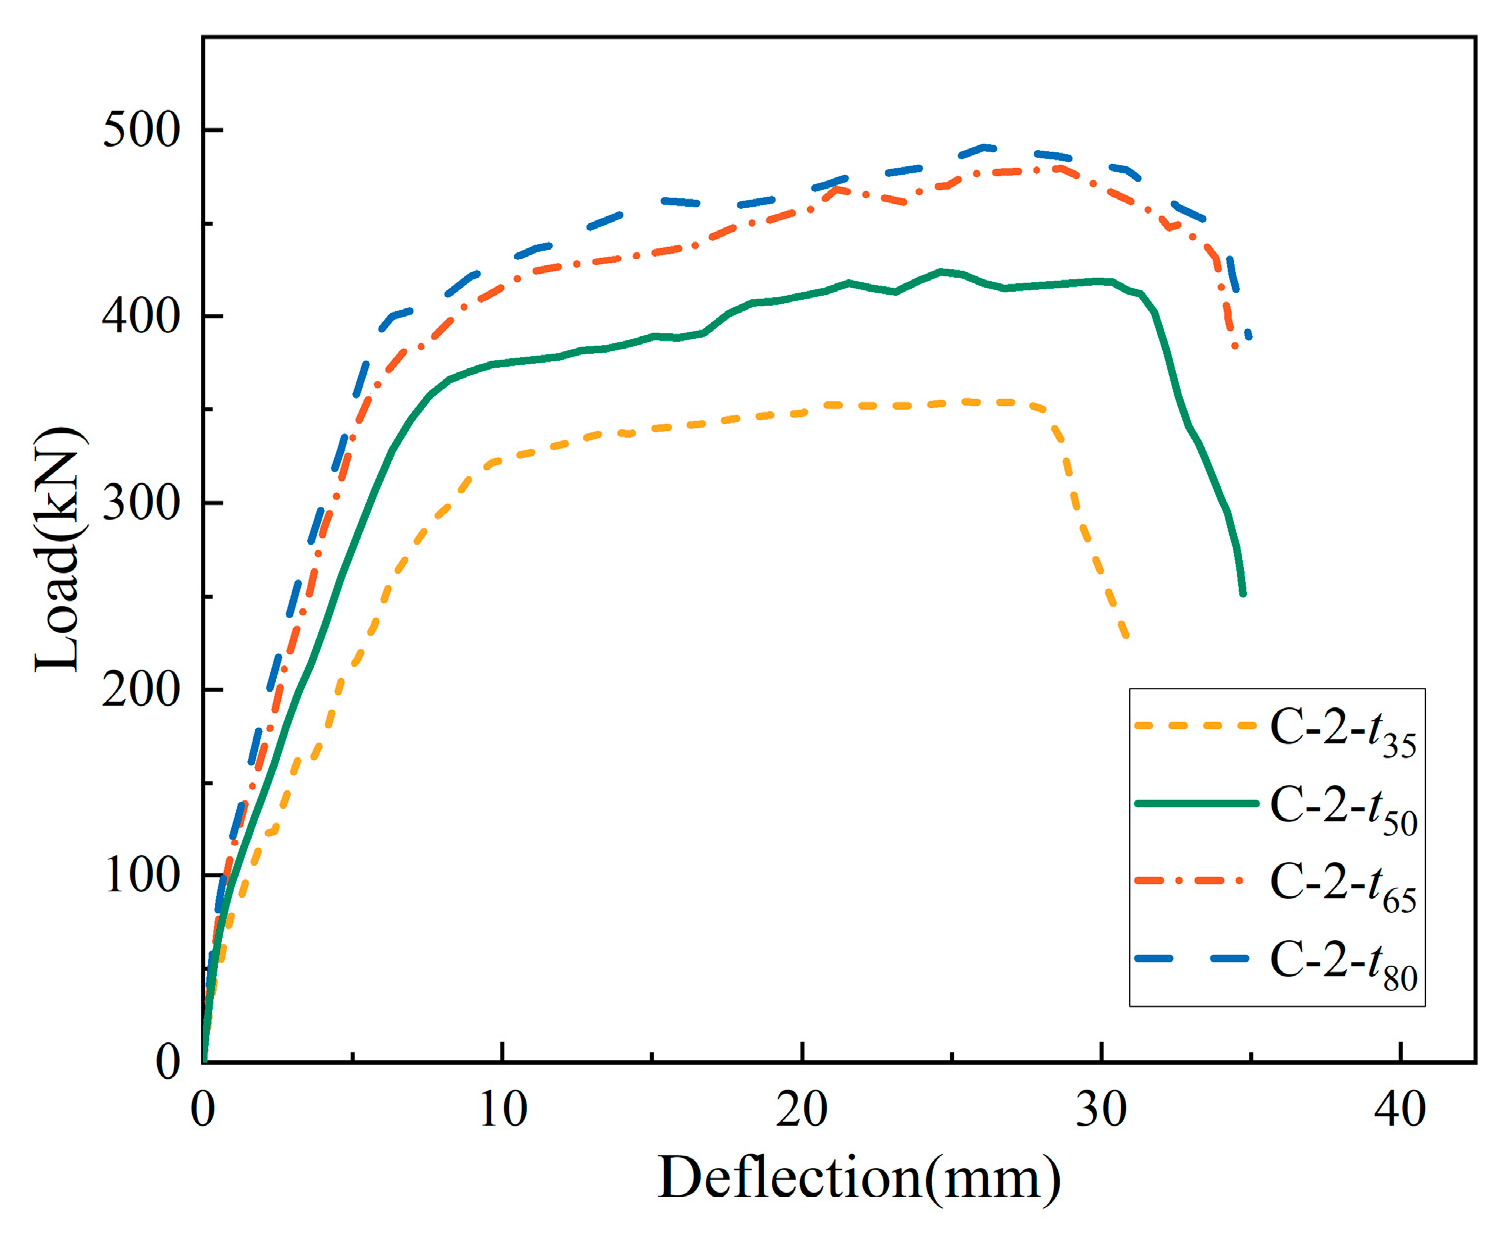
4.4. Parametric Study of GFRP Grid Web

The verified FEM was used to further investigate the effects of grid thickness and spacing on the localized compression behavior of the GFRP grid web composite beam. Based on this analysis, Table 6 lists the results under different grid thicknesses and spacings.
(1)
Grid thickness
The effect of different grid thicknesses on the load–displacement curve of the composite beam is shown in Figure 20. It can be observed that when the grid thickness increases from 35 mm to 80 mm, the ultimate bearing capacity of the composite beam increases from 354.2 kN to 491.5 kN, representing a 38.8% increase. As shown in Figure 21, at ultimate bearing capacity, specimen C-2-t65 exhibits less damage in the upper flange, but more severe damage in the lower flange compared to C-2-t35. This phenomenon occurs because the increased grid thickness enhances the strength and stiffness of the web, improving the deformation compatibility between the upper and lower flanges and thereby reducing the deformation of the upper flange. Additionally, the increased grid thickness reduces the effective compression area, resulting in more concentrated compressive stresses and a smaller stress diffusion range. As shown in Figure 22, in C-2-t35, local yielding of the longitudinal reinforcement occurs beneath the loading point, reflecting as localized collapse under compression. In contrast, in C-2-t65, the tensile stress in the lower flange grid exceeds the ultimate strength, accompanied by the longitudinal reinforcement. This indicates the failure of the beam control by its flexural behavior. Consequently, further increasing the thickness to 80 mm provides limited improvement in the ultimate bearing capacity of the composite beam. A parametric analysis of grid thickness reveals that a 65 mm thickness achieves a favorable balance between web performance and economic feasibility.
(2)
Grid spacing
The actual effect of changing the grid spacing is reflected in the grid element density. Figure 23 shows the comparison of the load–displacement curves for composite beams with different grid spacings. It can be observed that when the grid spacing decreases from 60 mm to 30 mm, the ultimate bearing capacity of the composite beam increases from 398.5 kN to 544.4 kN, representing a 36.6% increase. This indicates that reducing the grid spacing significantly enhances the contribution of the web to the ultimate capacity. Figure 24 and Figure 25 demonstrate that reducing the grid spacing to 30 mm results in the specimen being governed by flexural behavior. The increased density of GFRP grids embedded in the lower flange further improves the overall flexural performance of the composite beam. The parametric analysis results suggest that grid spacing should be maintained above 60 mm to mitigate premature failure of composite beams.
The influence of grid spacing and thickness on pre-cracking stiffness can be attributed to changes in the geometric properties of the section. Specifically, reducing the grid spacing or increasing the grid thickness significantly enhances the cross-sectional area and moment of inertia of the GFRP grid web, thereby increasing its contribution to the overall stiffness of the composite beam. Additionally, a denser or thicker grid exerts a stronger constraining effect on the deformation of the concrete flanges, effectively suppressing the shift of the neutral axis during the elastic phase and delaying the onset of cracking.
Based on parametric analysis results, practical engineering applications should avoid insufficient grid thickness and spacing to prevent web compression failure. Meanwhile, a balance between web strength and flange strength should be maintained to achieve cost-effectiveness.

5. Analytical Model

The Winkler elastic foundation model [39,40] is a classical model in foundation mechanics. It assumes that the foundation consists of a series of independent linear springs arranged vertically, with the deformation of each spring solely related to the local pressure above it and the pressure and settlement being linearly related. The pressure and settlement are linearly related. This model has been widely applied in the calculation of both the dynamic and static mechanical properties of composite beams [41,42,43].
Before deriving the formula for localized compression capacity, the following assumptions are made to simplify the calculation method and improve its accuracy:
(1)
The interface between the concrete and the GFRP grid web is assumed to form a reliable bond, with no relative slippage considered.
(2)
Given that the localized compression failure in the composite beam is predominantly governed by the GFRP grid web, and experimental observations indicate that damage in the upper flange occurs after web failure while the lower flange contributes minimally due to tensile cracking, the contribution of the reinforced concrete flanges to the bearing capacity is conservatively neglected to simplify the calculation model.
(3)
The stiffness of the GFRP grid web is assumed to be constant and uniformly distributed along the axial direction of the beam.
When calculating the localized compression capacity of the GFRP grid web beam, the Winkler model treats the upper flange as a continuous beam on an elastic foundation, as shown in Figure 26a. The GFRP grid web is modeled as linear springs with uniform stiffnesses, and the stress distribution under localized compression is depicted in Figure 26b.
Assuming that the deflection at the upper flange is denoted as y and the deflection at the lower flange is denoted as y0, the elastic foundation coefficient, denoted as kg, represents the unit stiffness of the GFRP grid. It can be calculated using the following Equation (2):
k g = 2 E g A g s cos 2 θ
where Ag is the cross-sectional area of the GFRP grid ribs, and can be calculated by A g = t w ; t is the thickness of the GFRP grid ribs; w is the width of the GFRP grid ribs; θ is the angle between the GFRP grid ribs and the upper flange plate; θ is taken as 45°; s is the spacing of the GFRP grid ribs; and Eg is the elastic modulus of the GFRP.
The reaction force per unit length between the web and the upper flange can be expressed as k g y y 0 . A concrete strength reduction factor βc with a specified value of 0.88 is integrated into the analytical model to account for the post-cracking stiffness deterioration characteristics in a composite beam. Econ is the elastic modulus of the concrete. The bending differential equation of the elastic foundation beam can then be expressed as Equation (3).
β c E c o n I t d 4 y d z 4 + k g y = k g y 0
Supposing that γ = k g 4 β c E c o n I t 4 , the bending differential equation of the elastic foundation beam can be rewritten as Equation (4).
y + 4 γ 4 y = 4 γ 4 y 0
According to the Winkler elastic foundation model, as z approaches infinity, the beam deflection tends to zero. The governing equation can be solved by considering the boundary conditions at the supports and loading points, from which the solution to the differential equation is derived, as shown in Equation (5).
y y 0 = P γ 2 k g e γ z ( sin γ z + cos γ z )
When the load width is 2a and the width of the upper flange is tw, the vertical compressive stress σcy can be expressed as Equation (6).
σ c y = k y y 0 t w = 2 0 a q γ d z 2 t w e γ z ( sin γ z + cos γ z )
According to Equation (7), the maximum vertical compressive stress σmax at z = 0 can be calculated. Under this load condition, the effective bearing width beff of the GFRP grid composite beam can be calculated using the following Equation (8).
σ m a x = 2 q γ 2 t w 1 2 γ 2 2 e γ a cos γ a = q t w 1 e γ a cos γ a
b e f f = P σ m a x t w = 2 q a σ m a x t w = 2 a 1 e γ a cos γ a
The localized compression capacity of the GFRP grid web–concrete composite beam is primarily controlled by the compressive strength of the GFRP, which is denoted as fcg. The ultimate localized compression capacity can be calculated using the following Equation (9). Considering the stress concentration at GFRP grid nodes, a strength adjustment factor βg of 0.88 is introduced for the GFRP grid system.
P = 2 β g f c g A g b e f f s cos 45 °
As shown in Table 7, the capacity verification of composite beams using Equation (9) demonstrates close consistency between the experimental and numerical results (Pn) and the calculated values (Pn,c). Comparative results show that the deviation between Pn and Pn,c is within 10%, and Equation (9) provides reliable predictions for the localized compression capacity of composite beams. Notably, there are significant discrepancies between the two sets of calculated data and the numerical simulation results. These discrepancies are due to the dominant localized compression strength of the GFRP grid web over the bending strength of the flange.

6. Conclusions

The following conclusions were derived:
(1)
The failure process of the novel GFRP grid web–concrete composite beam under localized compression can be categorized into three stages: the linear elastic phase, the post-cracking stiffening phase, and the failure phase. The localized failure of the composite beam is primarily governed by the GFRP grid web. At the ultimate state, the localized crushing of the grid web results in a rapid loss of load-bearing capacity in the structure.
(2)
Experimental results show that a 19.2% reduction in the shear-span ratio (from 1.77 to 1.43) leads to an approximate 22.93% increase in ultimate capacity and a 66.85% improvement in stiffness. Furthermore, the addition of local stiffener further enhances the ultimate capacity and stiffness by 77.53% and 94.29%, respectively. These findings indicate that optimizing the shear-span ratio and reinforcing local stiffener can significantly improve load distribution and overall structural performance.
(3)
The finite element model developed using ABAQUS successfully reproduced the load–displacement relationship, strain distribution, and failure modes observed in the experiments. The predicted ultimate bearing capacity had a deviation of less than 5% from the experimental results, demonstrating the accuracy of the numerical simulation and supporting its applicability for subsequent parametric analyses.
(4)
Parametric studies using the validated finite element model indicate that increasing the grid thickness within a range of 35–65 mm and reducing the grid spacing to between 30 and 40 mm can significantly enhance localized compression performance. This improvement is attributed to the fact that a thicker grid increases the load-bearing capacity, while a smaller spacing promotes more uniform stress distribution across the web. However, the influence of the grid parameters on localized compression performance necessitates further experimental and numerical validation to achieve an optimal balance between material efficiency and structural performance.
(5)
The analytical model derived from the Winkler elastic foundation theory can effectively predict the ultimate load. Comprehensive analysis of the experimental, numerical, and theoretical results shows that the calculation deviation remains within 10%, providing a practical and reliable theoretical basis for engineering design. However, the grid strength adjustment factor βg introduced still requires further refinement through further experimental and numerical validations.
(6)
For the same cross-sectional design, the localized bearing capacity of composite beams is generally higher than their flexural failure capacity. In practical engineering applications, although the localized compression performance meets the required standards after proper design, the rational optimization of the GFRP grid web parameters remains crucial.
This research contributes to the understanding of GFRP grid web–concrete composite beams and aims to provide a foundation for their potential application in sustainable and durable infrastructure. Due to the corrosion resistance and lightweight nature of GFRPs, the proposed composite beam system shows promise for use in corrosion-prone environments and lightweight bridge construction. Additionally, its improved localized compression performance helps to address some of the limitations observed in existing GFRP composite structural designs, potentially offering a pathway to enhance safety and reliability in such systems.
To facilitate broader practical implementation, future research should explore a wider range of structural parameters, including variations in grid geometry, reinforcement configuration, and material characteristics. In addition, comprehensive studies on long-term performance, such as durability, fatigue resistance, and environmental effects, are essential to ensure the structural integrity and service life of the system under real-world conditions.

Author Contributions

Conceptualization, K.Y. and Z.Z.; Methodology, H.C. and W.K.; Validation, W.K.; Formal analysis, Y.L.; Resources, H.C.; Data curation, Y.Z., K.Y. and H.J.; Writing—original draft, Y.L.; Writing—review & editing, H.J. and Z.Z.; Supervision, Y.Z. All authors have read and agreed to the published version of the manuscript.

Funding

The authors express their sincere gratitude for the financial support provided by the National Natural Science Foundation of China (Grant Nos. 52278147 and 52208302), the Natural Science Foundation of Chongqing, China (Grant Nos. CSTB2023NSCQ-LZX0090 and CSTB2023NSCQ-MSX0019), and the Science and Technology Research Program of Chongqing Municipal Education Commission (Grant No. KJZD-M202300706).

Data Availability Statement

The original contributions presented in this study are included in the article. Further inquiries can be directed to the corresponding author.

Conflicts of Interest

Author Hai Cao was employed by the company CSSC Science Technology Co., Ltd. Authors Yang Zhou and Weibo Kong were employed by the company CSSC Haizhuang Windpower Co., Ltd. The remaining authors declare that the research was conducted in the absence of any commercial or financial relationships that could be construed as a potential conflict of interest.

References

  1. Xin, H.; Liu, Y.; Mosallam, A.S.; He, J.; Du, A. Evaluation on material behaviors of pultruded glass fiber reinforced polymer (GFRP) laminates. Compos. Struct. 2017, 182, 283–300. [Google Scholar] [CrossRef]
  2. Liu, T.; Liu, X.; Feng, P. A comprehensive review on mechanical properties of pultruded FRP composites subjected to long-term environmental effects. Compos. Part B Eng. 2020, 191, 107958. [Google Scholar] [CrossRef]
  3. Feng, P.; Wang, J.; Wang, Y.; Loughery, D.; Niu, D. Effects of corrosive environments on properties of pultruded GFRP plates. Compos. Part B Eng. 2014, 67, 427–433. [Google Scholar] [CrossRef]
  4. Yang, C.; Nan, Z.; Huo, Y.; Yang, Y.; Xu, P.; Xiao, Y.; Meng, K. Design, characterisation, and crushing performance of hexagonal-quadrilateral lattice-filled steel/CFRP hybrid structures. Compos. Part B Eng. 2025, 304, 112631. [Google Scholar] [CrossRef]
  5. Bazli, M.; Li, Y.-L.; Zhao, X.-L.; Raman, R.K.S.; Bai, Y.; Al-Saadi, S.; Haque, A. Durability of seawater and sea sand concrete filled filament wound FRP tubes under seawater environments. Compos. Part B Eng. 2020, 202, 108409. [Google Scholar] [CrossRef]
  6. Siwowski, T.; Kulpa, M.; Rajchel, M.; Poneta, P. Design, manufacturing and structural testing of all-composite FRP bridge girder. Compos. Struct. 2018, 206, 814–827. [Google Scholar] [CrossRef]
  7. Pang, K.; Zhou, H.; Wu, C.; Jiang, H.; Zhang, Z.; Yu, Y.; Zhang, J. Study on behavior of waffle-type UHPC-GFRP composite slab under three-point loading. Case Stud. Constr. Mater. 2023, 19, e02457. [Google Scholar] [CrossRef]
  8. Wu, C.; Wang, X.; Zhang, Z.; Zou, Y.; Yang, J.; Jin, M.; Lun, X. Flexural behavior of embedded GFRP grid framework-UHPC composite plate without steel rebar. Case Stud. Constr. Mater. 2024, 20, e02900. [Google Scholar] [CrossRef]
  9. Yang, J.Q.; Smith, S.T.; Feng, P. Effect of FRP-to-steel bonded joint configuration on interfacial stresses: Finite element investigation. Thin-Walled Struct. 2013, 62, 215–228. [Google Scholar] [CrossRef]
  10. Liu, T.; Vieira, J.D.; Harries, K.A. Lateral torsional buckling and section distortion of pultruded GFRP I-sections subject to flexure. Compos. Struct. 2019, 225, 111151. [Google Scholar] [CrossRef]
  11. Al-Rousan, R.; Ababneh, A.; Alhassan, M. Hybrid CFRP-steel for enhancing the flexural behavior of reinforced concrete beams. J. King Saud Univ. Eng. Sci. 2021, 33, 459–470. [Google Scholar] [CrossRef]
  12. Jiang, Z.; Wan, S.; Fang, Z.; Song, A. Experimental investigation of fatigue behavior for adhesively-bonded GFRP/steel joints. Eng. Struct. 2020, 213, 110580. [Google Scholar] [CrossRef]
  13. Sylaj, V.; Jawdhari, A.; Fam, A. Sandwich concrete beams with GFRP side faces tested and modeled in flexure. Thin-Walled Struct. 2022, 179, 109703. [Google Scholar] [CrossRef]
  14. Liu, T.; Feng, P.; Lu, X.; Yang, J.-Q.; Wu, Y. Flexural behavior of novel hybrid multicell GFRP-concrete beam. Compos. Struct. 2020, 250, 112606. [Google Scholar] [CrossRef]
  15. Chen, D.; El-Hacha, R. Damage tolerance and residual strength of hybrid FRP–UHPC beam. Eng. Struct. 2013, 49, 275–283. [Google Scholar] [CrossRef]
  16. Muc, A.; Stawiarski, A.; Chwał, M. Design of the hybrid FRP/concrete structures for bridge constructions. Compos. Struct. 2020, 247, 112490. [Google Scholar] [CrossRef]
  17. Zou, X.; Lin, H.; Feng, P.; Bao, Y.; Wang, J. A review on FRP-concrete hybrid sections for bridge applications. Compos. Struct. 2021, 262, 113336. [Google Scholar] [CrossRef]
  18. Madenci, E.; Özkılıç, Y.O.; Aksoylu, C.; Safonov, A. The Effects of Eccentric Web Openings on the Compressive Performance of Pultruded GFRP Boxes Wrapped with GFRP and CFRP Sheets. Polymers 2022, 14, 4567. [Google Scholar] [CrossRef]
  19. Iskander, M.; El-Hacha, R.; Shrive, N. Governing failure criterion of short-span hybrid FRP-UHPC beams subjected to high shear forces. Compos. Struct. 2018, 185, 123–131. [Google Scholar] [CrossRef]
  20. Alizadeh, E.; Dehestani, M.; Navayi Neya, B.; Nematzadeh, M. Efficient composite bridge deck consisting of GFRP. J. Sandw. Struct. Mater. 2019, 21, 154–174. [Google Scholar] [CrossRef]
  21. Wang, Z.; Xie, J.; Qian, X.; Yan, J.-B. Interfacial shear behaviour of GFRP box-concrete composite girders under low temperature. Eng. Struct. 2024, 312, 118242. [Google Scholar] [CrossRef]
  22. Wang, W.-W.; Harries, K.; Tian, J. Bonding Behavior of Wet-Bonded GFRP-Concrete Interface. J. Compos. Constr. 2015, 19, 04015001. [Google Scholar] [CrossRef]
  23. Zou, X.; Feng, P.; Wang, J. Bolted Shear Connection of FRP-Concrete Hybrid Beams. J. Compos. Constr. 2018, 22, 04018012. [Google Scholar] [CrossRef]
  24. Zou, X.; Feng, P.; Wang, J. Perforated FRP ribs for shear connecting of FRP-concrete hybrid beams/decks. Compos. Struct. 2016, 152, 267–276. [Google Scholar] [CrossRef]
  25. Zhang, P.; Hu, Y.; Pang, Y.; Feng, H.; Gao, D.; Zhao, J.; Sheikh, S.A. Influence factors analysis of the interfacial bond behavior between GFRP plates, concrete. Structures 2020, 26, 79–91. [Google Scholar] [CrossRef]
  26. Csillag, F.; Pavlović, M. Push-out behaviour of demountable injected vs. blind-bolted connectors in FRP decks. Compos. Struct. 2021, 270, 114043. [Google Scholar] [CrossRef]
  27. Kong, S.Y.; Yang, X.; Lee, Z.Y. Mechanical performance and numerical simulation of GFRP-concrete composite panel with circular hollow connectors and epoxy adhesion. Constr. Build. Mater. 2018, 184, 643–654. [Google Scholar] [CrossRef]
  28. Zou, Y.; Yu, K.; Heng, J.; Zhang, Z.; Peng, H.; Wu, C.; Wang, X. Feasibility study of new GFRP grid web—Concrete composite beam. Compos. Struct. 2023, 305, 116527. [Google Scholar] [CrossRef]
  29. Zeng, J.-J.; Zeng, W.-B.; Ye, Y.-Y.; Liao, J.; Zhuge, Y.; Fan, T.-H. Flexural behavior of FRP grid reinforced ultra-high-performance concrete composite plates with different types of fibers. Eng. Struct. 2022, 272, 115020. [Google Scholar] [CrossRef]
  30. Li, G.-Q.; Jiang, J.; Zhu, Q. Local buckling of compression flanges of H-beams with corrugated webs. J. Constr. Steel Res. 2015, 112, 69–79. [Google Scholar] [CrossRef]
  31. Jáger, B.; Dunai, L.; Kövesdi, B. Flange buckling behavior of girders with corrugated web Part II: Numerical study and design method development. Thin-Walled Struct. 2017, 118, 238–252. [Google Scholar] [CrossRef]
  32. ACI 318-19(22); Building Code Requirements for Structural Concrete and Commentary (Reapproved 2022). American Concrete Institute: Farmington Hills, MI, USA, 2019.
  33. Zou, Y.; Wu, C.; Zhang, Z.; Jiang, J.; Yu, K.; Wang, X. Investigation on flexural behavior of novel GFRP grid web-concrete hybrid beam. Eng. Struct. 2023, 278, 115489. [Google Scholar] [CrossRef]
  34. GB/T 50448-2015; Technical Code for Application of Cementitious Grout. General Administration of Quality Supervision, Inspection and Quarantine: Beijing, China, 2015. (In Chinese)
  35. GB/T 50081-2019; Standard for Test Methods of Concrete Physical and Mechanical Properties. State Administration for Market Regulation, Standardization Administration: Beijing, China, 2019. (In Chinese)
  36. 36. GB/T 228.1-2010; Metallic Materials-Tensile Testing-Part 1: Method of Test at Room Temperature. General Administration of Quality Supervision, Inspection and Quarantine: Beijing, China, 2010. (In Chinese)
  37. GB 50010-2010; Code for Design of Concrete Structures. General Administration of Quality Supervision, Inspection and Quarantine: Beijing, China, 2010. (In Chinese)
  38. ABAQUS 6.14 User Manual. Available online: http://62.108.178.35:2080/v6.14/index.html (accessed on 28 July 2025).
  39. Al-Hosani, K.; Fadhil, S.; El-Zafrany, A. Fundamental solution and boundary element analysis of thick plates on Winkler foundation. Comput. Struct. 1999, 70, 325–336. [Google Scholar] [CrossRef]
  40. Eisenberger, M.; Yankelevsky, D.Z. Exact stiffness matrix for beams on elastic foundation. Comput. Struct. 1985, 21, 1355–1359. [Google Scholar] [CrossRef]
  41. Wstawska, I.; Magnucki, K.; Kędzia, P. Stability of three-layered beam on elastic foundation. Thin-Walled Struct. 2022, 175, 109208. [Google Scholar] [CrossRef]
  42. Nguyen, N.-D.; Vo, T.P.; Nguyen, T.-K. An improved shear deformable theory for bending and buckling response of thin-walled FG sandwich I-beams resting on the elastic foundation. Compos. Struct. 2020, 254, 112823. [Google Scholar] [CrossRef]
  43. Gao, K.; Gao, W.; Wu, D.; Song, C. Nonlinear dynamic characteristics and stability of composite orthotropic plate on elastic foundation under thermal environment. Compos. Struct. 2017, 168, 619–632. [Google Scholar] [CrossRef]
Figure 1. Dimension of GFRP grid cell.
Buildings 15 02693 g001
Figure 2. Cross-sectional geometries of specimens C-1 and C-2 (units: mm). (a) Front view. (b) A-A. (c) B-B.
Buildings 15 02693 g002
Figure 3. Cross-sectional geometries of specimen C-3 (units: mm). (a) Front view. (b) A-A. (c) B-B.
Buildings 15 02693 g003
Figure 4. Fabrication process of specimens. (a) GFRP grid cutting. (b) Steel skeleton binding. (c) Concrete pouring.
Buildings 15 02693 g004
Figure 5. Mechanical property tests of materials. (a) Four-point test of concrete. (b) Concrete compression test. (c) Steel rebar property test.
Buildings 15 02693 g005
Figure 6. Test setup.
Buildings 15 02693 g006
Figure 7. Loading and measuring point arrangement. (a) C-1, C-2. (b) C-3. (c) Section.
Buildings 15 02693 g007
Figure 8. Failure modes of test specimens. (a) C-1. (b) C-2. (c) C-3.
Buildings 15 02693 g008
Figure 9. Failure characteristics of composite beams. (a) Upper flange plate reinforcement of C-1. (b) Grid crack morphology of C-1. (c) Failure mode of upper flange in C-2. (d) Grid crack morphology of C-2.
Buildings 15 02693 g009aBuildings 15 02693 g009b
Figure 10. Load–displacement curves of test specimens.
Buildings 15 02693 g010
Figure 11. Upper–lower flange relative displacement.
Buildings 15 02693 g011
Figure 12. Different sectional shear force and grid strain of specimen C-1. (a) Shear force and grid strain of the 1# section. (b) Shear force and grid strain of 2# section. (c) Shear force and grid strain of the 3# section.
Buildings 15 02693 g012
Figure 13. Different sectional shear force and grid strain of specimen C-2. (a) Shear force and grid strain of the 1# section. (b) Shear force and grid strain of the 2# section. (c) Shear force and grid strain of the 3# section.
Buildings 15 02693 g013aBuildings 15 02693 g013b
Figure 14. Sectional shear force and grid strain of specimen C-2 (2# section).
Buildings 15 02693 g014
Figure 15. FEM for specimen C-2.
Buildings 15 02693 g015
Figure 16. Load–deflection curves from experiment and numerical results.
Buildings 15 02693 g016
Figure 17. Comparison of crack distribution between experimental and numerical results for specimen C-2 at ultimate load.
Buildings 15 02693 g017
Figure 18. Stress extraction paths for GFRP grid.
Buildings 15 02693 g018
Figure 19. Stress distributions of GFRP grid. (a) Stress cloud map of GFRP grid web under Pu. (b) Path-1. (c) Path-2. (d) Path-3.
Buildings 15 02693 g019
Figure 20. Load–displacement curves of composite beams with different grid thicknesses.
Buildings 15 02693 g020
Figure 21. Effect of thickness parameters on damage and web stress. (a) C-2-t35. (b) C-2-t65.
Buildings 15 02693 g021
Figure 22. Stress maps of steel skeletons. (a) C-2-t35. (b) C-2-t65.
Buildings 15 02693 g022
Figure 23. Load–displacement curves of composite beams with different grid spacings.
Buildings 15 02693 g023
Figure 24. Damage and web stress of C-2-s30.
Buildings 15 02693 g024
Figure 25. Steel skeleton’s stress map of C-2-s30.
Buildings 15 02693 g025
Figure 26. Model and stress distribution of composite beam model based on Winkler elastic foundation. (a) Modeling GFRP grid web into linear springs. (b) Stress distribution under the Winkler elastic foundation model.
Buildings 15 02693 g026
Table 1. Mechanical properties of concrete and steel rebar materials.
MaterialCompressive Strength of Concrete
fc (MPa)
Young’s Modulus of Concrete
Ec (GPa)
Yield Stress of Steel Rebar
fv (MPa)
Ultimate Stress of Steel Rebar
fu (MPa)
Young’s Modulus of Steel Rebar
Es (GPa)
C5046.735.1---
HRB400--459.3577.1203.7
Table 2. Mechanical properties of GFRP materials.
PerformanceCompression ModulusCompressive StrengthTensile ModulusTensile StrengthInterlaminar Shear Strength
Result (MPa)20,000.0320.015,000.0238.733.2
Table 3. Loading parameters of composite beams.
Test Numbera (mm)b (mm)L (mm)Shear Span RatioNotes
C-17757523001.77Unribbed
C-262517523001.43Unribbed
C-362517516001.43Local ribbed
Table 4. Experimental results.
Test NumberPu (kN)Su (mm)Pu/Su (kN/mm)Su,0.5 (mm)Kel (kN/mm)Energy
Absorption (J)
Stiffness
Degradation Rate (%)
Failure Mode
C-1362.6539.209.234.1445.2711,337.5879.61Bending failure
C-2445.3228.9015.404.1253.659007.4771.29Local collapse
C-3790.7526.4029.926.0255.6513,030.9646.23Flexural-shear failure
Table 5. Comparison between FEM and experimental results.
Test NumberC-1C-2C-3
FEMEXPFEMEXPFEMEXP
Pu (kN)351.1362.0425.6445.0757.1790.0
Deviation3.01%4.36%4.16%
Table 6. Mechanical performance with varying grid thicknesses and spacings.
NumberGrid
Thickness (mm)
Grid
Spacing (mm)
Pu (kN)Su (mm)Pu/Su (kN/mm)
C-2-t353550348.025.313.7
C-2-t505050425.630.314.1
C-2-t656550479.628.717.1
C-2-t808050491.526.017.6
C-2-s605060398.521.616.1
C-2-s505050425.630.314.1
C-2-s405040479.925.319.0
C-2-s305030544.430.817.7
Table 7. Comparison of experimental, FEM, and calculation results.
NumberPn (kN)Pn,c (kN)Deviation
C-2445.0420.55.49%
C-2FEM425.6420.51.19%
C-2-t35348.0318.68.45%
C-2-t65479.6524.49.35%
C-2-t80491.5625.727.30%
C-2-s60398.5361.29.36%
C-2-s40479.9507.35.72%
C-2-s30544.4647.819.09%
Disclaimer/Publisher’s Note: The statements, opinions and data contained in all publications are solely those of the individual author(s) and contributor(s) and not of MDPI and/or the editor(s). MDPI and/or the editor(s) disclaim responsibility for any injury to people or property resulting from any ideas, methods, instructions or products referred to in the content.

