Article

Indoor Soundscape Perception and Soundscape Appropriateness Assessment While Working at Home: A Comparative Study with Relaxing Activities

1
School of Architecture and Urban Planning, Shenyang Jianzhu University, Shenyang 110168, China
2
Liaoning Provincial Key Laboratory of Regional Architecture and Cold Region Living Environment, Shenyang Jianzhu University, Shenyang 110168, China
3
Liaoning Provincial Key Laboratory of Eco-Building Physics Technology and Evaluation, Shenyang Jianzhu University, Shenyang 110168, China
4
School of Science, Shenyang Jianzhu University, Shenyang 110168, China
5
UCL Institute for Environmental Design and Engineering, The Bartlett, University College London, London WC1H 0NN, UK
*
Authors to whom correspondence should be addressed.
Buildings 2025, 15(15), 2642; https://doi.org/10.3390/buildings15152642
Submission received: 7 June 2025 / Revised: 10 July 2025 / Accepted: 16 July 2025 / Published: 26 July 2025
(This article belongs to the Section Architectural Design, Urban Science, and Real Estate)

Abstract

The COVID-19 pandemic’s rapid shift to working from home has fundamentally challenged residential acoustic design, which traditionally prioritises rest and relaxation rather than sustained concentration. However, a clear gap exists in understanding how acoustic needs and the subjective evaluation of soundscape appropriateness (SA) differ between these conflicting activities within the same domestic space. Addressing this gap, this study reveals critical differences in how people experience and evaluate home soundscapes during work versus relaxation activities in the same residential spaces. Through an online survey of 247 Chinese participants during lockdown, we assessed soundscape perception attributes, the perceived saliencies of various sound types, and soundscape appropriateness (SA) ratings while working and relaxing at home. Our findings demonstrate that working at home creates a more demanding acoustic context: participants perceived indoor soundscapes as significantly less comfortable and less full of content when working compared to relaxing (p < 0.001), with natural sounds becoming less noticeable (−13.3%) and distracting household sounds more prominent (+7.5%). Structural equation modelling revealed distinct influence mechanisms: while comfort significantly mediates SA enhancement in both activities, the effect is stronger during relaxation (R2 = 0.18). Critically, outdoor man-made noise, building-service noise, and neighbour sounds all negatively impact SA during work, with neighbour sounds showing the largest detrimental effect (total effect size = −0.17), whereas only neighbour sounds and outdoor man-made noise significantly disrupt relaxation activities. Additionally, natural sounds act as a positive factor during relaxation. These results expose a fundamental mismatch: existing residential acoustic environments, designed primarily for rest, fail to support the cognitive demands of work activities. This study provides evidence-based insights for acoustic design interventions, emphasising the need for activity-specific soundscape considerations in residential spaces. As hybrid work arrangements become the norm post-pandemic, our findings highlight the urgency of reimagining residential acoustic design to accommodate both focused work and restorative relaxation within the same home.

1. Introduction

The COVID-19 pandemic precipitated a rapid and widespread adoption of working from home, fundamentally transforming the functional requirements of residential spaces. This shift has brought the suitability of indoor environments for work activities into focus, with the acoustic environment emerging as a particularly critical factor [1,2,3]. Poor acoustic conditions, such as the presence of disruptive or distracting sounds, have been shown to reduce work efficiency, increase irritability, and even trigger work-related health issues [4,5]. A recent survey found that 79.6% of students engaged in home-based online learning reported a decrease in learning efficiency attributable to their indoor soundscape [6]. Similarly, studies of home-workers have linked perceived problems like noise from neighbours directly to lower psychological well-being [7].
This highlights a core research problem: residential soundscapes have traditionally been designed primarily to meet the needs of rest and relaxation, rather than the sustained concentration typically required for office work [8,9]. This inherent mismatch presents significant challenges: acoustic conditions designed for relaxation may not adequately support the demands of working from home. Whilst some research indicates that overall comfort is perceived as higher at home, perceived work performance is often rated higher at the office [10], highlighting this tension. Consequently, there is an urgent need to investigate whether existing residential acoustic environments can sufficiently support efficient work, yet empirical evidence in this area remains limited.
Although the urban lockdowns that facilitated this research are now past, the period offered a unique opportunity to study home acoustics. Reduced urban noise, particularly from traffic [11,12,13], allowed other soundscape elements to become more prominent [14,15]. However, a quieter city did not necessarily lead to a better home acoustic experience. Multiple studies reported an increase in noise complaints during lockdown, focusing on neighbourhood sounds (e.g., from neighbours, people in common areas) and mechanical noises from building services [16,17,18,19]. This was mainly attributed to extended time spent at home and increased activity types, which adversely affected productivity for those conducting noise-sensitive activities like work [18,19]. Since hybrid work models are now a persistent feature of modern professional life, understanding these acoustic challenges is crucial for enhancing residents’ well-being and productivity.
To address this, the soundscape approach, which considers sound as a “resource” to be shaped around human perception and experience [8,20], provides a valuable framework. Central to this approach is the concept of soundscape appropriateness (SA), defined as the subjective assessment of whether a soundscape is suitable for a given activity [21,22]. An appropriate soundscape positively influences individual experiences, whereas a mismatched soundscape can adversely affect behaviours like relaxation or work productivity [23,24,25]. People’s evaluation of SA differs depending on the activity, even within the same space [26], a finding reinforced by recent work showing comfort perceptions vary significantly between activities such as resting, reading, and typing [27].
Whilst extensive research exists on the acoustic requirements for traditional offices [28,29,30,31], the specific challenges of WAH environments are still being mapped. This has led to an emerging body of research focused on the residential soundscape during work. These studies confirm that home acoustic environments are often complex and variable, making workers more critical of their acoustic conditions [32,33]. A recurring finding is the heightened prominence of sounds originating within the building itself. Recent work has consistently identified neighbour sounds [7,10], floor impact sounds [34,35,36], and building-service noise as primary sources of disruption and negative soundscape evaluations during WAH [19,37,38,39].
This existing research clearly establishes the problem, but a specific knowledge gap remains. Although some studies have acknowledged SA in WAH contexts [32], it has often been a supplementary indicator rather than the central focus. There has been no systematic, comparative investigation into how residents’ indoor soundscape perception and, crucially, their SA evaluations differ when engaged in working versus relaxing activities within the same residential settings. Furthermore, the underlying mechanisms—how different sound sources and perceptual dimensions like “comfort” and “content” influence SA ratings for these distinct activities—have not been quantitatively modelled and contrasted. This study addresses this gap, offering a novel contribution by systematically exploring these differences.
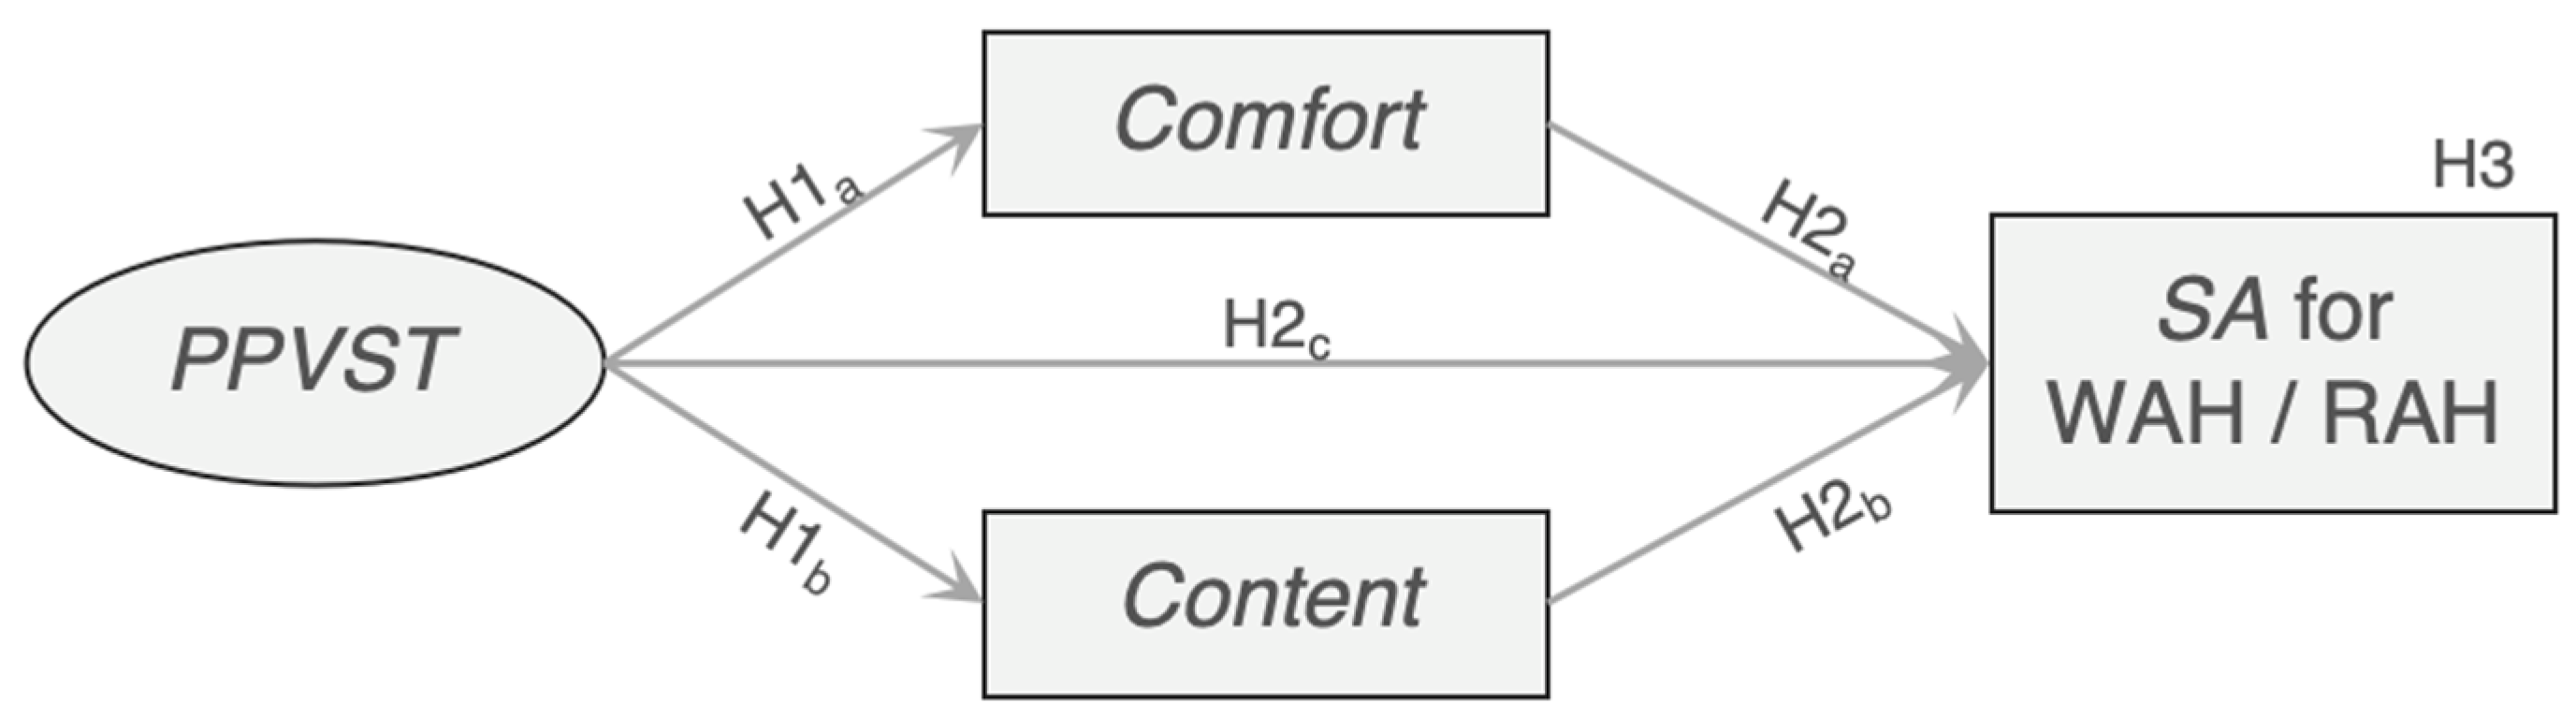
This study, therefore, aims to systematically compare differences in residents’ indoor soundscape perception and SA evaluation when engaged in working at home (WAH) versus relaxing at home (RAH) within their residential settings, and to explore in depth the key factors influencing SA assessment under these two distinct home-based activities. By employing structural equation modelling (SEM), this research offers a unique contribution by not only identifying differences in soundscape perception but also by quantitatively modelling and contrasting the complex pathways through which various sound sources and perceptual dimensions influence SA during both work and relaxation—a dual-functionality now common in post-pandemic homes. To this end, this study conducted an online questionnaire survey, capitalising on the opportunity of widespread working from home during lockdown, to assess participants’ SA ratings under both WAH and RAH contexts. The survey collected feedback on soundscape elements (such as the perceived prominence of various sound types and indoor soundscape perception attributes), soundscape perception dimensions (comfort and content), and housing and individual factors (such as floor level, number of cohabitants, noise sensitivity, and education level). Based on these data, the study first compared the consistency and heterogeneity of indoor soundscape perception under WAH versus RAH behaviours to understand people’s emotional responses to indoor soundscapes when engaging in different activities at home. Subsequently, SEM was employed to reveal the influence mechanisms and extents of different soundscape elements, affective perception, and individual factors on SA evaluation under both activities. The results of this study are expected to deepen understanding of the acoustic requirements for different home activities (particularly WAH), thereby providing scientific evidence for optimising residential acoustic environment design and enhancing residents’ well-being.

2. Methods

2.1. Study Design

The research first conducted an online survey of 262 Chinese participants during lockdown using an adapted scale, completing data collection. After data screening, 247 valid samples were obtained. Comparative analysis of soundscape perception under two conditions (WAH and RAH) was conducted using the Wilcoxon signed-rank test, and structural equation models were constructed for both conditions, with the process shown in Figure 1.
The questionnaire used in this study was adapted from a previous UK study [20,32,40]. The questionnaire was translated into Mandarin Chinese by six soundscape researchers proficient in both English and Mandarin Chinese, and certain questions were modified to reflect the Chinese context. The questionnaire comprised three sections: (1) questions related to the two home activities, separately asking about the rooms used for WAH and RAH, the perceived prominence of various sound types, indoor soundscape perception, and SA evaluation (measured by the appropriateness of the surrounding acoustic environment for work or relaxation), all during the preceding 30-day period; (2) questions concerning housing characteristics and urban environment, including the housing area and type, floor level, and number of cohabitants; (3) questions regarding personal attributes, including gender, age, noise sensitivity, and occupational characteristics. Questions related to indoor soundscape perception utilised eight attributes developed by Torresin et al. [41] for the perceived affective quality of indoor soundscapes, which were proposed based on the ISO 12913 series standards and eight attributes of urban soundscape perception [42], employing a soundscape model with comfort and content as the two primary perceptual dimensions to measure people’s perception of indoor soundscapes. The Noise Sensitivity Scale [43] was used to enquire about respondents’ sensitivity to sound, as this may influence their perception of the acoustic environment. The specific format of the questionnaire can be found in the Appendix A, Table A1. The design relied on participants’ natural alternation between work and relaxation, the frequency and sequence of which differ across individuals, thereby providing an inherent random distribution of activity order and minimising any potential sequence effect.

2.2. Participants

In April 2022, during the period when Chinese cities faced full or partial lockdowns due to COVID-19, an online survey was conducted among working-from-home populations in 37 cities including Shanghai, Beijing, and Shenyang. The purpose was to capture a broadly representative natural survey to comprehensively understand Chinese participants’ soundscape experiences whilst working from home. Participants were required to meet the following criteria: be over 18 years of age, have been working at home under lockdown for at least 30 days prior to completing the questionnaire, and have no hearing impairments. The questionnaire was created and distributed using the online data collection and processing platform wjx.cn. All procedures complied with relevant ethical regulations and were approved by the Ethics Committee of the School of Architecture and Urban Planning, Shenyang Jianzhu University (No. 2022SJZU-A023). Informed consent was obtained from all participants.
A total of 262 questionnaires were collected in this survey. Through screening, 15 questionnaires that did not meet requirements were excluded (7 did not meet age criteria, 2 showed anomalous noise sensitivity responses, and 6 showed careless responses). Finally, 247 valid samples were obtained (59.1% female, 40.9% male), with an average completion time of 7.8 min.
The average age of participants was 31.5 years. Participants generally had high educational attainment, with over half holding postgraduate degrees or above (50.2%). Regarding work content at home, internet-based activities such as online meetings and telephone conversations (78.1%) and online learning (62.8%) were most frequently reported, followed by cognitive work (thinking: e.g., reading, writing, calculation) (69.2%) and creative work (creating: e.g., design, planning) (57.9%). Of the participants, 26.7% reported WAH for more than 8 h per day on average, whilst 20.6% worked 6–8 h daily. In terms of housing characteristics, most participants worked in bedrooms or studies (46.2% and 32.8%, respectively), whilst they were more likely to relax in bedrooms or living rooms. The housing area of participants was predominantly in the 80–120 m2 range (35.6%), with multi-storey or high-rise residences being the most common housing type (85.9%), which aligns with typical housing characteristics in major Chinese cities. In most cases, participants lived with three people (33.2%) or two people (27.1%). Regarding the urban environment, residences were more commonly located slightly away from the city centre (41.3%), with fewer in suburban areas (10.1%). Additional information on participant demographics and housing characteristics is provided in the Appendix A, Table A2.

2.3. Statistical Analysis

Data entry, screening, and processing were conducted using IBM SPSS Statistics 26. The questionnaire data passed reliability and validity tests, with the results shown in the Appendix A, Table A3, indicating that the Chinese-translated version of the questionnaire was valid. As the main indicators involved in the study were ordinal variables, non-parametric methods were used for subsequent data analysis.
This study employed the calculation method for indoor soundscape perception dimensions developed by Torresin et al. [41] to calculate scores for comfort and content (Equations (1) and (2)). Subsequently, the open-source visualisation tool Soundscapy, developed by Mitchell et al. [44], was used to represent comfort and content as a circumplex distribution map of soundscape perception, allowing observation of the distribution characteristics of indoor soundscape perception across the two primary perceptual dimensions.
comfort = (ca) + cos45° × (pciu) + cos45° × (en − d)
content = (fem) + cos45° × (iupc) + cos45° × (en − d)
where a = annoying, c = comfortable, d = detached, em = empty, en = engaging, f = full of content, iu = intrusive/uncontrolled, pc = private/controlled. The coordinates are divided by (4 + √32) to scale the resulting values between −1 and +1.
The Wilcoxon signed-rank test was employed to explore whether differences existed in participants’ perception of indoor soundscapes and SA evaluation when engaging in different activities at home. This method is suitable for comparing paired sample differences and can effectively eliminate the influence of individual differences on results. In this method, differences refer to median differences, with the test calculating the median of WAH-RAH difference values rather than calculating the difference between the two group medians. The statistical significance threshold was set at 0.05.
Exploratory factor analysis (EFA) was used to reduce the dimensionality of nine anthropogenic sounds based on respondents’ perceived prominence of various sound sources under two home activity conditions, with the analysis results serving as the basis for establishing the measurement model in subsequent structural equation modelling. EFA was conducted separately on the full sample (n = 247 × 2 = 494), WAH (n = 247), and RAH samples (n = 247), with results showing completely consistent factor structures. The Kaiser–Meyer–Olkin (KMO) values were 0.789, 0.757, and 0.809, respectively, indicating robust exploratory factor analysis results. Without restricting the number of factor sets, the nine sound types were grouped into four factor sets—neighbour sounds (NBS), building-service noise (BSN), outdoor man-made noise (OMN), and household sounds (HS)—with the results shown in the Appendix A, Table A4. The cumulative variance explained of the four factor groups across the three groupings was 77.11%, 76.11%, and 78.95%, respectively (>0.40), indicating the good interpretability of the exploratory factor analysis results. Confirmatory factor analysis (CFA) was further conducted on data from both home activity conditions, with results showing that the Average Variance Extracted (AVE > 0.5), composite reliability (CR > 0.7), and standardised loadings (>0.5) all met the requirements in each model, confirming that the EFA results were validated and had good interpretability, as shown in the Appendix A, Table A5.
Structural equation modelling (SEM) was used to explore the influence mechanisms of SA under the two home activity conditions. Based on the theoretical foundations of soundscapes and indoor soundscape research, two research hypotheses were proposed. For both WAH and RAH, H1 proposes that the perceived prominence of various sounds can influence the affective responses to indoor soundscapes represented by the comfort and content dimensions; H2 proposes that both sound perception prominence and indoor soundscape perception will influence people’s evaluation of SA in specific spaces; and H3 proposes that the influence mechanisms and effect sizes of SA differ between the two home activity conditions. Based on these hypotheses, theoretical models applicable to WAH and RAH were established as shown in Figure 2. SEM was established and calculated using Amos 26.0. The model fit results were evaluated according to the acceptable model fit indices proposed by Dawn [33], including the Chi square/degree of freedom (CMIN/DF < 5), goodness of fit index (GFI ≥ 0.90), and root mean square error of approximation (RMSEA ≤ 0.08).

3. Results

3.1. Indoor Soundscape Perception While Working and Relaxing at Home

3.1.1. Perception of Various Sounds

Figure 3 presents the perceived prominence of different sound types under WAH and RAH conditions. Overall, participants showed a broadly consistent ranking of perceived prominence for various sound sources across both home activity conditions. The most prominently perceived sounds were from people in the home, a finding consistent with studies from Canada [18] and the UK [20,45]. When considering only participants living with others (n = 200), the proportion perceiving sounds from household members as prominent increased further. This was followed by sounds from people in shared/common areas of the residential complex and sounds from upstairs neighbours. Notably, traffic noise no longer occupied a dominant position in perceived prominence, contradicting pre-pandemic research, with other studies reporting similar conclusions [46,47]. This change may be attributed to urban traffic restrictions during lockdown.
Comparison revealed that the perception of natural sounds from outside showed the greatest difference between the two home activity conditions (difference = −13.3%) (all differences in this study were calculated as WAH-RAH), followed by sounds from people in the home (difference = 7.5%) and sounds from household equipment (difference = 3.2%). This indicates that people perceived fewer natural sounds and more sounds from within the home whilst working. However, the perception of elevator noise, traffic noise, and sounds from upstairs neighbours showed opposite trends, with differences of −2.1%, −1.8%, and −1.4%, respectively. This suggests that compared to RAH, people perceived fewer negative sounds from outdoor and neighbourhood spaces during WAH.

3.1.2. Perception of the Soundscape

The Wilcoxon signed-rank test was used to determine whether differences existed in participants’ perception of indoor soundscapes during WAH and RAH, with the results shown in Table 1. Overall, although participants showed different levels of perceived prominence for various home sounds when engaging in different activities, they consistently regarded the indoor soundscape as positive across both activities. This inference is reflected in participants’ consistently high agreement with positive indoor soundscape perception attributes and low agreement with negative attributes. Comparing differences in indoor soundscape perception between the two home activity conditions in the two core dimensions of comfort and content revealed that scores for both dimensions during work were significantly lower than during relaxation, with effect sizes of medium (|r| = 0.33) and medium-to-large (|r| = 0.43), respectively [48]. Among the evaluations of eight soundscape attributes, private was not significant, while full of content and engaging reached medium effect sizes (|r| ≥ 0.3), and the remaining five attributes showed small effect sizes (|r| ≥ 0.1). These differences manifested as participants being more inclined to agree with negative soundscape perception attributes whilst working, with the opposite pattern occurring during relaxation.
Considering that participants were in different rooms during the two types of activities, the same analysis was conducted for participants who worked and relaxed in the same room (n = 82). The results showed the same trends, indicating that differences in soundscape perception were not merely due to room characteristics. Related content can be found in the Appendix A, Table A6.
To eliminate the influence of the room’s characteristics on participants’ indoor soundscape perception, the Wilcoxon signed-rank test was used to explore differences in indoor soundscape perception among participants who worked and relaxed in the same room (n = 82). The results showed similar trends to the full sample, but with a reduced number of soundscape perception attributes showing significant differences. During RAH, participants found rooms more engaging (p < 0.001) and full of content (p < 0.01), with these two soundscape attributes also showing the greatest perceptual differences in the full sample. During WAH, people found rooms more alienating (p < 0.01).
Comparing differences in the comfort and content dimensions of indoor soundscape perception between the two home activity conditions revealed that the scores for both dimensions were lower during work than during relaxation. The same trend was observed when considering only data from participants who worked and relaxed in the same room. This result indicates that people’s recognition of indoor soundscapes during WAH was not as high as during RAH.
Soundscapy was used to analyse the spatial distribution characteristics of the two dimensions of indoor soundscape perception (comfort and content), with the results shown in Figure 4. Overall, whether considering the full sample or only those working and relaxing in the same room, the two types of home activities showed a considerable overlap in ratings on both indoor soundscape perception dimensions, indicating that people’s perception of residential indoor soundscapes maintains consistency even under different activity conditions. The overlapping area was predominantly concentrated in the first quadrant, suggesting that participants’ evaluation of indoor soundscapes was generally positive, consistent with participants’ soundscape perception evaluation results. During RAH, people’s perception of indoor soundscapes was more broadly distributed across the positive dimensions of comfort and content. This indicates that people considered existing indoor soundscapes suitable for relaxing at home. Similarly, comfort ratings during WAH were also relatively high, whilst distribution along the content dimension axis was relatively uniform.

3.1.3. Factors Influencing Indoor Soundscape Perception

Spearman correlation analysis was used to explore the associations between the comfort and content of indoor soundscapes and the perceived prominence of various sound types under both home activity conditions, with the results shown in Table 2. The findings indicated a general consistency in how comfort correlated with various sounds across the two states (WAH and RAH), though specific coefficients differed; however, correlations involving content showed more variability between the activity conditions. Specifically, during both WAH and RAH, comfort was significantly negatively correlated with all sounds except outdoor natural sounds and household sounds. For the content dimension during WAH, it was significantly negatively correlated only with outdoor man-made noise, household equipment sounds, and sounds from upstairs neighbours. All significant correlation variables in the aforementioned analysis demonstrated weak correlations (|r| < 0.3), suggesting that the perception of individual sounds is insufficient to describe the association between participants’ acoustic environments and soundscape perception.
During RAH, the content dimension exhibited a broader range of associations, being significantly negatively correlated with more than half of all sound types and, notably, significantly positively correlated with natural sounds from outside. Taken together, these correlation analysis results validate the first hypothesis of this study (H1), namely that the perceived prominence of sounds is associated with affective responses to indoor soundscapes, as represented by the comfort and content dimensions.
Further Spearman correlation analysis was conducted to clarify the associations between indoor soundscape perception and housing and individual characteristics, with the results shown in Table 3. Under both home activity conditions, housing area was significantly positively correlated with comfort. Both the residential area and the number of co-residents showed significant positive correlations with RAH-content, whilst the residential floor level exhibited a significant negative correlation with WAH-content. However, the property’s location within the city showed no significant correlations with any perceived sound salience or soundscape perception, which may be attributed to strict lockdown conditions obscuring the effects of locational differences. Regarding individual characteristics, noise sensitivity scores were significantly positively correlated with the perceived prominence of half or more sound types under both home activity conditions, indicating that participants with high noise sensitivity were more susceptible to environmental noise. Participants’ education level was significantly negatively correlated only with WAH-content. Participants’ age was significantly positively correlated with WAH-comfort. Similarly, all significantly correlated variables exhibited weak correlations (|r| < 0.3).

3.2. Factors Influencing SA While Working and Relaxing at Home

3.2.1. SA and Its Related Factors

Participants’ evaluation of SA during WAH and RAH is shown in the Appendix A, Table A7. Overall, participants evaluated SA more positively during relaxation than during work. Specifically, 75.3% and 82.6% of participants, respectively, considered their rooms relatively suitable for work and relaxation. The Wilcoxon signed-rank test was used to examine differences in SA ratings when conducting these two activities at home. The results showed that the differences in SA evaluation between the two home activity conditions were significant, with SA ratings reported during work being lower than during relaxation (grouped-median difference = −0.22, p < 0.001).
Spearman correlation analysis was used to explore the associations between SA evaluation and indoor soundscape perception, housing, and individual characteristics under both home activity conditions, with the results shown in Table 4. During both WAH and RAH, SA showed varying degrees of correlation with more than half of the perceived sound types. Further analysis revealed that SA exhibited significant positive correlations with both comfort and content, with these relationships being more pronounced during relaxation at home, as evidenced by higher correlation coefficients and smaller p-values. SA demonstrated a strong correlation with RAH-comfort (r = 0.54, p < 0.01) and moderate correlations with WAH-comfort and RAH-content (r = 0.44/0.41, p < 0.01). This result confirms the second research hypothesis, namely that perceived sound prominence and soundscape perception are both associated with people’s evaluation of soundscape appropriateness in specific spaces. Among housing characteristics, only housing area was significantly positively correlated with SA during RAH. Regarding individual characteristics, SA during WAH was significantly positively correlated with both education level and age, and significantly negatively correlated with noise sensitivity. The correlation analysis provided a theoretical basis for incorporating control variables into subsequent SEM, with significantly correlated variables being included in the two SEM models, respectively.

3.2.2. Structural Equation Modelling

To explore the influence mechanisms of SA, separate SEM models were established for the two home activity conditions. Based on the exploratory factor analysis results, measurement models were constructed for both home conditions and confirmed to be reliable and valid, with the results presented in the Appendix A, Table A5. SEM was then established based on the measurement models and theoretical hypotheses. After removing paths with p > 0.05, the final stable SEM models for SA under both home conditions are shown in Figure 5. The fit indices for the WAH model were CMIN/DF = 1.982 (<5), GFI = 0.971 (>0.90), and RMSEA = 0.063 (<0.08), whilst the fit indices for the RAH model were CMIN/DF = 2.870 (<5), GFI = 0.960 (>0.90), and RMSEA = 0.087 (<0.10). These models demonstrated a good goodness of fit and interpretability. According to Cohen’s guidelines [48], standardised path coefficients β < 0.1 represent small effects, β values between 0.1 and 0.3 represent medium effects, and values of β > 0.3 represent large effects.
In the WAH model (Figure 5a), perceived outdoor man-made noise, building-service noise, and neighbour sounds were associated with SA evaluation. SA was primarily subject to direct negative effects from neighbour sounds (β = −0.17, medium effect). Additionally, outdoor man-made noise and building-service noise showed significant negative associations with the comfort dimension of indoor soundscape perception (β = −0.25 and −0.21, respectively, medium effects), which indirectly related to SA evaluation. Furthermore, participants with higher education levels were more likely to evaluate SA more positively (β = 0.17, medium effect). These significant factors collectively contributed to an R2 value of 0.26.
In the RAH model (Figure 5b), perceived outdoor man-made noise, neighbour sounds, and nature sounds were associated with SA evaluation. SA was primarily subject to direct negative effects from outdoor man-made noise (β = −0.19, medium effect) and the mediating effect of the comfort dimension of indoor soundscape perception. Comfort was mainly negatively associated with outdoor man-made noise and neighbour sounds (β = −0.22 and −0.28, respectively, medium effects), whilst positively associated with perceived nature sounds, which in turn related to SA evaluation. These significant factors collectively contributed to an R2 value of 0.33.
Overall, during both WAH and RAH, SA was associated with more comfortable and quieter acoustic environments, but differences existed in the specific factors and effect sizes influencing SA. The comfort dimension of indoor soundscape perception played a significant mediating role in enhancing SA evaluation under both home activity conditions (WAH/RAH: β = 0.41/0.48, large effects). Under both conditions, SA was negatively associated with outdoor man-made noise and neighbour sounds, particularly the direct negative association with neighbour sounds. Additionally, SA during WAH was also negatively associated with building-service noise, whilst nature sounds represented a positive factor associated with SA during RAH. Regardless of home activities, household sounds showed no association with soundscape perception and SA.

3.2.3. Total Effect Size

To determine the impact of different sound types on SA, the total effect sizes for each sound type were calculated using path coefficients from the SEM models for WAH and RAH. The calculation method involved multiplying all significant path coefficients from the target variable to SA to obtain direct and indirect effect sizes separately, then summing these to obtain the total effect size. Notably, all effect sizes mentioned in the study were standardised. The total effect size can be used to measure the magnitude of a target variable’s impact on the dependent variable. Total effect size = 0.02 indicates a small effect, 0.15 indicates a medium effect, and 0.35 indicates a large effect [48].
The calculation results are shown in Table 5. Outdoor man-made noise, building-service noise, and neighbour sounds showed negative associations with SA during WAH, whilst outdoor man-made noise and neighbour sounds similarly affected SA during RAH. This represents consistency in people’s perception of indoor soundscapes in residential environments, highlighting issues requiring focused attention in residential indoor soundscape design. During WAH, neighbour sounds had the largest negative impact on SA (direct effect size = −0.17; total effect size = −0.17), representing a medium effect, whilst outdoor anthropogenic noise and building-service noise also negatively affected SA evaluation. During RAH, neighbour sounds similarly had the largest negative impact on SA (total effect size = −0.32) with a large effect. This influence comprised both direct effects and indirect effects mediated by comfort (direct effect size = −0.19; indirect effect size = −0.13). Outdoor anthropogenic noise also had an indirect negative impact on SA (indirect effect size = −0.11; total effect size = −0.11).
Further exploration of the effects of various sound types on SA (see Table 5) revealed that sounds from next-door neighbours and sounds from upstairs neighbours had the greatest impact on SA under both home conditions. During WAH, the total effect sizes were −0.14 and −0.13, respectively, representing medium effects, whilst during RAH, the total effect sizes were −0.27 and −0.24, respectively, representing medium-to-large effects. This was followed by sounds from people in shared/common areas of the residential complex, with total effect size = −0.10 during WAH and total effect size = −0.20 during RAH, representing medium-to-large effects. This suggests that residential soundscape design should prioritise the consideration and mitigation of neighbour sound interference. However, even during lockdown when urban noise levels decreased, under home activity conditions, people still generally perceived that traffic noise and other external anthropogenic noise would result in relatively negative SA evaluations, with total effect sizes of −0.07 and −0.09, respectively, during WAH, and −0.09 for both during RAH. Additionally, during WAH, plumbing sounds also negatively affected SA (total effect size = −0.08). During RAH, natural sounds had an indirect positive impact on SA evaluation (total effect size = 0.13), representing a medium effect.

4. Discussion

4.1. Difference in Perception of Indoor Soundscape When Working and Relaxing

This study initially explored the perception of various sounds within residential spaces during WAH and RAH. The results indicated that during the survey period, people generally perceived notable sounds from within the home and from neighbours, regardless of whether they were working or relaxing. Similar findings have been reported in other recent studies, which observed that during lockdown, people’s perception of sounds originating within buildings exceeded their perception of external sounds. These studies identified neighbourhood sounds and mechanical noises from common areas as primary sources of annoyance and dissatisfaction [18,19,49]. This may be because increased home activities during lockdown led to higher occurrence frequencies and sound pressure levels of related sounds, thereby intensifying people’s perception of these sounds. Additionally, the significant reduction in external environmental noise (particularly traffic noise) during lockdown may have heightened residents’ sensitivity to internal and neighbourhood sounds beyond typical levels experienced in non-lockdown urban soundscapes. The absence of conventional masking effects from external sound sources likely made internal sounds more noticeable and potentially more irritating. Research has shown that perceiving more impact sounds and equipment sounds can trigger adverse emotional and physiological responses [50], suggesting the need for attention to acoustic design that minimises such sounds in residences. Simultaneously, lockdown made cities quieter, leading to varying degrees of reduced perception of outdoor man-made noise, consistent with previous research findings [45,51]. This also aligns with our expectations for future optimised urban acoustic environments.
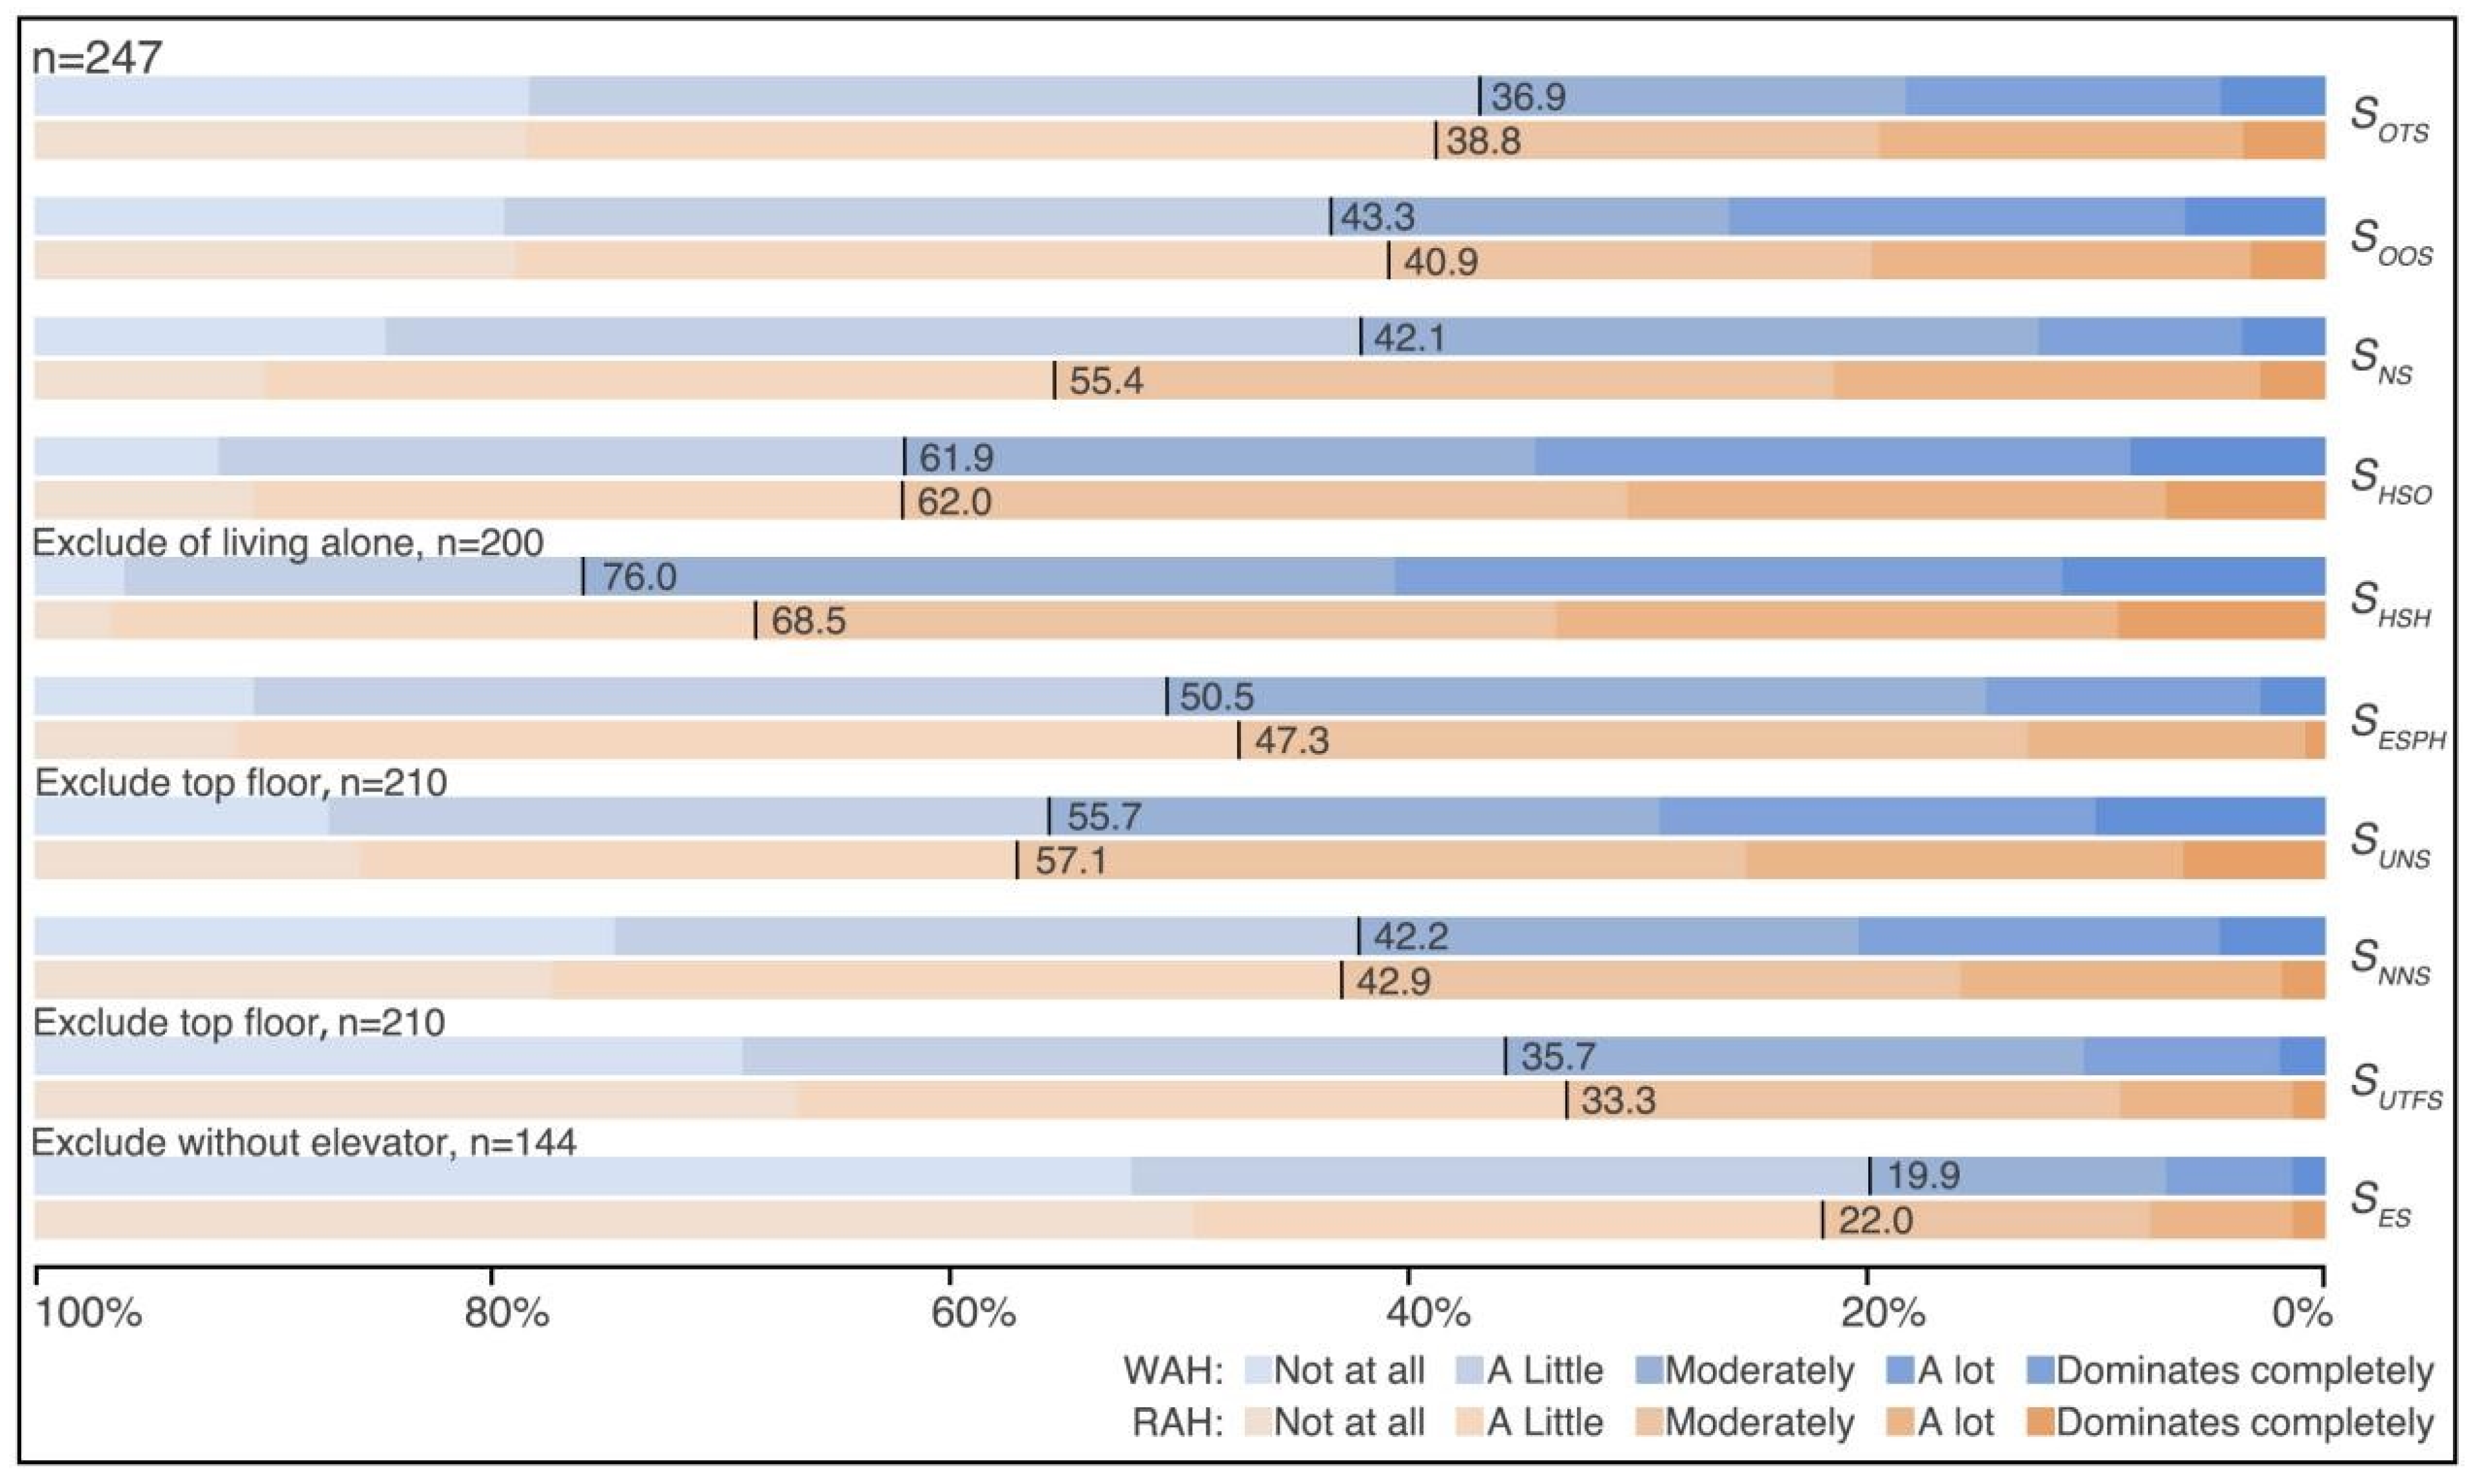
Compared to RAH, people showed greater sensitivity to sounds from within the home during WAH, including both human voices and mechanical noises. Conversely, the perception of natural sounds, which are known to promote restoration, was notably lower during work activities. This may be attributed to the need for sustained concentration and high acoustic environmental requirements during work, leading to a heightened perception of distracting sounds and reduced capacity to perceive positive restorative sounds [52,53]. Furthermore, the unique psychological context of lockdown—including potential stress, restricted movement, and altered work patterns—may have profoundly influenced participants’ perceptual thresholds and emotional responses, extending far beyond a simple “forced to stay home” effect. During RAH, people typically felt more relaxed and were less affected by their surroundings, enabling the better perception of positive aspects of the acoustic environment. However, the perception of elevator sounds, external traffic sounds, and upstairs neighbour sounds showed opposite trends. A possible explanation is that people engaged in WAH actively selected rooms with better sound insulation, such as bedrooms or studies, whereas relaxation activities were conducted across a broader range of rooms. Another possibility is that when people are in a state of mental concentration, they are less likely to perceive these lower-frequency sounds.
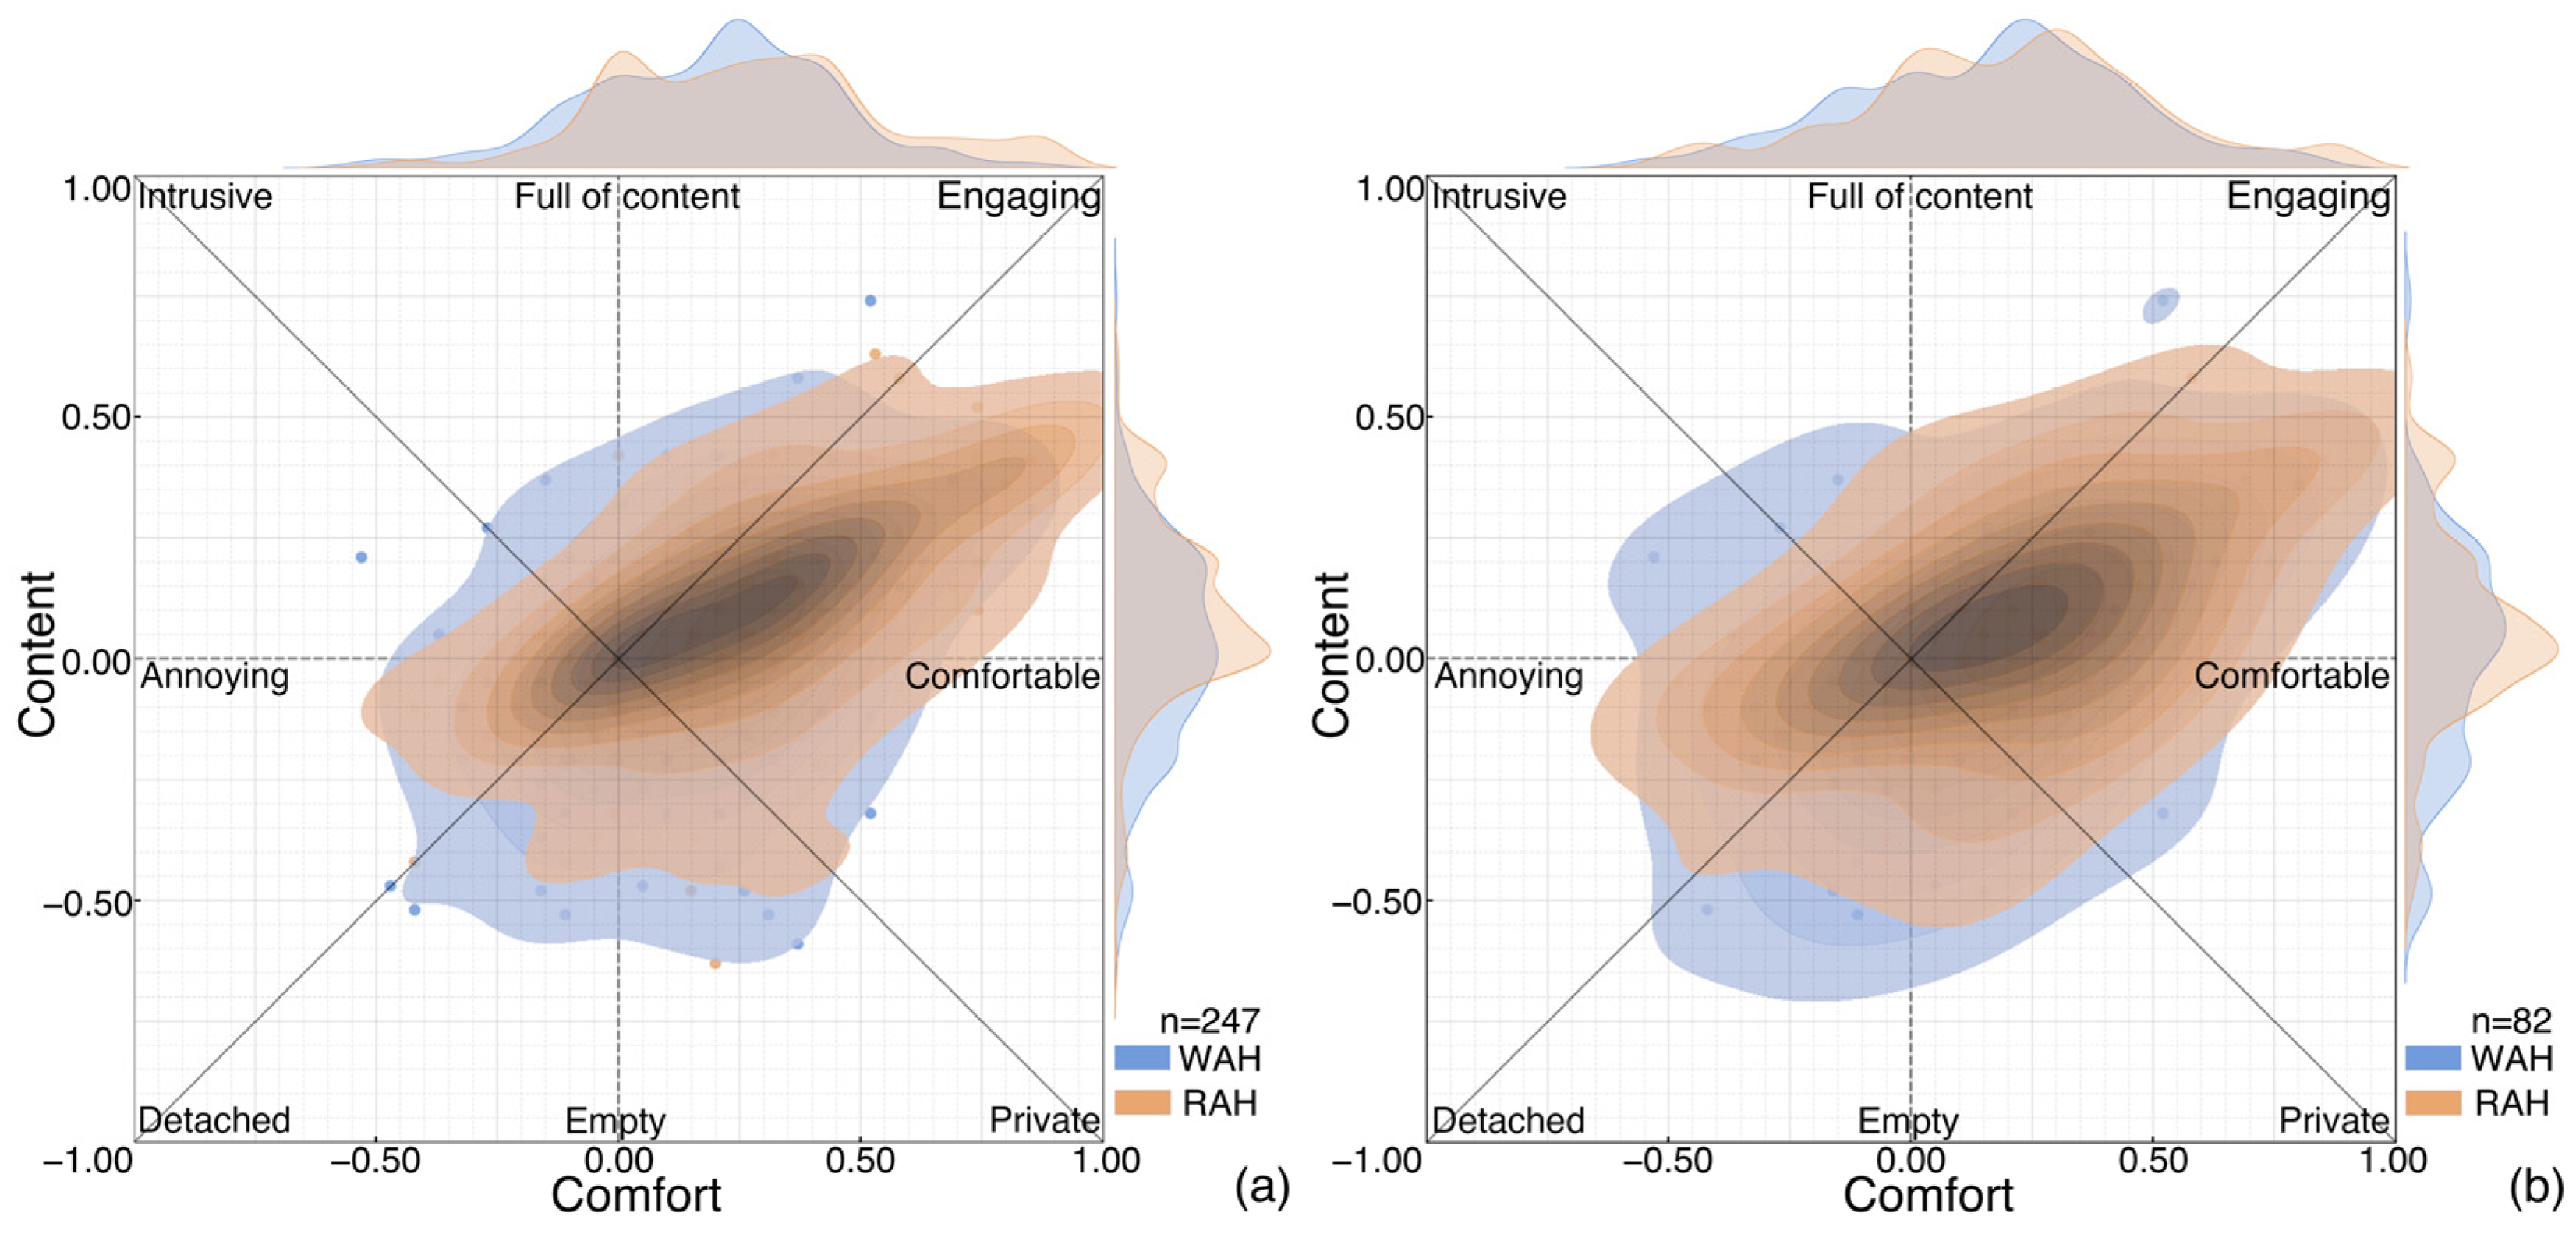
Significant differences also existed in indoor soundscape perception between the two home activity conditions. During RAH, participants generally considered the indoor soundscape more “engaging” and “full of content”, whilst during WAH, the indoor soundscape was perceived as more “detached”. Additionally, evaluations of both comfort and content during WAH were significantly lower than during RAH, consistent with UK research findings [20]. This perceptual difference may arise because people typically engage in entertainment activities or interact with family members whilst relaxing, experiencing more relaxed emotions without highly concentrated attention, and thus perceiving the indoor soundscape more positively at such times. Other studies have also shown that experiencing medium-to-high sound pressure level disturbances during work increases noise annoyance [54,55], subsequently leading to negative evaluations of acoustic environment comfort and satisfaction [56,57]. This suggests the need for attention to soundscape creation in home office spaces. Moreover, although people perceived various notable interfering sounds under both home activity conditions, ratings for indoor soundscape perception comfort and content remained relatively positive. This might be because people had never experienced such quiet acoustic environments as during lockdown. Consequently, even whilst perceiving substantial interfering sounds from neighbouring areas and within homes, they considered the overall indoor acoustic environment improved, leading to an overestimation of indoor soundscape quality. However, this “improvement” is relative to the typically noisy environment before lockdown and may not reflect the intrinsically optimal state of WAH soundscapes.

4.2. Individual Differences, Room Selection, and the Psycho-Social Context of Lockdown

Beyond the general trends observed, the results are influenced by individual, housing, and contextual factors that warrant deeper discussion. Our correlation analysis revealed that individual characteristics significantly shape soundscape perception. For example, participants with higher noise sensitivity reported a greater prominence of various sounds, suggesting they are a particularly vulnerable group in acoustically suboptimal home environments. Conversely, older participants reported higher comfort during work-from-home (WAH) activities, which could be linked to different living arrangements or a generational difference in tolerance or expectations for the home environment.
Housing characteristics also played a clear role. A larger housing area was correlated with greater comfort and, during relaxing-at-home (RAH) activities, with a higher rating of “content”. This is likely due to greater physical distance from internal sound sources (e.g., cohabitants, household equipment) and a reduced sense of being confined. The strategic choice of rooms—typically bedrooms or studies for WAH (46.2% and 32.8%, respectively) and living rooms or bedrooms for RAH—is likely a behavioural adaptation to find acoustically suitable spaces. However, this introduces a confounding variable. Our sub-analysis of participants who used the same room for both activities (n = 82) helps to isolate the effect of the activity itself. The fact that significant perceptual differences persisted—with the room still perceived as less “engaging” and more “detached” during WAH—strengthens our core finding that the cognitive demands of work fundamentally alter soundscape requirements, independent of the physical space.
Furthermore, the impact of the COVID-19 lockdown extends beyond a mere reduction in external traffic noise. The unique psychological context—characterised by enforced confinement, potential anxiety, and the blurring of work–life boundaries—likely heightened sensitivity to the acoustic environment. The absence of typical external masking noise from traffic likely made internal building sounds (e.g., neighbours, plumbing) more psychoacoustically prominent and potentially more irritating. For families or cohabiting individuals (81% of our sample lived with others), the home transformed into a shared, multi-functional space for work, school, and leisure. This increased density of activity likely explains why sounds from people within the home were the most prominently perceived sound source and why they became even more noticeable during the high concentration demands of WAH (+7.5% difference). Therefore, the negative evaluations of the soundscape during WAH may not only reflect the unsuitability of the sounds for work but also the psychological stress of having one’s workspace continuously permeated by domestic life.

4.3. Factors Affecting Soundscape Appropriateness

Overall, SA ratings during work were significantly lower than during relaxation. In both cases, positive SA evaluations were significantly associated with more comfortable soundscape perception. This relationship was also reflected in participants’ general sound perception results: those experiencing less interference from indoor and outdoor environmental sounds correspondingly considered their room’s acoustic environment more appropriate. This aligns with previous findings that the perceived quality of indoor soundscapes is highly dependent on the acoustic environmental conditions of outdoor spaces [58].
SEM revealed relationships between indoor soundscape perception and SA under both home activity conditions. Certain commonalities existed in indoor soundscape perception and its associations across both home activities. During both work and relaxation, the perception of outdoor man-made noise and neighbour sounds was negatively associated with SA evaluation, with neighbour sounds showing direct effects and the largest total effect sizes on SA. This finding may be explained by China’s distinctive urban and housing structures. Most workers in China reside in cities, necessitating residential designs that increasingly adopt higher-density layouts, taller buildings, and more compact internal configurations to accommodate larger populations. This study presented similar trends, with nearly 90% of participants living in urban multi-storey or high-rise residences. In such high-density housing, increased home activities inevitably lead to greater inter-neighbour interference, making residents more susceptible to perceiving neighbourhood-related sounds. Other studies have reported similar conclusions, finding higher noise complaint rates in cities with higher population densities [33,59,60,61]. They showed that as crowd density and the perception of human voices increase, the overall soundscape assessment initially improves then declines [62,63]. This occurs because simultaneous exposure to indoor and outdoor human voices creates perceptual crowding in soundscapes, thereby limiting positive soundscape experiences and negatively influencing SA evaluation [33]. These studies collectively emphasise the importance of improving residential neighbourhood noise transmission. Furthermore, even though urban noise levels were relatively reduced during the survey period, outdoor man-made noise was still identified as a common negative factor affecting soundscape perception and SA during home activities. This reconfirms the persistent adverse effects of urban traffic noise and other external noise types, highlighting the necessity and urgency of urban noise management. However, critical evaluation is needed regarding how the unique acoustic environment created by lockdown—quieter externally but potentially noisier internally due to concentrated household activities—limits the direct applicability of these findings to “normal” WAH scenarios. For example, under non-lockdown conditions where traffic noise typically dominates, the relative effects of neighbourhood noise versus outdoor noise may change significantly. The neighbourhood sound effects observed during lockdown may have been amplified due to reduced external masking sounds, or their nature of influence may differ when regular external noise also constitutes work interference.
Additionally, building-service noise showed negative associations with SA during WAH, an association not significant in the RAH model. This difference may be because people actively selected relatively quiet environments when working (46.2% worked in bedrooms, 32.8% in studies), thus perceiving less elevator noise and plumbing sounds compared to RAH. Despite this, the perception of these sounds still had certain adverse associations with SA evaluation during work. Conversely, during RAH, the perception of natural sounds positively influenced comfort and subsequently SA, whilst natural sounds showed no significant associations during WAH. The data indicated that the perception of natural sounds showed the greatest difference between home activity conditions (difference = −13.3%, WAH-RAH), suggesting that directed attention during work made already less prominent externally transmitted natural sounds even less noticeable.
The study also found that the comfort dimension of indoor soundscapes was closely associated with SA, consistent with Lu et al.’s research [64]. Sounds indirectly influenced SA through comfort perception in both activities, with this association being particularly evident during RAH. In contrast, content showed no statistically significant association with SA. This may be attributed to the existing residential soundscapes being primarily designed for rest activities, making them more suitable for enhancing SA levels during relaxation through similar optimisation measures. This also emphasises the importance of focusing on constructing active soundscapes to improve WAH experiences.
Overall, WAH may lead to more negative soundscape perception, subsequently affecting SA evaluation. This effect may partly result from lockdown measures, but it also reflects a fundamental phenomenon associated with working from home: the number of people at home and the duration spent at home objectively increased, correspondingly increasing neighbourhood activity sounds and equipment noise from common areas. The research findings emphasise that residential design, as part of urban acoustic environment improvement, needs greater focus on mitigating noise interference from neighbours. Although the lockdown context may have amplified neighbourhood noise perception, its importance as a stressor in high-density living environments remains a key insight for residential design, independent of WAH trends.
As working from home becomes increasingly prevalent, future residential design urgently needs to integrate flexible spaces to accommodate office and learning needs. This is particularly important for small dwellings or multi-person households. Enhancing overall residential acoustic quality is also crucial: this can be achieved through strengthening wall sound insulation, properly addressing acoustic weak points such as elevator shafts and pipes, and clearly separating active and quiet zones in spatial layouts, thereby reducing sound interference and creating superior acoustic conditions for working. For residences with dedicated work areas (typically larger dwellings—in this study, 76% of respondents with studies/workrooms had residential areas exceeding 80 square metres), the design focus should concentrate on enhancing the acoustic characteristics of these spaces, creating quieter, more efficient work atmospheres. Looking forward, the core of soundscape and interior design research lies in creating ideal indoor soundscapes for residences whilst fully considering work scenario requirements. Therefore, creating dedicated, undisturbed spaces for efficient WAH and constructing tranquil, controllable soundscapes is essential.

5. Conclusions

This study investigated the differences in indoor soundscape perception and soundscape appropriateness (SA) between working and relaxing at home, drawing on survey data from 247 Chinese participants during a period of lockdown. Our research reveals a fundamental conflict between the acoustic requirements of these two activities within the same residential setting. The findings demonstrate that working from home (WAH) imposes a more demanding acoustic context than relaxing at home (RAH). Participants perceived their indoor soundscape as significantly less comfortable and less full of content during work, with a reduced perception of beneficial natural sounds and a heightened awareness of distracting household sounds.
Our structural equation models identified distinct mechanisms influencing SA for each activity. Whilst the perceptual dimension of “comfort” was a significant positive mediator for SA in both scenarios, its effect was stronger during relaxation. Critically, the sources of disruption differed. During WAH, outdoor man-made noise, building-service noise, and neighbour sounds all negatively affected SA. In contrast, during RAH, only neighbour sounds and outdoor man-made noise were significant disruptors, whilst natural sounds emerged as a positive factor. In both contexts, neighbour sounds exerted the most substantial negative impact on SA, highlighting a critical vulnerability in high-density residential buildings. These results confirm that existing residential acoustic environments, traditionally designed for rest, are often ill-equipped to support the cognitive demands of focused work.
These findings carry significant practical implications for residential acoustic design, particularly as hybrid work models become a permanent feature of modern life. To address the pervasive issue of neighbour noise, architects and developers should prioritise acoustic performance beyond minimum building code requirements, specifying enhanced sound insulation for party walls and floors, with a particular focus on mitigating impact noise. For new builds and refurbishments, the creation of “acoustic zones” within dwellings through strategic layout planning—separating quiet work areas from noisier domestic activity zones—could prove highly effective. Furthermore, for dedicated home office spaces, the introduction of low-level, broadband sound-masking systems, similar to those used in commercial offices, could be a viable strategy to obscure distracting intermittent sounds and improve concentration. Conversely, to support relaxation, designs should aim to improve residents’ connection to positive outdoor sounds, such as through well-placed windows and balconies, or even facilitate the use of curated natural soundscapes via smart home systems.
Given that the survey was conducted during the exceptional period of strict lockdown controls, participants’ experiences were likely influenced by mandatory home isolation, including potential changes in work demands and the unique psychological atmosphere brought about by lockdown. Simultaneously, pandemic control measures and changes in urban activity patterns (such as reduced traffic and increased home activities) may have amplified certain sounds whilst attenuating others, potentially biasing people’s assessments of sound types and soundscape characteristics. However, after considering potential biases from the atypical data collection environment, paired comparisons still demonstrated that soundscape perception and SA evaluations during working at home (WAH) were less positive than during regular home activities (RAH), revealing perceptual differences between these two home activities. Therefore, whilst the research conclusions require interpretation within the specific context of the study, they still provide valuable evidence-based insights for developing residential indoor soundscapes more suitable for working from home. Additionally, we did not enquire about participants’ previous home-working experience in the survey, which may have affected their indoor soundscape perception outcomes. However, large-scale WAH in China was precisely triggered and intensified by COVID-19-induced lockdowns, with no prior data indicating substantial home-working populations. Given that our participant selection criteria required at least 30 days of home-working experience, we believe that 30 days of home working would likely establish relatively stable cognition of indoor environments and soundscape perception. Under these circumstances, participants’ soundscape perception conclusions can still provide valuable guidance for residential indoor soundscape design.
Evidently, the current state of residential indoor soundscapes during this period could not meet the needs of people engaging in home working and similar home-based focused activities, necessitating further research to establish indoor soundscapes suitable for home activities requiring concentrated attention. Ideally, future research should incorporate data from non-lockdown periods.

Author Contributions

J.L.: Investigation, formal analysis, writing—original draft. Y.H.: Methodology, writing—review and editing, supervision. R.H.: Formal analysis. Y.Z.: Methodology, writing—review and editing, supervision, funding acquisition. J.K.: Conceptualisation, writing—review and editing, supervision, funding acquisition. All authors have read and agreed to the published version of the manuscript.

Funding

J.L. acknowledges the Educational Department of Liaoning Province Distinguished Doctoral Student Project (2221013003). Y.Z. and J.K. acknowledge the European Research Council (ERC) Advanced Grant (No. 740696).

Data Availability Statement

The original data presented in the study are openly available in Mendeley Data at DOI: 10.17632/dkm73c7s6z.1.

Acknowledgments

During the preparation of this work the authors used ChatGPT-4o (2024-11-20) in order to proofread for minor grammar and expression imperfections. After using this tool, the authors reviewed and edited the content as needed and take full responsibility for the content of the publication.

Conflicts of Interest

The authors declare no conflicts of interest.

Abbreviations

The following abbreviations are used in this manuscript:
WAHWorking at home
RAHRelaxing at home
SASoundscape appropriateness
EFAExploratory factor analysis
CFAConfirmatory factor analysis
CMIN/DFChi square/degree of freedom
GFIGoodness of Fit index
RMSEARoot mean square error of approximation

Appendix A

Table A1. Questionnaire on perception of indoor soundscape while working and relaxing at home in China.
IDQuestionScaleLabel
1. Questions related to working and relaxing at home in the last 30 days
Q1Please indicate how much each of these activities is relevant to your work from home? (Q1.1 Online meetings, Telephone conversations; Q1.2 Thinking (e.g., reading, writing, calculation); Q1.3 Creating (e.g., design, planning); Q1.4 Operating (e.g., fabrication, assembly); Q1.5 Online learning; Q1.6 Online teaching)LikertNot at all; A little; Moderately; A lot; Really important; Not applicable
Q2Now please focus on one room that is relevant for your working activity at home.Studio; Living room; Dining room; Bedroom
Q3To what extent do you hear the following types of sounds while working at home? (Q4.1 Traffic noise; Q4.2 Other external man-made noise; Q4.3 Natural sounds from outside; Q4.4 Sounds from people in shared/common areas of the residential complex; Q4.5 Sounds from people in your home; Q4.6 Sounds from household equipment; Q4.7 Sounds from upstairs neighbours; Q4.8 Sounds from next-door neighbours; Q4.9 Plumbing sounds; Q4.10 Elevator noise)LikertNot at all; A little; Moderately; A lot; Dominates completely
Q4To what extent is your present surrounding soundscape appropriate to working?LikertNot at all; Slightly; Moderately; Very; Perfectly
Q5For each of the 8 scales below, to what extent do you agree or disagree that they apply to the present surrounding sound environment while you are working at home? (Q6.1 Comfortable; Q6.2 Full of content; Q6.3 Private, controlled; Q6.4 Engaging; Q6.5 Annoying; Q6.6 Empty; Q6.7 Intrusive, uncontrolled; Q6.8 Detached)LikertStrongly disagree; Disagree; Neutral attitude; Agree; Strongly agree
Q6Now please focus on rooms that are relevant for your relaxing activities at home.Studio; Living room; Dining room; Bedroom; Kitchen; Bathroom
Q7To what extent do you hear the following types of sounds while relaxing at home? (Q9.1 Traffic noise; Q9.2 Other external man-made noise; Q9.3 Natural sounds from outside; Q9.4 Sounds from people in shared/common areas of the residential complex; Q9.5 Sounds from people in your home; Q9.6 Sounds from household equipment; Q9.7 Sounds from upstairs neighbours; Q9.8 Sounds from next-door neighbours; Q9.9 Plumbing sounds; Q9.10 Elevator noise)LikertNot at all; A little; Moderately; A lot; Dominates completely
Q8To what extent is your present surrounding soundscape appropriate to relaxing?LikertNot at all; Slightly; Moderately; Very; Perfectly
Q9For each of the 8 scales below, to what extent do you agree or disagree that they apply to the present surrounding sound environment while you are relaxing at home? (Q10.1 Comfortable; Q10.2 Full of content; Q10.3 Private, controlled; Q10.4 Engaging; Q10.5 Annoying; Q10.6 Empty; Q10.7 Intrusive, uncontrolled; Q.8 Detached)LikertStrongly disagree; Disagree; Neutral attitude; Agree; Strongly agree
2. The housing features and the urban context
Q10What is the size of your house?<40 m2 ≤ 40–80 m2; 80–120 m2; >120 m2
Q11What type of house do you live in?Apartment block; High-density residential; Villa
Q12Including yourself, how many people live in your home?1; 2; 3; 4; 5+
Q13On which floor do you live?Text field
Q14Is there an elevator in the building of your house?Yes, it has; No, it hasn’t
Q15How would you describe the area where you live? City centre; Away from the city centre; Edge of the city; Suburban
3. Person-related characteristics
Q16Please state to what extent you disagree/agree with the following sentences: (Q17.1 I am sensitive to noise; Q17.2 I find it difficult to relax in a place that’s noisy; Q17.3 I get mad at people who make noise that keeps me from falling asleep or getting work done; Q17.4 I get annoyed when my neighbours are noisy; Q17.5 I get used to most noises without much difficultyLikertTotally disagree; Disagree; Slightly disagree; Neither agree nor disagree; Slightly agree; Agree; Totally agree
Q17What is your gender?Male; Female
Q18How old are you?Text field
Q19What is your educational background?Lower secondary and below; Senior secondary level; College level; Graduate level and above
Q20How long do you work at home per day?≤2 h; 2–4 h; 4–6 h; 6–8 h; >8 h
Table A2. Individual and housing characteristics of participants.
QuestionChoice%QuestionChoice%
Activities relevant to WAHOnline meetings78.1Size of the house≤40 m216.6
Thinking work69.240–80 m223.9
Creative work57.980–120 m235.6
Operating work31.6≥120 m223.9
Online learning62.8Availability of elevatorsYes59.1
Online teaching45.8No40.9
Working roomStudio32.8Location of house within the cityCity centre25.1
Living room18.6Away from the city centre41.3
Dining room2.4Edge of the city23.5
Bedroom46.2Suburban10.1
Relaxing roomsStudio14.6Number of people living together119.0
Living room42.9227.1
Dining room7.3333.2
Bedroom78.5411.3
Kitchen5.35+9.3
Bathroom7.3Type of the houseApartment block12.1
SexMale40.9High-density residential85.9
Female59.1Villa2.0
EducationLower secondary and below1.6Average working hours per day≤2 h15.8
Senior secondary level4.52–4 h19.8
College level43.74–6 h17.0
Graduate level and above50.26–8 h20.6
---≥8 h26.7
Table A3. Reliability and validity tests.
ParameterWAHRAH
ReliabilityCronbach’s α (>0.7)0.7300.736
Construct ValidityKMO (>0.6)PPVST0.7640.819
Soundscape perception0.6700.787
Noise Sensitive0.841
PPVST = perceived prominence of various sound types.
Table A4. Composition, description, and interpretation of EFA results.
ItemFactor LoadingCumulative Explained Variance
Factor 1Factor 2Factor 3Factor 4ALL SampleWAH
Sample
RAH
Sample
Neighbour Sounds 1 (SNeigh)Sounds from upstairs neighbours (SUN)0.782 23.26%22.14%23.05%
Sounds from people in shared/common areas of the residential complex (SPSAR)0.774
Sounds from next-door neighbours (SNN)0.745
Building-Service Noise 2 (NBuildS)Elevator noise (SEN) 0.861 42.46%41.1343.16
Plumbing sounds (SPS) 0.746
Outdoor Man-made Noise 3 (NOutM)Traffic noise (STN) 0.891 61.55%59.98%63.15%
Other external man-made noise (SOEMN) 0.863
Household Sounds 4 (SHouse)Sounds from people in your home (SPYH) 0.88877.11%76.11%78.95
Sounds from household equipment (SHE) 0.694
Natural Sounds 5 (SNat)Natural sounds from outside-------
1 Neighbour Sounds primarily consists of sounds generated by human activity from adjacent (upstairs, next-door) residential units or people immediately outside the dwelling but related to the residential complex. 2 Building-Service Noise represents sounds produced by the building’s infrastructure or shared utilities, such as elevators and plumbing systems. 3 Outdoor Man-made Noise comprises sounds originating from environments outside the residential building itself, with traffic being the most prominent. 4 Household Sounds includes sounds generated by people and their activities or equipment within the respondent’s own dwelling. 5 Natural Sounds encompasses sounds originating from the natural environment external to the building.
Table A5. Reliability analysis of observation model under WAH and RAH conditions.
ConstructItemStandardised LoadingAVECR
WAHOutdoor Man-made NoiseSOEMN0.8120.6150.7614
STN0.755
Neighbour SoundsSPSAR0.5710.52540.7647
SNN0.824
SUN0.757
Household SoundsSHE0.8680.51230.664
SPYH0.520
Building-Service NoiseSEN0.5770.57310.7192
SPS0.902
RAHOutdoor Man-made NoiseSOEMN0.8590.69100.8171
STN0.803
Neighbour SoundsSPSAR0.6210.55380.786
SNN0.831
SUN0.765
Household SoundsSHE0.8700.52340.6755
SPYH0.539
Building-Service NoiseSEN0.6290.62840.7654
SPS0.928
Table A6. Differences (WAH-RAH) in the perception of the indoor soundscape while working and relaxing at home based on the Wilcoxon signed-rank test (only in the same room, n = 82).
Grouped MedianZp-Valuer
WAHRAHDifference
comfortable3.683.74−0.08−0.620.54−0.07
full of content3.213.50−0.28−2.490.01−0.27
private3.703.610.03−0.360.72−0.04
engaging2.693.19−0.39−4.280.00−0.47
annoying2.442.400.03−0.770.44−0.08
empty2.702.630.06−1.010.31−0.11
intrusive2.682.740.00−0.340.74−0.04
detached2.852.720.17−2.540.01−0.28
comfort0.190.22−0.03−2.010.04−0.22
content0.040.05−0.05−3.700.00−0.41
Table A7. SA evaluations during WAH and RAH.
WAHRAH
n%n%
Perfectly42176425.9
Very6325.55522.3
Moderately8132.88534.4
Slightly4819.43514.2
Not at all135.383.2

References

  1. Okawara, M.; Ishimaru, T.; Igarashi, Y.; Matsugaki, R.; Mafune, K.; Nagata, T.; Tsuji, M.; Ogami, A.; Fujino, Y. Health and work performance consequences of working from home environment: A nationwide prospective cohort study in Japan. J. Occup. Environ. Med. 2023, 65, 277–283. [Google Scholar] [CrossRef] [PubMed]
  2. Sasaki, N.; Kuroda, R.; Mikami, Y.; Tsuno, K.; Imamura, K.; Nishi, D.; Kawakami, N. Working environment at home and mental health in employees working from home in Japan during COVID-19 pandemic: A cross-sectional study. J. Occup. Health 2023, 65, e12410. [Google Scholar] [CrossRef] [PubMed]
  3. Umishio, W.; Kagi, N.; Asaoka, R.; Hayashi, M.; Sawachi, T.; Ueno, T. Work productivity in the office and at home during the COVID-19 pandemic: A cross-sectional analysis of office workers in Japan. Indoor Air 2022, 32, e12913. [Google Scholar] [CrossRef] [PubMed]
  4. Mucci, N.; Traversini, V.; Lulli, L.G.; Vimercati, L.; Rapisarda, V.; Galea, R.P.; De Sio, S.; Arcangeli, G. Neurobehavioral alterations in occupational noise exposure: A systematic review. Sustainability 2021, 13, 12224. [Google Scholar] [CrossRef]
  5. Bergefurt, L.; Appel-Meulenbroek, R.; Maris, C.; Arentze, T.; Weijs-Perrée, M.; De Kort, Y. The influence of distractions of the home-work environment on mental health during the COVID-19 pandemic. Ergonomics 2023, 66, 16–33. [Google Scholar] [CrossRef] [PubMed]
  6. Lin, D.; Li, T.; Liang, H. Semantic differential analysis of effects of indoor soundscapes on learning efficiency during online home-based classes. PLoS ONE 2024, 19, e0306812. [Google Scholar] [CrossRef] [PubMed]
  7. Manu, S.; Rysanek, A. Home as an office: Investigating the associations between indoor environmental quality, well-being, and performance in work-from-home settings. Build. Environ. 2025, 283, 113310. [Google Scholar] [CrossRef]
  8. Torresin, S.; Albatici, R.; Aletta, F.; Babich, F.; Kang, J. Assessment methods and factors determining positive indoor soundscapes in residential buildings: A systematic review. Sustainability 2019, 11, 5290. [Google Scholar] [CrossRef]
  9. Li, J.; Yuan, J.; Huang, Y.; Zhang, Y. Revealing the widespread existence and serious adverse health consequences of low-price rental housing in urban villages in Xiamen, China. Humanit. Soc. Sci. Commun. 2023, 10, 398. [Google Scholar] [CrossRef]
  10. Srivastava, C.; Murnane, E.L.; Billington, S.L.; Samuelson, H.W. Impact of workplace design on perceived work performance and well-being: Home versus office. J. Environ. Psychol. 2024, 95, 102274. [Google Scholar] [CrossRef]
  11. Hasegawa, Y.; Lau, S.-K. A qualitative and quantitative synthesis of the impacts of COVID-19 on soundscapes: A systematic review and meta-analysis. Sci. Total Environ. 2022, 844, 157223. [Google Scholar] [CrossRef] [PubMed]
  12. Aletta, F.; Oberman, T.; Mitchell, A.; Tong, H.; Kang, J. Assessing the changing urban sound environment during the COVID-19 lockdown period using short-term acoustic measurements. Noise Mapp. 2020, 7, 123–134. [Google Scholar] [CrossRef]
  13. Basu, B.; Murphy, E.; Molter, A.; Sarkar Basu, A.; Sannigrahi, S.; Belmonte, M.; Pilla, F. Investigating changes in noise pollution due to the COVID-19 lockdown: The case of Dublin, ireland. Sustain. Cities Soc. 2021, 65, 102597. [Google Scholar] [CrossRef]
  14. Manzano, J.V.; Pastor, J.A.A.; Quesada, R.G.; Aletta, F.; Oberman, T.; Mitchell, A.; Kang, J. The “sound of silence” in granada during the COVID-19 lockdown. Noise Mapp. 2021, 8, 16–31. [Google Scholar] [CrossRef]
  15. Zhang, Y.; Kang, J.; Kang, J. Effects of soundscape on the environmental restoration in urban natural environments. Noise Health 2017, 19, 65–72. [Google Scholar] [PubMed]
  16. Tong, H.; Aletta, F.; Mitchell, A.; Oberman, T.; Kang, J. Increases in noise complaints during the COVID-19 lockdown in spring 2020: A case study in greater london, UK. Sci. Total Environ. 2021, 785, 147213. [Google Scholar] [CrossRef]
  17. Ramphal, B.; Dworkin, J.D.; Pagliaccio, D.; Margolis, A.E. Noise complaint patterns in new york city from January 2010 through february 2021: Socioeconomic disparities and COVID-19 exacerbations. Environ. Res. 2022, 206, 112254. [Google Scholar] [CrossRef] [PubMed]
  18. Andargie, M.S.; Touchie, M.; O’Brien, W. Case study: A survey of perceived noise in canadian multi-unit residential buildings to study long-term implications for widespread teleworking. Build. Acoust. 2021, 28, 443–460. [Google Scholar] [CrossRef]
  19. Scamoni, F.; Salamone, F.; Scrosati, C. A survey on perceived indoor acoustic quality by workers from home during COVID-19 lockdown in Italy. Buildings 2023, 13, 640. [Google Scholar] [CrossRef]
  20. Torresin, S.; Albatici, R.; Aletta, F.; Babich, F.; Oberman, T.; Stawinoga, A.E.; Kang, J. Indoor soundscapes at home during the COVID-19 lockdown in London—Part I: Associations between the perception of the acoustic environment, occupantś activity and well-being. Appl. Acoust. 2021, 183, 108305. [Google Scholar] [CrossRef] [PubMed]
  21. Jo, H.I.; Jeon, J.Y. Effect of the appropriateness of sound environment on urban soundscape assessment. Build. Environ. 2020, 179, 106975. [Google Scholar] [CrossRef]
  22. Yang, X.; Zhang, G.; Lu, X.; Zhang, Y. Contribution of soundscape appropriateness to soundscape quality assessment in space: A mediating variable affecting acoustic comfort. J. Environ. Manag. 2024, 372, 123321. [Google Scholar] [CrossRef] [PubMed]
  23. Zhang, Z.; Zhang, Y.; Kang, J. An experimental study on the influence of environmental noise on students’ attention. In Proceedings of the 11th EuroNoise Conference, Crete, Greece, 27–31 May 2018. [Google Scholar]
  24. Kaarlela-Tuomaala, A.; Helenius, R.; Keskinen, E.; Hongisto, V. Effects of acoustic environment on work in private office rooms and open-plan offices—Longitudinal study during relocation. Ergonomics 2009, 52, 1423–1444. [Google Scholar] [CrossRef] [PubMed]
  25. Di Blasio, S.; Shtrepi, L.; Puglisi, G.E.; Astolfi, A. A cross-sectional survey on the impact of irrelevant speech noise on annoyance, mental health and well-being, performance and occupants’ behavior in shared and open-plan offices. Int. J. Environ. Res. Public Health 2019, 16, 280. [Google Scholar] [CrossRef] [PubMed]
  26. Torresin, S.; Ratcliffe, E.; Aletta, F.; Albatici, R.; Babich, F.; Oberman, T.; Kang, J. The actual and ideal indoor soundscape for work, relaxation, physical and sexual activity at home: A case study during the COVID-19 lockdown in London. Front. Psychol. 2022, 13, 1038303. [Google Scholar] [CrossRef] [PubMed]
  27. Wen, X.; Meng, Q.; Yang, D.; Li, M. Effect of thermal-acoustic composite environments on comfort perceptions considering different office activities. Energy Build. 2024, 305, 113887. [Google Scholar] [CrossRef]
  28. Jahncke, H.; Hygge, S.; Halin, N.; Green, A.M.; Dimberg, K. Open-plan office noise: Cognitive performance and restoration. J. Environ. Psychol. 2011, 31, 373–382. [Google Scholar] [CrossRef]
  29. De Croon, E.; Sluiter, J.; Kuijer, P.P.; Frings-Dresen, M. The effect of office concepts on worker health and performance: A systematic review of the literature. Ergonomics 2005, 48, 119–134. [Google Scholar] [CrossRef] [PubMed]
  30. Liu, Y.; Zhang, Y.; Zhang, R. Problems and impacts associated with the acoustic environment of open-plan offices from the perspective of healthy environment. Chin. Sci. Bull. 2020, 65, 511–521. [Google Scholar] [CrossRef]
  31. Zong, J.; Ai, Z.; Melikov, A.K.; Cao, S. Indoor environmental quality and subjective perceptions in multi-chair dental offices. Build. Environ. 2025, 267, 112196. [Google Scholar] [CrossRef]
  32. Torresin, S.; Albatici, R.; Aletta, F.; Babich, F.; Oberman, T.; Stawinoga, A.E.; Kang, J. Indoor soundscapes at home during the COVID-19 lockdown in London—Part II: A structural equation model for comfort, content, and well-being. Appl. Acoust. 2022, 185, 108379. [Google Scholar] [CrossRef] [PubMed]
  33. Mitchell, A.; Aletta, F.; Kang, J. How to analyse and represent quantitative soundscape data. JASA Express Lett. 2022, 2, 37201. [Google Scholar] [CrossRef] [PubMed]
  34. Chen, K.; Kang, J.; Ma, H. Perceived attachment to indoor acoustic environments in high-rise residential buildings: Quantization, prediction, and population-based comparison. Build. Environ. 2025, 276, 112914. [Google Scholar] [CrossRef]
  35. Chen, K.; Kang, J.; Ma, H. Effects of sound-source characteristics and personal factors on the perceived controllability of indoor acoustic environments in high-rise multi-unit residences. Build. Environ. 2024, 264, 111935. [Google Scholar] [CrossRef]
  36. Chen, K.; Kang, J.; Ma, H. Evaluation of healthy indoor acoustic environments in residential buildings by the occupants: A mixed-method approach. Build. Environ. 2023, 246, 110950. [Google Scholar] [CrossRef]
  37. Puglisi, G.E.; Di Blasio, S.; Shtrepi, L.; Astolfi, A. Remote Working in the COVID-19 Pandemic: Results From a Questionnaire on the Perceived Noise Annoyance. Front. Built Environ. 2021, 7, 688484. [Google Scholar] [CrossRef]
  38. Park, S.H.; Shin, H.-K.; Kim, K.-W. Relationship between indoor noise perception and remote work during the COVID-19 pandemic. PLoS ONE 2023, 18, e0286481. [Google Scholar] [CrossRef] [PubMed]
  39. Mimani, A.; Nama, S. A perception-based study of the indoor and outdoor acoustic environments in India during the COVID-19 pandemic. J. Acoust. Soc. Am. 2022, 152, 2570–2587. [Google Scholar] [CrossRef] [PubMed]
  40. Li, M.; Han, R.; Xie, H.; Zhang, R.; Guo, H.; Zhang, Y.; Kang, J. Mandarin chinese translation of the ISO-12913 soundscape attributes to investigate the mechanism of soundscape perception in urban open spaces. Appl. Acoust. 2024, 215, 109728. [Google Scholar] [CrossRef]
  41. Torresin, S.; Albatici, R.; Aletta, F.; Babich, F.; Oberman, T.; Siboni, S.; Kang, J. Indoor soundscape assessment: A principal components model of acoustic perception in residential buildings. Build. Environ. 2020, 182, 107152. [Google Scholar] [CrossRef]
  42. Axelsson, Ö.; Nilsson, M.E.; Berglund, B. A principal components model of soundscape perception. J. Acoust. Soc. Am. 2010, 128, 2836–2846. [Google Scholar] [CrossRef] [PubMed]
  43. Job, R.F.S. Noise sensitivity as a factor influencing human reaction to noise. Noise Health 1999, 3, 57–68. [Google Scholar]
  44. Iacobucci, D. Structural equations modeling: Fit indices, sample size, and advanced topics. J. Consum. Psychol. 2010, 20, 90–98. [Google Scholar] [CrossRef]
  45. Lee, P.J.; Jeong, J.H. Attitudes towards outdoor and neighbour noise during the COVID-19 lockdown: A case study in London. Sustain. Cities Soc. 2021, 67, 102768. [Google Scholar] [CrossRef] [PubMed]
  46. Okokon, E.O.; Turunen, A.W.; Ung-Lanki, S.; Vartiainen, A.-K.; Tiittanen, P.; Lanki, T. Road-traffic noise: Annoyance, risk perception, and noise sensitivity in the finnish adult population. Int. J. Environ. Res. Public Health 2015, 12, 5712–5734. [Google Scholar] [CrossRef] [PubMed]
  47. Stansfeld, S.; Clark, C.; Smuk, M.; Gallacher, J.; Babisch, W. Road traffic noise, noise sensitivity, noise annoyance, psychological and physical health and mortality. Environ. Health 2021, 20, 32. [Google Scholar] [CrossRef] [PubMed]
  48. Cohen, J. Statistical Power Analysis for the Behavioral Sciences, 2nd ed.; L. Erlbaum Associates: Hillsdale, NJ, USA, 1988. [Google Scholar]
  49. Torresin, S.; Albatici, R.; Aletta, F.; Babich, F.; Oberman, T.; Kang, J. Associations between indoor soundscapes, building services and window opening behaviour during the COVID-19 lockdown. Build. Serv. Eng. Res. Technol. 2022, 43, 225–240. [Google Scholar] [CrossRef] [PubMed]
  50. Frescura, A.; Lee, P.J. Emotions and physiological responses elicited by neighbours sounds in wooden residential buildings. Build. Environ. 2022, 210, 108729. [Google Scholar] [CrossRef]
  51. Yang, T.; Kang, J. Sound environment in an urban apartment building during and after the COVID-19 lockdown. Front. Psychol. 2023, 14, 1136201. [Google Scholar] [CrossRef] [PubMed]
  52. Meng, Q.; An, Y.; Yang, D. Effects of acoustic environment on design work performance based on multitask visual cognitive performance in office space. Build. Environ. 2021, 205, 108296. [Google Scholar] [CrossRef]
  53. Zhang, M.; Kang, J.; Jiao, F. A social survey on the noise impact in open-plan working environments in China. Sci. Total Environ. 2012, 438, 517–526. [Google Scholar] [CrossRef] [PubMed]
  54. Landström, U.; Åkerlund, E.; Kjellberg, A.; Tesarz, M. Exposure levels, tonal components, and noise annoyance in working environments. Environ. Int. 1995, 21, 265–275. [Google Scholar] [CrossRef]
  55. Zimmer, K.; Ghani, J.; Ellermeier, W. The role of task interference and exposure duration in judging noise annoyance. J. Sound. Vib. 2008, 311, 1039–1051. [Google Scholar] [CrossRef]
  56. Rachman, Z.; Aletta, F.; Kang, J. Exploring soundscape assessment methods in office environments: A systematic review. Buildings 2024, 14, 3408. [Google Scholar] [CrossRef]
  57. Jeon, J.Y.; Lee, P.J.; You, J.; Kang, J. Perceptual assessment of quality of urban soundscapes with combined noise sources and water sounds. J. Acoust. Soc. Am. 2010, 127, 1357–1366. [Google Scholar] [CrossRef] [PubMed]
  58. Mohamed, M.A.E.; Dokmeci Yorukoglu, P.N. Indoor soundscape perception in residential spaces: A cross-cultural analysis in Ankara, turkey. Build. Acoust. 2020, 27, 35–46. [Google Scholar] [CrossRef]
  59. Şentop Dümen, A.; Şaher, K. Noise annoyance during COVID-19 lockdown: A research of public opinion before and during the pandemic. J. Acoust. Soc. Am. 2020, 148, 3489–3496. [Google Scholar] [CrossRef] [PubMed]
  60. Tong, H.; Kang, J. Characteristics of noise complaints and the associations with urban morphology: A comparison across densities. Environ. Res. 2021, 197, 111045. [Google Scholar] [CrossRef] [PubMed]
  61. Yuan, M.; Yin, C.; Sun, Y.; Chen, W. Examining the associations between urban built environment and noise pollution in high-density high-rise urban areas: A case study in Wuhan, China. Sustain. Cities Soc. 2019, 50, 101678. [Google Scholar] [CrossRef]
  62. Meng, Q.; Sun, Y.; Kang, J. Effect of temporary open-air markets on the sound environment and acoustic perception based on the crowd density characteristics. Sci. Total Environ. 2017, 601–602, 1488–1495. [Google Scholar] [CrossRef] [PubMed]
  63. Yang, D.; Cao, X.; Meng, Q. Effects of a human sound-based index on the soundscapes of urban open spaces. Sci. Total Environ. 2022, 802, 149869. [Google Scholar] [CrossRef] [PubMed]
  64. Lu, Y.; Hasegawa, Y.; Tan, J.K.A.; Lau, S.-K. Effect of audio-visual interaction on soundscape in the urban residential context: A virtual reality experiment. Appl. Acoust. 2022, 192, 108717. [Google Scholar] [CrossRef]
Figure 1. Research design flowchart.
Buildings 15 02642 g001
Figure 2. Theoretical hypothesis model. PPVST = perceived prominence of various sound types.
Buildings 15 02642 g002
Figure 3. Differences in the perceived saliencies of various sounds while working and relaxing at home. Numbers represent the total proportion of participants choosing moderately, a lot, and dominates completely for each type of sound. STN = traffic noise; SOEMN = other external man-made noise; SHE = household equipment sounds; SPYH = sounds from people in the home; SPS = plumbing sounds; SEN = elevator noise; SUN = upstairs neighbour sounds; SNN = next-door neighbour sounds; SPSARC = sounds from people in shared/common areas of the residential complex; SNat = outside natural sounds.
Buildings 15 02642 g003
Figure 4. Comparison of the spatial distribution of two indoor soundscape perceptual dimensions while working and relaxing at home. (a) All samples. (b) Samples of those who work and relax in the same room.
Buildings 15 02642 g004
Figure 5. Mechanisms of the effects of SA for (a) WAH and (b) RAH. SNeigh = neighbour sounds; NBuildS = building-service noise; NOutM = outdoor man-made noise; SHouse = household sounds.
Buildings 15 02642 g005
Table 1. Differences (WAH-RAH) in the perception of the indoor soundscape while working and relaxing at home based on the Wilcoxon signed-rank test. (All samples, n = 247).
Grouped MedianZp-Valuer
WAHRAHDifference
Comfortable3.783.94−0.16−2.910.00−0.19
Full of content3.313.65−0.35−5.580.00−0.35
Private3.743.81−0.08−1.460.15−0.09
Engaging2.823.31−0.41−6.960.00−0.44
Annoying2.402.300.10−2.570.01−0.16
Empty2.622.460.16−3.260.00−0.21
Intrusive2.692.630.07−1.700.09−0.11
Detached2.792.550.20−4.460.00−0.28
Comfort0.210.26−0.05−5.190.00−0.33
Content0.040.10−0.05−6.690.00−0.43
Table 2. Correlation analysis between indoor soundscape perceptual dimensions and saliencies of various sound types.
WAHRAH
ComfortContentComfortContent
Outdoor man-made noiseSTN−0.14 *−0.06−0.20 **−0.20 **
SOEMN−0.28 **−0.16 **−0.22 **−0.21 **
Household soundsSHE−0.17 **−0.14 *−0.15 *−0.02
SPYH−0.12−0.020.040.08
Building-service noiseSPS−0.24 **−0.10−0.26 **−0.16 *
SEN−0.13 *−0.01−0.20 **−0.16 *
Neighbour soundsSUN−0.20 **−0.21 **−0.23 **−0.19 **
SNN−0.24 **−0.12−0.29 **−0.20 **
SPSAR−0.17 **−0.04−0.14 *−0.09
Natural soundsSNat−0.01−0.030.120.14 *
Note: * indicates a significant correlation at the 0.05 level (two-sided); ** indicates a significant correlation at the 0.01 level (two-sided).
Table 3. Correlation analysis between indoor soundscape perceptual dimensions and housing and individual characteristics.
Housing CharacteristicsIndividual Characteristics
Size of HousingNumber of Co-HabitantsLiving FloorLocationEducationAgeNoise Sensitive Score
WAHSTN−0.08−0.080.05−0.04−0.06−0.070.17 **
SOEMN−0.14 *−0.110.09−0.110.05−0.090.20 **
SHE0.000.000.030.010.11−0.080.21 **
SPYH0.16 *0.29 **−0.010.080.03−0.030.17 **
SPS−0.060.01−0.010.04−0.03−0.060.04
SEN0.070.040.080.10−0.01−0.020.07
SUN−0.03−0.020.010.020.07−0.090.11
SNN−0.07−0.00−0.05−0.030.06−0.080.13 *
SPSAR−0.09−0.01−0.090.070.12−0.18 **0.13 *
SNat−0.17 **0.01−0.120.06−0.04−0.100.12
Comfort0.15 *−0.04−0.050.08−0.030.19 **−0.10
Content0.030.05−0.14 *−0.05−0.14 *0.12−0.07
RAHSTN−0.14 *0.000.05−0.02−0.02−0.110.14 *
SOEMN−0.19 **−0.020.04−0.090.04−0.15 *0.18 **
SHE−0.020.050.010.08−0.05−0.040.14 *
SPYH0.110.28 **−0.020.020.03−0.040.15 *
SPS−0.000.07−0.030.06−0.040.050.06
SEN0.010.060.030.100.09−0.100.03
SUN−0.040.04−0.07−0.010.08−0.040.12
SNN−0.14 *0.04−0.05−0.050.00−0.040.11
SPSAR−0.14 *−0.02−0.120.03−0.00−0.15 *0.09
SNat−0.110.03−0.090.000.01−0.16 *0.17 **
Comfort0.20 **0.120.040.110.110.08−0.01
Content0.16 *0.16 *−0.090.10−0.030.09−0.02
Note: * indicates a significant correlation at the 0.05 level (two-sided); ** indicates a significant correlation at the 0.01 level (two-sided).
Table 4. Correlation analysis between SA and indoor soundscape perception, housing, and individual characteristics.
SA
WAHRAH
Outdoor man-made noiseSTN−0.18 **−0.29 **
SOEMN−0.27 **−0.24 **
Household soundsSHE−0.10−0.20 **
SPYH−0.14 *−0.08
Building-service noiseSPS−0.14 *−0.25 **
SEN−0.10−0.19 **
Neighbour soundsSUN−0.18 **−0.23 **
SNN−0.24 **−0.31 **
SPSAR−0.15 *−0.19 **
Natural soundsSNat−0.050.03
Soundscape perceptionComfort0.44 **0.54 **
Content0.14 *0.41 **
Housing characteristicsSize of housing0.060.20 **
Number of co-habitants−0.10−0.01
Living floor0.060.08
Location0.100.10
Individual characteristicsEducation0.13 *0.11
Age0.13 *0.10
Noise sensitive score−0.17 **−0.08
Note: * indicates a significant correlation at the 0.05 level (two-sided); ** indicates a significant correlation at the 0.01 level (two-sided).
Table 5. Standardised effect sizes of the effect of indoor soundscape on SA.
SA for WAHSA for RAH
DirectIndirectTotalDirectIndirectTotal
Outdoor man-made noise-−0.10−0.10-−0.11−0.11
Household sounds------
Building-service noise-−0.09−0.09---
Neighbour sounds−0.17-−0.17−0.19−0.13−0.32
Natural sounds----0.130.13
STN-−0.07−0.07-−0.09−0.09
SOEMN-−0.09−0.09-−0.09−0.09
SHE------
SPYH------
SPS-−0.08−0.08---
SEN-−0.05−0.05---
SUN-−0.13−0.13-−0.24−0.24
SNN-−0.14−0.14-−0.27−0.27
SPSAR-−0.10−0.10-−0.20−0.20
SNS----0.130.13
Disclaimer/Publisher’s Note: The statements, opinions and data contained in all publications are solely those of the individual author(s) and contributor(s) and not of MDPI and/or the editor(s). MDPI and/or the editor(s) disclaim responsibility for any injury to people or property resulting from any ideas, methods, instructions or products referred to in the content.

