
Study on the Shear Performance of MMOM Stay-in-Place Formwork Beams Reinforced with Perforated Steel Pipe Skeleton

Abstract
1. Introduction
2. Materials and Methods
2.1. Material Constitutive Model
2.1.1. Concrete
2.1.2. MMOM
2.1.3. Steel
2.2. Establishment of FE Model
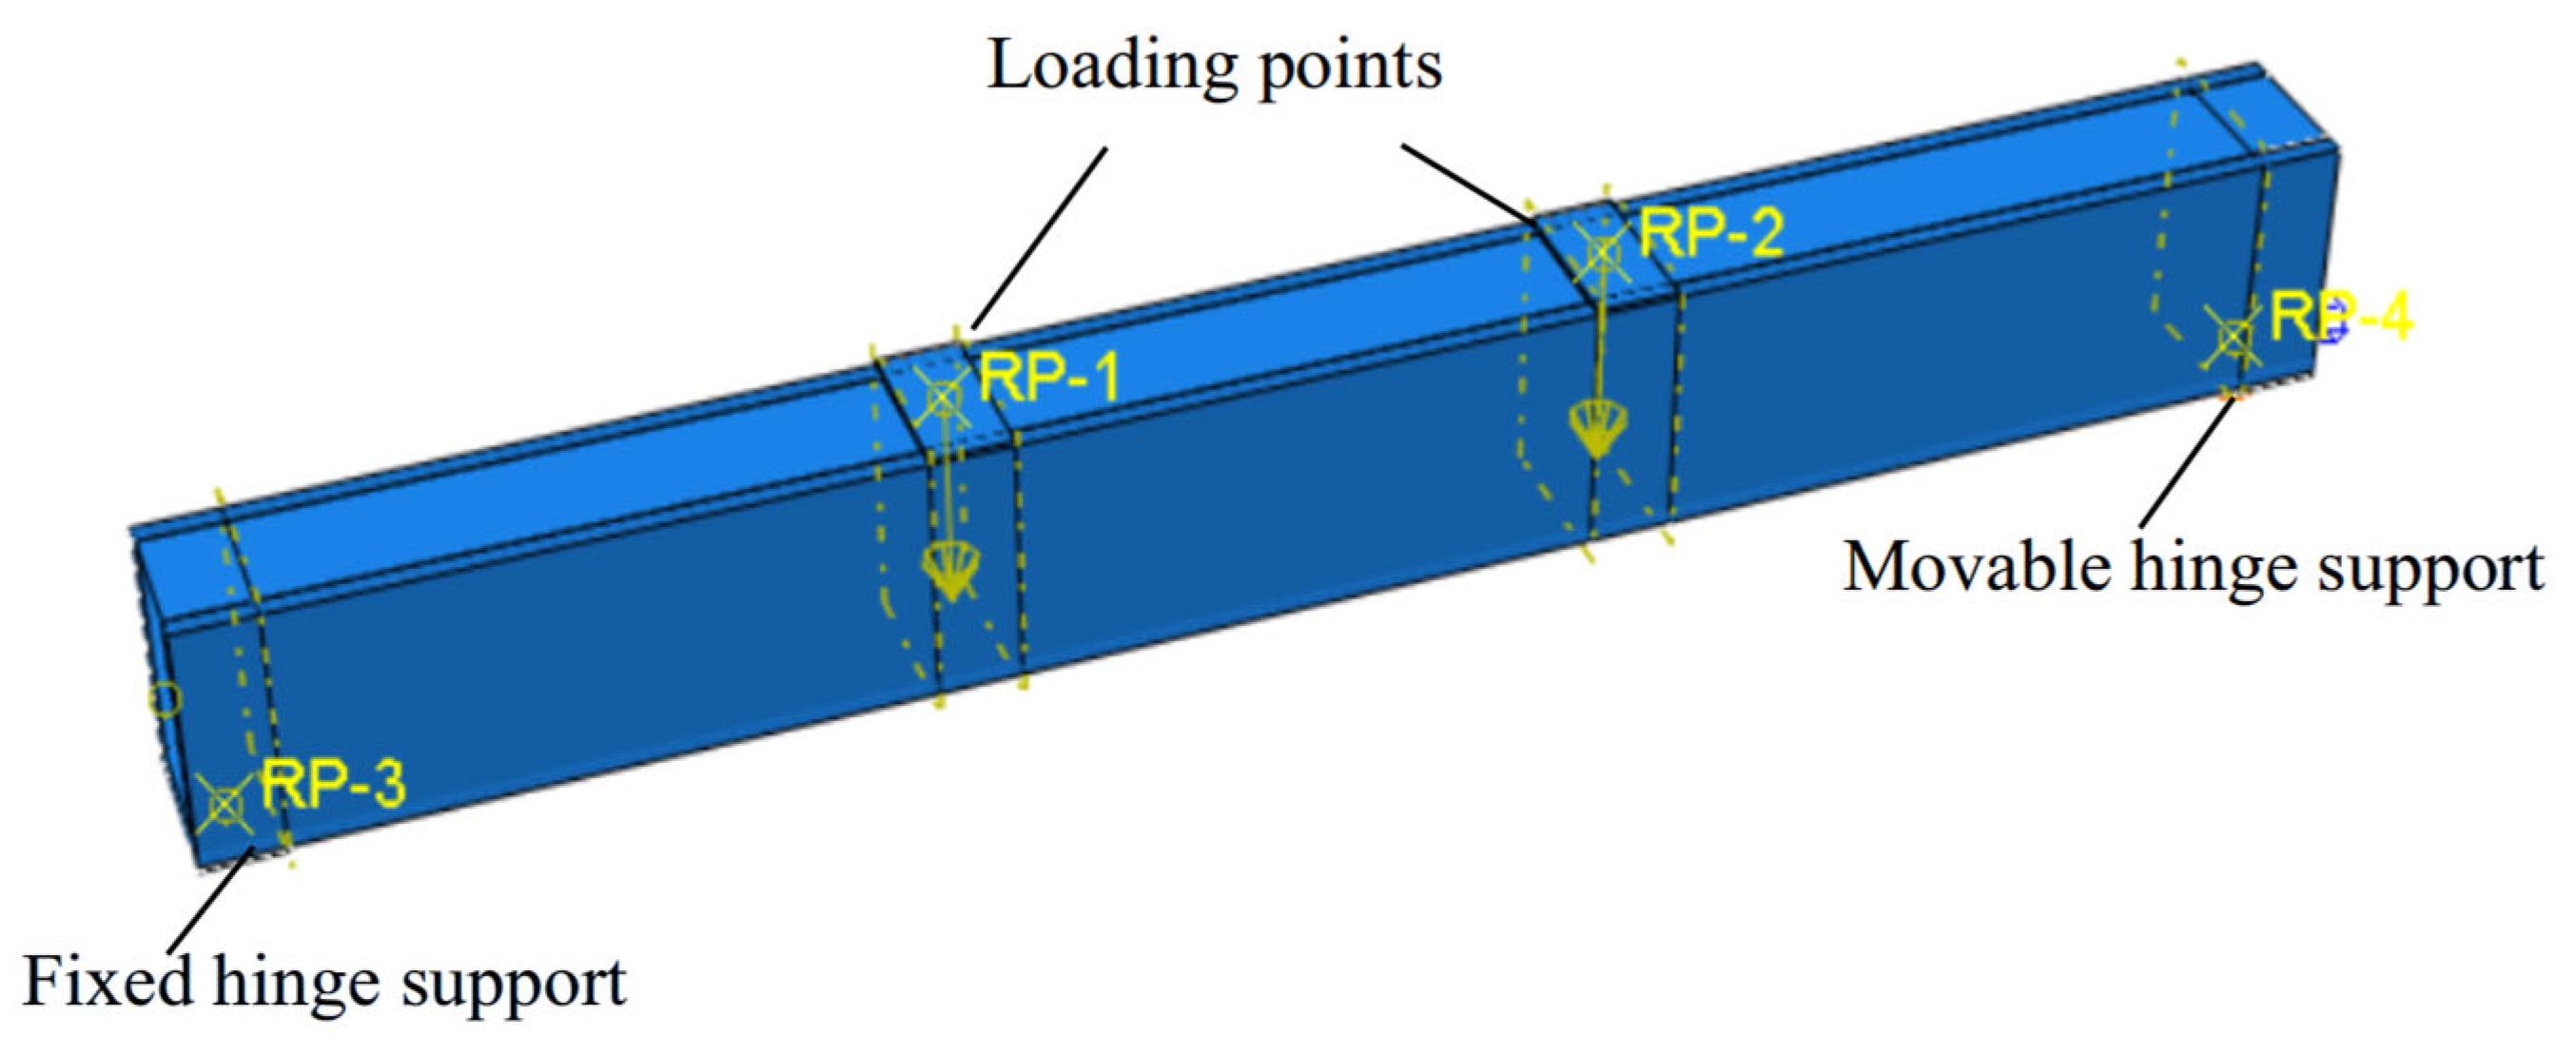
2.2.1. Boundary Conditions and Contact Methods
2.2.2. Element Type and Mesh Size
2.3. Model Verification
2.3.1. SIPF Beam Laboratory Shear Test
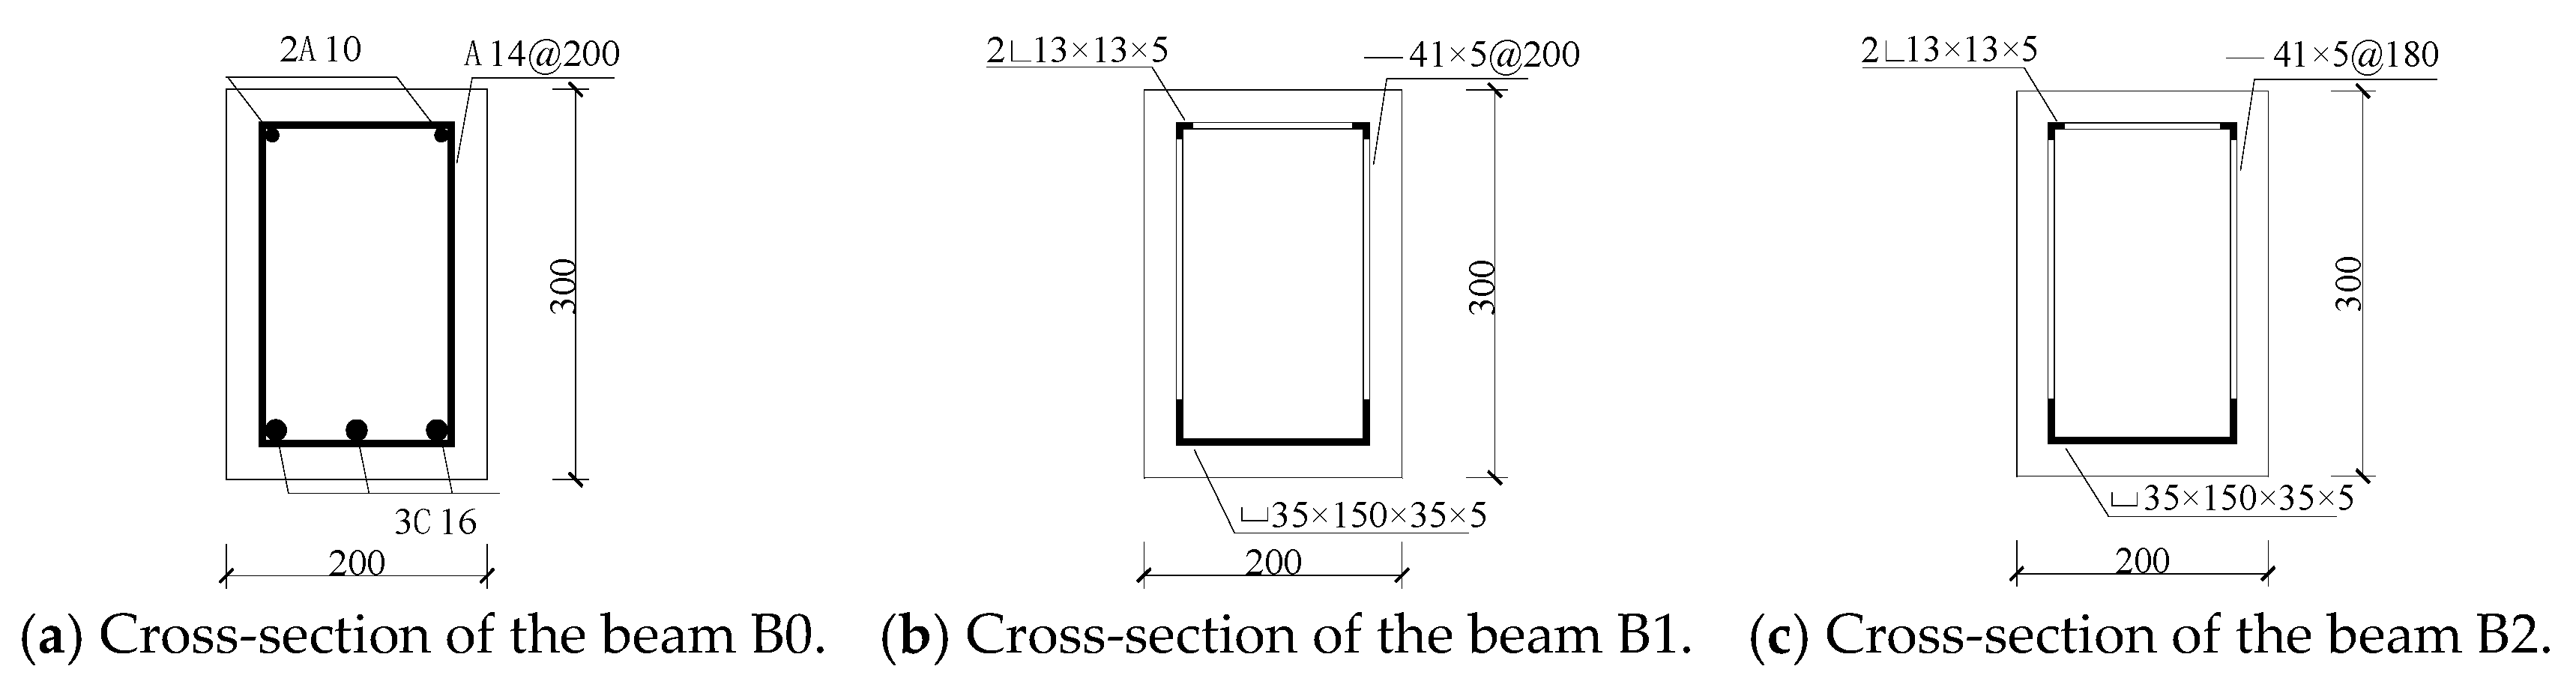
 ” indicates the upper longitudinal remaining steel strip after the steel pipe is dug and cut, “
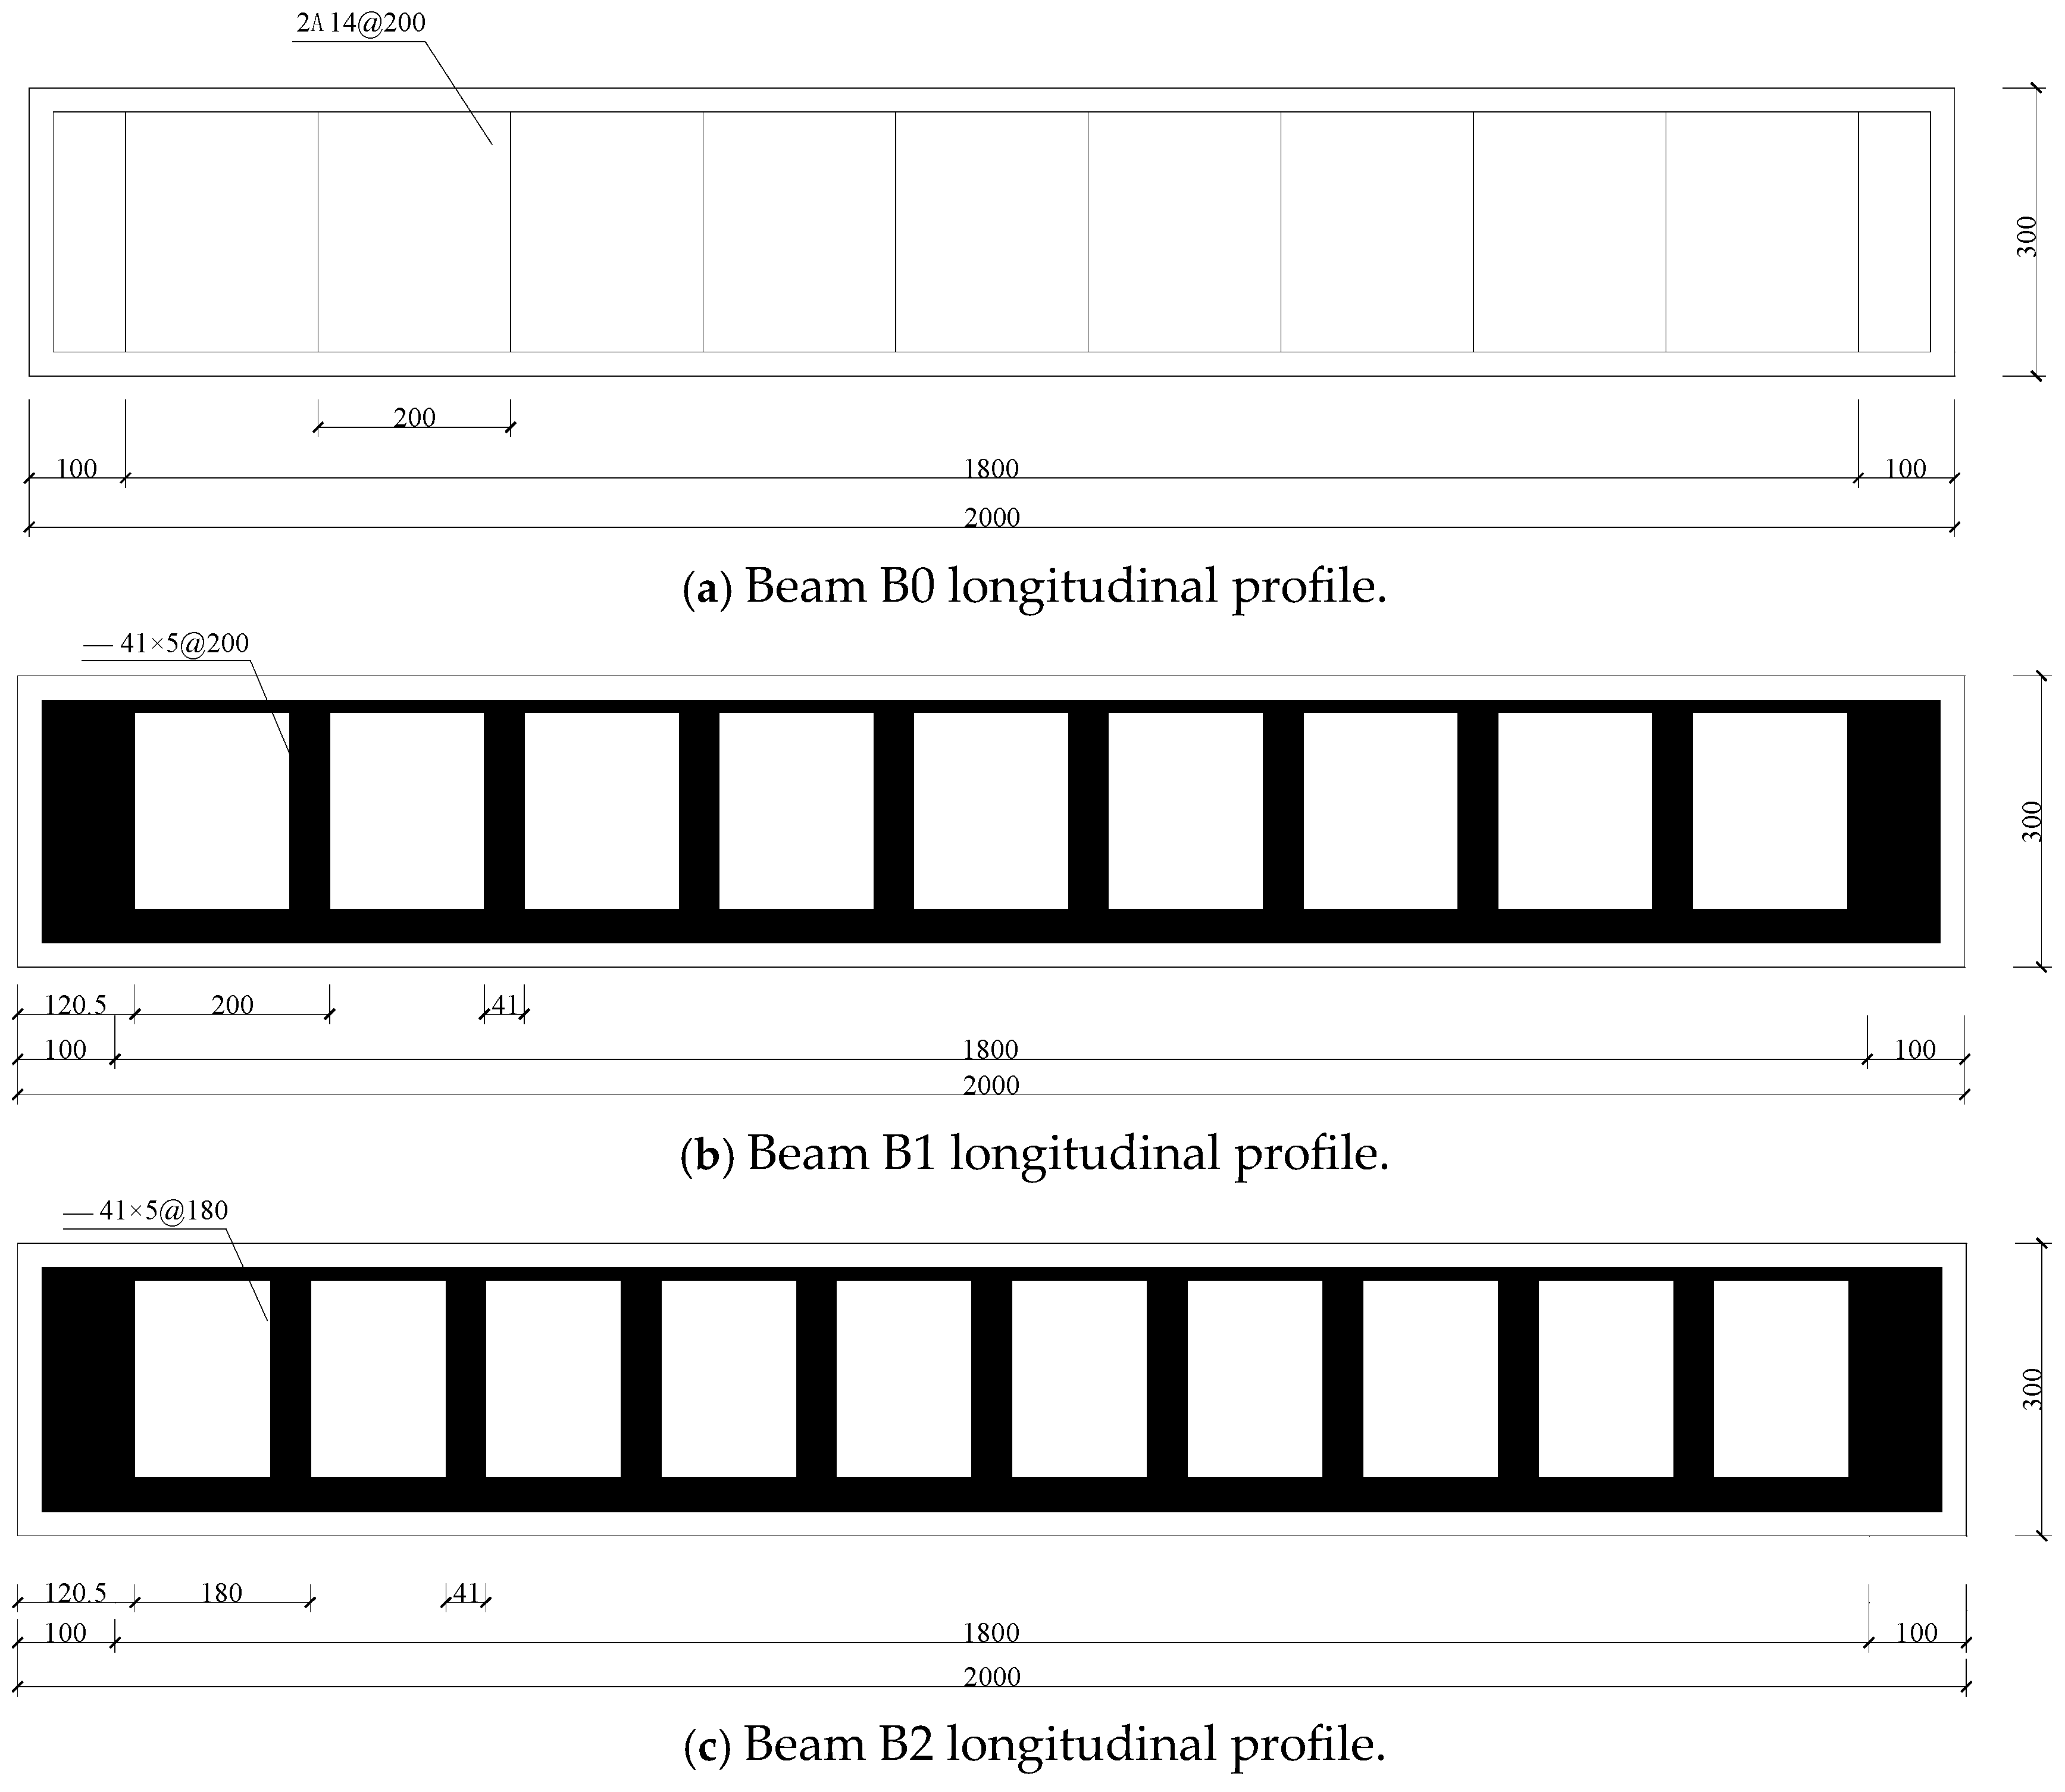
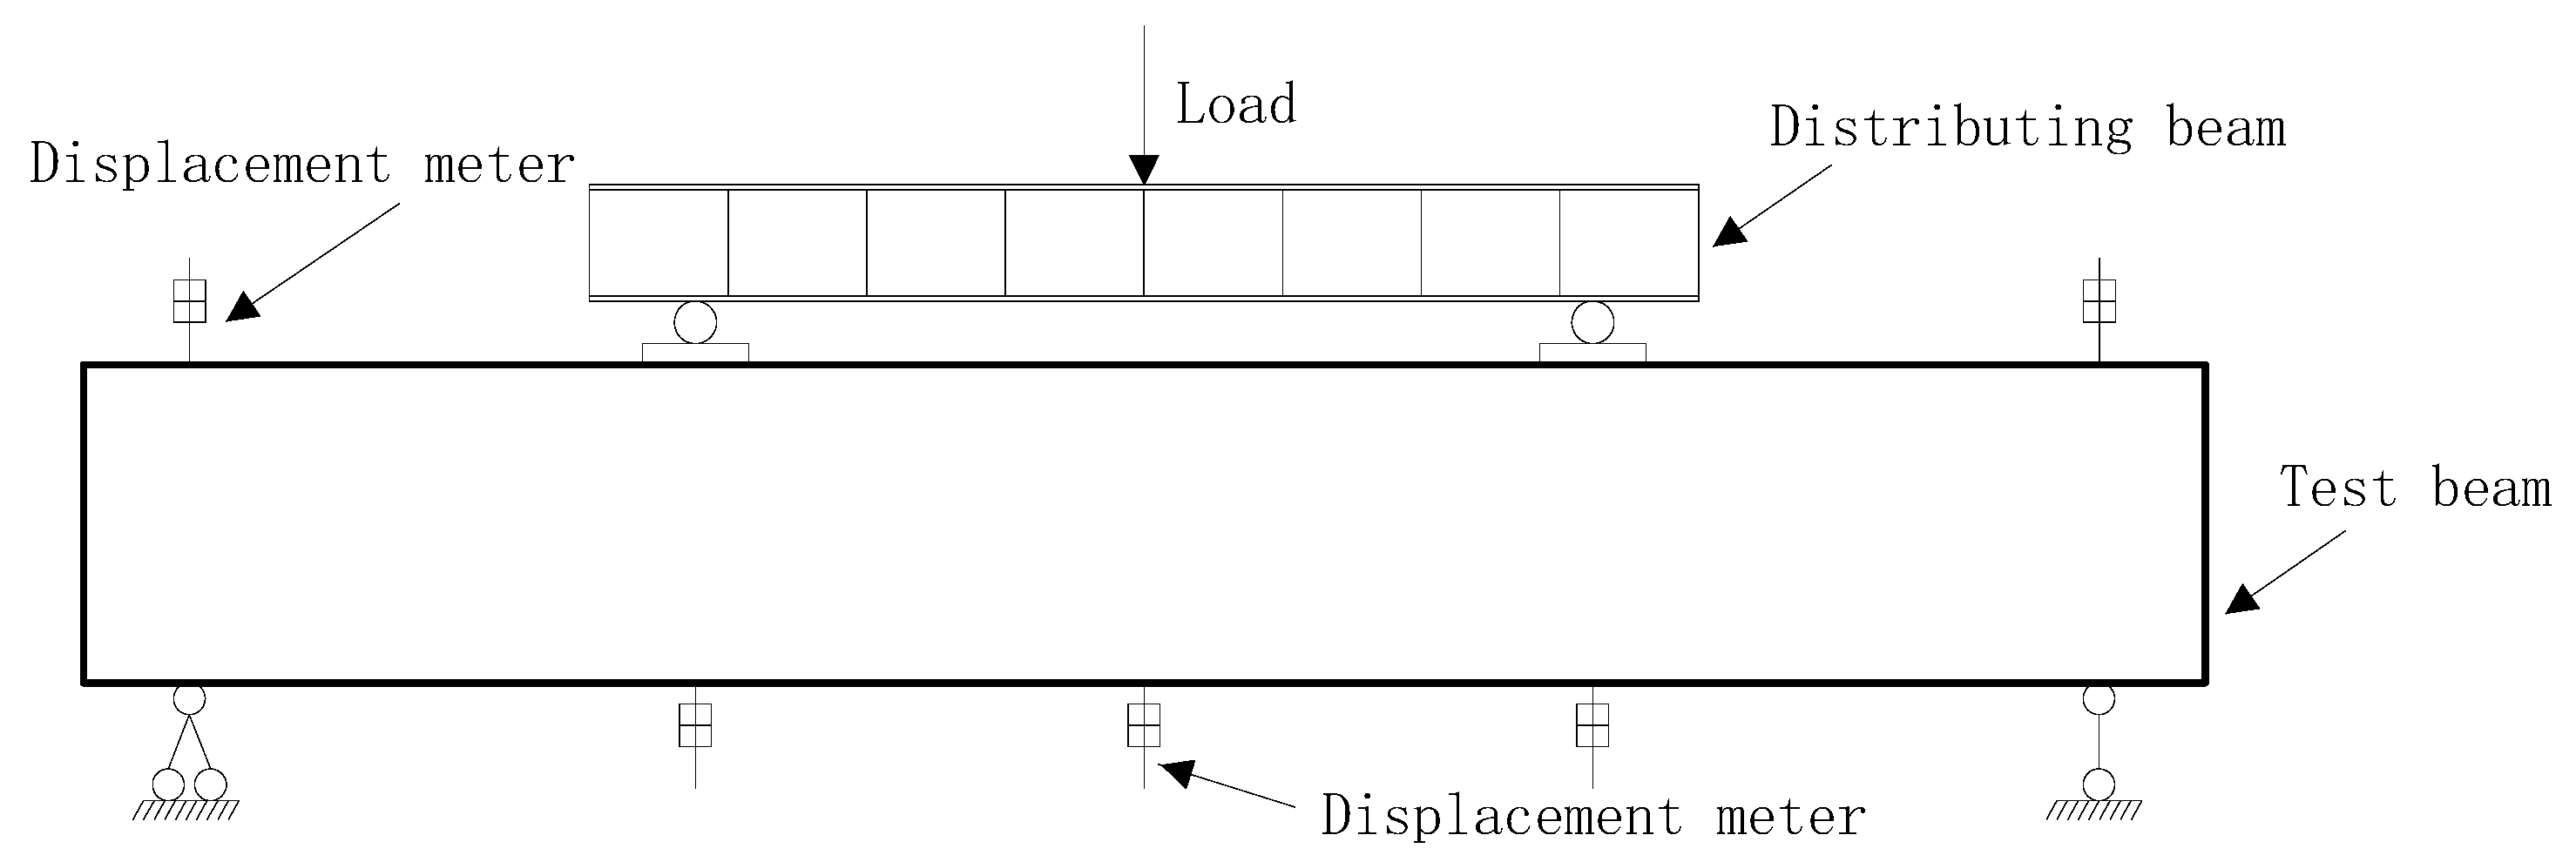
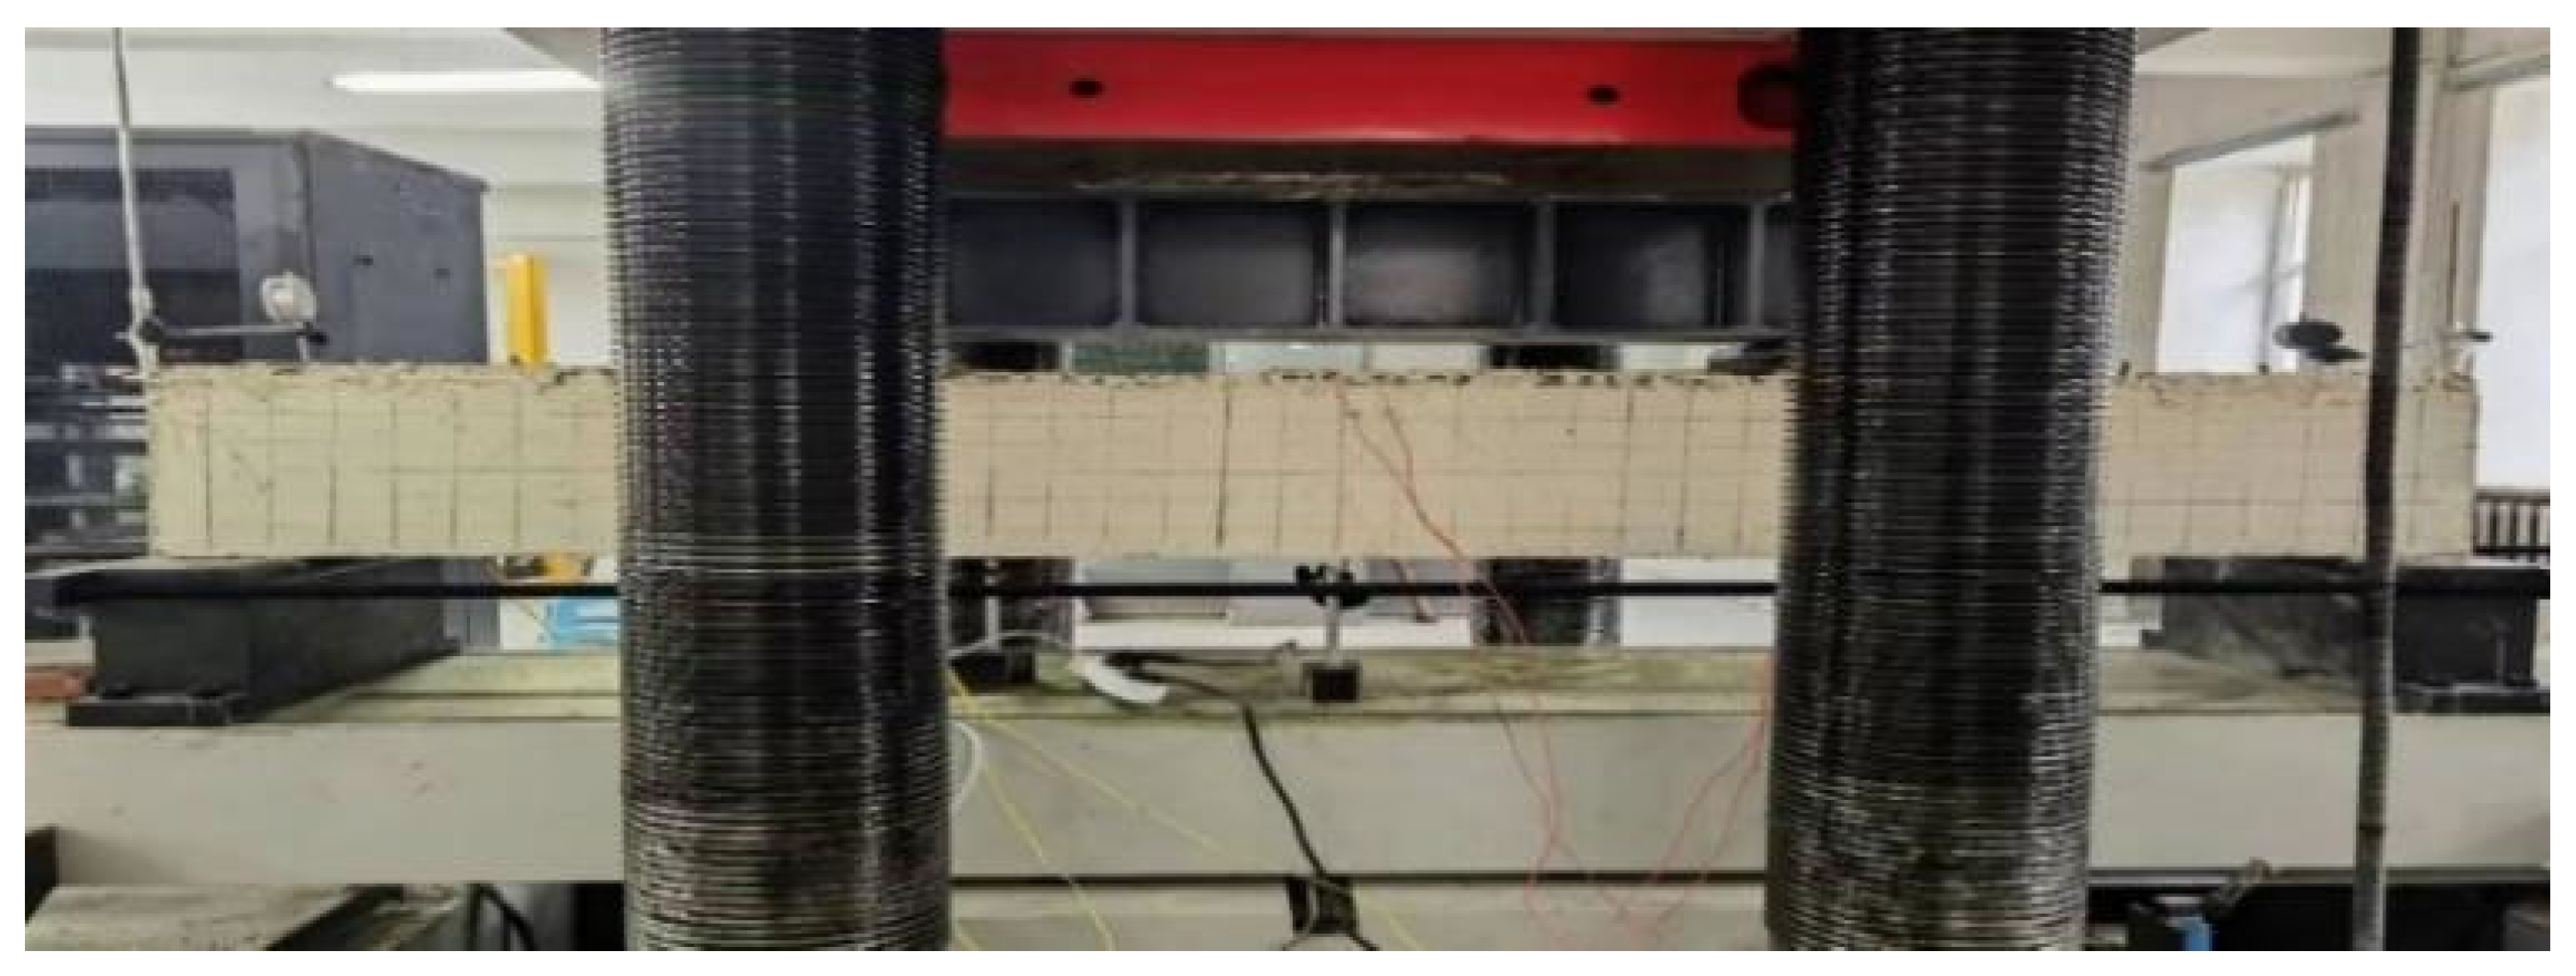
 ” indicates the lower longitudinal remaining steel strip, and “—” indicates the lateral remaining steel strip. Taking beam B1 as an example, 213 × 13 × 5 indicates that the transverse width, vertical height, and thickness of the remaining longitudinal steel strip on both sides of the upper part of the steel pipe after digging and cutting are 13 mm, 13 mm, and 5 mm. 35 × 150 × 35 × 5 indicates that the longitudinal remaining steel strip in the lower part of the steel pipe after digging and cutting is 150 mm in transverse width, 35 mm in vertical height, and 5 mm in thickness. —41 × 5@200 indicates that the width of the remaining steel belts is 41 mm, the thickness is 5 mm, and the spacing is 200 mm. The test beam adopts the four-point bending loading form. The schematic diagrams of the loading device and the laboratory loading diagram are shown in Figure 5 and Figure 6, respectively.
2.3.2. Comparison of Load–Deflection Curves
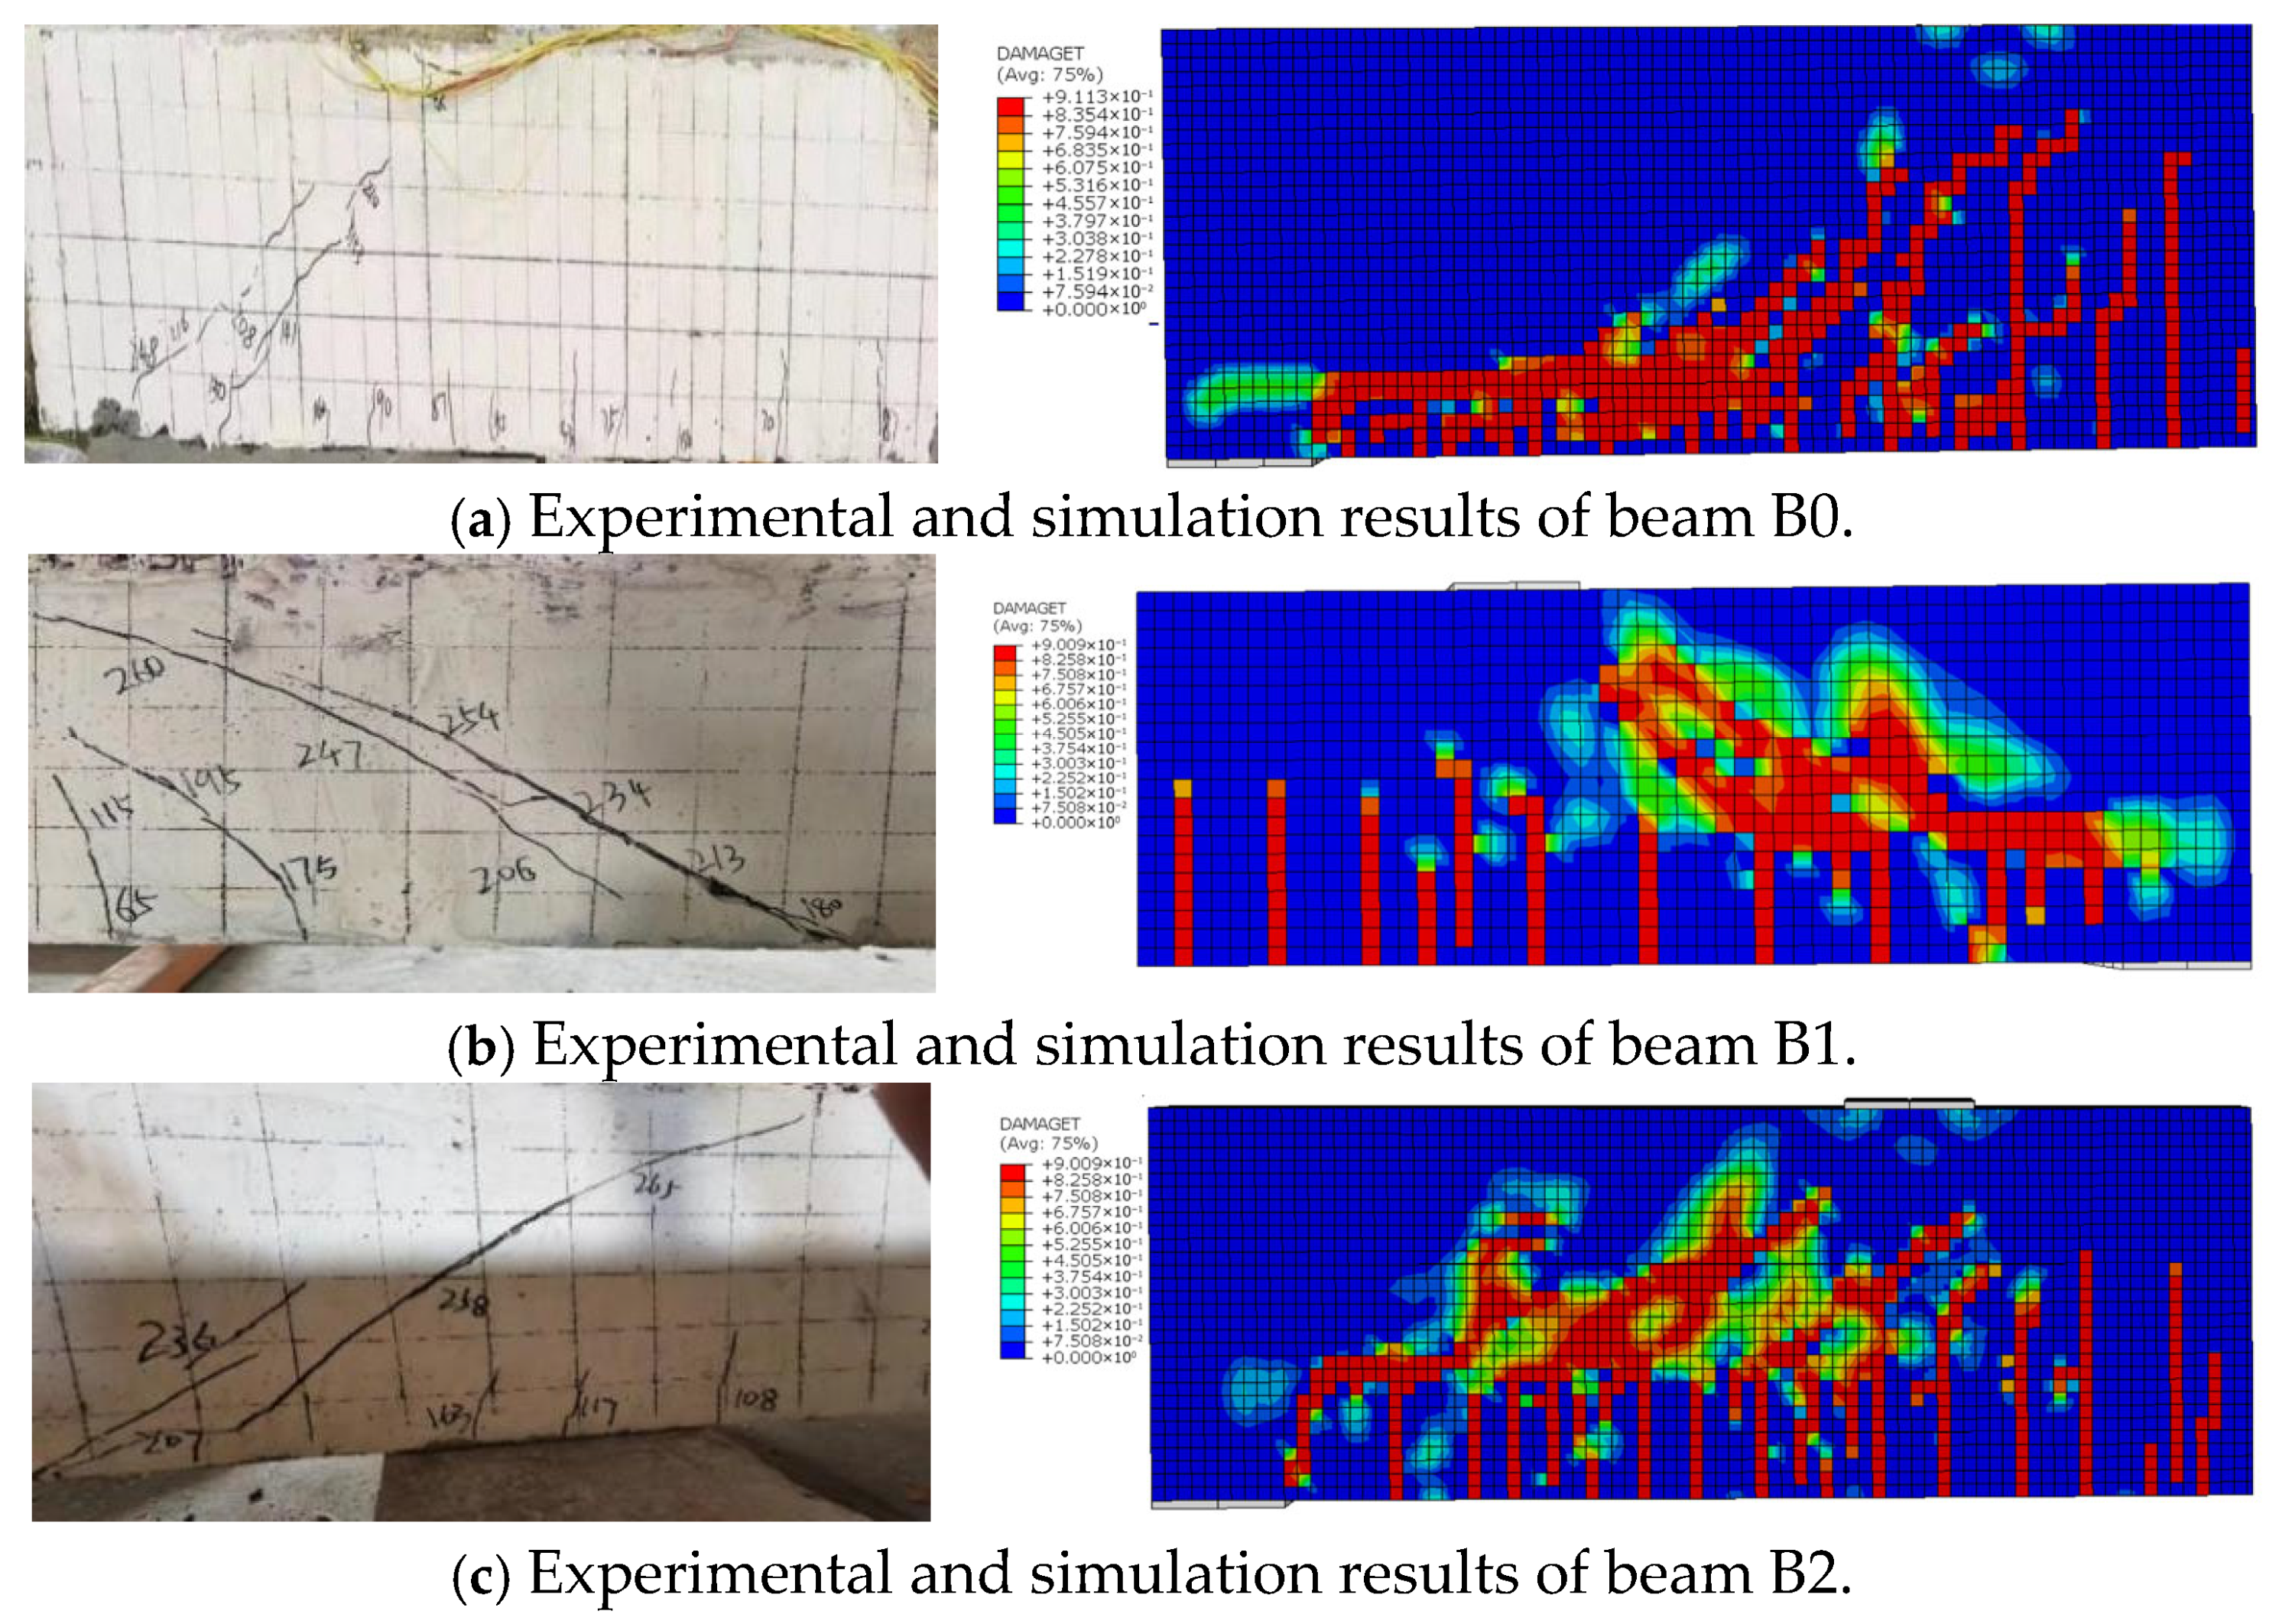
2.3.3. Comparison of Oblique Crack Development
3. Results and Discussion
3.1. The Influence of Each Parameter on the Shear Performance of SIPF Beams
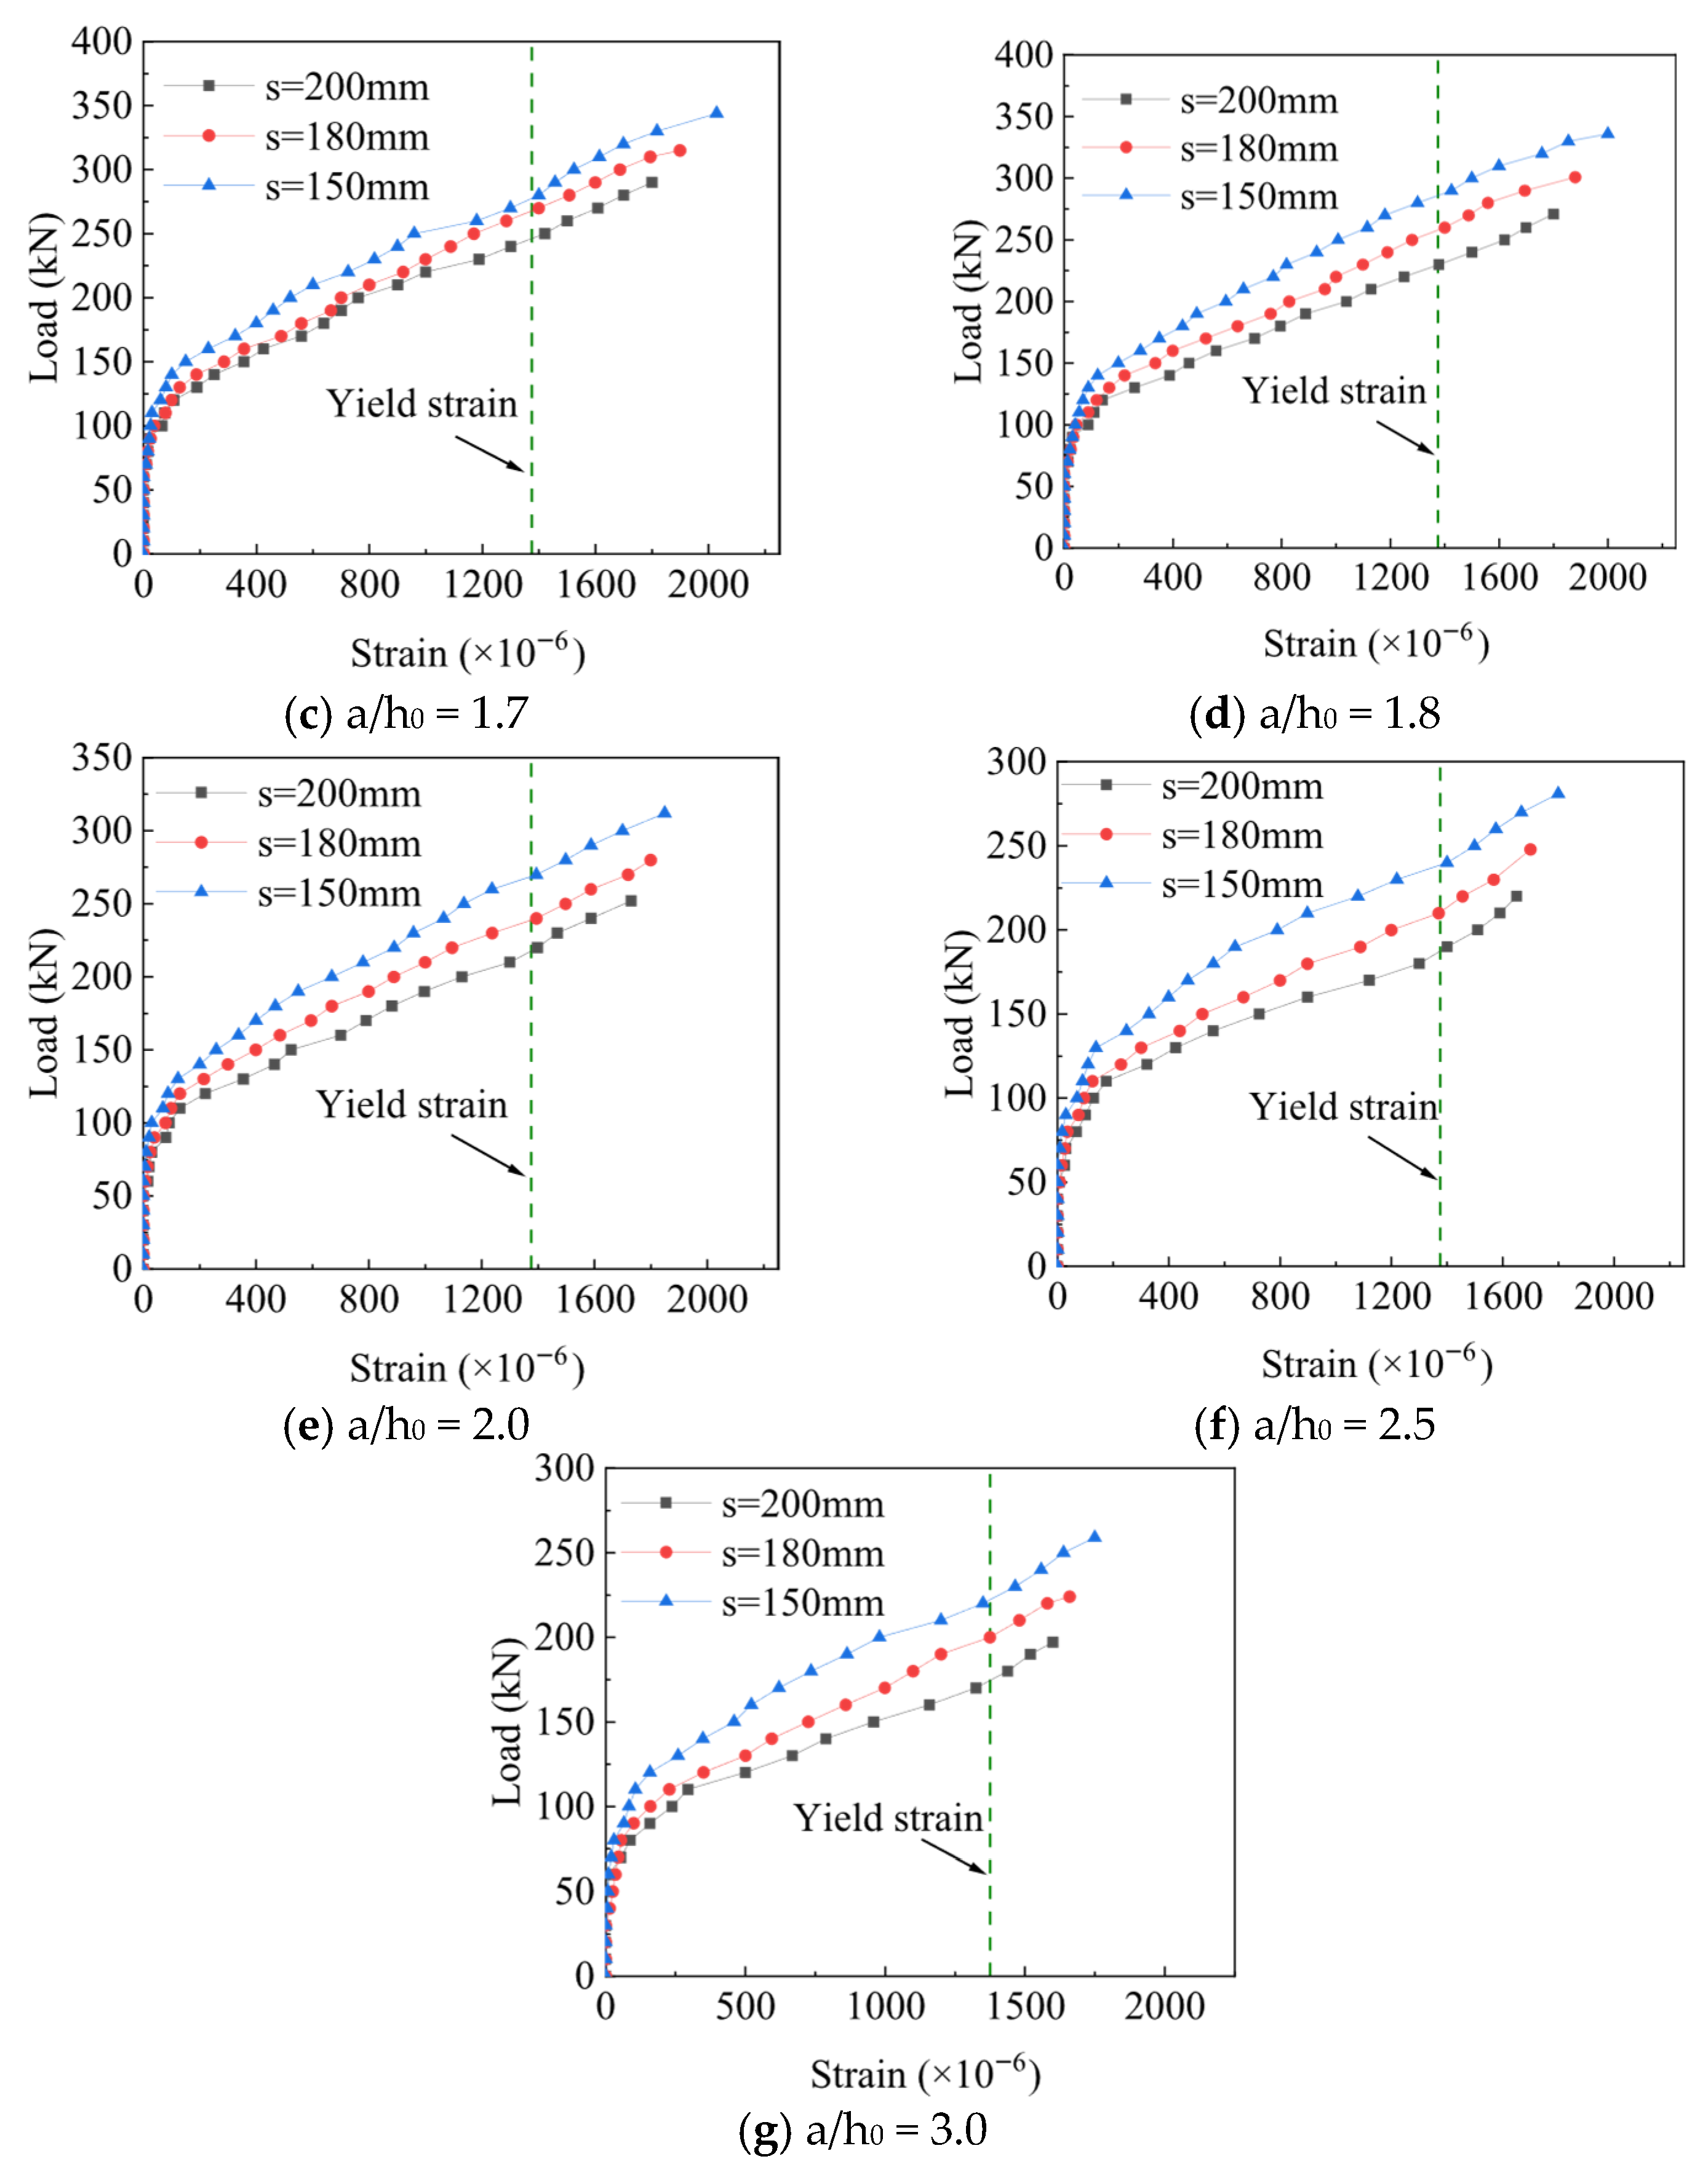
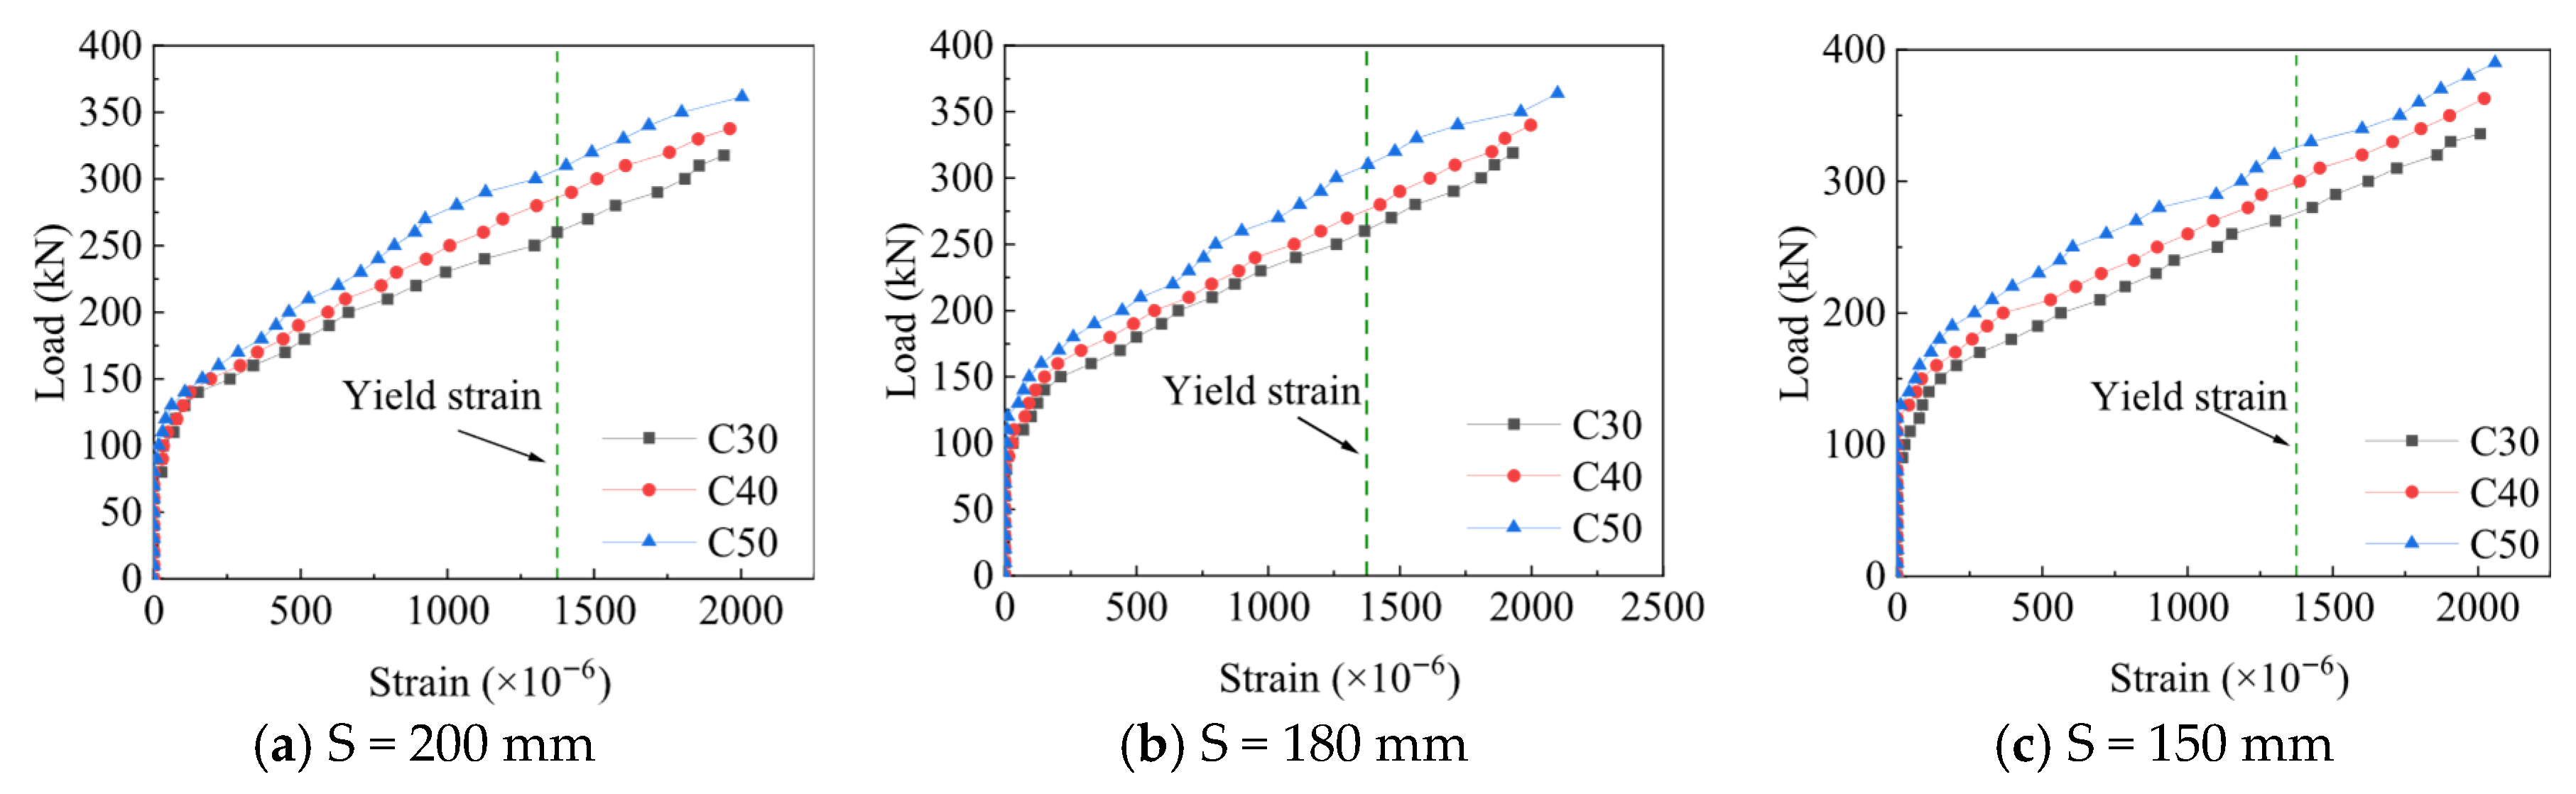
3.1.1. Influence on the Strain of Vertical Steel Strip of SIPF Beam
- (1)
- SSR
- (2)
- Steel strip spacing
- (3)
- Concrete strength
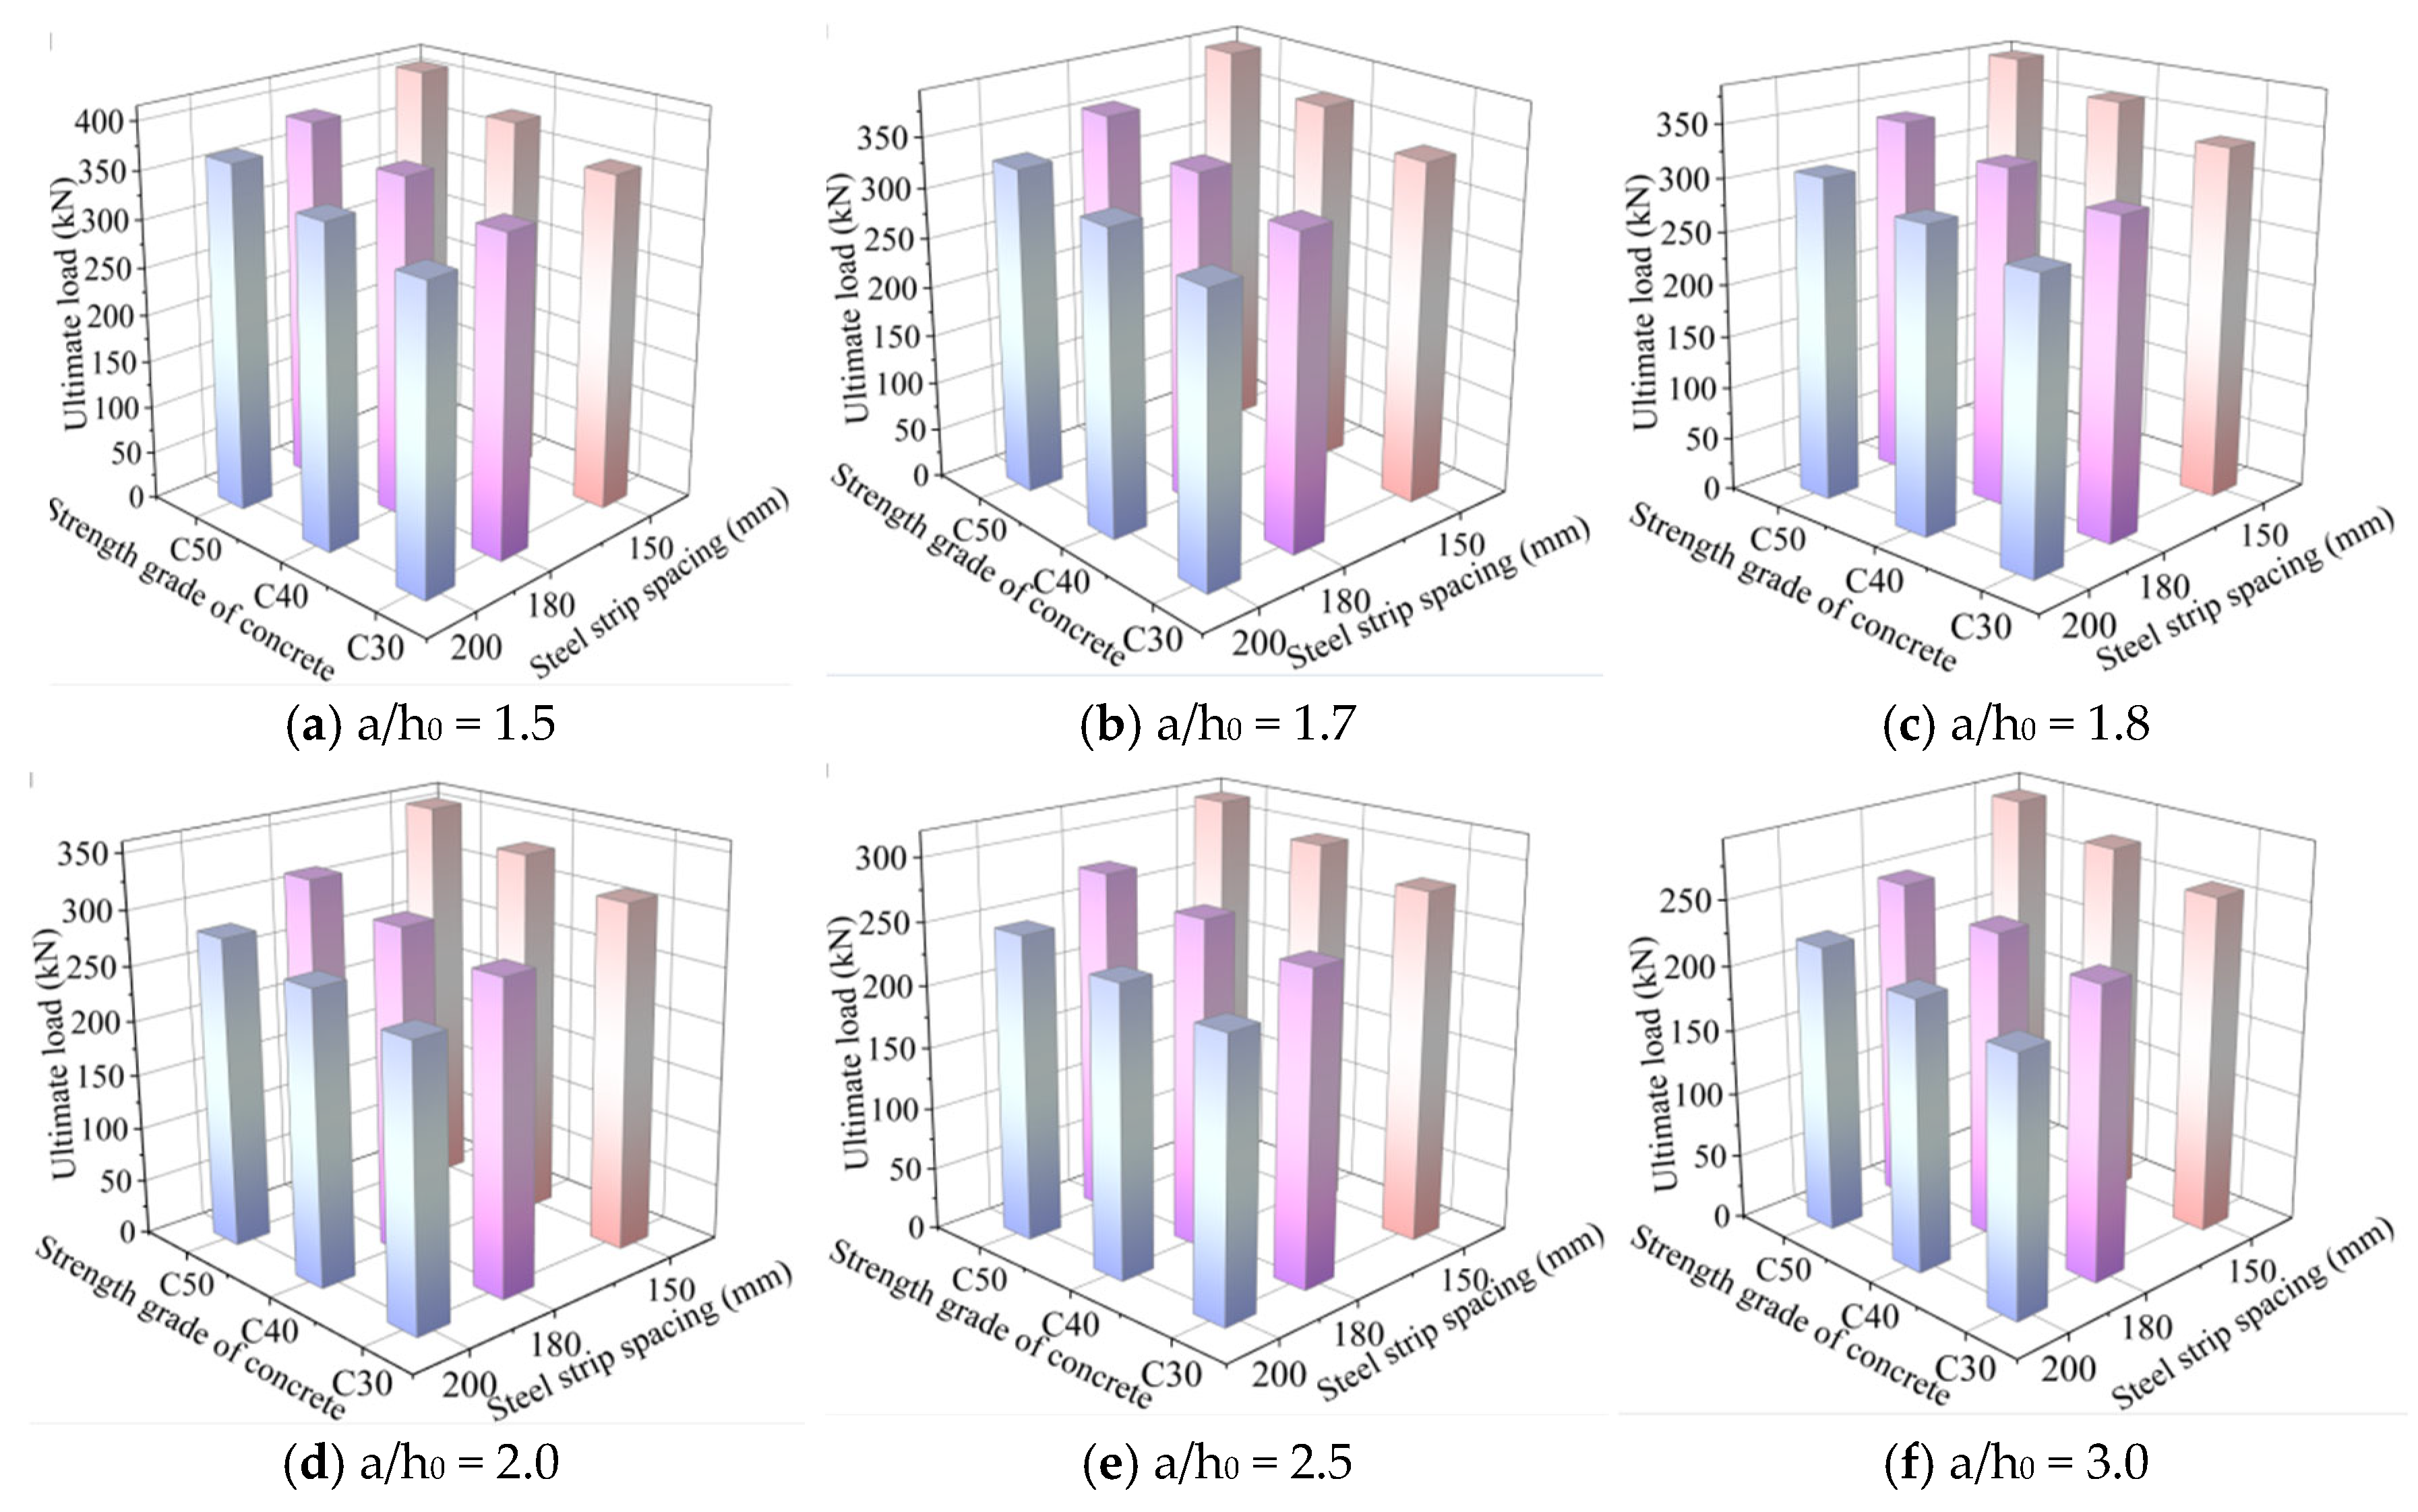
3.1.2. Influence on the Shear Capacity of SIPF Beams
- (1)
- SSR
- (2)
- Steel strip spacing
- (3)
- Concrete strength
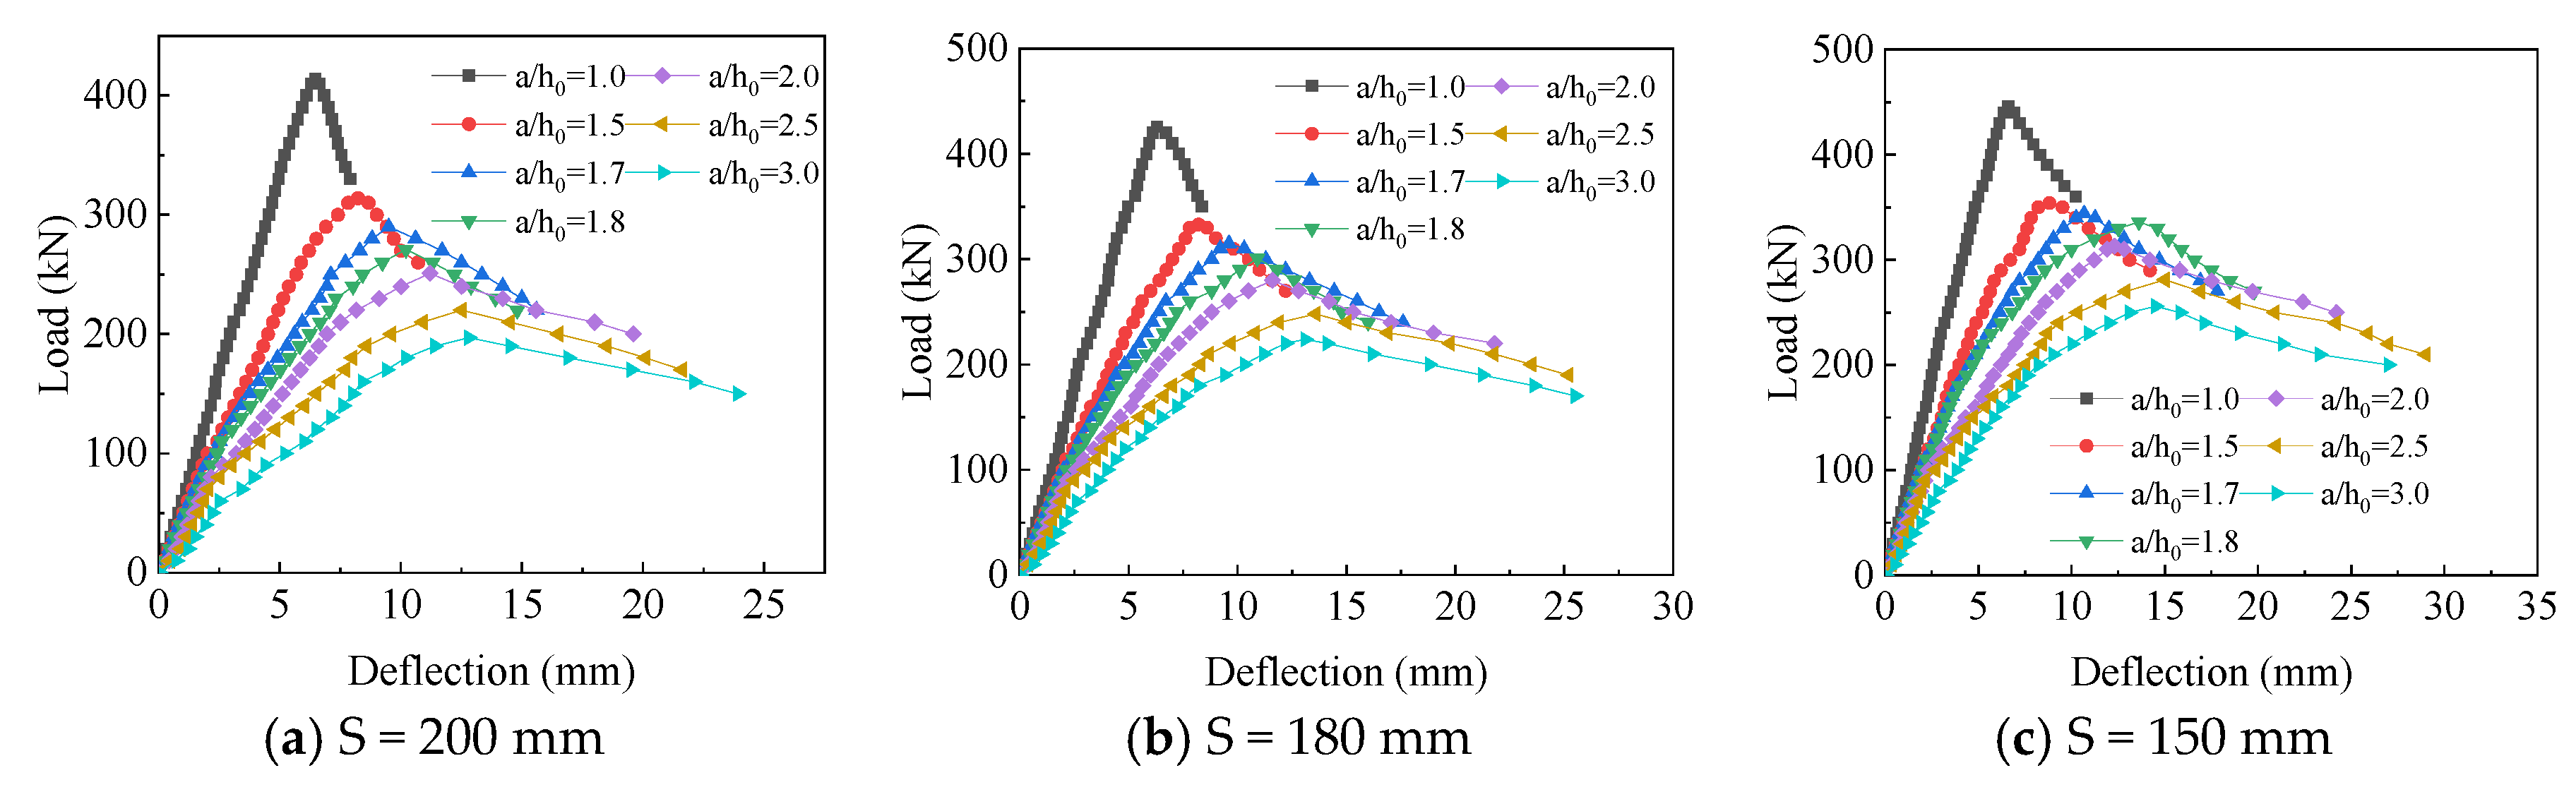
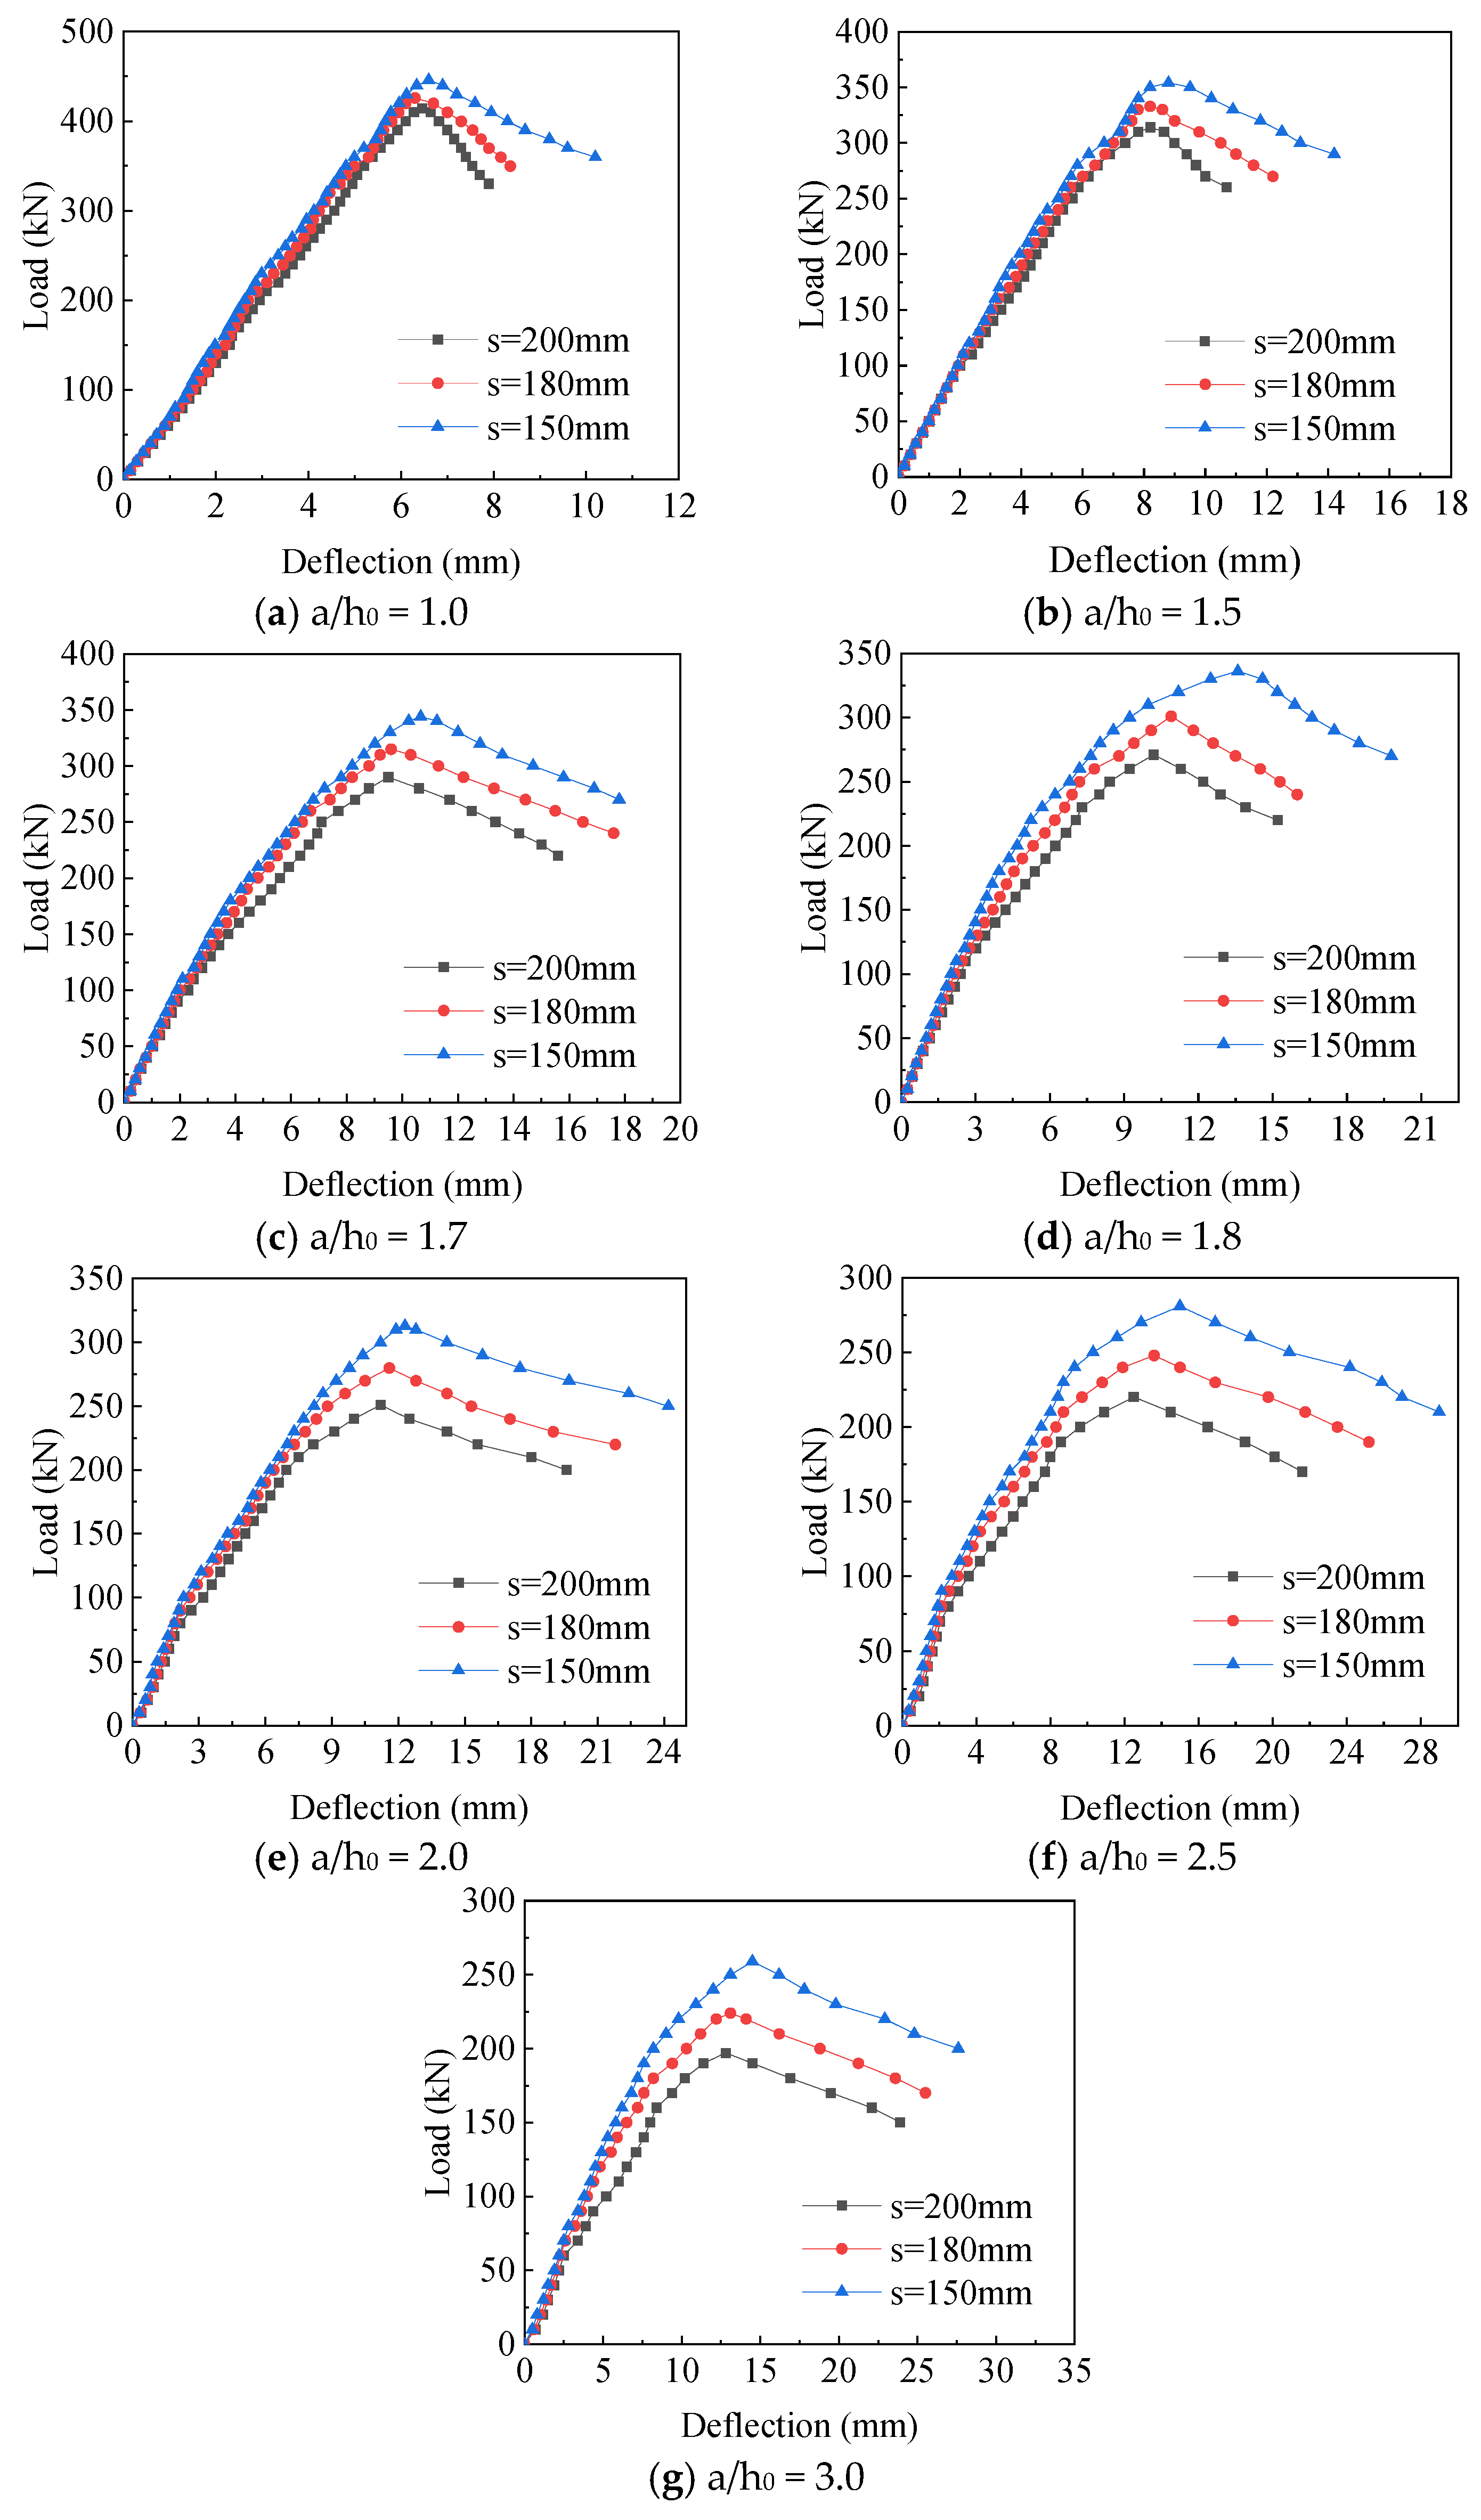
3.1.3. Influence on the Deformation of SIPF Beams
- (1)
- SSR
- (2)
- Steel strip spacing
3.2. Ductility Analysis
4. Establishment of the Formula of the Shear Bearing Capacity of SIPF Beams in Oblique Section
4.1. Shear Capacity Analysis
4.2. Role of Trusses
- (1)
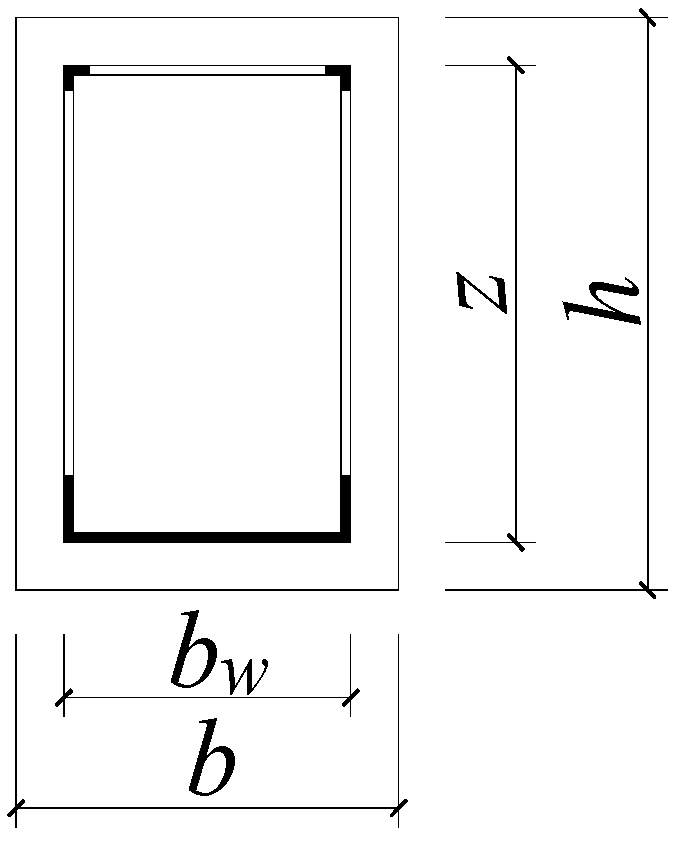
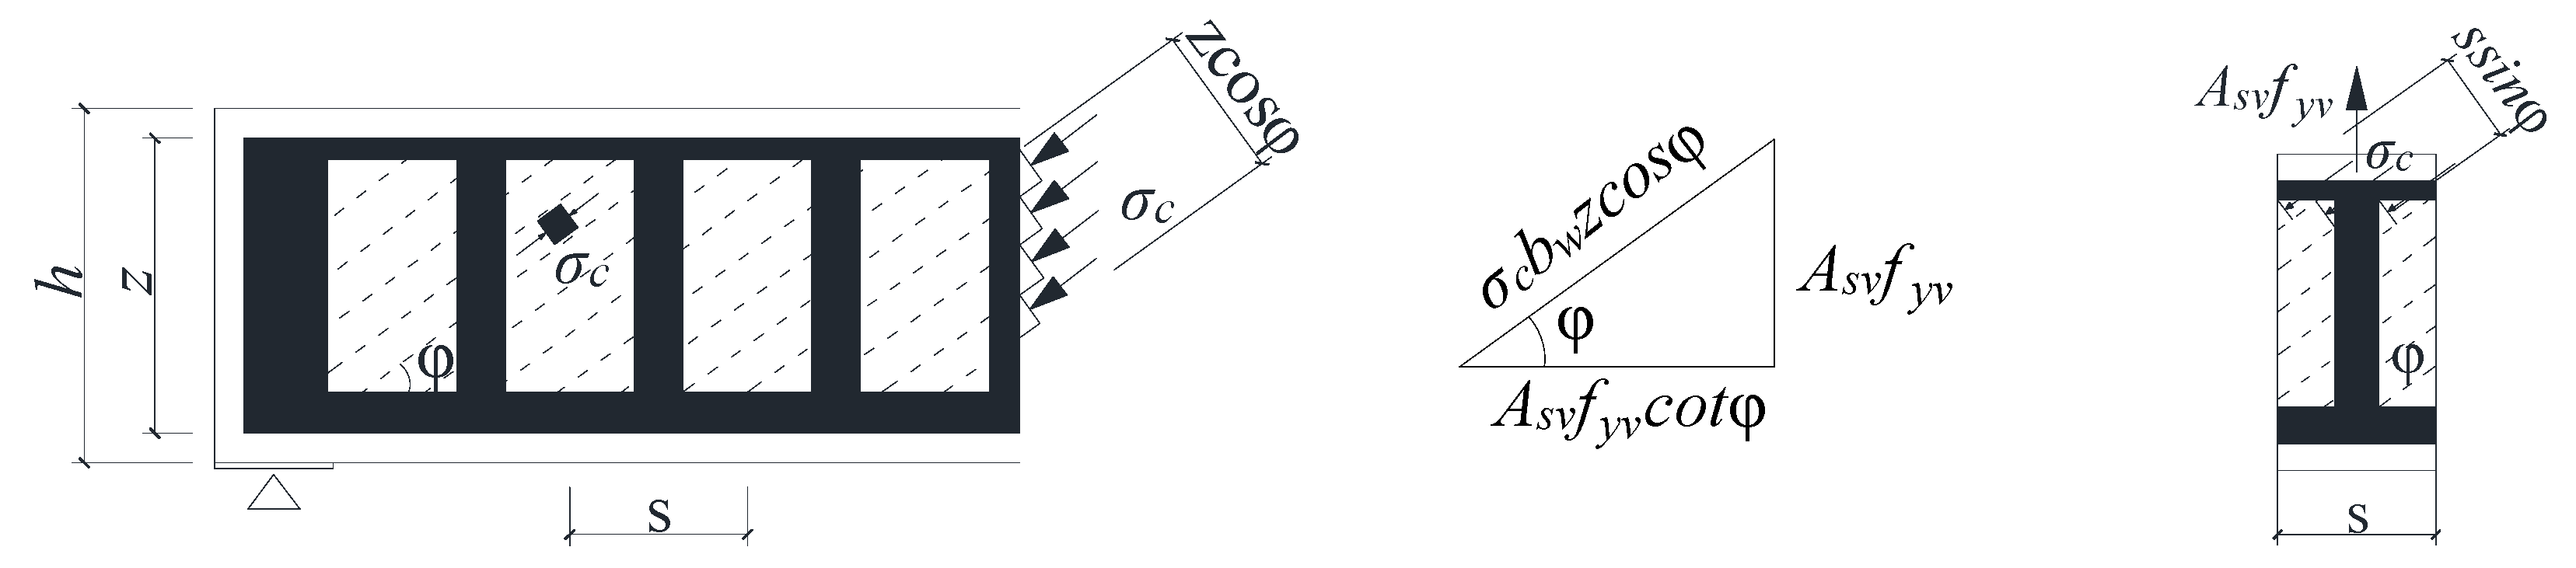
- Establishment of truss model
- (2)
- Shear borne by the truss model
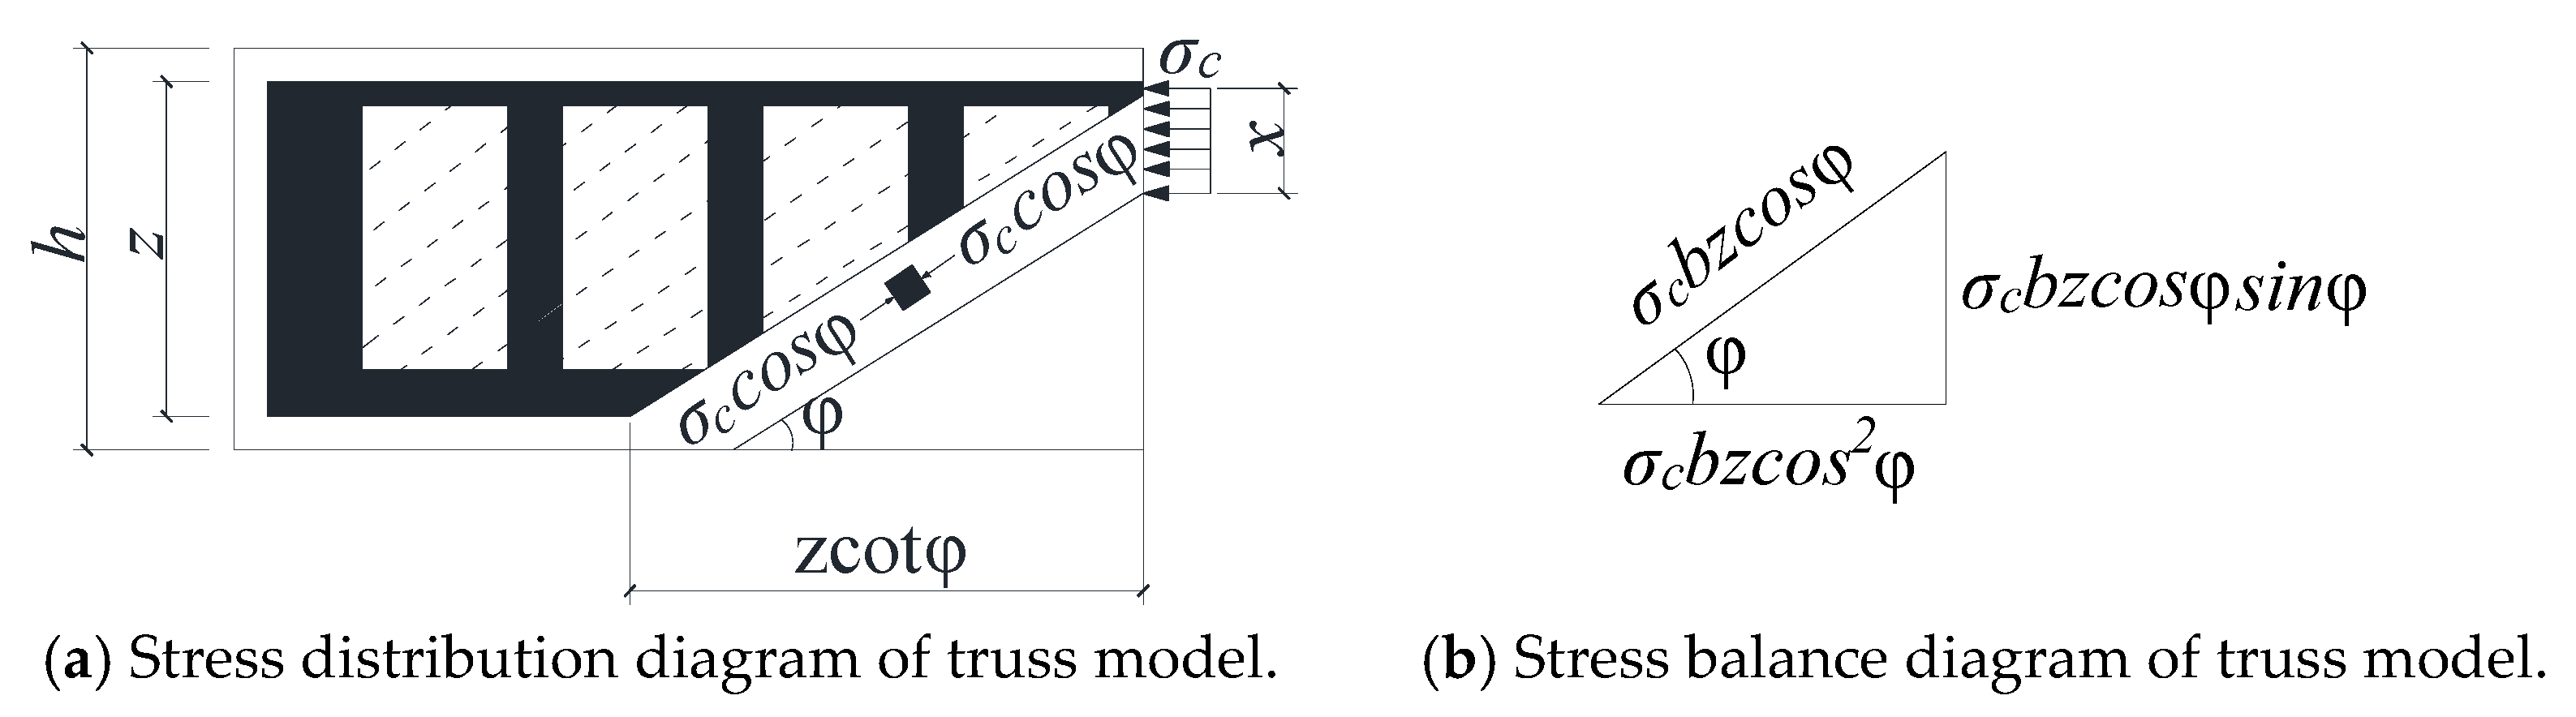
4.3. Arch Action
- (1)
- Establishment of arch model
- (2)
- Shear force borne by the arch model
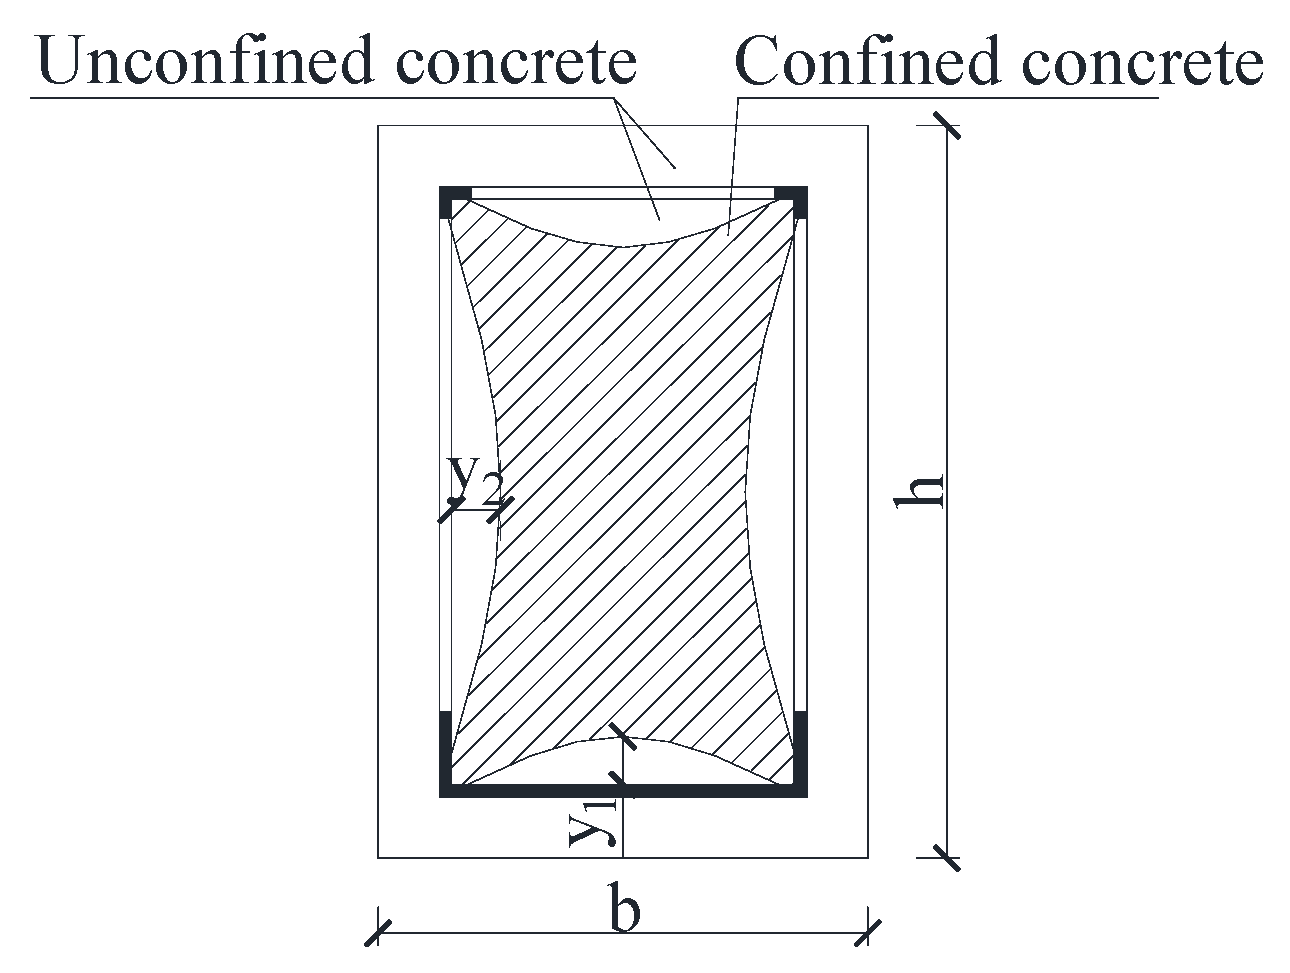
4.4. Restraint Effect of Holed Steel Pipe on Core Concrete
4.5. Practical Formula of SIPF Beam Shear Bearing Capacity
4.6. Formula Precision Comparison
5. Conclusions
- Compared with the laboratory test results, the maximum error of the simulation model for the shear bearing capacity of SIPF beams with steel tube skeleton with holes is 3.8%, which indicates that the FE model has a high calculation accuracy and can be used for the simulation analysis of this type of structure.
- The FE simulation results show that the yield, peak load, and stiffness of SIPF beams decrease with the increase in SSR and steel strip spacing. For an SIPF beam with a steel strip spacing of 200 mm, the ultimate load at SSR = 1.5 is 15.9% higher than that at SSR = 1.8. When SSR = 1.5, the shear strength of the SIPF beam with a steel strip spacing of 180 mm and 150 mm increases by 6.1% and 12.7%, respectively, compared with the SIPF beam with a steel strip spacing of 200 mm. When the concrete strength increases from C30 to C50, the shear capacity of SIPF beam decreases slowly with the increase in SSR.
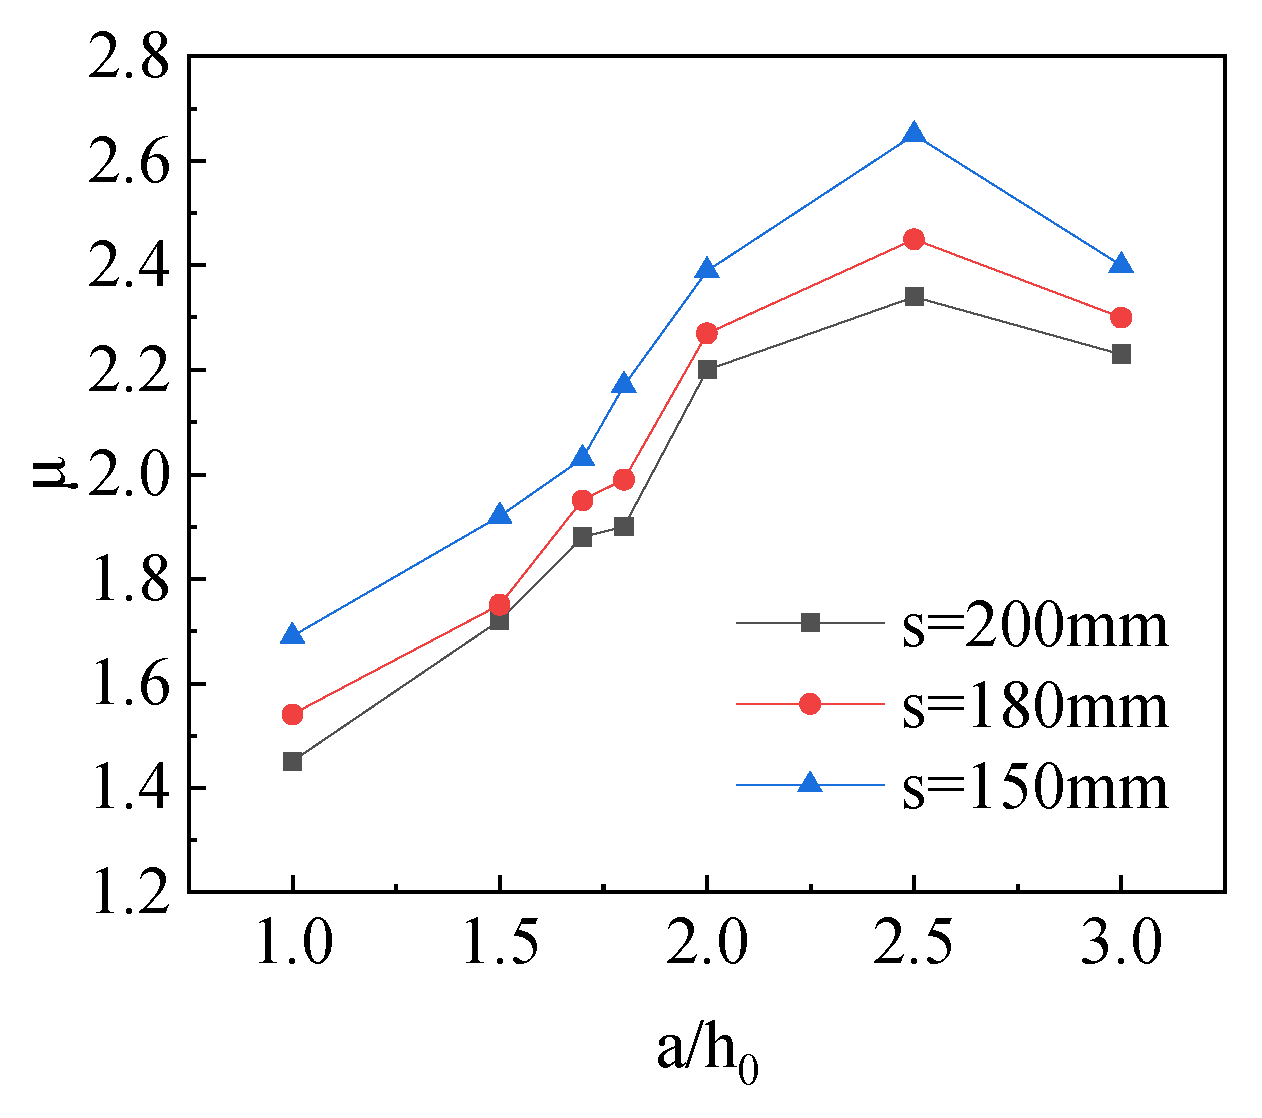
- The relationship between the SSR and the steel strip spacing has great influence on the ductility of the SIPF beam. When the SSR is too small, that is, SSR = 1.0, the SIPF beam will suffer baroclinic failure. When the SSR increases from 1.5 to 2.5, the ductility coefficient of the SIPF beam with 200 mm strip spacing increases from 1.72 to 2.34. The ductility coefficient of the SIPF beam with a steel strip spacing of 180 mm is increased from 1.75 to 2.45; the ductility coefficient of an SIPF beam with a steel strip spacing of 150 mm increases from 1.92 to 2.60.
- Taking SSR, steel strip spacing, and concrete strength as variables, and considering the improvement of the shear strength of the steel pipe confined core concrete, a formula for calculating the shear strength of the steel pipe skeleton SIPF beam with holes is established. Compared with the standard formulas of other countries, the calculated results of the formulas established in this paper are in the best agreement with the experimental results and have higher calculation accuracy. The formula established in this paper can provide reference for the calculation of the shear capacity of SIPF beams in similar projects.
Author Contributions
Funding
Data Availability Statement
Conflicts of Interest
References
- Raza, S.; Manshadi, B.; Sakha, M.; Widmann, R.; Wang, X.; Fan, H.; Shahverdi, M. Load transfer behavior of 3D printed concrete formwork for ribbed slabs under eccentric axial loads. Eng. Struct. 2025, 322, 119148. [Google Scholar] [CrossRef]
- Wang, H.; Shen, J.; Sun, X.; Dong, W.; Gao, J. Numerical investigation on shear behaviour of reinforced concrete beam with 3D printed concrete permanent formwork. J. Build. Eng. 2025, 100, 111706. [Google Scholar] [CrossRef]
- Gappmaier, P.; Reichenbach, S.; Kromoser, B. Advances in formwork automation, structure and materials in concrete construction. Autom. Constr. 2024, 162, 105373. [Google Scholar] [CrossRef]
- Huang, H.; Peng, Z.; Hou, J.; Zheng, X.; Ding, Y.; Wu, H. Study on the Ultimate Load-Bearing Capacity of Disc Buckle Tall Formwork Support Considering Uncertain Factors. Buildings 2024, 14, 828. [Google Scholar] [CrossRef]
- Hai, N.M.; Fujikura, S.; Rin, T.V.; Shinoda, Y.; Nam, P.H.; Tuan, N.D.; Thuy, M.T.T.; Van Huong, N.; Phuong, P.N. Experimental and finite element analysis of permanent formwork impacts on flexural failures of reinforced concrete beams. Eng. Fail. Anal. 2025, 168, 109069. [Google Scholar] [CrossRef]
- Albrecht, S.V.; Hellerbrand, S.; Weininger, F.; Thiel, C. Strategies for Minimizing Environmental Impact in Construction: A Case Study of a Cementitious 3D Printed Lost Formwork for a Staircase. Materials 2025, 18, 825. [Google Scholar] [CrossRef] [PubMed]
- Geng, J.; Cheng, W.; Liu, G. Enhancing interface shear performance and bending resistance of UHPC permanent formwork for composite short beams by different interface treatment. J. Build. Eng. 2024, 85, 108736. [Google Scholar] [CrossRef]
- Zhao, J.; Li, S.; Zhao, L.; Wang, H. Interface bonding behavior between alkali-activated ultra-high toughness permanent formwork and normal concrete: Experimental study and theoretical analysis. J. Build. Eng. 2025, 100, 111679. [Google Scholar] [CrossRef]
- Du, Y.; Shi, C.; Kang, S.B.; Amer, M.; Zhao, B.; Zhang, Y. Eccentric compression behaviors of iron tailings and recycled aggregate concrete-filled steel tube columns. J. Constr. Steel Res. 2024, 223, 109070. [Google Scholar] [CrossRef]
- Lan, J.; Dai, J.; Jia, B.; Yan, Q.; Yang, Z. Experimental Study on the Mechanical Properties of Reactive Powder Concrete Ultra-Thin Precast Slab for Bridge I-Beam Joints. Buildings 2024, 14, 3977. [Google Scholar] [CrossRef]
- Wang, X.; Ren, F. Research on axial compression performance of concrete columns with angle steel embedded in BMSCC stay-in-place formwork. Case Stud. Constr. Mater. 2023, 19, e02688. [Google Scholar] [CrossRef]
- Dehkordi, E.R.; Ramezanianpour, A.A.; Moodi, F. Application of pre-fabricated geopolymer permanent formworks (PGPFs): A novel approach to provide durability and mechanical strength of reinforced concrete. J. Build. Eng. 2022, 45, 103517. [Google Scholar] [CrossRef]
- Bong, S.H.; Nematollahi, B.; Mechtcherine, V.; Li, V.C.; Khayat, K.H. Three-Dimensional-Printed Engineered, Strain-Hardening Geopolymer Composite as Permanent Formwork for Construction of Reinforced Concrete Beam. ACI Struct. J. 2024, 121, 37–48. [Google Scholar] [CrossRef]
- Fahmy, E.H.; Shaheen, Y.B.I.; Abdelnaby, A.M.; Zeid, M.N.A. Applying the Ferrocement Concept in Construction of Concrete Beams Incorporating Reinforced Mortar Permanent Forms. Int. J. Concr. Struct. Mater. 2014, 8, 83–97. [Google Scholar] [CrossRef]
- Xu, C. Study on the Mechanical Behavior of Concrete Beams Without Demolition-Formwork. Master’s Thesis, Harbin Institute of Technology, Harbin, China, 2018. [Google Scholar]
- Sylaj, V.; Jawdhari, A.; Fam, A. Sandwich concrete beams with GFRP side faces tested and modeled in flexure. Thin-Walled Struct. 2022, 179, 109703. [Google Scholar] [CrossRef]
- Gai, X. Fibre Reinforced Polymer (FRP) Stay-In-Place (SIP) Participating Formwork for New Construction. Master’s Thesis, University of Bath, Bath, UK, 2012. [Google Scholar]
- Gai, X.; Darby, A.; Ibell, T.; Evernden, M. Experimental investigation into a ductile FRP stay-in-place formwork system for concrete slabs. Constr. Build. Mater. 2013, 49, 1013–1023. [Google Scholar] [CrossRef]
- Wu, X.; Lin, Y. Flexural behavior of UHPC-RC composite beam. Steel Compos. Struct. 2016, 22, 387–398. [Google Scholar] [CrossRef]
- Wu, X.; Kang, T.H.K.; Lin, Y.; Hwang, H.-J. Shear strength of reinforced concrete beams with precast High-Performance Fiber-Reinforced Cementitious Composite permanent form. Compos. Struct. 2018, 200, 829–838. [Google Scholar] [CrossRef]
- Azizinamini, A.; Rehmat, S.; Sadeghnejad, A. Enhancing Resiliency and Delivery of Bridge Elements using Ultra-High Performance Concrete as Formwork. Transp. Res. Rec. J. Transp. Res. Board 2019, 2673, 443–453. [Google Scholar] [CrossRef]
- Zhang, P.; Xu, F.; Liu, Y.; Sheikh, S.A. Shear behaviour of composite beams with permanent UHPC formwork and high-strength steel rebar. Constr. Build. Mater. 2022, 352, 128951. [Google Scholar] [CrossRef]
- Bai, M.; Xiao, J.; Wu, Y.; Ding, T. Experimental and numerical study on the flexural behavior of 3D-printed composite beams with U-shaped ECC formwork. Eng. Struct. 2024, 312, 15. [Google Scholar] [CrossRef]
- Ge, W.; Zhang, Z.; Ashour, A.; Guan, Z.; Jiang, H.; Sun, C.; Qiu, L.; Yao, S.; Cao, D. Flexural performance of prefabricated U-shaped UHPC permanent formwork–concrete composite beams reinforced with FRP bars. Arch. Civ. Mech. Eng. 2023, 23, 108. [Google Scholar] [CrossRef]
- Yin, S.; Cong, X.; Wang, C.; Wang, C. Research on flexural performance of composited RC beams with different forms of TRC permanent formwork. Structures 2021, 29, 1424–1434. [Google Scholar] [CrossRef]
- Shen, Y.; Xu, Z.; Fang, S.; Chen, Q.; Ba, M.; Zhang, Y. Effects of heavy metal sludge sintered and ground powder on properties of modified magnesium oxysulfate (MMOS) cementitious materials. Case Stud. Constr. Mater. 2024, 21, e03601. [Google Scholar] [CrossRef]
- Cui, J.; Ma, H.; Ma, Z.; Wang, S.; Ji, L.; Ba, M. Effects of sintered secondary aluminum ash grinding fine power on the properties of modified magnesium oxysulfate cement-based materials. Constr. Build. Mater. 2025, 468, 140428. [Google Scholar] [CrossRef]
- Zhou, J.; Guan, Y.; Hu, Z.; Bi, W.; Chang, J.; Zhang, T. Performance variations of light burned magnesia under different calcination parameters and its effects on magnesium oxysulfate cement preparation. Constr. Build. Mater. 2024, 450, 138500. [Google Scholar] [CrossRef]
- Zhao, Y.; He, D.; Liu, X.; Guo, Z.; Liu, C.; Gao, J. Performance and microstructural analysis of modified magnesium oxysulfate cement with additions: Roles of FA and GGBS. Case Stud. Constr. Mater. 2024, 21, e03941. [Google Scholar] [CrossRef]
- Wang, X.; Li, H.; Wang, S. Study on mechanical properties of E-glass mat reinforced basic magnesium sulfate cement thin-slab. Constr. Build. Mater. 2024, 436, 137028. [Google Scholar] [CrossRef]
- Wang, X.; Li, H.; Wang, S. Study on shear performance of BMSCC prefabricated shell and square steel tube composite permanent formwork beam. Constr. Build. Mater. 2024, 449, 138437. [Google Scholar] [CrossRef]
- GB 50010-2010; Code for the Design of Concrete Structures. Ministry of Housing and Urban-Rural Development of China: Beijing, China, 2010.
- Karthik, M.M.; Mander, J.B. Stress-Block Parameters for Unconfined and Confined Concrete Based on a Unified Stress-Strain Model. J. Struct. Eng. 2011, 137, 270–273. [Google Scholar] [CrossRef]
- Bao, Z. Finite Element Modelling of Static Behavior of Concrete-Filled Steel Tubular Members Besed on Improved Plastic-Damage Model. Master’s Thesis, East China Jiaotong University, Nanchang, China, 2021. [Google Scholar]
- Yang, S. Basic Mechanical Properties and Constitutive Relations of Basic Magnesium Sulfate Cement Concrete. Master’s Thesis, Nanjing University of Aeronautics and Astronautics, Nanjing, China, 2017. [Google Scholar]
- Du, C.; Chen, X.; Yang, Y.; Chen, Y.; Jiang, S. Experimental Study on the Complete Tensile Stress-Deformation Curve of Fully Graded Concrete. Exp. Tech. 2018, 42, 491–497. [Google Scholar] [CrossRef]
- Wang, T.; Kang, G. Japanese seismic Guide Model for calculating shear strength of reinforced concrete members. Build. Struct. 2000, 30, 3. [Google Scholar] [CrossRef]
- Guo, S. Study on Shear Properties of RC Beams with Ultra-High Toughness Cement-Based Composites. Master’s Thesis, Dalian University of Technology, Dalian, China, 2017. [Google Scholar]


| Number | Test | Simulation | ||||
|---|---|---|---|---|---|---|
| Ultimate Load | Deflection | Ultimate Load | Deviation | Deflection | Deviation | |
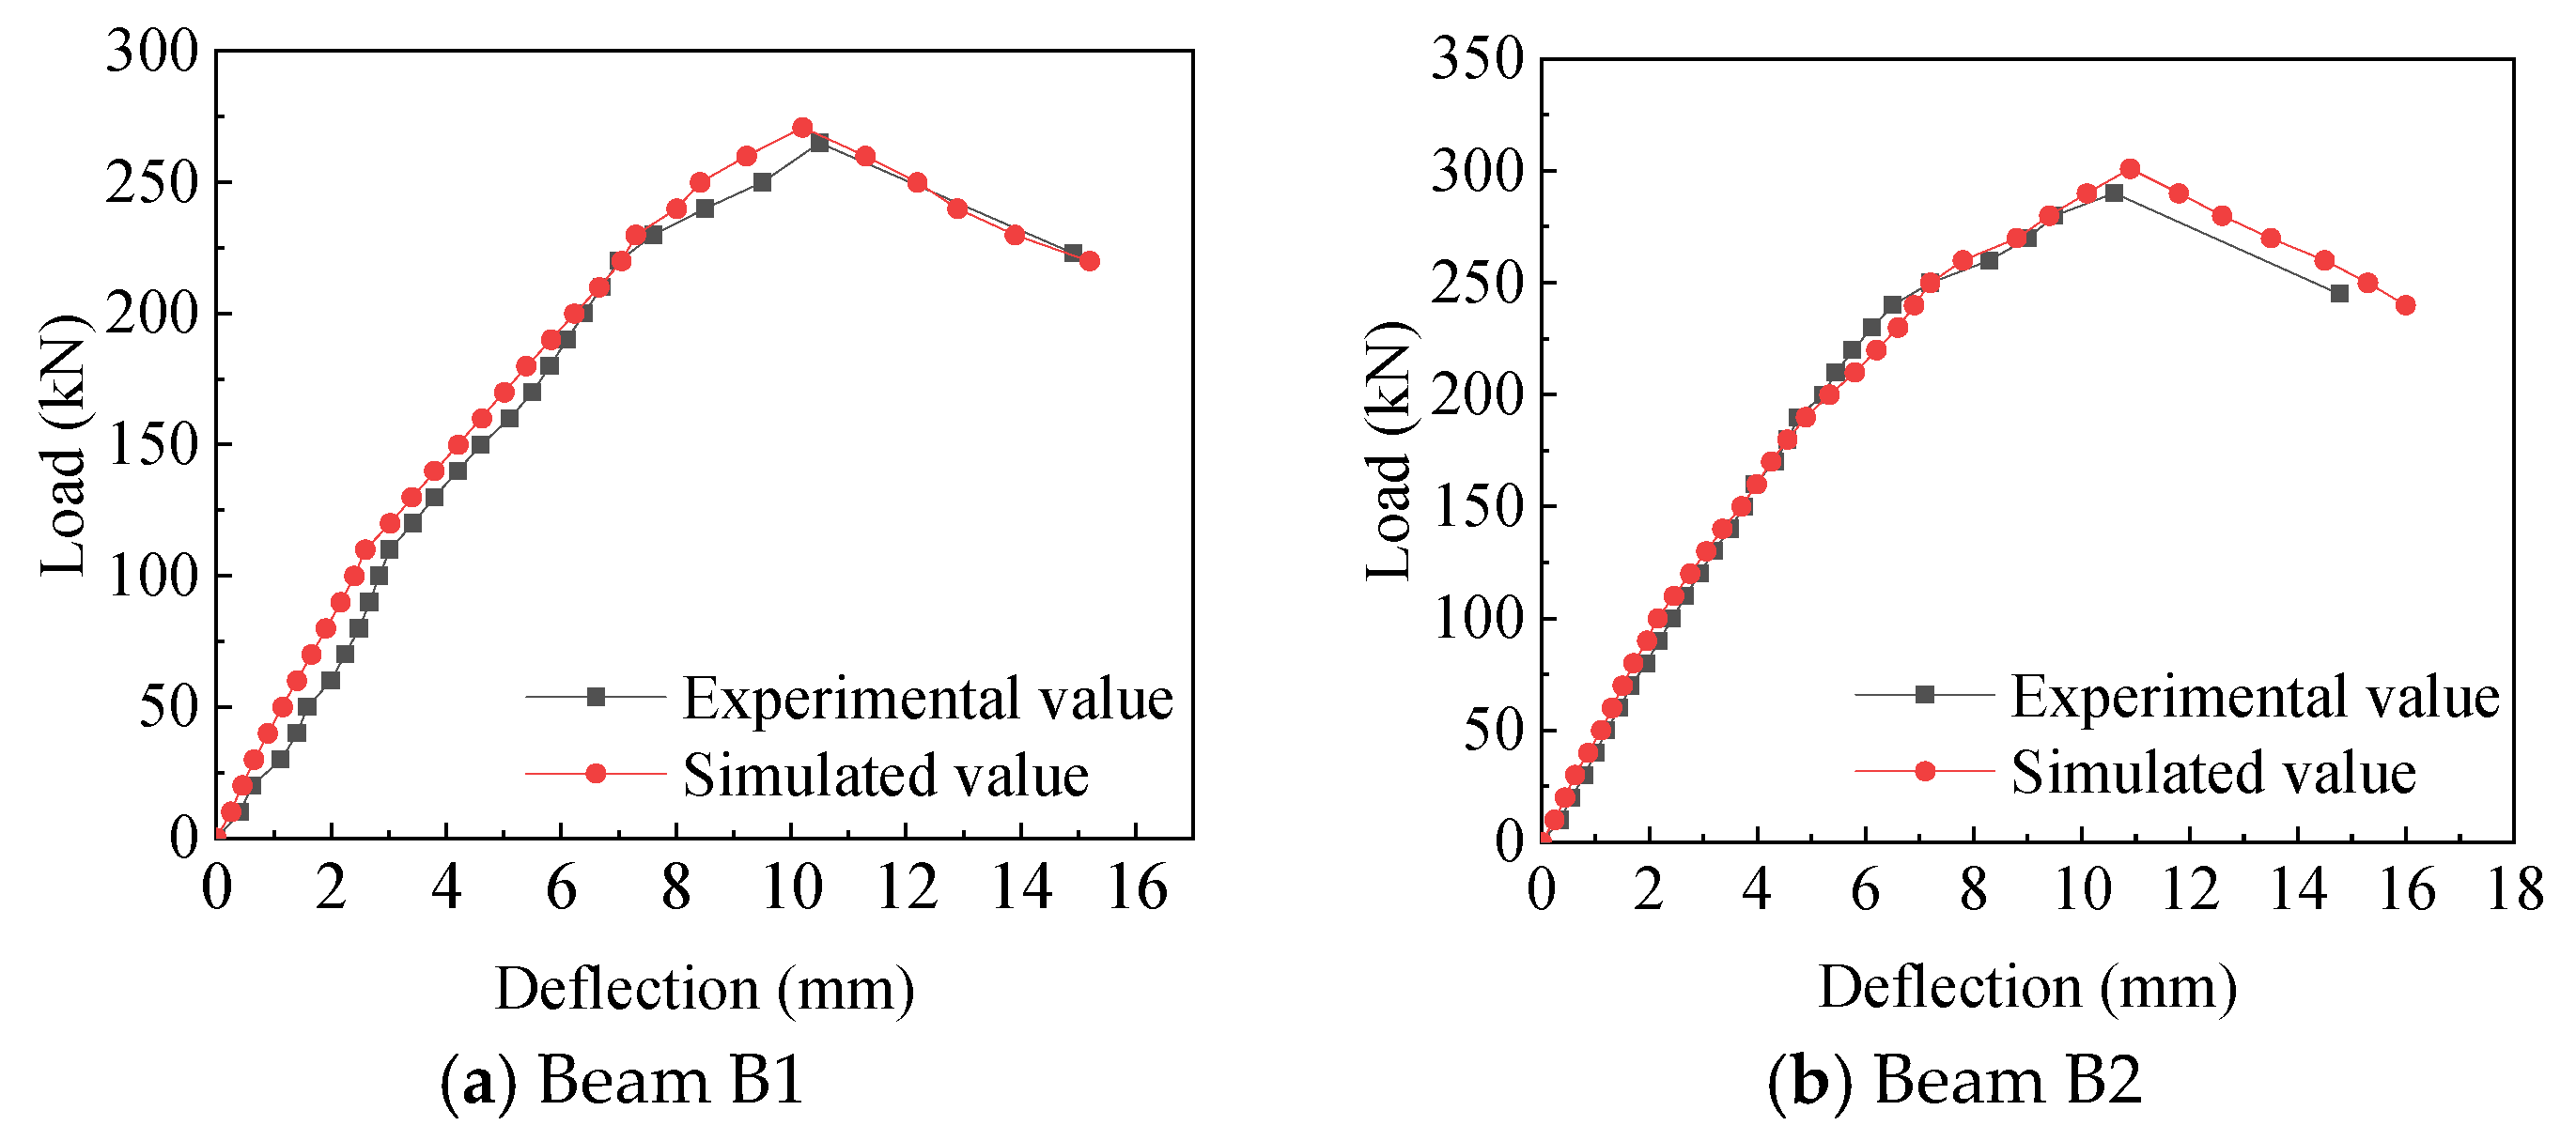
| B1 | 265 | 14.9 | 271 | 2.3% | 15.2 | 2.0% |
| B2 | 290 | 14.8 | 301 | 3.8% | 16 | 8.1% |
| Computing Method | Load Patterns | Calculated Value/Test Value | SD | CV |
|---|---|---|---|---|
| GB 50010-2010 | Concentrated | 0.92 | 0.084 | 0.091 |
| ACI318-08 | Concentrated | 1.12 | 0.044 | 0.039 |
| EN 1992-1-1:2014 | Concentrated | 0.77 | 0.024 | 0.042 |
| Proposed method | Concentrated | 1.01 | 0.090 | 0.089 |
Disclaimer/Publisher’s Note: The statements, opinions and data contained in all publications are solely those of the individual author(s) and contributor(s) and not of MDPI and/or the editor(s). MDPI and/or the editor(s) disclaim responsibility for any injury to people or property resulting from any ideas, methods, instructions or products referred to in the content. |
© 2025 by the authors. Licensee MDPI, Basel, Switzerland. This article is an open access article distributed under the terms and conditions of the Creative Commons Attribution (CC BY) license (https://creativecommons.org/licenses/by/4.0/).
Share and Cite
Li, L.; Shang, C.; Wang, X. Study on the Shear Performance of MMOM Stay-in-Place Formwork Beams Reinforced with Perforated Steel Pipe Skeleton. Buildings 2025, 15, 2638. https://doi.org/10.3390/buildings15152638
Li L, Shang C, Wang X. Study on the Shear Performance of MMOM Stay-in-Place Formwork Beams Reinforced with Perforated Steel Pipe Skeleton. Buildings. 2025; 15(15):2638. https://doi.org/10.3390/buildings15152638
Chicago/Turabian StyleLi, Lingling, Chuanhe Shang, and Xiaodong Wang. 2025. "Study on the Shear Performance of MMOM Stay-in-Place Formwork Beams Reinforced with Perforated Steel Pipe Skeleton" Buildings 15, no. 15: 2638. https://doi.org/10.3390/buildings15152638
APA StyleLi, L., Shang, C., & Wang, X. (2025). Study on the Shear Performance of MMOM Stay-in-Place Formwork Beams Reinforced with Perforated Steel Pipe Skeleton. Buildings, 15(15), 2638. https://doi.org/10.3390/buildings15152638