Article

Optimizing Urban Thermal Environments Through 2D/3D Landscape Pattern Analysis: A Machine Learning-Driven Approach for the Yangtze River Delta Urban Agglomeration

1
Institute of Remote Sensing and Earth Sciences, Hangzhou Normal University, Hangzhou 311121, China
2
Center for Environmental Remote Sensing, Chiba University, Chiba 263-8522, Japan
*
Author to whom correspondence should be addressed.
Buildings 2025, 15(13), 2261; https://doi.org/10.3390/buildings15132261
Submission received: 23 May 2025 / Revised: 24 June 2025 / Accepted: 25 June 2025 / Published: 27 June 2025
(This article belongs to the Section Building Energy, Physics, Environment, and Systems)

Abstract

To address the escalating urban heat stress driven by global warming and rapid urbanization, this study integrates multi-source remote sensing data to assess the spatiotemporal dynamics of summer thermal comfort across the Yangtze River Delta Urban Agglomeration (YRDUA) from 2000 to 2020. By combining 2D landscape pattern metrics with 3D building morphological features, this study employs an XGBoost model enhanced with SHAP and PDP techniques to reveal the nonlinear and threshold effects of landscape configurations on the Universal Thermal Climate Index (UTCI). The results show the following: (1) during the study period, over 90% of the region experienced strong or extreme heat stress, and 76.8% of the area exhibited a rising UTCI trend, with an average increase of 0.09 °C per year; (2) forest coverage exceeding 50% reduced the UTCI by approximately 2.5 °C, and an increased water area lowered the UTCI by around 1.5 °C, while highly clustered cropland intensified the UTCI by about 1.5 °C; and (3) a moderate increase in building height and shape complexity improved ventilation and shading, reducing the UTCI by roughly 0.5 °C. These findings highlight that optimizing the blue–green infrastructure and 3D urban form are effective strategies to mitigate urban heat stress, offering scientific guidance for sustainable urban planning.

1. Introduction

Global warming and urbanization have triggered a series of environmental issues, exacerbating energy consumption. Prolonged exposure to high-temperature environments disrupts normal thermoregulation in humans, significantly increasing the risk of heat-related illnesses and mortality [1,2]. A comfortable outdoor thermal environment can greatly enhance residents’ willingness to engage in outdoor activities, improving their quality of life and health [3]. Furthermore, improving the utilization of outdoor spaces can reduce the reliance on air conditioning, thereby lowering the indoor energy consumption [4]. Therefore, exploring the spatiotemporal variations in thermal comfort and identifying its influencing factors are crucial for designing rational public outdoor spaces and mitigating the adverse health impacts caused by thermal discomfort.
In recent years, the formation and impacts of urban thermal environments have attracted widespread attention. To assess and monitor changes in urban thermal environments, temperature data from ground weather stations and satellite remote sensing have been widely used in related studies [5,6]. The land surface temperature (LST) is one of the most common indicators reflecting thermal environments, and it is widely used for assessing urban thermal environments to study urban heat islands and heatwave risks [7,8]. However, human thermal comfort depends on complex environmental conditions. It is limiting to use the LST as a standard to measure human thermal comfort, ignoring the contribution of meteorological factors such as humidity and wind. While thermal comfort is primarily influenced by meteorological elements, including air temperature, relative humidity, solar radiation, and wind speed [9], individual differences also influence human thermal comfort. In general, thermal perception is determined by physiological and psychological factors, and behavioral responses to thermal environments vary by gender, age, and activity type [10]. The commonly used thermal comfort index is classified into three categories: field surveys, empirical indices, and physical indices [11]. The field surveys are based on on-site questionnaires, such as the Thermal Sensation Vote (TSV), which indicates the thermal comfort of the climate in a specific location [12]. However, the results are easily affected by the mood and understanding differences of respondents [13]. Empirical indices such as Wet-Bulb Globe Temperature (WBGT) and Wind Chill Index (WCI) focus on temperature, humidity, radiation, and wind speed influences, but lack integration with human physiological regulation mechanisms, limiting their applicability [14,15]. Consequently, researchers have developed physical indices that incorporate environmental parameters alongside human metabolic heat balance and clothing insulation, such as Physiological Equivalent Temperature (PET) and the Outdoor Standard Effective Temperature (OUT-SET*). However, PET and OUT-SET* perform well in specific climates but struggle in other environments, such as extreme cold or high-radiation environments [16]. The Universal Thermal Climate Index (UTCI) overcomes these limitations by introducing dynamic clothing models that convert thermal environments into equivalent temperatures across all climate conditions and scales, from macro to micro levels, providing a more accurate reflection of outdoor thermal environments [17,18]. Moreover, current research on thermal comfort often relies on field meteorological measurement data or meteorological station data, which cannot cover the entire region.
The landscape composition and configuration are key factors affecting the spatial distribution of thermal environments. Previous studies have shown significant differences in the LST across land cover types. Urbanization alters the thermal properties of land surfaces by replacing natural vegetation with impervious materials, which absorb and retain more solar radiation. This land use change reduces evaporative cooling and increases ambient temperatures, thereby intensifying the urban heat island effect and degrading local thermal comfort [19,20]. In contrast, urban green spaces and water bodies play a significant cooling role, and their landscape pattern indices can affect the cooling efficiency [21,22,23]. Kim et al. [24] found that the higher fragmentation, complex shapes, and lower proximity of green spaces can intensify the heat stress. Feng et al. [25] demonstrated that large-scale forests can improve thermal comfort, and concentrated water bodies enhance the cooling effects; conversely, clustered built-up areas degrade thermal comfort. Existing research has primarily focused on 2D landscapes’ impacts on thermal comfort; however, the role of 3D landscapes in urban thermal environments cannot be overlooked [26].
Linear models establish the relationship between independent and dependent variables based on the least squares method. Due to their strong interpretability and faster computational speed, they are widely used in the driver analysis of influencing factors [27]. Other studies employ geographically weighted regression models or multiscale geographically weighted regression models to address spatial heterogeneity and reveal spatial variations in the contribution of influencing factors [28,29]. Research indicates that nonlinear relationships may exist between the surface thermal environment and various influencing factors; hence, linear models fail to capture the nonlinear interactions and threshold effects between variables [30,31]. In recent years, with the advancement of machine learning techniques, nonlinear models have been increasingly used to more accurately discover complex interactions among various factors [32]. Random forest (RF) and gradient boosting are widely used algorithms in the field of machine learning. RF introduces random feature selection during the training of decision trees and derives final predictions by averaging results from multiple trees [33]. However, RF is prone to overfitting and suffers from poor model interpretability [34]. XGBoost, based on the gradient boosting algorithm, iteratively constructs multiple decision trees to progressively optimize the predictive performance. By leveraging gradient descent to minimize loss functions, incorporating regularization terms to prevent overfitting, and enabling parallel processing through multithreading to accelerate training, XGBoost offers superior accuracy, flexibility, robustness against overfitting, and enhanced handling of missing values [35,36]. Although complex machine learning models excel in predictive performance, they are often regarded as “black boxes” with obscure internal decision-making processes. Tools like SHAP (SHapley Additive exPlanations) and PDP (Partial Dependence Plot) address this interpretability challenge by explaining model predictions and quantifying the contribution of each feature to the output [37]. Therefore, this study applies the XGBoost model, combined with SHAP and PDP methods, to interpret how 2D and 3D landscape features influence the UTCI through complex mechanisms.
This study simulates the summer UTCI across China’s Yangtze River Delta Urban Agglomeration (YRDUA) from 2000 to 2020 to comprehensively evaluate the outdoor thermal comfort. This study adopts the UTCI as the core metric to characterize the outdoor thermal environment and utilizes multi-source remote sensing meteorological data to calculate UTCI covering the entire study area. To unravel the nonlinear and potentially synergistic relationships between landscape features and UTCI, we employ the advanced XGBoost machine learning model, enhanced with SHAP and PDP tools for interpretable modeling. These approaches enable us to identify and quantify the underlying mechanisms by which landscape patterns influence thermal comfort. The main objectives of this study are as follows: (1) to investigate the spatiotemporal variations in UTCI in summer within the YRDUA; (2) to evaluate the influence of both 2D and 3D urban landscape features on UTCI, thereby revealing the drivers of thermal comfort; and (3) to propose landscape design strategies to improve urban thermal comfort, offering scientific support for sustainable planning and policy-making in rapidly urbanizing regions.

2. Materials and Methods
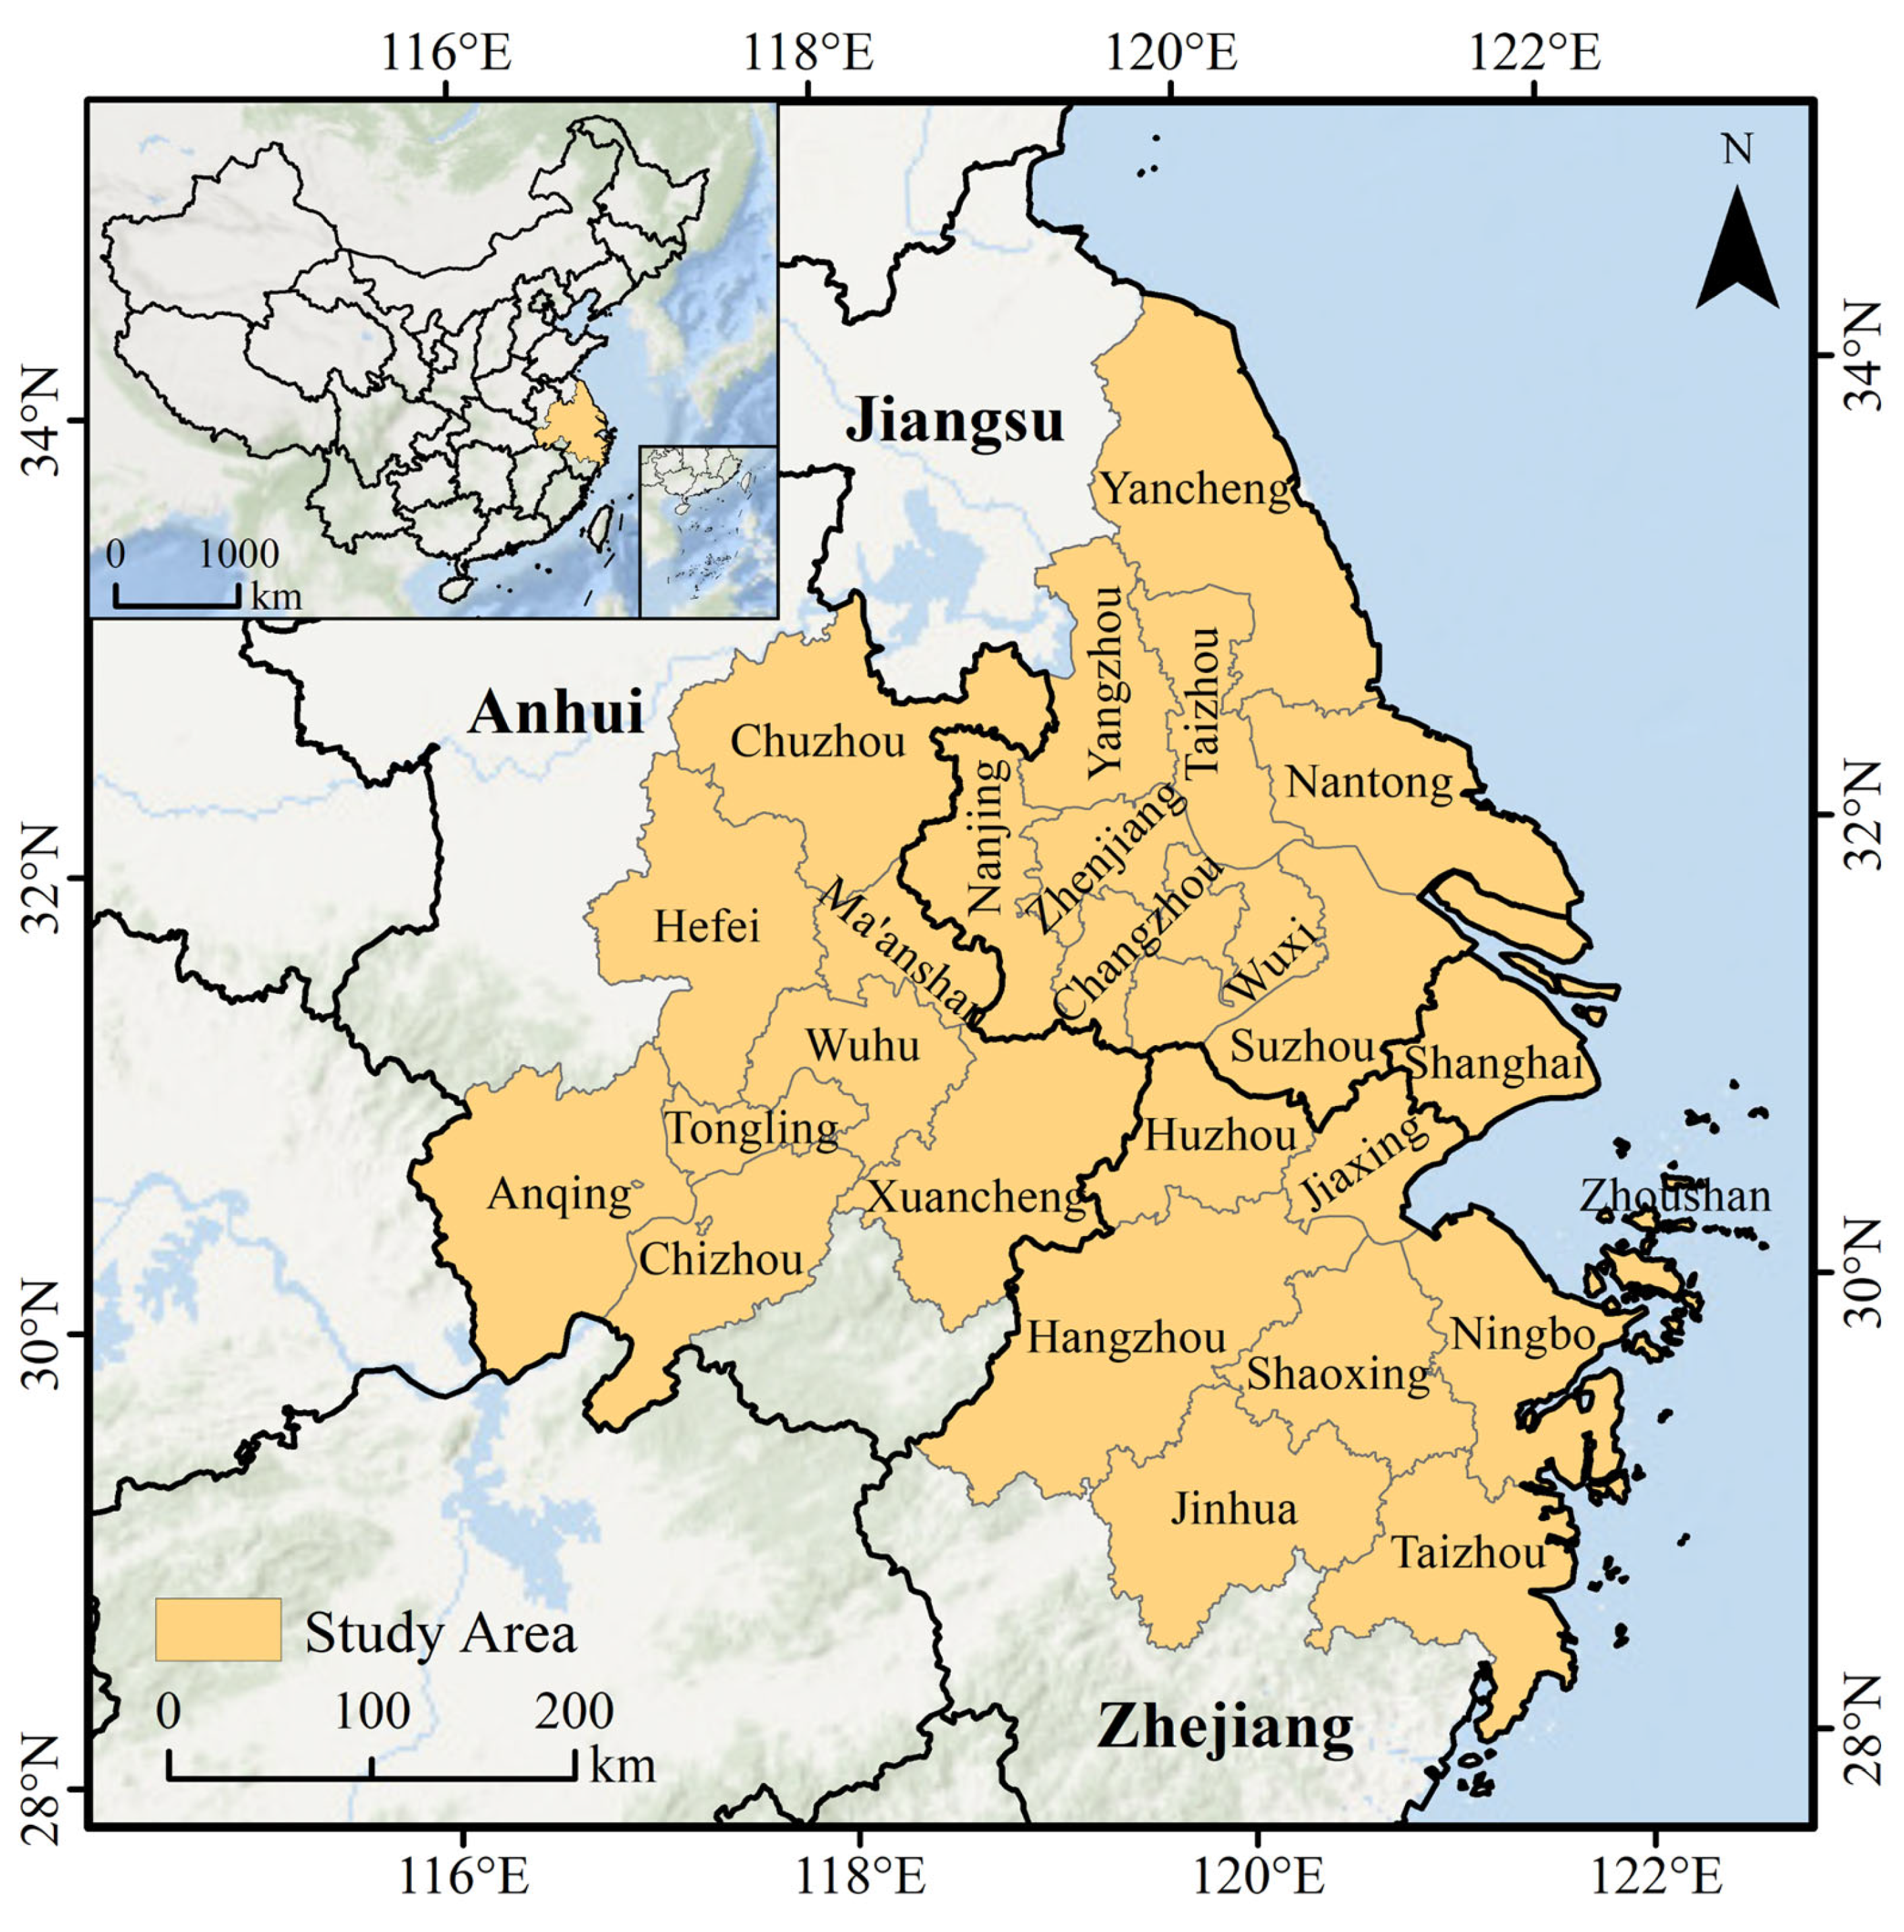
2.1. Study Area

The Yangtze River Delta urban agglomeration (YRDUA, 114°50′~122°40′ E, 27°10′~35°10′ N) occupies the lower reaches of the Yangtze River and borders the East China Sea to the east (Figure 1) [38,39]. The study area comprises twenty-six cities: Shanghai; nine in Jiangsu Province (Nanjing, Suzhou, Wuxi, Nantong, Changzhou, Yangzhou, Yancheng, Taizhou, and Zhenjiang); eight in Zhejiang Province (Hangzhou, Ningbo, Shaoxing, Jiaxing, Jinhua, Taizhou, Huzhou, and Zhoushan); and eight in Anhui Province (Hefei, Wuhu, Chuzhou, Anqing, Ma’anshan, Xuancheng, Tongling, and Chizhou) [40]. The region features a topography dominated by plains and hills, interspersed with abundant rivers and lakes. It experiences a subtropical humid monsoon climate, with precipitation concentrated in summer. During summer, the influence of the subtropical high-pressure system often leads to extreme weather characterized by high temperatures and humidity [6,41]. Rapid urbanization in the YRDUA has significantly intensified the urban heat island (UHI) effect. The combination of frequent extreme heat events and the UHI effect has severely degraded thermal comfort in the region, not only disrupting daily life, but also posing threats to public health.
The YRDUA was selected as the study area for the following reasons: First of all, the YRDUA is one of the most highly urbanized, densely populated, and economically vibrant regions in China. Rapid urbanization has intensified the urban heat island effect, impacting human thermal comfort. Moreover, the consistent subtropical monsoon climate of the YRDUA enables a more controlled analysis of how influencing factors regulate thermal comfort, minimizing the impact of confounding variables such as climate and landscape heterogeneity. These shared climatic and urbanization characteristics mean that it is appropriate to analyze the thermal environment at the scale of the agglomeration.

2.2. Data Collection and Preprocessing

This study utilizes remote sensing and meteorological data from 2000 to 2020, including air temperature, relative humidity, solar radiation, and wind speed. The meteorological datasets (air temperature, relative humidity, and wind speed) were derived from reanalysis data with spatial downscaling. Solar radiation and land surface temperature data were retrieved from MODIS thermal infrared sensors. Given that summer is a critical season for thermal comfort research, data from June to August of each year were collected, and the average values across these three months were calculated to characterize the region’s summer thermal environment.
Furthermore, land use data were classified from Landsat images via the Random Forest algorithm. The 3D building data were synthesized by integrating DEM with Sentinel-2 multispectral imagery, extracting building footprints and heights through morphological shadow detection. Land use data and 3D building data were integrated to assess the influence of landscape pattern metrics on the UTCI using XGBoost Model and SHAP-PDP Hybrid Interpretation. To ensure consistency and reliability in subsequent analyses, detailed descriptions of all data sources are provided in Table 1.

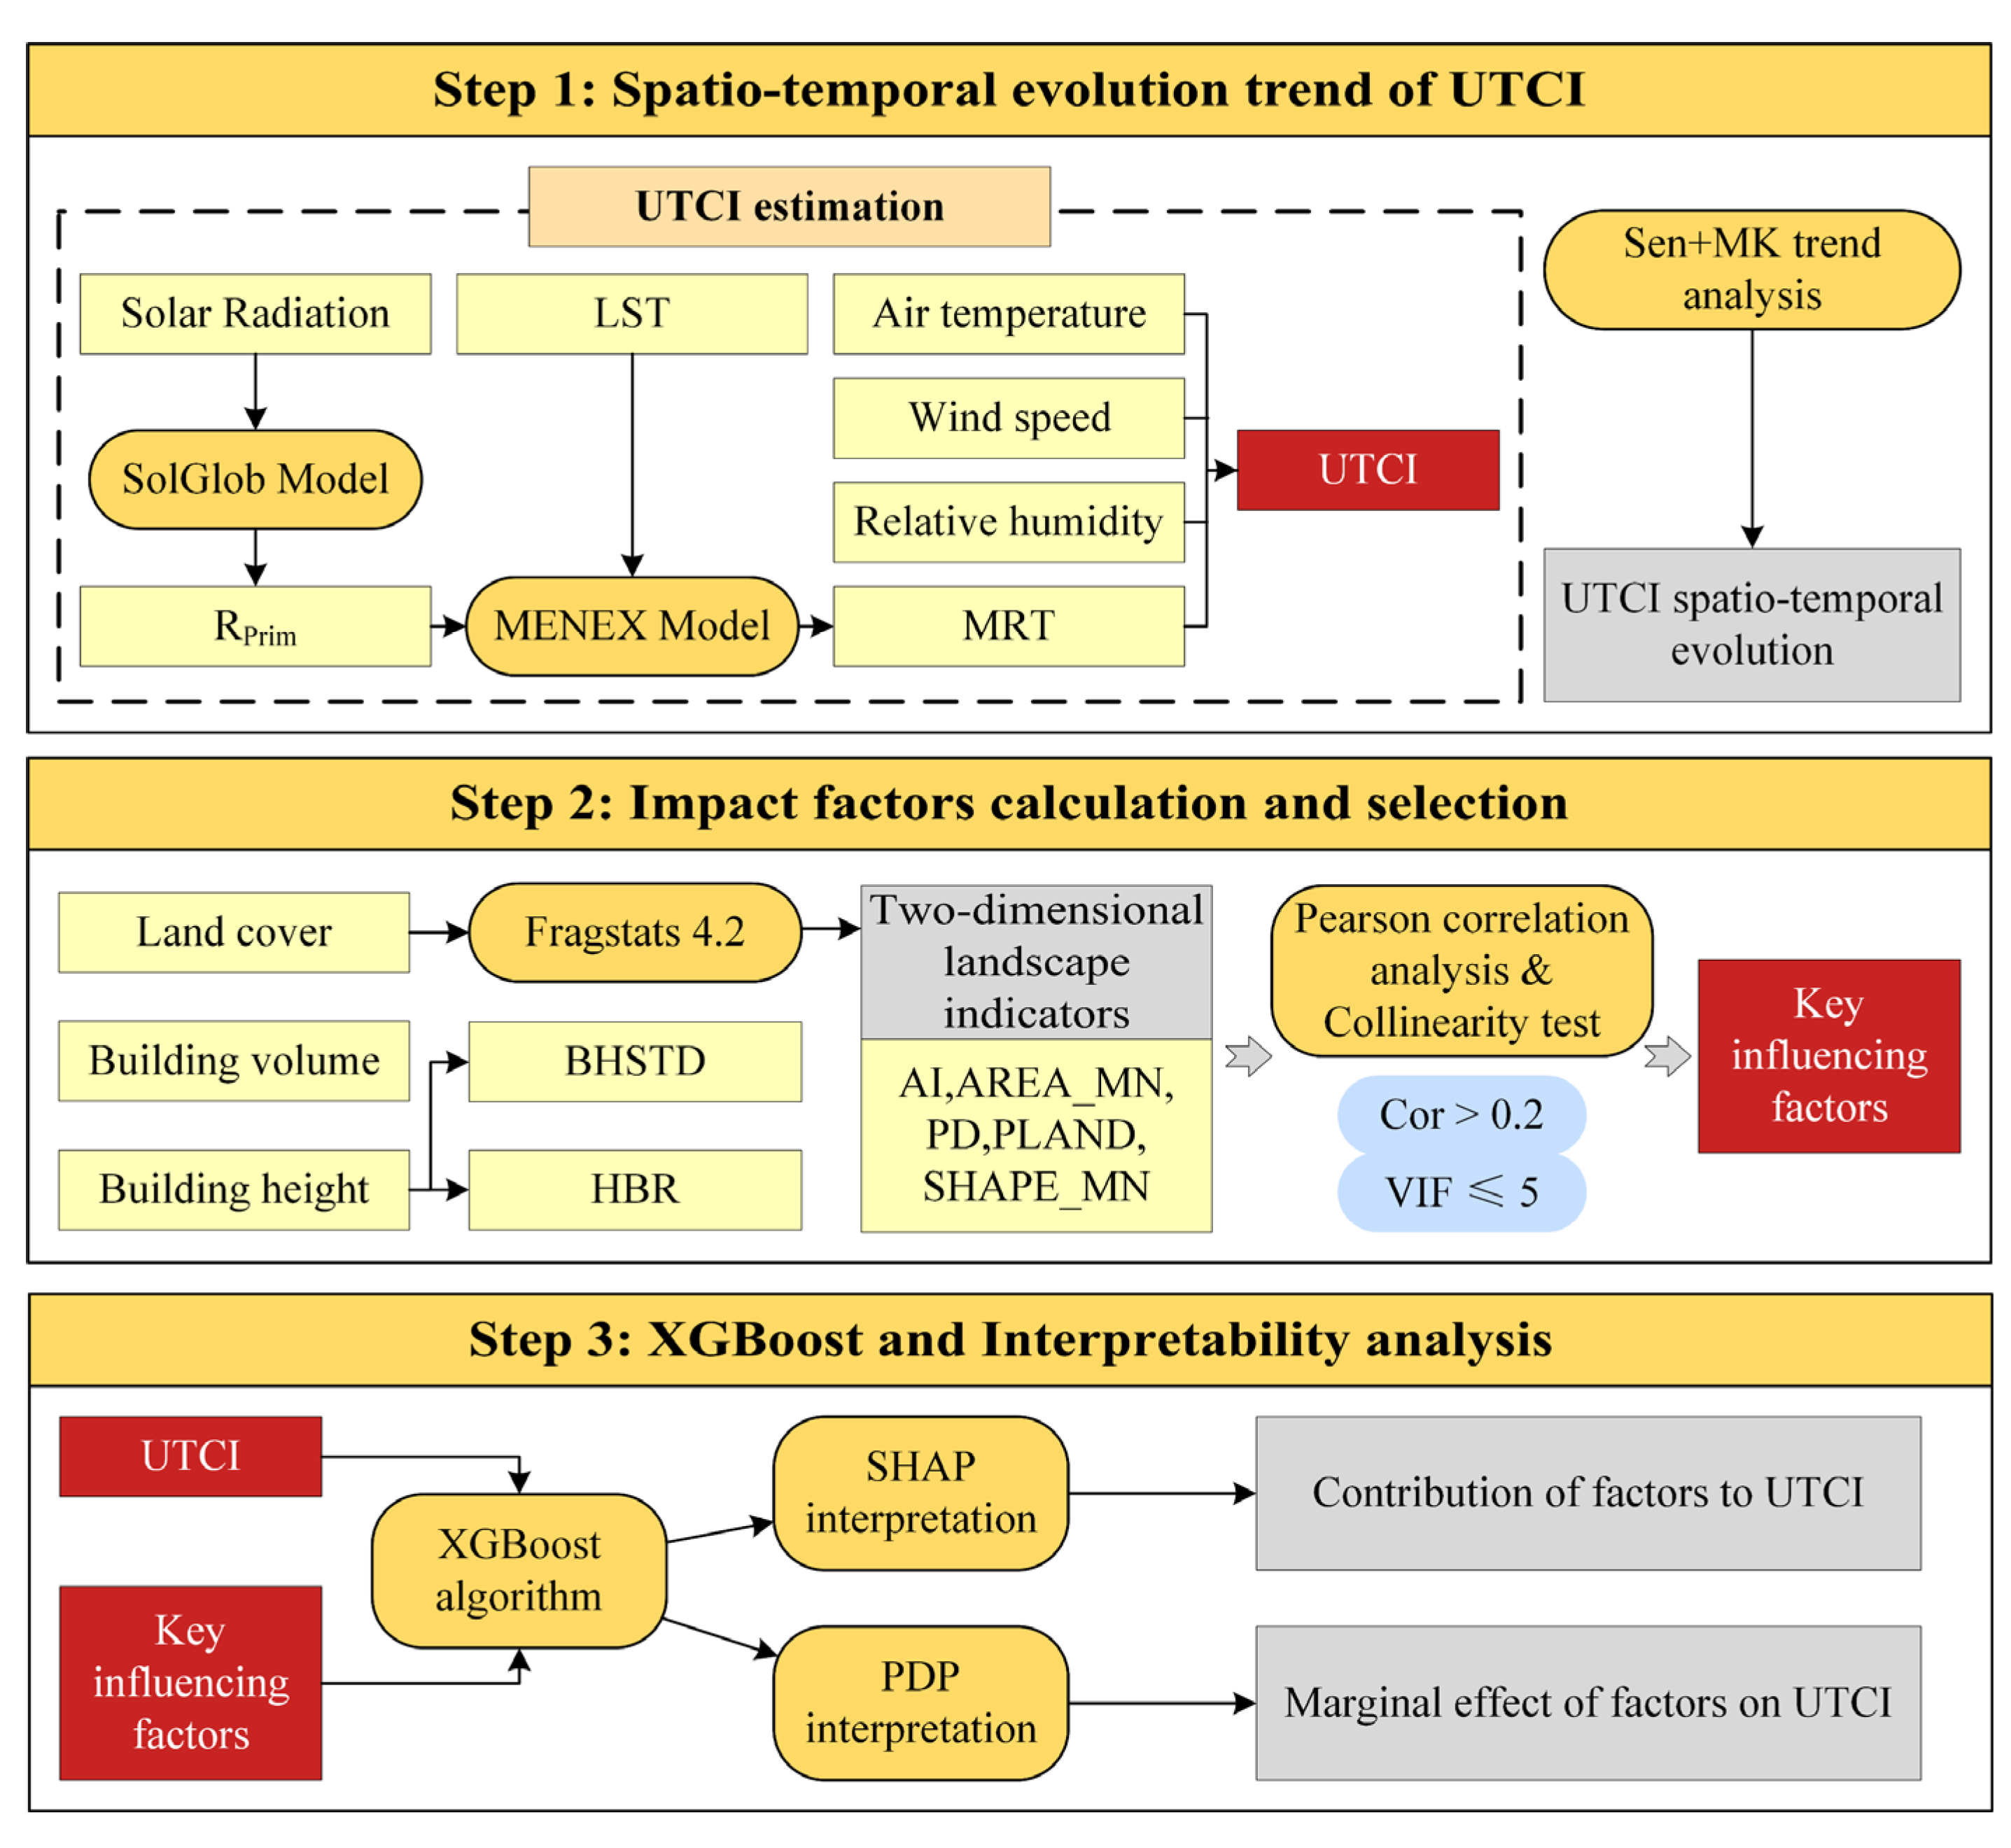
2.3. Overall Workflow

The research framework for analyzing the spatiotemporal variation in thermal comfort and its influencing factors is illustrated in Figure 2. To calculate the UTCI, four key meteorological parameters were required: air temperature ( T a ), mean radiant temperature ( T m r t ), wind speed ( W S ), and relative humidity ( R H ). The Sen+MK trend analysis method was then employed to examine the spatiotemporal patterns of the UTCI. Furthermore, the XGBoost algorithm was implemented within a statistical learning framework to quantify the nonlinear relationships between 2D/3D landscape configurations and UTCI. The model’s regression results were interpreted using SHAP and PDP methods. Finally, this study investigated strategies for optimizing urban landscape design to improve thermal comfort conditions.

2.4. Estimation of UTCI

Developed based on the concept of equivalent temperature, the Universal Thermal Climate Index (UTCI) employs the Fiala multi-node model to simulate human thermal physiological responses [42]. The UTCI is defined as the equivalent temperature experienced under a set of standardized reference conditions: the mean radiant temperature is assumed to be equal to air temperature, wind speed is maintained at 0.5 m/s, relative humidity is set at 50% (or alternatively, water vapor pressure at 20 hPa), and the human metabolic rate of the reference subject is fixed at 135 W/m2 [43]. The basic expression of the UTCI is
U T C I = T a + O f f s e t T a , T m r t , W S , R H
where Offset represents the deviation from air temperature; Ta is the air temperature (°C); Tmrt is the mean radiant temperature (°C); WS is the wind speed (m/s); and RH is the relative humidity (%).
Tmrt refers to an imaginary “black body” whose temperature is equivalent to the radiant heat received by the human body in the real environment. This indicator primarily represents the amount of shortwave and longwave radiation absorbed by the human body from the ambient environment [44,45], and can be estimated using the formula
T m r t = R p r i m + 0.5 L g + 0.5 L a ε p · σ 0.25 273.15
where ε p is the surface emissivity of the human body and is set as a constant (0.95); σ is the Stefan–Boltzmann constant (5.667 × 10⁻⁸ W/m2/K4); Rprim is the shortwave radiation absorbed by the human body, calculated using solar radiation data via the SolGlob model [46]; and La and Lg are the longwave radiation components from the atmosphere and ground, respectively, calculated as
R p r i m = 0.2467 × a c × S R 0.9763
L a = ε a · σ · 273.15 + T a 4
L g = ε g · σ · 273.15 + T S 4
where SR is the solar radiation (W/m2), which consists of direct and diffuse solar radiation; a c = 1 0.01   a c , where ac is the albedo of skin and clothing and set to a constant of 31% in summer; and ε a and ε g are the emissivities of the atmosphere and ground, both set to 0.95; TS is the land surface temperature (°C). The UTCI is calculated based on the above meteorological parameters, and classified into five levels according to the physiological response (Table 2) [47].

2.5. Spatiotemporal Changes in UTCI

The Sen+MK trend test can be used to determine the significance of trends in time series data. Here, the Sen+MK method is applied to calculate the trends in the UTCI changes from 2000 to 2020. The Sen+MK method employs Sen’s median estimator to compute the linear trend value of the UTCI [48], with the formula expressed as follows:
β = M e d i a n x j x i j i , j > i
where β represents the trend of the UTCI time series, xi and xj are the UTCI values for years i and j. If β > 0 indicates an increasing trend in the UTCI, β < 0 denotes a decreasing trend.
The Mann–Kendall test does not require UTCI data to follow a normal distribution and is robust to outliers and missing values [49]. It is widely used to assess the significance of trends in time series data. The test statistic is calculated as
Z = S V a r ( S ) ,     S > 0 0 ,   S = 0 S + 1 V a r ( S ) ,     S < 0
in which
S = i = 1 n 1 j = i + 1 n s g n ( x j x i )
g n ( x j x i ) = 1 ,     x j x i > 0 0 ,     x j x i = 0 1 ,   x j x i < 0
s V a r ( S ) = n ( n 1 ) ( 2 n + 5 ) 18
In these equations, n is the number of years in the UTCI time series; Var and sgn are symbolic functions; S is the test statistic; and Z is the significance statistic. When |Z| exceeds 1.96 or 2.58, the trend is statistically significant at the 0.05 or 0.01 confidence levels, respectively [50]. The criteria for trend significance determination are summarized in Table 3.

2.6. Landscape Indictors

Landscape pattern metrics are useful for quantifying the spatial structure and heterogeneity of different landscapes in both horizontal and vertical dimensions, playing a critical role in shaping thermal environments [51,52,53]. To investigate how two-dimension (2D) and three-dimension (3D) landscape metrics affect the UTCI in the YRDUA, five 2D landscape pattern metrics and four 3D building metrics were selected (Table 4). In our study, land use and land cover were classified into six types: forest, cropland, grassland, water body, bare land, and built-up areas. The 2D landscape pattern metrics, including Mean Patch Area (AREA_MN), Aggregation Index (AI), Patch Density (PD), Percentage of Landscape (PLAND), and Mean Shape Index (SHAPE_MN), were calculated using Fragstats 4.2 software based on a 1 × 1 km grid resolution. The 3D landscape metrics capture the vertical configuration and surface roughness of the built environment [54,55,56], including Building Height (BH), Building Volume (BV), Standard Deviation of Building Height (BHSTD), and High-Rise Building Ratio (HBR).

2.7. XGBoost Model

XGBoost is a gradient boosting-based machine learning method renowned for its strong nonlinear fitting capabilities and feature importance analysis. It builds a strong ensemble model by combining multiple weak learners (e.g., decision trees) through an iterative process that minimizes the objective loss function [57]. In the XGboost model, the objective function O consists of a loss function and a regularization term, defined as
O = L + Ω f t
where L is the loss function, measuring the discrepancy between the predicted and observed values; Ω(ft) is the regularization term; ft represents each decision tree; and t represents the number of trees, serving as a parameter to control model complexity and mitigate overfitting.
To enhance the interpretability of the XGBoost model, data preprocessing included the following steps: (1) Pearson’s correlation analysis was applied to identify the relationships between the UTCI and landscape metric variables. Features with correlation coefficients > 0.2 were retained; (2) the Variance Inflation Factor (VIF) was employed to identify multicollinearity among the landscape metrics variables. Variables with a VIF ≥ 5 were excluded to mitigate collinearity. Ultimately, nine metrics were selected for analyzing the UTCI’s influencing factors.
In this study, the XGBoost regression model was constructed with the UTCI as the dependent variable and nine landscape metrics as independent variables. The dataset was divided into a 70% training set for model training and a 30% testing set for model evaluation. To ensure the model’s stability and generalizability, its performance was evaluated using the coefficient of determination (R2) and root mean square error (RMSE). The final model parameters were set as follows: learning rate = 0.1, maximum tree depth = 10 and number of decision trees = 150.

2.8. Explanatory Models

The XGBoost model is often considered a black-box model. However, the Shapley additive explanations (SHAP) framework allows for the explanation of machine learning results [32]. The SHAP model quantifies feature importance by calculating the weighted sum of a feature’s contributions to predictive outputs across all possible feature combinations [58]. The SHAP value ( φ i ) is defined as
φ i = S ϵ F { i } S ! F S 1 ! F ! f S i x S i f S x S
where i denotes an independent variable; F represents the set of all independent variables; S is a subset of F excluding i; S ! is the factorial of the number of variables in subset S; xS are the input values of variables in subset S; f S i represents the model output with variable i included; and fS denotes the model output with variable i excluded. φ i > 0 indicates that the variable acts as a positive factor, while φ i < 0 suggests that it is a negative factor.
The Partial Dependence Plots (PDPs) illustrate the relationship between the predictions from XGBoost model and one or two features while marginalizing the effects of other features [59]. The PDP function is calculated as follows:
f ^ S x S = E X C f ^ x S , X C = f ^ x S , X C d P X C
where xS is the feature of interest for partial dependence analysis; XC represents all other features in the model f ^ .

3. Results

3.1. Spatiotemporal Variation in UTCI

From 2000 to 2020, the summer UTCI in the YRDUA ranged between 26.2 °C and 44.3 °C (Figure 3), indicating a generally high level of thermal stress across the region under extreme heat conditions. Although temporal fluctuations in the UTCI were observed, the overall spatial distribution pattern remained relatively stable. Spatially, thermal comfort zones exhibited a pronounced spatial aggregation in coastal belts and hilly/mountainous terrains, though their coverage was limited. In contrast, thermal discomfort zones were widely distributed across the inland plains and urbanized areas, particularly in the densely populated and highly urbanized regions. Over the course of the study period, regions classified as experiencing strong and very strong heat stress collectively constituted over 90% of the total area, indicating a high prevalence of severe thermal stress across the YRDUA during the summer. In terms of temporal variation, the area exhibiting strong heat stress reached its maximum extent in 2015 (194,428 km2), reflecting intensified thermal environmental conditions that year. In 2005, the area displaying very strong heat stress peaked at 89,984 km2, suggesting localized extreme heat events.
From 2000 to 2020, approximately 76.8% of the YRDUA exhibited a marginally significant increasing trend in the UTCI (Figure 4), with an annual growth rate of 0.05 °C. This underscores the escalating thermal pressure driven by global climate change and rapid regional urbanization. Areas categorized as exhibiting significant warming and very significant warming were sporadically distributed, mainly in southern Zhejiang Province and northern Jiangsu Province, accounting for 2.3% of the total area. These regions experienced a higher annual warming rate of 0.09 °C, exceeding the regional average. Notably, the hilly and mountainous regions in northern Zhejiang, along with certain suburban areas, exhibited a mildly significant cooling trend, with temperatures decreasing by 0.01 °C annually.
Table 5 illustrates the variations in the area of different thermal comfort levels across various cities from 2000 to 2020. These results highlight the spatial heterogeneity among cities. Overall, the majority of cities experienced an expansion in areas affected by strong and very strong heat stress, indicating a regional intensification of heat-related impacts. Economically developed cities (e.g., Shanghai, Nanjing, Hangzhou, and Suzhou) had larger areas under strong heat stress but relatively smaller areas of very strong heat stress. Coastal cities (e.g., Ningbo, Zhoushan, and Nantong) exhibited smaller areas of very strong heat stress, while inland cities (e.g., Hefei, Xuancheng, and Anqing) faced more extensive impacts from very strong heat stress.

3.2. Correlation Analysis Between UTCI and Landscape Indicators

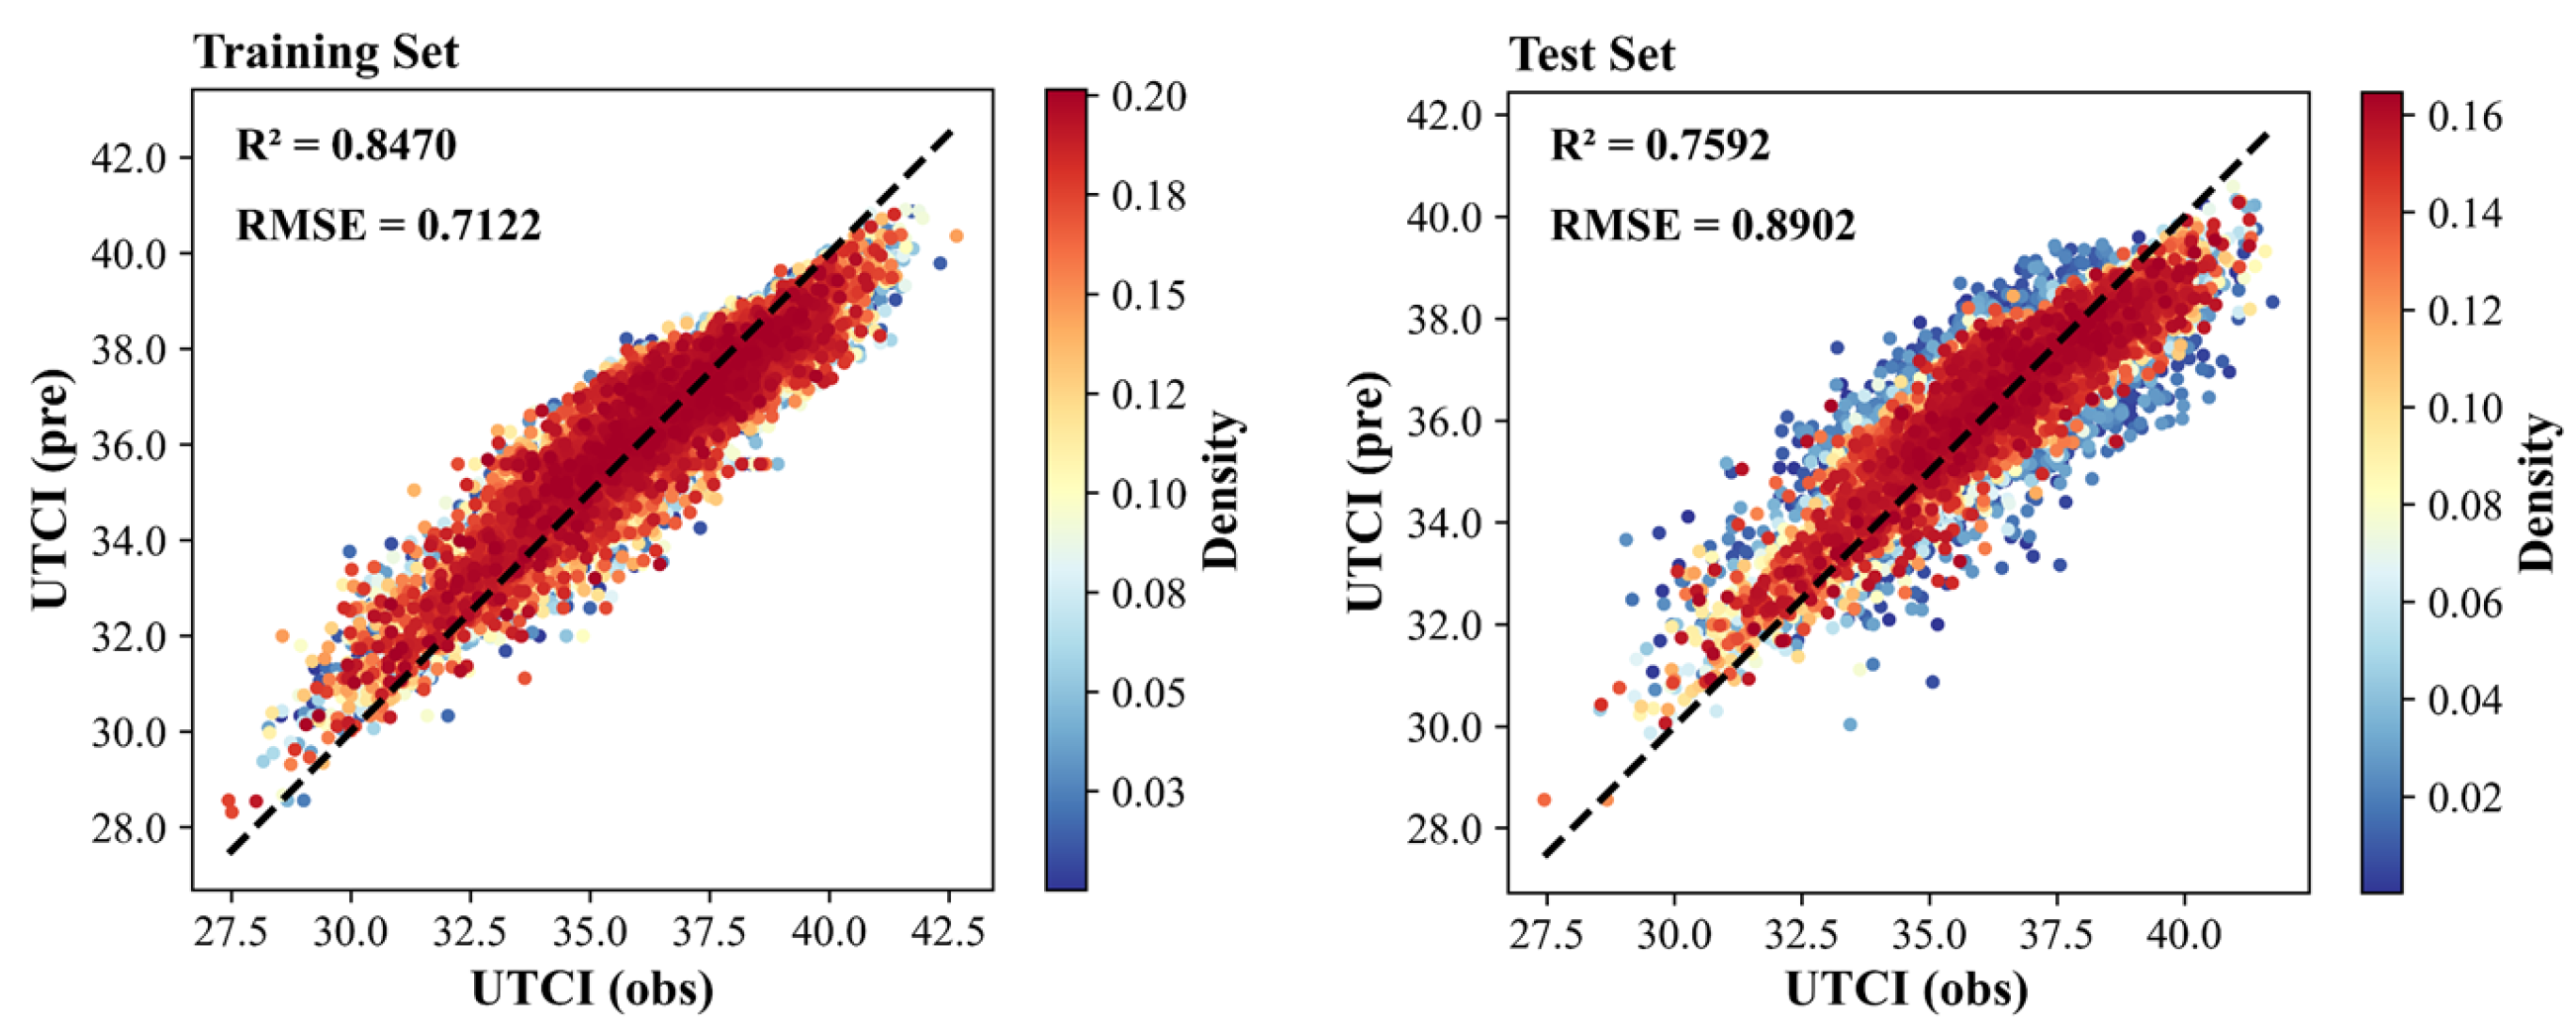
3.2.1. The Accuracy of XGBoost Model

To comprehensively detect the nonlinear relationship between the UTCI and its driving factors within YRDUA, an XGBoost regression model was employed to characterize the complex interactions between UTCI and a range of landscape variables. The model exhibited strong predictive performance, with an R2 of 0.8470 and an RMSE of 0.7122 on the training dataset and an R2 of 0.7592 and an RMSE of 0.8902 on the test dataset (Figure 5). These results suggest that the model possesses a high degree of generalization capability and is effective in capturing the primary environmental drivers influencing UTCI.

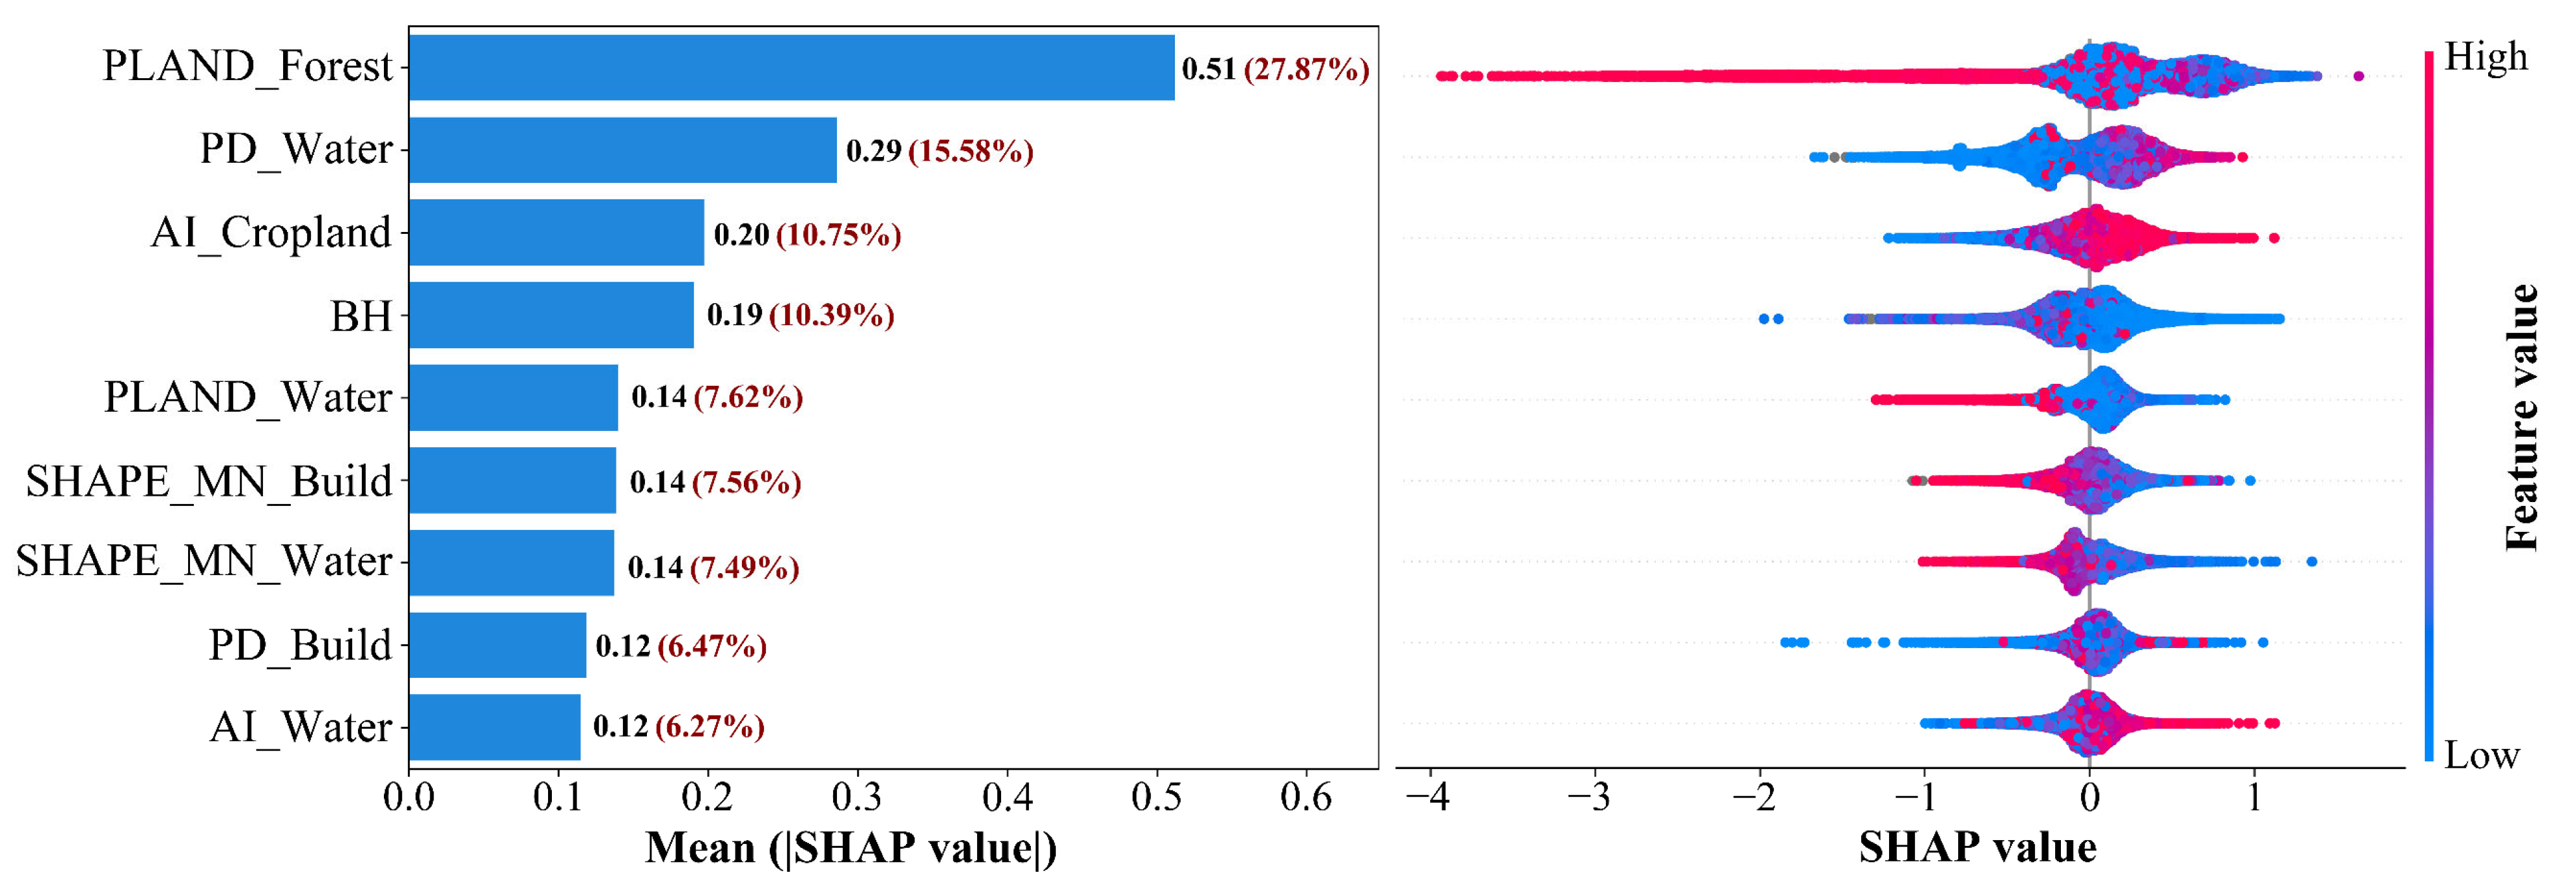
3.2.2. Model Interpretation from SHAP Analysis

Tree Explainer was utilized to calculate the Shapley values of each variable influencing the UTCI. The Shapley value of each feature reveals its contribution to the UTCI predictions, and a global importance ranking was established based on the mean absolute Shapley values (Figure 6). Substantial differences were detected in the contributions of the selected nine landscape metrics. The results indicate that PLAND_Forest, with the widest range of Shapley values, is the most critical feature affecting the UTCI (27.87%). PD_Water (15.58%) and AI_Cropland (10.75%) also exhibit notable impacts on the UTCI. Among the 3D landscape metrics analyzed, BH (10.39%) significantly influences the UTCI. Additionally, PLAND_Water (7.62%), SHAPE_MN_Build (7.56%), and SHAPE_MN_Water (7.49%) demonstrate relatively high contributions, while PD_Build (6.47%) and AI_Water (6.27%) show weaker effects.
Specifically, a higher PLAND_Forest corresponds to negative Shapley values, indicating an inverse relationship with the UTCI (i.e., increased forest coverage reduces the UTCI). However, a higher AI_Cropland correlates with positive Shapley values, suggesting that clustered cropland landscapes amplify the UTCI. A lower BH tends to shift the Shapley values toward the positive range, elevating the UTCI. A higher SHAPE_MN_Build exerts a negative effect on the UTCI. Furthermore, water-related metrics (PD_Water, PLAND_Water, SHAPE_MN_Water) contribute to cooling: a lower PD_Water and higher PLAND_Water and SHAPE_MN_Water could suppress the UTCI.

3.2.3. Partial Dependency

Partial Dependence Plots (PDPs) serve as an effective visualization tool to enhance the model interpretability, intuitively illustrating how individual features influence model predictions while controlling for other variables. In this study, Figure 7 details the impact trends of various environmental factors on the UTCI, providing scientific insights for optimizing urban thermal environments.
The results demonstrate that PLAND_Forest and PLAND_Water are the two most effective factors in reducing the UTCI. Specifically, PLAND_Forest contributes to a cooling effect of approximately 2.5 °C, with the UTCI dropping notably when the forest coverage exceeds 50%, reaching a minimum of around 34.5 °C. PLAND_Water lowers the UTCI by about 1.5 °C, decreasing from 36.5 °C to 35.3 °C as the water coverage increases. Though without sharp declines, BH also exhibits a modest cooling effect on the UTCI. Additionally, both SHAPE_MN_Build and SHAPE_MN_Water show similar impacts: When SHAPE_MN_Build ranges between 1 and 2 or SHAPE_MN_Water ranges between 1 and 4, the UTCI decreases significantly from 36.6 °C to 35.9 °C. Beyond these thresholds, the cooling effects stabilize, indicating a saturation point where further increases in shape complexity no longer improve thermal comfort (as measured by UTCI reduction). In contrast, AI_Cropland exhibits a pronounced warming effect, in which the UTCI rises from 35.5 °C to 36.6 °C when AI_Cropland exceeds 75%. In addition, nonlinear trends are observed for PD_Water and PD_Build. Between 0 and 2 patches/km2, both of these factors increase the UTCI by approximately 0.6 °C. As PD_Water rises from 2 to 7 patches/km2, the UTCI drops from 36.5 °C to 36.2 °C; similarly, PD_Build reduces the UTCI from 36.6 °C to 36.1 °C when increasing from 2 to 11 patches/km2. Beyond 7 patches/km2 (PD_Water) and 11 patches/km2 (PD_Build), further increases yield diminishing cooling returns, suggesting limited thermal benefits beyond these densities. AI_Water displays complex nonlinear behavior. The UTCI increases by 0.6 °C when AI_Water ranges from 25 to 80. However, when AI_Water exceeds 80, the UTCI declines by up to 0.5 °C, revealing a threshold-dependent dual effect.

4. Discussion

4.1. Spatiotemporal Variation Characteristics of UTCI

From 2000 to 2020, the overall summer thermal comfort in the YRDUA remained at a strong thermal stress level, indicating widespread high human heat load under extreme heat conditions. However, its spatial distribution exhibited significant spatial heterogeneity. Coastal cities such as Ningbo, Zhoushan, and Nantong demonstrated relatively higher thermal comfort, primarily due to the climatic regulation provided by the ocean. The ocean mitigates thermal stress in coastal areas by delivering cool, humid air through sea breezes [24]. In contrast, inland cities (e.g., Hefei, Xuancheng, and Anqing) faced more pronounced heat stress impacts. These regions, distant from oceanic moderation, are prone to heat accumulation due to surface temperature retention, while accelerated urbanization here has intensified the UHI effect. Additionally, the flat terrain in parts of Anhui and Jiangsu hinders air circulation, further trapping heat and exacerbating thermal discomfort [60]. Notably, thermally comfortable zones were also observed in the hilly/mountainous areas of Zhejiang Province, influenced by multiple factors, such as temperature lapse rate with altitude, topographic winds, mountain shadow effects, and vegetative transpiration cooling [61].
Over the two-decade period, most areas experienced slight significant warming, indicating a general intensification of heat stress across the YRDUA, which may be closely linked to global climate warming, urban expansion, and land use changes. Regions classified as exhibiting significant warming were concentrated in Yancheng and Taizhou (ZJ), where the rapid urbanization process facilitated the transformation of forest and grassland ecosystems into agricultural and urban land covers, leading to declines in vegetation cover and reductions in evaporative heat dissipation. Simultaneously, the expansion of urban building clusters aggravated local UHI effects, prolonging heatwave durations and amplifying human heat load [62,63,64]. In contrast, the slightly significant cooling zones were primarily distributed in the hilly regions of northern Zhejiang and near Hangzhou Bay. The cooling in these areas largely stems from topographic advantages and localized climatic regulation. The hilly terrain in northern Zhejiang, due to limited developmental interference and recent ecological conservation policies, has maintained robust vegetation cover, improving the thermal comfort. Furthermore, unlike the flat coastal plains of Jiangsu, the Hangzhou Bay area benefits from enhanced sea breeze channeling, which partially offsets warming induced by urbanization.

4.2. Effect of Landscape Factors on UTCI Changes

The XGBoost model, in combination with the SHAP and PDP methods, were employed to systematically explore the nonlinear driving mechanisms of summer thermal comfort in the YRDUA, revealing the impacts of natural environmental elements and urban architectural patterns on the thermal environment. The integrated methodologies not only quantify the individual contributions of each influencing factor, but also establish a scientific basis for sustainable urban design and planning. The results demonstrate that PLAND_Forest and PLAND_Water are the most effective in reducing the UTCI, indicating that forests and water bodies are critical landscape elements for urban cooling. This phenomenon may be linked to the following mechanisms: Forests and water bodies mitigate ambient temperatures via transpiration and evaporative cooling processes, thereby effectively reducing the air temperature. Moreover, green and blue spaces optimize local airflow and improve urban ventilation, thereby significantly enhancing outdoor thermal comfort for residents [65,66,67,68]. Meanwhile, the increase in SHAPE_MN_Water also improves thermal comfort, suggesting that irregular water bodies (e.g., meandering rivers and fragmented lakes) exhibit stronger cooling effects compared to regular ones (e.g., straight canals and rectangular artificial lakes). This is because more complex water boundaries create larger land–water interfaces, enhancing localized energy exchange and evaporative cooling. Additionally, meandering rivers and irregular lakes may form localized wind channels, promoting airflow and accelerating cooling [69]. However, once SHAPE_MN_Water exceeds 4, the marginal cooling benefit diminishes, indicating that further increases in water shape complexity have limited impact on reducing UTCI.
The PDP analysis revealed that the UTCI responds to PD_Water and AI_Water with an initial increase followed by a decrease. This suggests that fragmented and small water bodies lack significant evaporative cooling, and may even elevate the UTCI due to high reflectivity amplifying solar radiation. When water bodies become sufficiently clustered and contiguous, evaporative cooling gradually dominates over radiative heating, ultimately lowering the UTCI [25]. Furthermore, a positive correlation is observed between AI_Cropland and the UTCI, meaning higher cropland aggregation reduces the thermal comfort. Highly aggregated croplands often lack tree cover, exhibit strong soil heat absorption, and have a lower transpiration capacity compared to forests, leading to pronounced daytime surface temperature increases [70,71].
The building morphology also significantly impacts the thermal comfort. Specifically, increases in SHAPE_MN_Build improve the thermal comfort, indicating that irregular building layouts mitigate urban heat. More architecturally complex buildings may create better air channels, enhance ventilation, and reduce heat accumulation [72]. Compared to simple rectangular structures, complex shapes can generate more shaded areas, curbing surface temperature rises. However, beyond a certain complexity threshold, cooling effects stabilize, implying no unlimited UTCI reduction from overly intricate designs. PD_Build (building density) exhibits a nonlinear impact on the UTCI: at low densities, exposed surfaces rapidly heat under solar radiation, degrading thermal comfort; as the density increases, building shade and narrow street canyons enhance airflow, improving the thermal comfort [73]. For 3D building metrics, BH shows a significant negative correlation with the UTCI. Existing studies suggest that high-rise buildings reduce direct solar radiation via shading and amplify local wind speeds, enhancing convective heat dissipation and alleviating urban heat stress [74,75].

4.3. Suggestions for Improving Thermal Comfort

Based on the thermal comfort analysis results, targeted optimization strategies can be proposed from urban natural planning and architectural design to mitigate summer heat stress and enhance residents’ thermal comfort. Given the superior cooling capacity of forests, urban development and expansion should avoid large-scale encroachment on woodlands and green spaces. Particularly in high-heat-stress cities, green belts can be added along streets, riverbanks, and building gaps, and urban parks can be expanded to form cooling island effects that lower ambient temperatures and improve thermal comfort [76,77]. Moreover, natural rivers and wetlands should be preserved during urban development. In high-heat-stress zones, lakes, rivers, and other water features can be introduced, forming contiguous water networks to reduce thermal load. Additionally, meandering rivers and irregular lakes can enhance cooling by increasing land–water interfaces and promoting heat exchange through evaporation.
It is recommended to appropriately adjust building spacing and optimize the configuration of natural wind corridors along with street layouts, such as sea breeze channels and valley wind pathways, in order to enhance urban ventilation and effectively alleviate the UHI effect [78]. For instance, in coastal areas like Hangzhou Bay, east–west wind corridors should remain unobstructed to maximize sea breeze cooling. Large-scale rectangular building clusters should be avoided. Instead, irregular shapes (e.g., curved designs) can optimize airflow and reduce heat retention. Meanwhile, in dense urban areas, widening streets and integrating buildings with green spaces can enhance air circulation and cooling. High-rise buildings should be strategically placed to shade pedestrian-heavy areas, improving thermal comfort. However, glass facades commonly used in skyscrapers reflect significant solar radiation, elevating surface temperatures [79]. Moreover, increased air conditioning and equipment usage in tall buildings exacerbate local heat emissions. Therefore, the proportion of high-rise buildings should be appropriately regulated in urban planning. In addition, the use of eco-friendly design strategies should be prioritized to mitigate heat accumulation and enhance both indoor and outdoor thermal comfort, such as green roofs, vertical greenery systems, and reflective building materials [80,81,82].

4.4. Limitations and Prospects

This study simulated the summer thermal comfort in the YRDUA of China from 2000 to 2020, and analyzed the spatiotemporal variation characteristics of thermal comfort and its influencing factors. However, the spatial resolution of the simulated UTCI remains relatively coarse (1 km), which limits its applicability for detailed urban thermal comfort studies. Future research should aim to refine the spatial resolution to the micro-scale by utilizing higher-resolution data sources to better capture the spatial variability of thermal comfort in urban environments. [83]. In addition, human comfort in cold environments should not be overlooked. UTCI can also effectively assess comfort during cold winter weather, helping cities and communities develop corresponding adaptation strategies based on actual conditions to reduce the negative impact of cold weather on populations [84].

5. Conclusions

This study assessed the spatiotemporal dynamics of summer thermal comfort in the YRDUA from 2000 to 2020 using the UTCI derived from multi-source meteorological and remote sensing datasets. By integrating 2D landscape pattern metrics and 3D building morphological indicators into an interpretable machine learning framework (XGBoost with SHAP and PDP), we identified the dominant landscape drivers and quantified their nonlinear effects on UTCI. The main findings are as follows:
(1)
Over 90% of the YRDUA experienced strong or very strong summer heat stress during the study period, with 76.8% of the region showing a statistically significant upward trend in the UTCI at an average rate of 0.09 °C per year.
(2)
Areas with forest coverage exceeding 50% exhibited a reduction in the UTCI of up to 2.5 °C, while a higher proportion of water bodies decreased the UTCI by approximately 1.5 °C. Conversely, highly aggregated cropland increased the UTCI by about 1.5 °C, emphasizing the importance of preserving and enhancing blue–green infrastructure and considering land use configuration in mitigating thermal stress.
(3)
A moderate increase in building height and shape complexity improved shading and ventilation, leading to an enhancement in thermal comfort by approximately 0.5 °C.
These results offer a quantitative basis for climate-adaptive urban planning. Enhancing contiguous blue–green infrastructure and optimizing 3D urban form are effective strategies to alleviate urban heat stress. Future studies should incorporate higher-resolution data to support micro-scale analysis and apply this framework to other urban regions to improve the generalizability of climate adaptation strategies.

Author Contributions

Conceptualization, H.Z., R.W., and B.X.; methodology, H.Z. and H.H.; validation, H.Z. and H.H.; data curation, H.Z. and B.X.; writing—original draft preparation, H.Z. and B.X.; writing—review and editing, R.W., H.H., B.X., and T.H.; visualization, H.Z. and R.W.; supervision, B.X. and T.H. All authors have read and agreed to the published version of the manuscript.

Funding

This research was funded by the General Scientific Research Project of Department of Education of Zhejiang Province (Grant Number: Y202351693) and the “Pioneer” and “Leading Goose” R&D Program of Zhejiang (Grant Number: 2025C02050).

Data Availability Statement

The raw data supporting the conclusions of this article will be made available by the authors on request.

Acknowledgments

The authors thank the Guest Editors and anonymous reviewers for their constructive comments.

Conflicts of Interest

The authors declare no conflicts of interest.

Abbreviations

The following abbreviations are used in this manuscript:
AbbreviationsDefinition
YRDUAYangtze River Delta Urban Agglomerations
UTCIUniversal Thermal Climate Index
TSVThermal Sensation Vote
WBGTWet-Bulb Globe Temperature
WCIWind Chill Index
PETPhysiologically Equivalent Temperature
OUT_SET*Outdoor Standard Effective Temperature
TaAir Temperature
TmrtMean Radiant Temperature
WSWind Speed
RHRelative Humidity
TSLand Surface Temperature
RprimShortwave Radiation Absorbed by the Human Body
SRSolar Radiation
LaLongwave Radiation Component from the Atmosphere
LgLongwave Radiation Component from the Ground
AIAggregation Index
AREA_MNMean Patch Area
PDPatch Density
PLANDPercentage of Landscape
SHAPE_MNMean Shape Index
BHBuilding Height
BHSTDBuilding Height Standard Deviation
BVBuilding Volume
HBRHigh-Rise Building Ratio

References

  1. Ebi, K.L.; Capon, A.; Berry, P.; Broderick, C.; De Dear, R.; Havenith, G.; Honda, Y.; Kovats, R.S.; Ma, W.; Malik, A.; et al. Hot Weather and Heat Extremes: Health Risks. Lancet 2021, 398, 698–708. [Google Scholar] [CrossRef] [PubMed]
  2. Chen, H.; Zhao, L.; Dong, W.; Cheng, L.; Cai, W.; Yang, J.; Bao, J.; Liang, X.-Z.; Hajat, S.; Gong, P.; et al. Spatiotemporal Variation of Mortality Burden Attributable to Heatwaves in China, 1979–2020. Sci. Bull. 2022, 67, 1340–1344. [Google Scholar] [CrossRef] [PubMed]
  3. Lai, D.; Liu, W.; Gan, T.; Liu, K.; Chen, Q. A Review of Mitigating Strategies to Improve the Thermal Environment and Thermal Comfort in Urban Outdoor Spaces. Sci. Total Environ. 2019, 661, 337–353. [Google Scholar] [CrossRef] [PubMed]
  4. Mazzetto, S. Dynamic Integration of Shading and Ventilation: Novel Quantitative Insights into Building Performance Optimization. Buildings 2025, 15, 1123. [Google Scholar] [CrossRef]
  5. Ma, J.; Shen, H.; Wu, P.; Wu, J.; Gao, M.; Meng, C. Generating Gapless Land Surface Temperature with a High Spatio-Temporal Resolution by Fusing Multi-Source Satellite-Observed and Model-Simulated Data. Remote Sens. Environ. 2022, 278, 113083. [Google Scholar] [CrossRef]
  6. Zhao, C.; Zhu, H.; Zhang, S.; Jin, Z.; Zhang, Y.; Wang, Y.; Shi, Y.; Jiang, J.; Chen, X.; Liu, M. Long-term Trends in Surface Thermal Environment and Its Potential Drivers along the Urban Development Gradients in Rapidly Urbanizing Regions of China. Sustain. Cities Soc. 2024, 105, 105324. [Google Scholar] [CrossRef]
  7. Wen, Z.; Tian, D.; Zhu, Y. Research on Spatial and Temporal Patterns of Heat Island Variability and Influencing Factors in Urban Center Areas: A Case Study of Beijing’s Central Area. Buildings 2023, 13, 1887. [Google Scholar] [CrossRef]
  8. Hu, Y.; Jia, G.; Gao, H.; Li, Y.; Hou, M.; Li, J.; Miao, C. Spatial Characterization of Global Heat Waves Using Satellite-Based Land Surface Temperature. Int. J. Appl. Earth Obs. Geoinf. 2023, 125, 103604. [Google Scholar] [CrossRef]
  9. Ren, Z.; Fu, Y.; Dong, Y.; Zhang, P.; He, X. Rapid Urbanization and Climate Change Significantly Contribute to Worsening Urban Human Thermal Comfort: A National 183-City, 26-Year Study in China. Urban Clim. 2022, 43, 101154. [Google Scholar] [CrossRef]
  10. Jia, S.; Wang, Y.; Wong, N.H.; Weng, Q. A Hybrid Framework for Assessing Outdoor Thermal Comfort in Large-Scale Urban Environments. Landsc. Urban Plan. 2025, 256, 105281. [Google Scholar] [CrossRef]
  11. Patle, S.; Ghuge, V.V. Evolution and Performance Analysis of Thermal Comfort Indices for Tropical and Subtropical Region: A Comprehensive Literature Review. Int. J. Environ. Sci. Technol. 2024, 21, 10217–10258. [Google Scholar] [CrossRef]
  12. Azli, M.; Khasri, M.A.; Hariri, A.; Yao, C.Z.; Damanhuri, A.A.M.; Mustafa, M.S.S. Pilot Study on Investigation of Thermal Sensation Votes (TSV) and Students’ Performance in Naturally Ventilated Classroom. Environ. Ecol. Res. 2022, 10, 508–517. [Google Scholar] [CrossRef]
  13. Lala, B.; Biju, A.; Vanshita; Rastogi, A.; Dahiya, K.; Kala, S.M.; Hagishima, A. The Challenge of Multiple Thermal Comfort Prediction Models: Is TSV Enough? Buildings 2023, 13, 890. [Google Scholar] [CrossRef]
  14. Liu, Z.; Li, J.; Xi, T. A Review of Thermal Comfort Evaluation and Improvement in Urban Outdoor Spaces. Buildings 2023, 13, 3050. [Google Scholar] [CrossRef]
  15. Detommaso, M.; Gagliano, A.; Nocera, F. An Overview of Microclimate Simulation Tools and Models for Predicting Outdoor Thermal Comfort. In Urban Heat Stress and Mitigation Solutions; Taylor Francis Group: Abingdon, UK, 2021; pp. 21–39. [Google Scholar]
  16. Blazejczyk, K.; Epstein, Y.; Jendritzky, G.; Staiger, H.; Tinz, B. Comparison of UTCI to Selected Thermal Indices. Int. J. Biometeorol. 2012, 56, 515–535. [Google Scholar] [CrossRef]
  17. Jendritzky, G.; De Dear, R.; Havenith, G. UTCI—Why Another Thermal Index? Int. J. Biometeorol. 2012, 56, 421–428. [Google Scholar] [CrossRef]
  18. Li, W.; Chao, L.; Si, P.; Zhang, H.; Li, Q. Comparisons of the Urbanization Effect on Heat Stress Changes in Guangdong during Different Periods. Remote Sens. 2023, 15, 2750. [Google Scholar] [CrossRef]
  19. Yu, B.; Hu, Y.; Zhou, X. Can administrative division adjustment improve urban land use efficiency? Evidence from “Revoke County to Urban District” in China. Environ. Plan. B Urban Anal. City Sci. 2025, 0, 23998083251325638. [Google Scholar] [CrossRef]
  20. Liu, W.; Zhang, G.; Jiang, Y.; Wang, J. Effective Range and Driving Factors of the Urban Ventilation Corridor Effect on Urban Thermal Comfort at Unified Scale with Multisource Data. Remote Sens. 2021, 13, 1783. [Google Scholar] [CrossRef]
  21. Zou, M.; Zhang, H. Cooling Strategies for Thermal Comfort in Cities: A Review of Key Methods in Landscape Design. Environ. Sci. Pollut. Res. 2021, 28, 62640–62650. [Google Scholar] [CrossRef]
  22. Yang, J.; Zhao, Y.; Zou, Y.; Xia, D.; Lou, S.; Guo, T.; Zhong, Z. Improving the Thermal Comfort of an Open Space via Landscape Design: A Case Study in Hot and Humid Areas. Atmosphere 2022, 13, 1604. [Google Scholar] [CrossRef]
  23. Yu, H.; Fukuda, H.; Zhou, M.; Ma, X. Improvement Strategies for Microclimate and Thermal Comfort for Urban Squares: A Case of a Cold Climate Area in China. Buildings 2022, 12, 944. [Google Scholar] [CrossRef]
  24. Kim, Y.; Yu, S.; Li, D.; Gatson, S.N.; Brown, R.D. Linking Landscape Spatial Heterogeneity to Urban Heat Island and Outdoor Human Thermal Comfort in Tokyo: Application of the Outdoor Thermal Comfort Index. Sustain. Cities Soc. 2022, 87, 104262. [Google Scholar] [CrossRef]
  25. Feng, L.; Zhao, M.; Zhou, Y.; Zhu, L.; Tian, H. The Seasonal and Annual Impacts of Landscape Patterns on the Urban Thermal Comfort Using Landsat. Ecol. Indic. 2020, 110, 105798. [Google Scholar] [CrossRef]
  26. Lin, Z.; Xu, H.; Hu, X.; Liu, Z.; Yao, X.; Zhu, Z. Characterizing the Seasonal Relationships between Urban Heat Island and Surface Energy Balance Fluxes Considering the Impact of Three-Dimensional Urban Morphology. Build. Environ. 2024, 265, 112017. [Google Scholar] [CrossRef]
  27. Kashki, A.; Karami, M.; Zandi, R.; Roki, Z. Evaluation of the Effect of Geographical Parameters on the Formation of the Land Surface Temperature by Applying OLS and GWR, A Case Study Shiraz City, Iran. Urban Clim. 2021, 37, 100832. [Google Scholar] [CrossRef]
  28. Niu, L.; Zhang, Z.; Peng, Z.; Liang, Y.; Liu, M.; Jiang, Y.; Wei, J.; Tang, R. Identifying Surface Urban Heat Island Drivers and Their Spatial Heterogeneity in China’s 281 Cities: An Empirical Study Based on Multiscale Geographically Weighted Regression. Remote Sens. 2021, 13, 4428. [Google Scholar] [CrossRef]
  29. Assaf, G.; Assaad, R.H. Modeling the Impact of Land Use/Land Cover (LULC) Factors on Diurnal and Nocturnal Urban Heat Island (UHI) Intensities Using Spatial Regression Models. Urban Clim. 2024, 55, 101971. [Google Scholar] [CrossRef]
  30. Gu, X.; Wu, Z.; Liu, X.; Qiao, R.; Jiang, Q. Exploring the Nonlinear Interplay between Urban Morphology and Nighttime Thermal Environment. Sustain. Cities Soc. 2024, 101, 105176. [Google Scholar] [CrossRef]
  31. Wang, W.; Shi, Y.; Zhang, J.; Zhao, X.; Ruan, J.; Wang, C. Exploration of Non-Linear Influence Mechanisms of Traditional Courtyard Forms on Thermal Comfort in Winter and Summer: A Case Study of Beijing, China. Sustain. Cities Soc. 2025, 119, 106124. [Google Scholar] [CrossRef]
  32. He, J.; Shi, Y.; Xu, L.; Lu, Z.; Feng, M.; Tang, J.; Guo, X. Exploring the Scale Effect of Urban Thermal Environment through XGBoost Model. Sustain. Cities Soc. 2024, 114, 105763. [Google Scholar] [CrossRef]
  33. Wang, Q.; Wang, X.; Zhou, Y.; Liu, D.; Wang, H. The Dominant Factors and Influence of Urban Characteristics on Land Surface Temperature Using Random Forest Algorithm. Sustain. Cities Soc. 2022, 79, 103722. [Google Scholar] [CrossRef]
  34. Tanoori, G.; Soltani, A.; Modiri, A. Machine Learning for Urban Heat Island (UHI) Analysis: Predicting Land Surface Temperature (LST) in Urban Environments. Urban Clim. 2024, 55, 101962. [Google Scholar] [CrossRef]
  35. Guo, F.; Luo, M.; Zhang, C.; Cai, J.; Zhang, X.; Zhang, H.; Dong, J. The Mechanism of Street Spatial Form on Thermal Comfort from Urban Morphology and Human-Centered Perspectives: A Study Based on Multi-Source Data. Buildings 2024, 14, 3253. [Google Scholar] [CrossRef]
  36. Huang, C.; Liu, K.; Ma, T.; Xue, H.; Wang, P.; Li, L. Analysis of the Impact Mechanisms and Driving Factors of Urban Spatial Morphology on Urban Heat Islands. Sci. Rep. 2025, 15, 18589. [Google Scholar] [CrossRef]
  37. Zou, B.; Fan, C.; Li, J. Quantifying the Influence of Different Block Types on the Urban Heat Risk in High-Density Cities. Buildings 2024, 14, 2131. [Google Scholar] [CrossRef]
  38. Cao, Y.; Wang, Q.; Zhou, D. Does Air Pollution Inhibit Manufacturing Productivity in Yangtze River Delta, China? Moderating Effects of Temperature. J. Environ. Manag. 2022, 306, 114492. [Google Scholar] [CrossRef]
  39. Meng, F.; Qi, L.; Li, H.; Yang, X.; Liu, J. Spatiotemporal Evolution and Influencing Factors of Heat Island Intensity in the Yangtze River Delta Urban Agglomeration Based on GEE. Atmosphere 2024, 15, 1080. [Google Scholar] [CrossRef]
  40. FANG, Y.; SU, X.; HUANG, Z.; CHENG, X. Spatial Spillover Effect of Urban Resilience on Tourism Economy: A Case Study of the Yangtze River Delta Urban Agglomeration. Prog. Geogr. 2022, 41, 214–223. [Google Scholar] [CrossRef]
  41. Li, W.; Chen, Z.; Li, M.; Zhang, H.; Li, M.; Qiu, X.; Zhou, C. Carbon Emission and Economic Development Trade-Offs for Optimizing Land-Use Allocation in the Yangtze River Delta, China. Ecol. Indic. 2023, 147, 109950. [Google Scholar] [CrossRef]
  42. Fiala, D.; Havenith, G.; Bröde, P.; Kampmann, B.; Jendritzky, G. UTCI-Fiala Multi-Node Model of Human Heat Transfer and Temperature Regulation. Int. J. Biometeorol. 2012, 56, 429–441. [Google Scholar] [CrossRef] [PubMed]
  43. Błażejczyk, K.; Broede, P.; Fiala, D.; Havenith, G.; Holmér, I.; Jendritzky, G.; Kampmann, B.; Kunert, A. Principles of the New Universal Thermal Climate Index (UTCI) and Its Application to Bioclimatic Research in European Scale. Misc. Geogr. 2010, 14, 91–102. [Google Scholar] [CrossRef]
  44. Matzarakis, A.; Rutz, F.; Mayer, H. Modelling Radiation Fluxes in Simple and Complex Environments: Basics of the RayMan Model. Int. J. Biometeorol. 2010, 54, 131–139. [Google Scholar] [CrossRef] [PubMed]
  45. Wang, C.; Zhan, W.; Liu, Z.; Li, J.; Li, L.; Fu, P.; Huang, F.; Lai, J.; Chen, J.; Hong, F.; et al. Satellite-Based Mapping of the Universal Thermal Climate Index over the Yangtze River Delta Urban Agglomeration. J. Clean. Prod. 2020, 277, 123830. [Google Scholar] [CrossRef]
  46. Blazejczyk, K. Assessment of Recreational Potential of Bioclimate Based on the Human Heat Balance. In Proceedings of the First International Workshop on Climate, Tourism and Recreation. Report of a Workshop, Halkidiki, Greece, 5–10 October 2001; pp. 133–152. [Google Scholar]
  47. Bröde, P.; Fiala, D.; Błażejczyk, K.; Holmér, I.; Jendritzky, G.; Kampmann, B.; Tinz, B.; Havenith, G. Deriving the Operational Procedure for the Universal Thermal Climate Index (UTCI). Int. J. Biometeorol. 2012, 56, 481–494. [Google Scholar] [CrossRef]
  48. Chen, J.; Xu, C.; Lin, S.; Wu, Z.; Qiu, R.; Hu, X. Is There Spatial Dependence or Spatial Heterogeneity in the Distribution of Vegetation Greening and Browning in Southeastern China? Forests 2022, 13, 840. [Google Scholar] [CrossRef]
  49. Zuo, D.; Han, Y.; Xu, Z.; Li, P.; Ban, C.; Sun, W.; Pang, B.; Peng, D.; Kan, G.; Zhang, R.; et al. Time-Lag Effects of Climatic Change and Drought on Vegetation Dynamics in an Alpine River Basin of the Tibet Plateau, China. J. Hydrol. 2021, 600, 126532. [Google Scholar] [CrossRef]
  50. Fallah Ghalhar, G.; Farhang Dehghan, S.; Asghari, M. Trend Analysis of Humidex as a Heat Discomfort Index Using Mann-Kendall and Sen’s Slope Estimator Statistical Tests. Environ. Health Eng. Manag. J. 2022, 9, 165–176. [Google Scholar] [CrossRef]
  51. Ye, H.; Li, Z.; Zhang, N.; Leng, X.; Meng, D.; Zheng, J.; Li, Y. Variations in the Effects of Landscape Patterns on the Urban Thermal Environment during Rapid Urbanization (1990–2020) in Megacities. Remote Sens. 2021, 13, 3415. [Google Scholar] [CrossRef]
  52. Cong, Y.; Zhu, R.; Yang, L.; Zhang, X.; Liu, Y.; Meng, X.; Gao, W. Correlation Analysis of Thermal Comfort and Landscape Characteristics: A Case Study of the Coastal Greenway in Qingdao, China. Buildings 2022, 12, 541. [Google Scholar] [CrossRef]
  53. Zhou, R.; Xu, H.; Zhang, H.; Zhang, J.; Liu, M.; He, T.; Gao, J.; Li, C. Quantifying the Relationship between 2D/3D Building Patterns and Land Surface Temperature: Study on the Metropolitan Shanghai. Remote Sens. 2022, 14, 4098. [Google Scholar] [CrossRef]
  54. Sun, F.; Liu, M.; Wang, Y.; Wang, H.; Che, Y. The Effects of 3D Architectural Patterns on the Urban Surface Temperature at a Neighborhood Scale: Relative Contributions and Marginal Effects. J. Clean. Prod. 2020, 258, 120706. [Google Scholar] [CrossRef]
  55. He, W.; Cao, S.; Du, M.; Hu, D.; Mo, Y.; Liu, M.; Zhao, J.; Cao, Y. How Do Two- and Three-Dimensional Urban Structures Impact Seasonal Land Surface Temperatures at Various Spatial Scales? A Case Study for the Northern Part of Brooklyn, New York, USA. Remote Sens. 2021, 13, 3283. [Google Scholar] [CrossRef]
  56. Kong, F.; Chen, J.; Middel, A.; Yin, H.; Li, M.; Sun, T.; Zhang, N.; Huang, J.; Liu, H.; Zhou, K.; et al. Impact of 3-D Urban Landscape Patterns on the Outdoor Thermal Environment: A Modelling Study with SOLWEIG. Comput. Environ. Urban Syst. 2022, 94, 101773. [Google Scholar] [CrossRef]
  57. Wei, J.; Li, Y.; Jia, L.; Liu, B.; Jiang, Y. The Impact of Spatiotemporal Effect and Relevant Factors on the Urban Thermal Environment Through the XGBoost-SHAP Model. Land 2025, 14, 394. [Google Scholar] [CrossRef]
  58. Tan, J.; Wei, Q.-J.; Liao, Z.-Y.; Kuang, W.-J.; Deng, H.-T.; Yu, D. Relationship between Urban Form and Surface Temperature Based on XGBoost SHAP Interpretable Machine Learning Model. Ying Yong Sheng Tai Xue Bao 2025, 36, 659–670. [Google Scholar] [CrossRef]
  59. Zhao, X.; Yang, H.; Yao, Y.; Qi, H.; Guo, M.; Su, Y. Factors Affecting Traffic Risks on Bridge Sections of Freeways Based on Partial Dependence Plots. Phys. A Stat. Mech. Its Appl. 2022, 598, 127343. [Google Scholar] [CrossRef]
  60. Zheng, Z.; Lin, X.; Chen, L.; Yan, C.; Sun, T. Effects of Urbanization and Topography on Thermal Comfort during a Heat Wave Event: A Case Study of Fuzhou, China. Sustain. Cities Soc. 2024, 102, 105233. [Google Scholar] [CrossRef]
  61. Zheng, Y.; Li, Y.; Hou, H.; Murayama, Y.; Wang, R.; Hu, T. Quantifying the Cooling Effect and Scale of Large Inner-City Lakes Based on Landscape Patterns: A Case Study of Hangzhou and Nanjing. Remote Sens. 2021, 13, 1526. [Google Scholar] [CrossRef]
  62. Zou, Z.; Yan, C.; Yu, L.; Jiang, X.; Ding, J.; Qin, L.; Wang, B.; Qiu, G. Impacts of Land Use/ Land Cover Types on Interactions between Urban Heat Island Effects and Heat Waves. Build. Environ. 2021, 204, 108138. [Google Scholar] [CrossRef]
  63. Shu, Y.; Zou, K.; Li, G.; Yan, Q.; Zhang, S.; Zhang, W.; Liang, Y.; Xu, W. Evaluation of Urban Thermal Comfort and Its Relationship with Land Use/Land Cover Change: A Case Study of Three Urban Agglomerations, China. Land 2022, 11, 2140. [Google Scholar] [CrossRef]
  64. Palanisamy, P.A.; Zawadzka, J.; Jain, K.; Bonafoni, S.; Tiwari, A. Assessing Diurnal Land Surface Temperature Variations across Landcover and Local Climate Zones: Implications for Urban Planning and Mitigation Strategies on Socio-Economic Factors. Sustain. Cities Soc. 2024, 116, 105880. [Google Scholar] [CrossRef]
  65. Kianmehr, A.; Lim, T.C. Quantifying Interactive Cooling Effects of Morphological Parameters and Vegetation-Related Landscape Features during an Extreme Heat Event. Climate 2022, 10, 60. [Google Scholar] [CrossRef]
  66. Massaro, E.; Schifanella, R.; Piccardo, M.; Caporaso, L.; Taubenböck, H.; Cescatti, A.; Duveiller, G. Spatially-Optimized Urban Greening for Reduction of Population Exposure to Land Surface Temperature Extremes. Nat. Commun. 2023, 14, 2903. [Google Scholar] [CrossRef]
  67. Iungman, T.; Cirach, M.; Marando, F.; Pereira Barboza, E.; Khomenko, S.; Masselot, P.; Quijal-Zamorano, M.; Mueller, N.; Gasparrini, A.; Urquiza, J.; et al. Cooling Cities through Urban Green Infrastructure: A Health Impact Assessment of European Cities. Lancet 2023, 401, 577–589. [Google Scholar] [CrossRef]
  68. Yang, Y.; Lv, Y.; Zhou, D. The Impact of Urban Parks on the Thermal Environment of Built-up Areas and an Optimization Method. PLoS ONE 2025, 20, e0318633. [Google Scholar] [CrossRef]
  69. Cao, B.; Chen, Q.; Du, M.; Cheng, Q.; Li, Y.; Liu, R. Simulation Analysis of the Cooling Effect of Urban Water Bodies on the Local Thermal Environment. Water 2022, 14, 3091. [Google Scholar] [CrossRef]
  70. How Jin Aik, D.; Ismail, M.H.; Muharam, F.M.; Alias, M.A. Evaluating the Impacts of Land Use/Land Cover Changes across Topography against Land Surface Temperature in Cameron Highlands. PLoS ONE 2021, 16, e0252111. [Google Scholar] [CrossRef]
  71. Chen, X.; Gu, X.; Liu, P.; Wang, D.; Mumtaz, F.; Shi, S.; Liu, Q.; Zhan, Y. Impacts of Inter-Annual Cropland Changes on Land Surface Temperature Based on Multi-Temporal Thermal Infrared Images. Infrared Phys. Technol. 2022, 122, 104081. [Google Scholar] [CrossRef]
  72. He, B.-J.; Ding, L.; Prasad, D. Wind-Sensitive Urban Planning and Design: Precinct Ventilation Performance and Its Potential for Local Warming Mitigation in an Open Midrise Gridiron Precinct. J. Build. Eng. 2020, 29, 101145. [Google Scholar] [CrossRef]
  73. Han, D.; An, H.; Wang, F.; Xu, X.; Qiao, Z.; Wang, M.; Sui, X.; Liang, S.; Hou, X.; Cai, H.; et al. Understanding Seasonal Contributions of Urban Morphology to Thermal Environment Based on Boosted Regression Tree Approach. Build. Environ. 2022, 226, 109770. [Google Scholar] [CrossRef]
  74. Li, H.; Li, Y.; Wang, T.; Wang, Z.; Gao, M.; Shen, H. Quantifying 3D Building Form Effects on Urban Land Surface Temperature and Modeling Seasonal Correlation Patterns. Build. Environ. 2021, 204, 108132. [Google Scholar] [CrossRef]
  75. Han, D.; An, H.; Cai, H.; Wang, F.; Xu, X.; Qiao, Z.; Jia, K.; Sun, Z.; An, Y. How Do 2D/3D Urban Landscapes Impact Diurnal Land Surface Temperature: Insights from Block Scale and Machine Learning Algorithms. Sustain. Cities Soc. 2023, 99, 104933. [Google Scholar] [CrossRef]
  76. Jiang, Y.; Huang, J.; Shi, T.; Wang, H. Interaction of Urban Rivers and Green Space Morphology to Mitigate the Urban Heat Island Effect: Case-Based Comparative Analysis. Int. J. Environ. Res. Public Health 2021, 18, 11404. [Google Scholar] [CrossRef]
  77. Wai, C.Y.; Tariq, M.A.U.R.; Muttil, N. A Systematic Review on the Existing Research, Practices, and Prospects Regarding Urban Green Infrastructure for Thermal Comfort in a High-Density Urban Context. Water 2022, 14, 2496. [Google Scholar] [CrossRef]
  78. Yasa, E. The Interaction of Wind Velocity and Air Gap Width on the Thermal Comfort in Naturally Ventilated Buildings with Multiple Skin Facade. Athens J. Technol. Eng. 2022, 9, 213–266. [Google Scholar] [CrossRef]
  79. Zhou, H.; Yang, H.; Peng, J. Solar PV Vacuum Glazing (SVG) Insulated Building Facades: Thermal and Electrical Performances. Appl. Energy 2024, 376, 124323. [Google Scholar] [CrossRef]
  80. Pan, T.; He, S.; Liu, Z.; Jiang, L.; Zhao, Q.; Hamdi, R. Analyzing Changes in Urban Green Spaces and Their Effect on Land Temperature from the Perspective of Surface Radiation Energy Balance in Rizhao City, the Central Coast of China. Remote Sens. 2023, 15, 4785. [Google Scholar] [CrossRef]
  81. Wang, W.; Zhang, J.; Li, J. Research on Urban Three-Dimensional Greening Design from the Perspective of Climate Change—A Case Study of Beilin District, Xi’an, Shaanxi Province, China. Environ. Sci. Pollut. Res. 2024, 31, 6067–6081. [Google Scholar] [CrossRef]
  82. Liu, C.; Lu, S.; Tian, J.; Yin, L.; Wang, L.; Zheng, W. Research Overview on Urban Heat Islands Driven by Computational Intelligence. Land 2024, 13, 2176. [Google Scholar] [CrossRef]
  83. Li, N.; Wu, H.; Ouyang, X. Localized Downscaling of Urban Land Surface Temperature—A Case Study in Beijing, China. Remote Sens. 2022, 14, 2390. [Google Scholar] [CrossRef]
  84. Wang, B.; Yi, Y.K. Developing an Adapted UTCI (Universal Thermal Climate Index) for the Elderly Population in China’s Severe Cold Climate Region. Sustain. Cities Soc. 2021, 69, 102813. [Google Scholar] [CrossRef]
Figure 1. Location of the study area.
Buildings 15 02261 g001
Figure 2. Overall workflow.
Buildings 15 02261 g002
Figure 3. Spatiotemporal distribution of UTCI in the YRDUA, 2000–2020.
Buildings 15 02261 g003
Figure 4. Change trends in UTCI in the YRDUA, 2000–2020.
Buildings 15 02261 g004
Figure 5. XGBoost model training and validation results.
Buildings 15 02261 g005
Figure 6. SHAP values and relative importance of influencing factors.
Buildings 15 02261 g006
Figure 7. Partial dependence plot.
Buildings 15 02261 g007
Table 1. Data sources.
DataYearResolutionSource
Air temperature (Ta)2000, 2005, 2010, 2015, 20201 kmNational Earth System Science Data Center
(https://www.geodata.cn/, accessed on 2 May 2025)
Relative humidity (RH)1 km
Wind speed (WS)1 km
Solar radiation (SR)1 kmGlobal resources data cloud
(http://www.gis5g.com/, accessed on 2 May 2025)
Land surface temperature (Ts)1 kmMODIS MOD11A1 LST Product
(https://earthengine.google.com/, accessed on 5 April 2025)
Land use and land cover30 mThe 30 m annual land cover datasets in China
(https://zenodo.org/records/12779975, accessed on 5 April 2025)
3D building data100 mGlobal Human Settlement Layer
(https://human-settlement.emergency.copernicus.eu/, accessed on 5 April 2025)
Table 2. Thermal stress classification based on UTCI ranges.
UTCI RangesThermal Stress Classification
9–26 °CNo thermal stress
26–32 °CModerate heat stress
32–38 °CStrong heat stress
38–46 °CVery strong heat stress
>46 °CExtreme heat stress
Table 3. Mann–Kendall test trend categories.
β|Z|Trend Features
β > 0|Z| > 2.58Very significant warming
1.96 < |Z| ≤ 2.58Significant warming
|Z| ≤ 1.96Slight significant warming
β < 0|Z| ≤ 1.96Slight significant cooling
1.96 < |Z| ≤ 2.58Significant cooling
|Z| > 2.58Very significant cooling
Table 4. 2D/3D Landscape indictors.
DimensionsIndicatorsAbbreviationFormulaDescription
2D *Mean Patch Area (m2)AREA_MN A R E A M N = A N Average area of patches.
Aggregation Index (%)AI A I = g i i m a x ( g i i ) × 100 The connectivity among patches within each landscape type.
Patch Density (patches/km2)PD P D = n i A × 10 6 The density of patches within a given landscape area.
Percentage of Landscape (%)PLAND P L A N D = j = 1 n a i j A × 100 The ratio of patch area to total landscape area.
Mean Shape IndexSHAPE_MN S H A P E M N = j = 1 n 0.25 p i j a i j The complexity of patch shapes.
3D **Building Height (m)BH Building height.
Building Volume (m3)BV B V = A × B H Building volume.
Building Height Standard Deviation (m)BHSTD B H S T D = i = 1 n ( H i H m e a n ) 2 n The degree of change in buildings.
High-Rise Building Ratio (%)HBR H B R = N h / N The proportion of buildings > 24 m.
* The formulas and descriptions of the 2D indicators are from FRAGSTATS. ** Hi is the height of the building i; Hmean is the mean height of all buildings; n is the number of buildings; Nh is the number of high-rise buildings (>24 m) in each grid; and N is the number of buildings in each grid.
Table 5. The area of different UTCI levels in the YRDUA from 2000 to 2020 (km2).
Moderate Heat StressStrong Heat StressVery Strong Heat Stress
200020052010201520202000200520102015202020002005201020152020
Anqing644424634100070555013876491310,913561973789223797616107199
Changzhou0001404159183038694356346721125405010903
Chizhou9568138325133457526254725761740943696567335034244139
Chuzhou0000012,3211275292213,4769293115512,20110,55404183
Hangzhou738391607156262715,16310,44214,36514,80914,5484705538139901196
Hefei00027076841260258311,4086945375110,175885204490
Huzhou121651172181275396252050765599525630032326240434
Jiaxing0000039743940397439743974034000
Jinhua808302528102123892815701808096836171864495023452494544
Ma’anshan00000263046414444062240614323598261801656
Nanjing00010616213513600660655574455256300701050
Nantong9007518344835383538278835200000
Ningbo32762263938189805679458120744581940376000
Shanghai10189062146200621461266215015000
Shaoxing124147431464769256557143756669106422116630906
Suzhou11001303807773758076798280932473736016
Taizhou (ZJ)1565552111914115107621840680497764819602281811480
Taizhou (JS)000105728479757295728567319320056
Tongling00000178955216522997197212082445134501025
Wuxi000504490321142094585407410013793810516
Wuhu00000437053523545995472916255460364101266
Xuancheng23612120942520411,7765716842111,90699193196494370102208
Yancheng89661006414,38814,00614,30414,37314,413046516740
Yangzhou0002064742283473965916488120431118551106
Zhenjiang00100374613263493383730949125113430743
Zhoushan4612372294093596994475294100000
Disclaimer/Publisher’s Note: The statements, opinions and data contained in all publications are solely those of the individual author(s) and contributor(s) and not of MDPI and/or the editor(s). MDPI and/or the editor(s) disclaim responsibility for any injury to people or property resulting from any ideas, methods, instructions or products referred to in the content.

