Article

Study on the Spatial Coupling Coordination of Public Service Facilities Around Large Comprehensive Hospitals in Beijing from a Supply–Demand Perspective

1
School of Environmental Engineering, The University of Kitakyushu, Fukuoka 802-8577, Japan
2
China IPPR International Engineering Co., Ltd., Beijing 100081, China
*
Author to whom correspondence should be addressed.
Buildings 2025, 15(13), 2188; https://doi.org/10.3390/buildings15132188
Submission received: 26 February 2025 / Revised: 30 March 2025 / Accepted: 7 April 2025 / Published: 23 June 2025
(This article belongs to the Section Architectural Design, Urban Science, and Real Estate)

Abstract

With the development of urban construction and the improvement of residents’ quality of life, the focus of governance has shifted to a people-centered approach. In the core area of Beijing, there is a mismatch between the existing large comprehensive hospitals (LCHs) and the current demand for medical technology and services. Therefore, this study focuses on tertiary LCHs in the core area of Beijing from the perspective of supply and demand (SD) and explores in depth the problem of matching the crowd concentration and the SD of the surrounding public service facilities in the process of seeking medical treatment. By comprehensively analyzing the public service facilities within a 15-min walking distance around the hospital and considering demand, supply, and transport factors, this study identifies 15 key indicators, constructs an SD coupling model (SDCM) evaluation system, and systematically evaluates the space of public service facilities around an LCH. The results show that the higher the spatial coupling and coordination of these facilities around the LCH, the more tightly the system is connected, and the more pronounced the coupling effect is in the vicinity of the hospital, which suggests that the hospital has a clustering effect on its radiating area.

1. Introduction

Since China entered the process of modernization and development, significant progress has been made in urban construction and improvements in the quality of life of residents [1,2]. The concept of urban construction has undergone a fundamental shift from being dominated by rapid economic development to being people-centered, with the aim of building harmonious and livable cities that are more convenient, comfortable, and beautiful [3]. However, as people’s living needs continue to rise, unbalanced and inadequate urban development as well as urban spatial and environmental problems have become increasingly prominent [4,5], requiring urban governance to focus more on the people-centered concept and promote balanced and comprehensive urban construction [6]. The Beijing core area, as an important display window of temperament and outlook, should be more committed to enhancing the diversity and convenience of services [7,8,9]. In the context of the policy of relieving non-capital functions, the reuse of vacated space and inefficient space has become an important issue, especially in the construction of public service-oriented construction, which requires comprehensive and integrated planning and construction in terms of spatial enhancement, economic development, and facility configuration. As a major health facility in the city, a large comprehensive hospital (LCH) is an important part of China’s medical resources [10]. However, in the actual construction and use process, the high degree of crowd concentration in LCH has led to a series of common problems, such as transport congestion and poor medical experience. The essential cause of these problems is the contradiction between SD of urban space around hospitals [11,12]. Therefore, it has become imperative to improve the accessibility and functional complexity of public spaces around hospitals, as well as the diversified and multi-layered arrangement of public service facilities.
Maslow’s hierarchy of needs theory occupies an important position in modern behavioral science and is one of the five theoretical pillars of managerial psychology [13]. In 1943, the American psychologist Maslow proposed this theory, which classifies human needs into five categories, namely physiological, safety, social, respect, and self-actualization, and considers the needs to be stepped [14]. However, there are limitations to this theory, such as the absence of lower-level needs sometimes stimulating higher-level needs. Therefore, specific analyses are needed for issues. For example, with the development of the economy and the improvement of life quality, people’s needs in medical care become more diversified and compound, from the treatment of disease to the pursuit of healthy life, and the level of needs is gradually increased [15]. Research on hospitals and their surrounding spatial environments by scholars at home and abroad focuses on the accessibility [16,17], equity [18,19,20], and spatial distribution characteristics [21,22] of medical facilities, while less research has been conducted on the evaluation of the supply level of public service facilities in the vicinity of hospitals [23,24,25].
Matching SD refers to the quantity and spatial matching of service supply and residents’ demand in a certain area [26,27]. Early on, questionnaires were mostly used to understand the evaluation of open space SD through subjective judgment, lacking objective quantitative analysis [28,29]; later on, some scholars constructed the attractiveness of space by constructing an evaluation system and analyzed the distribution of demand according to the population distribution data, constructing a framework for attractiveness–demand analysis [30]; in the area of healthcare facilities, from the viewpoint of SD, service levels and modes were analyzed and evaluated in terms of both community healthcare and the overall healthcare and medical systems to analyze and evaluate the service level and mode. Fang et al. introduced the concept of SD coordination, constructed the evaluation index system of SD coordination, and introduced the coupled degree of coordination model to judge the type of SD and the degree of coordinated development, and the degree of coordinated development is judged [31]. Most of the above studies on the characteristics of public health service facilities and health care behavior only consider the travel and consultation process and are less involved in the waiting and consultation process, such as escorting, and the demand for purchasing, accommodation, and catering in the process of medical treatment is not included in the supply system of facilities in the area [32]. At the same time, the aggregation of hospitals to the surrounding areas makes the flow of people in the area where the hospitals are located increase, and the study on the level of SD of public service facilities is not suitable for special functions, and the study on the level of SD is not suitable for special functions. The study on the level of SD of public service facilities has seldom reflected the special characteristics of special functional areas [33].
The mayor of Paris put forward the concept of a ‘15-min city’, which advocates that residents should be able to satisfy their daily needs, such as shopping, work, and recreation, within 15 min [34]. Domestic academic research on the 15-min living sphere is mostly focused on theoretical discussions [35], and Shanghai, as a pioneer, has taken the lead in incorporating the ‘15-min community living sphere’ into urban planning practice [36]. Therefore, from the perspective of SD, this study focuses on the issue of crowd concentration and the matching of SD of regional public service facilities in the process of medical treatment, with the tertiary LCH in the core area of Beijing as the core [37]. The study aims to systematically analyze the situation of public service facilities within a 15-min walking distance of hospitals and to reveal the contradiction between SD as well as their spatial distribution characteristics. To achieve this goal, this study comprehensively considered tertiary factors, namely the demand side, the supply side, and the transport links; identified 15 key evaluation indicators; and constructed an SDCM evaluation system. The system can comprehensively and objectively reflect the overall situation of the public service facility space around LCH and its degree of coupling coordination. Eventually, based on this evaluation system, the matching relationship between the SD of residents and public service facilities around the hospital, the matching level of transport development, and the results of the coupling level are analyzed to obtain the coupling law of the space of public service facilities around LCH in the core area of Beijing, which will provide a scientific basis for the optimization of the layout of public service facilities and the enhancement of the level of urban governance. At the same time, this study will also provide useful references for the research and solution of similar problems in other cities [38,39].

2. Materials and Methods

2.1. Research Domain

Beijing’s functional core area is the core carrying area of the national political center, cultural center, and international communication center, the key area for the protection of historical and cultural cities, and an important window for displaying the national image, with a special status and great responsibility, and the overall area covers a total area of about 92.5 square kilometers, including 32 streets. As a core city with a long history, the facilities here are not only comprehensive but also emphasize quality improvement, and the resources are abundant but still need to be rationally distributed to avoid overcrowding [40].
This study focuses on 23 LCH in the core area of Beijing and defines the study area based on the circle of life theory, defining the 15-min walking distance as the scope [27]. Given that the medical population and neighboring residents generally use facility resources on foot, and that the 15-min is generally the maximum walking time commonly accepted, this delineation method has a scientific basis [41,42]. The study aims to explore the distribution of facility resources in the area around tertiary LCH and to study the coupling and coordination relationship in terms of supply, demand, and connecting links in order to enhance the efficiency of urban services, shape the image of the city, and to promote sustainable development [43]. The study area and hospital distribution are shown in Figure 1, where black squares mark the geographic locations of the 23 LCH studied in this paper. This study provides empirical and theoretical support for urban planning and facility optimization and promotes the innovative integration of academia and practice.

2.2. Methods

2.2.1. Supply and Demand Coupling Coordination Degree Model

The research method of the supply and demand coupling coordination degree (SDCCD) model first involves the construction of a supply indicators and demand indicators library, the standardization of indicators in accordance with the weight calculation, and adding them into the model formula for generating SD results to derive the SD synergy degree category for the proposed targeted strategy. This study aims to study the public service facilities within 15-min walking distances of LCHs, with the aim of exploring the degree of coordination between the SD of population demand, facility supply, and transport.

2.2.2. Selection of Evaluation Indicators

When constructing the evaluation system of public service facilities, quantitative indicators are scientifically selected to comprehensively reflect residents’ access to medical care and daily activities. In this study, medical services and public services are screened based on Beijing’s planning requirements and spatial distribution and residents [44]. Although the existing norms emphasize the diversified and convenient layout of facilities for medical care and commercial and sports activities, they lack the detailed evaluation criteria around large hospitals. Therefore, this paper combines the research norms and constructs an indicator library for the supply–demand coupling coordination model, covering economic, social, and urban aspects, including 3 primary, 8 secondary, and 15 tertiary indicators (Table 1).
Among them, the diversity of the business index is an important indicator to reflect the spatial distribution and abundance of facilities. In this study, Shannon’s diversity index is used to calculate the diversity of facilities, which is used to describe the degree of disorder and uncertainty in the appearance of individuals. The larger the index, the more diverse the karma. See the following Equations (1) and (2) for more details:
H = i = 1 S p i ln p i
p i = n i N
H denotes the evenness and diversity of the distribution of public service facilities within the range. S denotes the number of businesses, with a maximum value of 6. i denotes the ith type of facility, pi is the percentage of public service facilities within the study orientation, N denotes the number of POI of all facilities within the living area, and ni denotes the number of businesses in the ith type of mode.

2.2.3. AHP to Determine Indicator Weights

The analytic hierarchy process (AHP) is a multi-criteria decision-making method proposed by Saaty, T.L. which can simplify the fuzzy and complex problems and form a clear decision by analyzing the primary and secondary relationships of complex factors [45]. In this study, AHP is used to calculate the mutual influences and weights among the indicators of the SDCM, including model construction, determination of weights, and consistency test. Details of the indicators are shown in Table 1.
(1)
Constructing a judgment matrix
AHP was used to make a fuzzy comprehensive judgment of the results of the questionnaire, and the relative importance of the two-by-two indicators was calculated through the judgment matrix of Equation (3) to determine their respective weights.
P = ( p i j ) n × n
where pij > 0, pij = 1/pij, pij represents the indicator pi and pj. The proportion of the scale of importance is relative to the previous layer of indicators, where the larger the value indicates a higher importance, usually using a scale of 1 to 9. This scale is used in the following Table 2.
(2)
Calculating the weight vector and the largest characteristic root
Calculate the largest characteristic root of the matrix P, whose corresponding Eigenvector matrix is W, the required weight vector matrix: PW = λ max W , calculate the weight vectors wi of each row of the matrix using the arithmetic mean method, normalizing the elements of P by columns: p i j / p k j , the normalized columns are added and divided by n to obtain the weight vector. In summary, the above belongs to the calculation Equation (4), written as follows:
W i = 1 n j = 1 n a i j k = 1 n a k j ( i = 1 , 2 , 3 , )
The judgment matrix W of P is calculated as follows Equation (5):
W = w 1 w 2 w 3
Finally, the largest characteristic root is found by substituting the values into the following Equation (6):
λ max = i = 1 n ( P W ) i n W i
(3)
Consistency test
As the evaluation system supply-side indicators have a certain degree of subjectivity and diversity, in order to ensure the rationality of the indicator system, use the following formula for the consistency test:
CI = λ max n n 1
The final judgment of whether the consistency test is satisfied requires the consistency ratio CR, as shown in Equation (8):
CR = CI RI
where RI is the average random consistency indicator, the values are shown Table 3.
When the CR < 0.10, it can be judged that the results of the matrix consistency test passed. Calculated in accordance with the above steps of the hierarchical analysis method, the application of SPSS 28.0 calculation and analysis of the results of the weight of each indicator see Table 4.

2.2.4. Data Sources and Processing Methods

The main data of this study were collected with the help of the Baidu open platform to collect all kinds of data on public service facilities, activity facilities, POI data, and road data; we crawled the basic information of residential neighborhoods on the Chain Home website with Python 3.10 and we used WorldPop to obtain the population data of each township and street. ArcGIS 10.2 was used for spatial analysis and visualization, and Excel tools were used for data analysis and correlation tests. Because the multi-indicator evaluation involves different orders of magnitude, quantities, and properties, the min–max standardization method was used to process the data and map them into the [0–1] interval to avoid the imbalance of the indicator impacts, and the specific formulas are shown in Equations (9) and (10).
Positive indicators:
A i = a i a min a max a min
Negative indicators:
A i = a max a i a max a min
where ai indicates the value corresponding to each indicator before conversion, Ai denotes the converted value, and amax and amin represent the maximum and minimum values in the same indicator series.

2.2.5. Evaluation of SDCCD Model

Coupling refers to the phenomenon of mutual influence between two or more systems or movement patterns through interaction. The study constructed a tertiary indicator layer coupling coordination model covering crowd demand push, facility supply pull, and transport link effectiveness, aiming to reflect the degree of spatial matching and coordination among the three. In this study, adjustments were made on the dual system coupled coordination degree calculation framework so as to derive the calculation formula applicable to this study [46]. The coupled coordinated development index D consists of the coupling degree C and the coupled coordination index T, both of which are calculated based on the comprehensive evaluation value U of the indicators. The coupling degree C is used to reveal the corresponding tripartite relationship of the tertiary indicator layers, ranging from [0, 1]; the higher it is, the closer the connection between the elements of the system and the mutual promotion; the coupling coordination index T is the comprehensive evaluation of the system, reflecting the degree of contribution of the three indicators to the level of service of the facility.
Calculate the comprehensive evaluation score U of each indicator layer (Equation (11)); the standardized tertiary indicators are weighted and summed according to Table 5 to obtain the respective comprehensive evaluation scores Us, Ud, and Uc for supply, demand, and ties. The value indicates the strength of the contribution of each system to the degree of coupling coordination to determine whether it is a ‘demand lagging type’ or a ‘supply lagging type’.
U = i = 1 k W i X i
where W is the weight of the ith tertiary indicator; k is the sum of the number of indicators; and x is the result of standardization of the ith tertiary indicator.
The coupling degree C is as listed in Equation (12):
C = U s U d U c U s + U d + U c 3 3 3
The coupling coordination index T is shown in Equation (13):
T = α U s + β U d + γ U c
where, α, β, and γ represent the weight of the corresponding indicators because each indicator is equally important; therefore, they are set to one-third and substituted into Equation (14), which gives the coupling level D.
D = C T
Based on the relationship between the tripartite results of supply, demand, and ties can be derived from the level of SD (Us − Ud), the transport development index (Us − (Ud + Uc)), and the level of coupling D in the study area, respectively. In the process of studying the degree of coupling coordination, the ten-point method is introduced as a division criterion to define the degree of coordination, and the criteria table is shown in Table 5.

3. SDCCD Experimental Process

3.1. Experimental Data Acquisition

(1)
Hospital data
Medical facilities in the core area were obtained through the Baidu map editor, and a total of 23 tertiary LCH were screened out in accordance with the criteria for determining the level of hospitals in Beijing. The hospitals and their corresponding serial numbers are shown in Table 6.
(2)
Population and settlement data
The Global Population Spatial Dataset in WorldPop integrates a large amount of data to classify and spatialize the global spatial distribution of the population to support population dynamics studies. This stsudy obtains population raster data at 100 m × 100 m resolution for the east and eest urban areas in 2020 from this website (Figure 2).
(3)
Other data
In this study, we obtained POI data of various types of facilities in 2023 by calling the API interface of Baidu map. Meanwhile, using the Open Street Map (OSM) dataset, after vectorization, we obtained road information of the core area. In order to assess the demand for medical care, the number of hospital beds and average daily visits were selected as indicators, and these values reflect the hospital’s ability to attract patients other than those living within a fifteen-minute walking distance (Table 7). In addition, this study obtained evaluation indicators on facility satisfaction through the popular review platform.

3.2. Calculation of Indicators by Classification

The data from the above study were processed to obtain results that could be used to transform into indicators. First, a 100 m × 100 m fishing net was created in ArcGIS software, and individual data information was dropped onto the net. To ensure the completeness of the raster data drop, we extended 100 m outward from the boundary of the study area to obtain complete raster data information.
(1)
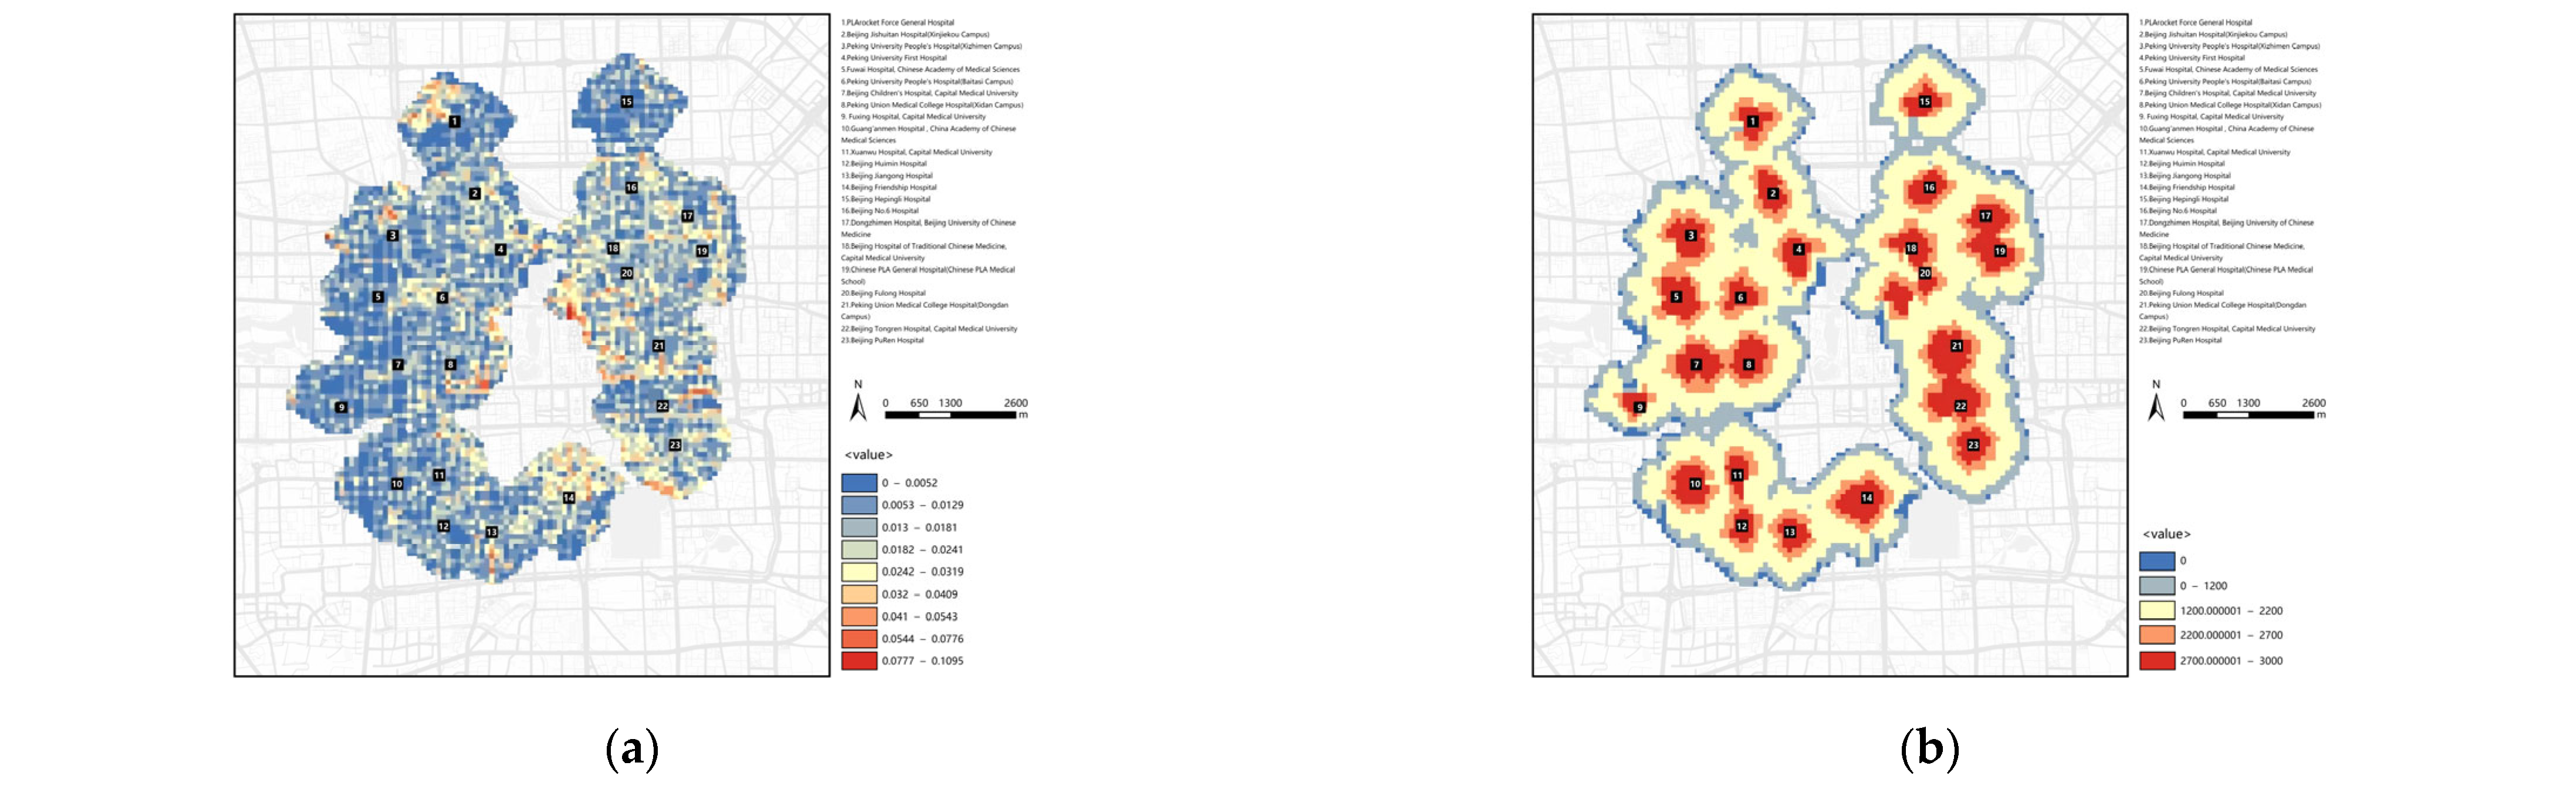
Information on the Data of Each Indicator Under the Demand Thrust of the Population
The results of obtaining the four indicators under the crowd demand pull indicator, population density, percentage of elderly and children population, demand for medical consultation, and average consumption level in the Worldpop website are shown in Figure 3.
(2)
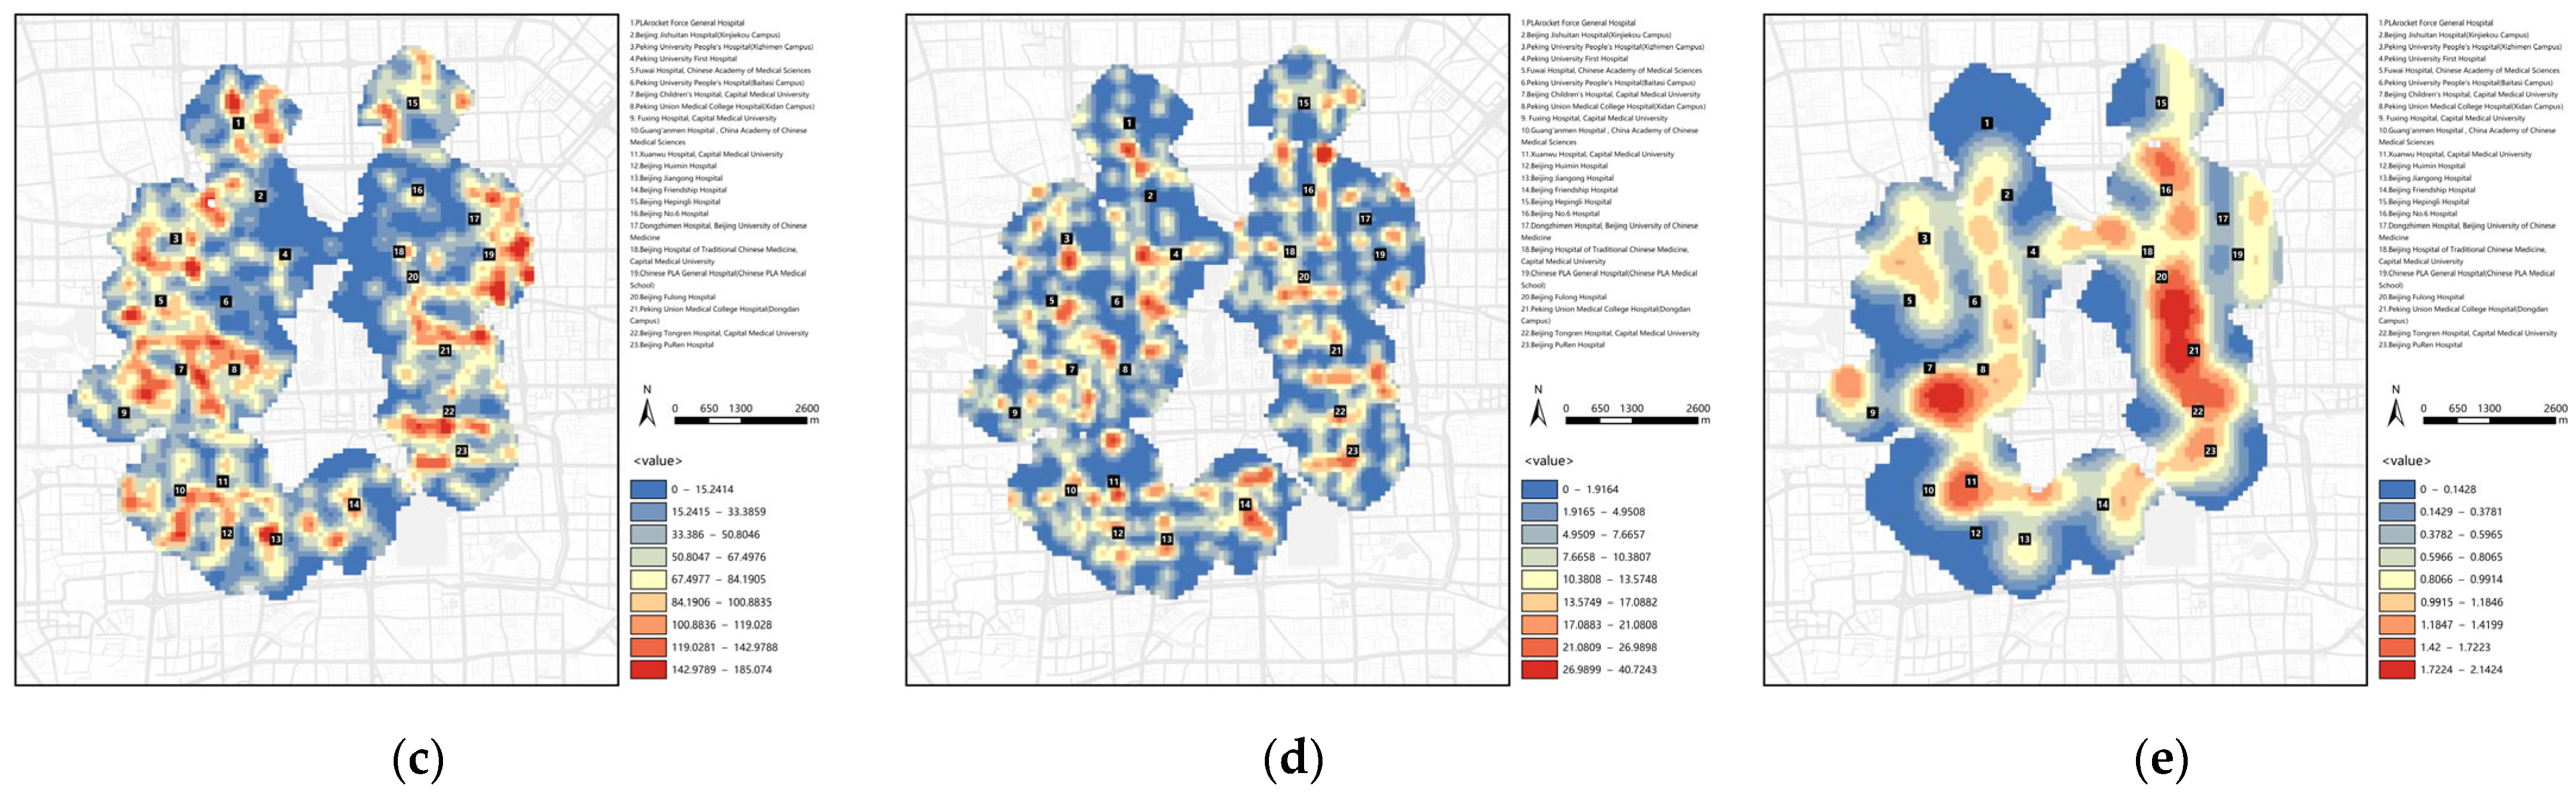
Information on the Data of Indicators Under the Pull of Space Supply of Facilities
Based on the results of the spatial distribution of various types of public service facilities, several specific indicators under the spatial supply tension indicator of facilities are obtained, including business diversity, facility coverage, facility density, activity facility density, and facility satisfaction, as shown in Figure 4.
(3)
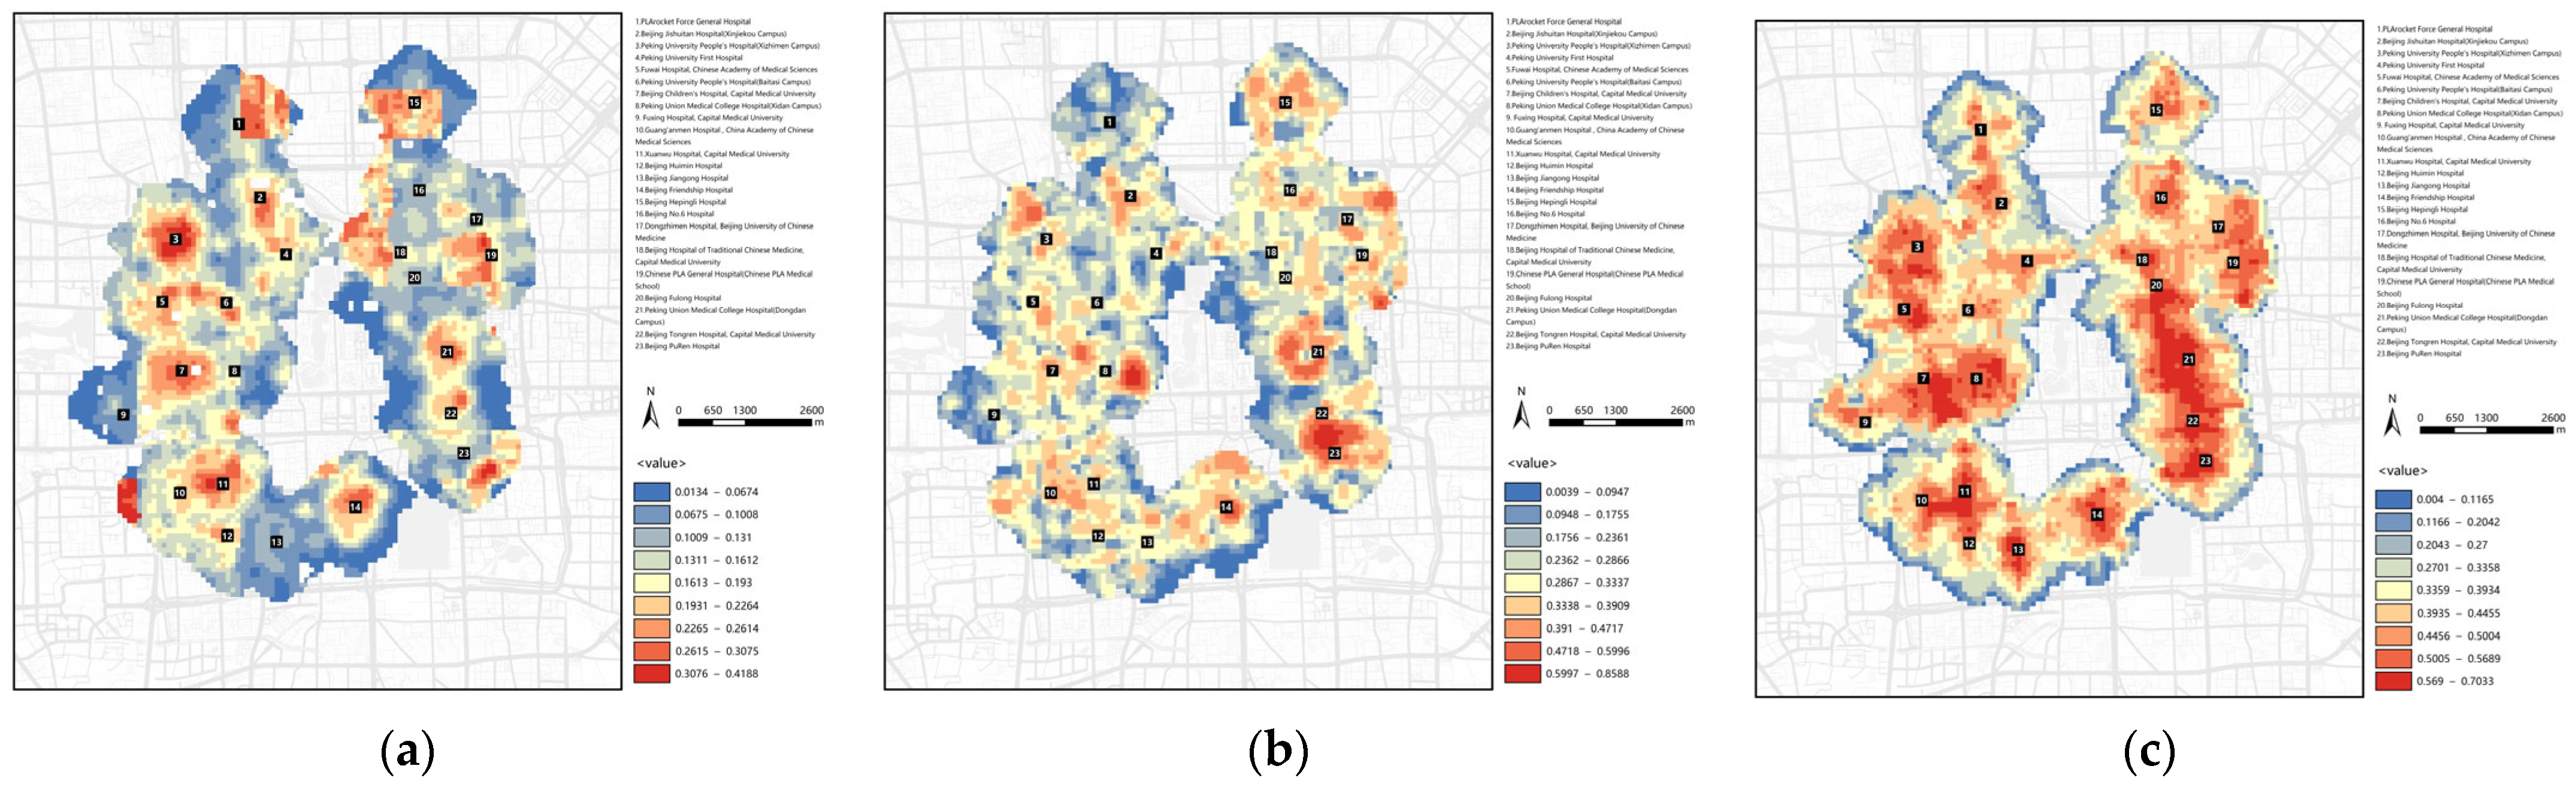
Information on the Data for Indicators of the Effectiveness of Transportation Links
Based on the acquired data, a few specific indicators under the transportation link effectiveness indicator were obtained, including road network density, road accessibility, parking density, and public transportation stop density, as shown in Figure 5.

3.3. Calculation of the Overall Indicator Score

Crowd demand pulls to the degree of demand for public service facilities in the neighborhood by residents and health care seekers. Combining the indicators of population, demand for medical care, and economy, this study evaluates the supply of facilities in each region and standardizes the calculation using the weights in Table 4. The supply tension of public service facilities reflects the level of supply, including the diversity of business, the density and coverage of facilities, and the level of service. Currently, diversified demand is difficult to satisfy by facility coverage and density alone. Facilities are crucial to transportation layout and economic development, directly affecting people’s quality of life. Transportation choices affect residents’ travel, and network layout is significant to daily life. Transportation and commercial activities complement each other; convenient transportation attracts commercial gatherings, and improved facility areas promote transportation optimization. The results of each indicator are shown in Figure 6.
As can be seen in Figure 6a, the high-demand areas are mainly concentrated in areas of high population density. The two high-demand areas on the north side are highly influenced by population density, probably due to the formation of residential areas, and the demand characteristics are obvious. The demand in the central area is affected by the demand for hospital access, especially around tertiary hospitals, with People’s Hospital, Children’s Hospital, and the Seventh Medical Center of the People’s Liberation Army having the highest demand, followed by Xuanwu Hospital, Youyi Hospital, Xiehe Hospital, and Tongren Hospital. Figure 6b shows that the distribution of facilities significantly affects the evaluation results. The supply of facilities in shopping districts is much higher than in other areas, and large shopping districts raise the level of commercial supply. The supply along Xidan-Xisi Avenue is moderate, and the supply of facilities between the Second and Third Ring Roads in the north is low. The supply of facilities in Dongcheng District is slightly better than that in Xicheng District, but the overall supply is moderately low, with fair coverage and density, and diversity and satisfaction to be improved. Figure 6c shows that overall transportation effectiveness is good, with most districts above the median and balanced development. Dongcheng District is better than Xicheng District, with the best transportation effectiveness around popular metro stations and business districts and significant traffic aggregation effects in business districts and hospital concentration areas, which are consistent with the distribution of hospitals, indicating that there is good transportation around hospitals and reasonable resource distribution.

4. Analysis of Results

The results of the sub-indicators are further analyzed to calculate the level of SD for facilities and the state of transport development within the study area, and finally, the results of the tripartite coupling level are derived, which are analyzed and summarized in terms of the extent to which the facilities match the demand, the extent to which the development is coordinated, and whether they are highly correlated or not.

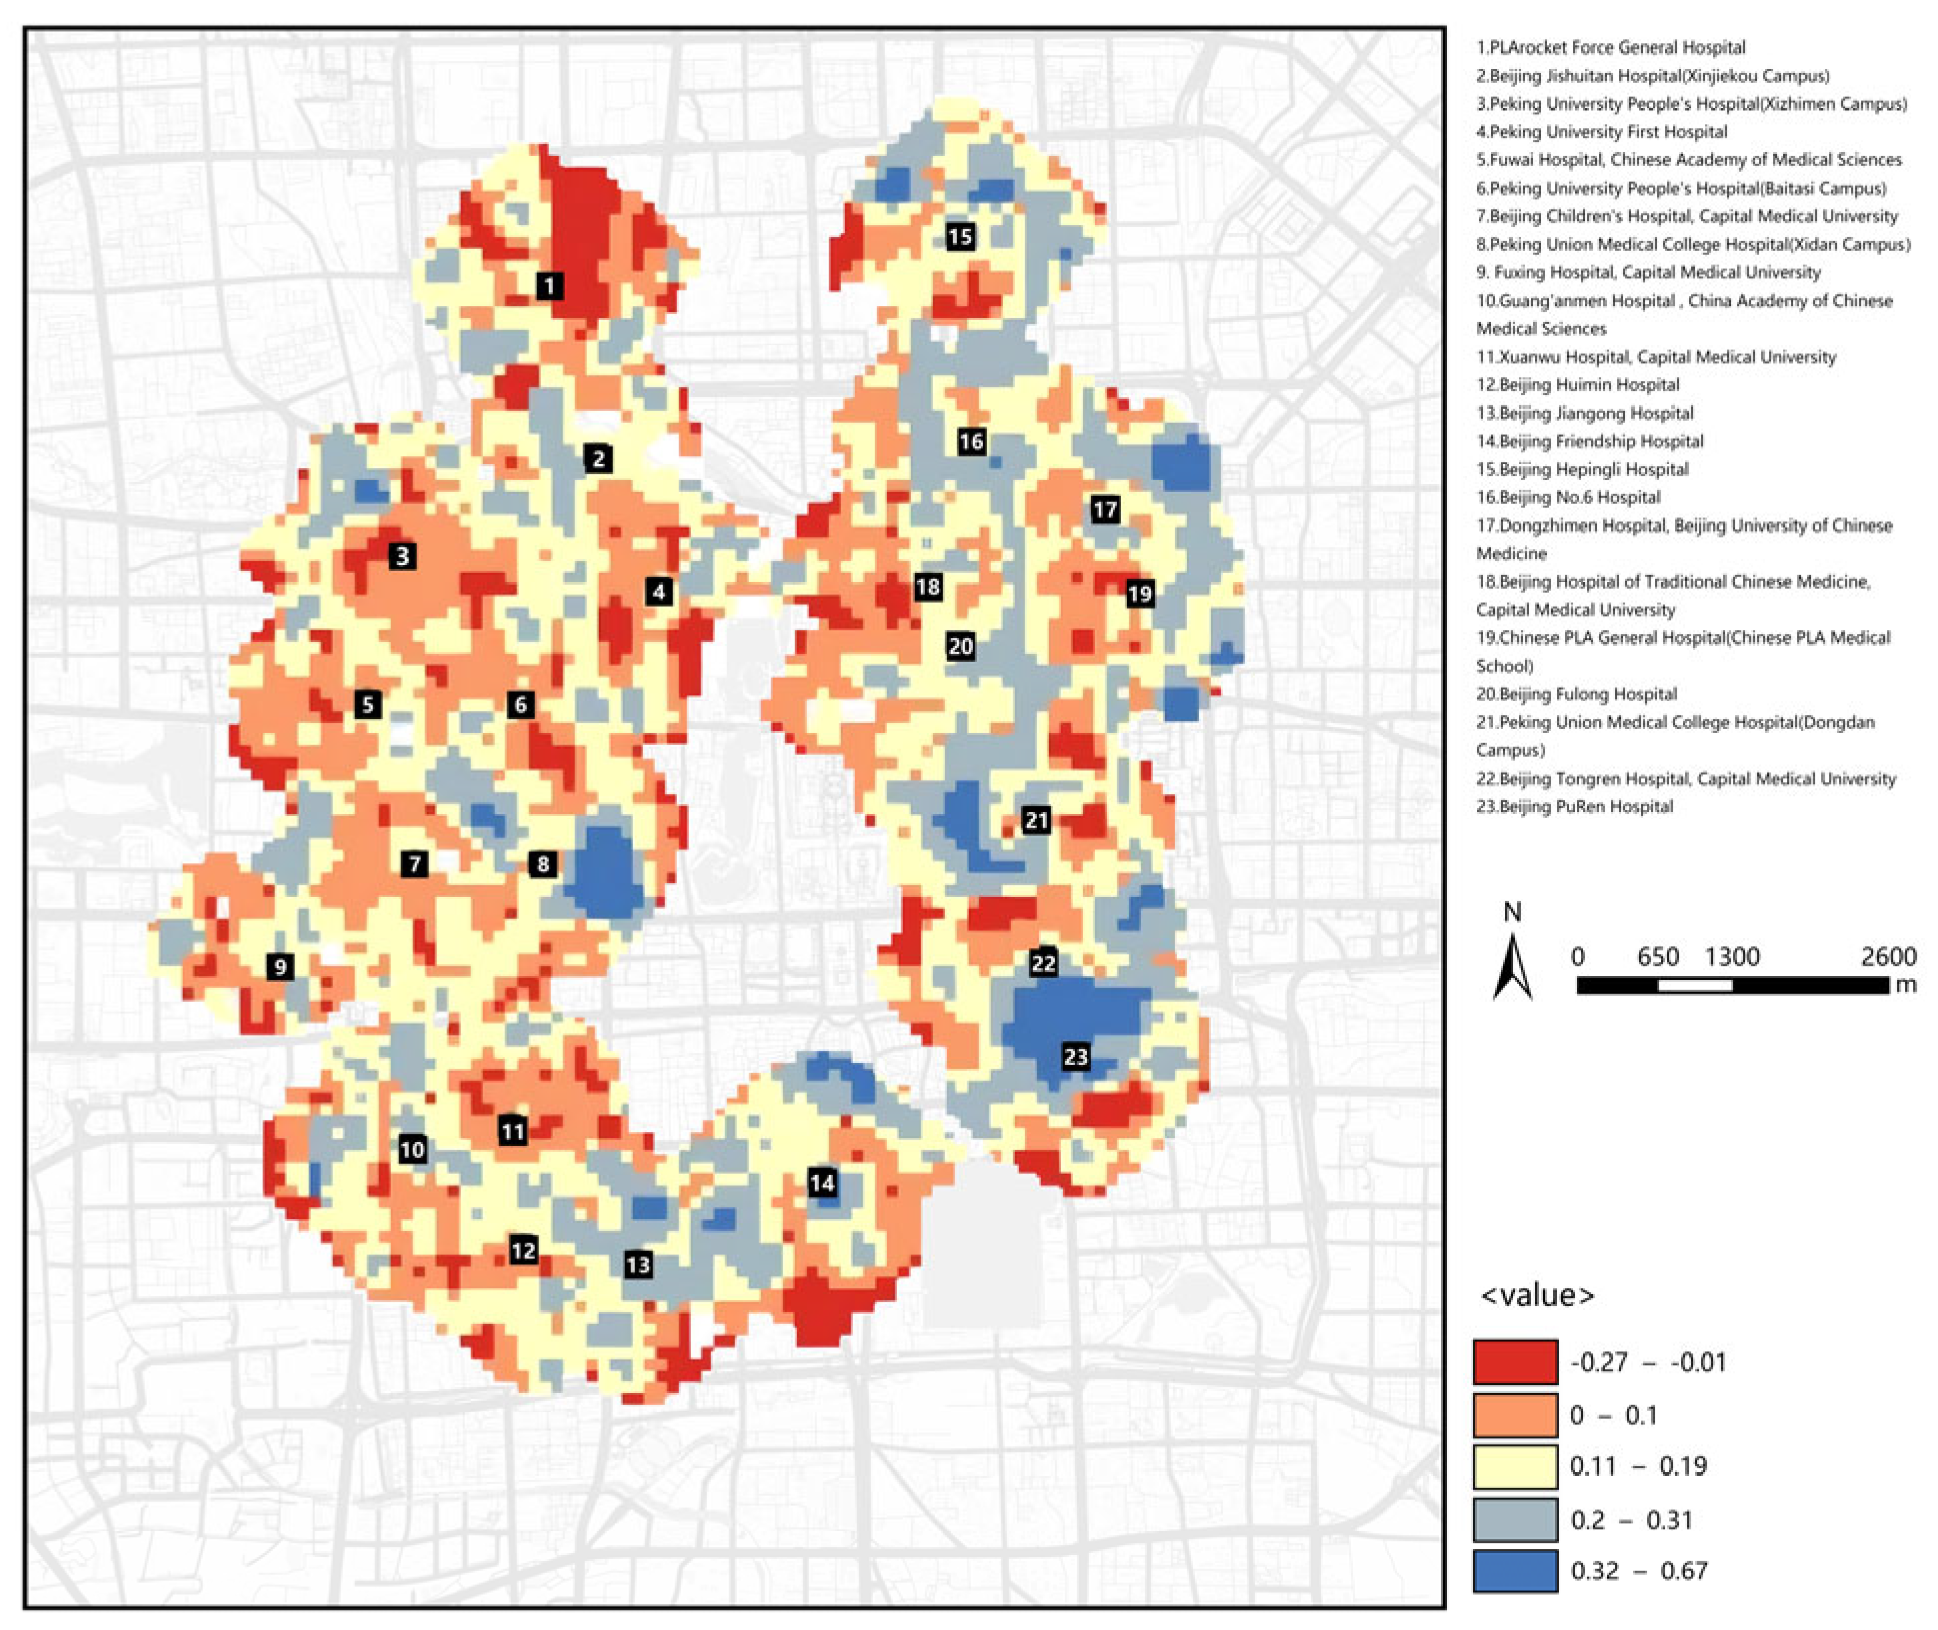
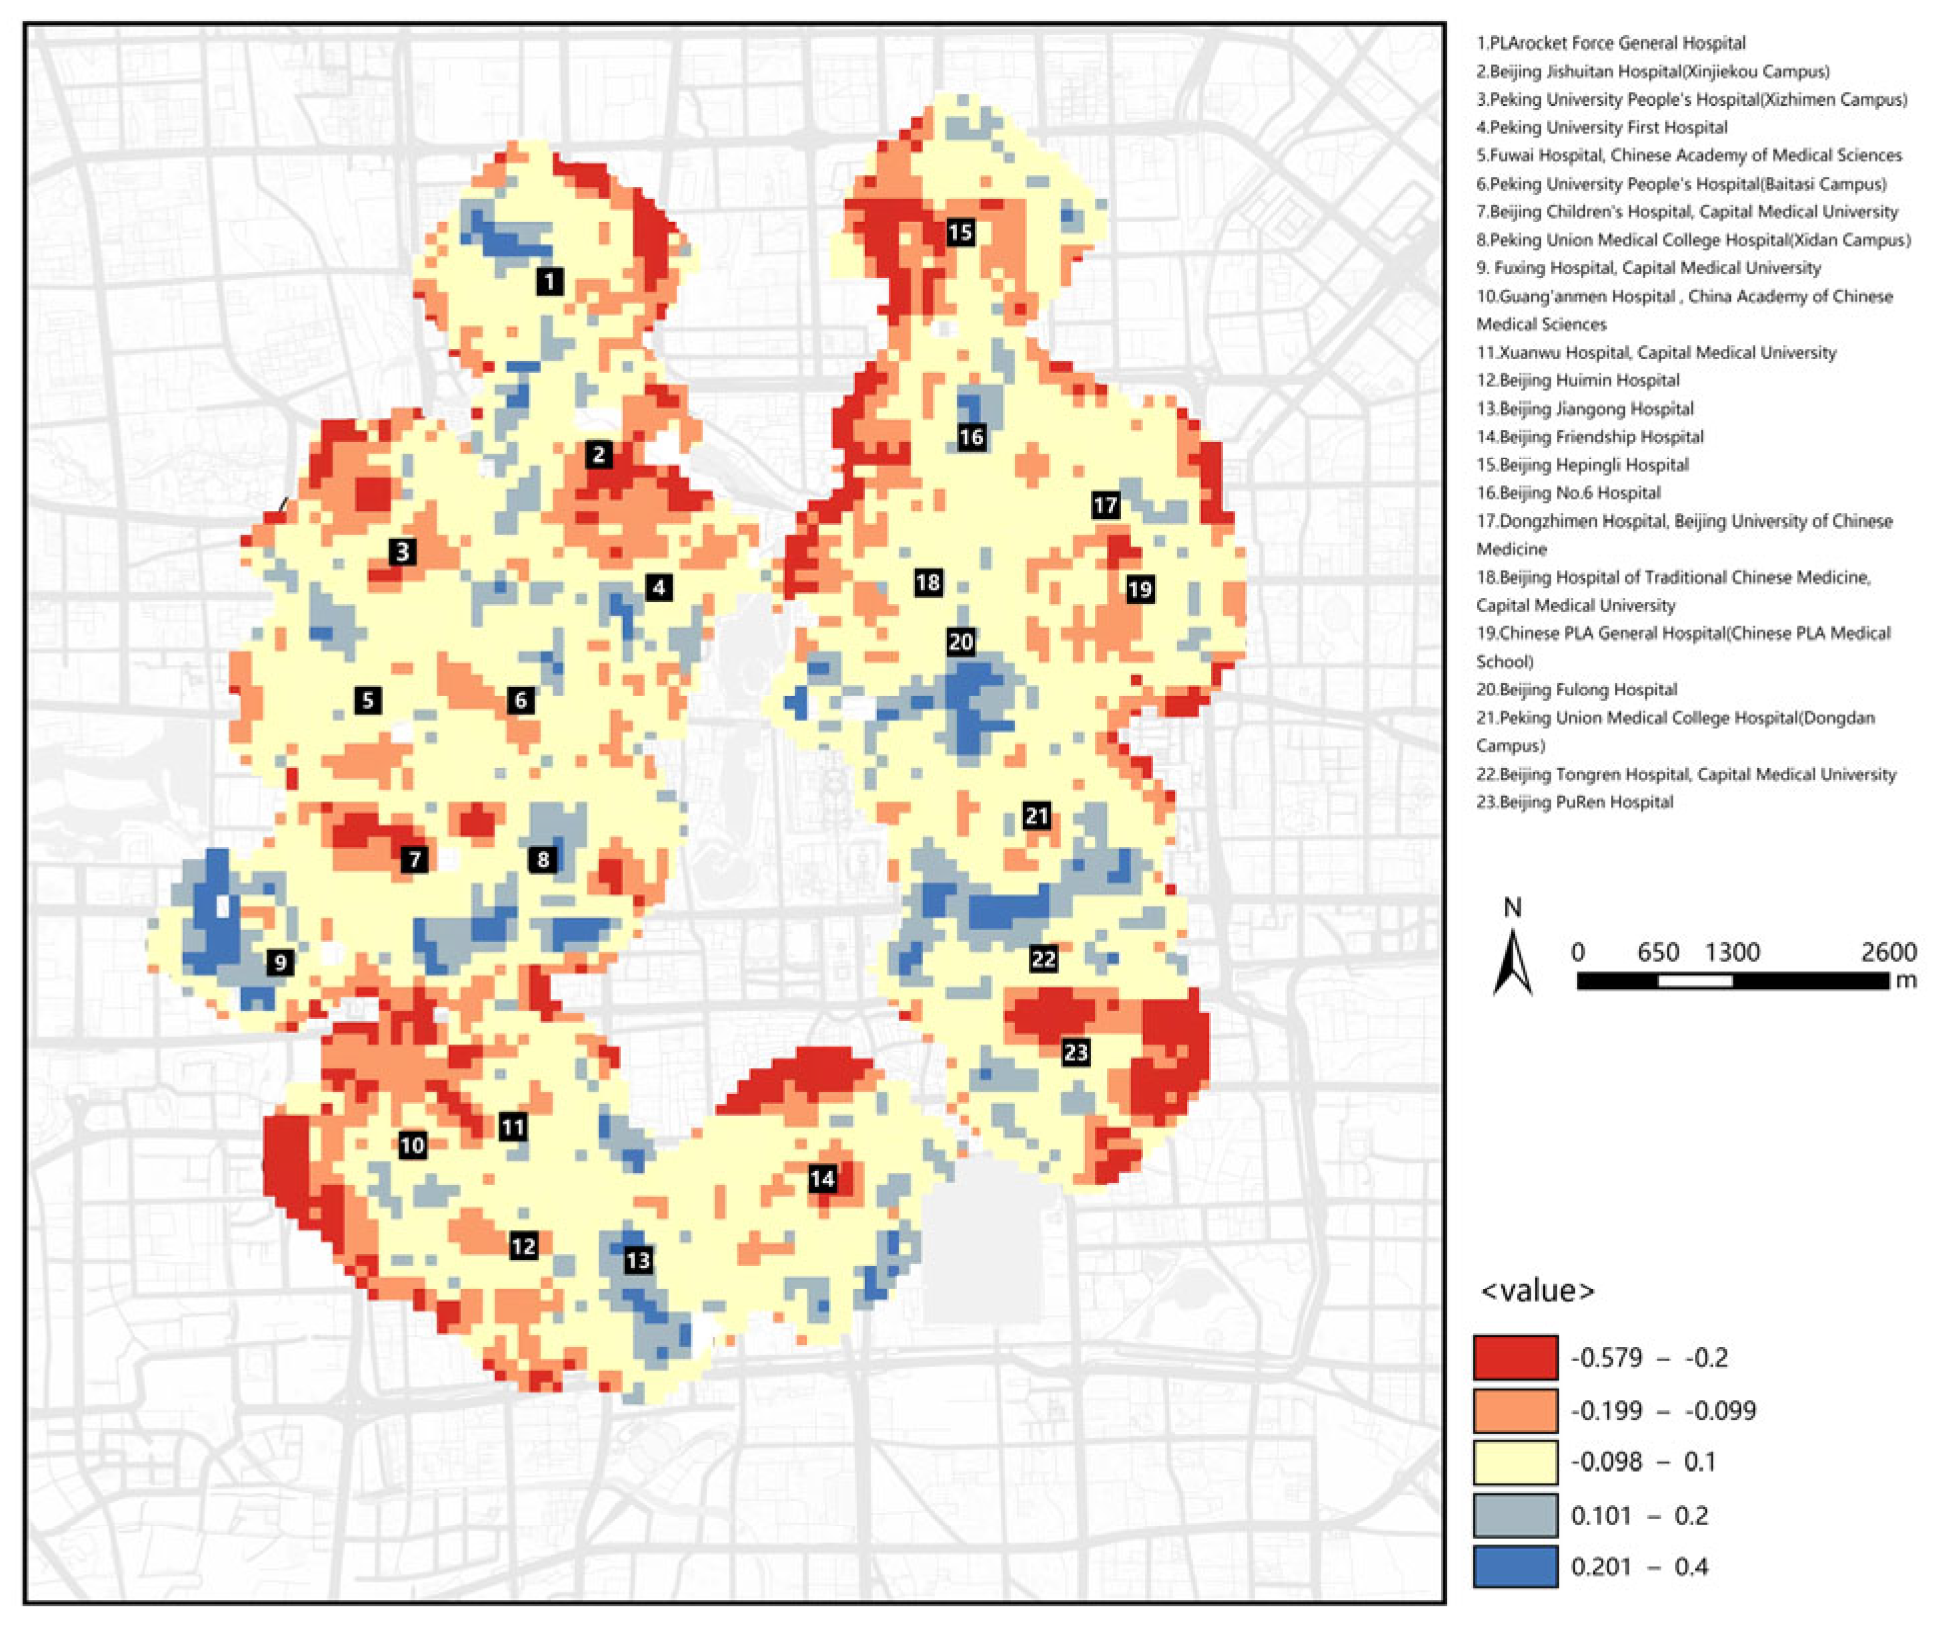
4.1. Supply and Demand Matching Analysis

The matching relationship between SD is to compare the evaluation results of the supply structure system and the evaluation results of the demand structure system. If the supply level is greater than the demand level, it is a demand lag type; if the demand level is greater than the supply level, it is a supply lag type. The results in the study area are as follows (Figure 7): the red area is the supply lagging area, the blue area is the demand lagging area, and the middle color is the transition. The match between SD in Xicheng District is weaker than that in Dongcheng District, and the difference between supply and demand is the largest in the range between 0 and 0.2. The supply level of facilities around the Rocket Military Hospital, the People’s Hospital Xizhimen Hospital, and Xuanwu Hospital needs to be improved, and the supply level of facilities around the hospitals in Dongcheng District is better, among which the supply level of facilities around Beijing Hospital is better. The supply level of facilities around hospitals in Dongcheng District is better, with the situation around Beijing Hospital, Beijing Hospital of Traditional Chinese Medicine, and Beijing General Hospital of the Beijing Military Command being average, and the demand of the crowd being higher.
The difference between the level of facility supply and the level of population demand is between [−1, 1] and the precision is three decimals, and 0.1 is selected as the tolerance for matching SD for the specific division of the level of SD for each hospital, i.e., when the difference is within ±0.1, the SD are matched, the difference is greater than 0.01 for the supply overshooting, and the difference is less than −0.1 for the supply lagging. The characteristics of regional SD levels for each hospital are shown in Table 8. Among them, 11 hospitals have matching SD results, 2 hospitals have lagging supply, and 11 hospitals have over-supply. The overall relationship between the SD of public service facilities in the study area is relatively coordinated, with People’s Hospital Xizhimen Campus and Xuanwu Hospital having a slightly missing supply, and Guang’anmen Hospital, Youyi Hospital, and Puren Hospital having the best level of supply of facilities in the vicinity, which is higher than the demand of more than 0.2, and the subsequent need to be carried out in accordance with the actual situation of the facilities and business adjustment.

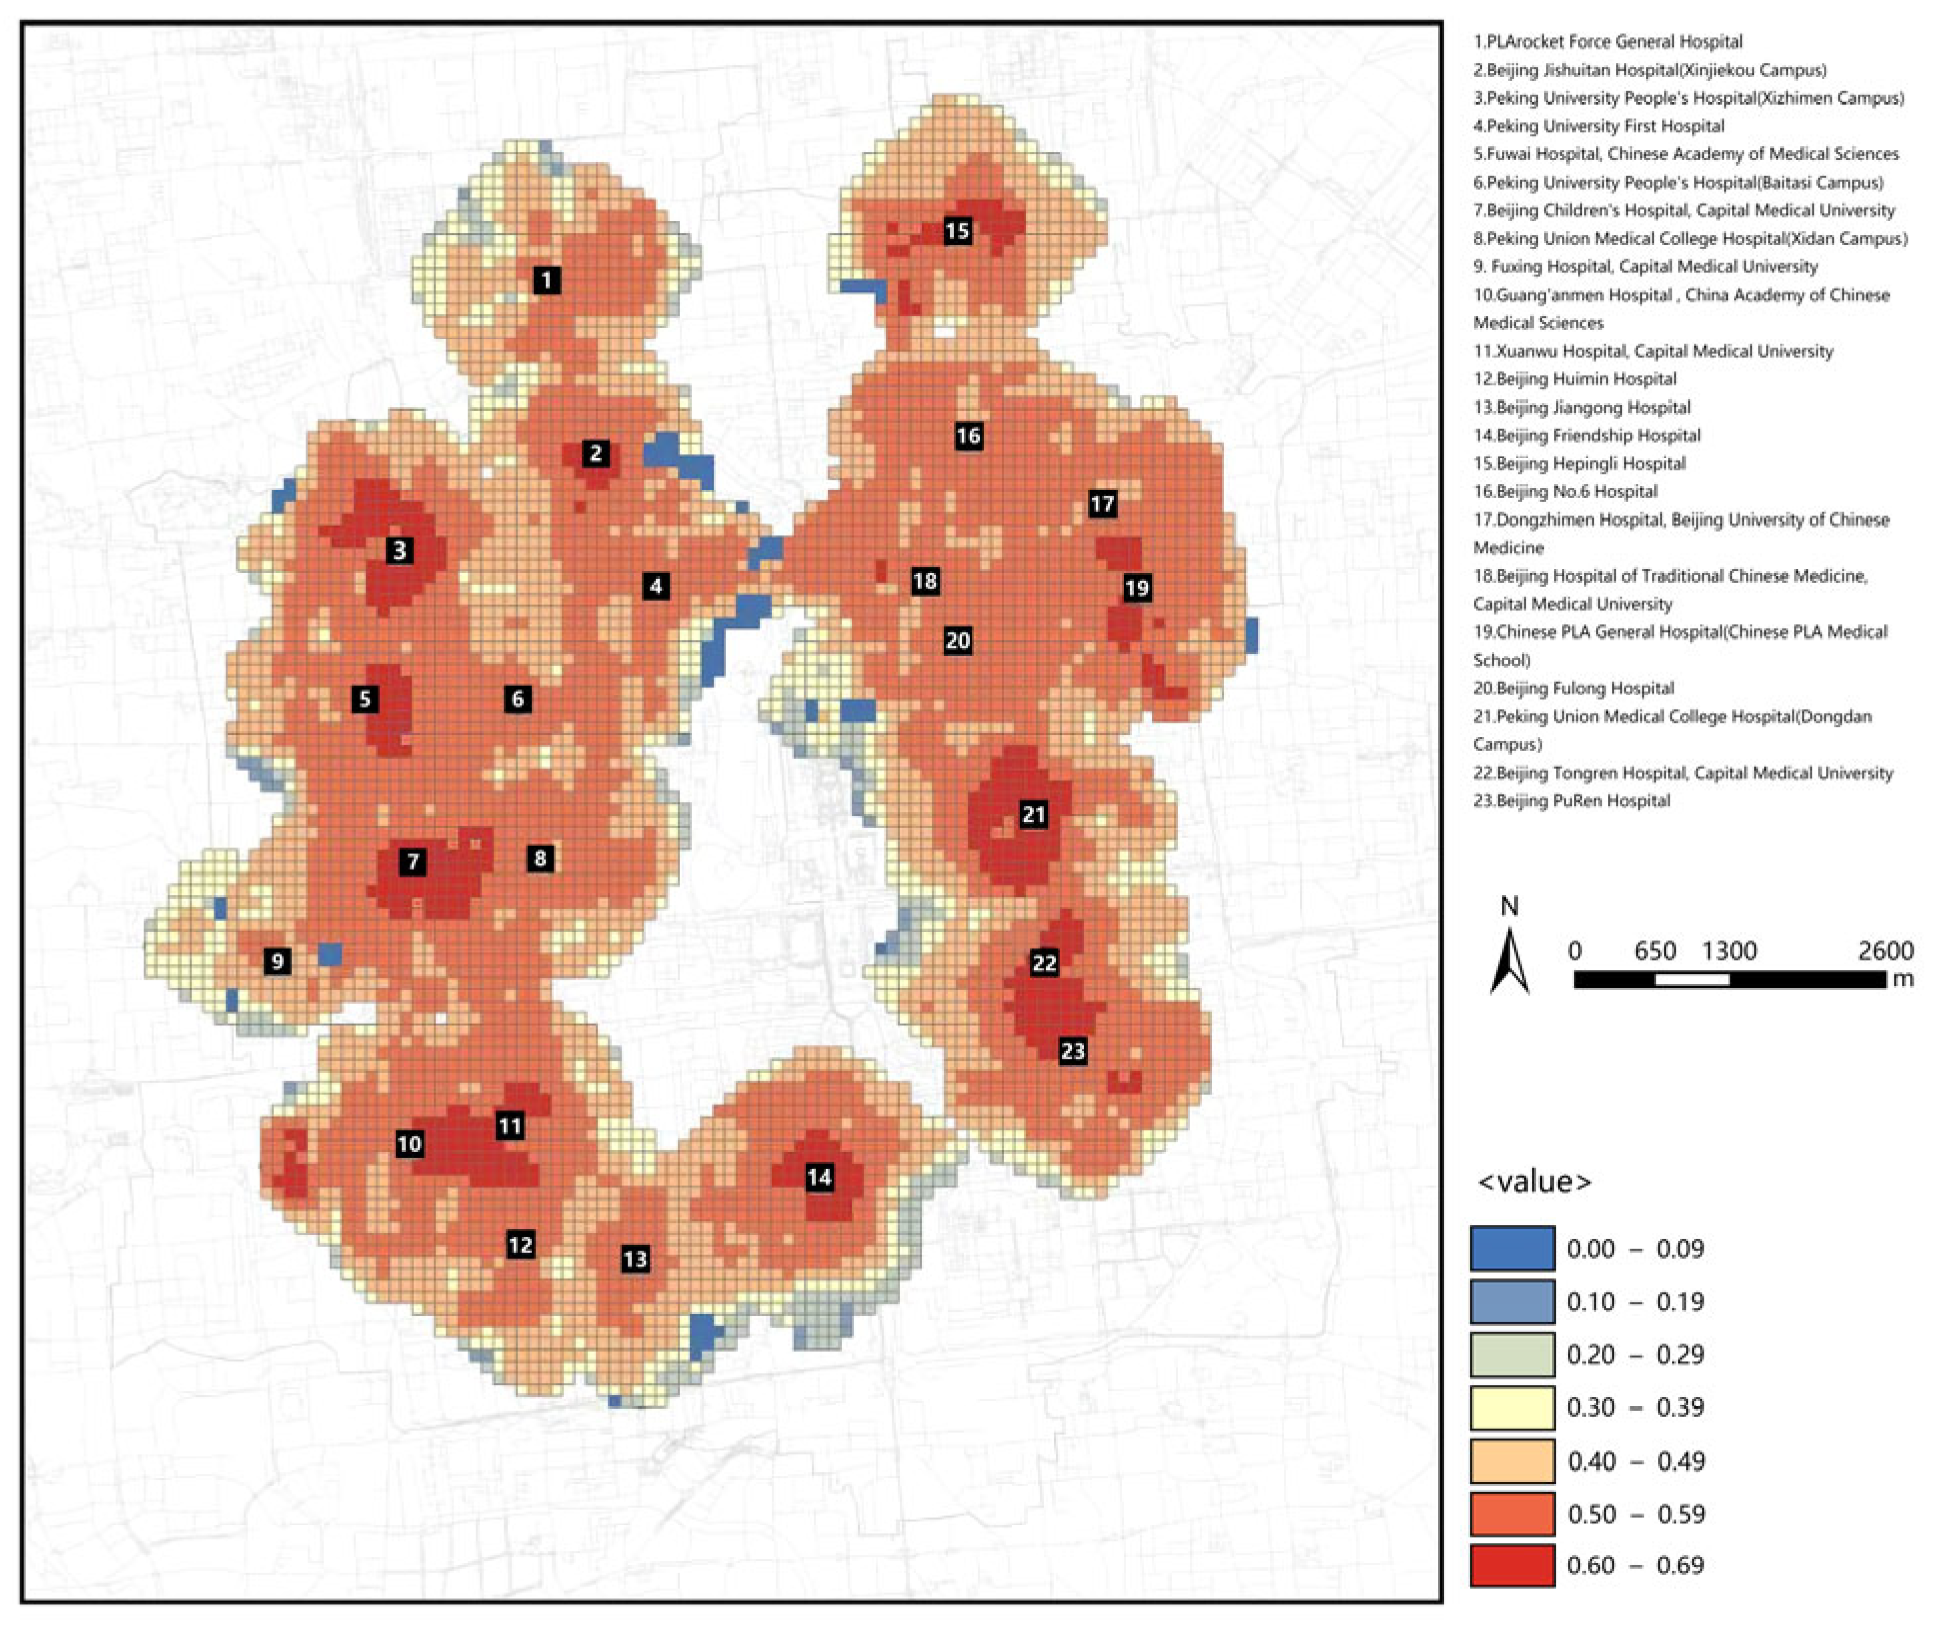
4.2. Transport Development Matching Analysis

Transport development matching analysis is to compare the results of the effectiveness of transport ties with the average level of SD. When the difference is within ±0.1 for the matching of transport development, the difference is greater than 0.01 for the transport development ahead, and the difference is less than −0.1 for the backward type of transport development area. The results of the analysis are shown below (Figure 8). The overall development of transportation within the core area of Beijing is relatively better, for the road transport and public transportation around the business district is well developed, the regional transportation centered on hospitals can roughly meet the SD relationship, and the transportation capacity around Hepingli Hospital, Huimin Hospital, Jishuitan Hospital, and the Children’s Hospital is a little bit weaker.
The summary of the results of the coordinated development of each hospital transport shows (see Table 9) that 11 hospitals around the regional transport development are synchronous, 7 hospitals around the transport development are lagging behind, and 6 hospitals around the transport are ahead of the Children’s Hospital and Youyi Hospital around the level of transport development, and there is a big difference in SD; presumably the Children’s Hospital is close to the fast arterial roads, although the road accessibility is good, but the surrounding parking situation and public transport are weak. It is assumed that the Children’s Hospital is adjacent to the fast arterial road, although the road accessibility is better, but the parking situation and public transport are weaker in the surrounding area, and the demand level of the crowd is higher, so the transport development is lagging behind, and the surrounding area is often congested.

4.3. Coupling Level Results Analysis

The coupling degree of the SD system is used to reveal the interaction between the supply structure system and the demand structure system, with 0 indicating that the system and its internal elements are hindering each other and 1 indicating that the system and its internal elements are facilitating each other. The higher the coupling degree, the closer the connection between the systems. From the distribution characteristics (Figure 9), the closer to the hospital, the better the coupling results, so it shows that the LCH for its radiant influence is within the scope of a certain degree of aggregation effect, and in the process of urban development, the arrangement of service facilities and transport facilities has taken into account the hospital function of aggregation of the distribution, the overall direction of the development of the same, and mutually reinforcing. The demand–supply–transport tripartite coupling level within 5–10 min of the area around the hospital is generally above 0.5. The strong correlation but poor synergy effect of each subsystem element indicates that the layout of facilities and traffic configuration in the study area is not yet significantly influenced by the traction of medical institutions. In the old city, the infrastructure has been improved, but the adaptability of the system for the medical cluster has not yet been fully revealed. Especially during the hospital-concentrated hours of medical treatment, the response of the urban space to the pressure of pedestrian flow is delayed, and the carrying capacity tends to be saturated.
Comprehensive evaluation of the coupling level of each hospital (Table 10), the results of the SDCCD to the study object in which there are 9 hospitals surrounded by the region of primary coordination, 14 hospitals surrounded by the SD coupling is barely coordinated, and there is a place on the verge of dysfunction. Analyzed from the perspective of coupling degree, the coupling degree of Xidan Campus of Xiehe Hospital, Fuxing Hospital, Beijing Jiangong Hospital, Beijing Sixth Hospital, Beijing Dongzhimen Hospital, Beijing Hospital of Traditional Chinese Medicine, Beijing Longfu Hospital, Beijing Hospital, and Puren Hospital is on the low side, and the tightness of connection between the facilities around these hospitals and the demand of the population is general, and the promotional effect of each other is not very obvious, which indicates that there is a lack of targeted facilities or a relatively weak demand around the hospitals. demand is relatively weak; from the analysis of the coordination index, the results of People’s Hospital Xizhimen Campus, Children’s Hospital, Xuanwu Hospital, Youyi Hospital, Union Hospital Dongdan Campus, and Puren Hospital are better among the research subjects, indicating that the three aspects of demand, supply, and ties contribute to the overall level of facility services to a higher degree, which suggests that the presence of the hospital has a greater impact on the results of the surrounding facilities SD; from the perspective of the coupling degree of coordination, the various hospital area facilities SDCCD is not high, at a medium level, reflecting the fact that in the three systems of demand–facilities–transportation, the factors affecting the degree of coupling of the three have other elements in addition to the hospital, which is more complex.

5. Conclusions

In this study, the SDCCD indicator system containing 15 tertiary indicators was constructed and assigned different weights. The spatial data within a 15-min walking distance around the tertiary LCH in the functional core area of Beijing was acquired and processed through Baidu Maps, ArcGIS, SPSS, and Python. Based on the tertiary indicators, the values of the sustainable development coupling and coordination model were calculated, and a comprehensive evaluation was carried out from the perspectives of the supply of public service facilities, the demand of the population and transport links, and the analysis of the results in terms of the degree of matching of SD, transport development, and the level of coupling. The final result is an evaluation of the regional SD that takes all factors into account.
The results of the study show that crowd demand is mainly influenced by population density and healthcare demand; the distribution of facility supply is consistent with the results of facility density and satisfaction; and the transport level analysis shows that accessibility and metro stations are the main influencing factors. Micro analysis shows that tertiary LCH have a significant impact on traffic and facility distribution in urban areas, and the closer the distance, the greater the impact. The study of 24 hospitals confirms the clustering effect of hospitals on resource distribution. To improve the service quality around large general hospitals, the following are recommended: (1) increasing the density of public transport routes and stops; (2) increasing the number of commercial service facilities in areas with high medical needs; and (3) the government must introduce policies to encourage the optimization of the traffic layout around hospitals.
The SCCD model proposed in this paper can provide quantitative support for the spatial reconfiguration of healthcare in Beijing. Real-time monitoring of service gaps is achieved by incorporating SCCD indicators into the urban experience assessment system and constructing a multi-source data platform. The results of the study can provide a basis for decision-making by multiple parties: the government can optimize the layout of healthcare resources, hospitals can improve the surrounding service facilities, and residents can understand the convenience of the surrounding services. Subsequent studies can track cross-district healthcare behaviors through online data and construct a spatio-temporal evolution model of the SCCD to provide a scientific basis for Beijing’s long-term development. However, the study has some limitations, with a strong reliance on data, analyses from an SD perspective only, and failure to account for time dynamics. Hospitals in Beijing’s functional core area may be affected by complex factors such as policy planning, and their mechanism of action is difficult to quantify. Future research should expand the perspective, optimize the data and methodology, and enhance the generality and applicability of the cases.

Author Contributions

Conceptualization, X.W.; methodology, B.J.D.; formal analysis, X.W. and Y.X.; investigation, T.F. and Y.X.; resources, X.W.; data curation, T.F.; writing—original draft preparation, X.W.; writing—review and editing, B.J.D.; visualization, A.Z.; project administration, H.W. All authors have read and agreed to the published version of the manuscript.

Funding

This research received no external funding.

Data Availability Statement

The original contributions presented in the study are included in the article Materials, further inquiries can be directed to the corresponding author.

Acknowledgments

Special thanks to Yang Shurui for his special contributions to the manuscript

Conflicts of Interest

Authors Tingting Fang, Yingjie Xu, Hai Wang and Andi Zheng were employed by China IPPR International Engineering Co., Ltd. The remaining authors declare that the research was conducted in the absence of any commercial or financial relationships that could be construed as a potential conflict of interest.

References

  1. Zabala, F.J.; Zapata, V.Y.; Martina, M.A.; Gonzalez, A.M.; Eugenia, M.; Vargas, V.J. Urban Agriculture: As A Transformation Strategy For Social Construction And Improvement Of The Quality Of Life In Vulnerable Communities In The Urban Area. WSEAS Trans. Environ. Dev. 2018, 14, 674–687. [Google Scholar]
  2. Kormina, A.A. Combined effects of the living environment on the well-being of the city population. Urban Constr. Archit. 2021, 11, 128–137. [Google Scholar] [CrossRef]
  3. Wenqiang, W. People’s Survival and Development in the Urban Public Construction—From the Perspective of the Relationship Between Human Development and Economic Development. Reform. Strategy 2013. [Google Scholar]
  4. Sun, C.; Chen, L.; Tian, Y.J.E.I. Study on the urban state carrying capacity for unbalanced sustainable development regions: Evidence from the Yangtze River Economic Belt. Ecol. Indic. Integr. Monit. Assess. Manag. 2018, 89, 150–158. [Google Scholar] [CrossRef]
  5. Xiong, G.; Cao, X.; Hamm, N.A.S.; Lin, T.; Zhang, G.; Chen, B.J.S. Unbalanced Development Characteristics and Driving Mechanisms of Regional Urban Spatial form: A Case Study of Jiangsu Province, China. Sustainability 2021, 13, 3121. [Google Scholar] [CrossRef]
  6. Carmon, N.; Fainstein, S.S. Introduction: Policy, Planning, and People. In Policy, Planning, and People (Promoting Justice in Urban Development); University of Pennsylvania Press: Philadelphia, PA, USA, 2013; pp. 1–10. [Google Scholar]
  7. Qiao, Z.; Xu, X.; Wu, F.; Luo, W.; Wang, F.; Liu, L.; Sun, Z. Urban ventilation network model: A case study of the core zone of capital function in Beijing metropolitan area. J. Clean. Prod. 2017, 168, 526–535. [Google Scholar] [CrossRef]
  8. Zhao, L.; Tang, X.; Xing, X.; Cai, C. Big Data Analysis of Park and Green Space Serviceability for Elderly Population-Case Study of Core Area of Beijing. Sens. Mater. Int. J. Sens. Technol. 2022, 34, 4369–4380. [Google Scholar] [CrossRef]
  9. Zhang, H.; Tang, H.; Zhang, A. Study on the Characteristics and Formation Mechanism of Residential Space Division in the Core Area of Capital Functions of Beijing. Urban Dev. Stud. 2019, 26, 98–106. [Google Scholar]
  10. Wei, G. Research on international medical service model of large comprehensive Class A tertiary hospitals. Chin. J. Med. Educ. Res. 2018, 17, 321–324. [Google Scholar] [CrossRef]
  11. Gupta, D.; Potthoff, S.J.J.F.; Information, T.i.T.; Management, O. Matching Supply and Demand for Hospital Services. Found. Trends Technol. Inf. Oper. Manag. 2016, 8, 131–274. [Google Scholar] [CrossRef]
  12. Zhang, J.; Tan, P.Y. Assessment of spatial equity of urban park distribution from the perspective of supply-demand interactions. Urban For. Urban Green. 2023, 80, 127827. [Google Scholar] [CrossRef]
  13. McLeod, S. Maslow’s hierarchy of needs. SimplyPsychology 2007, 1, 1–18. [Google Scholar]
  14. Simons, J.A.; Irwin, D.B.; Drinnien, B.A. Maslow’s hierarchy of needs. Salenger Inc. 1987, 9, 222. [Google Scholar]
  15. Tian-Yi, Z.; Management, S.O. Analyses on supply side in the field of medical health care helped by healthy big data. Chin. J. Urban Rural Enterp. Hyg. 2017. [Google Scholar]
  16. Samat, N.; Shattar, A.K.A. Spatial Accessibility of Colorectal Cancer Patients to Health Care Facilities in Kelantan State: A Study on Medical Geography. World Appl. Sci. J. 2014, 31, 1772–1782. [Google Scholar]
  17. Jin, M.; Liu, L.; Tong, D.; Gong, Y.; Liu, Y. Evaluating the Spatial Accessibility and Distribution Balance of Multi-Level Medical Service Facilities. Int. J. Environ. Res. Public Health 2019, 16, 1150. [Google Scholar] [CrossRef]
  18. Cho, C.J. An equity-efficiency trade-off model for the optimum location of medical care facilities. Socio-Econ. Plan. Sci. 1998, 32, 99–112. [Google Scholar] [CrossRef]
  19. Lee, S.J.; Youn, K.H. A Study on the Convergence of Spatial Equity of Medical Welfare Facilities for Older Persons and Services. J. Internet Things Converg. 2020, 6, 65–72. [Google Scholar]
  20. Rong, P.; Zheng, Z.; Kwan, M.P.; Qin, Y. Evaluation of the spatial equity of medical facilities based on improved potential model and map service API: A case study in Zhengzhou, China. Appl. Geogr. 2020, 119, 102192. [Google Scholar] [CrossRef]
  21. Ni, J.H.; Qian, T.L.; Xi, C.B.; Rui, Y.K.; Wang, J.C. Spatial Distribution Characteristics of Healthcare Facilities in Nanjing: Network Point Pattern Analysis and Correlation Analysis. Int. J. Environ. Res. Public Health 2016, 13, 833. [Google Scholar] [CrossRef]
  22. Shan, X.; Xu, J.; Du, Y.; Wang, R.; Deng, H. Spatial Distribution Characteristics and Optimization Strategies of Medical Facilities in Kunming Based on POI Data. In Proceedings of the The 10th International Conference on Computer Engineering and Networks, Xi′an, China, 16–18 October 2020; Springer: Singapore, 2021. [Google Scholar]
  23. Yin, C.; He, Q.; Liu, Y.; Chen, W.; Gao, Y. Inequality of public health and its role in spatial accessibility to medical facilities in China. Appl. Geogr. 2018, 92, 50–62. [Google Scholar] [CrossRef]
  24. Qiqi, H.; Kaitai, Y.A. Spatial Distribution Characteristics and Coverage Rate of Commercial Facilities in 15-minute Radius Livelihood Service Circles of Chunshu Street. J. Landsc. Res. 2024, 16, 17–21. [Google Scholar]
  25. Wang, Y.; Wu, C. Research on the spatial distribution and accessibility of medical institutions in Wuhan based on GIS. IOP Conf. Ser. Earth Environ. Sci. 2021, 825, 012028. [Google Scholar] [CrossRef]
  26. Xu, X.; Hu, J.; Lv, L.; Yin, J.; Tian, X. Research on the Matching Relationship between the Supply of Urban Ecological Recreational Space and the Demand of Residents-A Case Study of an Urban Development Area in Wuhan. Int. J. Environ. Res. Public Health 2022, 19, 816. [Google Scholar] [CrossRef] [PubMed]
  27. Song, L.; Kong, X.; Cheng, P. Supply-demand matching assessment of the public service facilities in 15-minute community life circle based on residents’ behaviors. Cities 2024, 144, 1.1–1.15. [Google Scholar] [CrossRef]
  28. Zhan, D.S.; Zhang, W.Z.; Yu, J.H.; Dang, Y.X.; Li, X.Y. Application of questionnaire survey method in human geography studies in China. Acta Geogr. 2016, 71, 899–913. [Google Scholar]
  29. Royo, E.; Li, Y.; Komatsu, T. Factors influencing common space use among the elderly in chinese urban residential areas: Based on the results of a questionnaire survey conducted in three communities in zhengzhou city. J. Archit. Plan. (Trans. AIJ) 2023, 88, 424–435. [Google Scholar] [CrossRef]
  30. Formica, S.; Uysal, M. Destination Attractiveness Based on Supply and Demand Evaluations: An Analytical Framework. J. Travel Res. 2006, 44, 418–430. [Google Scholar] [CrossRef]
  31. Fang, Z. Optimization of Medical Service Facilities Allocation in Small Towns of Wuhan City from the Perspective of Supply and Demand. Master’s Thesis, Huazhong University of Science and Technology: Wuhan, China, 2017. [Google Scholar]
  32. Medical Xpress. Just Half of Acute Hospital Trusts in England Have Chaperone Policy. Available online: https://medicalxpress.com/news/2010-08-hospital-england-chaperon-policy.html (accessed on 6 April 2025).
  33. Kwon, S.; Joo, S. A Study on the proportion of functional Areas in the ward of General Hospitals. J. Korea Inst. Healthc. Archit. 2011, 17, 49–55. [Google Scholar] [CrossRef]
  34. How the ‘15-Minute City’ Could Help Post-Pandemic Recovery. Available online: https://www.tbsnews.net/world/global-economy/how-15-minute-city-could-help-post-pandemic-recovery-108403 (accessed on 15 July 2020).
  35. Xiao, Z.; Chai, Y.; Zhang, Y. Overseas Life Circle Planning And Practice. Planners 2014, 30, 89–95. [Google Scholar]
  36. Shanghai Urban Planning and Land Resources Administration Bureau. Land Resources Administration Bureau: Shanghai, C. Planning Guidance of 15-Minute Community-Life Circle; Shanghai Urban Planning and Land Resources Administration Bureau: Shanghai, China, 2016. [Google Scholar]
  37. Fan, L.H.; Lin, X.Q.; Wang, D. Spatial-temporal succession characteristics of public service facilities supply and demand coordinated development in beijing: A case study of educational and medical facilities. Hum. Geogr. 2015, 30, 90–97. [Google Scholar]
  38. Zhang, L.; Zhang, M.; Yuan, M.; Guo, Y. A Study on the Regional Evolution of the Hefei Political and Cultural New District Skyline Based on Exploratory Factor Analysis and Semantic Segmentation. Buildings 2024, 14, 1238. [Google Scholar] [CrossRef]
  39. Yu, Z.; Zhou, Y.; Wang, H. Walking Environment Satisfaction in an Historic Block Based on POE and Machine Learning: A Case Study of Tianjin Five Avenues. Buildings 2024, 14, 3047. [Google Scholar] [CrossRef]
  40. Kerez, C. Christian Kerez, Beijing Central Business District Core Area, Culture Center. In International 2015; A.D.A. Edita: Tokyo, Japan, 2015. [Google Scholar]
  41. Wu, H.; Wang, L.; Zhang, Z.; Gao, J. Analysis and optimization of 15-minute community life circle based on supply and demand matching: A case study of Shanghai. PLoS ONE 2021, 16, e0256904. [Google Scholar] [CrossRef]
  42. Yang, Y.; Qian, Y.; Zeng, J.; Wei, X.; Yang, M. Walkability measurement of 15-minute community life circle in Shanghai. Land 2023, 12, 153. [Google Scholar] [CrossRef]
  43. Mousakazemi, M.S. Urban sustainable development: Concepts and perspectives. Geogr. Res. 2001, 94–113. [Google Scholar]
  44. Jian-Sheng, L. The Influence of the Positioning of Beijing’s General Urban Planning on the Construction of a National Cultural Center. J. Beijing Union Univ. (Humanit. Soc. Sci.) 2015. [Google Scholar]
  45. Saaty, T.L. The Analytic Hierarchy Process. Appl. Stud. 2001, 1, 1073–1076. [Google Scholar]
  46. Jing, W.; Yaofeng, M.; Tourism, D.O.; Amp, S.V. The Comparative Study of Coupling Coordination Degree of Tourism Industry and Urbanization of the Eastern City and the Western City. Tour. Forum 2014. [Google Scholar]
Figure 1. Scope of research and hospital distribution.
Buildings 15 02188 g001
Figure 2. East and west sides of the town population raster data map.
Buildings 15 02188 g002
Figure 3. Results of the analysis of indicators at level A. (a) Population density; (b) Percentage of children and older persons data; (c) Demand for medical treatment; (d) Average consumption level.
Buildings 15 02188 g003
Figure 4. Results of the analysis of indicators at level B. (a) Diversity of forms; (b) Facility coverage; (c) Density of public service facilities. (d) Density of activity facilities in green squares; (e) Facility satisfaction.
Buildings 15 02188 g004aBuildings 15 02188 g004b
Figure 5. Results of the analysis of indicators at level C. (a) Road density; (b) Road accessibility; (c) Parking density; (d) Density of bus stops; (e) Density of metro stations.
Buildings 15 02188 g005aBuildings 15 02188 g005b
Figure 6. Calculated results for primary indicators. (a) Crowd demand push; (b) Facility space supply pull; (c) Transport link effectiveness.
Buildings 15 02188 g006
Figure 7. Analysis of supply and demand matching relationship.
Buildings 15 02188 g007
Figure 8. Transportation development matching analysis.
Buildings 15 02188 g008
Figure 9. Coupling level calculation results.
Buildings 15 02188 g009
Table 1. Indicators for the evaluation of SDCCD.
Primary IndicatorsSecondary IndicatorsTertiary Indicators
A Crowd demand pushA1 Population characteristicsA11 Population density
A12 Percentage of children and older persons data
A13 Demand for medical treatment
A2 Economic characteristicsA21 Level of per capita consumption
B Facility supply pullB1 Public service facilitiesB11 Diversity of business
B12 Facility service coverage
B13 Density of various facilities
B2 Activity facilitiesB21Activity space density
B22 Service coverage
B3 Service levelB31 Facility satisfaction
C Transport link effectivenessC1 Transport capacityC11 Road network density
C12 Road network accessibility
C2 Static transportC21 Parking density
C3 Transport facilitiesC31 Density of underground stations
C32 Density of bus stations
Table 2. Judgment matrix scale and its description.
ScaleDefinition Description
1Both indicators are of equal importance
3One factor is slightly more important than the other
5One factor is clearly more important than the other
7One factor is more strongly more important than the other
9One factor is extremely more important than the other
2, 4, 6, 8The middle value of the two adjacent judgments above
Table 3. Table of values for the average random consistency indicator.
n1234
RI000.520.89
Table 4. Indicator weights.
Primary
Indicators
WeightSecondary
Indicators
WeightTertiary
Indicators
Weight
A1A10.76A110.37
A120.16
A130.23
A20.24A210.24
B1B10.59B110.25
B120.23
B130.11
B20.20B210.10
B220.10
B30.21B310.21
C1C10.50C110.17
C120.33
C20.20C210.20
C30.30C310.22
C320.08
Table 5. Corresponding level of coupling coordination.
Degree of Coupling CoordinationLevel of CoordinationDegree of Coupling CoordinationLevel of Coordination
0.90–1.00quality coordination0.40–0.49on the verge of dissonance
0.80–0.89well-coordinated0.30–0.39mild disorder
0.70–0.79mid-level coordination0.20–0.29moderate disorder
0.60–0.69primary coordination0.10–0.19severe disorder
0.50–0.59sue for coordination0.00–0.09extreme disorder
Table 6. Name of hospital with corresponding serial number.
NumberHospital Name
1PLArocket Force General Hospital
2Beijing Jishuitan Hospital (Xinjiekou Campus)
3Peking University People’s Hospital (Xizhimen Campus)
4Peking University First Hospital
5Fuwai Hospital, Chinese Academy of Medical Sciences
6Peking University People’s Hospital (Baitasi Campus)
7Beijing Children’s Hospital, Capital Medical University
8Peking Union Medical College Hospital (Xidan Campus)
9Fuxing Hospital, Capital Medical University
10Guang’anmen Hospital, China Academy of Chinese Medical Sciences
11Xuanwu Hospital, Capital Medical University
12Beijing Huimin Hospital
13Beijing Jiangong Hospital
14Beijing Friendship Hospital
15Beijing Hepingli Hospital
16Beijing No.6 Hospital
17Dongzhimen Hospital, Beijing University of Chinese Medicine
18Beijing Hospital of Traditional Chinese Medicine, Capital Medical University
19Chinese PLA General Hospital (Chinese PLA Medical Shool)
20Beijing Fulong Hospital
21Peking Union Medical College Hospital (Dongdan Campus)
22Beijing Tongren Hospital, Capital Medical University
23Beijing PuRen Hospital
Table 7. Information on average daily attendance at the study hospitals.
HospitalAverage Number of Consultations per Day (Number)HospitalAverage Number of Consultations Everyday
(Number)
12600131377
212001410,000
310,000151030
44000161096
52711171600
6-183000
710,000194500
8120020800
917002111,000
104288225000
117600231000
121800
Table 8. Table of regional levels of supply and demand by hospital.
HospitalUsUdUcSD Level (Us − Ud)SD Characteristics
10.2650.1780.443−0.087supply and demand match
20.2650.3120.4540.047supply and demand match
30.4120.3050.528−0.107supply lagging
40.1790.2700.5000.091supply and demand match
50.2550.3060.6200.051supply and demand match
60.2110.2460.4400.035supply and demand match
70.4020.4130.5700.011supply and demand match
80.1360.2410.5000.105supply ahead
90.0950.2280.4960.133supply ahead
100.1810.4360.4960.255supply ahead
110.4160.2780.650−0.138supply lagging
120.2210.2890.4570.068supply and demand match
130.1010.3030.5310.201supply ahead
140.2230.6200.6120.397supply ahead
150.2140.3940.4120.180supply ahead
160.1190.2910.5210.172supply ahead
170.1440.3000.4680.156supply ahead
180.1780.2780.5540.100supply and demand match
190.3280.2880.503−0.040supply and demand match
200.1000.2880.5780.188supply ahead
210.2320.4500.6940.218supply ahead
220.2560.3450.5630.089supply and demand match
230.1350.5020.7000.367supply ahead
Table 9. Table on the coordinated development of transport in hospitals.
HospitalUsUdUcLevel of Coordinated Transport Development
[Us − (Ud + Uc)]
Degree of Transport Coordination
10.2650.1780.4430.000synchronous
20.2650.3120.454−0.123lagging
30.4120.3050.528−0.189lagging
40.1790.2700.5000.051synchronous
50.2550.3060.6200.059synchronous
60.2110.2460.440−0.017synchronous
70.4020.4130.570−0.245lagging
80.1360.2410.5000.123ahead
90.0950.2280.4960.173ahead
100.1810.4360.496−0.121lagging
110.4160.2780.650−0.044synchronous
120.2210.2890.457−0.053synchronous
130.1010.3030.5310.127ahead
140.2230.6200.612−0.231lagging
150.2140.3940.412−0.196lagging
160.1190.2910.5210.111ahead
170.1440.3000.4680.024synchronous
180.1780.2780.5540.098synchronous
190.3280.2880.503−0.113lagging
200.1000.2880.5780.190ahead
210.2320.4500.6940.012synchronous
220.2560.3450.563−0.038synchronous
230.1350.5020.700 0.063synchronous
Table 10. Comprehensive evaluation table of the coupling level of each hospital.
HospitalIndividual ScoreScores on IndicatorsOverall Evaluation
UsUdUcCTD
10.2650.1780.4430.9330.2950.525sue for coordination
20.2650.3120.4540.9740.3440.579sue for coordination
30.4120.3050.5280.9750.4150.636primary coordination
40.1790.2700.5000.9140.3160.538sue for coordination
50.2550.3060.6200.9260.3940.604primary coordination
60.2110.2460.4400.9490.2990.533sue for coordination
70.4020.4130.5700.9870.4620.675primary coordination
80.1360.2410.5000.8690.2920.504sue for coordination
90.0950.2280.4960.8080.2730.470on the verge of dissonance
100.1810.4360.4960.9150.3710.583sue for coordination
110.4160.2780.6500.9420.4480.650primary coordination
120.2210.2890.4570.9550.3220.555sue for coordination
130.1010.3030.5310.8140.3120.504sue for coordination
140.2230.6200.6120.9050.4850.663primary coordination
150.2140.3940.4120.9600.3400.571sue for coordination
160.1190.2910.5210.8450.3100.512sue for coordination
170.1440.3000.4680.8960.3040.522sue for coordination
180.1780.2780.5540.8960.3370.549sue for coordination
190.3280.2880.5030.9710.3730.602primary coordination
200.1000.2880.5780.7930.3220.505sue for coordination
210.2320.4500.6940.9090.4590.646primary coordination
220.2560.3450.5630.9480.3880.606primary coordination
230.1350.5020.7000.8120.4460.602primary coordination
Disclaimer/Publisher’s Note: The statements, opinions and data contained in all publications are solely those of the individual author(s) and contributor(s) and not of MDPI and/or the editor(s). MDPI and/or the editor(s) disclaim responsibility for any injury to people or property resulting from any ideas, methods, instructions or products referred to in the content.

