
The Spatial Relationship Characteristics and Differentiation Causes Between Traditional Villages and Intangible Cultural Heritage in China

Abstract
1. Introduction
1.1. Overview of Traditional Villages and Intangible Cultural Heritage in China
“various traditional cultural expressions (such as folk customs, performing arts, traditional knowledge and skills, along with related instruments, objects, and handicrafts) and cultural spaces that have been passed down through generations and are closely related to people’s lives.”
1.2. Symbiotic Relationship and Spatial Compatibility Challenges Between TVs and ICH
1.3. Current Research Progress and Limitations
1.4. Innovations of This Study
2. Materials and Methods
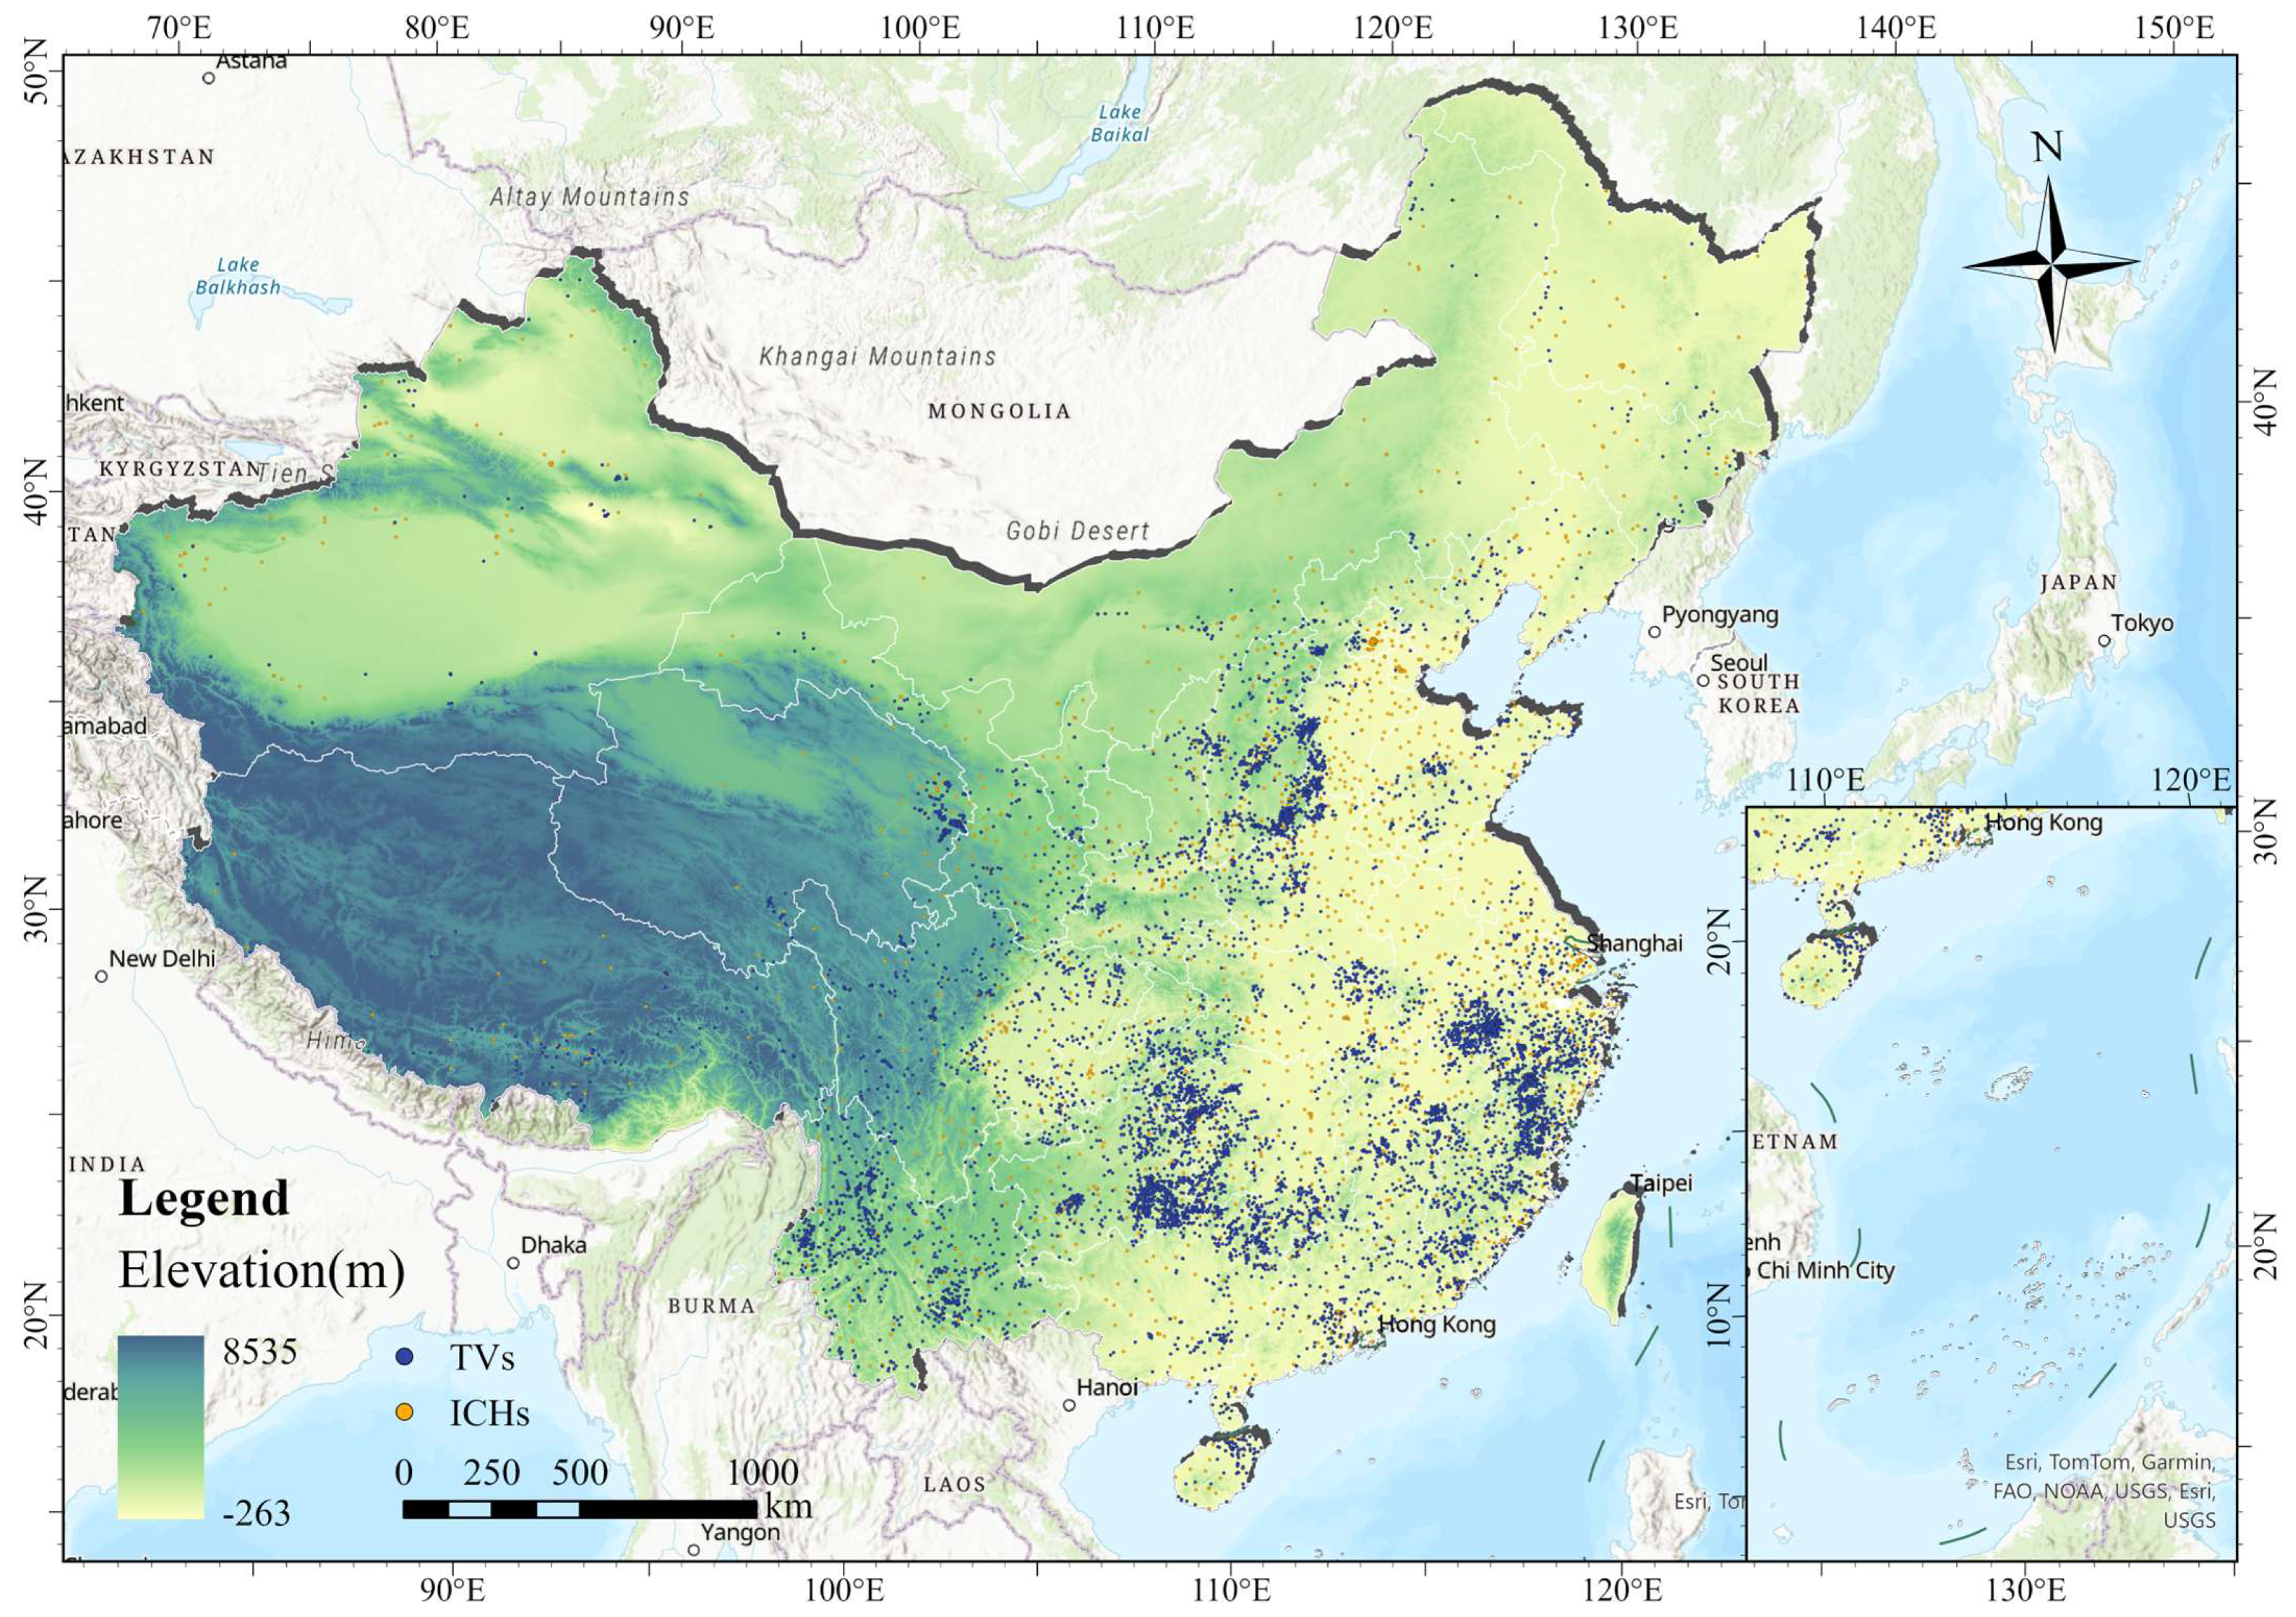
2.1. Study Area
2.2. Data Sources
2.3. Methods
2.3.1. Kernel Density Analysis
2.3.2. Geographic Concentration and Spatial Distribution Equilibrium Analysis
2.3.3. Spatial Quantity Relationship Model
2.3.4. Bivariate Spatial Autocorrelation Analysis
2.3.5. Gravity Center Model
2.3.6. Spatial Mismatch Index
2.3.7. Optimal-Parameter Geographic Detector
2.3.8. Multiscale Geographically Weighted Regression
2.4. Research Framework
3. Results
3.1. Analysis of the Spatial Layout of TVs and ICH
3.1.1. Spatial Characteristics of TVs
3.1.2. Spatial Characteristics of ICH
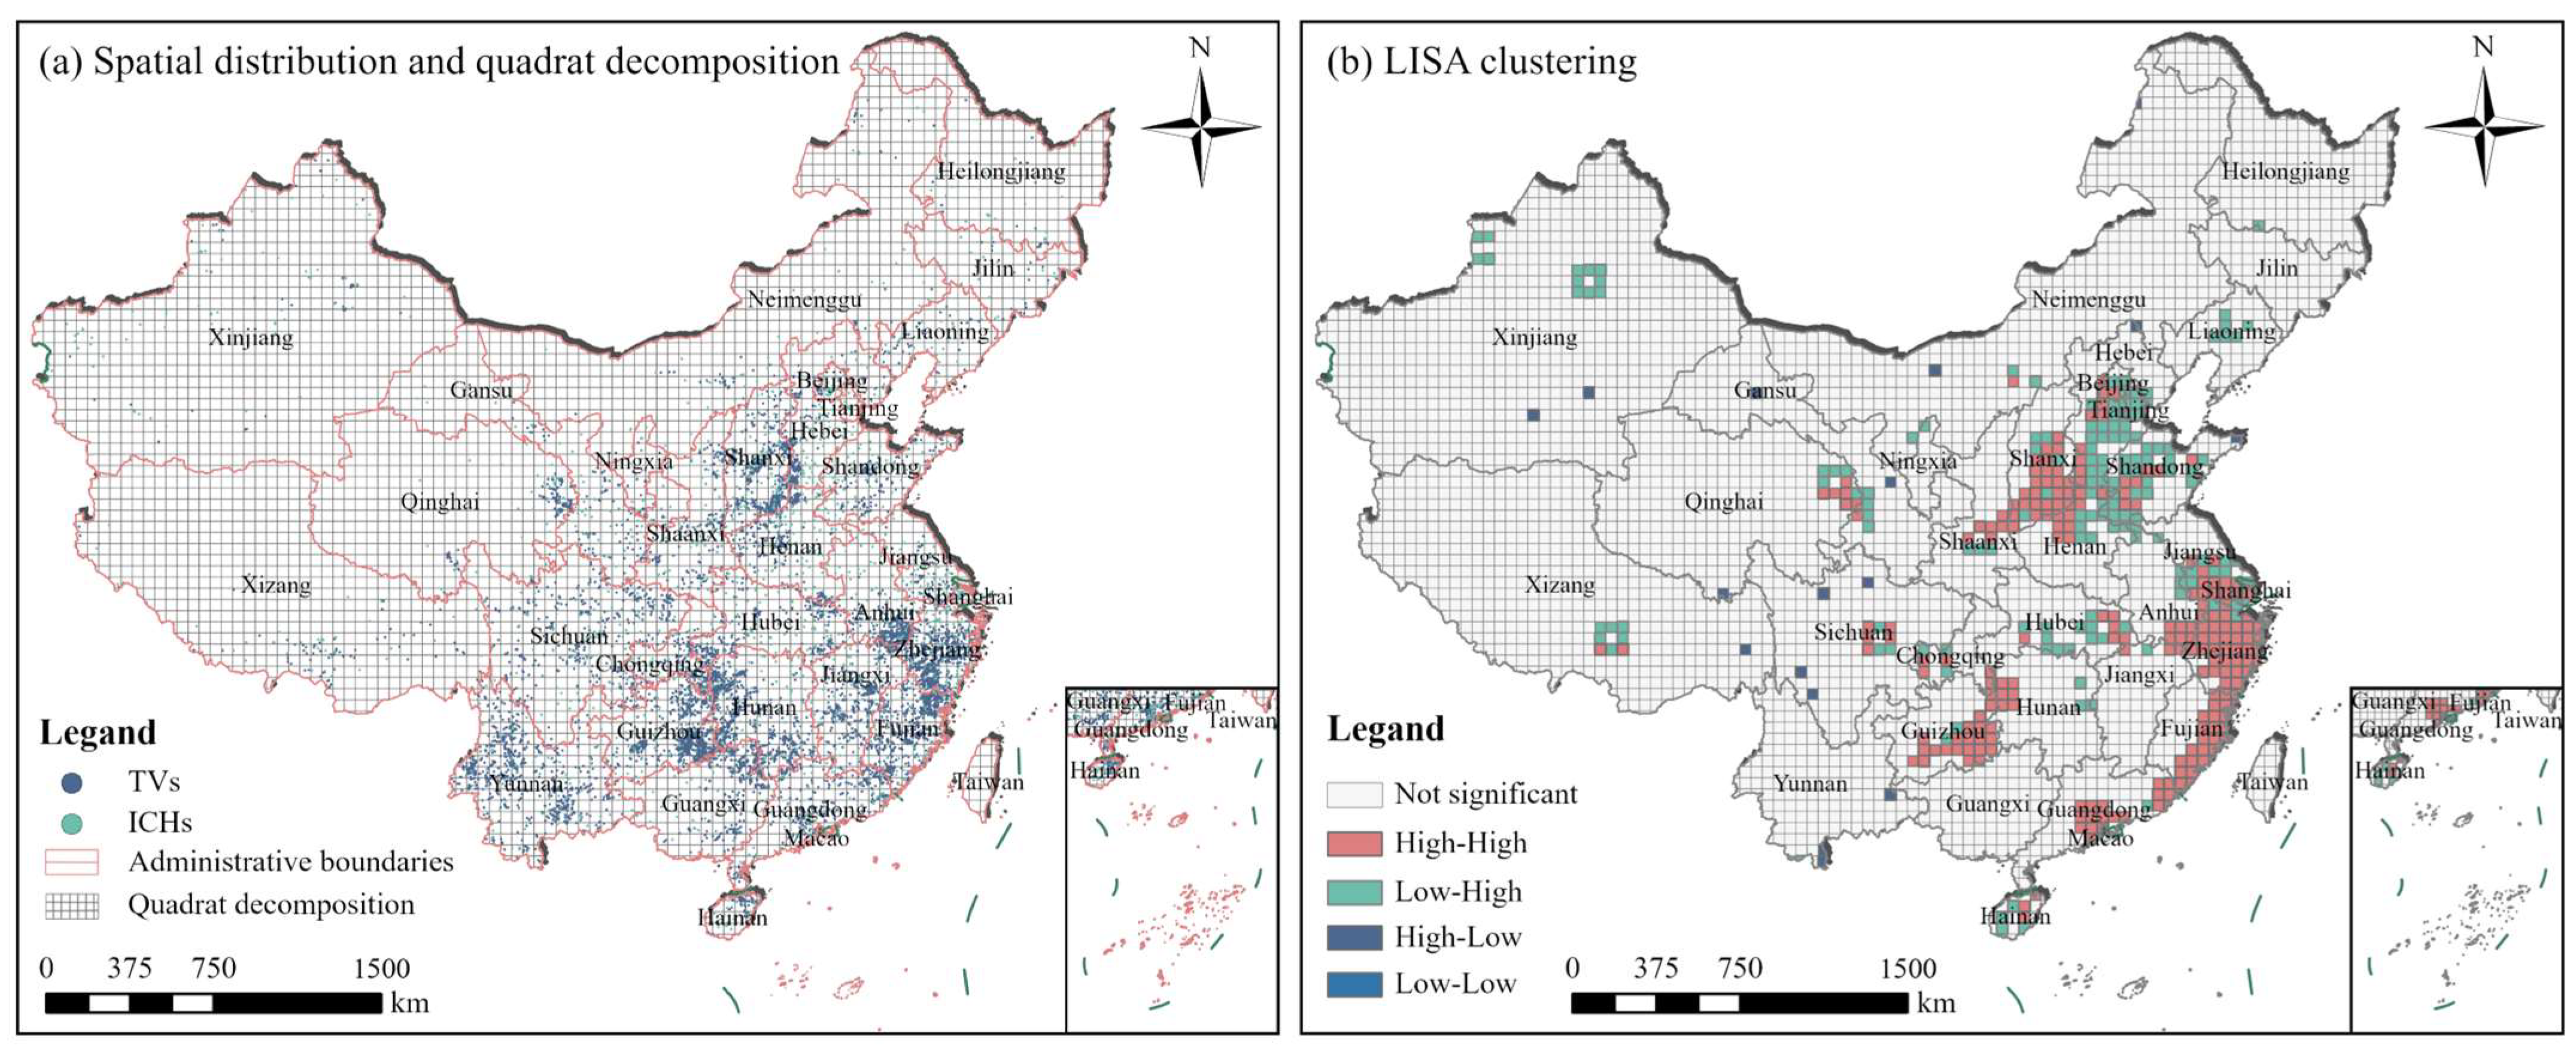
3.2. Analysis of the Spatial Relationship Between TVs and ICH
3.2.1. Quantitative Spatial Relationship
3.2.2. Spatial Correlation Relationship
3.2.3. Spatial Mismatch Relationship
3.3. Analysis of the Impact Mechanism of Spatial Mismatch Between TVs and ICH
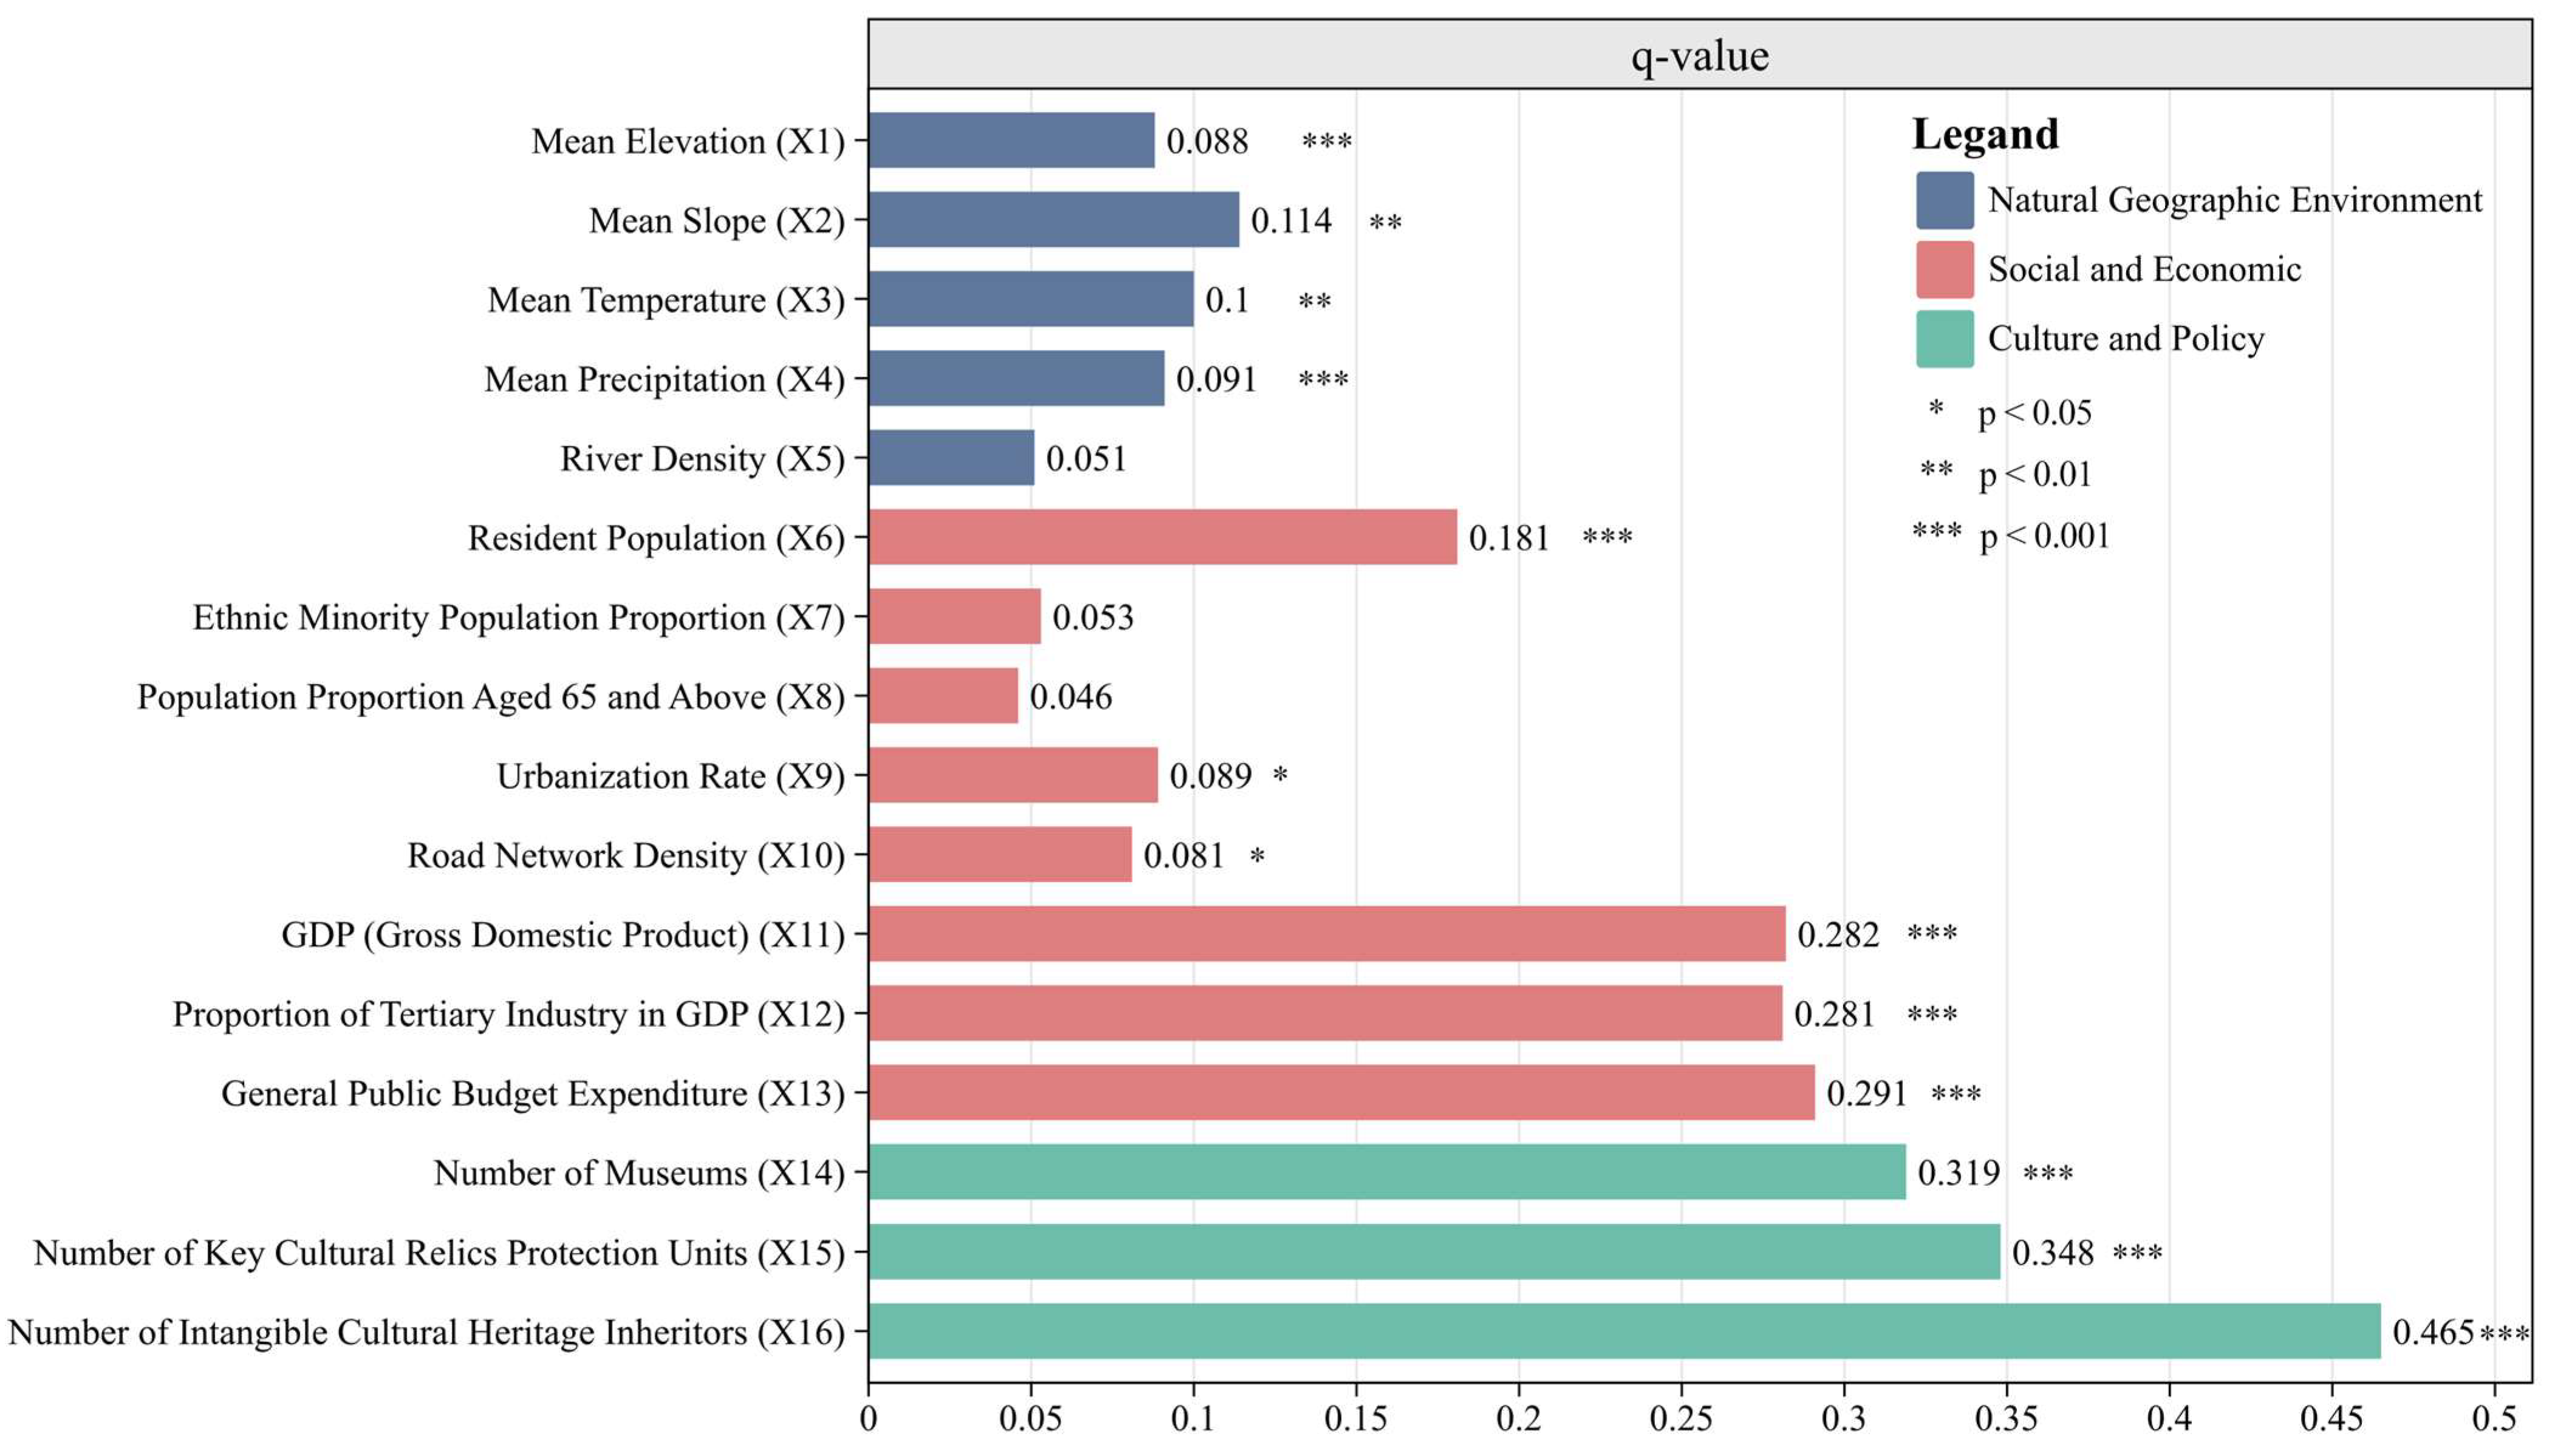
3.3.1. Selection of Driving Factors
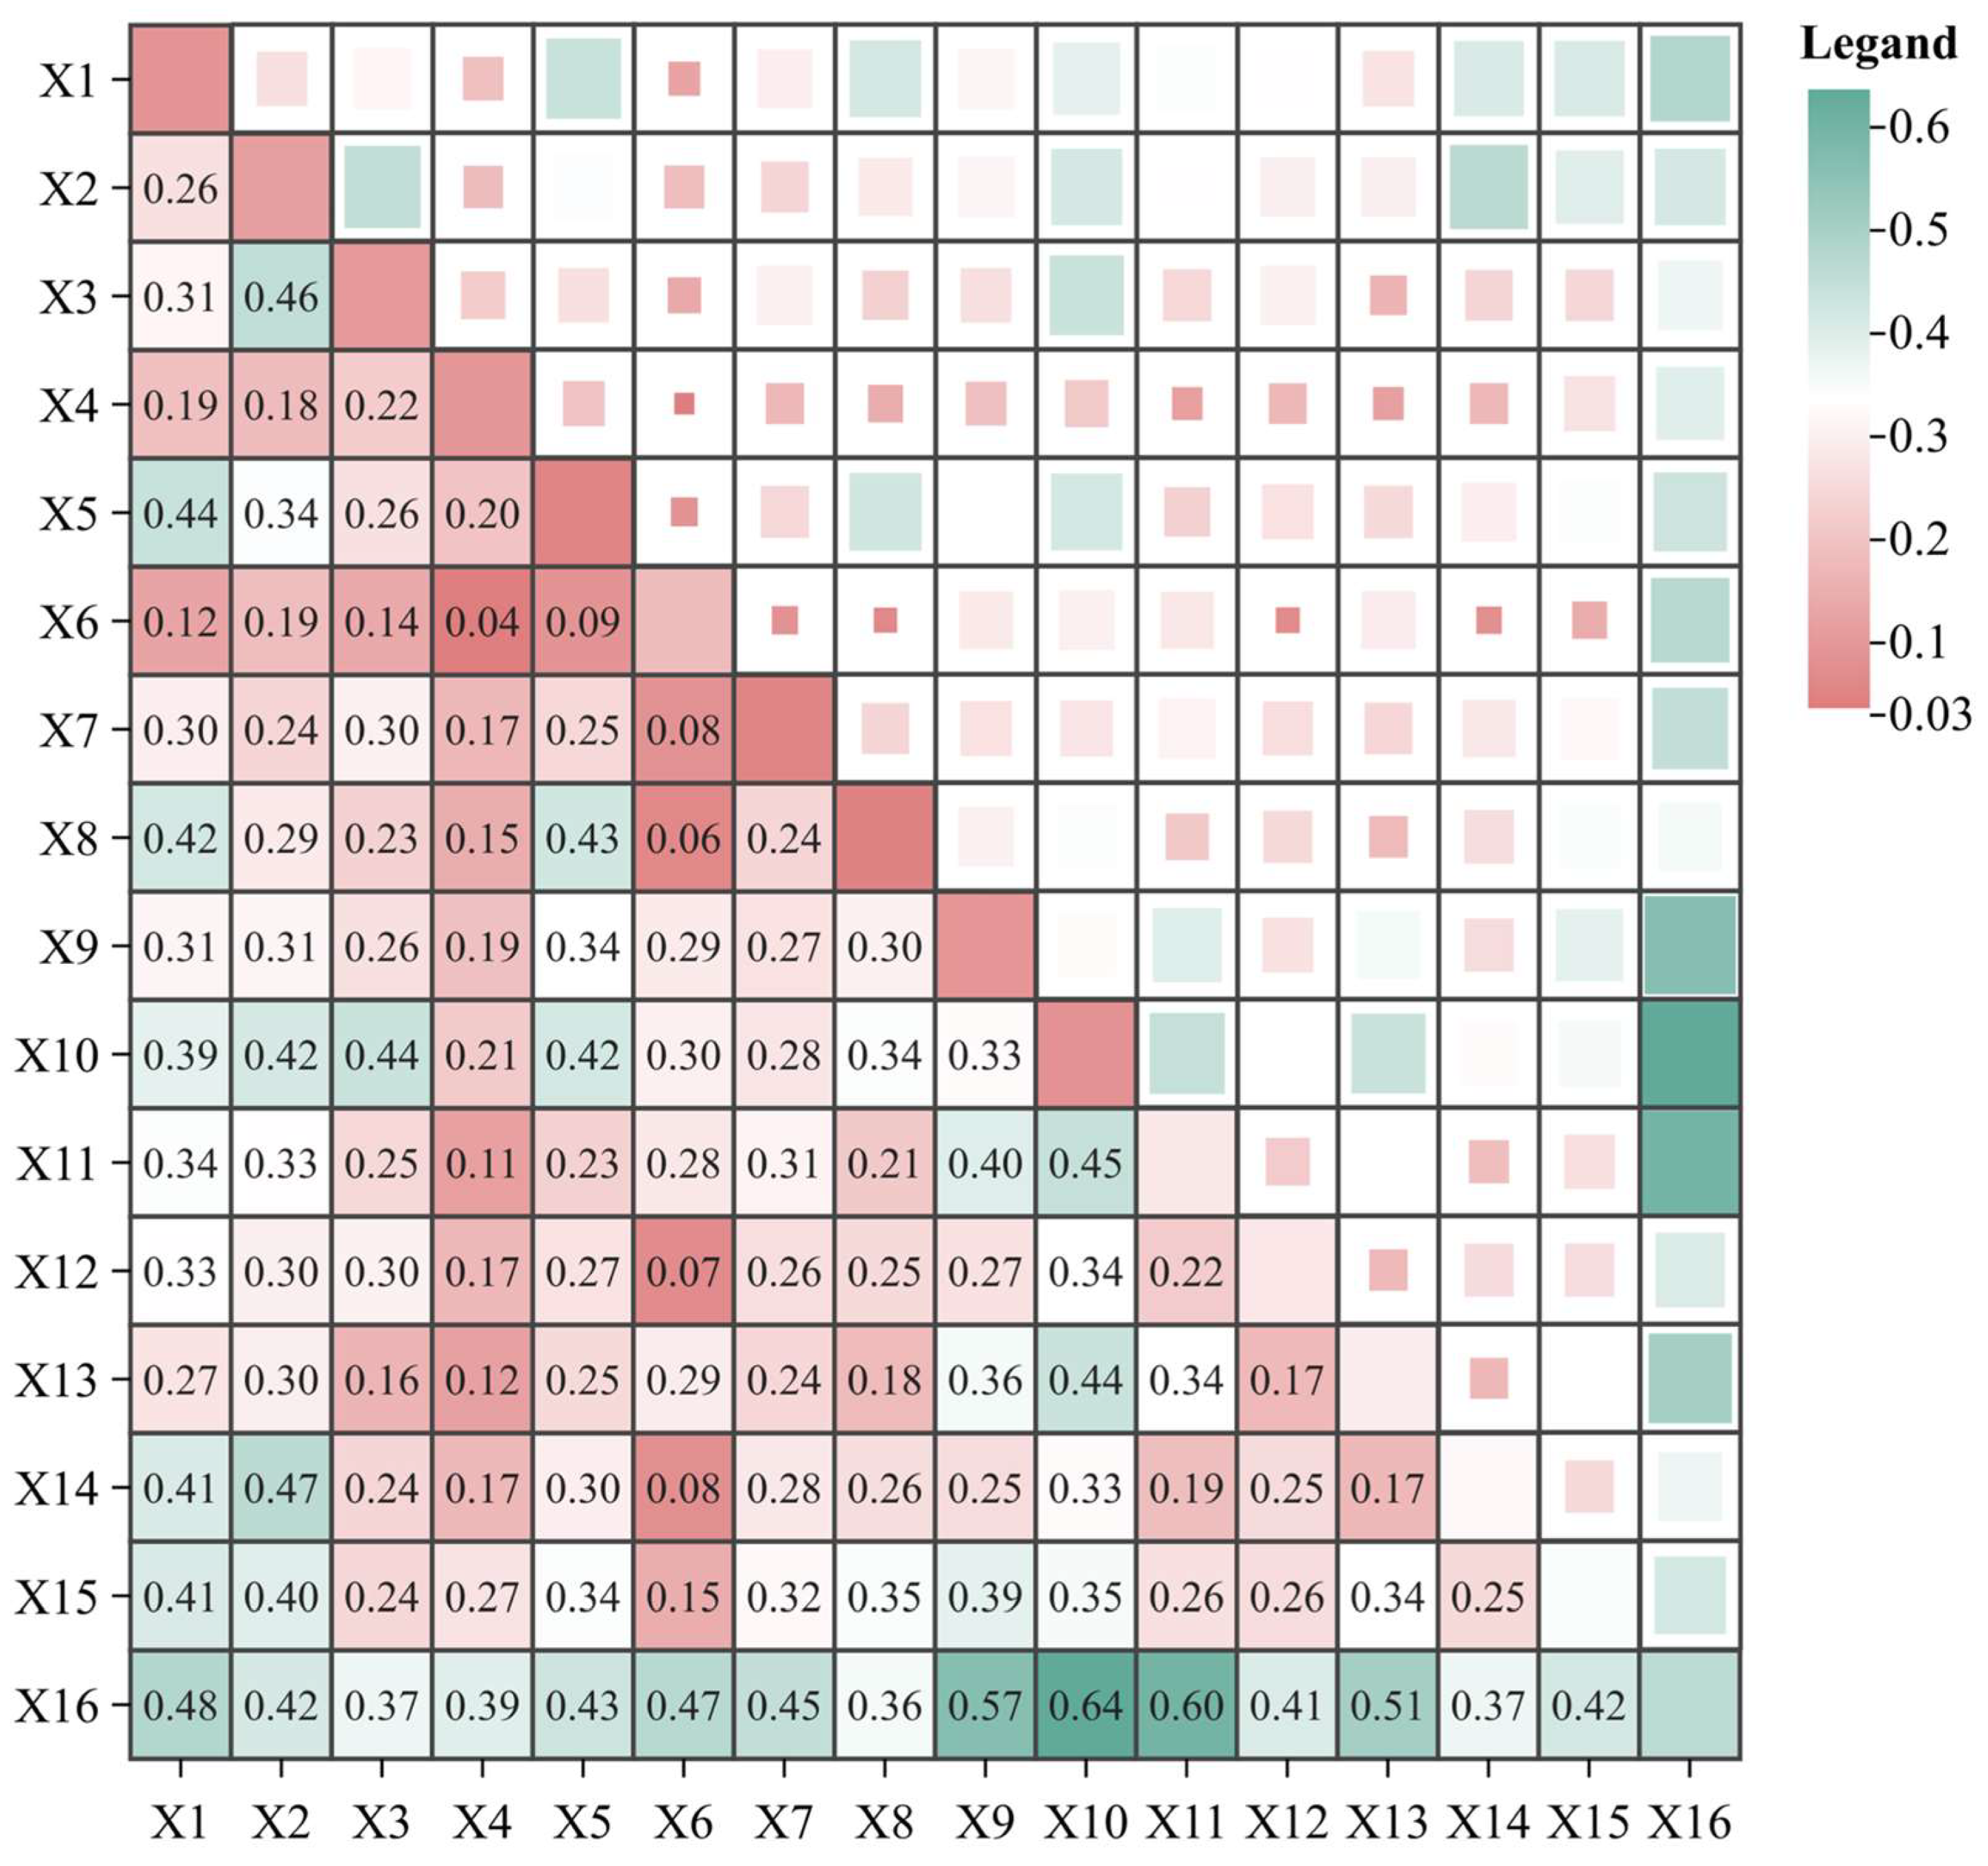
3.3.2. Results of the Optimal-Parameter Geographic Detector
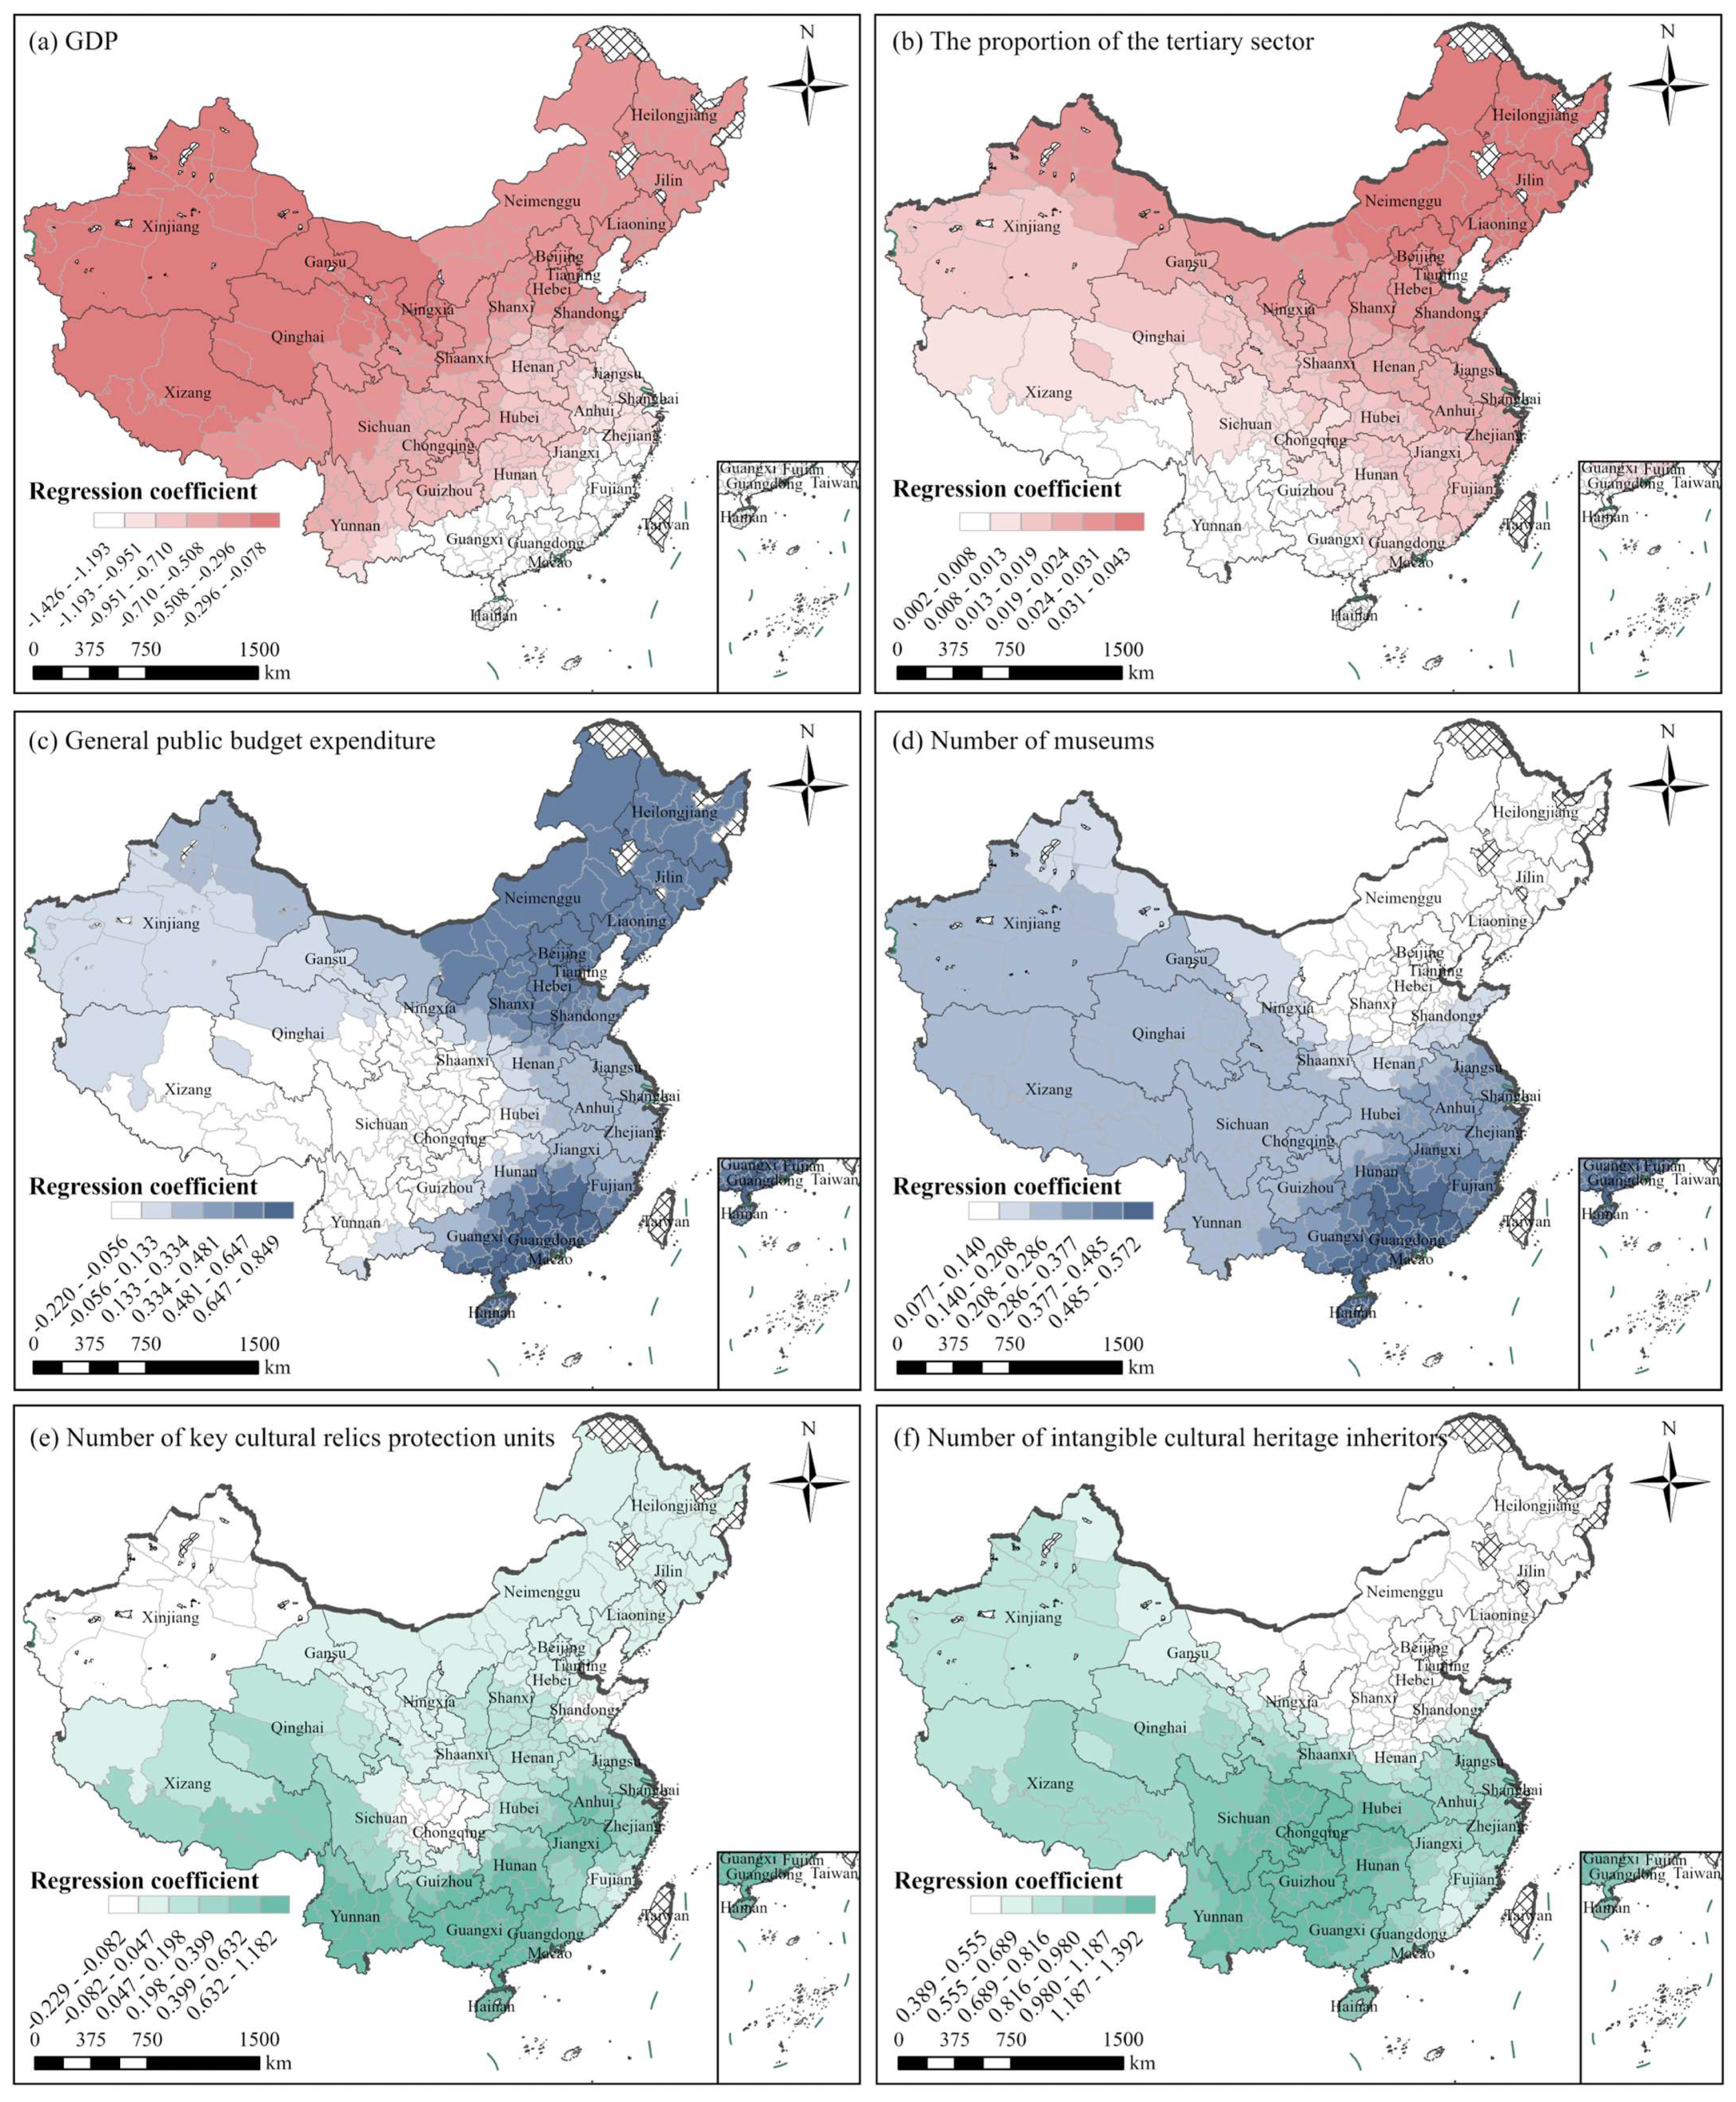
3.3.3. Results of Multiscale Geographically Weighted Regression
4. Discussion
4.1. Spatial Pattern and Relationship Characteristics of TVs and ICH
4.2. Driving Mechanism of Spatial Mismatch Relationship Between TVs and ICH
4.3. Spatial Heterogeneity of Core Driving Factors
5. Conclusions
Author Contributions
Funding
Data Availability Statement
Conflicts of Interest
References
- Hu, Y.; Chen, S.; Cao, W.; Cao, C. The concept and cultural connotation of traditional villages. Urban Dev. Stud. 2014, 21, 10–13. [Google Scholar]
- Jing, F.; Ramli, R.R.; Nasrudin, N. Protection of traditional villages in China: A review on the development process and policy evolution. J. Cult. Herit. Manag. Sustain. Dev. 2024, ahead of print. [Google Scholar] [CrossRef]
- Liu, Z. Indigenising intangible cultural heritage: Comparison and interpretation of the concept of ICH in China. Int. J. Intang. Herit. 2015, 10, 125–134. [Google Scholar]
- Fu, J.; Zhou, J.; Deng, Y. Heritage values of ancient vernacular residences in traditional villages in Western Hunan, China: Spatial patterns and influencing factors. Build. Environ. 2021, 188, 107473. [Google Scholar] [CrossRef]
- Wu, C.; Chen, M.M.; Zhou, L.; Liang, X.J.; Wang, W. Identifying the Spatiotemporal Patterns of Traditional Villages in China: A Multiscale Perspective. Land 2020, 9, 449. [Google Scholar] [CrossRef]
- Lenzerini, F. Intangible cultural heritage: The living culture of peoples. Eur. J. Int. Law 2011, 22, 101–120. [Google Scholar] [CrossRef]
- He, Y.; Zhang, J. Bibliometric Analysis of Chinese Traditional Villages Based on CiteSpace. Adv. Educ. Humanit. Soc. Sci. Res. 2025, 13, 177–181. [Google Scholar] [CrossRef]
- Chen, Y.H.; Li, R. Spatial Distribution and Type Division of Traditional Villages in Zhejiang Province. Sustainability 2024, 16, 5262. [Google Scholar] [CrossRef]
- Li, Y.Z.; Fan, W.L.; Yuan, X.W.; Li, J.Y. Spatial distribution characteristics and influencing factors of traditional villages based on geodetector: Jiarong Tibetan in Western Sichuan, China. Sci. Rep. 2024, 14, 11700. [Google Scholar] [CrossRef]
- Liu, W.; Xue, Y.; Shang, C. Spatial distribution analysis and driving factors of traditional villages in Henan province: A comprehensive approach via geospatial techniques and statistical models. Herit. Sci. 2023, 11, 185. [Google Scholar] [CrossRef]
- Feng, J.; Yin, J.; Chen, Y. Spatial evolution and influencing factors of water-town settlements in Southern China: Evidence from 942 villages in Zhongshan City. J. Asian Archit. Build. Eng. 2024. [Google Scholar] [CrossRef]
- Li, J.; Xiao, Y.; Yan, J.; Liang, C.; Zhong, H. Spatiotemporal Evolution Characteristics and Causative Analysis of Toponymic Cultural Landscapes in Traditional Villages in Northern Guangdong, China. Sustainability 2025, 17, 271. [Google Scholar] [CrossRef]
- Zhang, Y.; Han, N.; Zhang, B.; Lu, C.; Yang, M.; Zhai, F.; Li, H. Spatial and temporal distribution characteristics and evolution of traditional villages in the Qihe River Basin of China. Sci. Rep. 2025, 15, 10077. [Google Scholar] [CrossRef] [PubMed]
- Cai, A.; Bai, M.; Yao, M.; Liu, S. Traditional Village Activity Quantization Evaluation Method Involves Determining Traditional Village Vitality Index According to Evaluation Index System and Database, and Evaluating Vitality of Large Sample of Traditional Villages in Region, and Dividing Vitality into Different Levels. China Patent CN115796629-A, 14 March 2023. [Google Scholar]
- Li, S.; He, Y. Digital Twin Based Traditional Village Protection Effect Evaluation Method, Involves Collecting Data of Monitoring Point of Traditional Village Through Collecting Terminal, and Introducing Data into Digital Twinning Construction Software. China Patent CN118569687-A.; CN118569687-B, 30 August 2024. [Google Scholar]
- Dai, M.L.; Fan, D.X.F.; Wang, R.; Ou, Y.H.; Ma, X.L. Does rural tourism revitalize the countryside? An exploration of the spatial reconstruction through the lens of cultural connotations of rurality. J. Destin. Mark. Manag. 2023, 29, 100801. [Google Scholar] [CrossRef]
- Gao, J.; Wu, B. Revitalizing traditional villages through rural tourism: A case study of Yuanjia Village, Shaanxi Province, China. Tour. Manag. 2017, 63, 223–233. [Google Scholar] [CrossRef]
- Zhang, Y.J.; Okamura, Y. Revitalizing traditional villages through Bookstore-led Rural Tourism: A case study of three Bookstore villages in Rural China. J. Asian Archit. Build. Eng. 2024. [Google Scholar] [CrossRef]
- Nie, X.; Xie, Y.; Xie, X.X.; Zheng, L.X. The characteristics and influencing factors of the spatial distribution of intangible cultural heritage in the Yellow River Basin of China. Herit. Sci. 2022, 10, 121. [Google Scholar] [CrossRef]
- Zhang, X.Y.; Xiang, H.; Liu, R. Spatial pattern and influencing factors of intangible cultural heritage of music in Xiangxi, central China. Herit. Sci. 2022, 10, 39. [Google Scholar] [CrossRef]
- Dong, B.L.; Bai, K.; Sun, X.L.; Wang, M.T.; Liu, Y. Spatial distribution and tourism competition of intangible cultural heritage: Take Guizhou, China as an example. Herit. Sci. 2023, 11, 64. [Google Scholar] [CrossRef]
- Su, J.J. Managing intangible cultural heritage in the context of tourism: Chinese officials’ perspectives. J. Tour. Cult. Change 2020, 18, 164–186. [Google Scholar] [CrossRef]
- Cai, Z.Q.; Cai, K.K.; Huang, T.; Zhang, G.; Chen, R.X. Spatial Distribution Characteristics and Sustainable Inheritance Strategies of National Traditional Fine Arts Intangible Cultural Heritage in China. Sustainability 2024, 16, 4488. [Google Scholar] [CrossRef]
- Guo, C.; Hua, H.J.; Geng, X.W. Incorporating Folk Belief into National Heritage: The Interaction between Ritual Practice and Theatrical Performance in Xiud Yax Lus Qim (Yalu wang) of the Miao (Hmong) Ethnic Group. Religions 2021, 12, 899. [Google Scholar] [CrossRef]
- Dai, M.; Feng, Y.; Wang, R.; Jung, J. Enhancing the Digital Inheritance and Development of Chinese Intangible Cultural Heritage Paper-Cutting Through Stable Diffusion LoRA Models. Appl. Sci. 2024, 14, 11032. [Google Scholar] [CrossRef]
- Song, X.T.; Yang, Y.Z.; Yang, R.; Shafi, M. Keeping Watch on Intangible Cultural Heritage: Live Transmission and Sustainable Development of Chinese Lacquer Art. Sustainability 2019, 11, 3868. [Google Scholar] [CrossRef]
- Li, C.; Qian, Y.Y.; Li, Z.K.; Tong, T. Identifying factors influencing the spatial distribution of minority cultural heritage in Southwest China. Herit. Sci. 2024, 12, 117. [Google Scholar] [CrossRef]
- Zhang, Z.W.; Li, Q.; Hu, S.X. Intangible Cultural Heritage in the Yellow River Basin: Its Spatial-Temporal Distribution Characteristics and Differentiation Causes. Sustainability 2022, 14, 11073. [Google Scholar] [CrossRef]
- Nie, Z.Y.; Dong, T.; Pan, W. Spatial differentiation and geographical similarity of traditional villages--Take the Yellow River Basin and the Yangtze River Basin as examples. PLoS ONE 2024, 19, e0295854. [Google Scholar] [CrossRef]
- Wu, K.H.; Su, W.C.; Ye, S.A.; Li, W.; Cao, Y.; Jia, Z.Z. Analysis on the geographical pattern and driving force of traditional villages based on GIS and Geodetector: A case study of Guizhou, China. Sci. Rep. 2023, 13, 20659. [Google Scholar] [CrossRef]
- Li, Z.Y.; Yang, M.Y.; Zhou, X.L.; Li, Z.G.; Li, H.D.; Zhai, F.F.; Zhang, Y.; Zhang, Y.X. Research on the spatial correlation and formation mechanism between traditional villages and rural tourism. Sci. Rep. 2023, 13, 8210. [Google Scholar] [CrossRef]
- Zhang, D.X.; Zhang, X.Y.; Teng, L.; Ma, W.J.; Tan, L.G.; Li, H.H. Distribution Characteristics and Influencing Factors of Traditional Villages in the Lingnan Region of China. Buildings 2025, 15, 978. [Google Scholar] [CrossRef]
- Dandan, S.; Kyungjin, Z. Analysis of spatial distribution characteristics and driving factors of ethnic-minority villages in China using geospatial technology and statistical models. J. Mt. Sci. 2024, 21, 2770–2789. [Google Scholar] [CrossRef]
- Wang, W. Strategy for Rural Heritage Regeneration in China: Integrating Community and Government in Governance: A Case Study of Traditional Villages in Luoning County. Ph.D. Dissertation, University of Nova Gorica (Slovenia), Nova Gorica, Slovenia, 2024. [Google Scholar]
- Zhang, Z.W.; Cui, Z.; Fan, T.S.; Ruan, S.Y.; Wu, J.M. Spatial distribution of intangible cultural heritage resources in China and its influencing factors. Sci. Rep. 2024, 14, 4960. [Google Scholar] [CrossRef] [PubMed]
- Li, S.Y.; Song, Y.H.; Xu, H.; Li, Y.J.; Zhou, S.K. Spatial Distribution Characteristics and Driving Factors for Traditional Villages in Areas of China Based on GWR Modeling and Geodetector: A Case Study of the Awa Mountain Area. Sustainability 2023, 15, 3443. [Google Scholar] [CrossRef]
- Chen, W.X.; Yang, Z.; Yang, L.Y.; Wu, J.H.; Bian, J.J.; Zeng, J.; Liu, Z.L. Identifying the spatial differentiation factors of traditional villages in China. Herit. Sci. 2023, 11, 149. [Google Scholar] [CrossRef]
- He, C.; Liang, Y.W.; Zhang, S.Y. A Study on the Spatial Structures and Mechanisms of Intangible Cultural Heritage and Traditional Villages in the Dongting Lake Basin. Buildings 2024, 14, 1736. [Google Scholar] [CrossRef]
- Yu, T.; Ye, Y.-l. Analysis on the inbound tourist source market in Jiangxi based on geographic concentration index and market competition status. IOP Conf. Ser. Earth Environ. Sci. 2018, 153, 062086. [Google Scholar] [CrossRef]
- Wren, C. Geographic concentration and the temporal scope of agglomeration economies: An index decomposition. Reg. Sci. Urban Econ. 2012, 42, 681–690. [Google Scholar] [CrossRef]
- Ma, H.; Tong, Y. Spatial differentiation of traditional villages using ArcGIS and GeoDa: A case study of Southwest China. Ecol. Inform. 2021, 68, 101416. [Google Scholar] [CrossRef]
- Xue, Q.; Huang, Y. The spatial relationship and influence mechanism of traditional villages and intangible cultural heritage: A case study of the upper reaches of the Yellow River Basin. Humanit. Soc. Sci. Commun. 2025, 12, 142. [Google Scholar] [CrossRef]
- Tian, L.; Shi, B.; Sun, F.; Zhang, S.; Wang, B. Spatial correlation between traditional villages and intangible cultural heritage in the Yellow River Basin and its influencing factors. Arid Zone Resour. Environ. 2023, 37, 186–194. [Google Scholar]
- Liang, L.; Chen, M.; Luo, X.; Xian, Y. Changes pattern in the population and economic gravity centers since the Reform and Opening up in China: The widening gaps between the South and North. J. Clean. Prod. 2021, 310, 127379. [Google Scholar] [CrossRef]
- Wang, H.; Zhang, B.; Liu, Y.; Liu, Y.; Xu, S.; Zhao, Y.; Chen, Y.; Hong, S. Urban expansion patterns and their driving forces based on the center of gravity-GTWR model: A case study of the Beijing-Tianjin-Hebei urban agglomeration. J. Geogr. Sci. 2020, 30, 297–318. [Google Scholar] [CrossRef]
- Martin, R.W. Spatial mismatch and the structure of American metropolitan areas, 1970–2000. J. Reg. Sci. 2004, 44, 467–488. [Google Scholar] [CrossRef]
- Zhou, Y.; Zhao, K.; Han, J.; Zhao, S.; Cao, J. Geographical pattern evolution of health resources in China: Spatio-temporal dynamics and spatial mismatch. Trop. Med. Infect. Dis. 2022, 7, 292. [Google Scholar] [CrossRef]
- Li, J.; Ning, J.; Song, J.; Chen, X. Analysis of the spatial mismatch pattern of net carbon in agriculture and its influencing factors. Environ. Impact Assess. Rev. 2024, 106, 107522. [Google Scholar] [CrossRef]
- An, M.; Xie, P.; He, W.J.; Wang, B.; Huang, J.; Khanal, R. Spatiotemporal change of ecologic environment quality and human interaction factors in three gorges ecologic economic corridor, based on RSEI. Ecol. Indic. 2022, 141, 109090. [Google Scholar] [CrossRef]
- Jiang, R.; Wu, P.; Song, Y.Z.; Wu, C.K.; Wang, P.; Zhong, Y. Factors influencing the adoption of renewable energy in the US residential sector: An optimal parameters-based geographical detector approach. Renew. Energy 2022, 201, 450–461. [Google Scholar] [CrossRef]
- Yu, H.C.; Fotheringham, A.S.; Li, Z.Q.; Oshan, T.; Wolf, L.J. On the measurement of bias in geographically weighted regression models. Spat. Stat. 2020, 38, 100453. [Google Scholar] [CrossRef]
- Chien, Y.M.C.; Carver, S.; Comber, A. Using geographically weighted models to explore how crowdsourced landscape perceptions relate to landscape physical characteristics. Landsc. Urban Plan. 2020, 203, 103904. [Google Scholar] [CrossRef]
- Wang, X.R.; Zhang, T.J.; Duan, L.R.; Liritzis, I.; Li, J.S. Spatial distribution characteristics and influencing factors of intangible cultural heritage in the Yellow River Basin. J. Cult. Herit. 2024, 66, 254–264. [Google Scholar] [CrossRef]
- Wang, J.C.; Chen, M.; Zhang, H.Y.; Ye, F. Intangible Cultural Heritage in the Yangtze River Basin: Its Spatial Distribution Characteristics and Influencing Factors. Sustainability 2023, 15, 7960. [Google Scholar] [CrossRef]
- Pang, L.; Wu, L.A. Distribution characteristics and influencing factors of Intangible Cultural Heritage in Beijing-Tianjin-Hebei. Herit. Sci. 2023, 11, 19. [Google Scholar] [CrossRef]
- Kou, W.H.; Zhai, J.H. Spatial distribution patterns and influencing factors of sports intangible cultural heritage in China. Front. Earth Sci. 2025, 13, 1556652. [Google Scholar] [CrossRef]
- Chen, W.X.; Yang, L.Y.; Wu, J.H.; Wu, J.H.; Wang, G.Z.; Bian, J.J.; Zeng, J.; Liu, Z.L. Spatio-temporal characteristics and influencing factors of traditional villages in the Yangtze River Basin: A Geodetector model. Herit. Sci. 2023, 11, 111. [Google Scholar] [CrossRef]
- Feng, Y.; Wei, H.; Huang, Y.; Li, J.W.; Mu, Z.Q.; Kong, D.Z. Spatiotemporal evolution characteristics and influencing factors of traditional villages: The Yellow River Basin in Henan Province, China. Herit. Sci. 2023, 11, 97. [Google Scholar] [CrossRef]
- Bian, J.J.; Chen, W.X.; Zeng, J. Spatial Distribution Characteristics and Influencing Factors of Traditional Villages in China. Int. J. Environ. Res. Public Health 2022, 19, 4627. [Google Scholar] [CrossRef]
- Su, H.R.; Wang, Y.W.; Zhang, Z.; Dong, W. Characteristics and Influencing Factors of Traditional Village Distribution in China. Land 2022, 11, 1631. [Google Scholar] [CrossRef]


| Batch 1 | Batch 2 | Batch 3 | Batch 4 | Batch 5 | Batch 6 | Total | |
|---|---|---|---|---|---|---|---|
| East China | 197 | 229 | 270 | 637 | 1361 | 398 | 3092 |
| Southwest China | 186 | 478 | 411 | 384 | 416 | 219 | 2094 |
| Central–South China | 130 | 142 | 150 | 188 | 408 | 237 | 1255 |
| North China | 93 | 38 | 96 | 265 | 336 | 163 | 991 |
| Northwest China | 38 | 25 | 53 | 111 | 122 | 280 | 629 |
| Northeast China | 2 | 3 | 14 | 13 | 23 | 39 | 94 |
| Total | 646 | 915 | 994 | 1598 | 2666 | 1336 | 8155 |
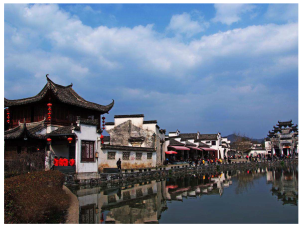 EC: Xidi Village, Anhui. | 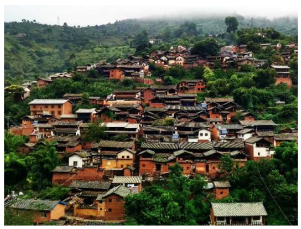 SWC: Dengnuo Village, Yunnan. | 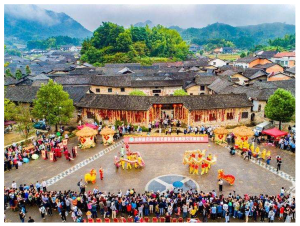 CSC: Zhangguying Town, Hunan. |
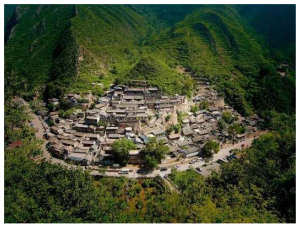 NC: Cuandixia Village, Beijing. |  NWC: Dangjia Village, Shaanxi. | 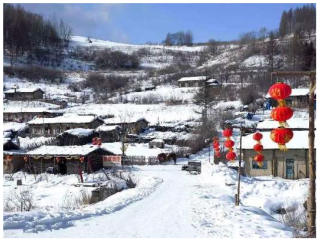 NEC: Wooden Houses Village, Jilin. |
| Batch 1 | Batch 2 | Batch 3 | Batch 4 | Batch 5 | Total | |
|---|---|---|---|---|---|---|
| Northeast China | 36 | 65 | 24 | 20 | 28 | 173 |
| Southwest China | 116 | 202 | 71 | 56 | 65 | 510 |
| Northwest China | 117 | 200 | 75 | 68 | 84 | 544 |
| Central–South China | 124 | 198 | 83 | 74 | 70 | 549 |
| North China | 129 | 266 | 95 | 87 | 84 | 661 |
| East China | 237 | 420 | 212 | 152 | 129 | 1150 |
| Total | 759 | 1351 | 560 | 457 | 460 | 3587 |
| L1 | L2 | L3 | L4 | L5 | L6 | L7 | L8 | L9 | L10 | Total | |
|---|---|---|---|---|---|---|---|---|---|---|---|
| Northeast China | 16 | 22 | 8 | 16 | 16 | 7 | 26 | 9 | 28 | 25 | 173 |
| Southwest China | 100 | 50 | 11 | 71 | 45 | 22 | 71 | 40 | 83 | 17 | 510 |
| Northwest China | 87 | 58 | 17 | 76 | 46 | 32 | 79 | 46 | 77 | 26 | 544 |
| Central–South China | 62 | 65 | 20 | 66 | 88 | 23 | 74 | 41 | 84 | 26 | 549 |
| North China | 132 | 68 | 61 | 40 | 90 | 47 | 74 | 33 | 75 | 41 | 661 |
| East China | 228 | 153 | 49 | 86 | 185 | 51 | 104 | 82 | 135 | 77 | 1150 |
| Total | 625 | 416 | 166 | 355 | 470 | 182 | 428 | 251 | 482 | 212 | 3587 |
 L1: Yixing Purple Clay Pottery Making. |  L2: Zhangzhou Woodblock New Year Prints. | 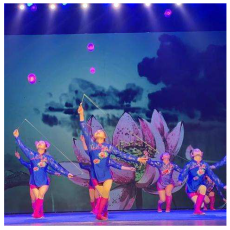 L3: Liaocheng Acrobatics. |  L4: Yangge | 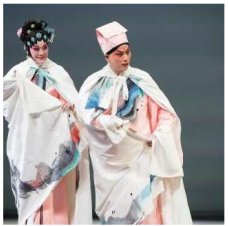 L5: Kunqu Opera. |
 L6: Traditional Chinese Medicine Diagnostics. |  L7: Mongolian Long Tune Folk Songs. |  L8: The Butterfly Lovers. |  L9: Spring Festival | 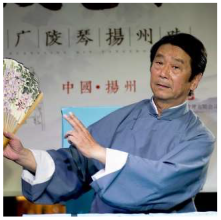 L10: Yangzhou Storytelling. |
| Type | Name | Data Source | Remarks |
|---|---|---|---|
| Basic Data | National Provincial and Municipal Administrative Boundaries | Standard Map Service (http://bzdt.ch.mnr.gov.cn/ (accessed on 3 February 2025)) | China Standard Administrative Division Data GS(2024)0650 |
| National Traditional Villages | 8155 in total from six batches jointly announced by the Ministry of Housing and Urban–Rural Development, the Ministry of Culture, and the Ministry of Finance | Data for Hong Kong, Macao, and Taiwan Province are not included | |
| National Intangible Cultural Heritage | 3610 items from five batches publicly disclosed by the State Council and the national cultural and tourism administrative department (https://www.ihchina.cn/ (accessed on 3 February 2025)) | Due to data limitations, the research data does not include Hong Kong, Macao, and Taiwan Province, with only 3587 items | |
| Natural Geographic Environment | Mean Elevation | Geospatial data cloud (https://www.gscloud.cn/ (accessed on 3 February 2025)) | 2021, 250 m precision |
| Mean Slope | GIS slope processing | ||
| Mean Temperature | National Qinghai–Tibet Plateau Data Center (https://data.tpdc.ac.cn/ (accessed on 3 February 2025)) | 2021, 1000 m precision | |
| Mean Precipitation | |||
| Mean River Density | OpenStreetMap (http://www.openstreetmap.org/ (accessed on 18 November 2021)) | / | |
| Social and Economic | Resident Population | Data from the Seventh National Population Census | / |
| Proportion of Ethnic Minority Population | |||
| Proportion of Population Aged 65 and Above | |||
| Urbanization Rate | |||
| GDP | 2022 National Urban Statistical Yearbook and provincial statistical yearbooks | The 2022 yearbook statistics for 2021 | |
| Proportion of the Tertiary industry | |||
| General Public Budget Expenditure | |||
| Road Network Density | OpenStreetMap (http://www.openstreetmap.org/ (accessed on 18 November 2021)) | / | |
| Cultural Policy | National Museum POI | AutoNavi Maps (https://ditu.amap.com/(accessed on 18 November 2021)) | / |
| National Key Cultural Relics Protection Units | 5058 items announced in eight batches by the State Council (http://www.ncha.gov.cn/ (accessed on 3 February 2025)) | / | |
| Intangible Cultural Heritage Inheritors | 3057 people publicly announced by the State Council and the national cultural and tourism administrative department (https://www.ihchina.cn/ (accessed on 3 February 2025)) | / |
| Types | Driving Factors |
|---|---|
| Natural geographical environment | Mean Elevation (X1), Mean Slope (X2), Mean Temperature (X3), Mean Precipitation (X4), Mean River Density (X5) |
| Society and economy | Resident Population (X6), Ethnic Minority Population Proportion (X7), Population Proportion Aged 65 and Above (X8), Urbanization Rate (X9), Road Network Density (X10), GDP (X11), Proportion of Tertiary Industry in GDP (X12), General Public Budget Expenditure (X13) |
| Cultural policy | Number of Museums (X14), Number of Key Cultural Relic Protection Units (X15), Number of Intangible Cultural Heritage Inheritors (X16) |
| Statistical Data | GWR | MGWR |
|---|---|---|
| R-Squared | 0.6888 | 0.6793 |
| Adjusted R-Squared | 0.6272 | 0.6359 |
| AICC | 684.9744 | 686.6123 |
| σ² | 0.3726 | 0.364 |
| Sigma-Squared MLE | 0.3112 | 0.3207 |
| Effective Degrees of Freedom | 289.8374 | 305.7647 |
| Explanatory Variables | Mean | Standard Deviation | Minimum | Median | Maximum |
|---|---|---|---|---|---|
| GDP | −0.7491 | 0.378 | −1.4264 | −0.7193 | −0.0784 |
| Proportion of Tertiary Industry in GDP | 0.0185 | 0.0096 | 0.0021 | 0.0184 | 0.0435 |
| General Public Budget Expenditure | 0.2948 | 0.3208 | −0.2198 | 0.2838 | 0.849 |
| Number of Museums | 0.2744 | 0.144 | 0.0769 | 0.2378 | 0.5718 |
| Number of Key Cultural Relic Protection Units | 0.2431 | 0.3181 | −0.2286 | 0.1275 | 1.1819 |
| Number of Intangible Cultural Heritage Inheritors | 0.8483 | 0.2879 | 0.3892 | 0.8473 | 1.3918 |
Disclaimer/Publisher’s Note: The statements, opinions and data contained in all publications are solely those of the individual author(s) and contributor(s) and not of MDPI and/or the editor(s). MDPI and/or the editor(s) disclaim responsibility for any injury to people or property resulting from any ideas, methods, instructions or products referred to in the content. |
© 2025 by the authors. Licensee MDPI, Basel, Switzerland. This article is an open access article distributed under the terms and conditions of the Creative Commons Attribution (CC BY) license (https://creativecommons.org/licenses/by/4.0/).
Share and Cite
Qian, X.; Yu, Y.; Liu, R. The Spatial Relationship Characteristics and Differentiation Causes Between Traditional Villages and Intangible Cultural Heritage in China. Buildings 2025, 15, 2094. https://doi.org/10.3390/buildings15122094
Qian X, Yu Y, Liu R. The Spatial Relationship Characteristics and Differentiation Causes Between Traditional Villages and Intangible Cultural Heritage in China. Buildings. 2025; 15(12):2094. https://doi.org/10.3390/buildings15122094
Chicago/Turabian StyleQian, Xinyan, Yi Yu, and Runjiao Liu. 2025. "The Spatial Relationship Characteristics and Differentiation Causes Between Traditional Villages and Intangible Cultural Heritage in China" Buildings 15, no. 12: 2094. https://doi.org/10.3390/buildings15122094
APA StyleQian, X., Yu, Y., & Liu, R. (2025). The Spatial Relationship Characteristics and Differentiation Causes Between Traditional Villages and Intangible Cultural Heritage in China. Buildings, 15(12), 2094. https://doi.org/10.3390/buildings15122094