Article

Damage Detection of Seismically Excited Buildings Using Neural Network Arrays with Branch Pruning Optimization

by
Jau-Yu Chou
,
Chia-Ming Chang
* and
Chieh-Yu Liu
Department of Civil Engineering, National Taiwan University, Taipei 10617, Taiwan
*
Author to whom correspondence should be addressed.
Buildings 2025, 15(12), 2052; https://doi.org/10.3390/buildings15122052
Submission received: 1 May 2025 / Revised: 10 June 2025 / Accepted: 13 June 2025 / Published: 14 June 2025
(This article belongs to the Special Issue Structural Health Monitoring Through Advanced Artificial Intelligence)

Abstract

:
In structural health monitoring, visual inspection remains vital for detecting damage, especially in concealed elements such as columns and beams. To improve damage localization, many studies have investigated and implemented deep learning into damage detection frameworks. However, the practicality of such models is often limited by their computational demands, and the relative accuracy may suffer if input features lack sensitivity to localized damage. This study introduces an efficient method for estimating damage locations and severity in buildings using a neural network array. A synthetic dataset is first generated from a simplified building model that includes floor flexural behavior and reflects the target dynamics of the structures. A dense, single-layer neural network array is initially trained with full floor accelerations, then pruned iteratively via the Lottery Ticket Hypothesis to retain only the most effective sub-networks. Subsequently, critical event measurements are input into the pruned array to estimate story-wise stiffness reductions. The approach is validated through numerical simulation of a six-story model and further verified via shake table tests on a scaled twin-tower steel-frame building. Results show that the pruned neural network array based on the Lottery Ticket Hypothesis achieves high accuracy in identifying stiffness reductions while significantly reducing computational load and outperforming full-input models in both efficiency and precision.

1. Introduction

Structural health monitoring (SHM) offers the potential to reduce inspection and repair costs while enhancing public safety. A central objective in SHM is damage detection, which aims to identify degraded structural components in a timely and reliable manner. According to Rytter [1], a comprehensive damage detection method should be capable of determining the occurrence, location, severity, and remaining service life of structural damage. Among these, accurately assessing damage levels is particularly critical, as it directly informs remaining service life estimates and helps prevent misleading engineering judgments in decision-making processes.
In recent years, the use of frequency response functions (FRFs) has shown great potential for structural damage detection. As one of the most compact and accessible forms of dynamic response data, FRFs can be readily obtained through vibration testing with a relatively small number of sensors, making FRFs particularly attractive for real-time monitoring applications [2]. Moreover, FRFs inherently contain rich information about the dynamic characteristics of structures, such as natural frequencies and mode shapes, which are highly sensitive to damage [3,4]. The application of FRF-based methods generally relies on the assumption of linear structural behavior. However, in real-world scenarios, this assumption may be violated when structures exhibit significant nonlinear responses due to severe impacts or progressive damage. Conversely, when the structure is damaged but subjected to low-load conditions or has reached a post-damage stabilized state, it can often be reasonably approximated as linear [5].
Data-driven algorithms have become a widely adopted approach for structural damage detection [6,7]. In recent years, machine learning (ML) techniques, including both shallow and deep neural networks, have shown significant promise due to their ability to extract nonlinear features and capture complex patterns between sensor data and structural behavior [8]. Networks and self-organizing maps for damage detection under ambient vibrations. Kostić and Gül [9] incorporated temperature effects into bridge damage detection using time-series analysis and neural networks. Abdeljaber et al. [10] developed a real-time vibration-based damage detection model using a one-dimensional convolutional neural network. Moreover, several studies have explored the use of machine learning techniques for seismic damage detection. Huang and Burton [11] proposed a graph-based neural network-integrated with semi-supervised learning to assess seismic damage across distributed infrastructure. Lazaridis et al. [12] investigated various machine learning algorithms for predicting damage in reinforced concrete frame structures subjected to both individual and sequential earthquake excitations. Although successful damage detections were obtained in these studies, acquiring sufficient and diverse training data from real-world structures is difficult and may limit the generalization and robustness of ML-based damage detection methods.
To address the scarcity of real-world training data, synthetic samples can be generated using numerical structural models such as digital twins and finite element (FE) models [13,14]. The success of this approach hinges on model updating, wherein numerical models are calibrated to reflect the dynamic characteristics of as-built structures using measured responses [15]. Once validated, these models can simulate various damage states and produce synthetic datasets for training machine learning models to estimate damage levels. For instance, Figueiredo et al. [16] trained a hybrid ML model on synthetic data derived from an FE model. Mousavi et al. [17] used frequency-domain responses of an FE model to detect damage in beam-like structures, while Ritto and Rochinha [18] integrated physics-based models with ML classifiers to develop digital twins for structural condition assessment. Although machine learning has significantly advanced SHM, most ML-based methods still rely on manually extracted features or empirical formulations [6]. These approaches often depend heavily on the expertise of inspectors and substantial computational resources. Moreover, such methods typically require large volumes of data collected directly from the target structure, which increases model complexity and training costs. As a result, the robustness and generalizability of neural networks for damage detection may be limited in practical applications.
Beyond single-network models, using an array of neural networks—each dedicated to estimating specific damage locations and levels—offers advantages in both model simplicity and neuron-level interpretability. This modular architecture reduces network complexity and enables more precise control over neuron influence. In practice, decentralized damage detection algorithms have demonstrated greater feasibility for large-scale structures due to scalability constraints [19]. For instance, Mangal et al. [20] developed a damage detection approach for offshore platforms using two types of neural network arrays, showing that both architectures were effective and could be further enhanced through integration. Moreover, ensemble neural networks, which aggregate predictions from multiple individual networks, have also been applied successfully in structural damage assessment [21,22]. Combining decentralized architectures with ensemble learning, as realized through neural network arrays, can significantly reduce computational cost while enhancing robustness and accuracy, making the approach well-suited for practical SHM applications.
Neural network pruning is an effective strategy for reducing computational costs and enhancing model predictability by eliminating redundant components, such as neurons or filters with negligible weights. Initially, regularization approaches such as Dropout [23] and L1/L2 norms [24] are adopted to extract important features and prevent overfitting. These strategies are effective in promoting sparsity and reducing the number of network weights or memory usage, but often at the expense of increased error estimations. To address these limitations, pruning techniques are introduced as a more effective alternative. For instance, Han et al. [25] pruned filters with weights below a predefined threshold following fine-tuning with strong regularization. Zhou et al. [26] introduced a bounding box approach to efficiently prune large networks while maintaining performance comparable to their unpruned counterparts. Wu et al. [27] applied Taylor expansion-based pruning to pretrained deep convolutional networks for structural damage detection. A more recent advancement, the Lottery Ticket Hypothesis (LTH) proposed by Frankle and Carbin [28], suggests that within a large dense network, a smaller subnetwork, referred to as the “winning ticket”, can be trained to achieve comparable accuracy. Girish et al. [29] further demonstrated the effectiveness of this approach in preserving performance. LTH eliminates the need for full training and repeated retraining by identifying high-performing subnetworks at an early stage. This strategy improves upon traditional pruning methods by enhancing training efficiency, enabling more effective model compression, and achieving stronger generalization. Overall, incorporating network pruning techniques significantly reduces model complexity and memory requirements, while potentially improving generalization by eliminating non-contributory structures within the network.
The objective of this study is to develop an efficient and accurate damage detection method for identifying damage locations and severity levels in buildings using a pruned neural network array. The proposed framework begins with the construction and training of a neural network array on synthetically generated datasets derived from a simplified building model that accounts for floor flexural behavior and maintains dynamic similarity with the target structure. In this framework, the phase angles of frequency response functions are employed as damage-sensitive features. Following initial training, the network is iteratively pruned using the Lottery Ticket Hypothesis to retain only the most effective subnetworks. Subsequently, critical event measurements are input into the pruned neural network array to estimate story-wise stiffness reduction percentages. To evaluate performance, a numerical study of a six-story building model, incorporating floor stiffness contributions, is conducted. Moreover, the method is experimentally validated using a scaled twin-tower steel-frame structure tested on a shake table. The results demonstrate that the proposed approach can accurately estimate stiffness reductions and achieve a significant reduction in network complexity so that both computational efficiency and practicality are enhanced.

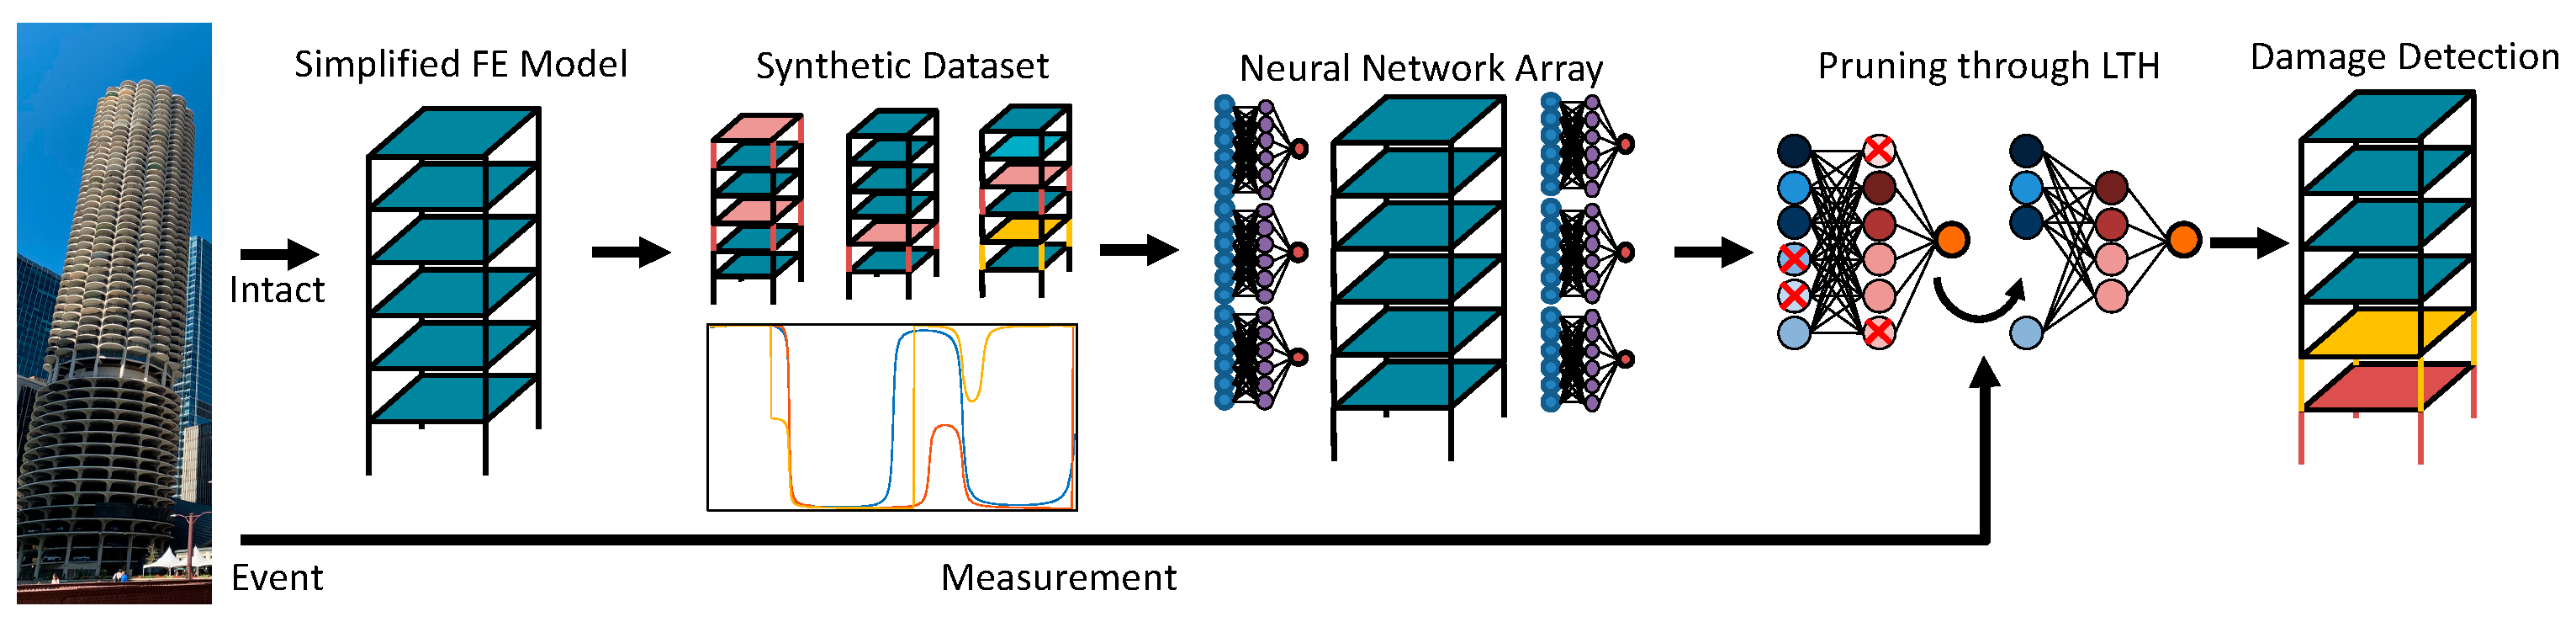
2. Damage Detection Using Neural Network Array with Lottery Ticket Hypothesis

This study proposes a damage detection method based on a neural network array combined with branch pruning via the Lottery Ticket Hypothesis, as shown in Figure 1. A simplified numerical building model is first constructed, where each floor is assumed to behave as a rigid diaphragm, and floor rotational stiffness is designed to correspond to the geometric and material properties of the target as-built structure. While the floor slabs and beams contribute to the overall rotational stiffness, their influence is relatively minor compared to that of the columns, as demonstrated in Equation (2). The modal properties of this model are calibrated to align with results obtained through identification. Using this optimized model, synthetic samples are generated to train an initial one-layer neural network array. Each neural network within the array is then individually pruned using LTH, effectively reducing model complexity while retaining performance. The resulting pruned neural network array is ultimately employed to estimate story-wise stiffness reduction percentages, enabling efficient and accurate structural damage assessment.

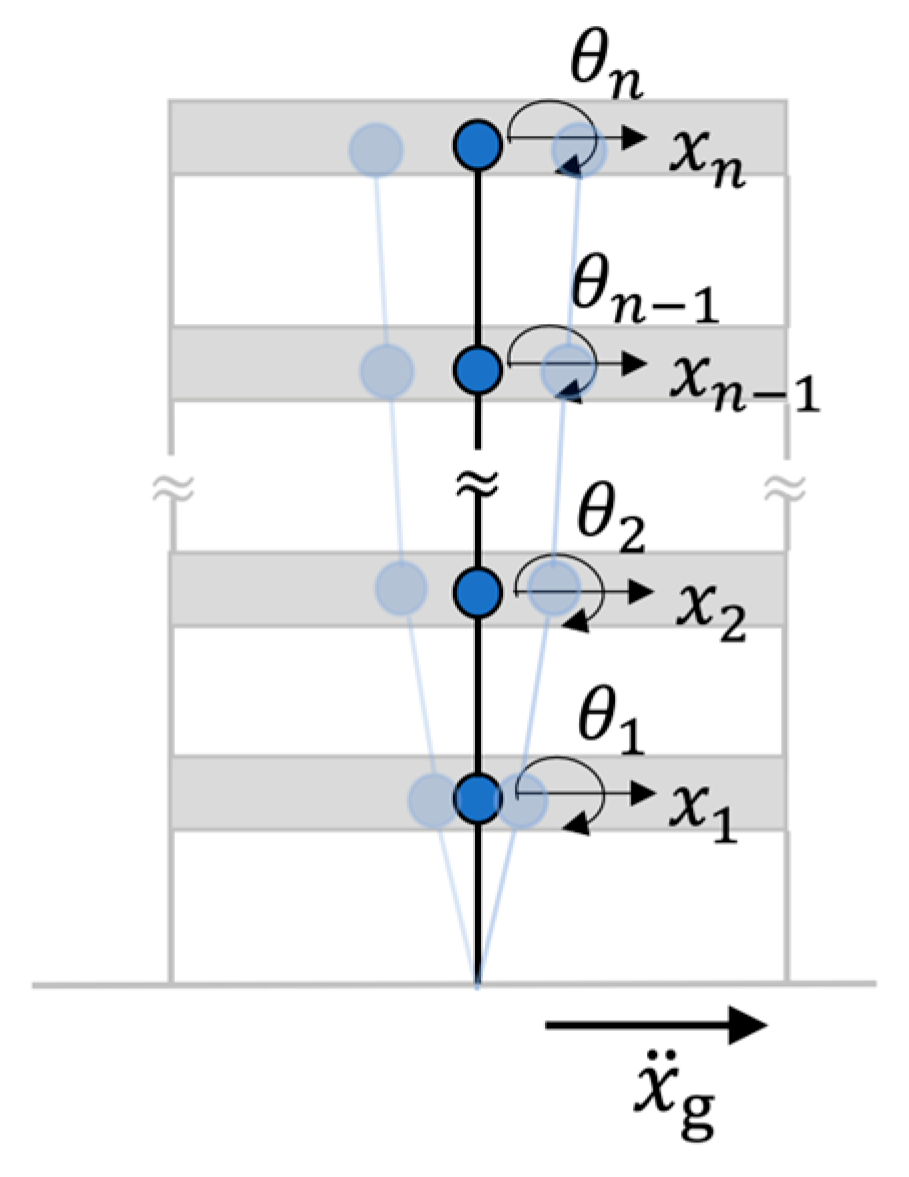
2.1. Numerical Building Model with Floor Flexural Behavior

A simplified building model using a lumped-mass representation is illustrated in Figure 2, where each floor is modeled as a single node with one translational degree of freedom in the horizontal direction and one rotational degree of freedom. Since floor slabs are assumed to behave as rigid diaphragms, all in-plane displacements are slaved to the translational and rotational DoFs at the center of mass (i.e., lumped mass). Therefore, the total number of active DoFs equals twice the number of floors. The story stiffness is comprised of the column stiffness based on the Euler beam theory and the upper and lower floor flexural stiffness of the system (i.e., rotational stiffness contributed from beams and floors). Most building models developed in past studies consider only lateral displacements and neglect the effects of rotational deformation. In this study, the inclusion of rotational DoF allows for a more realistic representation of structural deformation behavior. The equation of motion of the building is given by
M x ¨ + C x ˙ + K x = M 1 x ¨ g
where
M = M c 1 2 + M c 2 2 + M b 1 + M s 1 0 0 0 0 0 M c n 2 + M b n + M s n 0 0 0 K = 12 E e 1 I e 1 l e 1 3 + 12 E e 2 I e 2 l e 2 3 6 E e 1 I e 1 l e 1 2 + 6 E e 2 I e 2 l e 2 2 6 E e 1 I e 1 l e 1 2 + 6 E e 2 I e 2 l e 2 2 4 E e 1 I e 1 l e 1 + 4 E e 2 I e 2 l e 2 + 4 E b 1 I b 1 l b 1 + 4 E s 1 I s 1 l s 1 0 s y m m . 12 E e n I e n l e n 3 6 E e n I e n l e n 2 6 E e n I e n l e n 2 4 E e n I e n l e n + 4 E b n I b n l b n + 4 E s n I s n l s n x = x 1 , θ 1 , , x n , θ n T
where M , C , and K are the global mass, damping, and stiffness matrices, respectively; x ¨ g is the input excitation; n indicates the number of nodes; x ¨ ,   x ˙ ,   and x are the relative displacement, velocity, and acceleration vectors, respectively; 1 is a vector of which each entry is 1; x i i and θ i i are the translational and rotational DoFs at the ii-th node, respectively; M c , M b , M s are the column, beam, and floor mass, respectively; E e , I e , and l e are the Young’s modulus, moment of inertia, and height of a column, respectively; E b , I b , and l b are the Young’s modulus, moment of inertia, and length of a beam, respectively; E s , I s , and l s are the Young’s modulus, moment of inertia, and width of a floor, respectively. Note that the superscript in the mass, Young’s modulus, moment of inertia, and height or length indicates the node number, and all columns and beams per floor are lumped to the corresponding mass and moment of inertia. The proposed simplified structural model is then applied to generate synthetic samples for training a neural network.

2.2. Frequency Response Phase Difference

This study focuses on post-seismic damage assessment under the assumption that the structural system exhibits stationary behavior after the damage has stabilized. Frequency response functions (FRFs) contain rich information about structural damage and serve as effective features for damage identification. Notably, FRF phase angles are inherently bounded between −180° and 180°, making them well-suited as normalized inputs for neural network models. Due to this bounded nature, phase angles offer enhanced numerical stability and facilitate efficient learning during model training. Thus, the state-space representation derived from Equation (1) is considered and reformulated as
z s = A s z s + B x ¨ g y s = C s z s + D s x ¨ g
where z s and y s are the state and output vectors, respectively; A s , B s , C s , and D s are the system, input, output, and feedthrough matrices, respectively. The FRF phase angle can be represented by
φ p ω q = j · l n h p ω q h p ω q
where
H ω q = C s j ω q I A s 1 B s + D s = h 1 ω q , , h p ω q , , h n y ω q T H = H ω 1 , , H ω q , , H ω n f T
φ p ω q is the phase angle of the p-th output at the q-th frequency point; nf and ny are the numbers of frequency points and outputs, respectively; j = 1 ; H is the flattened response from all FRFs’ overall selected frequency points. The phase angle difference is then written as
φ D = φ I φ E
where φ D , φ I , and φ E are the phase angle vectors derived from H , indicating the difference, intact, and event (i.e., an event that damage occurs), respectively. Phase angle differences provide a sensitive feature of local stiffness degradation because structural damage alters the dynamic response characteristics. Specifically, when stiffness decreases due to damage, the natural frequencies shift and changes in the phase lag between input and output across different frequency ranges.
Note that the reliability of phase angle features relies on the assumption of a stationary structural response. While this assumption is valid in the post-damage stabilized state considered in this study, the effectiveness of phase-based features may be limited under transient or evolving damage conditions. In such cases, non-stationary signal processing techniques, such as the Short-Time Impulse Response Function [30] or the Stockwell Transform [31], may be required to accurately capture the dynamic behavior. To support reliable post-earthquake repair decision-making, this study places greater emphasis on assessing the structural condition after damage has stabilized, rather than capturing the transient dynamics during the damage. Therefore, the frequency response function and phase are finally selected as damage-sensitive features.

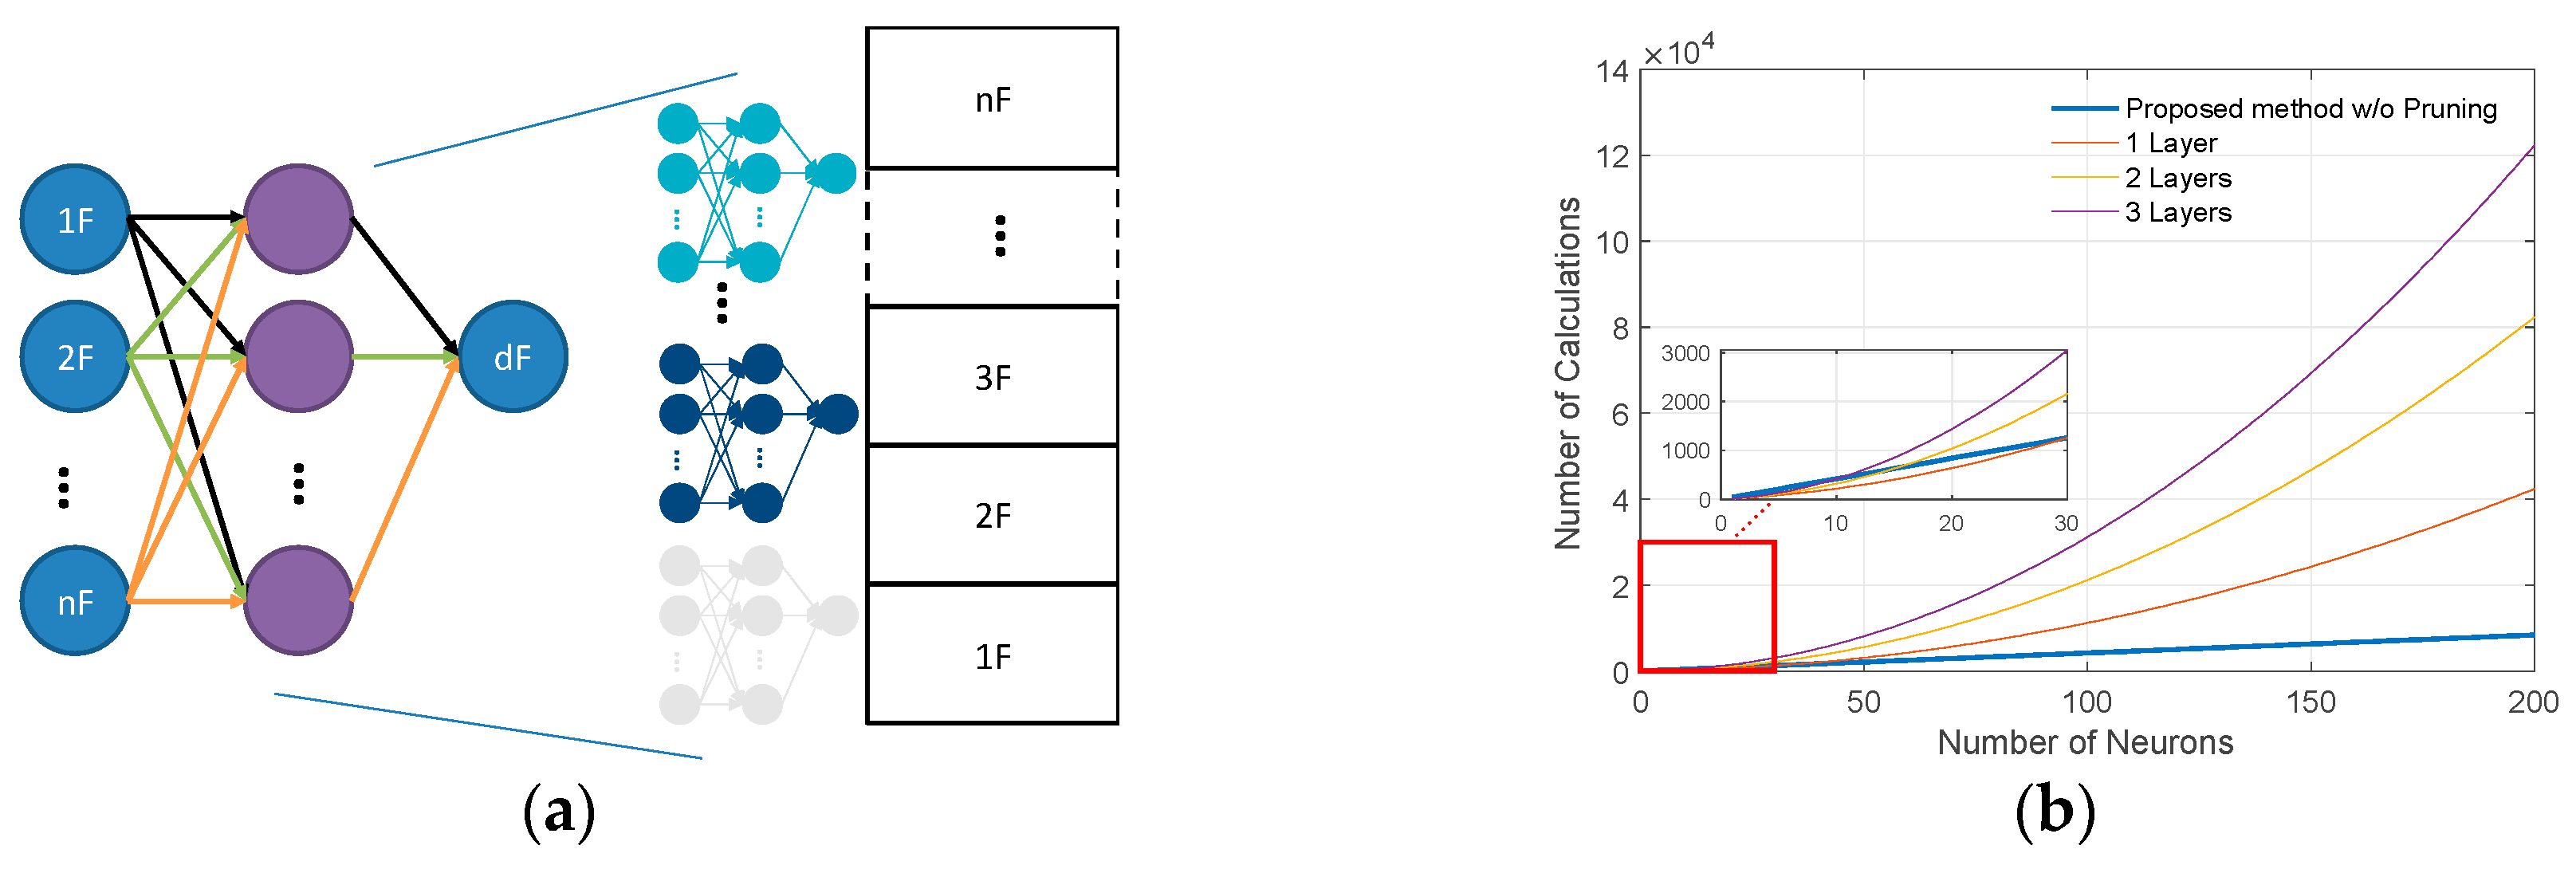
2.3. Artificial Neural Network Model for Damage Detection

An artificial neural network (ANN) typically consists of three primary components: the input layer, hidden layers, and the output layer. To ensure stable and efficient training, it is recommended that both input and output data be normalized, commonly within a fixed range such as [−1, 1]. The number of hidden layers is determined based on the complexity of the problem, with deeper architectures often employed for capturing intricate nonlinear relationships. Each neuron within the hidden layers utilizes a consistent activation function. In this study, the hyperbolic tangent sigmoid function is introduced to address the highly nonlinear complex patterns between features and responses, defined as
y p = 1 e 2 x p 1 + e 2 x p ,           y p [ 1 ,   1 ]
where the subscript “p” represents the neurons. During training, the initial parameters (i.e., weights and biases) in neurons are determined using the Nguyen–Widrow method [32]. Then, the training process uses a loss function for evaluation such as
w ^ , b ^ = a r g m i n w , b t F ( I n , w , b ) 2
where w and b are the weights and biases, respectively; w ^ and b ^ are the optimal weights and biases, respectively; I n and t are the input and the target, respectively; F ( * ) denotes the processing steps in the neural network. After each epoch, the errors are back-propagated to update the weights and biases. Finally, the model is successfully trained when the loss is lower than the pre-defined threshold.
In this study, each neural network within the proposed array is designed with a single hidden layer and is tasked with predicting the damage level of an individual story, as illustrated in Figure 3a. To assess computational efficiency, the proposed neural network array is compared to a single neural network that performs multi-story damage prediction using the same total number of neurons.
As depicted in Figure 3b, the proposed architecture requires significantly fewer computation steps, particularly when the number of neurons per network is sufficiently large. This comparison is based on an example with identical input dimensions (i.e., six inputs) for both network configurations. The zoomed-in plot in Figure 3b further highlights the superior computational efficiency of the neural network array over the monolithic single-network model.

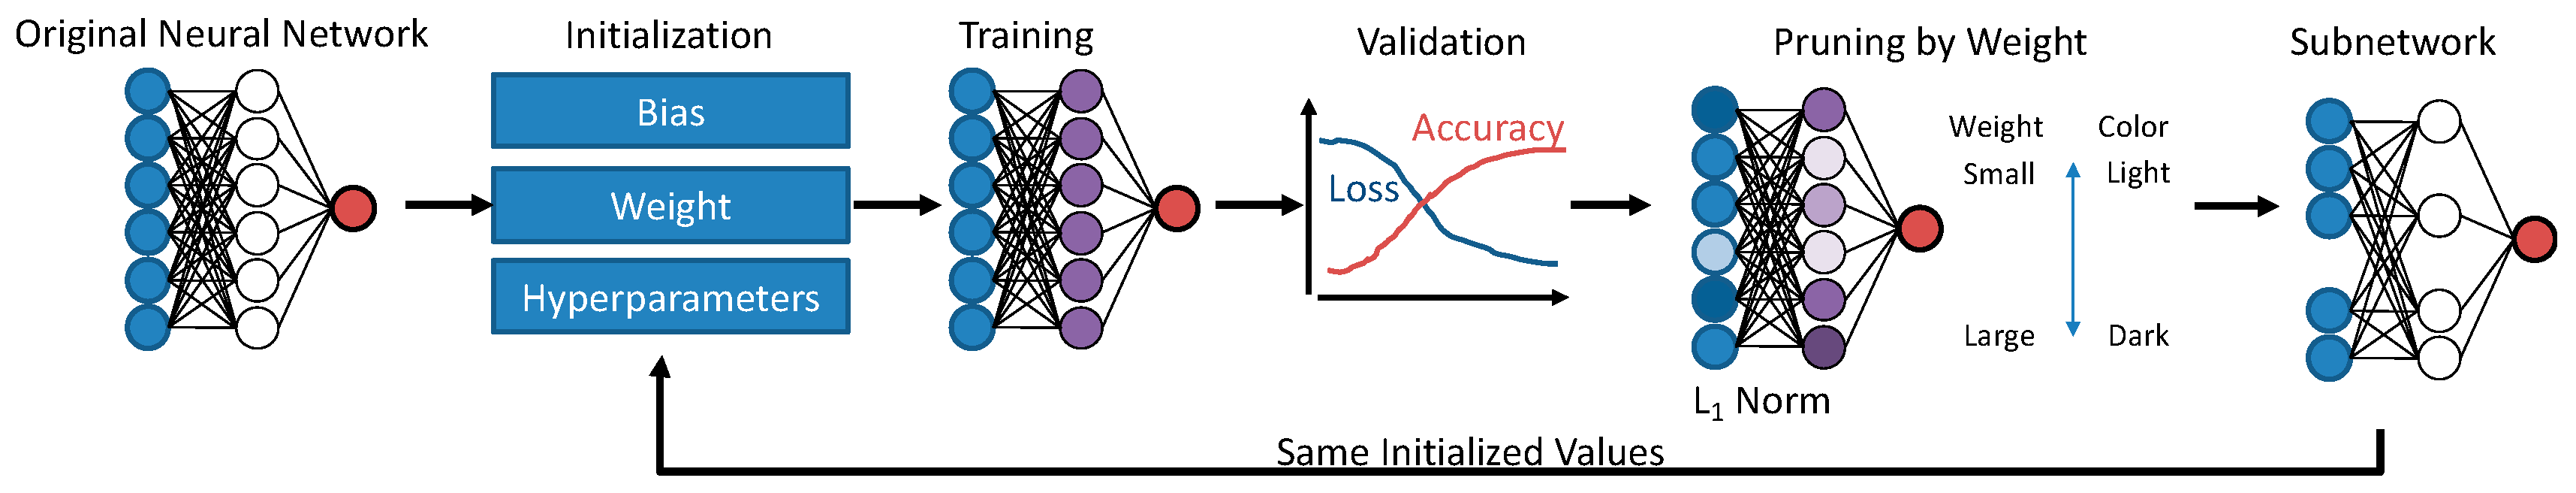
2.4. Introduction to Lottery Ticket Hypothesis

A dense neural network array can be more computationally efficient and more feasible for practical applications. Most neural networks have many neurons with zero weights, and then the neural network branches can be pruned and compressed [33]. Thus, the Lottery Ticket Hypothesis assumes that some subnetworks in a dense neural network can provide similar test accuracy with fewer parameters (i.e., neurons). The subnetworks can be iteratively pruned from the original neural network, as shown in Figure 4. After training the original network, the neuron participation is calculated through L1 norm such as
P = i = 1 n r o w j = 1   n c o l | w i , j |
where P is the L1 norm; w i , j is the i-th and j-th weight of a filter with a dimension of n r o w × n c o l in the neural network. By sorting all L1 norms, those neurons that have participation lower than a certain threshold and/or within a lower pruning proportion will be eliminated. Then, the initial weights of the original network are utilized in the pruned network which is re-trained using the same hyperparameters. The initial weights are considered to be the “winning ticket”. The best-pruned network is selected after pruning the network iteratively. More details of the network pruning using LTH can be found in [28].

3. Numerical Study

A six-story building model is developed in this numerical example to demonstrate the implementation of neural network pruning and evaluate the performance of the proposed damage detection method. The process includes a detailed description of the construction of the neural network array and the application of the network pruning procedure based on the Lottery Ticket Hypothesis. Finally, the effectiveness and advantages of the proposed approach are assessed through comparative analysis and performance metrics.

3.1. Preparation of Training Samples

In this study, a simplified six-story building model, as illustrated in Figure 5a, is established by Equations (1) and (2). The Young’s modulus of all beams, columns, and floors is 45 kPa. The column height, beam length, and floor width are all 0.225 m. The moments of inertia of columns, beams, and floors are 4.75 × 10 5 m−4, 1.41 × 10 8 m−4, and 1 × 10 3 m−4. The phase angle differences are generated by Equations (3) and (5) from absolute floor accelerations, and the FRFs of the intact building are illustrated in Figure 5b. A total of 441 frequency points is employed in the phase differences because 0.1–4.5 Hz while 0.01 Hz/point is used for the range and resolution.
Table 1 summarizes the dataset generated from the simplified building model, categorized into single-story, multiple-story, and randomized-story damage cases to ensure diversity in damage levels and configurations. For the single-story damage category, five damage levels, ranging from 0% to 90% stiffness reduction, are uniformly distributed. By adjusting the stiffness of specific stories in the simplified building model, story damage is simulated with different degrees of stiffness reduction. To ensure numerical stability, the maximum allowable stiffness reduction is limited to 90%. For each damage level, 1000 samples are randomly generated, resulting in a well-balanced dataset.
For the multiple-story damage category, six predefined damage levels (see Table 1) are used to generate 46,656 possible combinations, covering damage scenarios from two-story to full-story damage. Additionally, 20,000 samples are randomly generated to represent randomized-story damage patterns, further enhancing the generalization capacity of the model. In total, the final dataset comprises 96,656 samples, enabling robust training and validation of the proposed neural network array.

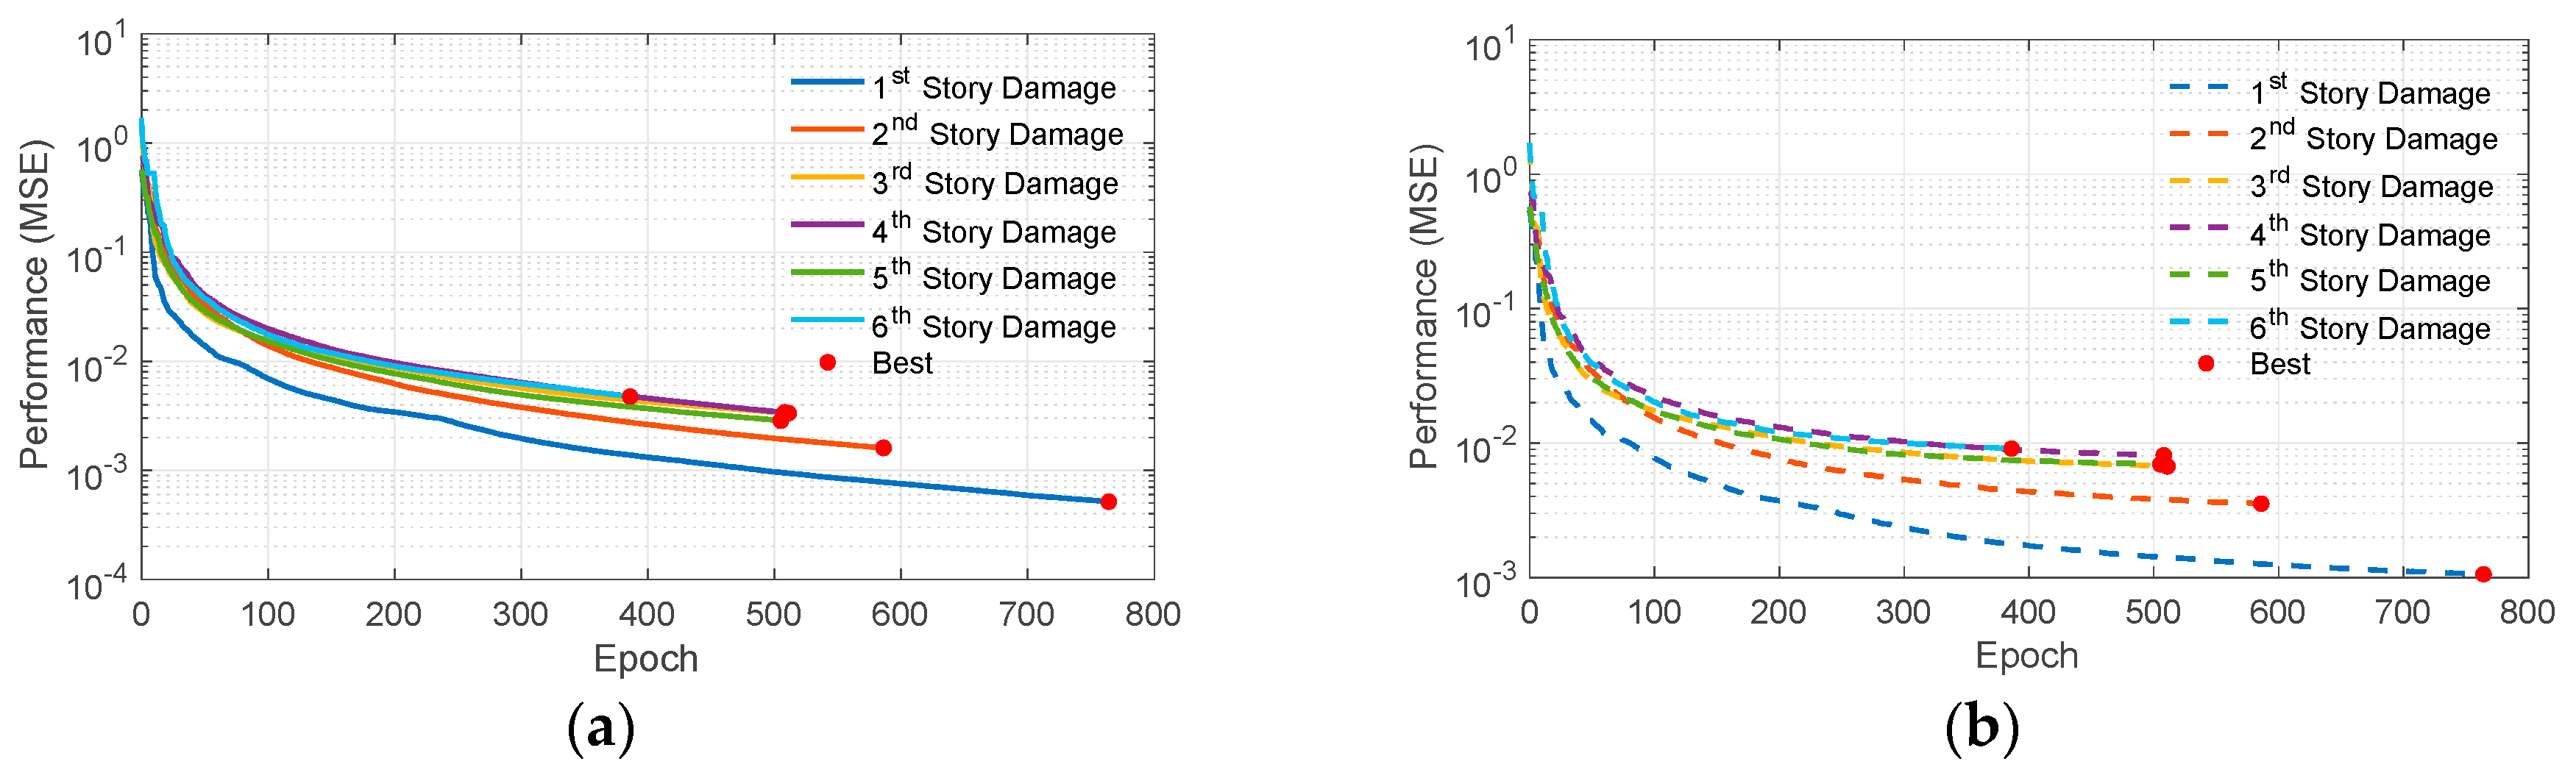
3.2. Training and Validation Process of Initial Neural Network Array

The dataset described in Table 1 is randomly partitioned into training, validation, and testing subsets using a 64–16–20% split, corresponding to 61,860, 15,465, and 19,331 samples, respectively. To ensure a balanced representation of damage levels, particularly within the single-story damage category, samples for each predefined level are proportionally selected, i.e., 64% of Level-1 samples, 64% of Level-2 samples, and so forth, are allocated to the training set. For the multiple-story and randomized damage cases, samples are similarly divided following the same ratio. Prior to training, damage levels ranging from 0% to 90% stiffness reduction are linearly normalized to the range [−1, 1], in accordance with best practices for neural network output scaling. The training process is conducted on a machine configured with an Intel® Core™ i7–8700 CPU, an NVIDIA GeForce GTX 1060 GPU (6 GB), and 48 GB of RAM. The proposed neural network framework is implemented in MATLAB (R2020) [34].
Table 2 presents the hyperparameters utilized during the training process. These values are adopted from reference [35] and further fine-tuned based on validation performance. The network weights are initialized using the default random initialization method, and the hyperbolic tangent sigmoid function is applied as the activation function. During training, the initial weight and bias values are preserved and consistently reused throughout the pruning iterations. Moreover, the scaled conjugate gradient backpropagation algorithm is employed as the learning algorithm. In this study, six neural networks are configured, each with a single hidden layer comprising 192 neurons, to estimate single-story damage in terms of stiffness reduction percentages. Through estimating the extent of stiffness reduction, the severity of structural damage is inferred. The frequency response function phase responses from all floor accelerations are used as inputs to each network. These networks are labeled Model 1 to Model 6, corresponding to damage levels from the first story to the sixth story.
As shown in Figure 6, the low mean square errors (MSEs) across the six networks indicate that the models are successfully trained. After converting the predicted values back to the 0–90% stiffness reduction range, the root-mean-square errors (RMSEs), evaluated on the test dataset, are 1.43%, 2.65%, 3.69%, 4.22%, 3.70%, and 4.26% for the first through sixth stories, respectively, demonstrating the effectiveness of the neural network array in estimating damage.

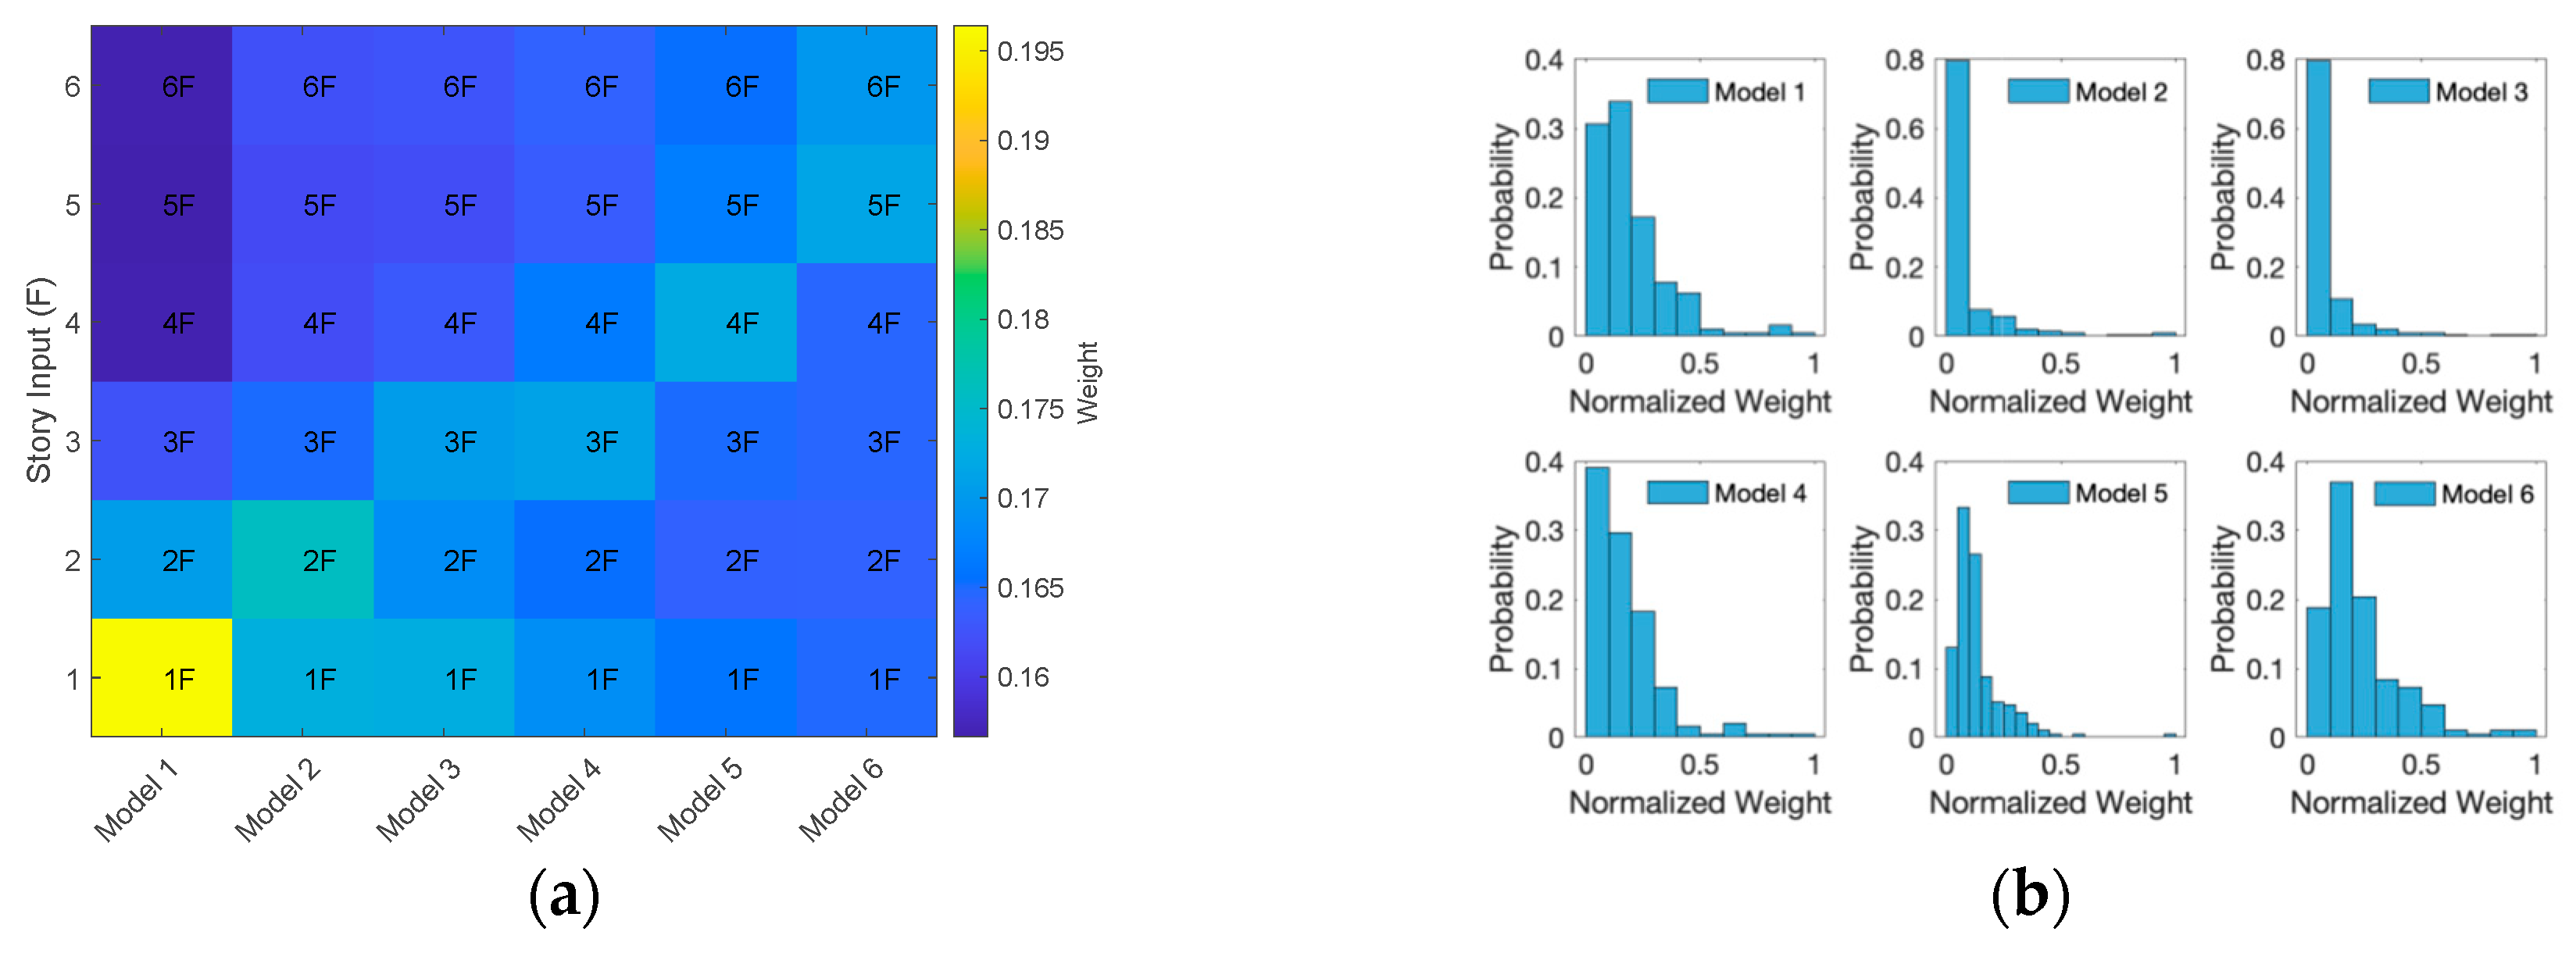
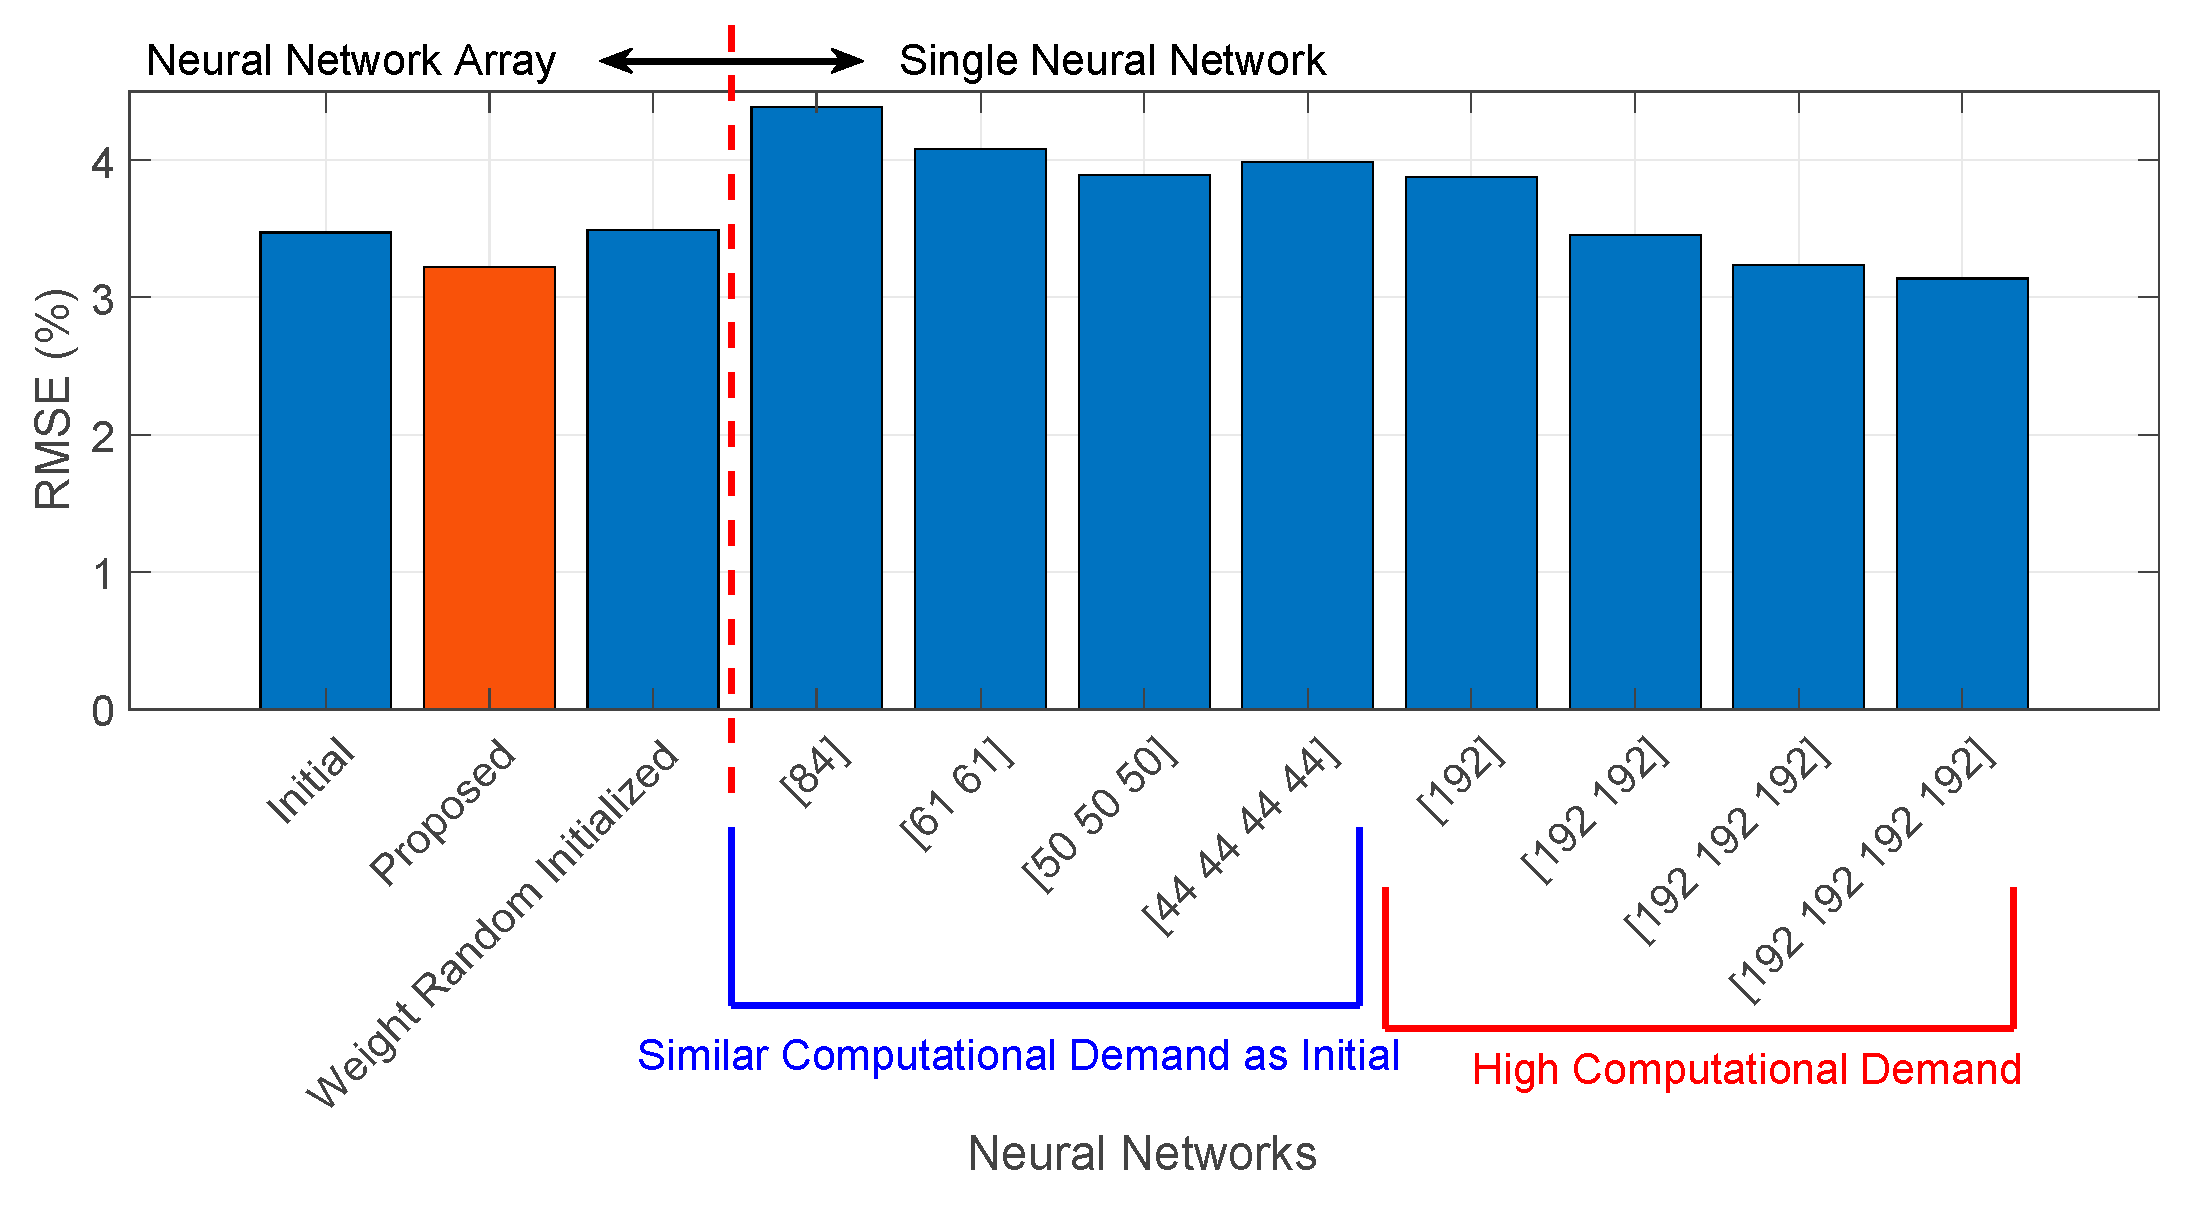
3.3. Neural Network Pruning Using Lottery Ticket Hypothesis

Figure 7a illustrates neuron weight participation across the original neural network array using the L1 norm. The L1 norm of input layer weights reflects the relative sensitivity of FRF phase responses to damage in specific stories. For example, in Model 1, the phase responses from the first and second stories exhibit notably higher weight magnitudes, suggesting greater influence in estimating first-story damage. In contrast, Model 6 shows a more uniform distribution of input weight contributions, indicating that all floor responses contribute similarly to sixth-story damage prediction.
Figure 7b presents the histograms of hidden layer neuron weights for all models. The distributions are right-skewed toward zero, indicating a high frequency of near-zero weights. This result implies that a significant portion of neurons contribute minimally to model output and may be pruned without adversely affecting performance. The presence of numerous low-magnitude weights confirms the potential for model compression, which motivates the application of network pruning techniques such as the Lottery Ticket Hypothesis.
A pruning proportion of 10% per iteration is applied in the network pruning process. Figure 8 presents the performance of each iterative pruning step using the Lottery Ticket Hypothesis and summarizes the final model evaluation on the test dataset. In each iteration, one input story response is removed, with a maximum of four pruned inputs allowed. Note that a sufficiently small learning rate is required to ensure effective pruning and model convergence.
Figure 8a shows that the RMSE on the test dataset for Model 1 varies with different pruning percentages of the network weights. Each curve corresponds to a specified number of input story responses that are removed before applying parameter pruning. The results indicate that input selection has a significant influence on accuracy, with the model pruned by removing three input responses achieving the lowest RMSE on the test dataset. In contrast, the model without input reduction shows the highest RMSE. This proves that pruning not only reduces the network size, but also improves prediction performance, as evidenced by a decrease in RMSE. This improvement is attributed to the reduction in model complexity and overfitting risk. By eliminating redundant inputs and low-contributing neurons, the network becomes more focused and generalizable. This outcome aligns with the findings of Frankle and Carbin [28], who demonstrated that smaller, well-initialized subnetworks can match or exceed the performance of larger, overparameterized models.
Figure 8b presents the final results of the best-performing pruned neural networks for all six models. The low mean errors across the models demonstrate the accuracy of the pruned networks in estimating stiffness reduction percentages, while the low standard deviations indicate consistent performance across a variety of damage scenarios, reflecting the precision and robustness of the proposed approach.
The architectural details of the final pruned networks are summarized in Table 3. The number of neurons in the hidden layers has been significantly reduced from the original 192 to 17, 14, 37, 173, 141, and 141 for Model 1 through Model 6, respectively. These results suggest that lower-story damage can be accurately predicted with fewer neurons and input features, while higher-story damage requires a greater number of neurons and more comprehensive input data from other stories to achieve comparable performance to the original, unpruned networks.
Moreover, the test dataset is divided into three portions such as single-story damage, multiple-story damage, and false-positive datasets, and these datasets are evaluated by RMSE and listed in Table 4. The errors of these datasets are calculated by
R M S E S = i = 1 n s d ^ i d i 2 / n s ,   R M S E M = i = 1 n m d ^ i d i 2 / n m R M S E F = i = 1 n f d ^ i d i 2 / n f ,   R M S E A L L = i = 1 n d ^ i d i 2 / n
where the subscripts “S”, “M”, “F”, and “ALL” represent single-story damage, multiple-story damage, false-positive, and full dataset, respectively; n s , n m , and n f represents the number of samples from each set within the full n samples; d and d ^ denote the target and estimated stiffness reduction percentage. The false-positive dataset describes the estimation errors when damage occurs in other stories instead of the selected one. As a result, utilizing the proposed method yields better performance after pruning by LTH as compared to the initial network array, and all models have an overall RMSE lower than 5% of stiffness reduction percentages.
Figure 9 compares the performance of the proposed method against several alternative neural network configurations, including single multi-layer neural networks with varying computational complexities and the best-pruned network architecture retrained from random initialization without applying the Lottery Ticket Hypothesis.
The results demonstrate that the proposed pruned neural network array, trained via LTH, achieves prediction accuracy comparable to a deep neural network with four layers and 192 neurons, while offering substantially reduced computational cost. Moreover, the figure highlights the critical role of LTH in effective network pruning. When the same pruned architecture is retrained from scratch without LTH, the prediction errors notably increase, indicating that the initialization from the winning ticket is essential for preserving performance after pruning. These findings verify that the proposed method strikes an effective balance between model efficiency and predictive accuracy, reinforcing its suitability for practical structural damage detection tasks.

4. Experimental Verification

The proposed method is applied to a scaled twin-tower building for experimental verification. Although shake table tests cannot fully replicate real-world noise and variability, they still capture key dynamic characteristics [36] (i.e., natural frequency and phase angle). A series of tests is carried out in this experiment to introduce accumulated damage in particular to the first story. An array of eight neural networks is established and pruned by LTH. Finally, the damage detection performance using the proposed method is discussed.

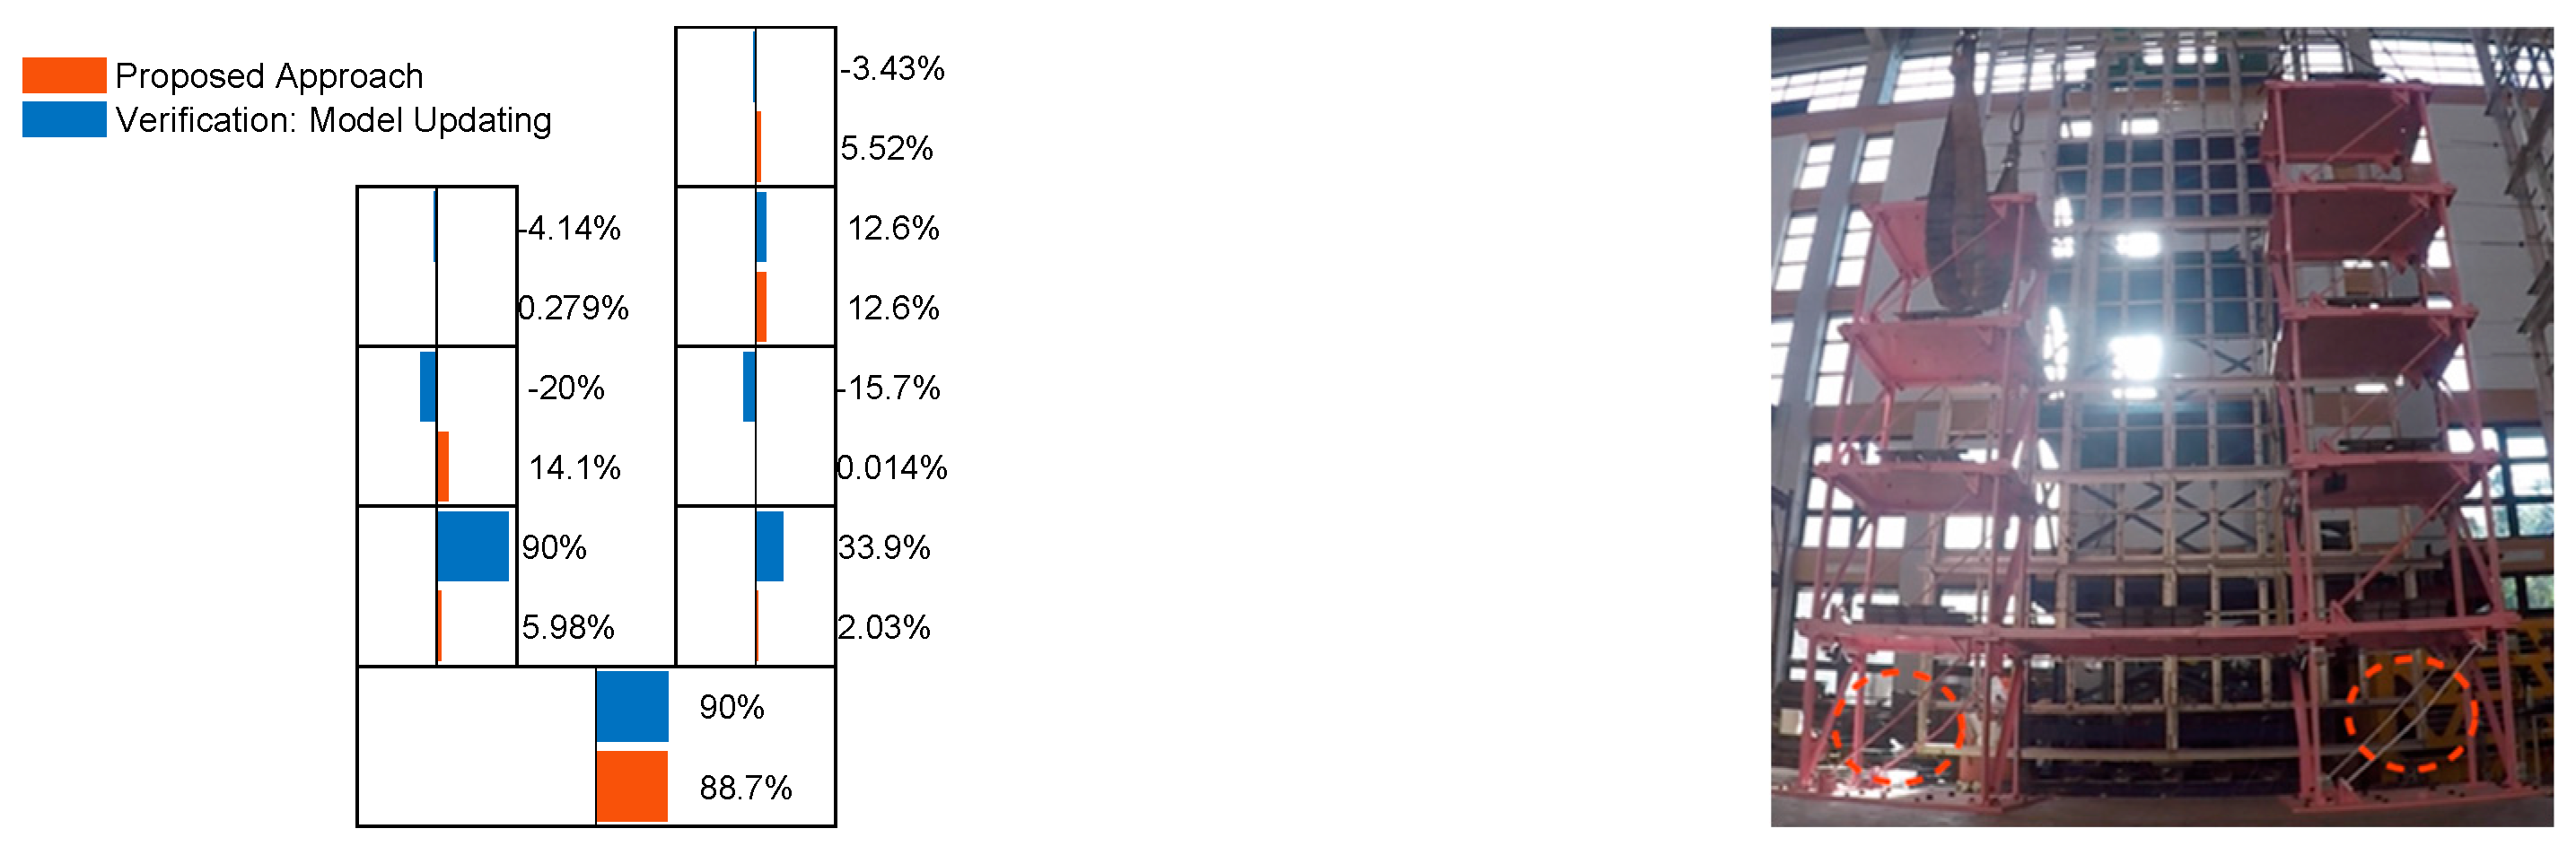
4.1. Experimental Setup

The scaled model structure is designed to be geometrically representative of a full-scale office building, as illustrated in Figure 10a. The twin-tower steel-frame model comprises a five-story tower on the right and a four-story tower on the left, connected on the first floor by a rigid plate to simulate interaction between the towers (see Figure 10b). Each tower is securely fixed on the shake table. Each story measures 1.50 m × 1.10 m × 1.17 m, and a 500 kg mass block is added to each floor to simulate floor loading. The columns are fabricated from A36 steel and have I-shaped cross-sections with 100 mm × 5 mm webs and 30 mm × 7 mm flanges. To provide lateral stability, L-shaped braces are installed in a direction perpendicular to the excitation. In the direction of excitation, two types of tube braces are used: (1) tubes with a 19.0 mm diameter and 1.2 mm thickness, and (2) tubes with a 21.3 mm diameter and 2.0 mm thickness. Structural damage is simulated by replacing strong braces with weaker tube braces in the first stories of both towers along the excitation direction. Regarding the installation of measuring instruments, two linear variable differential transformers (LVDTs) are installed on both sides of each floor along the vibration direction. Single-axis accelerometers are placed at each corner on the same two sides. Each accelerometer is a Setra Model 141 with an operational frequency range of 0 to 300 Hz. A total of 22 LVDTs and 22 accelerometers are installed. Acceleration responses at the floor levels and ground are recorded using accelerometers operating at a sampling rate of 200 Hz, following the methodology outlined by [37].
Figure 10c outlines the experimental test plan. Two types of unidirectional ground excitations are applied to the structure: band-limited white noise (BLWN) and synthetic earthquake records. The BLWN excitation is conducted with a duration of 120 s and a peak ground acceleration (PGA) of 50 Gal, serving as a baseline input for capturing the building’s dynamic characteristics. The seismic input uses the near-fault ground motion of the Chi-Chi earthquake measured at the TCU071 station (denoted as TCU071). To induce varying levels of structural damage, the seismic excitation is applied incrementally, with increasing PGA values. This staged approach enables controlled evaluation of the damage detection method under progressive deterioration. Phase differences are computed from the measured acceleration responses during the BLWN tests, which are then used as inputs to the proposed neural network array. The method is applied to identify damage locations and quantify damage levels, validating its effectiveness under realistic experimental conditions.

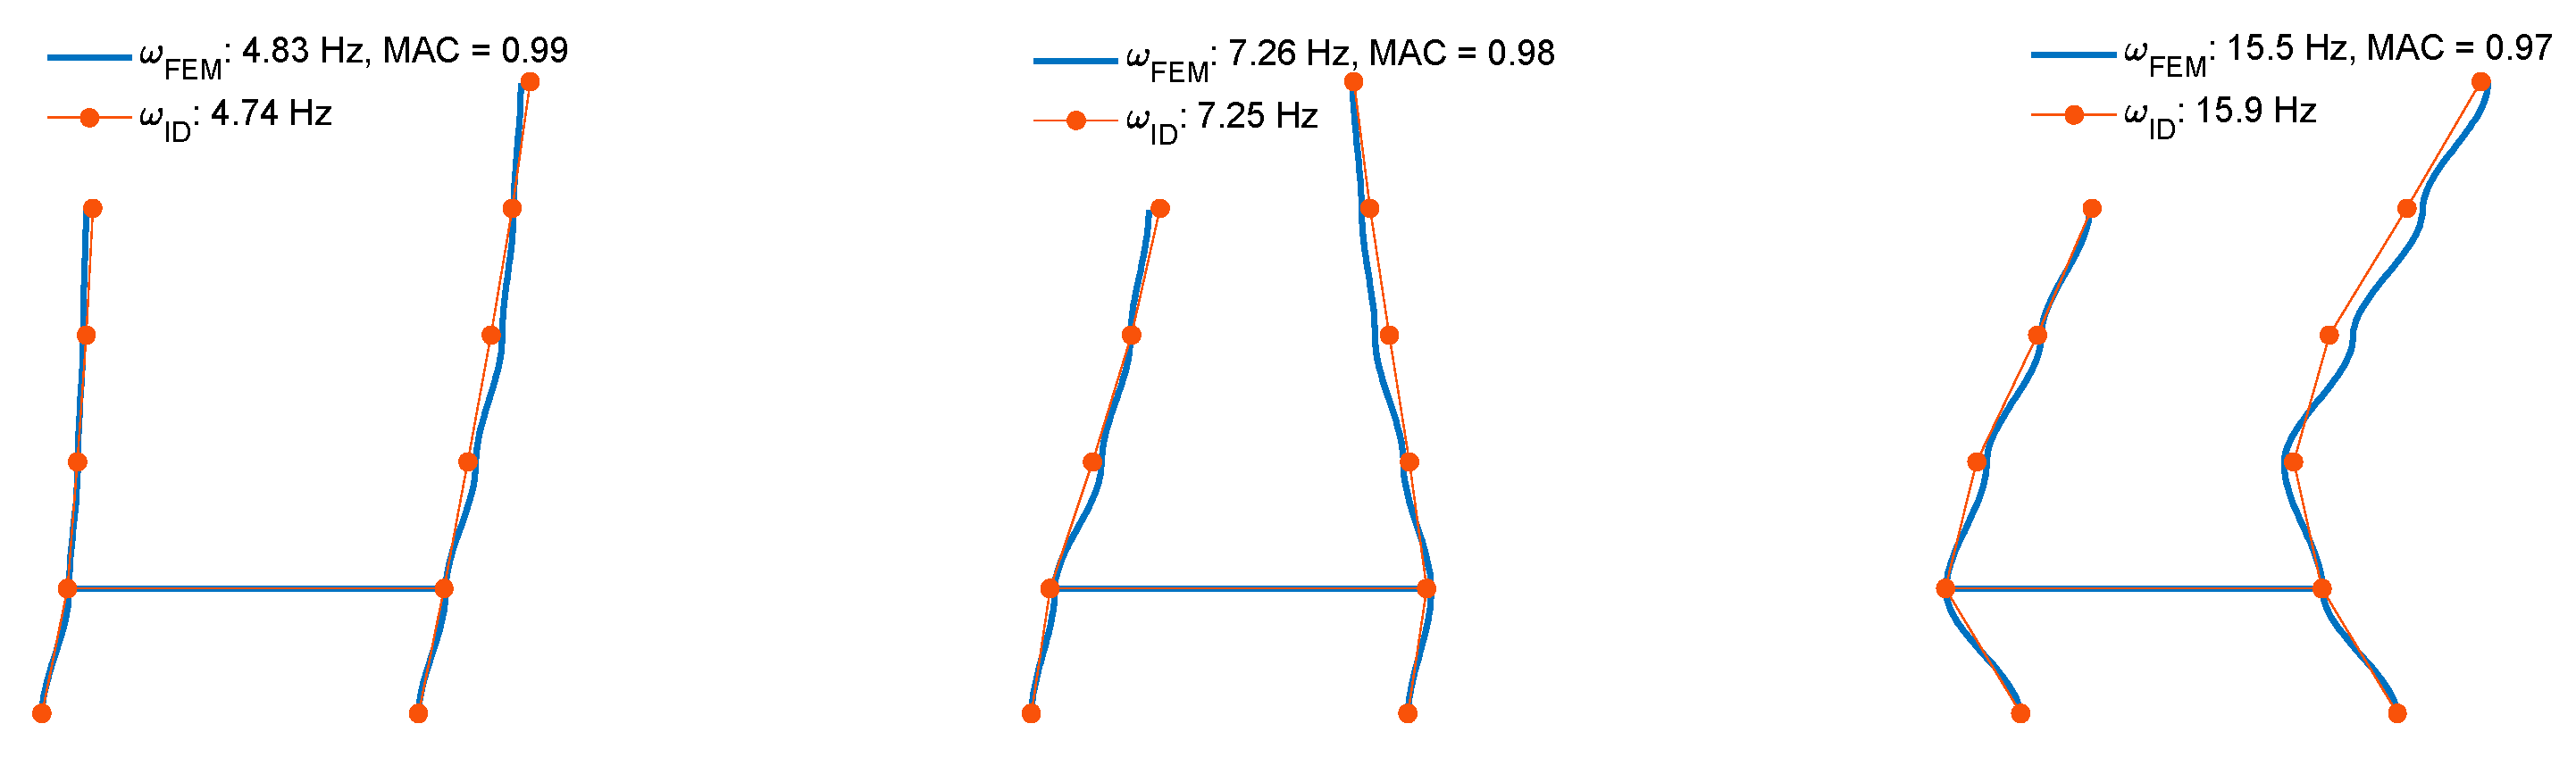
4.2. Development of Simplified Numerical Model

To fully capture the dynamic behavior of the twin-tower structure, the simplified model introduced in the previous section is utilized. The twin tower is considered with 8 degrees of freedom, whereas the first story of both towers is considered to be rigidly connected. The stiffness and mass matrices are initially determined using the geometric and material properties. Moreover, the first three modal properties (i.e., natural frequencies and mode shapes) are employed to tune or update the numerical model. The objective function used in the model updating is given by
min α | F α | 2 2 = m i n α ( i = 1 3 | ω e i ω m i ω e i | 2 + i = 1 3 | Φ e i Φ m i | 2 )
where α is a vector of factors that tune the story stiffness; Φ i is the i-th mode shape corresponding to the natural frequency ω n i ; the subscripts “m” and “e” indicate the modal properties extracted from the simplified model and experiment, respectively. Note that the experimental modal properties are identified from the frequency-domain subspace system identification [38]. As shown in Figure 11, the numerical mode shapes have a good agreement with the identification results, and the overall modal assurance criterion (MAC) values [39] are over 0.97.

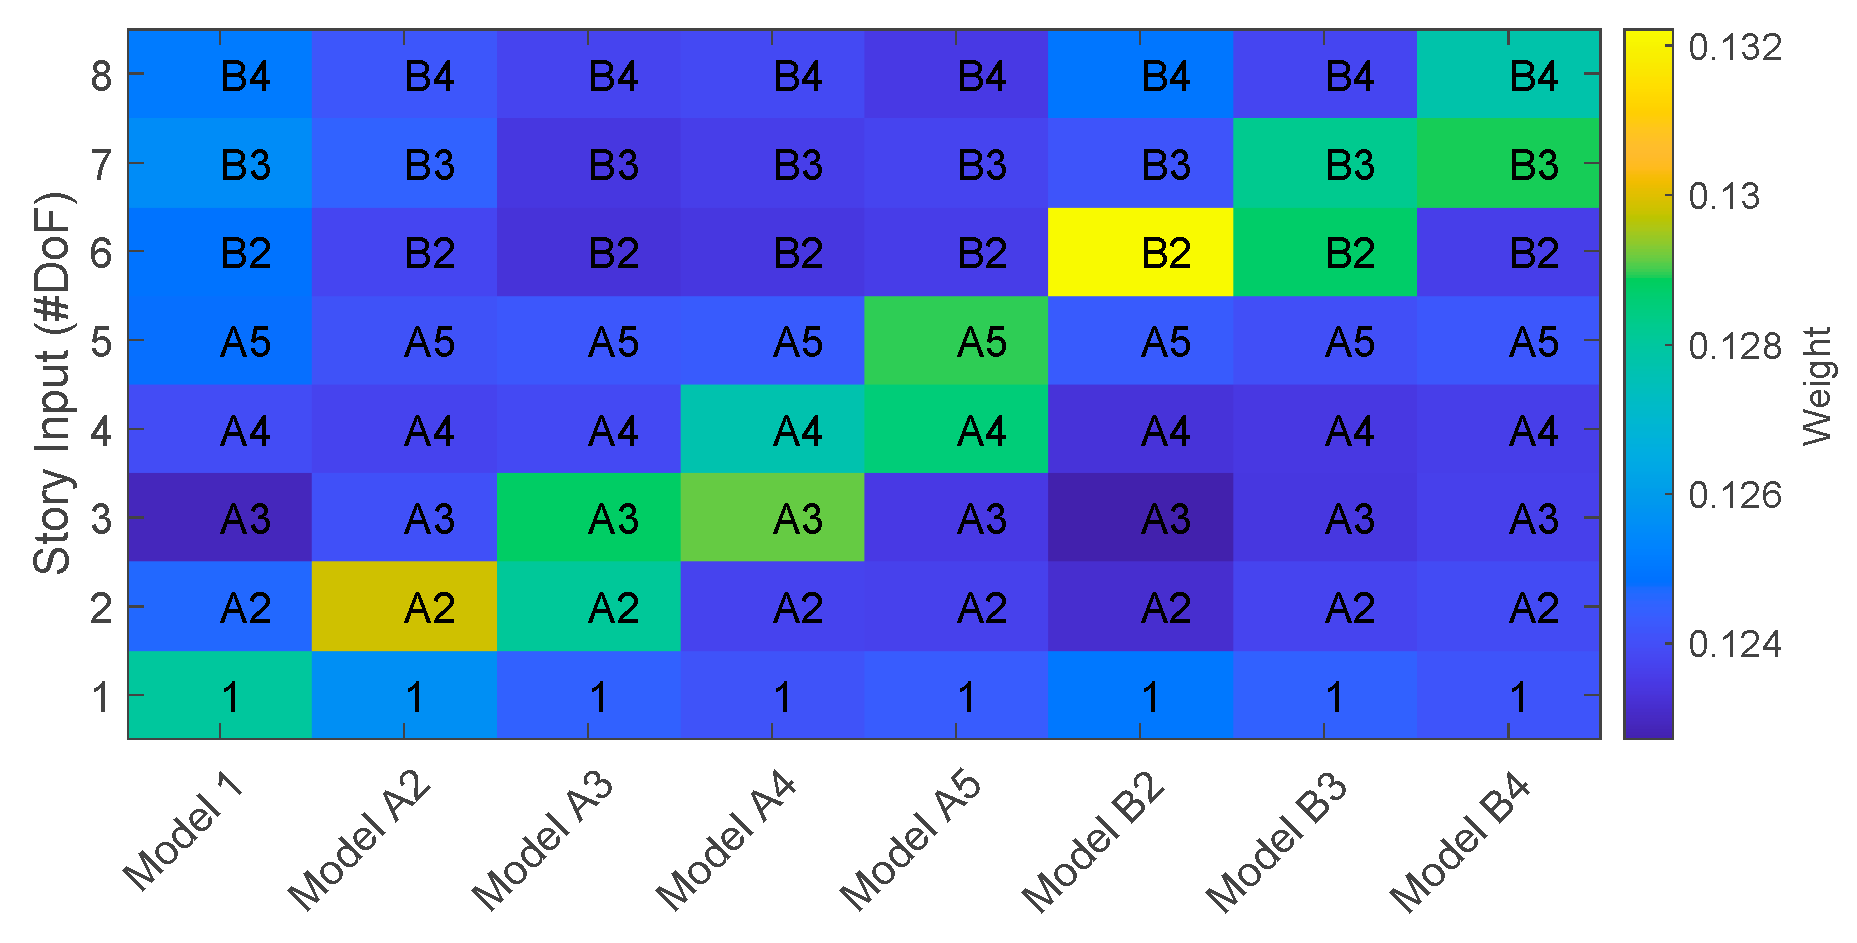
4.3. Establishment of Proposed Network Array

An array of eight neural networks is constructed to evaluate the damage level of each individual story. The models are designated as Model A# and Model B# for the five-story and four-story towers, respectively, where “#” indicates the corresponding story being assessed. Since the first floors of both towers are structurally connected, a single network, Model 1, is used to detect damage on the first floor.
Figure 12 visualizes the weight distributions of the initial network array, with lighter colors indicating higher-weight contributions and darker shades of blue representing lower contributions. The results show that FRF phase differences from a specific story exhibit a strong influence on detecting damage in that story, reinforcing the story-level sensitivity of the networks. Moreover, for damage located in higher stories, the responses from the opposite tower contribute minimally, suggesting that such cross-tower inputs can be pruned without sacrificing accuracy. These findings verify the feasibility of network pruning to reduce computational complexity while preserving the performance of the neural network array in story-specific damage detection.
Similar to the numerical study, synthetic damage cases are generated and classified into three categories: single-story, multiple-story, and randomized-story damage, as summarized in Table 5. A total of 125,536 samples are produced and subsequently partitioned into training (56%), validation (24%), and test (20%) datasets to ensure a balanced distribution across damage scenarios.
Table 6 presents a performance comparison between the initial and pruned neural networks, employing the same pruning strategy based on the LTH as used in the numerical example. Initially, the neural network array is configured with eight input features and 220 neurons per model. Following pruning, the RMSE decreases by approximately 0.2% to 2%, depending on the model, while the network complexity is reduced by up to 63%.
Compared to the numerical case, the pruning rate is slightly lower for the twin-tower building network array, likely due to the increased structural complexity and inter-tower interaction. Nevertheless, the proposed pruning approach effectively enhances model accuracy while significantly reducing computational demands, reinforcing its applicability to more complex experimental structures.

4.4. Damage Detection Results

Figure 13 compares the estimated story stiffness reduction percentages obtained using the proposed method and the conventional model updating technique by Equation (10) for test plan Case 5. In the first story, the proposed method and model updating estimate stiffness reductions of approximately 88% and 90%, respectively. These estimates are consistent with the observed buckled braces, as shown in the corresponding photograph, where material properties yield a theoretical reduction of around 73%.
Notably, the proposed method demonstrates a lower false-positive rate in adjacent stories. For example, in stories A2 and B2, the proposed method predicts reductions of 33.9% and 90% using model updating, whereas the proposed approach yields lower and more realistic estimations, indicating better localization of damage.
Table 7 summarizes the estimated stiffness reductions across all test cases. The results reveal a progressive increase in stiffness reduction in the first story, ranging from 11.88% to 88.56%, and verify the ability of the method to capture accumulated damage over sequential tests. Other stories exhibit only minor variations, particularly in Cases 2–4, and the findings reinforce the capability of the proposed method to accurately detect both damage location and severity.
Structural damage detection based on dynamic characteristics is inherently relative. When a structure is previously in a relatively healthy state, any subsequent damage may induce detectable changes in modal properties, which can be identified through low-amplitude ambient vibrations in the real world. The effectiveness of this proposed method depends on whether the damage induces a measurable change in the structural dynamic characteristics. As demonstrated in the experimental validation (Case 2 to Case 4), even subtle shifts in frequency-related features can be successfully identified. Therefore, the proposed method is applicable as long as the damage produces detectable alterations in modal properties. In contrast, if the damage (e.g., superficial surface cracking) does not alter the global stiffness or mass distribution, the proposed method may fail to detect it.

5. Conclusions

In this study, a building damage detection method was proposed using a neural network array enhanced by branch pruning optimization via the Lottery Ticket Hypothesis. The approach involved developing a neural network array, with each network dedicated to predicting single-story damage, trained on synthetically generated data derived from a simplified dynamic model that accurately represented the behavior of an as-built structure, as formulated in Equations (1) and (2). The networks were subsequently pruned iteratively using LTH, resulting in an efficient and tailored architecture for structural damage detection.
In the numerical investigation, a six-story building model was used to evaluate the performance of the proposed method. The RMSEs for the testing data estimated by the six models were all below 5%. This result indicated that the proposed approach is feasible for predicting stiffness reduction percentages. In addition, under a similar computational cost, the proposed method achieved RMSEs that were approximately two to three times lower than those of the baseline neural network. The pruning process also successfully eliminated less informative inputs, thereby enhancing interpretability and reducing computational complexity. As demonstrated in Figure 9, the false-positive rate was notably lower than that of conventional methods and verified the robustness and precision of the pruned network architecture.
For experimental verification, the proposed method was applied to a twin-tower scaled steel-frame structure subjected to shake table tests. The weight heatmap results indicate that FRF phase differences from a given story are strongly correlated with the detection of damage in that same story. In contrast, responses from the opposite tower have limited influence on identifying damage in higher stories. This indicates that low-impact inputs can be efficiently removed during the pruning process. Although the complexity of the twin-tower structure leads to slightly higher RMSE values compared to the numerical simulation, the results after pruning show a noticeable improvement, with relative RMSE reductions ranging from approximately 0.2% to 2%. The detection results showed that the estimated stiffness reductions, closely with the observed physical damage and effectively, capture the progressive deterioration in the first story. Overall, the proposed method proves to be effective and efficient for estimating story-level stiffness reductions, offering a practical and scalable solution for post-earthquake building assessment.
While the proposed method demonstrated effective damage detection capabilities, several practical challenges remain to be addressed for real-world deployment. In particular, sensor noise and environmental effects potentially affect the robustness of the model. Future work will incorporate signal-to-noise ratios into the numerical model to better simulate real operating conditions. In addition, a key limitation of this study lies in its reliance on frequency-domain features under the assumption of stationary post-damage behavior. In real-world scenarios, especially during the early onset of damage or under evolving structural conditions, responses may be highly non-stationary and nonlinear. While the proposed model performs well within the scope of the assumed conditions, future research will investigate the use of non-stationary signal analysis techniques (e.g., Short-Time Impulse Response Function and the Stockwell Transform) to implement early-stage damage detection.

Author Contributions

Conceptualization, C.-M.C.; methodology, J.-Y.C. and C.-M.C.; validation, J.-Y.C.; formal analysis, J.-Y.C.; investigation, J.-Y.C.; resources, C.-M.C.; data curation, J.-Y.C. and C.-Y.L.; writing—original draft preparation, J.-Y.C. and C.-Y.L.; writing—review and editing, C.-M.C.; visualization, J.-Y.C.; supervision, C.-M.C.; project administration, C.-M.C.; funding acquisition, C.-M.C. All authors have read and agreed to the published version of the manuscript.

Funding

This research was funded by the National Science and Technology Council in Taiwan under grant numbers NSTC 112-2221-E-002-082 and NSTC 113-2625-M-002-009.

Data Availability Statement

The data presented in this study are available on request from the corresponding author.

Conflicts of Interest

The authors declare no conflicts of interest.

References

  1. Rytter, A. Vibration Based Inspection of Civil Engineering Structures. Ph.D. Dissertation, Aalborg University, Aalborg, Denmark, 1993. [Google Scholar]
  2. Bandara, R.P.; Chan, T.H.; Thambiratnam, D.P. Frequency response function based damage identification using principal component analysis and pattern recognition technique. Eng. Struct. 2014, 66, 116–128. [Google Scholar] [CrossRef]
  3. Liu, X.; Lieven, N.; Escamilla-Ambrosio, P.J. Frequency response function shape-based methods for structural damage localisation. Mech. Syst. Sig. Process. 2009, 23, 1243–1259. [Google Scholar] [CrossRef]
  4. Lee, U.; Shin, J. A frequency response function-based structural damage identification method. Comput. Struct. 2002, 80, 117–132. [Google Scholar] [CrossRef]
  5. Catbas, F.N.; Gul, M.; Burkett, J.L. Conceptual damage-sensitive features for structural health monitoring: Laboratory and field demonstrations. Mech. Syst. Sig. Process. 2008, 22, 1650–1669. [Google Scholar] [CrossRef]
  6. Azimi, A.; Eslamlou, A.D.; Pekcan, G. Data-driven structural health monitoring and damage detection through deep learning: State-of-the-art review. Sensors 2020, 20, 2778. [Google Scholar] [CrossRef]
  7. Ying, Y.; Garrett, H.J., Jr.; Irving, J.; Soibelman, L.; Harley, J.B.; Shi, J.; Jin, Y. Toward data-driven structural health monitoring: Application of machine learning and signal processing to damage detection. J. Comput. Civ. Eng. 2013, 27, 667–680. [Google Scholar] [CrossRef]
  8. Abdeljaber, O.; Avci, O. Nonparametric structural damage detection algorithm for ambient vibration response: Utilizing artificial neural networks and self-organizing maps. J. Archit. Eng. 2016, 22, 04016004. [Google Scholar] [CrossRef]
  9. Kostić, B.; Gül, M. Vibration-based damage detection of bridges under varying temperature effects using time-series analysis and artificial neural networks. J. Bridge Eng. 2017, 22, 04017065. [Google Scholar] [CrossRef]
  10. Abdeljaber, O.; Avci, O.; Kiranyaz, S.; Gabbouj, M.; Inman, D.J. Real-time vibration-based structural damage detection using one-dimensional convolutional neural networks. J. Sound Vib. 2017, 388, 154–170. [Google Scholar] [CrossRef]
  11. Huang, H.; Burton, H.V. Dynamic seismic damage assessment of distributed infrastructure systems using graph neural networks and semi-supervised machine learning. Adv. Eng. Softw. 2022, 168, 103113. [Google Scholar] [CrossRef]
  12. Lazaridis, P.C.; Kavvadias, I.E.; Demertzis, K.; Iliadis, L.; Vasiliadis, L.K. Structural damage prediction of a reinforced concrete frame under single and multiple seismic events using machine learning algorithms. Appl. Sci. 2022, 12, 3845. [Google Scholar] [CrossRef]
  13. Mousavi, Z.; Varahram, S.; Ettefagh, M.M.; Sadeghi, M.H.; Razavi, S.N. Deep neural networks-based damage detection using vibration signals of finite element model and real intact state: An evaluation via a lab-scale offshore jacket structure. Struct. Health Monit. 2021, 20, 379–405. [Google Scholar] [CrossRef]
  14. Ye, C.; Butler, L.; Calka, B.; Iangurazov, M.; Lu, Q.; Gregory, A.; Girolami, M.; Middleton, C. A digital twin of bridges for structural health monitoring. In Proceedings of the 12th International Workshop on Structural Health Monitoring, Stanford, CA, USA, 10–12 September 2019. [Google Scholar]
  15. Avci, O.; Abdeljaber, O.; Kiranyaz, S.; Hussein, M.; Gabbouj, M.; Inman, D.J. A review of vibration-based damage detection in civil structures: From traditional methods to machine learning and deep learning applications. Mech. Syst. Signal Process. 2021, 147, 107077. [Google Scholar] [CrossRef]
  16. Figueiredo, E.; Moldovan, I.; Santos, A.; Campos, P.; Costa, J.C.W.A. Finite element–based machine-learning approach to detect damage in bridges under operational and environmental variations. J. Bridge Eng. 2019, 24, 04019061. [Google Scholar] [CrossRef]
  17. Mousavi, Z.; Ettefagh, M.M.; Sadeghi, M.H.; Razavi, S.N. Developing deep neural network for damage detection of beam-like structures using dynamic response based on FE model and real healthy state. Appl. Acoust. 2020, 168, 107402. [Google Scholar] [CrossRef]
  18. Ritto, T.G.; Rochinha, F.A. Digital twin, physics-based model, and machine learning applied to damage detection in structures. Mech. Syst. Signal Process. 2021, 155, 107614. [Google Scholar] [CrossRef]
  19. Zhao, R.; Yan, R.; Chen, Z.; Mao, K.; Wang, P.; Gao, R.X. Deep learning and its applications to machine health monitoring. Mech. Syst. Signal Process. 2019, 115, 213–237. [Google Scholar] [CrossRef]
  20. Mangal, L.; Idichandy, V.G.; Ganapathy, C. ART-based multiple neural networks for monitoring offshore platforms. Appl. Ocean Res. 1996, 18, 137–143. [Google Scholar] [CrossRef]
  21. Mokhatar, S.N.; Shahidan, S.; Jaini, Z.M.; Kamarudin, A.F. An ensemble neural network for damage identification in steel girder bridge structure using vibration data. Civ. Eng. Archit. 2021, 9, 523–532. [Google Scholar]
  22. Dackerman, U.; Li, J.; Samali, B. Dynamic-based damage identification using neural network ensembles and damage index method. Adv. Struct. Eng. 2010, 13, 1001–1016. [Google Scholar] [CrossRef]
  23. Srivastava, N.; Hinton, G.; Krizhevsky, A.; Sutskever, I.; Salakhutdinov, R. Dropout: A simple way to prevent neural networks from overfitting. J. Mach. Learn. Res. 2014, 15, 1929–1958. [Google Scholar]
  24. Xu, Z.; Zhang, H.; Wang, Y.; Chang, X.; Liang, Y. L 1/2 regularization. Sci. China Inf. Sci. 2010, 53, 1159–1169. [Google Scholar] [CrossRef]
  25. Han, S.; Pool, J.; Tran, J.; Dally, W.J. Learning both weights and connections for efficient neural networks. arXiv 2015, arXiv:1506.02626v3. [Google Scholar]
  26. Zhou, X.; Venigalla, M.; Zhu, S. Bounding box approach to network pruning for efficient path search through large networks. J. Comput. Civ. Eng. 2017, 31, 04017033. [Google Scholar] [CrossRef]
  27. Wu, R.T.; Singla, A.; Jahanshahi, M.R.; Bertino, E.; Ko, B.J.; Verma, D. Pruning deep convolutional neural networks for efficient edge computing in condition assessment of infrastructures. Comput.-Aided Civ. Infrastruct. Eng. 2019, 34, 774–789. [Google Scholar] [CrossRef]
  28. Frankle, J.; Carbin, C. The lottery ticket hypothesis: Finding sparse, trainable neural networks. In Proceedings of the ICLR Workshop 2019, New Orleans, LA, USA, 6–9 May 2019. [Google Scholar]
  29. Girish, S.; Maiya, S.R.; Gupta, K.; Chen, H.; Davis, L.; Shrivastava, A. The Lottery Ticket Hypothesis for object recognition. In Proceedings of the Conference on Computer Vision and Pattern Recognition, Virtual Event, 19–25 June 2021. [Google Scholar]
  30. Ditommaso, R.; Ponzo, F.C. Automatic evaluation of the fundamental frequency variations and related damping factor of reinforced concrete framed structures using the Short Time Impulse Response Function (STIRF). Eng. Struct. 2015, 82, 104–112. [Google Scholar] [CrossRef]
  31. Ditommaso, R.; Mucciarelli, M.; Ponzo, F.C. Analysis of non-stationary structural systems by using a band-variable filter. Bull Earth Eng. 2012, 10, 895–911. [Google Scholar] [CrossRef]
  32. Pavelka, A.; Procházka, A. Algorithms for initialization of neural network weights. In Proceedings of the 12th Annual Conference, MATLAB, Prague, Czech Republic, 23–27 August 2004. [Google Scholar]
  33. LeCun, Y.; Denker, J.S.; Solla, S.A. Optimal brain damage. Adv. Neural Inf. Process. Syst. 1990, 2, 598–605. [Google Scholar]
  34. The MathWorks Inc. MATLAB Version 9 (R2021a); The MathWorks Inc.: Natick, MA, USA, 2020. [Google Scholar]
  35. Chou, J.Y.; Chang, C.M. Low-story damage detection of buildings using deep neural network from frequency phase angle differences within a low-frequency band. J. Build. Eng. 2022, 55, 104692. [Google Scholar] [CrossRef]
  36. Zhang, F.L.; Ventura, C.E.; Xiong, H.B.; Lu, W.S.; Pan, Y.X.; Cao, J.X. Evaluation of the dynamic characteristics of a super tall building using data from ambient vibration and shake table tests by a Bayesian approach. Struct. Contr. Health Monitor. 2018, 25, e2121. [Google Scholar] [CrossRef]
  37. Chou, J.Y.; Chang, C.M. Decentralized damage detection of seismically-excited buildings using multiple banks of Kalman estimators. Adv. Eng. Inform. 2018, 38, 1–13. [Google Scholar] [CrossRef]
  38. Chou, J.Y.; Chang, C.M. Modal tracking of seismically-excited buildings using stochastic system identification. Smart Struct. Syst. 2020, 26, 419–433. [Google Scholar]
  39. Pastor, M.; Binda, M.; Harčarik, T. Modal assurance criterion. Procedia Eng. 2012, 48, 543–548. [Google Scholar] [CrossRef]
Figure 1. Flowchart of proposed damage detection method.
Buildings 15 02052 g001
Figure 2. Illustration of a simplified building model.
Buildings 15 02052 g002
Figure 3. Illustration of neural network array: (a) architecture and (b) computational expense.
Buildings 15 02052 g003
Figure 4. Procedure of Lottery Ticket Hypothesis.
Buildings 15 02052 g004
Figure 5. Six-story building model used in the numerical study: (a) photo and (b) frequency response functions.
Buildings 15 02052 g005
Figure 6. Performance curves: (a) training and (b) validation.
Buildings 15 02052 g006
Figure 7. Neuron participation by means of weights: (a) input layer and (b) hidden layer.
Buildings 15 02052 g007
Figure 8. Performance of the neural network array with LTH: (a) RMSE of Model 1 per LTH iteration and (b) final results in terms of error mean and standard deviation.
Buildings 15 02052 g008
Figure 9. Performance comparison among various models, where the numbers in the brackets indicate the number of neurons and hidden layers used.
Buildings 15 02052 g009
Figure 10. Damage detection experiment of the twin-tower building: (a) photo of the as-built building, (b) scaled twin-tower model building, and (c) test plan.
Buildings 15 02052 g010
Figure 11. Comparison of mode shapes of the structure and simplified model.
Buildings 15 02052 g011
Figure 12. Weight distributions in the initial array of eight neural networks.
Buildings 15 02052 g012
Figure 13. Damage detection results from Case 5 in test plan.
Buildings 15 02052 g013
Table 1. Damage cases used in the numerical study.
Samples
Damage LevelSingle-Story Damage Multiple-Story DamageRandomized
Level 1 (0–18%)1000 (Random)2 (0%, 18%)-
Level 2 (18–36%)1000 (Random)1 (36%)-
Level 3 (36–54%)1000 (Random)1 (54%)-
Level 4 (55–73%)1000 (Random)1 (72%)-
Level 5 (73–90%)1000 (Random)1 (90.0%)-
Total Count 5000 × 6 = 30,000 46,656 combinations20,000
Table 2. Training hyperparameters.
HyperparameterValue
Maximum Epoch3000
Mean Square Error (MSE) Threshold 10 8
Learning Rate 10 3
Batch Size128
Momentum0.9
Learning Rate Drop Factor0.1
Table 3. Neural networks before and after pruning by LTH.
Before PruningAfter Pruning
Network NameInput LayerHidden LayerRMSE
(%)
Input Layer—Floor ResponseHidden Layer—Neurons (Pruning Ratio)RMSE
(%)
Model 1All story responses192 neurons1.428%1F, 2F, 3F17 (91%)0.881%
Model 22.650%1F, 2F, 3F14 (93%)1.831%
Model 33.690%1F, 2F, 3F37 (81%)3.152%
Model 44.218%1F, 2F, 3F, 4F, 6F173 (11%)4.217%
Model 53.699%1F, 3F, 4F, 5F, 6F141 (27%)3.653%
Model 64.259%All Stories141 (27%)4.122%
Table 4. RMSE comparison between a three-layer neural network and the proposed method with similar computational expense.
R M S E S (%) R M S E M (%) R M S E F (%) R M S E A l l (%)
Proposed method1F0.203%0.988%0.727%0.881%
2F0.469%1.949%1.743%1.831%
3F0.721%3.538%2.642%3.152%
4F0.884%4.644%3.687%4.217%
5F0.871%4.096%3.023%3.653%
6F0.836%4.474%3.756%4.217%
3-layer network1F0.796%2.012%1.062%1.695%
2F0.679%2.849%1.817%2.463%
3F0.746%4.076%2.544%3.512%
4F0.728%5.491%3.624%4.778%
5F0.748%5.366%3.653%4.697%
6F0.749%5.619%3.975%4.957%
Table 5. Synthetic samples are generated for the neural network array of the twin-tower building.
Damage TypesCalculation of Synthetic Samples
LevelsDoFsSamples
Single-story damage5840,000
Multiple-story damage3865,536
Randomized-story damage-820,000
Total count 125,536
Table 6. Network pruning using LTH for the neural network array of the twin-tower building.
Network NameInitialAfter LTH
RMSEInput Layer—Floor ResponseHidden Layer—Neurons (Pruning Ratio)RMSE
Model 12.052%1, A2, A4, A5, B3, B4180 (18%)1.783%
Model A25.315%1, A2, A3, B4147 (33%)5.059%
Model A37.168%1, A2, A3, A4, A5, B4120 (45%)6.735%
Model A49.968%1, A3, A4, A582 (63%)8.884%
Model A511.891%1, A2, A4, A5, B3120 (45%)10.767%
Model B25.181%1, A2, A4, A5, B2, B3, B4199 (10%)4.986%
Model B39.174%1, A2, A4, A5, B2, B3, B4133 (40%)8.786%
Model B412.656%1, A2, A5, B3, B446 (79%)10.495%
Table 7. Estimated stiffness reduction percentage for all cases.
1F2F3F4F5F6F7F8F
Case 1Reference
Case 211.88%0.68%0.14%0.42%1.53%0.13%0.39%0.28%
Case 313.70%0.64%0.10%0.37%1.00%0.10%0.39%0.40%
Case 418.65%0.73%0.07%0.64%0.20%0.10%0.56%0.54%
Case 588.65%2.03%0.01%12.61%5.52%5.98%14.1%0.28%
Disclaimer/Publisher’s Note: The statements, opinions and data contained in all publications are solely those of the individual author(s) and contributor(s) and not of MDPI and/or the editor(s). MDPI and/or the editor(s) disclaim responsibility for any injury to people or property resulting from any ideas, methods, instructions or products referred to in the content.

