
Assessment of Flood Risk of Residential Buildings by Using the AHP-CRITIC Method: A Case Study of the Katsushika Ward, Tokyo


Abstract
1. Introduction
- Scale: Urban disaster risk assessment tends to be more prevalent. However, in recent years, there have also been studies on risk assessment based on various levels of urban areas and grid classifications [9,38]. Consequently, subdivision of the area and analysis of local characteristics can more accurately implement disaster reduction and prevention strategies, strengthening the flood resistance of urban areas.
- Indicator system: Despite numerous proposed indicator systems, such as the Risk Index System (DDI) proposed by UNDP, the Hotspots Projects, and the Disaster Risk Management Indicator System introduced by Universidad Nacional de Colombia and the Inter-American Development Bank [24], a universally endorsed framework for risk assessment remains absent. However, the current risk assessment systems for natural disasters exhibit significant shortcomings and limited applicability to diverse regions [24]. Indicator systems for specific disasters and their assessment criteria are scarce. In addition, several indicators related to residential buildings have been proposed. Insufficient indicators suitable for the local situation are included in the indicator system, and indicator systems specific for the flood risk assessment of residential buildings are even fewer. Most indicators are qualitative, rather than quantitative.
- Method: The combination of qualitative and quantitative methods and the exploration of multi-source data analysis have emerged as a prevailing trend in the field [22].
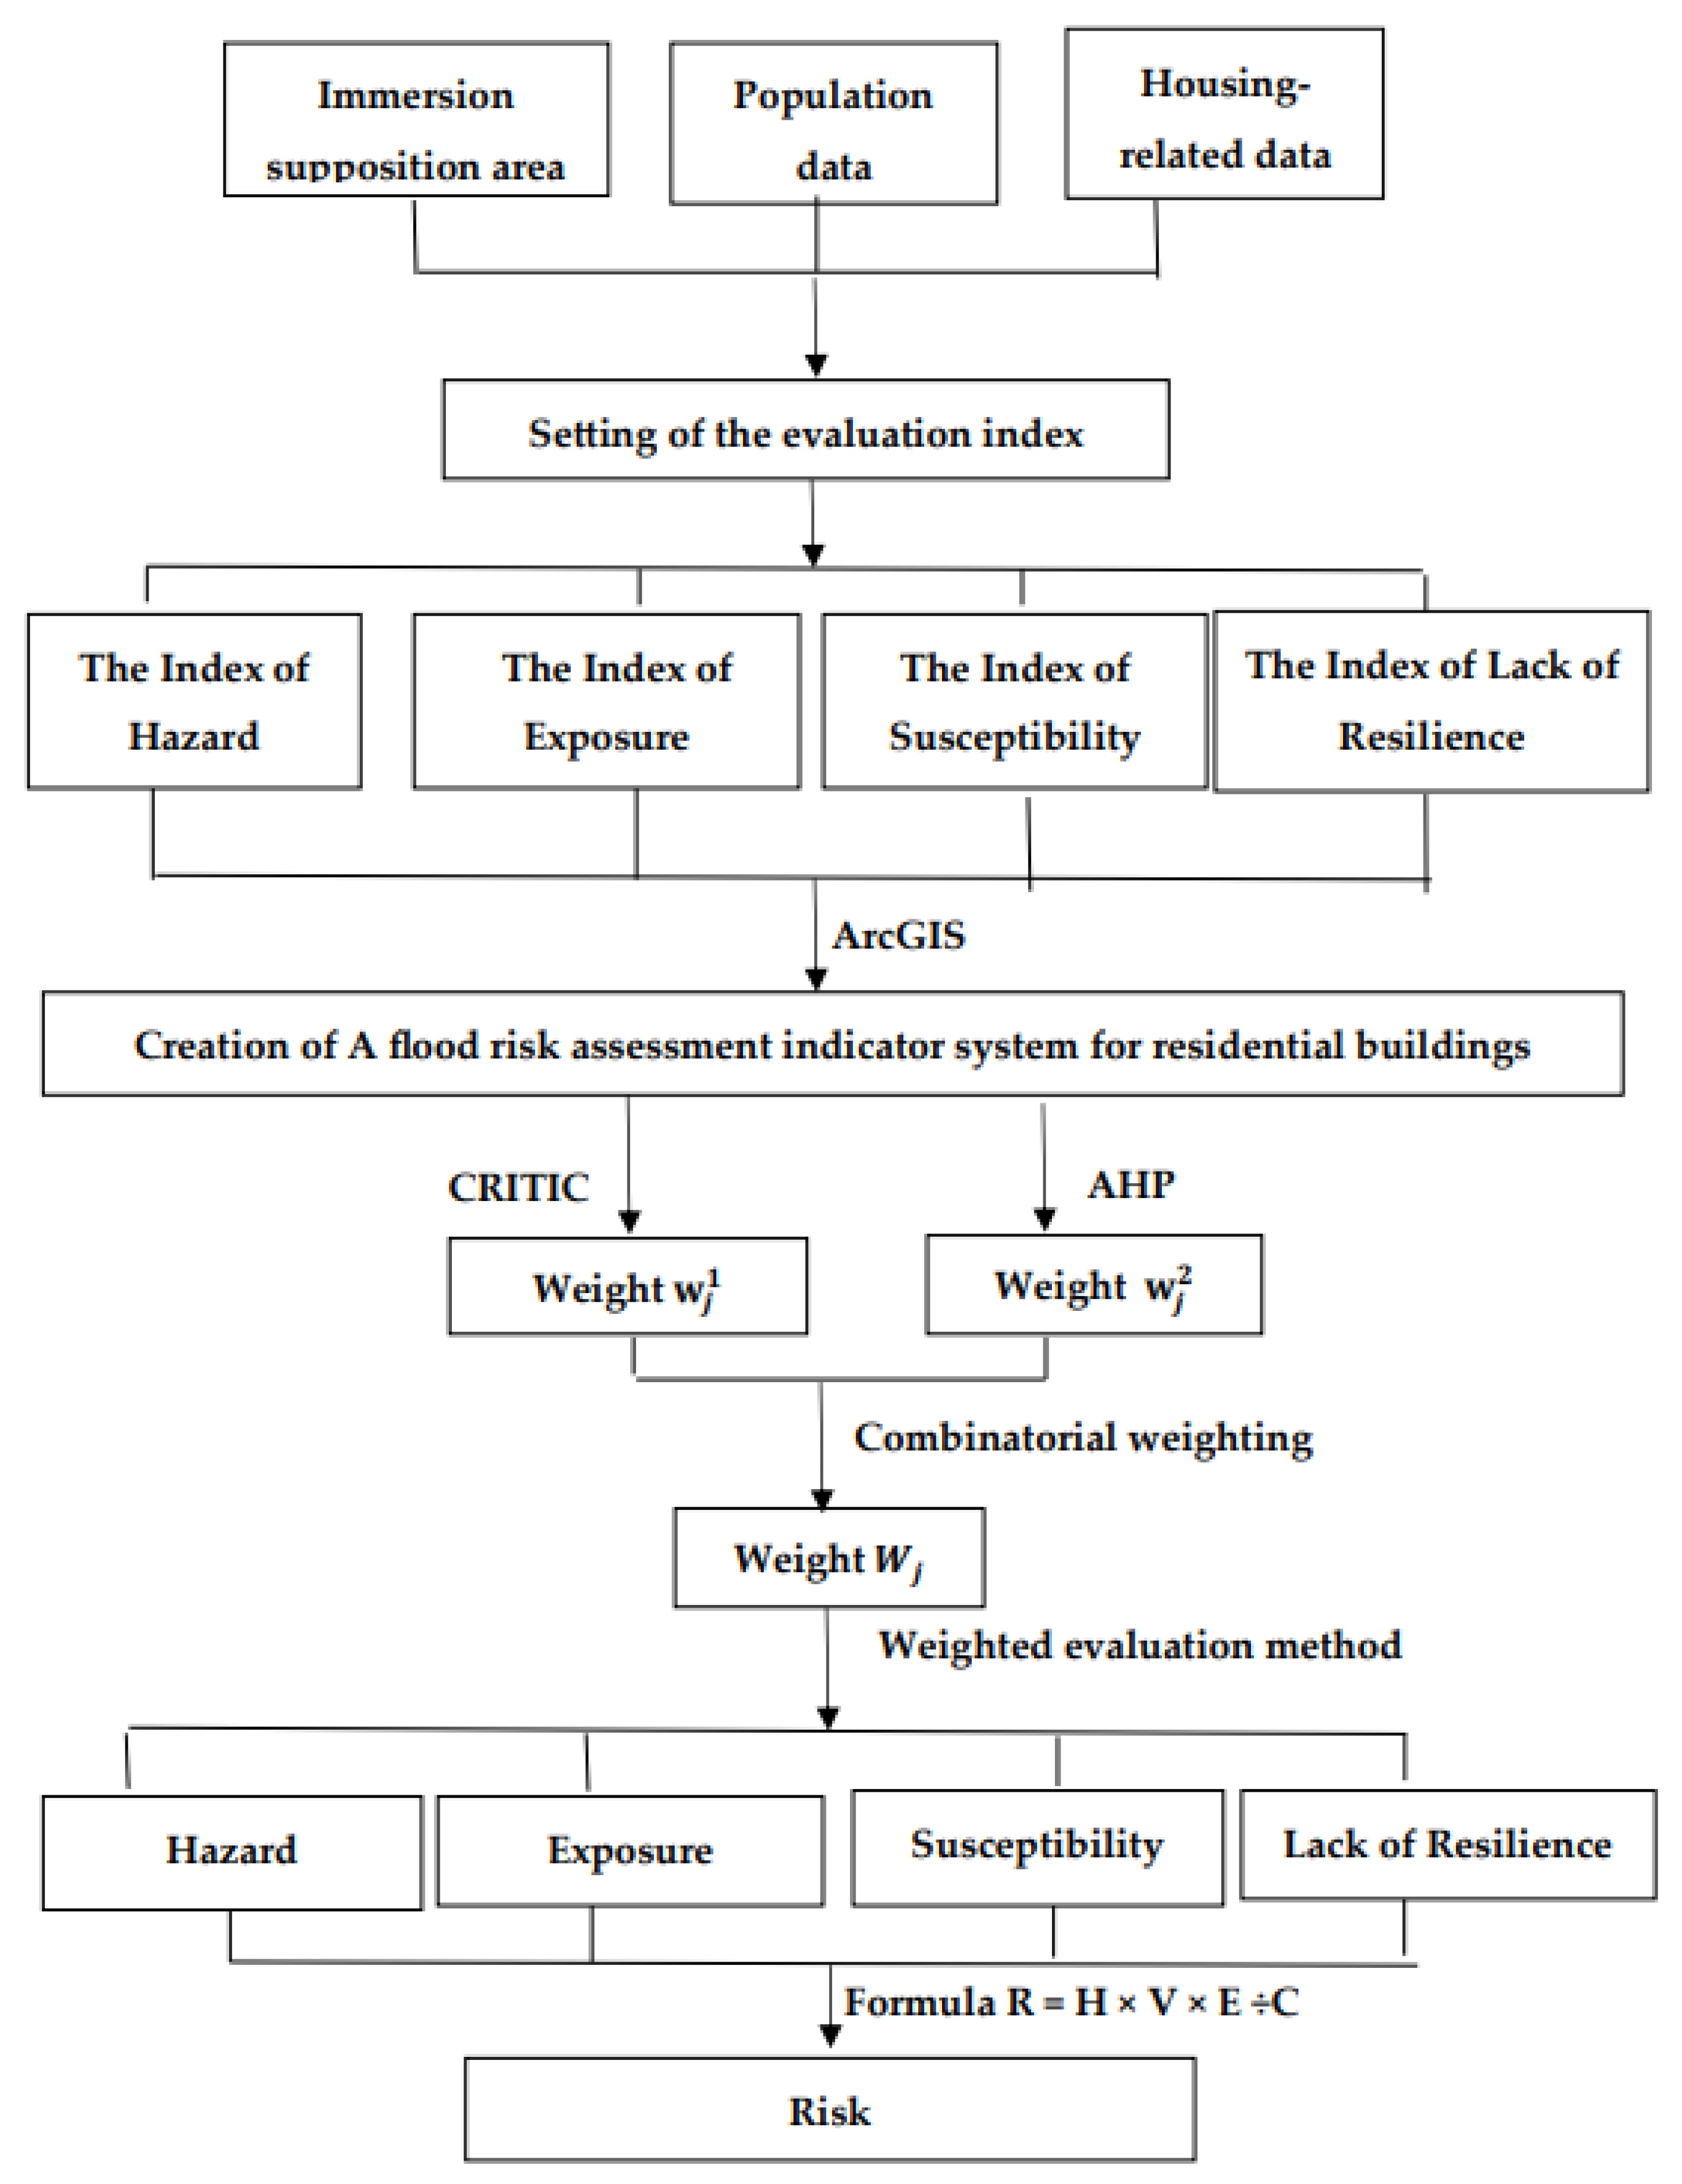
2. Materials and Methods
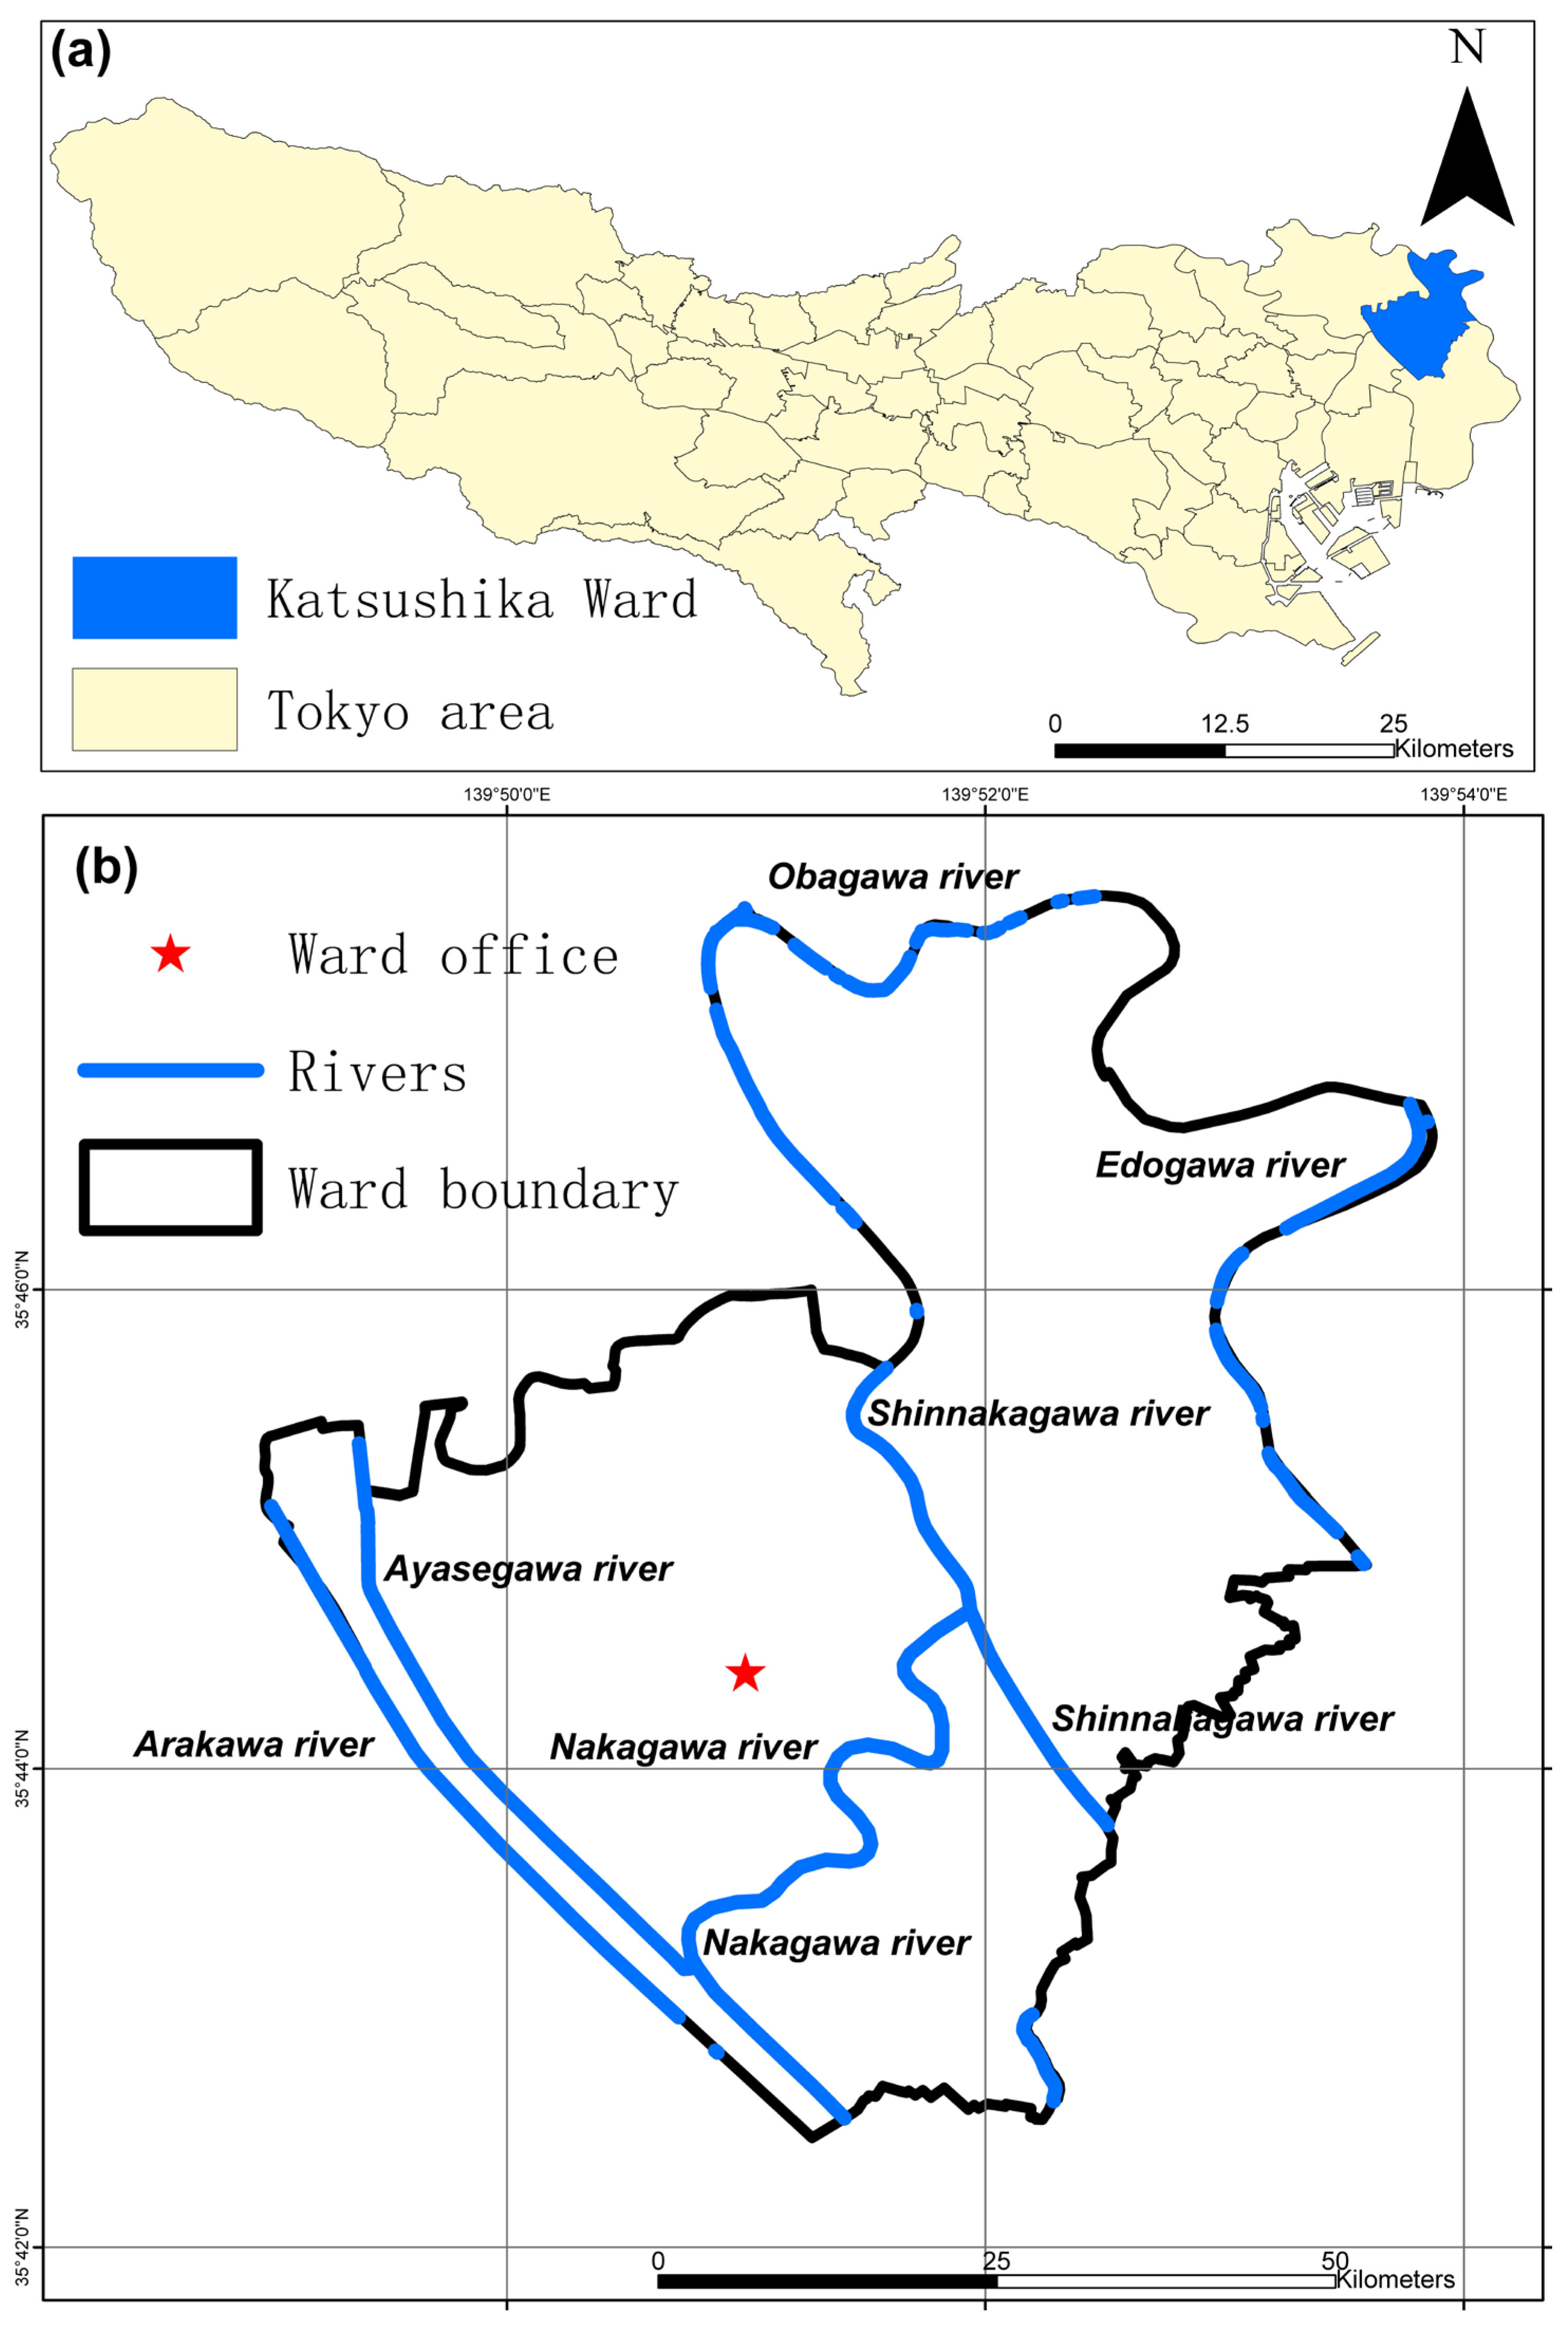
2.1. Study Area
2.2. Data Collection and Processing
2.2.1. Data Used for Research
2.2.2. Selection of Indicators
2.2.3. Establishment of Matrix
- Criteria Importance Through Intercriteria Correlation Method (CRITIC)
- Analytical hierarchy process (AHP)
- Combinatorial weighting
2.3. Evaluation Grading
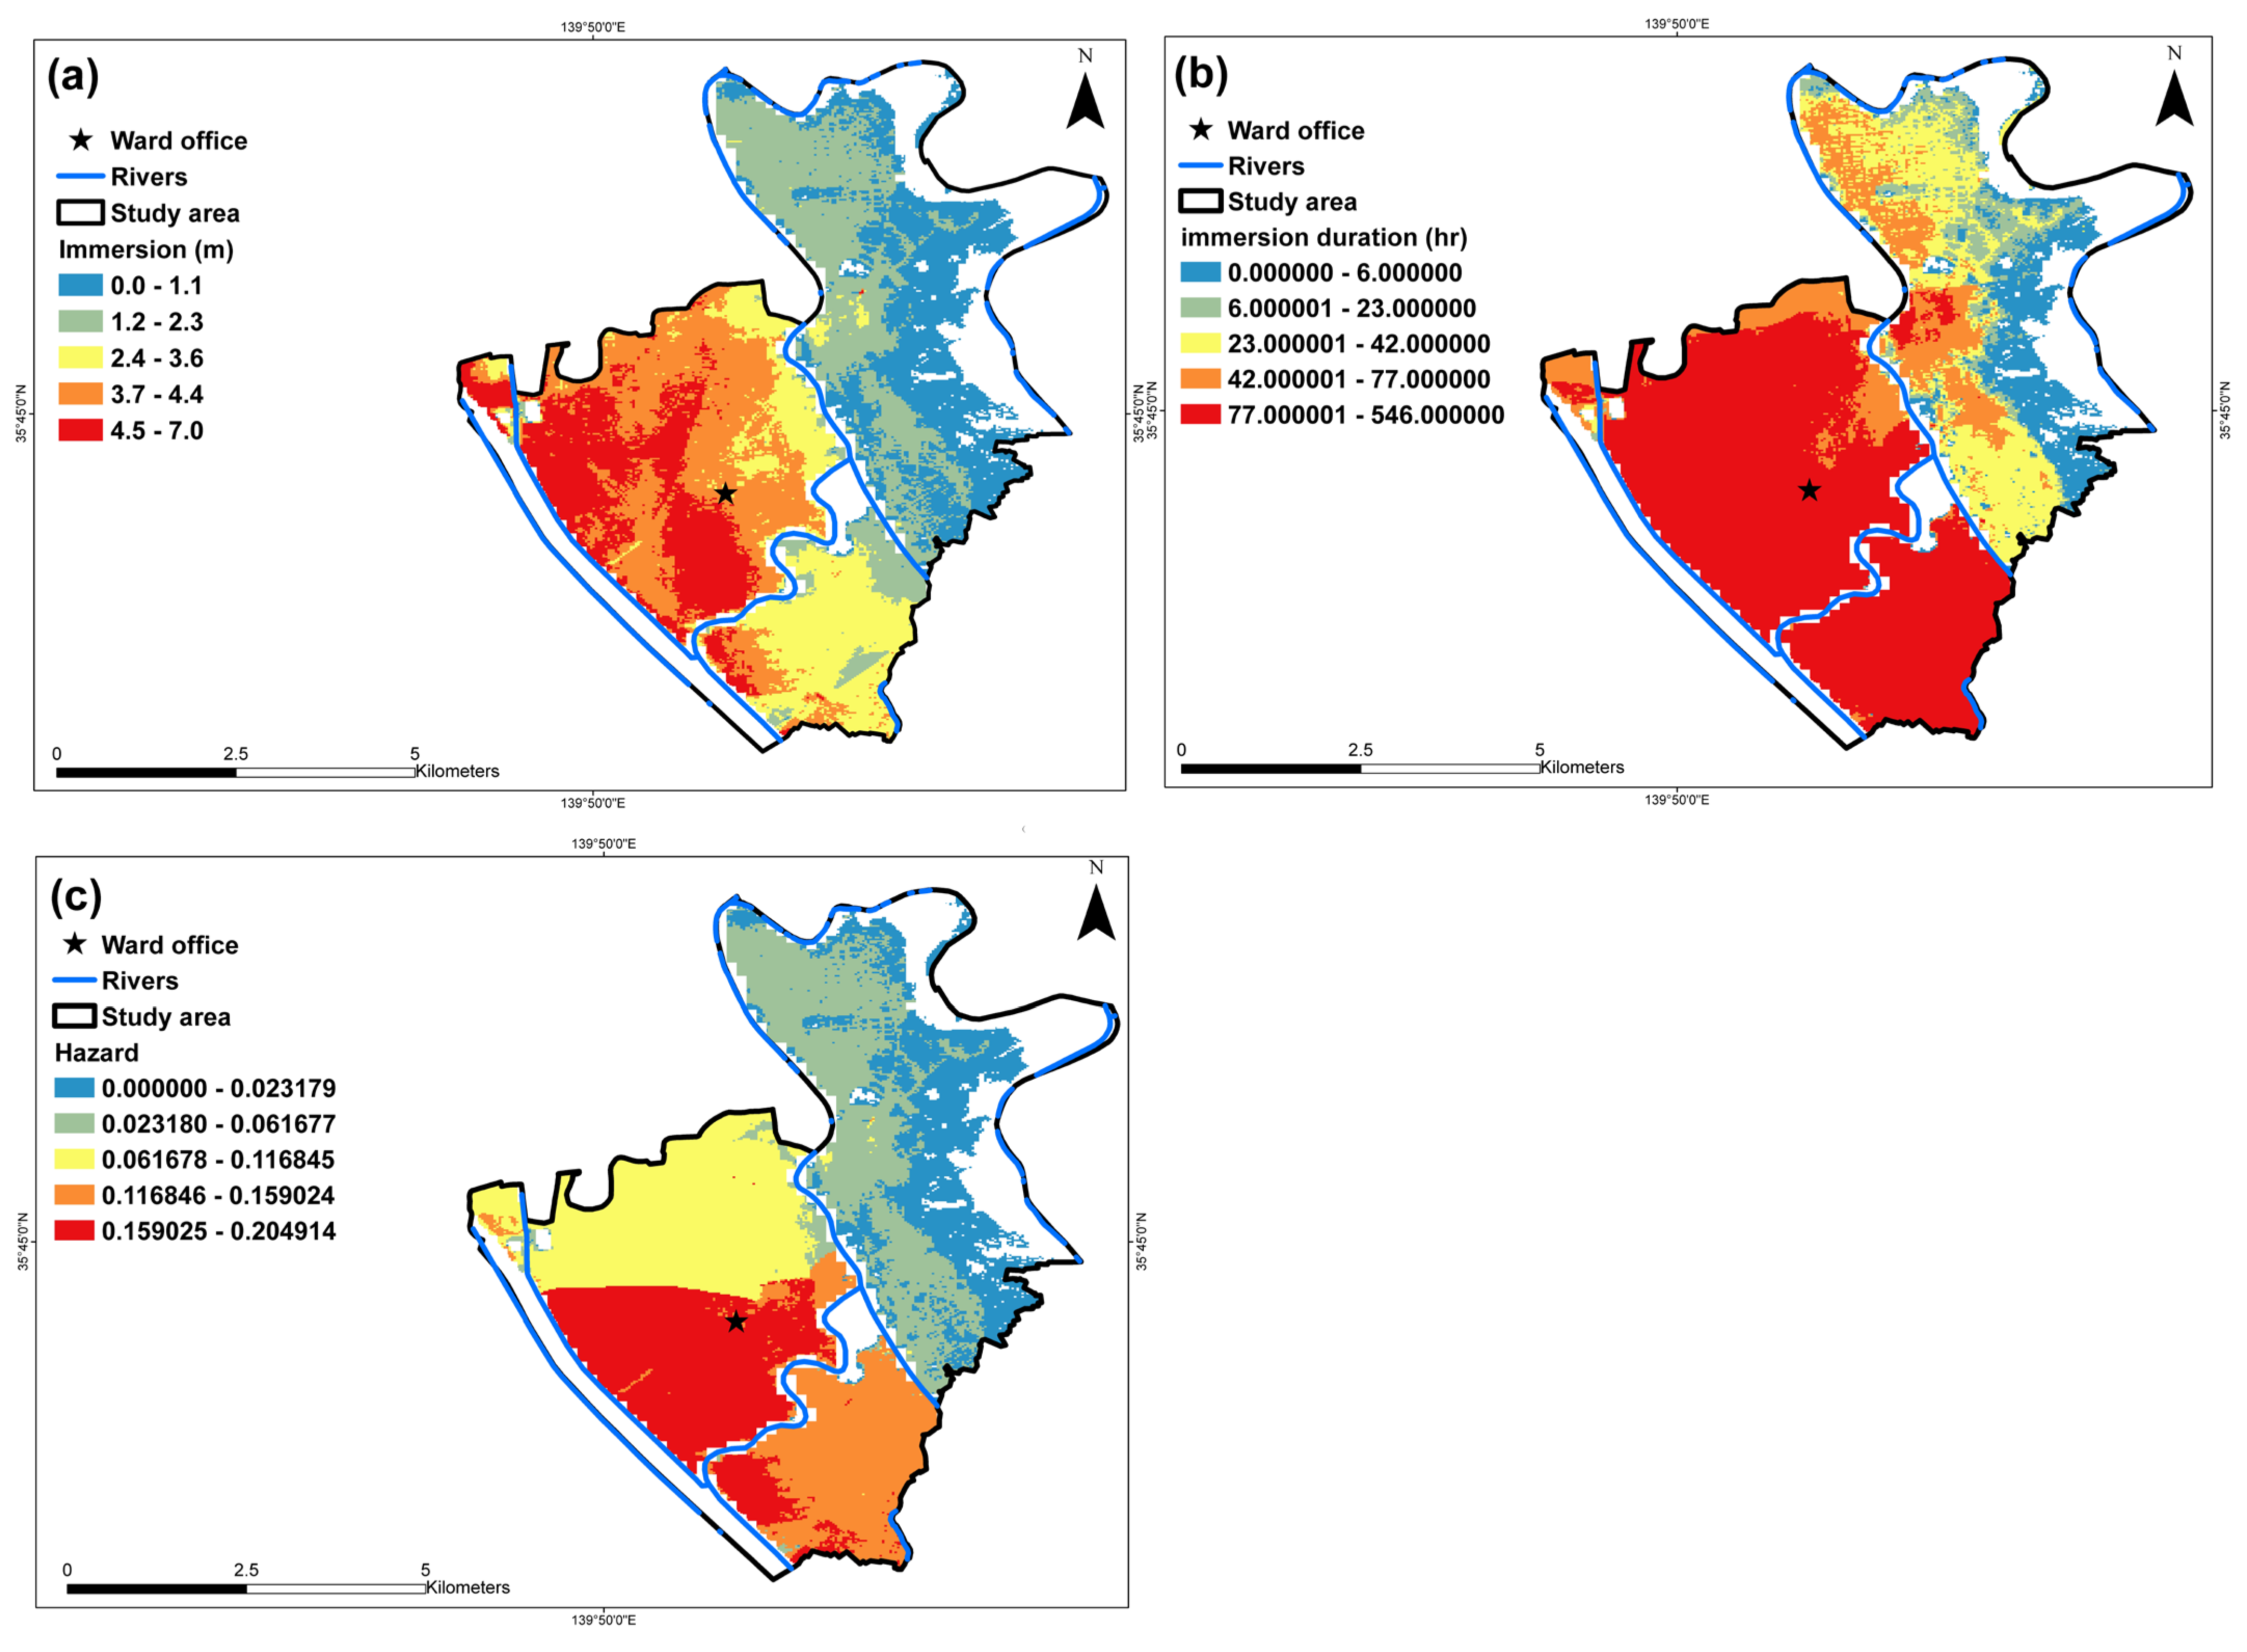
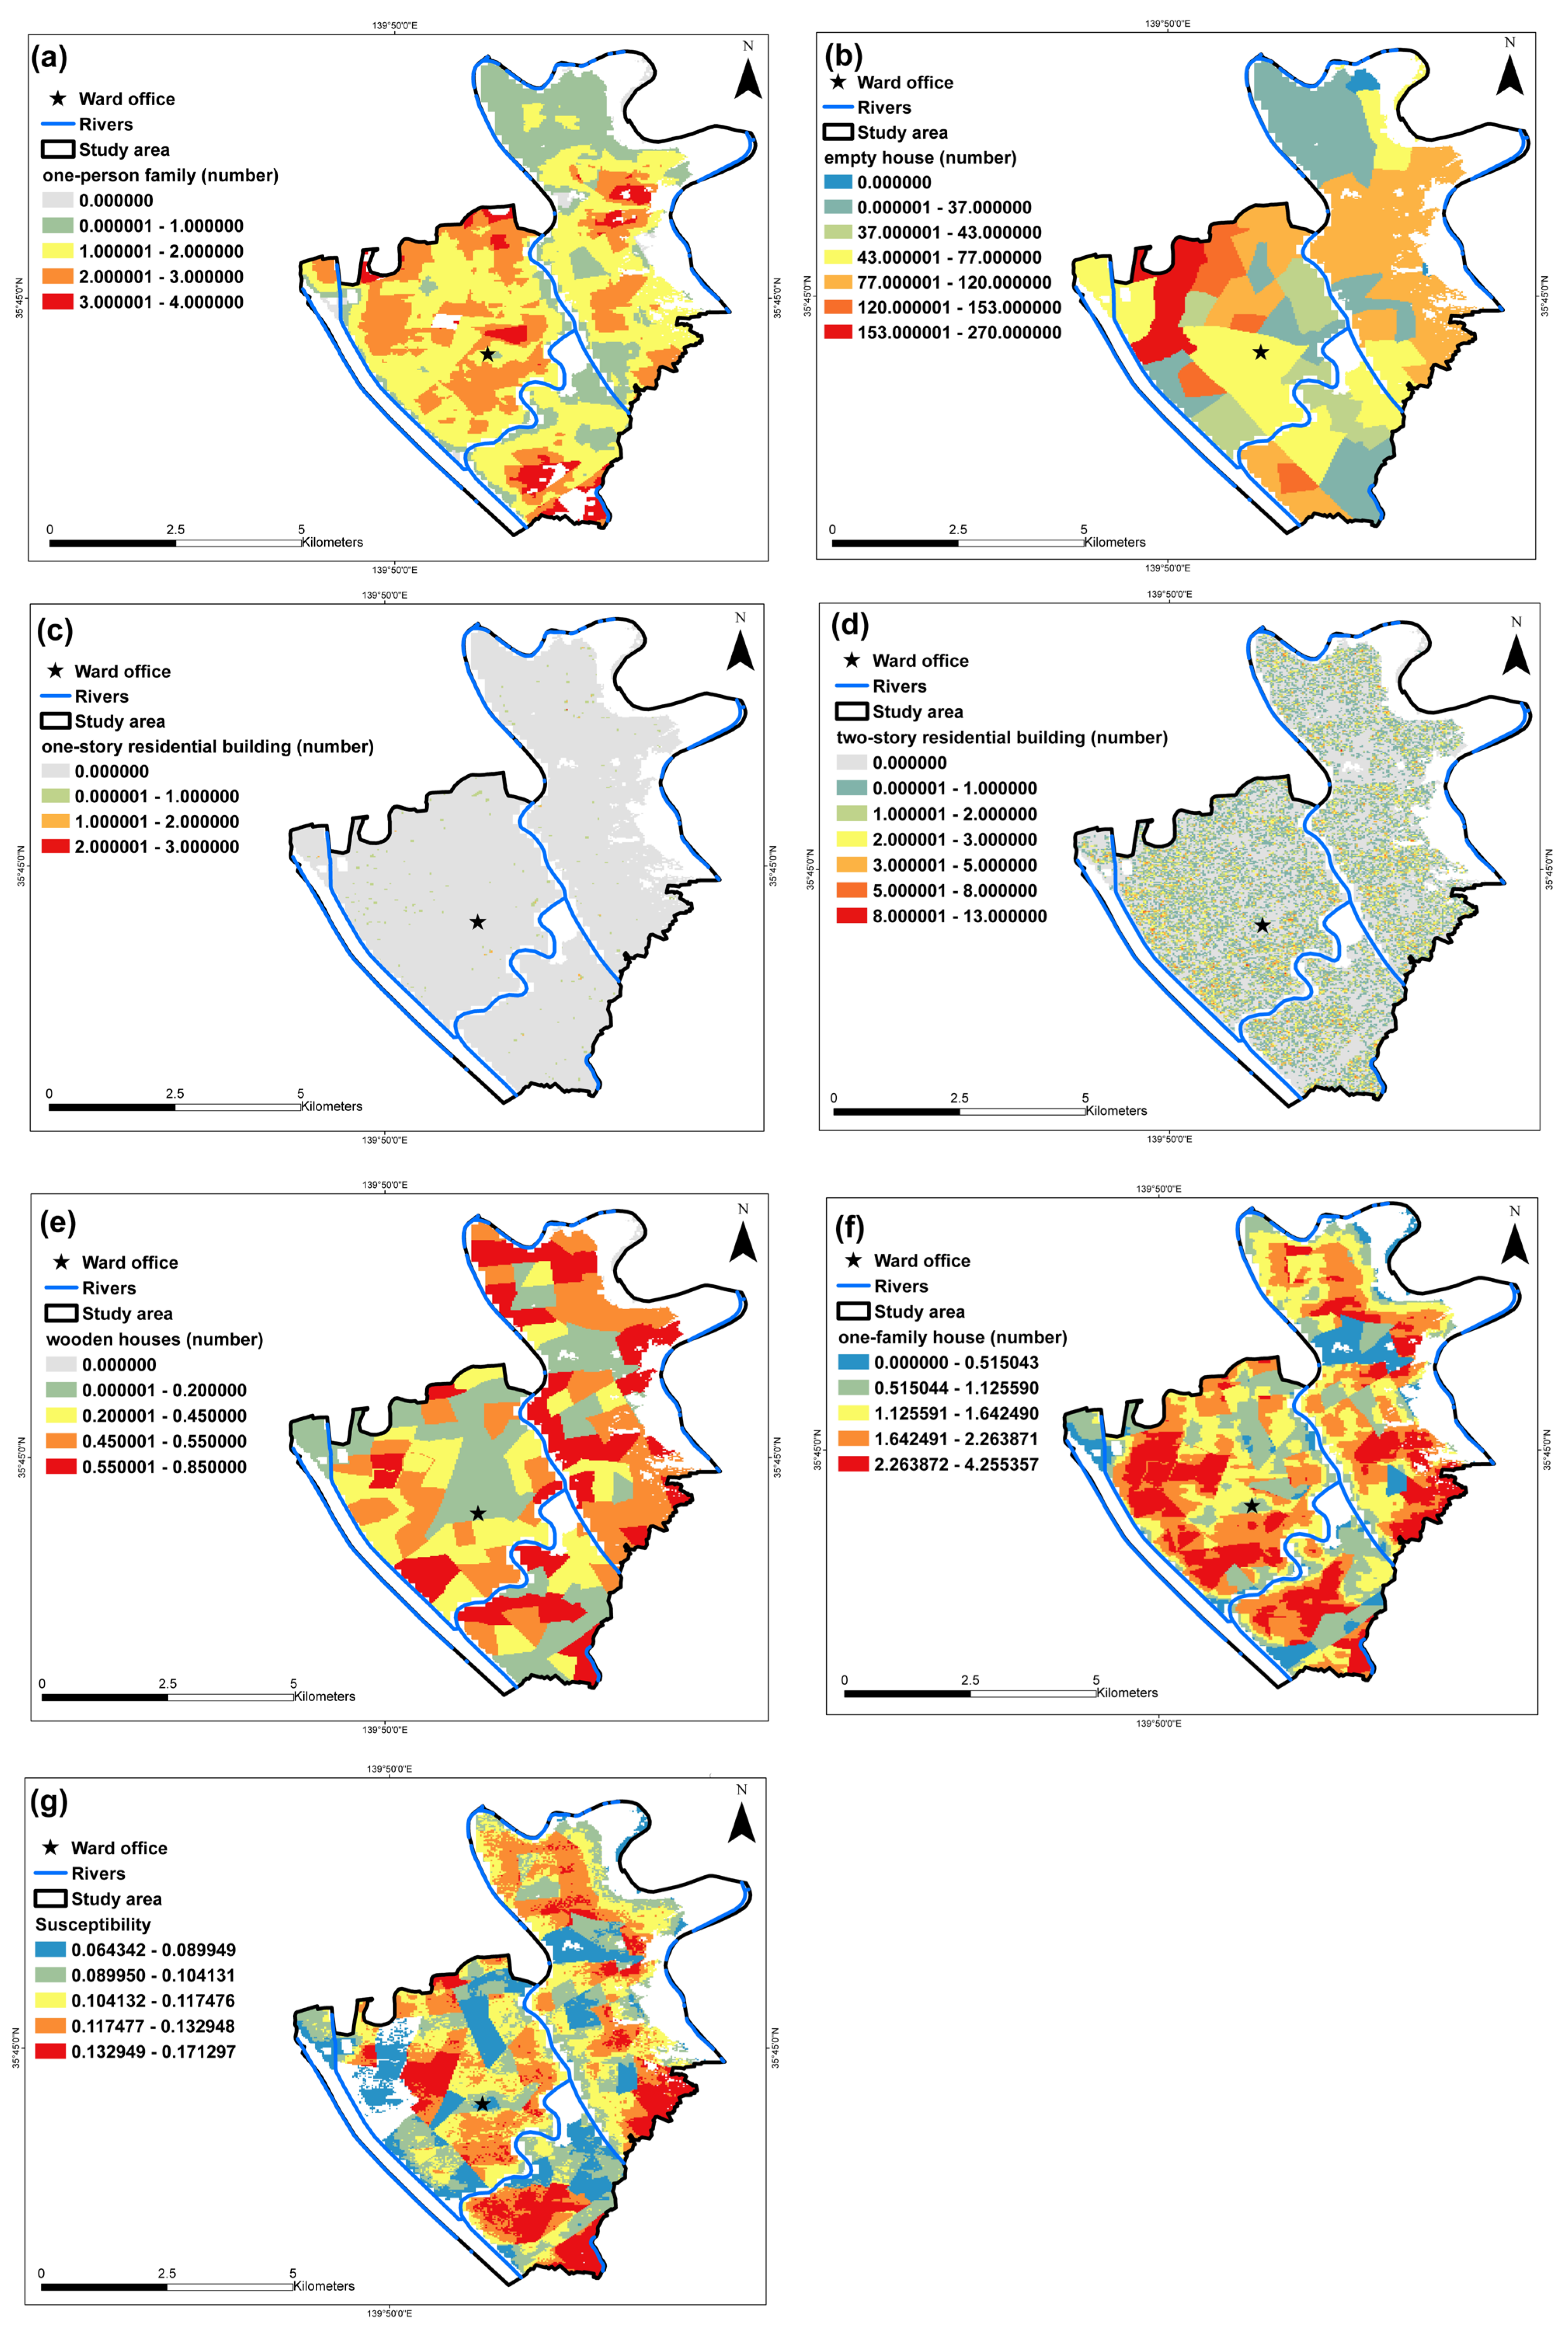
3. Results
4. Discussion
5. Conclusions
Author Contributions
Funding
Data Availability Statement
Conflicts of Interest
References
- Masson, D.V.; Zhai, P.; Pirani, A. Climate Change 2021: The Physical Science Basis; Working Group I Contribution to the Sixth Assessment Report of the Intergovernmental Panel on Climate Change, IPCC AR6 WG1; Intergovernmental Panel on Climate Change: Geneva, Switzerland, 2021. [Google Scholar]
- Shi, Y. The vulnerability assessment of residences in rainstorm waterlogging in cities: A case study of shanghai. J. Catastrophol. 2015, 30, 94–98. [Google Scholar] [CrossRef]
- Shi, X.; Zha, X.; Guo, Y. Flood disaster risk assessment of ankang city in upper reaches of hanjiang river based on GIS. Shandong Agric. Sci. 2017, 49, 88–94. [Google Scholar] [CrossRef]
- Rogers, J.S.; Maneta, M.M.; Sain, S.R.; Madaus, L.E.; Hacker, J.P. The role of climate and population change in global flood exposure and vulnerability. Nat. Commun. 2025, 16, 1287. [Google Scholar] [CrossRef]
- Voortman, H.G.; van Vuren, S.; Jonkman, S.N.; Klerk, W.J. Developments in the management of flood defences and hydraulic infrastructure in the Netherlands. Struct. Infrastruct. Eng. 2018, 14, 95–910. [Google Scholar] [CrossRef]
- Eyre, S. Practical Exploration of Dutch Stormwater Management in the Context of Climate Change. Landsc. Archit. 2023, 30, 28–35. [Google Scholar]
- Hu, Y.M.; Wen, Q.Y.; Wang, J.; Cao, Z.H.; Peng, A.B.; Liang, Z.M. Flood standards and coping strategies for climate change in typical developed countries in Europe, America, and Asia. South-North Water Transf. Water Sci. Technol. 2024, 22, 605–617. [Google Scholar]
- Chen, B.; Zhong, C. A preliminary study on risk loss degree assessment of natural hazards. J. Catastrophol. 2010, 25, 1–5. [Google Scholar] [CrossRef]
- Quan, R. Vulnerability analysis of rainstorm waterlogging on buildings in central urban area of Shanghai based on scenario simulation. Sci. Geogr. Sin. 2014, 34, 1399–1403. [Google Scholar] [CrossRef]
- Zhang, X.; Wang, Y.; Liu, T.; Chen, Y. Research progress of building vulnerability curve associated with mountain torrent. Mount Res. 2021, 39, 356–366. [Google Scholar] [CrossRef]
- Shi, P.J. Theory on disaster science and disaster dynamics. J. Nat. Disasters 2002, 11, 1–9. [Google Scholar] [CrossRef]
- Wang, N.; Cheng, W.; Zhang, Y. Reasons and risk assessment of housing damage in the national mountain torrent disaster prevention county. J. Geoinform. Sci. 2017, 19, 1575–1583. [Google Scholar]
- Coulbourne, W.L.; Kriebe, D.L.; Behm, R.L. Guide for Design of Flood-Resistant Buildings; National Research Council of Canada: Ottawa, ON, Canada, 2021. [Google Scholar]
- UNDP. Reducing Disaster Risk, a Challenge for Development; A Global Report; UNDP: New York, NY, USA, 2004. [Google Scholar]
- Comprehensive Study Group of Natural Disaster. Research Progress of Natural Disaster Regionalization in China; China Ocean Press: Beijing, China, 1998. [Google Scholar]
- Shi, Y.; Zhong, F.; Zhang, H. Discussion on evaluation indexes of disaster resilience in urban communities. J. Inst. Disaster Prevent. 2019, 21, 47–54. [Google Scholar] [CrossRef]
- Liu, X.; Qiu, W. Risk assessment and zoning analysis of flood disaster in Yangzhou City, Jiangsu Province. China Flood Drought Manag. 2023, 33, 48–53. [Google Scholar] [CrossRef]
- Xiong, F.; Li, P.; Yuan, Y.; Wu, F. Urban flood disaster risk assessment based on GIS and combined weights. Yangtze River 2023, 54, 60–66. [Google Scholar] [CrossRef]
- Li, W.P.; Fu, R.D.; Liang, Q.D. The regime and causes of the Jialing River floods in Qing Dynasty based on inscription records. J. Earth Environ. 2017, 8, 384–396. [Google Scholar] [CrossRef]
- Wang, D.; Yuan, S. Analysis and Simulation of 1980–2017 Flood Disasters in Yunnan Province, China. Mount Res. 2018, 36, 898–906. [Google Scholar] [CrossRef]
- Cai, T.; Li, X.; Ding, X.; Wang, J.; Zhan, J. Flood risk assessment based on hydrodynamic model and fuzzy comprehensive evaluation with GIS technique. Int. J. Disaster Risk Reduct. 2019, 35, 101077. [Google Scholar] [CrossRef]
- Knighton, J.; Steinschneider, S.; Walter, M.T. A vulnerability-based, bottom-up assessment of future riverine flood risk using a modified peaks-over-threshold approach and a physically based hydrologic model. Water Resourc. Res. 2017, 53, 10043–10064. [Google Scholar] [CrossRef]
- Chen, J.; Zhang, R.; Xie, Y. Risk assessment of rainstorm waterlogging disaster based on urban rainstorm waterlogging mathematical model in Fuzhou city. Torrent Rain Disasters 2020, 39, 89–95. [Google Scholar] [CrossRef]
- Dong, S.; Jiang, L.; Zhang, J.; Tong, Z.; Liu, X.; Jiang, X. Research on flood vulnerability curves of rural dwellings based on “3S” technology. J. Catastrophol. 2012, 27, 34–38. [Google Scholar] [CrossRef]
- Akbas, S.O.; Blahut, J.; Sterlacchini, S. Critical assessment of existing physical vulnerability estimation approaches for debris flows. In Proceedings of the Landslide Processes: From Geomorphological Mapping to Dynamic Modelling, 2–3; CERG Editions: Strasbourg, France, 2009; pp. 229–233. [Google Scholar]
- Cao, S.J.; Fang, W.H.; Tan, J. Vulnerability of building contents to coastal flooding based on questionnaire survey in Hainan after Typhoon Rammasun and Kalmeagi. J. Catastrophol. 2016, 31, 188–195. [Google Scholar]
- FEMA. Flood Model: User Manual; Federal Emergency Management Agency: Washington, DC, USA, 2003.
- Büchele, B.; Kreibich, H.; Kron, A.; Thieken, A.; Ihringer, J.; Oberle, P.; Merz, B.; Nestmann, F. Flood-risk mapping: Contributions towards an enhanced assessment of extreme events and associated risks. Nat. Hazards Earth Syst. Sci. 2006, 6, 485–503. [Google Scholar] [CrossRef]
- Karagiorgos, K.; Thaler, T.; Hübl, J.; Maris, F.; Fuchs, S. Multi-vulnerability analysis for flash flood risk management. Nat. Hazards 2016, 82, 63–87. [Google Scholar] [CrossRef]
- Kelly, J. Department of home land security. Defense Transp. J. 2017, 3, 38–39. [Google Scholar]
- Papathoma-Köhle, M.; Zischg, A.; Fuchs, S.; Glade, T.; Keiler, M. Loss estimation for landslides in mountain areas–An integrated toolbox for vulnerability assessment and damage documentation. Environ. Modell. Softw. 2015, 63, 156–169. [Google Scholar] [CrossRef]
- Penning-Rowsell, E.C.; Chatterton, J.B. The Benefits of Flood Alleviation. A Manual of Assessment Techniques; Saxon House, Gower Aldershot: London, UK, 1977. [Google Scholar]
- Penning-Rowsell, E.C.; Green, C.; Thompson, P.M.; Coker, A.; Tunstall, S.; Richards, C.; Parker, D. The Economics of Coastal Management: A Manual of Benefit Assessment Techniques; Belhaven Press: London, UK, 1992. [Google Scholar]
- The State of Queensland (Department of Natural Resources and Mine). Guidance on the Assessment of Tangible Flood Damages; The State of Queensland (Department of Natural Resources and Mine): Brisbane, Australia, 2002.
- Totschnig, R.; Fuchs, S. Mountain torrents: Quantifying vulnerability and assessing uncertainties. Eng. Geol. 2013, 155, 31–44. [Google Scholar] [CrossRef]
- Van Ootegem, L.; Van Herck, K.; Creten, T.; Verhofstadt, E.; Foresti, L.; Goudenhoofdt, E.; Reyniers, M.; Delobbe, L.; Tuyls, D.M.; Willems, P. Exploring the potential of multivariate depth-damage and rainfall-damage models. J. Flood Risk Manag. 2018, 11, 5916–5929. [Google Scholar] [CrossRef]
- Yu, L.; Huang, R.; Li, B.; Pan, X.; Liu, B.; Ju, Q. Risk assessment of waterlogging in Beijing Municipal Administrative Center by hierarchical analysis. J. Beijing Norm. Univ. (Nat. Sci.) 2022, 58, 62–69. [Google Scholar] [CrossRef]
- Sumiko, K. Environmental changes in the Tokyo lowland. Acad. Trends 2022, 27, 39–243. [Google Scholar]
- Sotaro, T. Geographical Research on the Conversion Process from Agricultural Irrigation to Environmental Utilization by Urbanization—A Case Study of Edogawa Ward Tokyo. J. Environ. Inf. Sci. 2024, 38, 148–153. [Google Scholar]
- Takanashi, T. The hazard assessment and classification of Tokyo low-lying area during flood damage. In Annual Report of Graduate School of Science and Engineering; Chuo University: Hachioji, Japan, 2016. [Google Scholar]
- Sotaro, T. A study on damage and life recovery by flood disaster case study of July 2020 flood disaster Hitoyoshi City KUMAMOTO. In Proceedings of the General Meeting of the Association of Japanese Geographers, Takamatsu, Japan, 10 September 2022. [Google Scholar]
- Nakamura, S.; Oki, T. Paradigm shifts on flood risk management in Japan: Detecting triggers of design flood revisions in the modern era. Water Resour. Res. 2018, 54, 5504–5515. [Google Scholar] [CrossRef]
- Shono, S.; Hiroki, O. A study on maintenance of the population density and inundation damage risk reduction in the residence guidance area focusing on revision of act on special measure concerning urban reconstruction and inundation assumption area in urban promotion area. J. City Plann. Insit. Jpn. 2021, 56, 952–959. [Google Scholar]
- Nozomu, K.; Takahiro, T.; Taku, N. Study on the floodproofing plans of wooden detached housings and their cost effectiveness evaluation. AIJ J. Technol. Des. 2021, 27, 499–504. [Google Scholar] [CrossRef]
- Takeru, M.; Toshiya, M.; Bumpei, N. Study on Measures Against Estimated Flood Area with House Collapse included in Residential Promotion Area. Pap. City Plan. 2022, 57, 760–767. [Google Scholar]
- Nobuyuki, T. Possibility and limits of water disaster countermeasures in metropolitan areas where population and industry are concentrated. Jpn. Assoc. Real. Estate Sci. 2022, 36, 84–89. [Google Scholar]
- Akagi, N. The framework of flood damage prevention in the district of Katsushika. River Front. 2017, 86, 2–16. Available online: http://www.rfc.or.jp/pdf/vol_86/p012.pdf (accessed on 5 December 2024).
- Takaaki, K. Rethinking Urban Development Strategies in an Era of Frequent Flood Disasters. 2022. Available online: https://www.mlit.go.jp/toshi/city_plan/content/001341487.pdf (accessed on 5 July 2024).
- Takaaki, K.; Kinji, I. The community based workshop for consideration of countermeasures against forthcoming flood disasters trial in Shin Koiwa Narth district of Katsushika city in Tokyo. Instit. Indu. Sci. 2010, 62, 371–376. [Google Scholar]
- Katsushika Ward Office. Katsushika Ward Statistics 60th; Katsushika Ward Office: Tokyo, Japan, 2016. [Google Scholar]
- Priyambodho, B.A.; Yagi, R.; Ishikawa, S.; Kidou, A.; Kure, S. Relationship between flood inundation flow and building damage due to flood disaster at Chikuma river in Nagano prefecture in 2019. Jurnal 2019, 76, I_619–I_624. Available online: http://eprints.untirta.ac.id/id/eprint/22877 (accessed on 5 July 2024).
- Ge, Y.; Liu, J.; Shi, P.J. Quantifying social vulnerability for flood hazard of households: A case study of Changsha, China. J. Nat. Disasters 2006, 15, 33–37. [Google Scholar]
- Zang, X.; Wang, Q. The evolution of the urban resilience concept, and its research contents and development trend. Sci. TechnolRev. 2019, 37, 94–104. Available online: https://d.wanfangdata.com.cn/periodical/ChlQZXJpb2RpY2FsQ0hJTmV3UzIwMjMxMjI2Eg1ramRiMjAxOTIyMDEzGghna2ppdDM2dA%3D%3D (accessed on 5 July 2024).
- Cabinet Office. Main Contents of Revision of the Damage Certification Standard Operation Guideline for Houses Related to Disasters; Cabinet Office: London, UK, 2019. [Google Scholar]
- Katsushika Ward Office. Katsushika Ward Residential Basic Plan; Katsushika Ward Office: Tokyo, Japan, 2011. [Google Scholar]
- Tan, H.; Tuo, Y.; Wang, Q.; Zheng, Y.; Wang, Z.Y.; Liu, X.N.; Shi, X.L.; Ding, M.J.; Ma, J.M. Comprehensive evaluation of water carrying capacity of Yunnan province based on CRITIC-VIKOR method. J. Water Resourc. Water Eng. 2023, 34, 18–126. [Google Scholar] [CrossRef]
- Saaty, T.L. The Analytic Hierarchy Process; McGraw-Hill: New York, NY, USA, 1980. [Google Scholar]
- Yan, H.; Li, L.; Li, L.; Li, Y.; Li, L.; Zhang, W.; Peng, C. Suitability assessment on CO2 storage in offshore basins of China based on AHP and fuzzy comprehensive evaluation. Mar. Geol. Front. 2024, 40, 9–93. [Google Scholar] [CrossRef]
- Katsushika Ward Office. Katsushika Ward Regional Disaster Prevention Plan; Katsushika Ward Office: Tokyo, Japan, 2013. [Google Scholar]
- Katsushika Ward Official. Katsushika Ward Arakawa Flood Disaster Map. Katsushika Ward Office: Tokyo, Japan, 2017. [Google Scholar]
- Katsushika Ward Office. Guidelines Concerning the Maximum Building Height of Katsushika Ward; Katsushika Ward Office: Tokyo, Japan, 2014. [Google Scholar]
- Katsushika Ward Office. Around Yotsugi Station District Fireproof Building Block Maintenance District Planning; Katsushika Ward Office: Tokyo, Japan, 2015. [Google Scholar]
- Katsushika Ward Office. Around Horikiri 2 Chome and 4 Chome City Fireproof Building Block Maintenance District Planning; Katsushika Ward Office: Tokyo, Japan, 2016. [Google Scholar]
- Lianxiao; Morimoto, T. Spatial Analysis of Social Vulnerability to Floods Based on the MOVE Framework and Information Entropy Method: Case Study of Katsushika Ward, Tokyo. Sustainability 2019, 11, 29. [Google Scholar] [CrossRef]
- Lianxiao; Morimoto, T.; Siqin, T.; An, C.; Yuhai, B.; Fei, G. Evaluating Regional Flood Disaster Resilience Based on the DROP Model and TOPSIS Method: A Case Study of the Katsushika Ward, Tokyo. Nat. Hazards Rev. 2022, 23, 04022018. [Google Scholar] [CrossRef]
Disclaimer/Publisher’s Note: The statements, opinions, and data contained in all publications are solely those of the individual author(s) and contributor(s) and not of MDPI and/or the editor(s). MDPI and/or the editor(s) disclaim responsibility for any injury to people or property resulting from any ideas, methods, instructions, or products referred to in the content. |


| Module | Index Code | Index | Explanation | Index Property |
|---|---|---|---|---|
| Extent of hazard | H1 | ) | Greater the immersion depth corresponds to higher flood risk for houses [51]. | + |
| H2 | ) | Longer immersion duration is associated with increased flood risk for houses [52]. | + | |
| Exposure | E1 | Household (number) | Higher population levels are linked to elevated flood risk [10] | + |
| E2 | Homestead rate | Increased homestead rates lead to greater flood risk [42] | + | |
| E3 | Rental households (number) | A higher number of tenants increases flood risk [42]. | + | |
| E4 | Home ownership population (number) | Larger populations of self-owned houses result in greater flood risk for houses [42]. | + | |
| Susceptibility | S1 | one-person family (number) | A higher presence of one-person families is connected to heightened flood risk [42]. | + |
| S2 | empty house (number) | A greater number of empty houses is linked to increased flood risk [42]. | − | |
| S3 | one-story residential building (number) | The presence of more one-story residential buildings corresponds to higher flood risk [17] | + | |
| S4 | two-story residential building (number) | A larger number of two-story residential buildings is associated with increased flood risk [17]. | + | |
| S5 | wooden houses (number) | An increased number of wooden houses leads to greater flood risk [10,21] | + | |
| S6 | one-family house (number) | A higher prevalence of one-family houses is connected to increased flood risk [53] | + | |
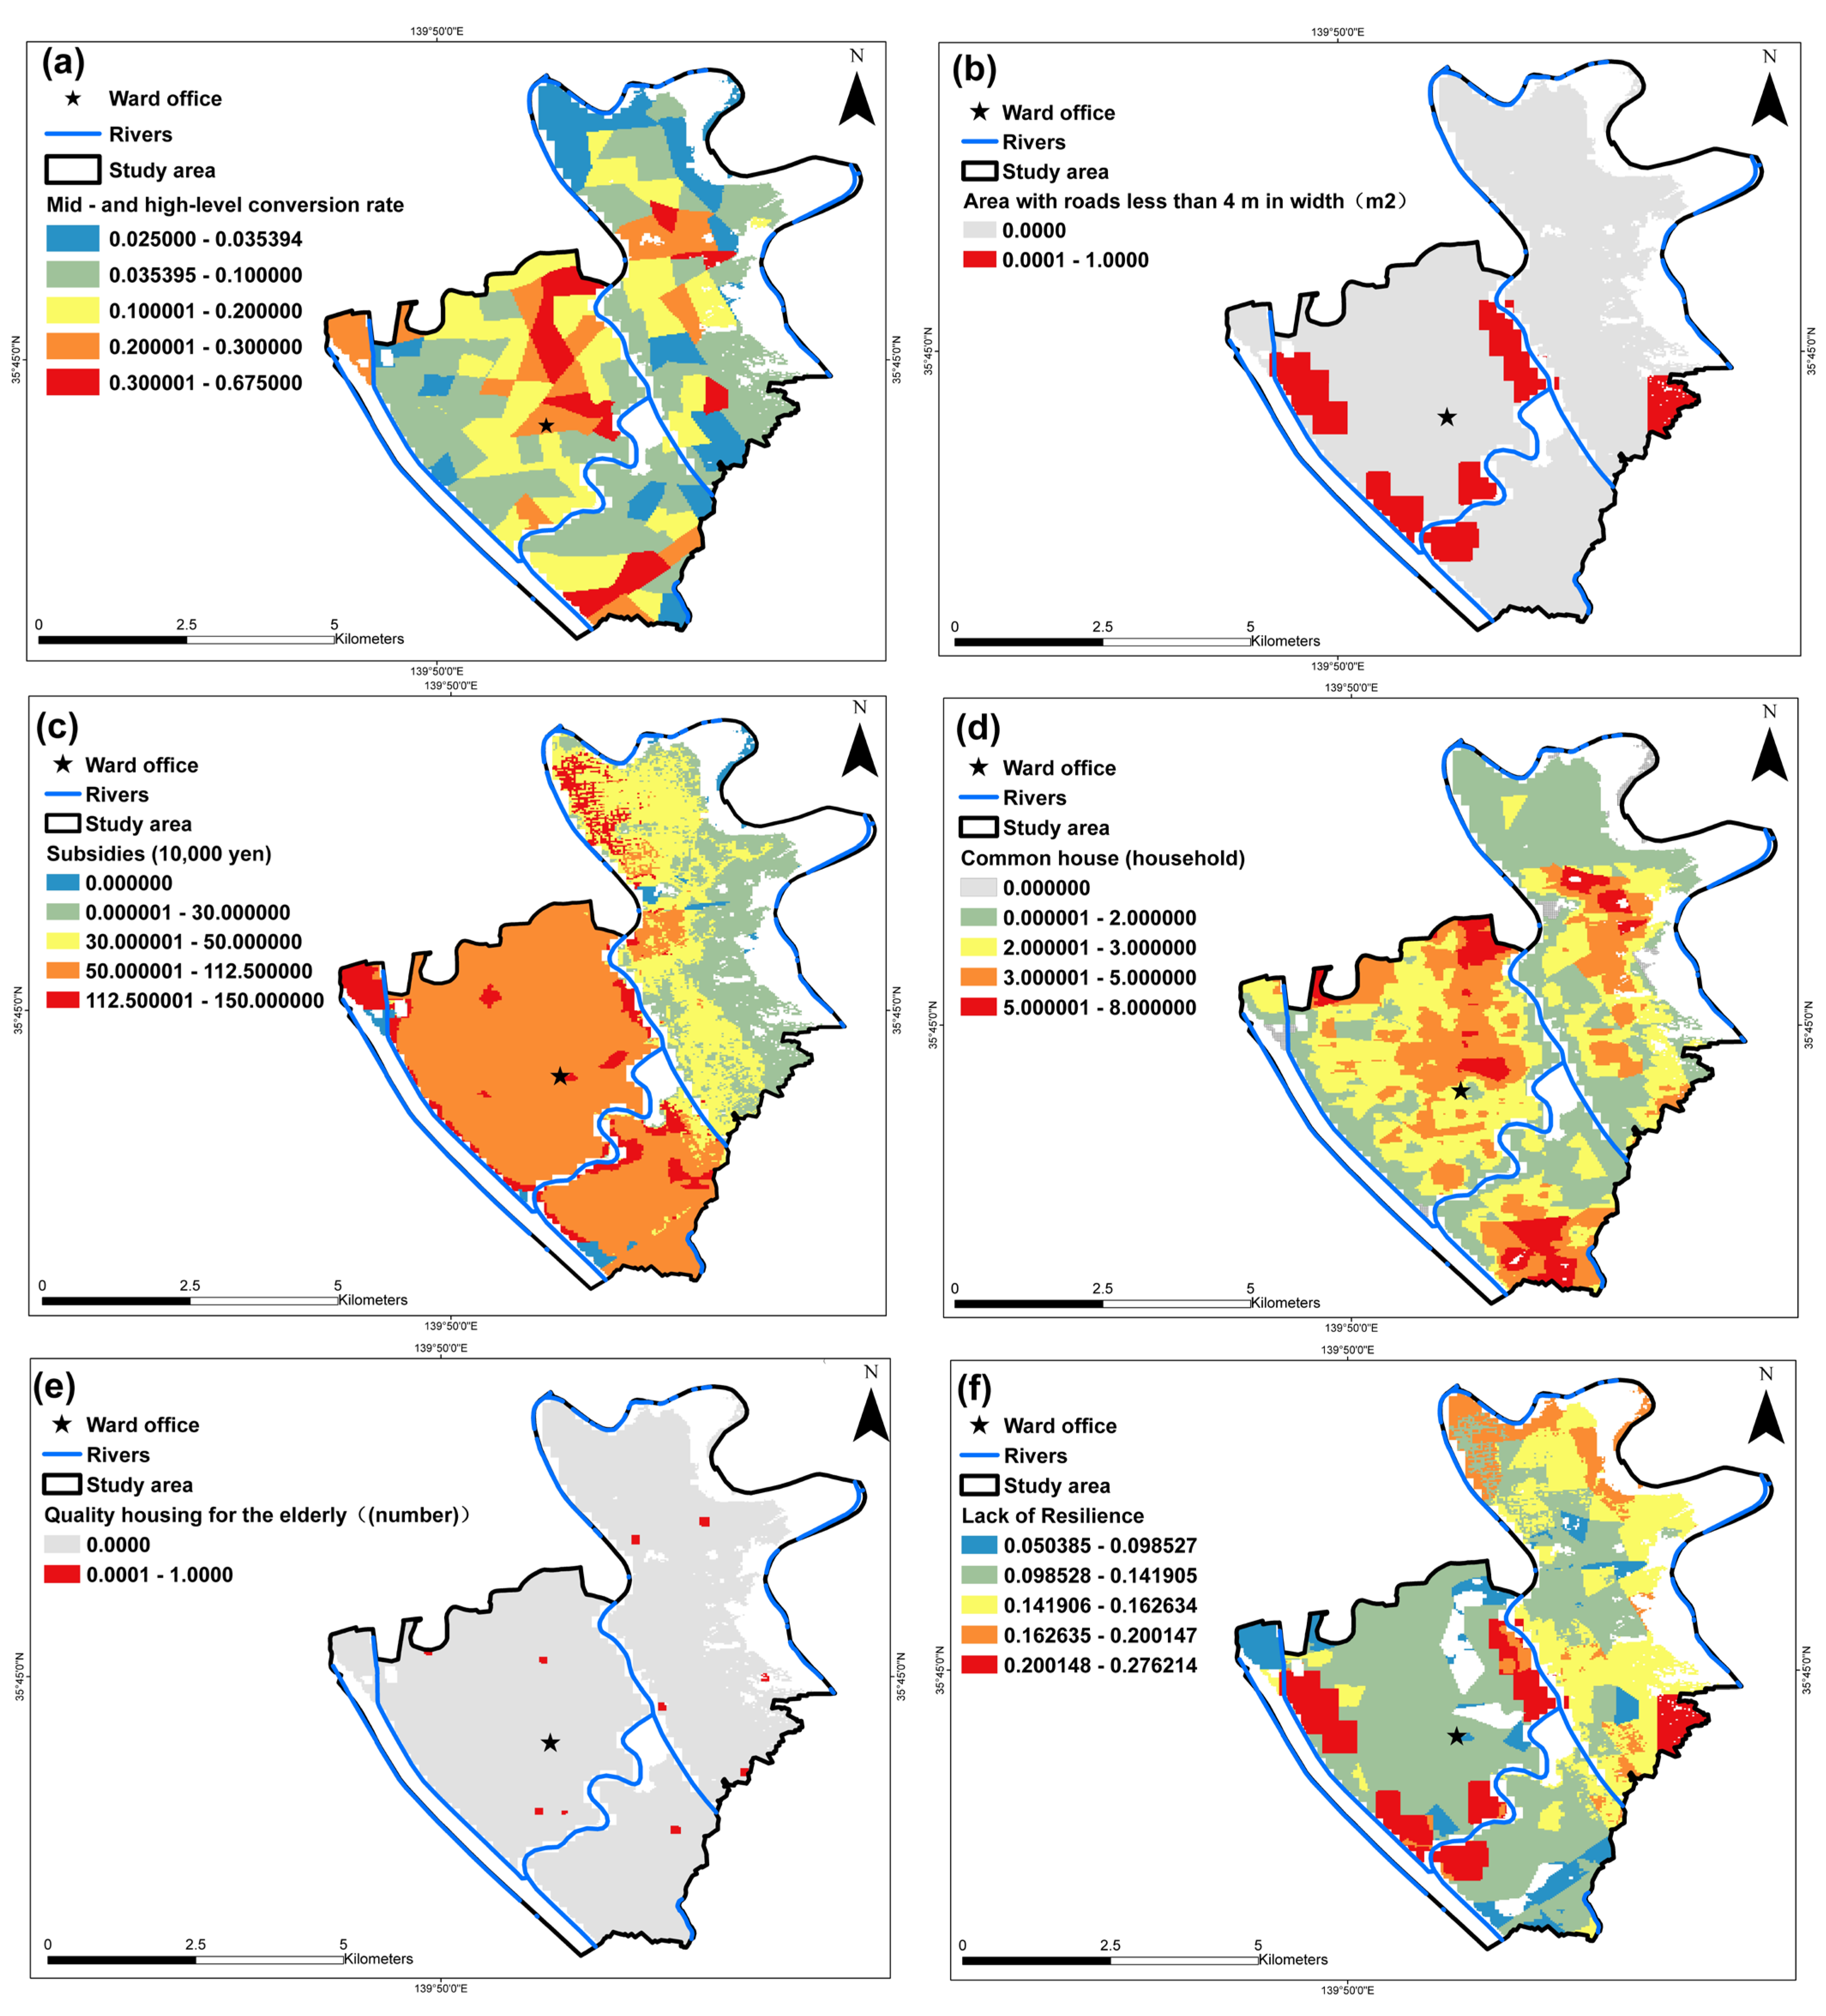
| Lack of Resilience | LoR1 | Mid—and high-level conversion rate | A greater rate of high-rise buildings corresponds to increased flood risk [10,21] | − |
| LoR2 | Area with roads less than 4 m in width (m2) | A larger area with roads less than 4 m in width is linked to higher flood risk [42]. | + | |
| LoR3 | Subsidies (10,000 yen) | Increased grants availability is associated with reduced flood risk [54]. | − | |
| LoR4 | Common house (household) | A higher prevalence of common homes results in reduced flood risk [55]. | − | |
| LoR5 | Quality housing for older adults (number) | An increased number of high-quality houses for older adults is linked to reduced flood risk [55]. | − |
| Module | Index Code | Index | |||
|---|---|---|---|---|---|
| Extent of hazard | H1 | ) | 0.0698 | 0.1939 | 0.1253 |
| H2 | ) | 0.1385 | 0.0561 | 0.0943 | |
| Exposure | E1 | Household (number) | 0.0506 | 0.1265 | 0.086 |
| E2 | Homestead rate | 0.0738 | 0.0553 | 0.0687 | |
| E3 | Rental households (number) | 0.0463 | 0.0437 | 0.0481 | |
| E4 | Home ownership population (number) | 0.0468 | 0.025 | 0.0367 | |
| Susceptibility | S1 | one-person family (number) | 0.0469 | 0.0611 | 0.057 |
| S2 | empty house (number) | 0.0706 | 0.0773 | 0.083 | |
| S3 | one-story residential building (number) | 0.0105 | 0.0372 | 0.0212 | |
| S4 | two-story residential building (number) | 0.0238 | 0.027 | 0.0272 | |
| S5 | wooden houses (number) | 0.0652 | 0.0193 | 0.0371 | |
| S6 | one-family house (number) | 0.0553 | 0.028 | 0.0423 | |
| Lack of Resilience | LoR1 | Mid—and high-level conversion rate | 0.0771 | 0.0752 | 0.0816 |
| LoR2 | Area with roads less than 4 m in width (m2) | 0.1005 | 0.0749 | 0.0931 | |
| LoR3 | Subsidies (10,000 yen) | 0.0722 | 0.0304 | 0.0502 | |
| LoR4 | Common house (household) | 0.0496 | 0.0315 | 0.0423 | |
| LoR5 | Quality housing for older people (number) | 0.00248 | 0.0376 | 0.0102 |
Disclaimer/Publisher’s Note: The statements, opinions and data contained in all publications are solely those of the individual author(s) and contributor(s) and not of MDPI and/or the editor(s). MDPI and/or the editor(s) disclaim responsibility for any injury to people or property resulting from any ideas, methods, instructions or products referred to in the content. |
© 2025 by the authors. Licensee MDPI, Basel, Switzerland. This article is an open access article distributed under the terms and conditions of the Creative Commons Attribution (CC BY) license (https://creativecommons.org/licenses/by/4.0/).
Share and Cite
Lianxiao; Morimoto, T.; Jin, H.; Tong, S.; Bao, Y. Assessment of Flood Risk of Residential Buildings by Using the AHP-CRITIC Method: A Case Study of the Katsushika Ward, Tokyo. Buildings 2025, 15, 2016. https://doi.org/10.3390/buildings15122016
Lianxiao, Morimoto T, Jin H, Tong S, Bao Y. Assessment of Flood Risk of Residential Buildings by Using the AHP-CRITIC Method: A Case Study of the Katsushika Ward, Tokyo. Buildings. 2025; 15(12):2016. https://doi.org/10.3390/buildings15122016
Chicago/Turabian StyleLianxiao, Takehiro Morimoto, Hugejiletu Jin, Siqin Tong, and Yuhai Bao. 2025. "Assessment of Flood Risk of Residential Buildings by Using the AHP-CRITIC Method: A Case Study of the Katsushika Ward, Tokyo" Buildings 15, no. 12: 2016. https://doi.org/10.3390/buildings15122016
APA StyleLianxiao, Morimoto, T., Jin, H., Tong, S., & Bao, Y. (2025). Assessment of Flood Risk of Residential Buildings by Using the AHP-CRITIC Method: A Case Study of the Katsushika Ward, Tokyo. Buildings, 15(12), 2016. https://doi.org/10.3390/buildings15122016