Article

A Study on the Quality Measurement of the 15-Minute Community Life Circle Based on Multisource Data in Qingdao

College of Civil Engineering and Architecture, Shandong University of Science and Technology, Qingdao 266590, China
*
Author to whom correspondence should be addressed.
Buildings 2025, 15(12), 1968; https://doi.org/10.3390/buildings15121968
Submission received: 29 April 2025 / Revised: 30 May 2025 / Accepted: 5 June 2025 / Published: 6 June 2025
(This article belongs to the Section Architectural Design, Urban Science, and Real Estate)

Abstract

With the shift of urbanization from large-scale expansion to high-quality transformation, the 15-minute community life circle (15-minute CLC) has emerged as a significant research focus. Enhancing the quality of 15-minute CLCs has become a critical issue requiring immediate attention. Based on the humanistic perspective, this study systematically analyzes the concept of 15-minute CLC and deeply analyzes the actual demands of residents. In this way, it constructs a 15-minute CLC quality measurement system covering three dimensions: public service facility allocation, public space quality, and pedestrian environment quality. The study takes the central area of Qingdao as the research object. It uses GIS spatial analysis, big data mining, and deep learning to measure the quality of 25 15-minute CLCs in the study area. The results reveal significant spatial heterogeneity in quality metrics across different 15-minute CLCs. This study advances a scientific approach to measuring 15-minute CLC quality and provides evidence-based decision support for targeted urban renewal strategies. Its findings hold substantial practical implications for fostering high-quality 15-minute CLC development.

1. Introduction

With the acceleration of urbanization, traditional urban functional layouts have gradually struggled to meet the growing demands of residents. Consequently, urban planning from the perspective of the 15-minute community life circle (15-minute CLC) has gained increasing attention. A 15-minute CLC refers to a basic unit within a suitable daily walking range that fulfills the diverse needs of urban and rural residents across their entire life cycle, including work and daily life [1]. Its essence lies in understanding, transforming, and renewing communities through a human-centric lens, emphasizing the interaction between the residents’ lives and community spaces [2].
The community life circle concept originated in Japan in the 1970s and has received widespread attention worldwide in recent years [3]. In China, Shanghai pioneered the implementation of the “15-minute CLC” concept, followed by cities such as Beijing, Guangzhou, and Hangzhou, which subsequently launched their initiatives of 15-minute CLC planning [4]. In 2023, Qingdao issued the Qingdao Urban Public Service Facilities Supporting Standards and Planning Guidelines (2023 Trial Version), providing local standards. A 15-minute CLC is not only a planning unit of physical space but also a vehicle for resource allocation [5]. It is also an important means to promote the optimization of community services and sustainable urban development [6]. Under the framework of the Polycrisis theory of the Anthropocene, 15-minute CLCs have been given a new mission, i.e., to be the smallest unit of governance to cope with climate change, economic fluctuations, and social fragmentation. Under the crisis of uncertainty, the planning of 15-minute CLCs should also be evaluated in terms of equity and sustainability [7]. By scientifically and rationally dividing and constructing 15-minute CLCs, the level of physical space and the actual needs of residents in different 15-minute CLCs can be accurately counted. Thus, it can provide solid data support and a decision-making basis for optimizing resource allocation and enhance the system’s resilience through accurate measurement.
Additionally, 15-minute CLCs provide residents with essential daily services and public activity spaces [8], covering education, healthcare, commerce, leisure, and more. With the acceleration of urbanization and the improvement of residents’ living standards, the current 15-minute CLC can no longer meet residents’ growing and diversified needs. There remains a significant gap between community construction and residents’ expectations. In this context, it is particularly urgent to establish a scientific and comprehensive measurement system. Current research on 15-minute CLCs primarily focuses on hierarchical structuring, facility allocation, and spatial optimization [9]. Some studies conducted single-dimensional evaluations and optimizations of public service facility allocation from the perspectives of demographic composition, subjective and objective evaluation, and temporal and spatial changes [2,4,10,11,12,13]. In addition, some studies have developed differentiated design methods, such as elderly-friendly [14,15,16] and child-friendly [17], from the perspective of specific groups to achieve precise functional enhancement. Although Li (2024) evaluated infrastructure and featured scenarios from multiple dimensions, they did not quantify subjective perception indicators (such as safety and comfort), ultimately reducing the analysis to a single dimension of functional configuration optimization [18]. In this regard, most of the existing evaluation systems are limited to a single physical space dimension [2,4,10,11,12,13,14,15,16,19,20]. The multidimensional evaluation system primarily involves objective indicators, such as infrastructure and public space evaluation [18], but it includes fewer subjective indicators related to residents’ needs [21].
The planning associated with 15 min CLCs encompasses not only physical environments but also social spaces [22]. In recent years, scholars have emphasized that the existence of physical space does not directly contribute to social cohesion but that the key lies in ‘meaningful interactions’ in actual use. Through activity diary surveys and structural equation modeling, Min (2024) revealed that community space usage influences social cohesion via neighborhood interactions as a mediator [23]. Liu (2022) highlighted that green spaces (e.g., parks and greenways) and blue spaces (e.g., lakes and rivers) offer attractive environments for leisure and socialization [24]. While green spaces have a positive impact on residents’ physical and mental health, these benefits only materialize when residents actively engage with these spaces [25]. Thus, spatial optimization must prioritize resident needs, foster public spaces conducive to social interaction [26,27], and ensure the visibility and accessibility of green spaces.
In this context, this study poses the question: How can a comprehensive, multidimensional 15-minute CLC quality measurement system be constructed and evaluated with precision?
Driven by modern information technologies, multisource data has introduced new perspectives and methods for measuring the quality of 15-minute CLCs. Integrating multisource data can effectively unveil temporal and spatial insights, enabling multidimensional assessments and more accurate reflections of current conditions. The methods used in this paper include geographic information systems (GIS) spatial analysis, big data analysis based on POI (points of interest), and deep learning. The semantic segmentation of street view photos through the deep learning system can quantify subjective feelings that were previously difficult to quantify in bulk, expanding the comprehensiveness of the evaluation system. The results of these analyses provide scientific foundations for optimizing the planning of 15-minute CLCs and help formulate more precise and effective optimization strategies.
Qingdao is a major city on China’s eastern coast and one of the country’s planned cities, renowned for its stunning natural landscape and rich historical architecture. Since 2021, when Qingdao was approved as one of the first national pilot cities for the “Quarter-hour Convenient Life Circle,” it has consistently endeavored to create an efficient and convenient 15-minute CLC and continuously improve its residents’ quality of life. This study takes Qingdao as the research object and conducts a 15-minute CLC delineation and quality measurement of the central area of Qingdao. First, the study constructs a 15-minute CLC quality measurement system by analyzing residents’ needs and introducing three dimensions: public service facility allocation, public space quality, and pedestrian environment quality. Subsequently, this study visualizes the spatial distribution of multisource data in ArcGIS 10.8.1 by collecting data that includes points of interest (POIs), geographic information road networks, and street view images. Finally, the 15-minute CLC in the central area of Qingdao is finely diagnosed based on the visualization results, allowing for the proposal of a refined optimization strategy.
The innovation of this paper is mainly reflected in the innovation of the theoretical framework. By summarizing the evaluation systems of previous studies, a new measurement system for the quality of the 15-minute CLC is constructed, incorporating the level of residents’ needs and subjective feeling evaluation based on physical space evaluation. The system can identify service gaps in urban areas, thus forming a “diagnosis–intervention” paradigm. This paradigm not only helps to accurately identify the problems existing at the human scale 15-minute CLC but also provides an essential reference for community construction in the new period.

2. Materials and Methods

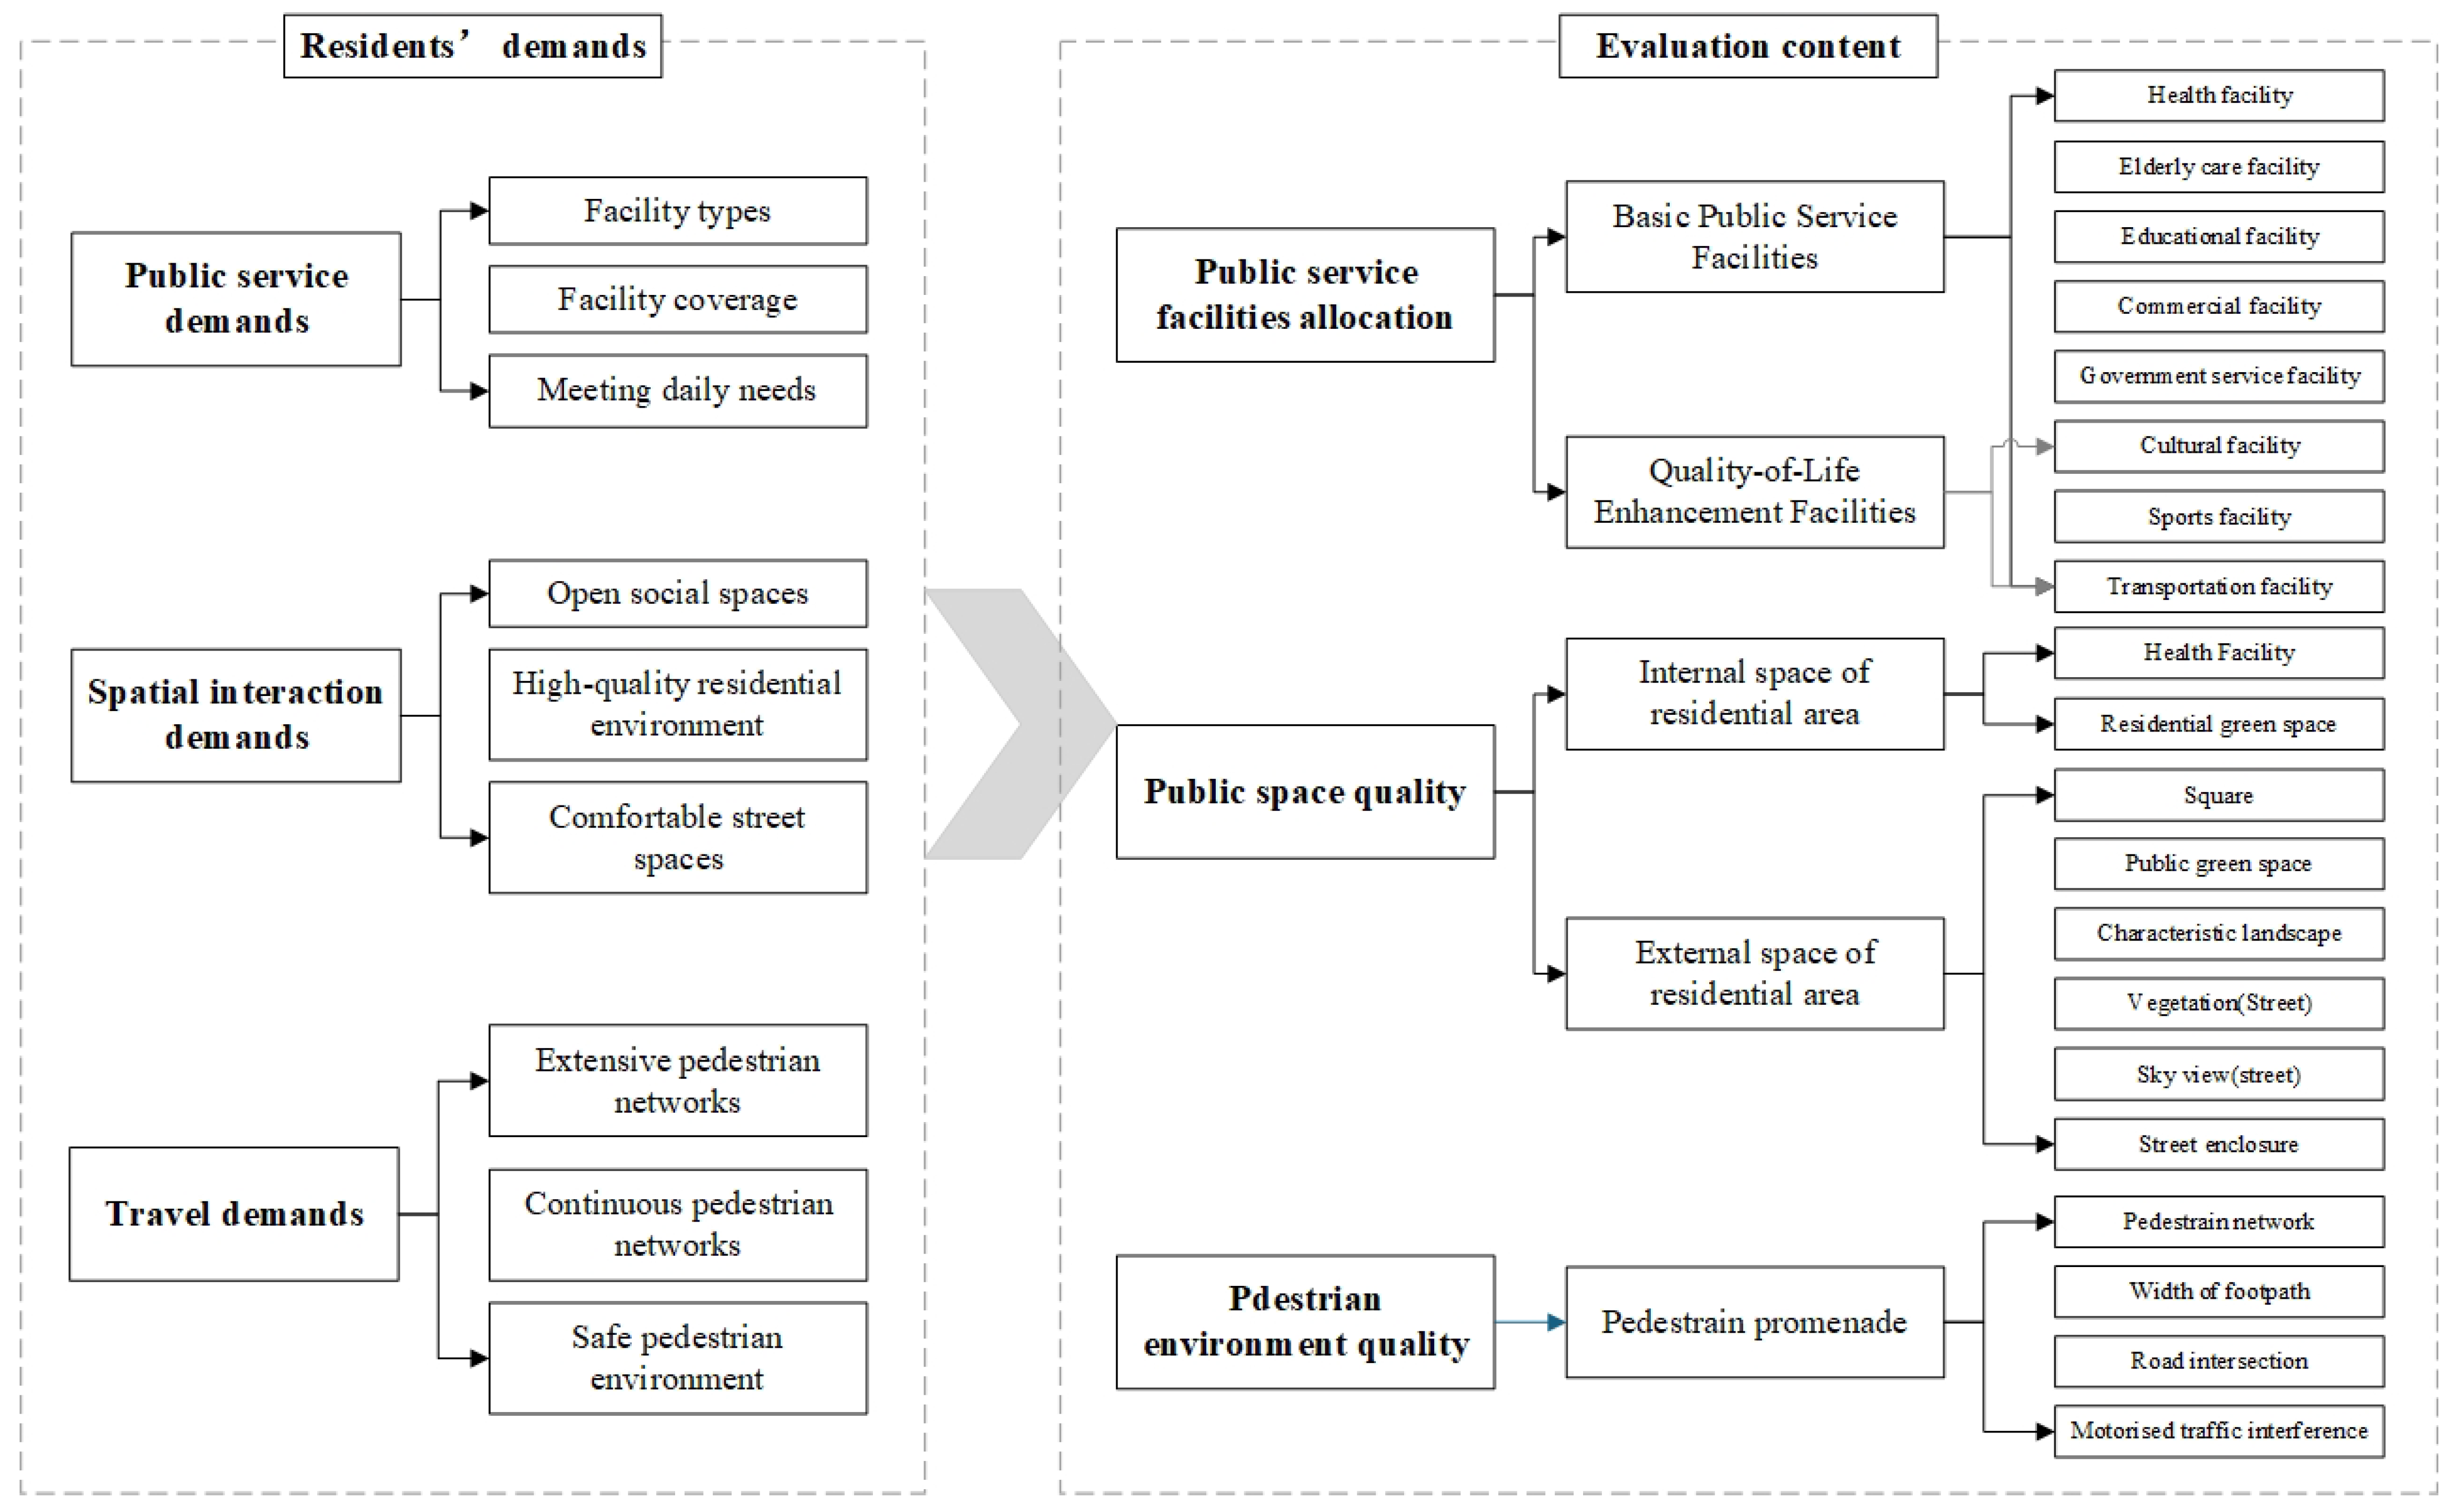
2.1. Construction of the 15-Minute CLC Quality Measurement System with the People-Oriented Scale

According to the concept of people-oriented community development, this study starts from the actual demands of residents. It divides the demands of community residents into public service demands, spatial interaction demands, and travel demands. In the dimension of public service demand, the diversified and multi-level configuration of public service facilities guarantees residents’ daily life needs. In the dimension of spatial interaction demand, community public space carries rich behavioral scenarios, and the creation of behavioral scenarios and the improvement of the environmental quality of public space meet the spatial interaction demand of residents. In the dimension of travel demand, the pedestrian network effectively improves residents’ willingness to travel in a comfortable and smooth slow-walking environment. Based on the demand framework, this study constructs a human-scale quality measurement system for 15-minute CLCs from three dimensions: public service facility allocation, public space quality, and pedestrian environment quality (Figure 1). Finally, the accurate mapping of human-centered demand is achieved through multisource data fusion.

2.2. Selection of Public Service Facilities and Service Distance

A people-oriented 15-minute CLC requires a variety of public service facilities and comprehensive coverage to meet the daily needs of residents. At the facility type level, based on the different levels of demand, this study classifies public service facilities into basic public service facilities and quality-of-life enhancement facilities. Basic public service facilities focus on meeting residents’ basic demands and are universal and necessary, such as educational facilities, healthcare facilities, and elderly care facilities. Quality-of-life enhancement facilities are important vehicles for further improving the quality of life of residents on the premise of guaranteeing basic demands. Such facilities can provide residents with higher-level services and enrich their life experience, such as cultural facilities and sports facilities. In terms of configuration strategy, the 15-minute CLC should uphold the principle of ‘preserving the basics and promoting enhancement’. Priority should be given to making up the short board of basic public service facilities in the whole area, and various quality-life enhancement facilities can be allocated in economically developed areas according to the demands [1].
When carrying out the selection of specific service facilities, according to the provisions of the Technical Guidelines for Community Life Circle Planning, the Standard for the Planning and Design of Urban Residential Areas GB50180-2018, and Qingdao Urban Public Service Facilities Supporting Standards and Planning Guidelines (2023 Trial Version), the public service facilities are subdivided into eight categories of facilities, namely healthcare, elderly care, educational, cultural, sports, commercial, government service, and transportation facilities [1,28,29]. Moreover, the service distance is determined according to the norms (Table 1). When evaluating the allocation of public service facilities, less developed regions focus on the coverage rate of basic public service facilities. In contrast, economically developed regions need to evaluate the allocation level of both types of facilities comprehensively.

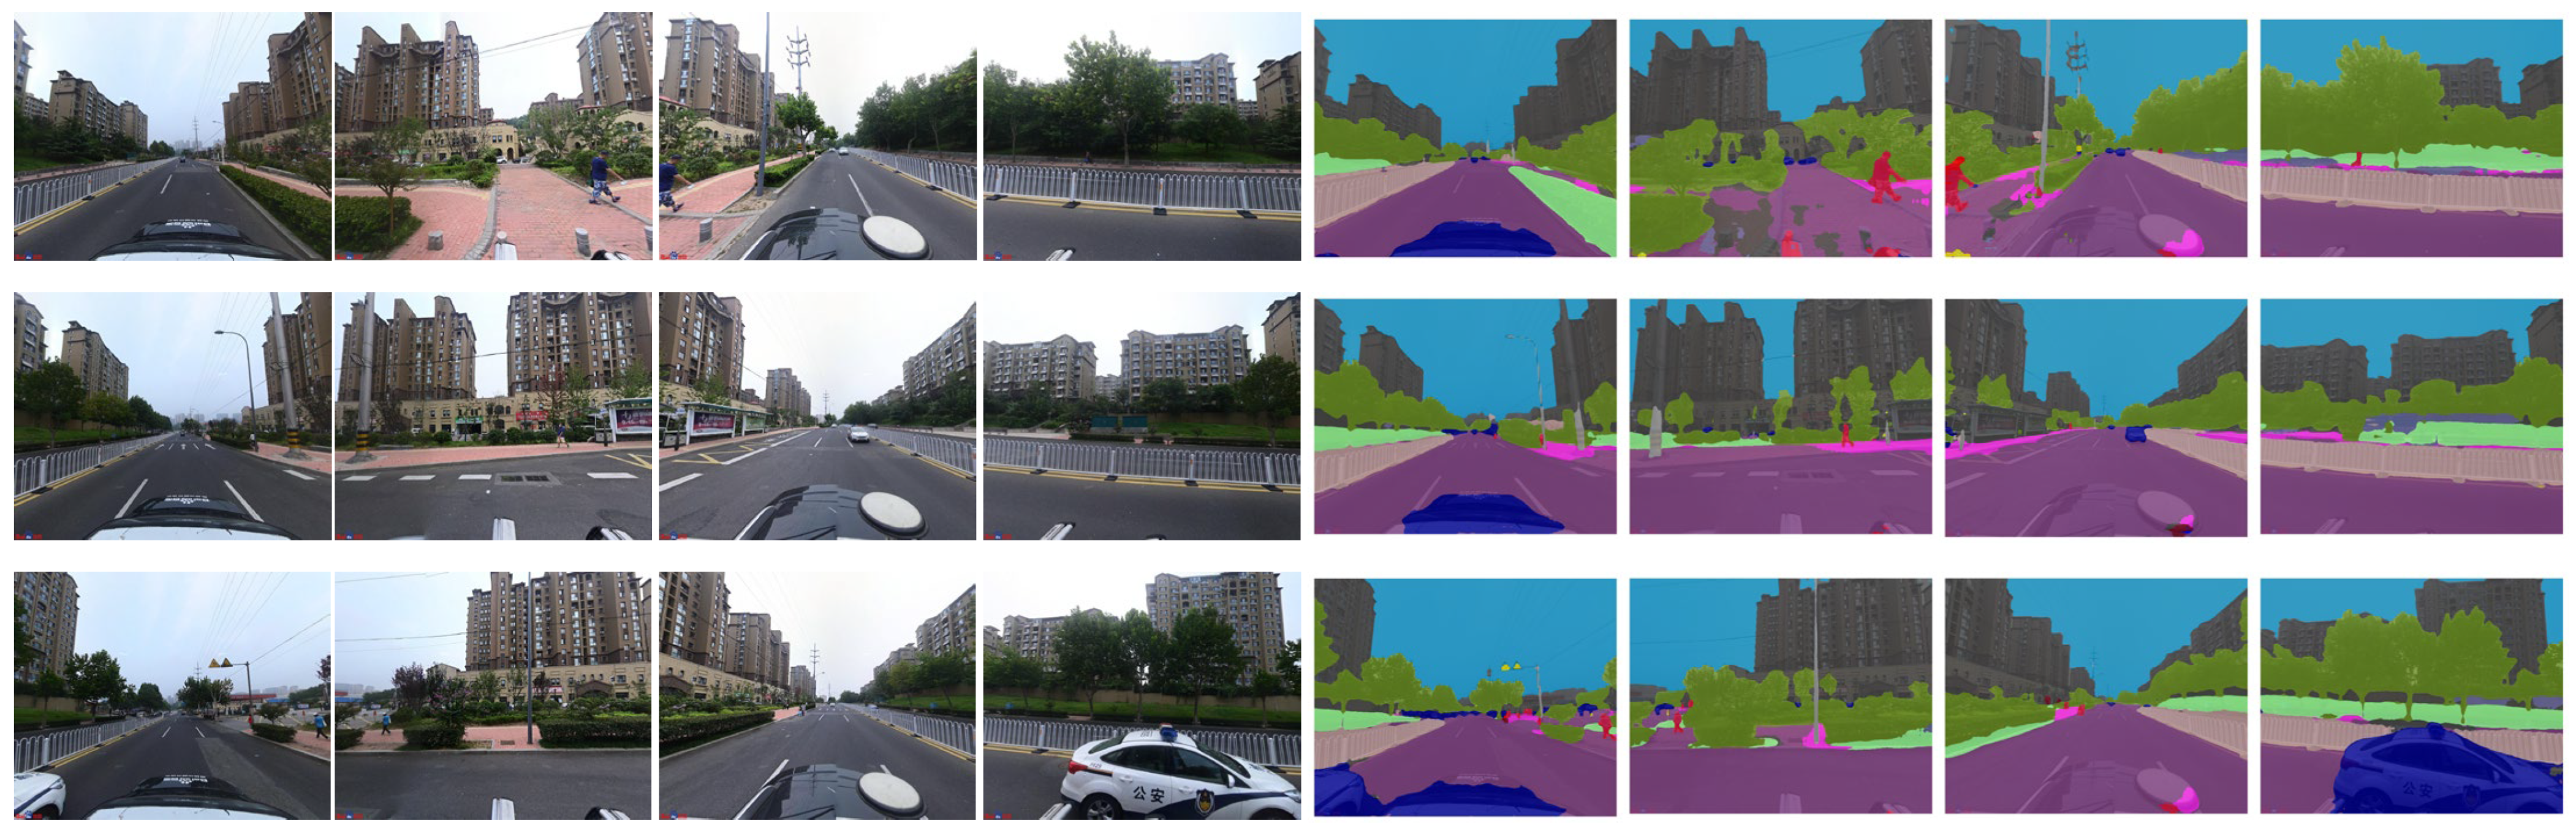
2.3. Selection and Quantification of Indicators Related to Public Space Quality

At the level of public space demand, the modern 15-minute CLC should meet residents’ multi-level social interaction demands. It is mainly reflected in three aspects: the need to allocate sufficient open interaction sites [30], the creation of a high-quality settlement interaction environment, and the creation of pleasant street interaction spaces. Considering the differences in the nature of spaces inside and outside settlements, this study divides public spaces in the community into internal and external spaces of settlements. The study selects indicators on this basis.
In the evaluation of the internal space of the settlement, this study utilizes macro-indicators, including average plot ratio and average green space ratio, to characterize the overall environmental quality of the settlement. The average plot ratio is used to measure the per capita enjoyment of public space within the 15-minute CLC. The average green space ratio can effectively reflect the proportion of various types of green space within the settlement. In the evaluation of the external space of the settlement, the study quantitatively analyzes the accessibility of squares and public green spaces by calculating their 15-minute walking distance [20]. In addition, characteristic landscapes (including natural landscapes and historic buildings) significantly impact spatial quality and increase the length of time residents stay [18]. In this study, the kernel density algorithm is used to measure the spatial radiation intensity of characteristic landscapes and to characterize the attractiveness of landscape elements to residents’ stopping behaviors. In terms of evaluating the spatial quality of street interaction, the study is based on the semantic segmentation technology of streetscape images, which transforms residents’ subjective perception into quantifiable indicators such as street green view index, sky view factor, and street enclosure ratio [31].

2.4. Selection of Indicators Related to Pedestrian Environment Quality

At the level of residents’ travel demands, the quality of the walking path network is a key factor affecting the traveling experience. It is mainly reflected in three core dimensions, i.e., adequacy of road network coverage, road network continuity, and safety of the walking environment. Based on the research framework of 15-minute CLC, this study focuses on the road system within walking distance, including diverse walking spaces such as urban pavements, recreational greenways, and fitness trails. In order to systematically evaluate the quality characteristics of the pedestrian network, the study adopts the pedestrian network density indicator to measure the coverage adequacy of the pedestrian network [20]. The relative sidewalk width and pedestrian continuity index are used to assess the accessibility of spatial connections [32]. The motorized traffic interference index is used to quantify the safety level of the walking environment [31]. Thus, the quality of the pedestrian network is comprehensively assessed.

2.5. Construction of Quality Measurement System and Calculation

Based on the above analyses, the quality measurement system for 15-minute CLCs is constructed (Table 2), with 15-minute CLCs finely measured through 20 indicators in three categories.
In the dimension of evaluation of public service facility allocation, this study adopts the coverage index to quantitatively evaluate eight types of public service facilities (healthcare, elderly care, educational, cultural, sports, commercial, government service, and transportation). Based on the ArcGIS 10.8 platform, the calculation is completed by the following steps: (1) constructing the facility service radius model to determine the service distance of each type of facility; (2) generating the precise service range by using Network Analyst; and (3) calculating the coverage rate of facilities.
The evaluation of public space quality adopts a three-level index system: the internal space quality of the settlement, the external space quality of the settlement, and the street space quality. (1) The internal interaction space quality of the settlement is quantified by calculating the average value of the residential plot ratio and residential green space ratio. (2) In the evaluation of the external spatial quality of the settlement, square accessibility and public green space accessibility are obtained by calculating the 15-minute accessibility ranges using the network analysis method in the ArcGIS 10.8.1 platform. The kernel density of characteristic landscapes is calculated by using the kernel density algorithm in the ArcGIS 10.8 platform. (3) Computer vision technology is introduced for street space quality evaluation. Based on the Deeplabv3 deep learning framework and Cityscapes image semantic segmentation model, pixel-level recognition is performed on the acquired street view images to obtain the pixel count of trees, sky, buildings, and more to calculate the street green view index, sky view factor, and street enclosure ratio.
In the evaluation of pedestrian environment quality, the pedestrian network density and pedestrian continuity index are obtained by calculating the density of the pedestrian network and the number of intersections in the ArcGIS 10.8.1 platform (the number of intersections reflects the pedestrian continuity). Relative sidewalk width and motorized traffic interference index were also obtained by semantic segmentation of the streetscape image. The relevant calculations are performed by extracting the pixel number of sidewalks, driveways, and motor vehicles in the streetscape image.

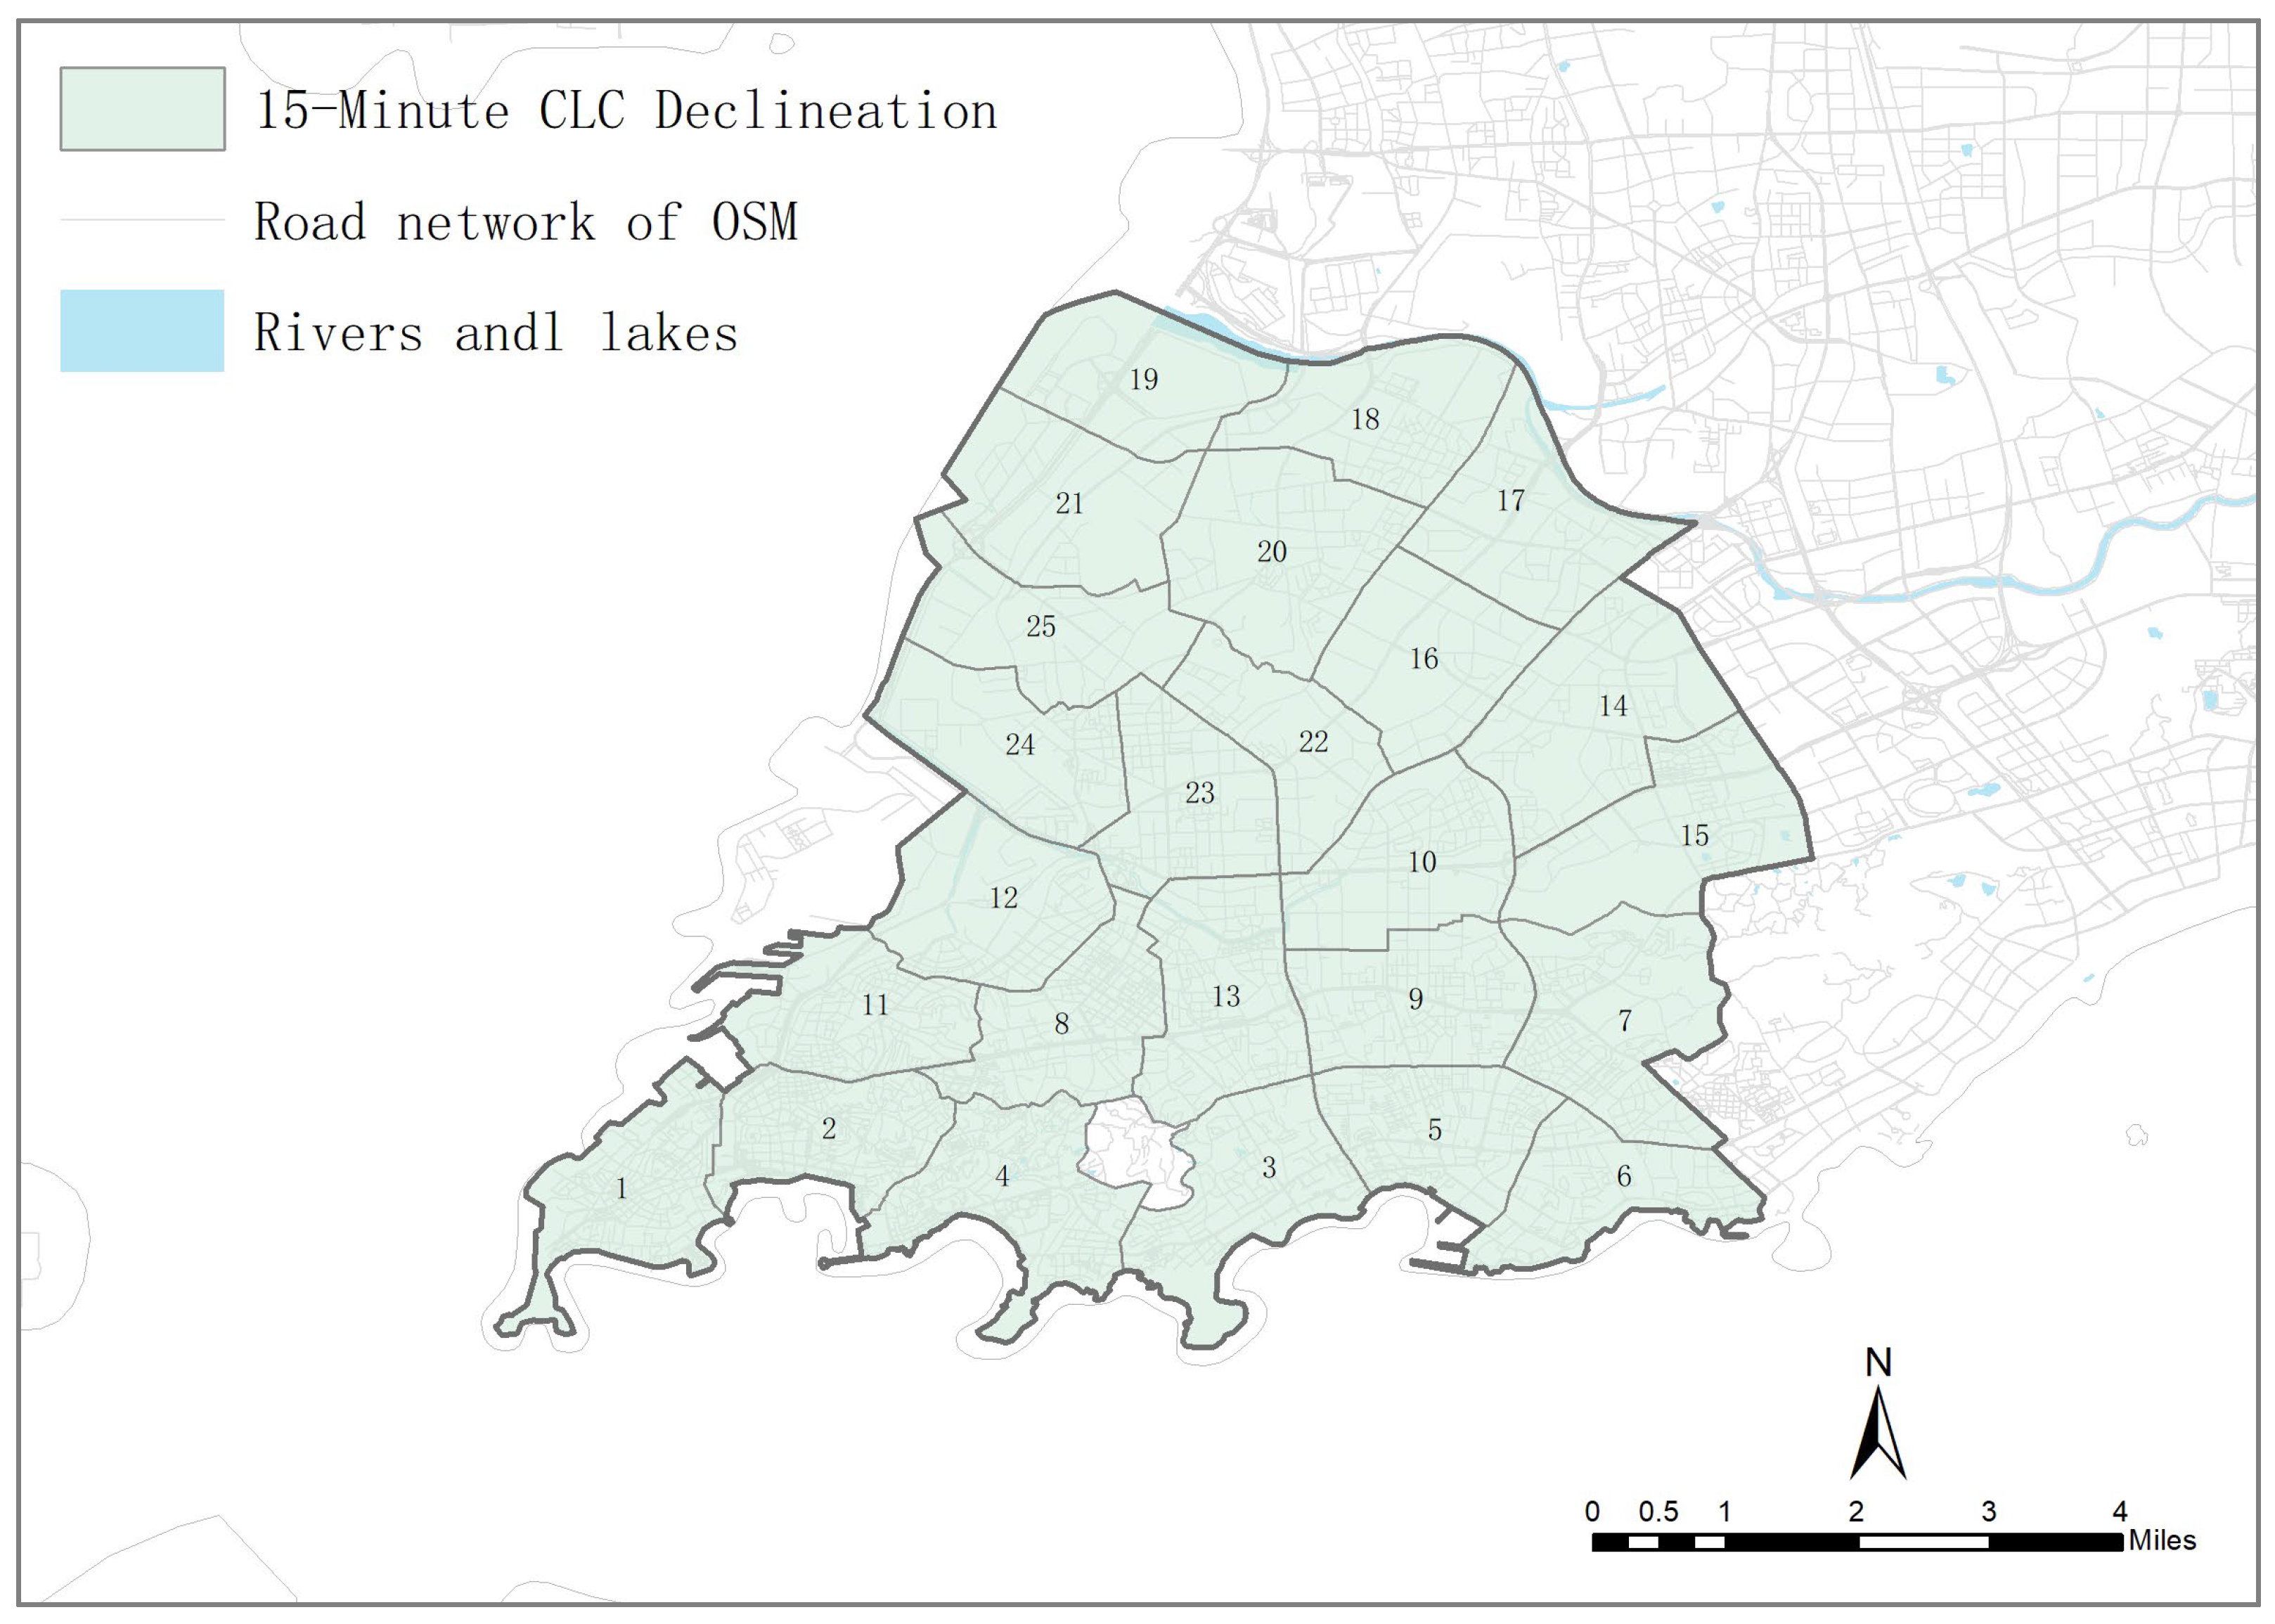
2.6. Study Area and Data Sources

The study area is defined as the central area of Qingdao, i.e., Shinan District and Shibei District, with a total area of 95.41 km2. From the point of view of population and built-up environment, the study area is characterized by a high population density, a more complete built-up environment, and a higher degree of development. The level of regional economic development is comparable, and the size of the street delineation is similar. In the delineation of 15-minute CLCs, reference is made to the relevant Chinese planning standards. The size of 15-minute CLCs is controlled at 3–5 km2, covering a residential population of 50,000–100,000 people and avoiding crossing obvious geographical boundaries such as urban railways, main roads, rivers, and mountains [1]. Based on the above requirements, 25 15-minute CLCs were ultimately delineated (Figure 2).
This study takes the 15-minute CLC as the basic research unit. The basic geographic data, such as administrative district boundaries, green areas, and waters, were obtained from the Resource and Environmental Science and Data Platform of the Chinese Academy of Sciences (https://www.resdc.cn/) (accessed on 18 November 2023). Urban road network data were obtained from OSM (OpenStreetMap) (https://www.openstreetmap.org/) (accessed on 18 November 2023). POI data were obtained in bulk through the Gaode Map API (http://lbs.amap.com/) (accessed on 19 March 2024). After data cleaning and invalid entry removal, a total of 30,348 valid data entries were obtained. The street view images were obtained through Baidu Map API (http://lbs.baidu.com/) (accessed on 17 September 2024). Invalid roads were first rejected by matching the street view track map, and then sampling points were set at 50 m intervals to acquire 149,904 panoramic images corresponding to 37,476 sampling points. The study uses the Deeplabv3 deep learning framework with the Cityscapes image semantic segmentation model to classify and recognize the acquired street view images at the pixel level (Figure 3). Subsequently, using the ArcGIS platform, the study projected the identification results with geo-referenced information into the urban space to analyze the quality of 15-minute CLCs.

3. Results

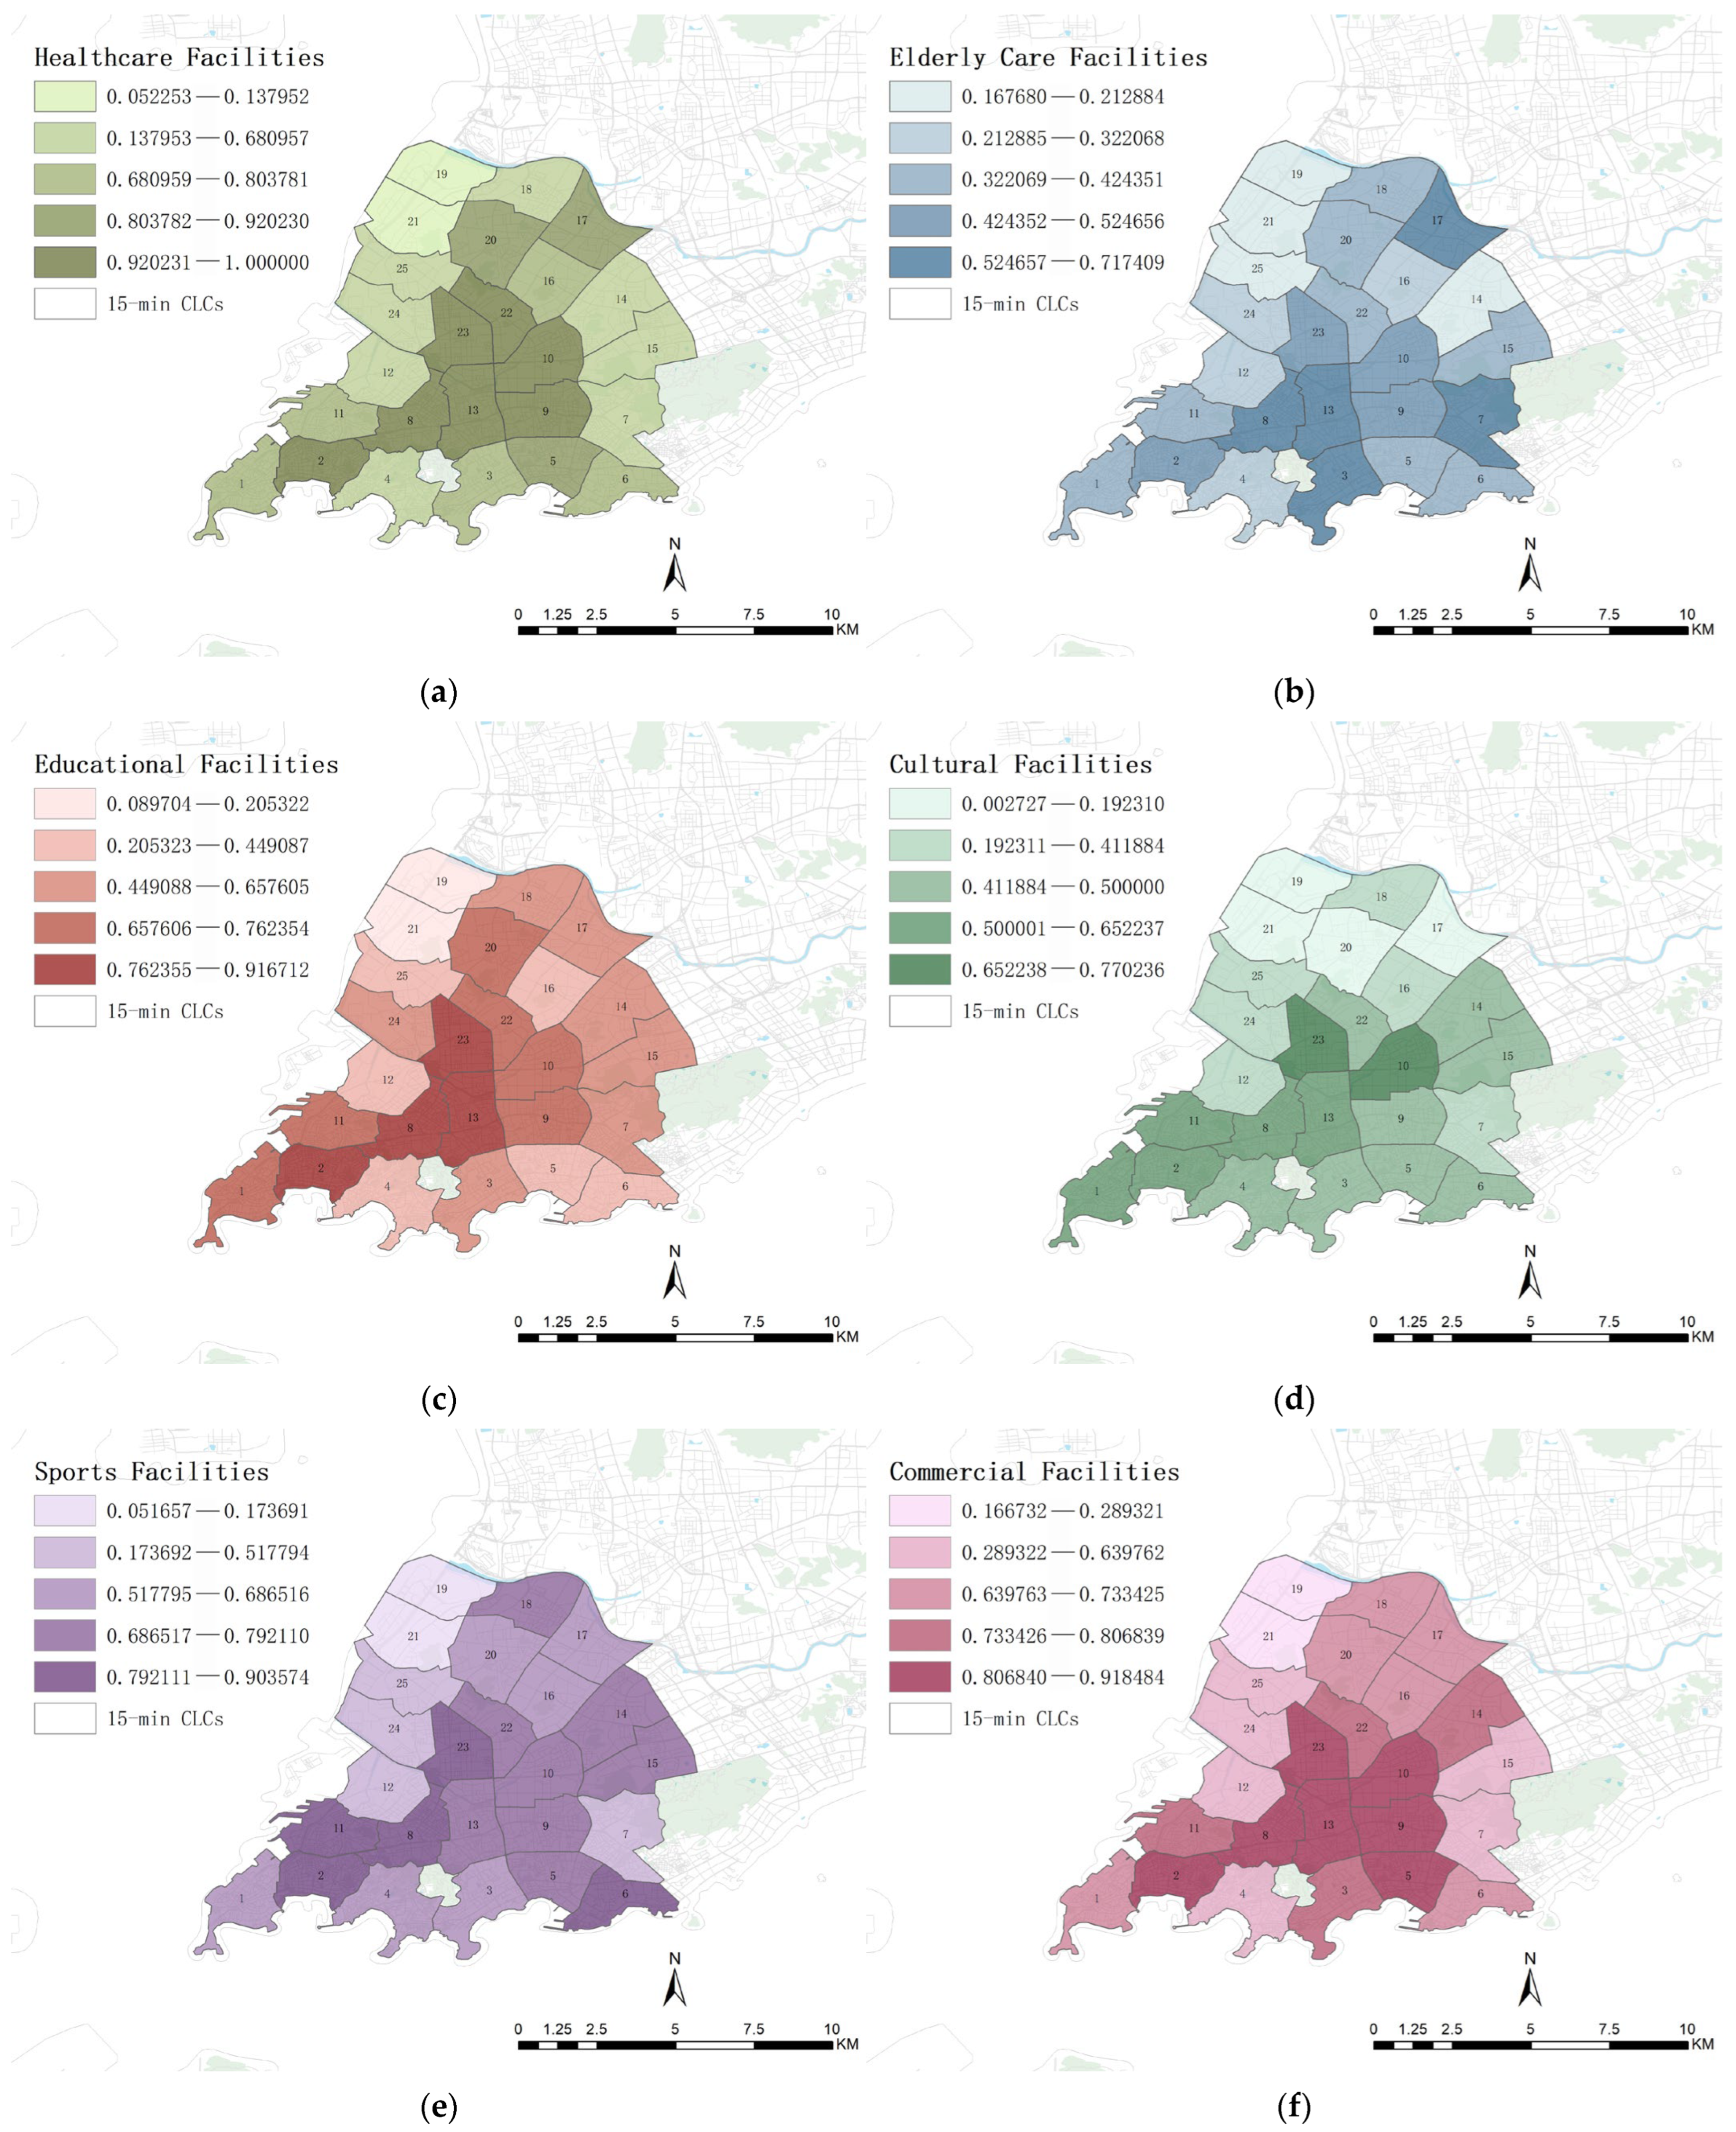
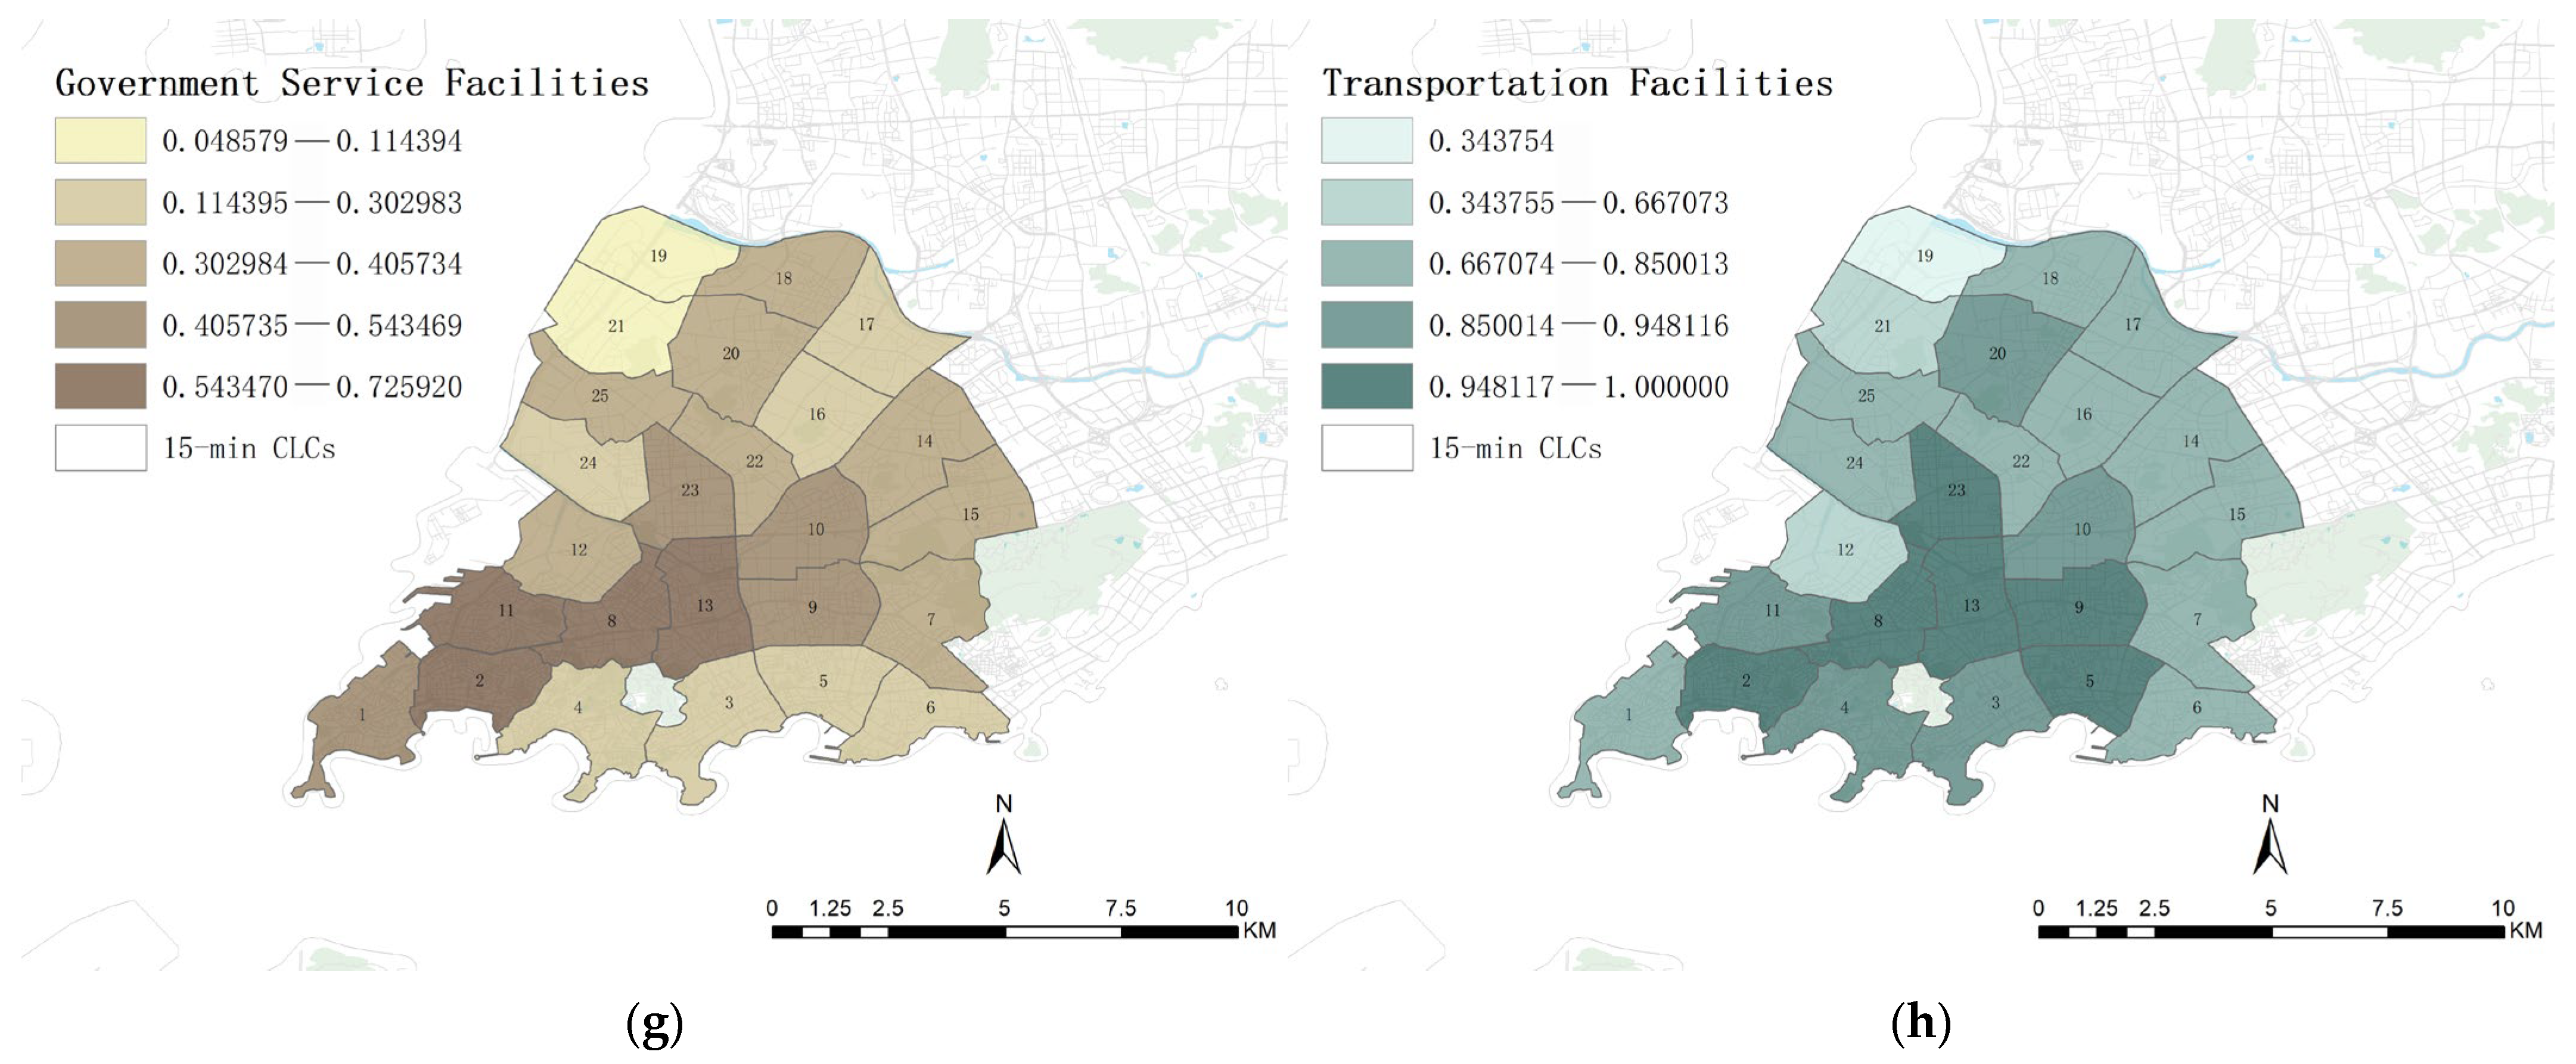
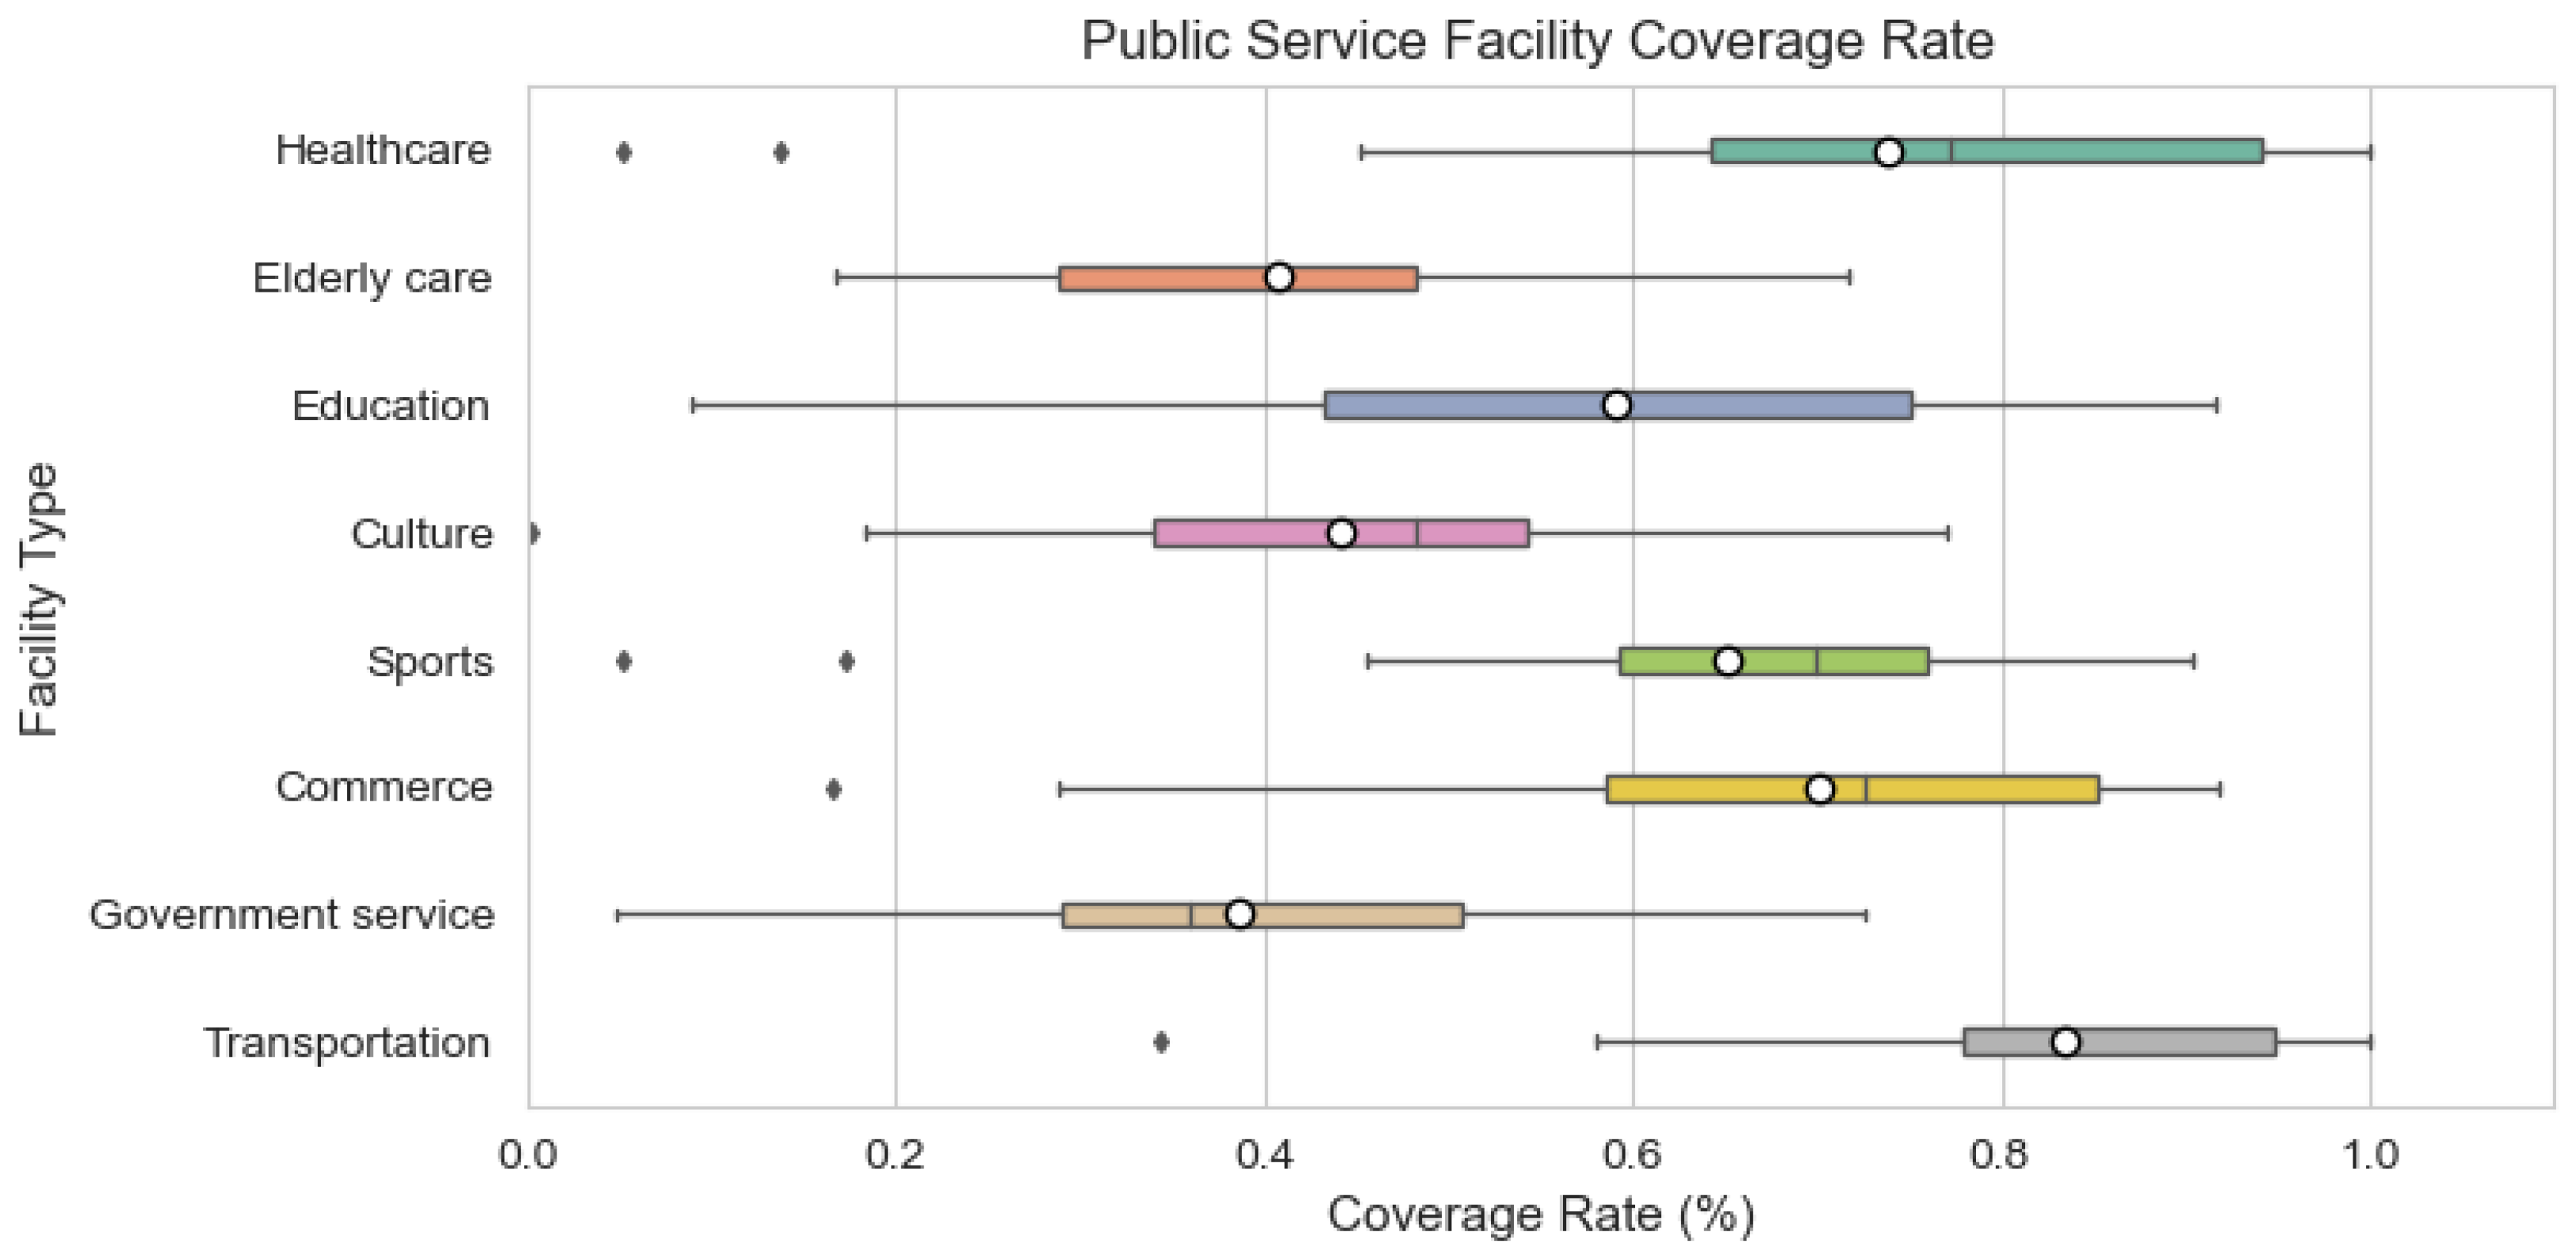
3.1. Evaluation of Public Service Facility Allocation

After taking the overall mean of the coverage of the 25 subcategories of facilities by major category, it is found that all eight categories of public service facilities show a distribution pattern of high core—low periphery. Areas 8, 13, and 23 in the center form a continuous high-density service core, with a coverage rate of more than 70% for several types of facilities, forming a 15-minute CLC with a high level of coverage for all types of facilities. The peripheral areas have lower facility coverage, especially areas 19 and 21 in the northwest, where most of the facility coverage is below 30%, and the functional gaps are significant. This is because the western coastal areas are restricted by the functional positioning of port industrial zones, with relatively poor locational conditions and environment, and public service support lagging behind for a long time. It can be seen that Qingdao’s central area has formed a 15-minute CLC with high functional complexity, but the problem of uneven distribution of regional development is prominent (Figure 4).
From the point of view of the spatial distribution characteristics of individual functions, various types of public service facilities show a significant pattern of differentiation. Taking three of these types of facilities as an example, the spatial distribution of healthcare facilities shows a typical central radial pattern. The center of the study area forms an obvious peak area with service coverage of up to 100%. However, as the distance increases, the supply in the peripheral areas is obviously insufficient (Figure 4a). The spatial pattern of elderly care facilities shows a polycentric distribution with high in the south and low in the north, with a service coverage of 71.7% in area 8 and 16.7% in area 21, forming a significant difference of 4:1 between the two (Figure 4b). The distribution of sports facilities, on the other hand, shows a relatively balanced pattern, with the coverage rate of the remaining regions remaining above 50%, except for the northwest, where there are localized gaps in supply (Figure 4e).
From the statistical data (Figure 5), the overall coverage rate of the eight categories of public service facilities is high (the average median reaches 0.605). However, the coverage rate of the facilities varies greatly (the average variance is 0.037). Individually, the coverage rates of healthcare, educational, commercial, and transportation facilities are higher overall, while the coverage rates of elderly care, cultural, and government service facilities are lower (median not exceeding 0.5). Regional differences in the coverage of educational facilities are the greatest.

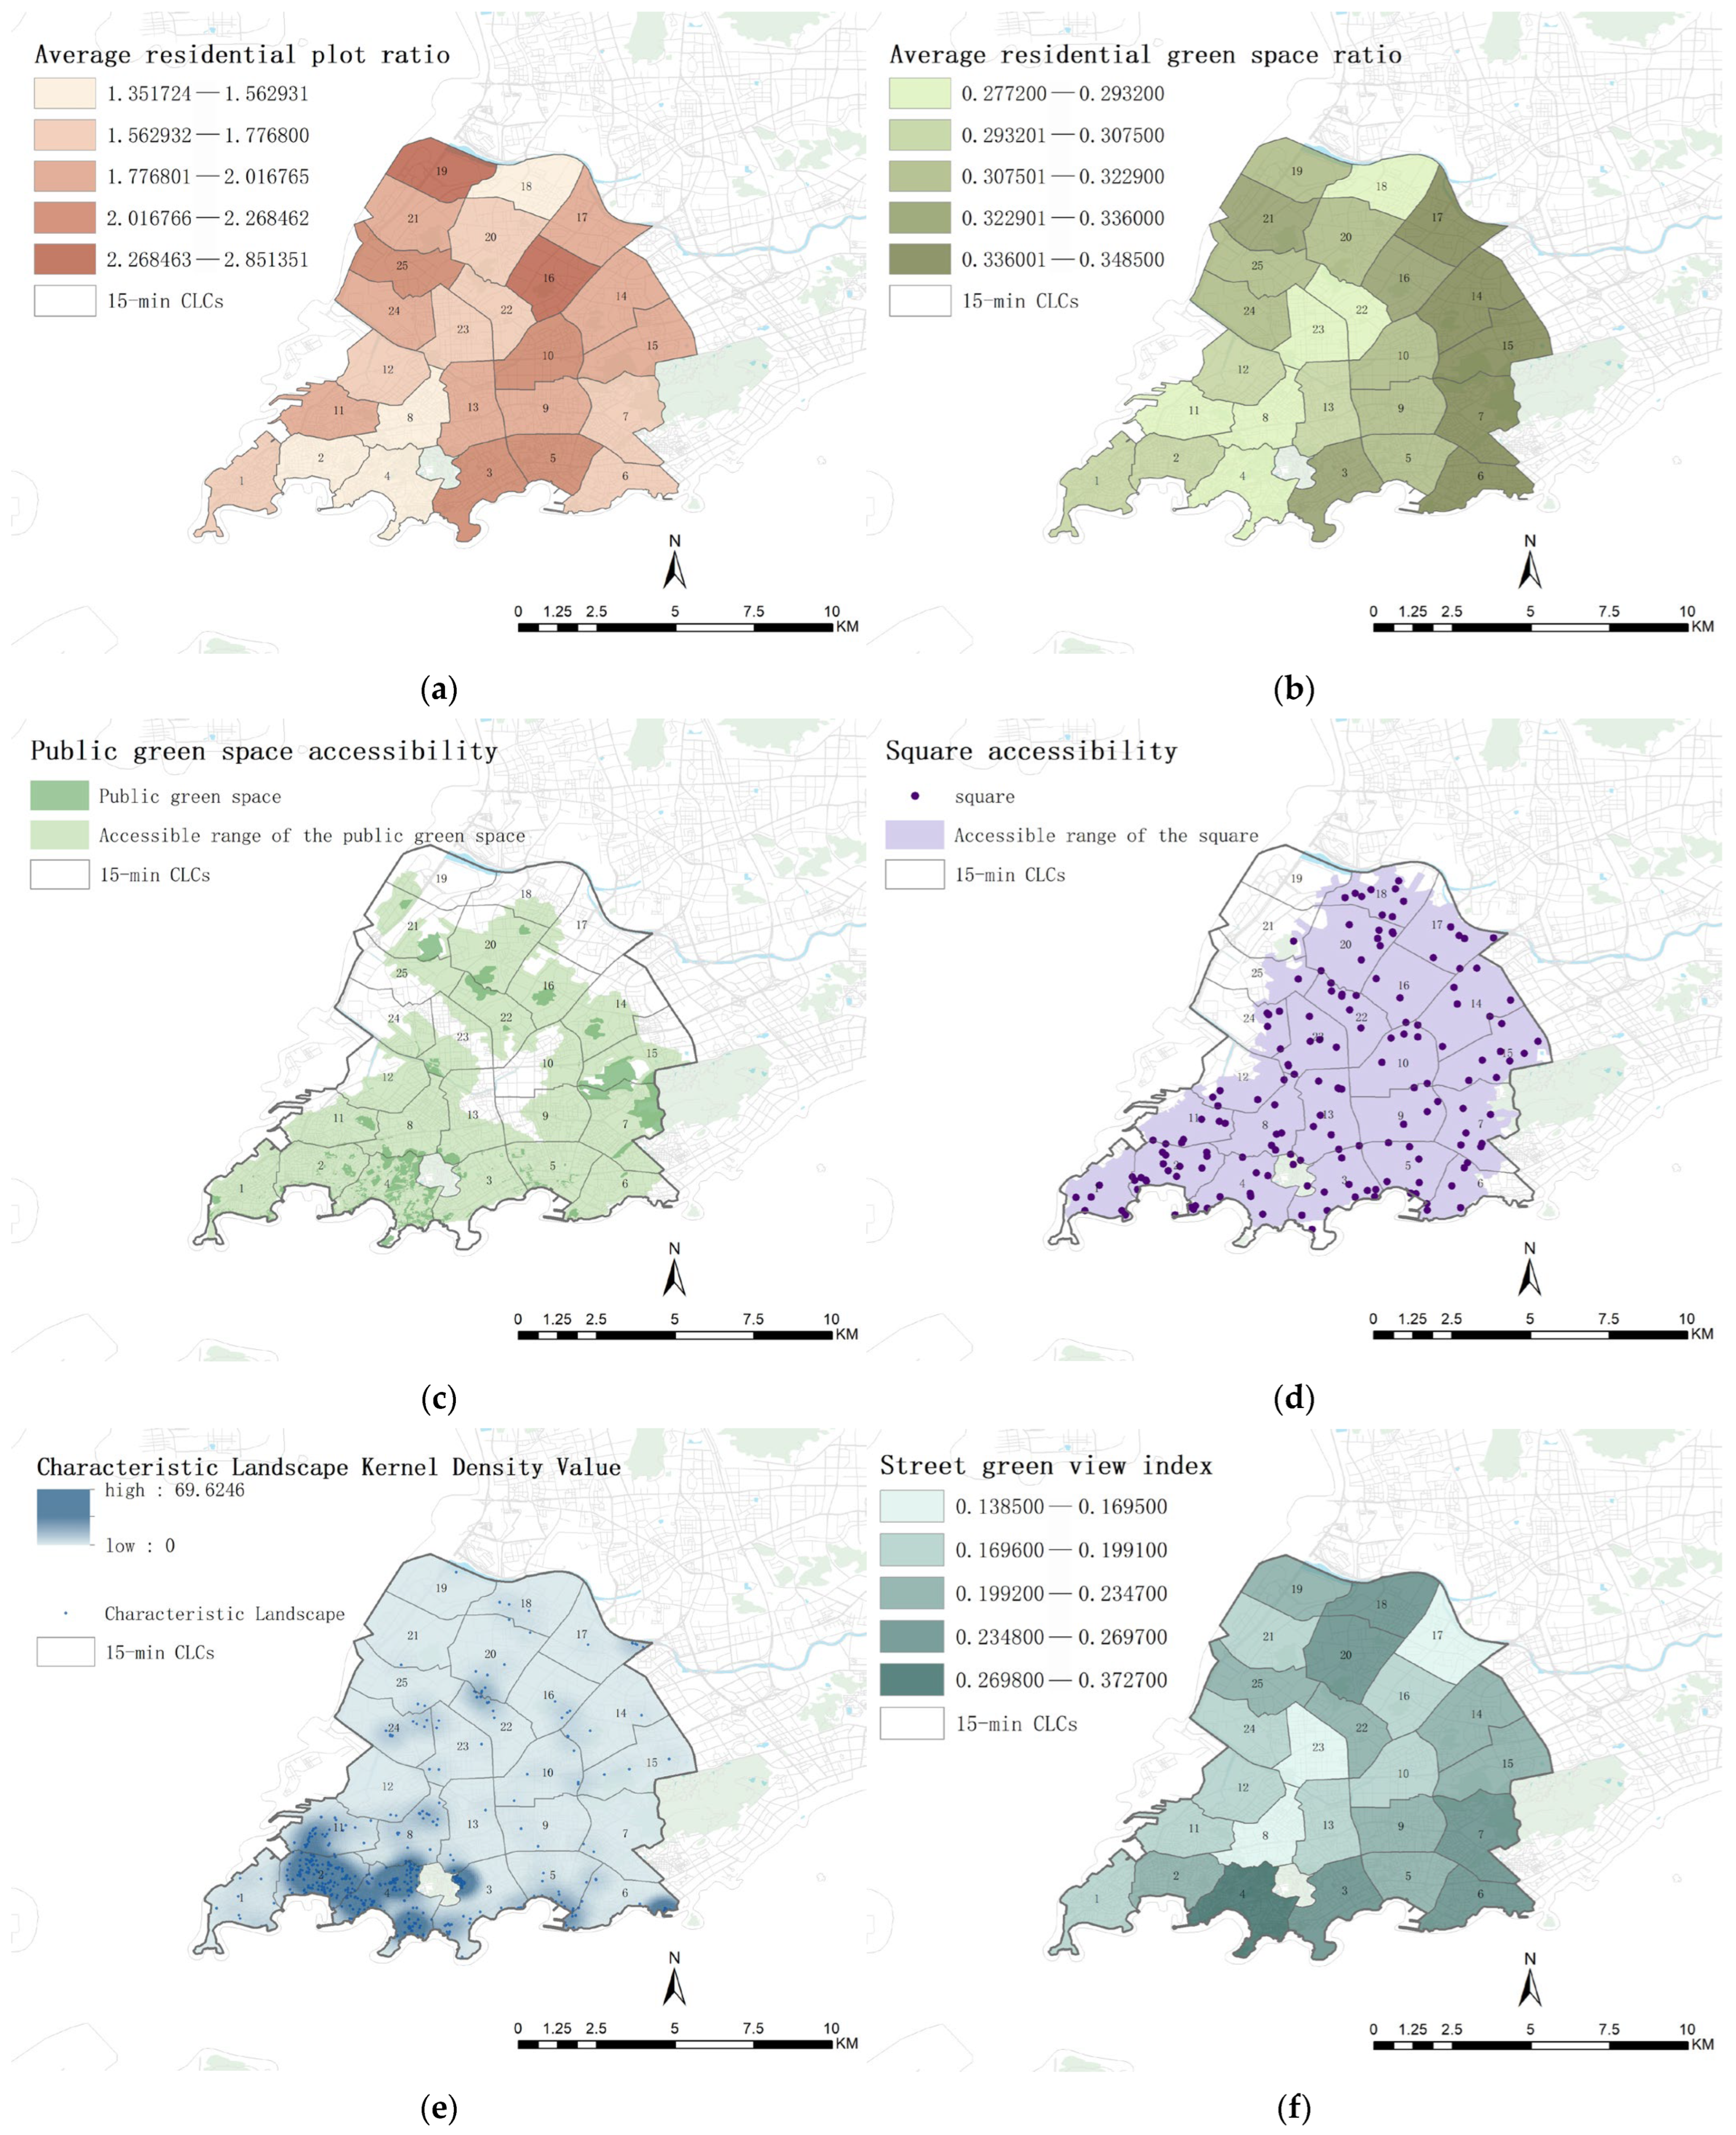
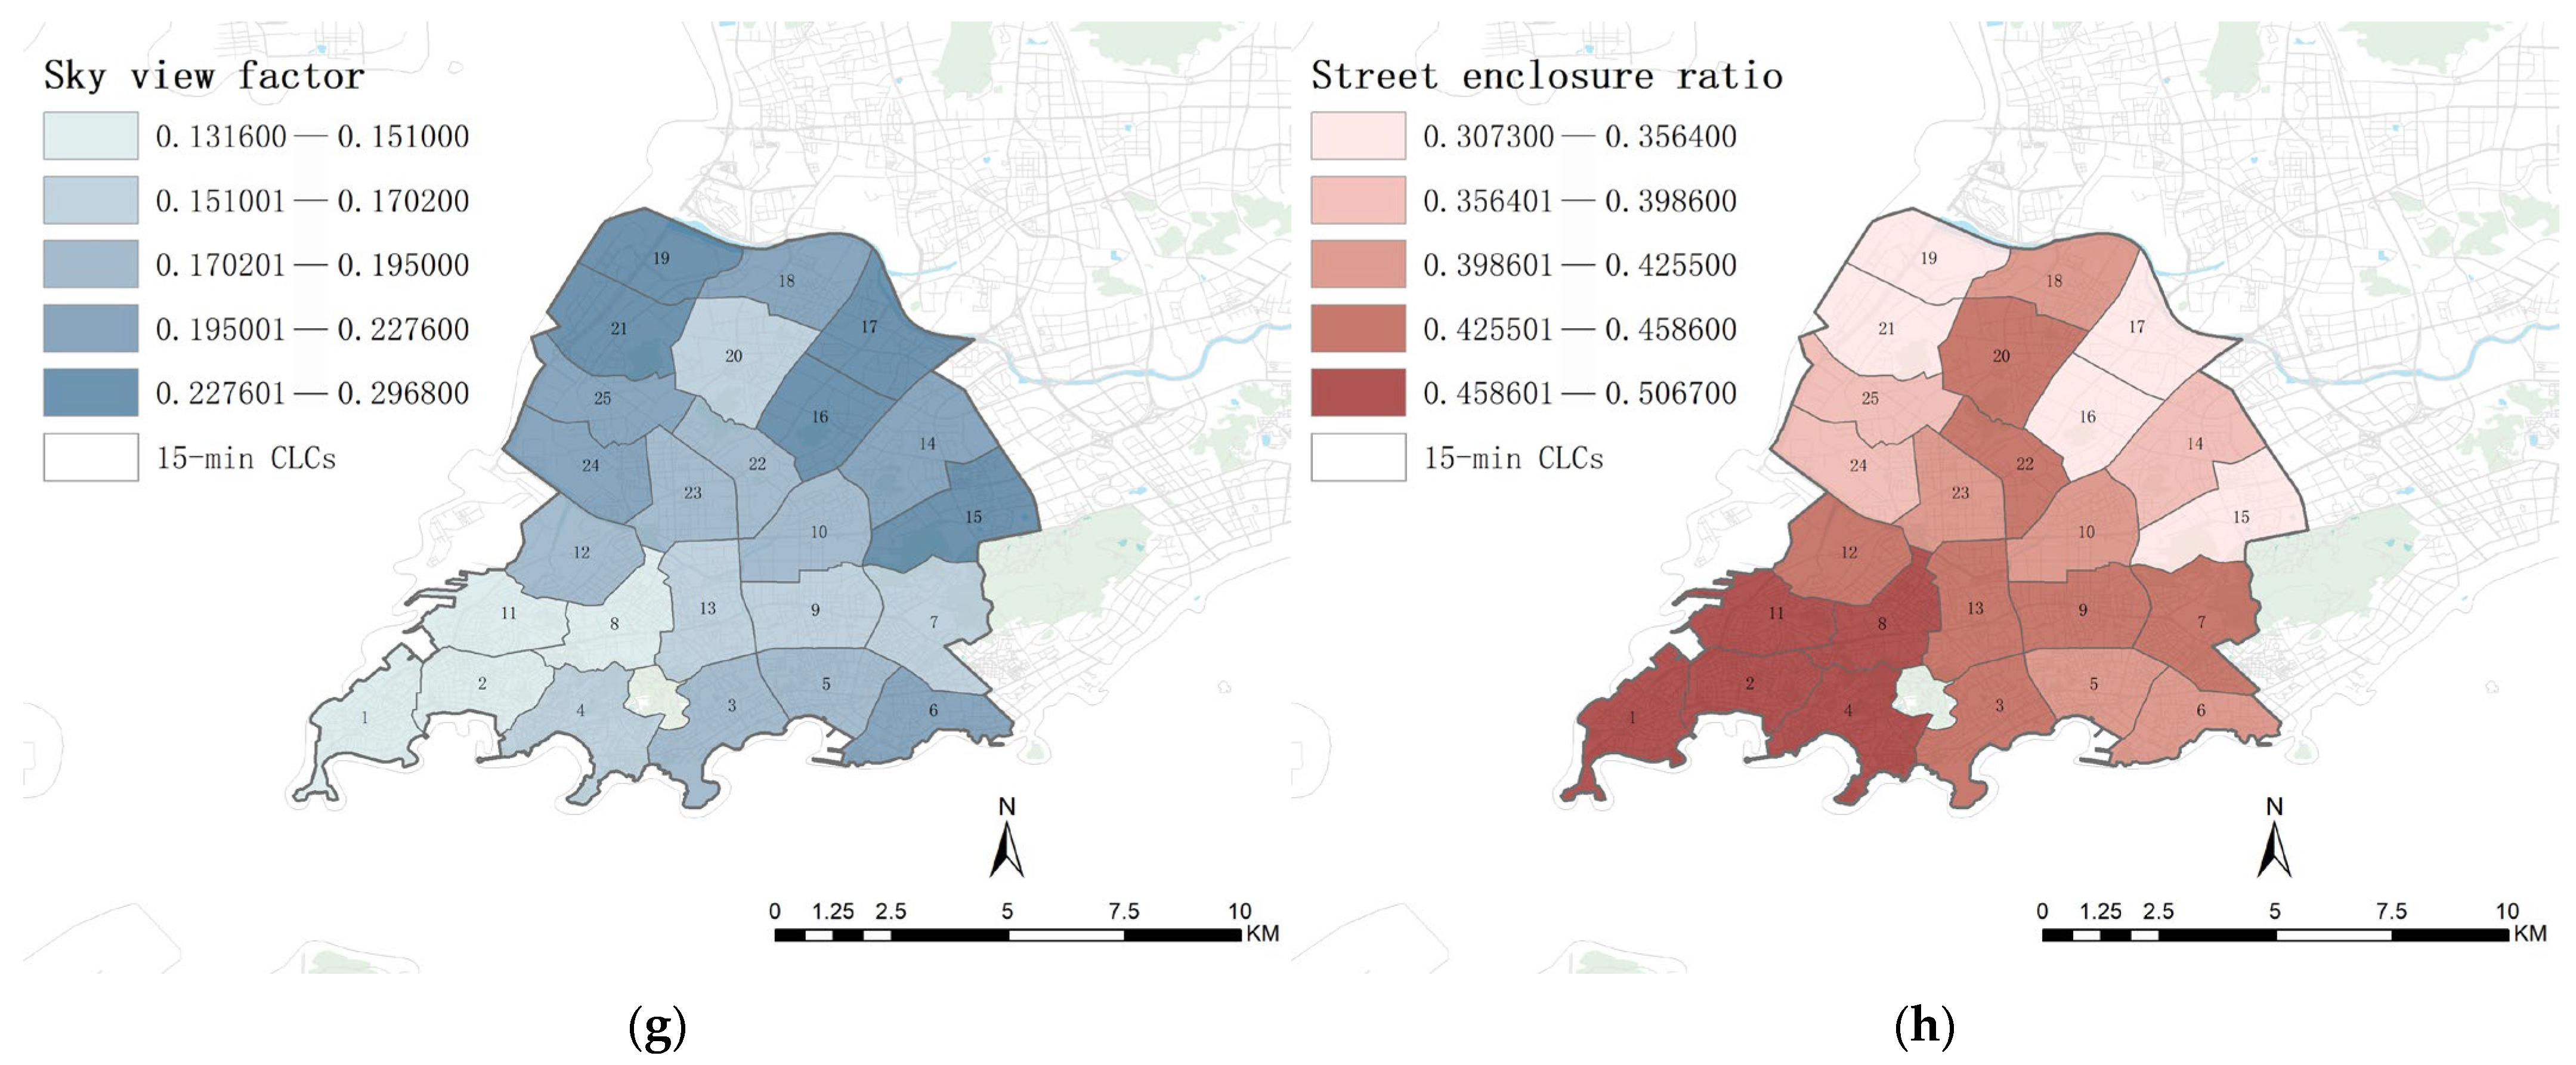
3.2. Evaluation of the Public Space Quality

A quantitative analysis of the settlements within the 15-minute CLC in the central area of Qingdao found that the average plot ratio of the settlements in the study area exhibits obvious spatial differentiation characteristics. The average plot ratio of the southwestern area is significantly lower than that of the other areas, and the residents’ experience of public space is relatively more favorable. This phenomenon is mainly attributed to the fact that the area belongs to the Historic Landscape Protection Zone, where building heights are strictly limited, resulting in a more relaxed internal spatial layout and higher spatial quality. In contrast, the average plot ratios in the northern and eastern neighborhoods are generally high. The high density of development has led to the compression of public space per capita and insufficient supply of public resources, which in turn affects the overall public space quality and living experience of the neighborhoods (Figure 6a). In terms of the average green space ratio, the study area shows a gradient distribution pattern that is high in the northeast and low in the southwest. On the other hand, even in the 15-minute CLC with the lowest green space ratio, its average green space ratio still reaches 27.72%, which is higher than the requirement of the Planning and Design Standards for Urban Residential Areas’ (GB 50180-2018) that the green space ratio of old area renovation projects should not be lower than 25%. It indicates that the overall performance of the study area in terms of settlement green space construction is relatively satisfactory (Figure 6b).
The accessibility of public green space is characterized by a dense south and a sparse north. The southern historic urban area shows a highly developed green space service system, with a 15-minute walking coverage of up to 100%, which has the advantage of achieving full coverage through the dense distribution of small and micro green spaces. In contrast, the northern 15-minute CLCs have several large centralized green spaces, but due to the lack of density, the 15-minute walking coverage is only 9–45%, leaving a large green space service vacuum (Figure 6c). The distribution of squares is relatively even, but there are service blind zones in the northwest which need to be targeted and supplemented (Figure 6d). The kernel density analysis of characteristic landscape shows that the southern coastal area forms continuous character landscape corridors at high densities, with a high degree of overlap between their distribution and the boundary of the Historic Buildings Conservation Area (HBCA). This has also led to the formation of an intense historical atmosphere in the area, confirming the empowering effect of cultural heritage on spatial quality (Figure 6e).
Regarding the comfort of street interaction space, the street green view index shows a hollow structure of ‘low in the center and high in the periphery’. The average value of the central area is only 13.85%, while the peripheral area reaches 21.5%, of which the southern coastal area standing out with a peak value of 37.27% (Figure 6f). It fully confirms the positive influence of the natural landscape pattern on the greening level. Meanwhile, the sky view factor shows a gradient difference between high in the northeast (26.02%) and low in the southwest (13.16%), while the street enclosure ratio is the opposite. It shows that the artificially built environment squeezes the ecological and sky elements, and an excessively high street enclosure ratio decreases the sky view factor (Figure 6g,h).

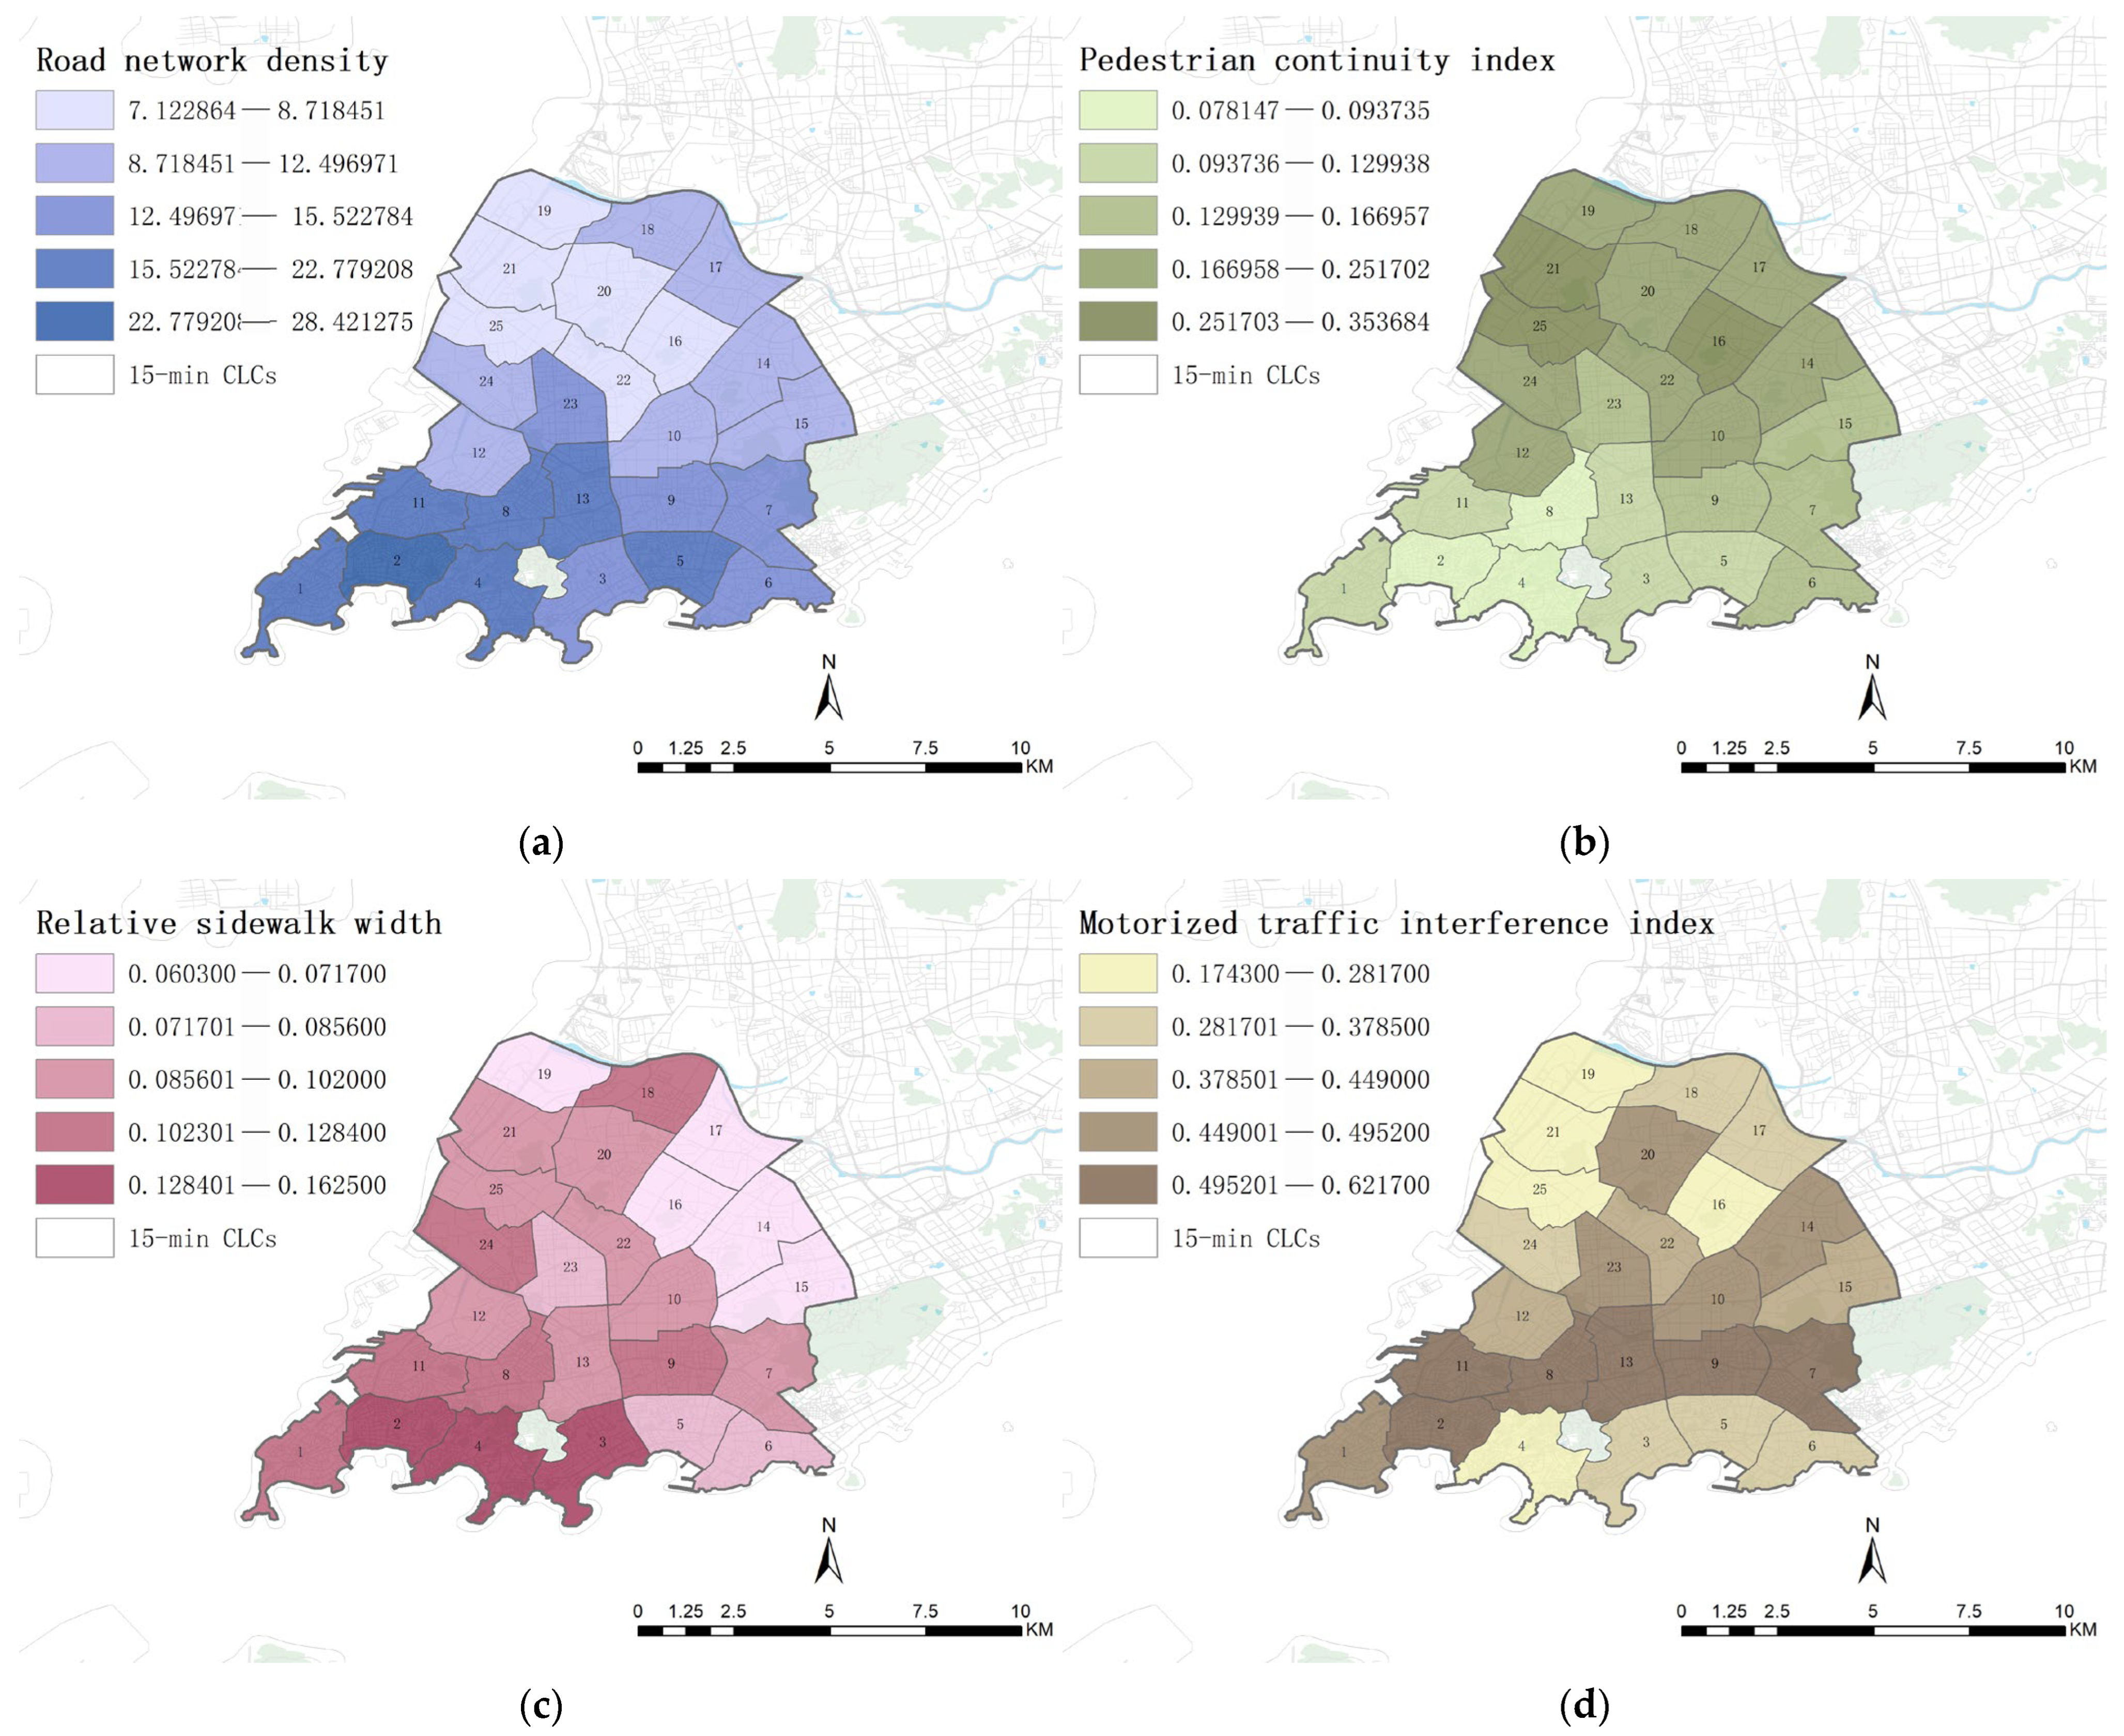
3.3. Evaluation of Pedestrian Environment Quality

The analyses of pedestrian environment quality show significant spatial differentiation in the quality of the pedestrian network in the study area (Figure 7). In terms of pedestrian network density, the southern region is significantly higher than the north and shows a gradient decreasing characteristic of high along the coast and low inland. The Urban Comprehensive Transportation System Planning Standard (GB/T 51328-2018) stipulates that the density of the pedestrian network should not be lower than 14 km/km2 in high-intensity development areas and should not be lower than 8 km/km2 in other areas [33]. Among the 25 15-minute CLCs involved in this study, nine of them meet the standard for high-intensity development areas; five of them do not meet the minimum standard, but their pedestrian network density is still maintained above 7 km/km2, close to the normative limit. It indicates that the overall road network in the study area is in good basic condition, with only some parts of the northwest 15-minute CLCs having a slight lack of pedestrian road network. This distribution pattern is closely related to the historically dense road network texture in the southern part of the old town. However, in the northern part, modern planning concepts emphasize the efficiency of the main roads rather than pedestrian network density.
The pedestrian continuity index shows an inverse correlation with pedestrian network density. The southern region has a lower pedestrian continuity index than the northern region due to the high density of intersections, resulting in frequent interruptions of pedestrian paths. The spatial differentiation of relative sidewalk width shows a decreasing gradient trend from southwest to northeast, and the southern coastal region has the best walking path width. Analyzed in conjunction with historical maps, the wider walking paths in the southern 15-minute CLC partly derive from the road planning heritage planned during the colonial period. In addition, Qingdao City’s healthy life circle construction has created a large number of landscape trails, resulting in better walking path widths in this area. In contrast, the newly built area in the north is affected by the intensity of land development and walking space is compressed. In terms of walking safety, the motorized traffic interference index is the highest in the central part of the city at 0.62, exposing the structural contradiction of traffic congestion and the mixing of people and vehicles in the central city. The high interference areas highly overlap with the tourist hotspots, leading to a decrease in walking safety. This spatial mismatch phenomenon suggests that human-scale street space needs to be reconstructed through traffic stabilization design (e.g., widening pavements and setting up curb extensions) while enhancing pedestrian network density.

4. Discussion

4.1. Research Content and Impact

In order to systematically measure the quality of the 15-minute CLC, this study constructs a multidimensional quality measurement system from the human scale in terms of three dimensions: public service facility allocation, public space quality, and pedestrian environment quality. Accordingly, the quality of 15-minute CLCs in the central area of Qingdao is measured.
The distribution of public service facilities in the central area of Qingdao has an overall core-edge circle structure. The central region achieves high coverage of all categories of facilities in the 15-minute CLC, while peripheral regions such as the northwest generally have lower coverage. It reflects the uneven distribution of regional development. At the same time, there is a clear differentiation in the coverage of different facilities. The coverage rates of health, commercial, and travel facilities are high overall, while the median coverage rates of elderly, cultural, and administrative facilities are less than 0.5, and there are still large service gaps in several categories of facilities. The unbalanced pattern is jointly affected by regional functional positioning, development level, and geographical conditions, and there is an urgent need to strengthen the supply of facilities in weak regions and promote the balanced development of public services.
The indicators of public space quality show significant divergent characteristics. In the evaluation of the internal space of the settlements, the average residential plot ratio space difference is noticeable, and the low plot ratio in the southwest area guarantees a better public space experience. The average residential green space ratio meets the standard, and the gradient characteristics of high in the northeast and low in the southwest are prominent. In the evaluation of the external space of the settlement, the layout of public green space shows a pattern of dense in the south and sparse in the north. The southern historic district achieves 100% coverage in 15 minutes through small and micro green spaces, while there is a service vacuum in the north. The distribution of squares is relatively even, and there is a service vacuum only in the northwest. The characteristic landscape corridor along the southern coast highly overlaps with the historic conservation area, forming a characteristic open space. In the evaluation of street spatial comfort, the distribution of the street green view index shows the characteristics of low center and high periphery. Additionally, there is a significant negative correlation between the sky view factor and street enclosure ratio. The optimization of public space quality needs to consider the dynamic balance between historical preservation and new city development. Through systematic spatial management and environmental micro-remodeling, the efficiency of public resource supply can be improved.
Regarding the pedestrian environment quality index, the southern old town has a high pedestrian network density, relying on the historical road network texture. However, the intersections are too dense, resulting in poor continuity. Meanwhile, the northern area is the opposite. Relative sidewalk widths show a decreasing trend from southwest to northeast, with the south benefiting from the colonial boulevard heritage and the construction of landscaped walkways under the best conditions. In terms of pedestrian safety, the central tourist area has a high motorized traffic interference index, and pedestrian-vehicle conflicts are prominent.
Based on the quality measurement results of 15-minute CLCs, the corresponding precise optimization strategies can be summarized.

4.2. Optimization Strategies for 15-Minute CLC

4.2.1. Optimization Strategies for Public Service Facility Allocation

Given the imbalance in public service facility allocation, we can take the “core radiation + periphery gap filling” as a guide to build a whole-area linkage of facilities optimization system. In low-coverage areas, the strategy of “stock tapping + function embedding” should be implemented, and unused buildings in industrial areas should be transformed into multifunctional integrated service facilities. The transformation should rely on the high-density facility clusters in the central area to build a radiation network and guide high-quality medical and educational resources to set up branches in the periphery through an inter-regional collaboration mechanism. At the same time, an intelligent facility management platform should also be established, using big data to monitor the utilization rate and demand gap of facilities in each district. Through gradual policy guidance and precise spatial intervention, the gap between the service levels of core and peripheral facilities will be gradually narrowed to form a public service network with full coverage and efficient linkage.

4.2.2. Optimization Strategies for Public Space Quality

For the high-density settlements in the north and east, vertical ecological space can be expanded using three-dimensional greening compensation and roof garden construction. The incentive policy of plot ratio can guide the embedding of small and micro public spaces. Additionally, the construction of the green space service system should pay attention to the differentiation between north and south to make up for the difference. The north relies on large-scale green space to build a radial green corridor system, linking community parks and street-corner green space. For the blind area of public space services in the northwest, it is appropriate to use “acupuncture” micro-renewal to activate unused corners and build multifunctional community plazas. To optimize the spatial quality of streets, an “Interface Renewal Program” can be implemented to promote modular green belts and permeable paving in the central district to increase the street green view index to more than 15%. At the same time, building setback optimization and interface modification will improve spatial permeability and balance the artificial environment with ecological elements. In addition, a public participation platform should be established to incorporate residents’ experience data into the planning and decision-making system, so as to realize efficient community governance.

4.2.3. Optimization Strategies for Pedestrian Environment Quality

In order to address the spatial differentiation of pedestrian environment quality, it is necessary to adopt the strategy of “differentiated weaving and mending + whole-area synergistic enhancement”. First, implement the “road network encryption plan” in the northern low-density area and improve the connectivity of the pedestrian network by opening up the internal passageways of the neighborhoods and installing more side streets and alleys. Focus on the northwestern region close to the lower limit of the standard missing road network and build a “bus + slow” connection system combined with the TOD model. Optimize the spatial design of intersections in the high-density old town in the south and reduce the frequency of pedestrian path interruptions by adding safety islands. In response to the compression of walking space in the north, the use of building overheads, air corridors, and other three-dimensional designs to expand walking space. The central high interference area needs to implement traffic stabilization and quiet transformation. By widening sidewalks, setting up curb extensions, and elevated crossing platforms, pedestrian and vehicle traffic should be separated. We can shape the slow-walking environment of 15-minute CLCs with all-time comfort and integration of all elements through systematic spatial intervention and dynamic fine management.

5. Conclusions

This study constructs a human-oriented three-dimensional quality measurement system for 15-minute CLCs, encompassing three dimensions: public service facility allocation, public space quality, and pedestrian environment quality. The specific quality analysis based on 25 15-minute CLCs in Qingdao city center shows that, through the synergistic application of ArcGIS spatial analysis and deep learning technology of streetscape, accurate assessment—such as the identification of blind zones of facility coverage, the diagnosis of spatial quality differentiation, and the diagnosis of pedestrian environment quality—can be realized. Its visualization results significantly enhance the transparency of urban resource allocation.
However, this study has some limitations. At the methodological level, Pawlusinski (2023) emphasized the importance of nighttime service assessment [34], but this study is biased towards static daytime data analysis and lacks the spatiotemporal dynamic monitoring of nighttime service accessibility (e.g., 24-h medical points) and security lighting assessment. At the theoretical level, over-reliance on physical spatial indicators and neglect of the embeddedness of socio-political variables, such as governance structures and cultural perceptions, may magnify the risk of spatial injustice [35]. Mocák (2022) suggests that 15-minute cities should be viewed as a shift towards people-centered inclusive urbanism, which fits in with the “people-centered” philosophy of this paper. However, the implementation challenges revealed by Mocák also raise a cautionary note for this study: the impacts of governance and public participation should be taken into account when proposing optimization measures [36]. In addition, this study is primarily based on the current situation in Qingdao, which lacks a certain responsiveness to cultural and geographical differences. The measurement system requires dynamic calibration in accordance with the population distribution and urban morphology when applied in other regions.
Despite these limitations, this study provides valuable theoretical references for academic research and applications in related fields, and it has significant practical implications. Theoretically, the innovative application of multi-source data fusion and deep learning technology addresses the dilemma of subjective and objective indicators in traditional evaluation, providing a replicable “diagnosis–intervention” paradigm for 15-minute CLC. In practice, this study also provides decision-making support for local governments and community management agencies, enabling them to allocate community resources more effectively and optimize the supply of community services. The follow-up study will focus on building a spatiotemporal dynamic monitoring network and conducting participatory action experiments in community planning to promote a paradigm leap in the assessment system from a technical tool to a governance platform.

Author Contributions

Conceptualization, Y.Z. and T.Z.; methodology, Y.Z.; software, Y.Z.; formal analysis, Y.Z.; resources, Y.Z. and Y.S.; data curation, Y.Z. and J.W.; writing—original draft preparation, Y.Z.; writing—review and editing, T.Z. and G.F.; visualization, Y.Z.; supervision, T.Z. All authors have read and agreed to the published version of the manuscript.

Funding

This research received no external funding.

Data Availability Statement

The data are not publicly available due to the data are part of an ongoing study.

Conflicts of Interest

The authors declare no conflicts of interest.

References

  1. National Technical Committee for Standardization of Natural Resources and Territorial Spatial Planning. Technical Guidelines for Community Life Circle Planning. 2021. Available online: https://www.mohurd.gov.cn/?medium=01 (accessed on 22 March 2024).
  2. Xu, L.; Tong, Y.; Yu, L.; Zheng, L.; Qin, H. Planning path of community public service facilities allocation under the perspective of matching supply and demand—An example of urban community construction planning in Fuyang District, Hangzhou. Planner 2024, 40, 128–136. [Google Scholar]
  3. Moreno, C.; Allam, Z.; Chabaud, D.; Gall, C.; Pratlong, F. Introducing the “15-Minute City”: Sustainability, resilience and place identity in future post-pandemic cities. Smart Cities 2021, 4, 93–111. [Google Scholar] [CrossRef]
  4. Fan, J.; Tang, H.; Yu, Y. Measurement of community amenity under human scale—A refined assessment based on multisource urban data. New Archit. 2020, 5, 10–15. [Google Scholar]
  5. Yang, Z.; Kang, M.; Mu, X.; Li, J. Progress of Community Life Circle Research. Beijing Plan. Constr. 2023, 4, 88–91. [Google Scholar]
  6. The UPF Editorial Department. Concept-Method-Practice: An academic paper on the identification of the core meaning of “15-minute community life circle planning”. J. Urban Plan. 2020, 1, 1–8. [Google Scholar]
  7. Matlovic, R.; Matlovicova, K. Polycrisis in the Anthropocene as a Key Research Agenda for Geography: Ontological Delineation and the Shift to a Postdisciplinary Approach. Folia Geogr. 2024, 66, 5–33. [Google Scholar]
  8. Xu, Y.; Liao, Z.; Zhang, S.; Shen, G.; Zheng, D.; Chen, L.; Li, J.; Song, W. Strategic thinking on the optimization of urban spatial pattern in Shanghai. J. Urban Plan. 2017, 20–30. [Google Scholar] [CrossRef]
  9. Long, B.; Yin, M. Research on Public Service Facilities in Community Living Area Based on Matching Supply and Demand. People’s City, Planning for Empowerment. In Proceedings of the 2023 China Urban Planning Annual Conference (19 Housing and Community Planning), Chongqing University, Chongqing, China, 3 September 2023; pp. 502–508. [Google Scholar] [CrossRef]
  10. Yang, C.; Xin, L.; Ouyang, H.; Liang, L.; Zhu, M. Research on optimization strategy of public service facilities in community living area based on subjective and objective evaluation--Taking Nanning central city as an example. Shanghai Urban Plan. 2024, 1, 9–16. [Google Scholar]
  11. Ma, W.; Wang, N.; Li, Y.; Sun, D. 15-Min Pedestrian Distance Life Circle and Sustainable Community Governance in Chinese Metropolitan Cities: A Diagnosis. Humanit. Soc. Sci. Commun. 2023, 10, 364. [Google Scholar] [CrossRef]
  12. Wei, W.; Hong, M.; Xie, B. Delineation and spatial optimization of 15-minute living circle in Wuhan based on supply-demand matching. Planner 2019, 35, 11–17. [Google Scholar]
  13. Liu, K.; Zhou, D.; Wang, M.; Liu, T.; Wang, Y. Analysis and Optimization of Supply and Demand Fitness of Public Service Facilities in Community Life Circle: A Case Study of Xi’an. J. Archit. 2024, S1, 192–197. [Google Scholar]
  14. Zhao, P.; Luo, J.; Hu, H. Characterization of the living area and facility allocation for the elderly based on big data—A case study of Beijing. Geoscience 2022, 42, 1176–1186. [Google Scholar] [CrossRef]
  15. Wang, N.; Ma, W. Evaluation Study on the Layout of Community Senior Living Facilities in the Main Area of Shanghai from the Perspective of Senior Life Circle. Sustainability 2023, 15, 10362. [Google Scholar] [CrossRef]
  16. Yang, Y.; Li, C.; Zhou, D. Study on the Characteristics of Community Elderly Care Service Facilities Usage and Optimization Design Based on Life Cycle Theory. Buildings 2024, 14, 3003. [Google Scholar] [CrossRef]
  17. Wang, X.; Huang, J.; Qin, Z.; Gan, W.; He, Z.; Li, X. Is the Children’s 15-Minute City an Effective Framework for Enhancing Children’s Health and Well-Being? An Empirical Analysis from Western China. Buildings 2025, 15, 248. [Google Scholar] [CrossRef]
  18. LI, Q.; LIU, M.; WU, Y. Optimization path of community life circle function configuration based on multidimensional evaluation--Taking Yinzhou District of Ningbo City as an example. Planner 2024, 40, 113–120. [Google Scholar]
  19. Shen, Y.; Tong, Z. Research on the assessment method of convenience of community life circle under human-oriented scale. South. Archit. 2022, 7, 72–80. [Google Scholar]
  20. Guo, R.; Li, Y.; Huang, M. Delineation of 15-minute community life circle and optimization strategy of pedestrian network in Harbin. Planner 2019, 35, 18–24. [Google Scholar]
  21. Cai, X.; Wang, H.; Li, L.; Ning, X.; Li, G. Community Life Circle Assessment Application Practice, Challenges and Prospects. Planner 2023, 39, 47–52. [Google Scholar]
  22. Chai, Y.; Li, C. Urban living area planning: From research to practice. Urban Plan. 2019, 43, 9–16+60. [Google Scholar]
  23. Jiang, M.; Hu, J.; Gao, X. Community Life Circle, Neighbourly Interaction, and Social Cohesion: Does Community Space Use Foster Stronger Communities? Land 2024, 13, 1094. [Google Scholar] [CrossRef]
  24. Liu, W.; Zheng, S.; Hu, X.; Wu, Z.; Chen, S.; Huang, Z.; Zhang, W. Effects of Spatial Scale on the Built Environments of Community Life Circles Providing Health Functions and Services. Build. Environ. 2022, 223, 109492. [Google Scholar] [CrossRef]
  25. Sarai, P.; Ángel, B.; E, L.F.; Erik, G.B.; Mathew, P.W.; María, C.U. Contact with blue-green spaces during the COVID-19 pandemic lockdown beneficial for mental health. Sci. Total Environ. 2021, 756, 143984. [Google Scholar] [CrossRef]
  26. Zeng, D.; Yang, J.; Xu, P. Progress and Implications of Research on Urban Spatial Mismatch. Mod. Urban Stud. 2021, 6, 2–9. [Google Scholar]
  27. Weng, M.; Ding, N.; Li, J.; Jin, X.; Xiao, H.; He, Z.; Su, S. The 15-minute walkable neighborhoods: Measurement, social inequalities and implications for building healthy communities in urban China. J. Transp. Health 2019, 13, 259–273. [Google Scholar] [CrossRef]
  28. Ministry of Housing and Urban-Rural Development of China. Standard for the Planning and Design of Urban Residential Areas. 2018. Available online: https://www.mohurd.gov.cn/?medium=01 (accessed on 22 March 2024).
  29. Qingdao Municipal Bureau of Natural Resources and Planning. Qingdao Urban Public Service Facilities Supporting Standards and Planning Guidelines (2023 Trial Version). 2023. Available online: http://zrzygh.qingdao.gov.cn/ (accessed on 22 March 2024).
  30. Wang, M.; Pei, X.; Zhang, M.; Tang, Y. Evaluation and Optimization of Urban Public Space Accessibility for Residents’ Satisfaction: A Case Study of Nanshan District, Shenzhen City. Buildings 2023, 13, 2624. [Google Scholar] [CrossRef]
  31. Huang, Z.; Li, Z.; Lang, W. Measurement of street spatial quality based on multi-source big data and its impact on street vitality—A case study of Guangzhou historic district. Shanghai Urban Plan. 2023, 06, 122–130. [Google Scholar]
  32. Yang, J.; Wu, H.; Zheng, Y. Research on spatial characteristics and optimization strategy of urban street walkability based on multi-source big data--Taking the central city of Nanjing as an example. Int. Urban Plan. 2019, 34, 33–42. [Google Scholar] [CrossRef]
  33. Ministry of Housing and Urban-Rural Development of the People’s Republic of China. Urban Comprehensive Transportation System Planning Standards. 2018. Available online: http://www.mohurd.gov.cn/gongkai/zc/wjk/art/2019/art_17339_239844.html (accessed on 22 March 2024).
  34. Pawlusinski, R. Managing of the Night-Time Economy—Challenges for a Sustainable Urban Policy with GIS Methods. Folia Geogr. 2023, 65, 5–20. [Google Scholar]
  35. Tóth, B. Mixed-Use Developments in Phoenix and Tempe, Arizona: Sustainability Concerns and Current Trends. Folia Geogr. 2023, 65, 53–77. [Google Scholar]
  36. Mocák, P.; Matlovičováb, K.; Matlovičc, R.; Pénzesd, J.; Pachurae, P.; Mishraf, P.; Kostilníkovág, K.; Demková, M. 15-Minute City Concept as a Sustainable Urban Development Alternative: A Brief Outline of Conceptual Frameworks and Slovak Cities as A Case. Folia Geogr. 2022, 64, 69–89. [Google Scholar]
Figure 1. Elements of 15-minute CLC assessment generated by residents’ demands.
Buildings 15 01968 g001
Figure 2. Delineation of the 15-minute CLCs in the central area of Qingdao.
Buildings 15 01968 g002
Figure 3. Baidu street view data and semantic segmentation results.
Buildings 15 01968 g003
Figure 4. Distribution map of public service facilities coverage rate. (a) Healthcare facilities; (b) elderly care facilities; (c) educational facilities; (d) cultural facilities; (e) sports facilities; (f) commercial facilities; (g) government service facilities; (h) transportation facilities.
Buildings 15 01968 g004aBuildings 15 01968 g004b
Figure 5. Overall statistics on the coverage rate of public service facilities.
Buildings 15 01968 g005
Figure 6. Distribution map of public space quality. (a) Average residential plot ratio; (b) average residential green space ratio; (c) public green space accessibility; (d) square accessibility; (e) kernel density of characteristic landscapes; (f) street green view index; (g) sky view factor; (h) street enclosure ratio.
Buildings 15 01968 g006aBuildings 15 01968 g006b
Figure 7. Distribution map of pedestrian environment quality. (a) Road network density; (b) pedestrian continuity index; (c) relative sidewalk width; (d) motorized traffic interference index.
Buildings 15 01968 g007
Table 1. Selection of public service facilities and their service distance.
Type of FacilityPrinciple CategorySubcategoryService Distance/m
Basic public service facilitiesHealthcare facilitiesHealth service center (community hospital)1000
Outpatient department1000
Elderly care facilitiesNursing home1000
Elderly care service center1000
Educational facilitiesKindergarten300
Primary school500
Junior high school1000
Cultural facilitiesCultural activity center (street level)1000
Sports facilitiesMultifunctional sports venue1000
Commercial facilitiesShopping mall500
Wet market or fresh food supermarket500
Dining facilities500
Bank branch500
Telecom service outlet500
Postal service location1000
Community service outlet300
Government service facilitiesCommunity service center (street level)1000
Sub-district office1000
Legal service office1000
Transportation facilitiesBus stop500
Quality-of-life enhancement facilitiesSports facilitiesPublic sports complex1000
Fitness center1000
Cultural facilitiesCultural exhibition hall1000
Transportation facilitiesRail transit station800
Motor vehicle parking lot500
Table 2. Quality measurement system for 15-minute CLCs.
Tier-1 IndicatorTier-2 IndicatorCalculation FormulaQuantitative Definition
Public service facility allocationHealthcare facility coverage rate
Elderly care facility coverage rate
Educational facility coverage rate
Cultural facility coverage rate
Sports facility coverage rate
Commercial facility coverage rate
Government service facility coverage rate
Transportation facility coverage rate
X = F/S0F is the area of the service zone of the facility; S0 is the total area of the 15-minute CLC.
Public space qualityAverage residential plot ratio x = 1 n i = 0 n x i x i is the plot ratio indicating the ith settlement; n is the total number of settlements.
Average residential green space ratio x = 1 n i = 0 n x i x i is the green space ratio indicating the ith settlement; n is the total number of settlements.
Square accessibilityX = Sq/S0Sq is the 15-minute accessible range of the square; S0 is the total area of the 15-minute CLC.
Public green space accessibilityX = G/S0G is the 15-minute accessible range of the public green space; S0 is the total area of the 15-minute CLC.
Kernel density of characteristic landscapes Kernel density calculation for characteristic landscapes in ArcGIS 10.8.1.
Street green view indexX = T/PT is the number of pixels representing vegetation in the streetscape image; P is the total pixels in the streetscape image.
Sky view factorX = S/PS is the number of pixels representing the sky in the streetscape image; P is the total number of pixels in the streetscape image.
Street enclosure ratioX = B/PB is the number of pixels representing buildings, walls, and trees in the streetscape picture; P is the total number of pixels in the streetscape picture.
Pedestrian environment qualityPedestrian network density D = L S = i = 0 n L i S D is the length density of the road network; L is the length of the road; S is the area of the 15-minute CLC; n is the number of roads in the region.
Relative sidewalk widthX = W/RW is the number of pixels representing walking paths; R is the number of pixels of carriageways.
Pedestrian continuity indexX = R/IR is the length of the pedestrian network at the extent of the 15-minute CLC; I is the number of intersections at the extent of the 15-minute CLC.
Motorized traffic interference indexX = M/RM is the number of pixels representing motor vehicles in the streetscape image; R is the total number of pixels representing motorways in the entire image.
Disclaimer/Publisher’s Note: The statements, opinions and data contained in all publications are solely those of the individual author(s) and contributor(s) and not of MDPI and/or the editor(s). MDPI and/or the editor(s) disclaim responsibility for any injury to people or property resulting from any ideas, methods, instructions or products referred to in the content.

