
Energy-Saving Performance and Optimization Study of Adaptive Shading System—A Case Study

Abstract
1. Introduction
2. Research Progress on Adaptive Shading Systems
2.1. Energy-Saving Studies on Adaptive Shading Systems
2.2. Structure and Parameter Studies on Adaptive Shading Systems
2.3. Current Status and Limitations
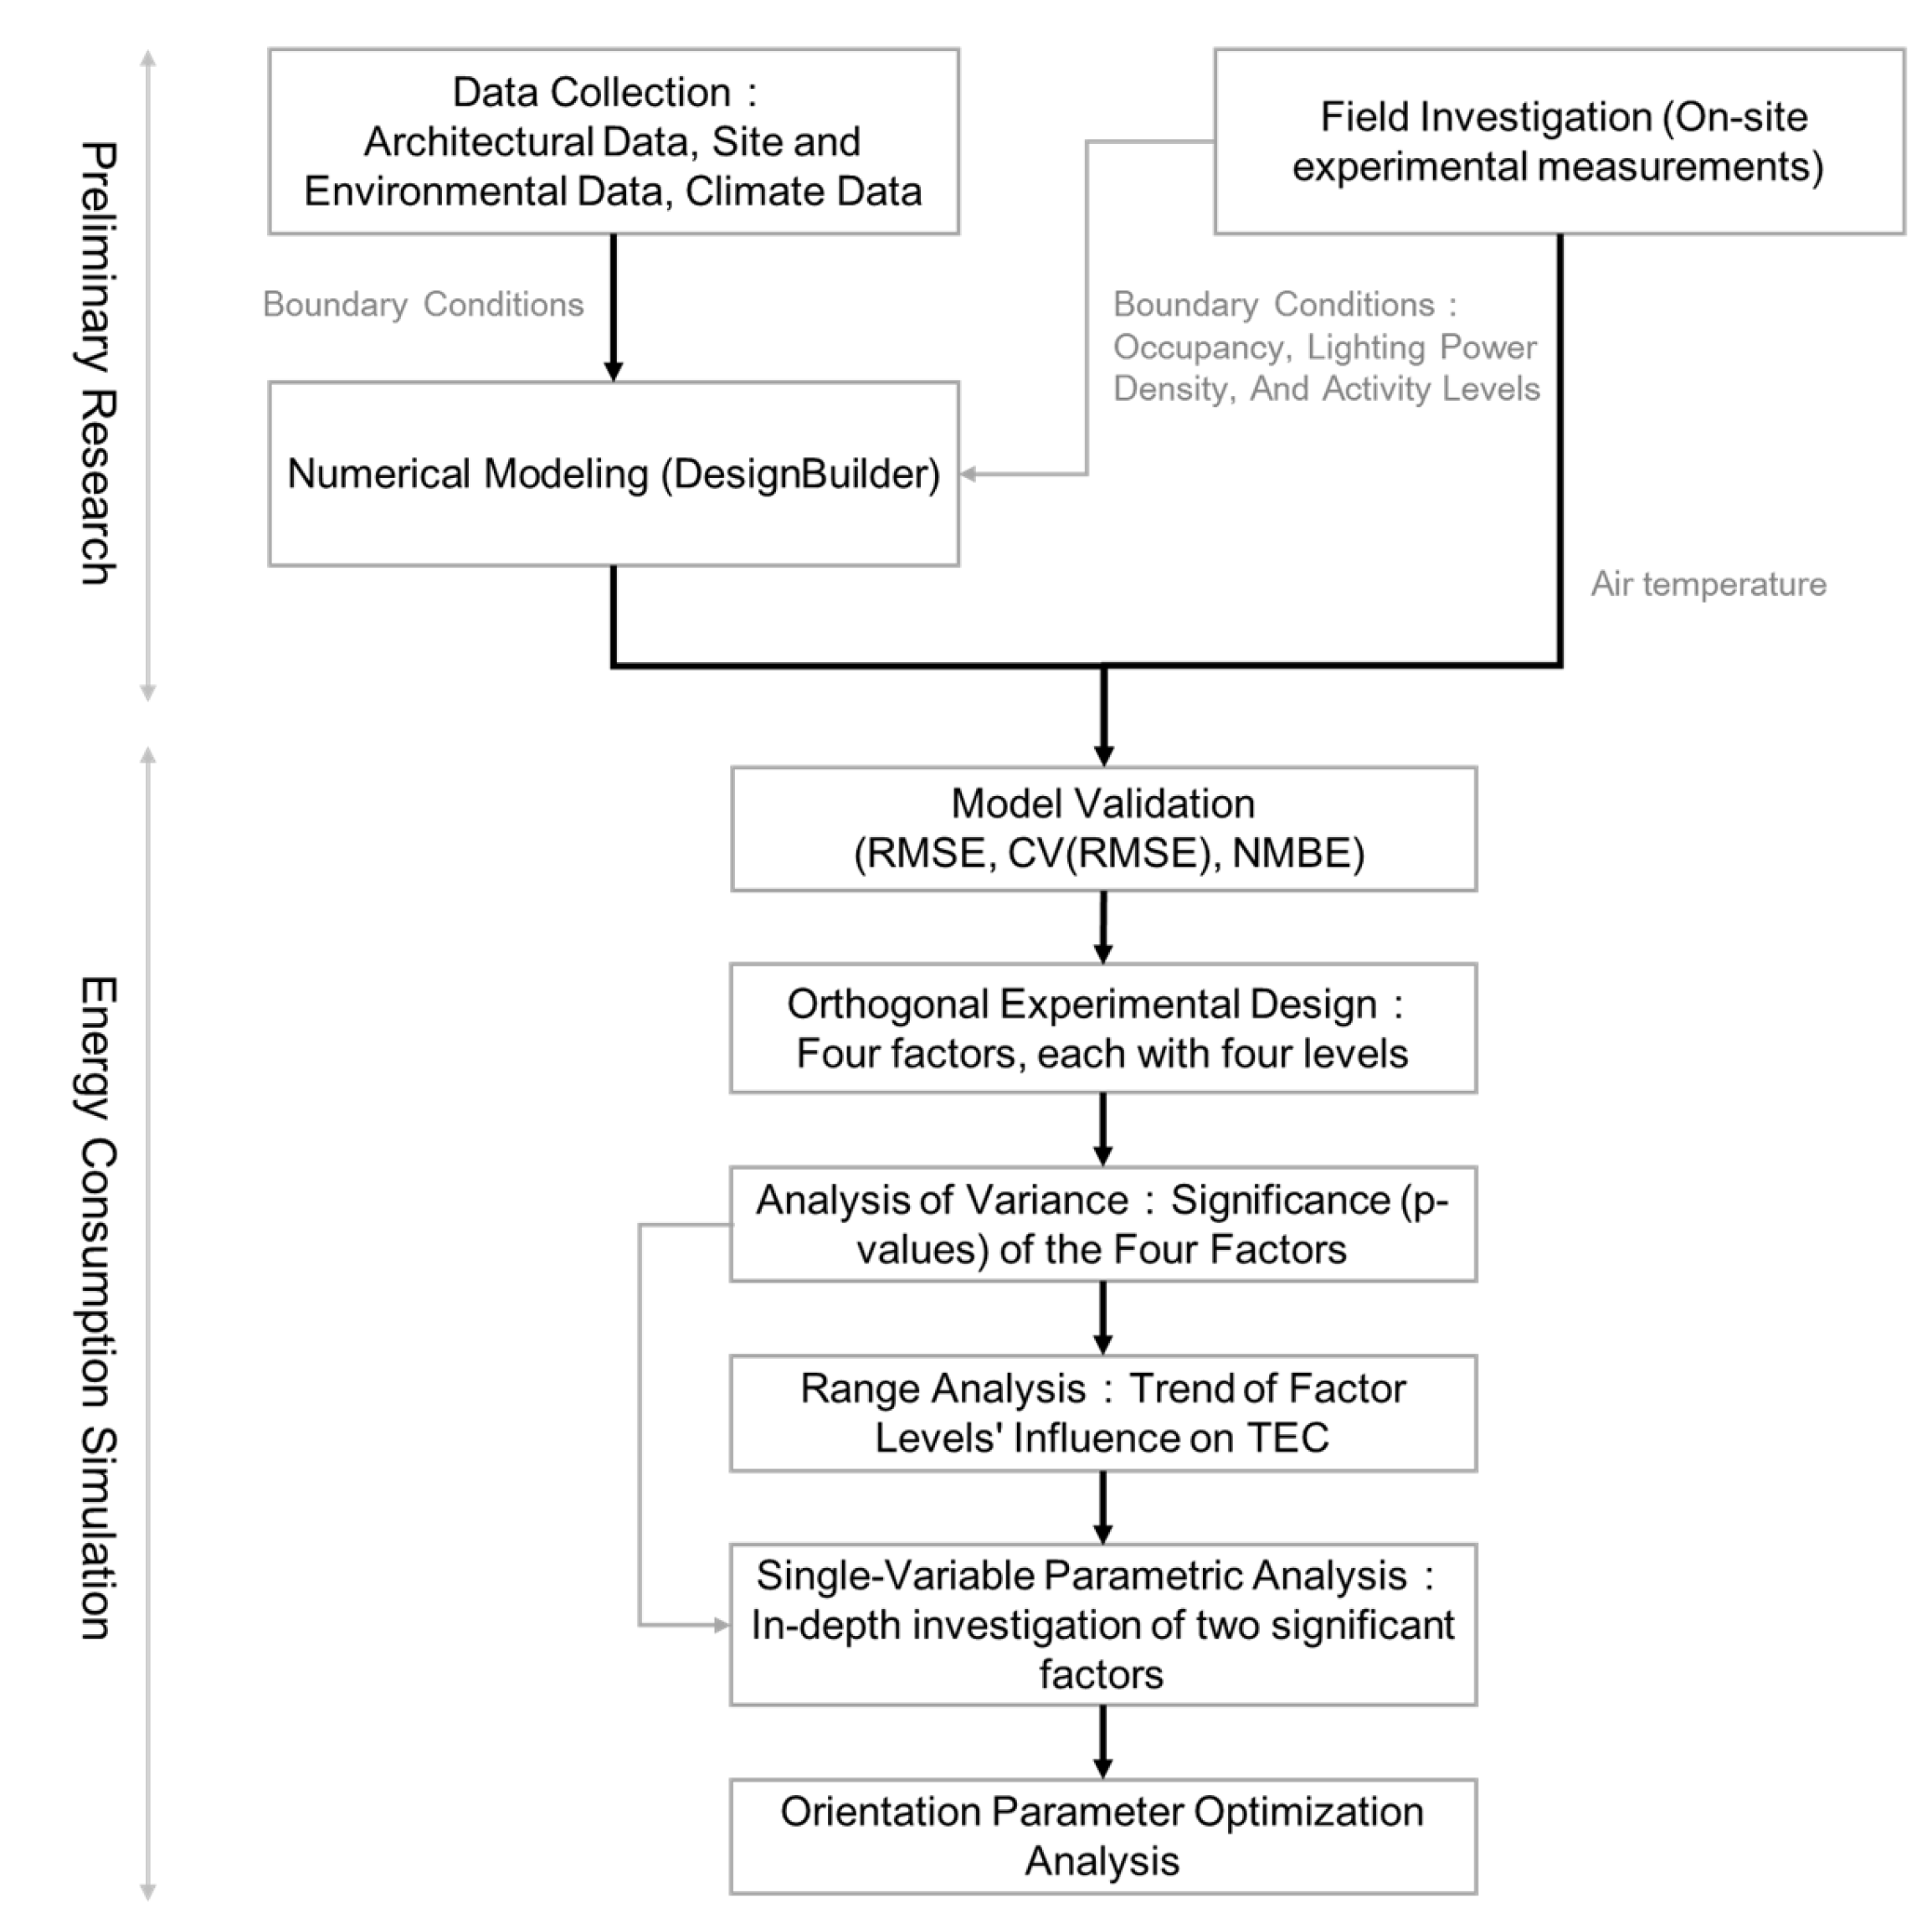
3. Methodology
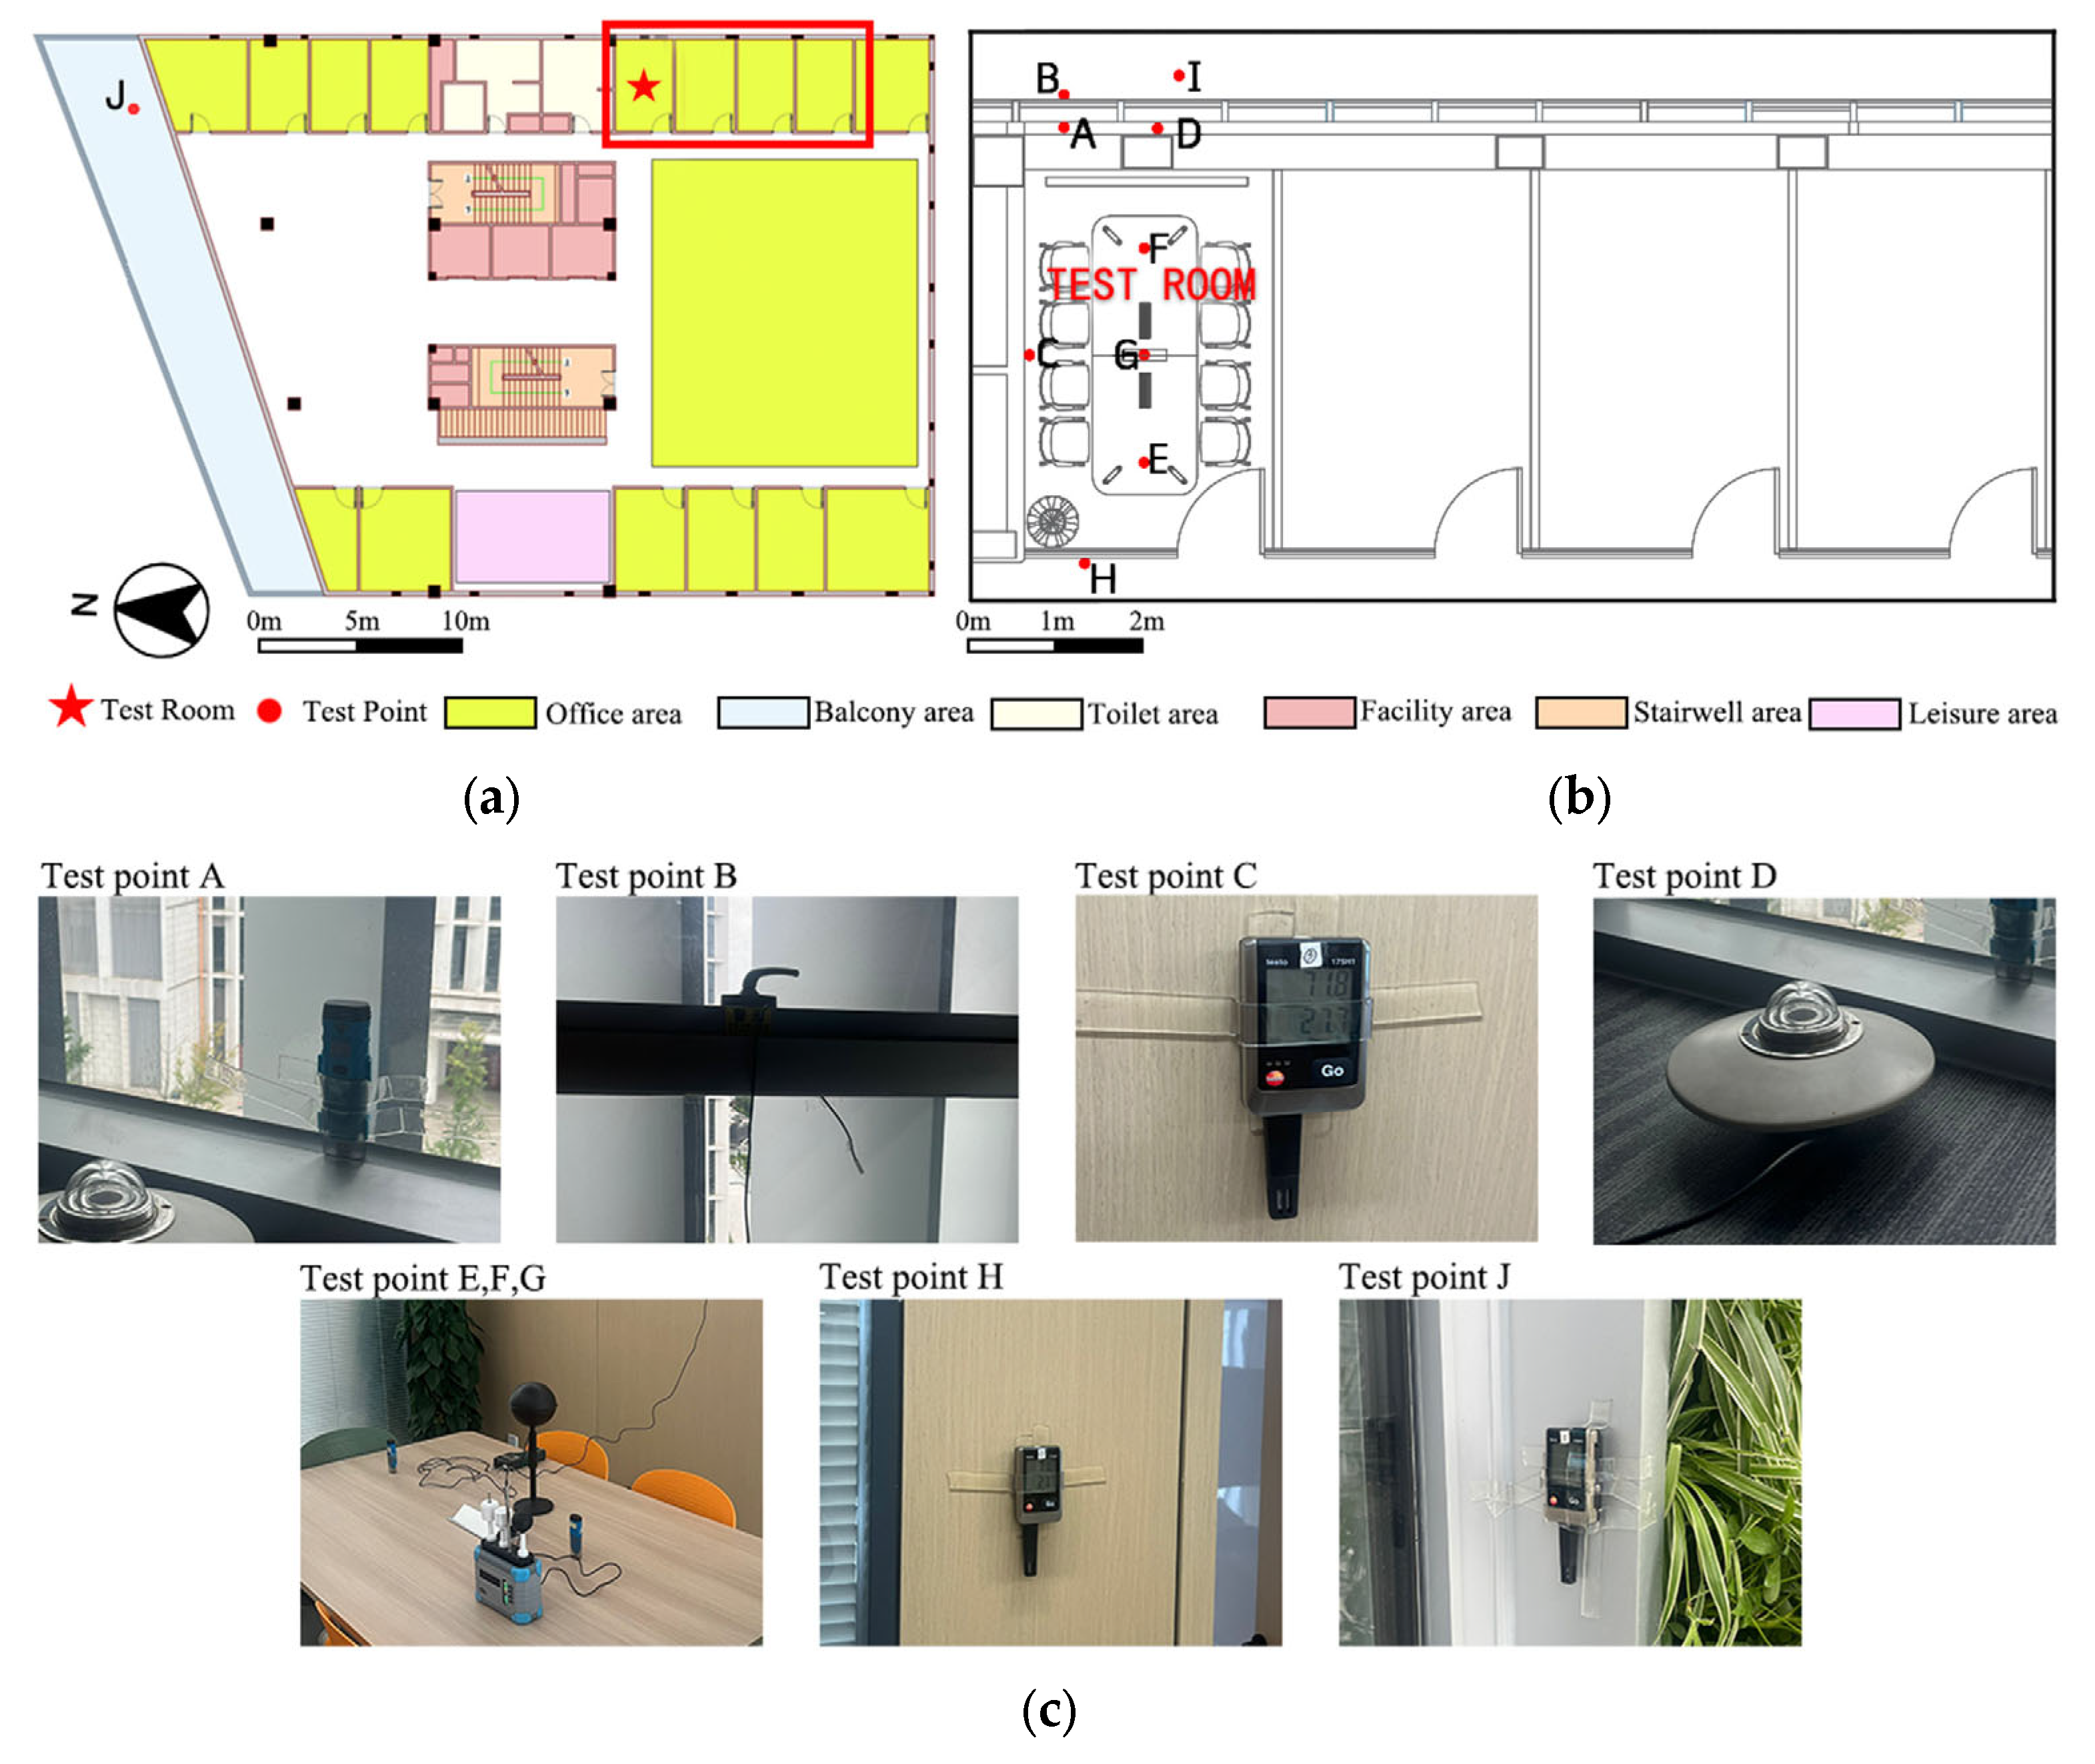
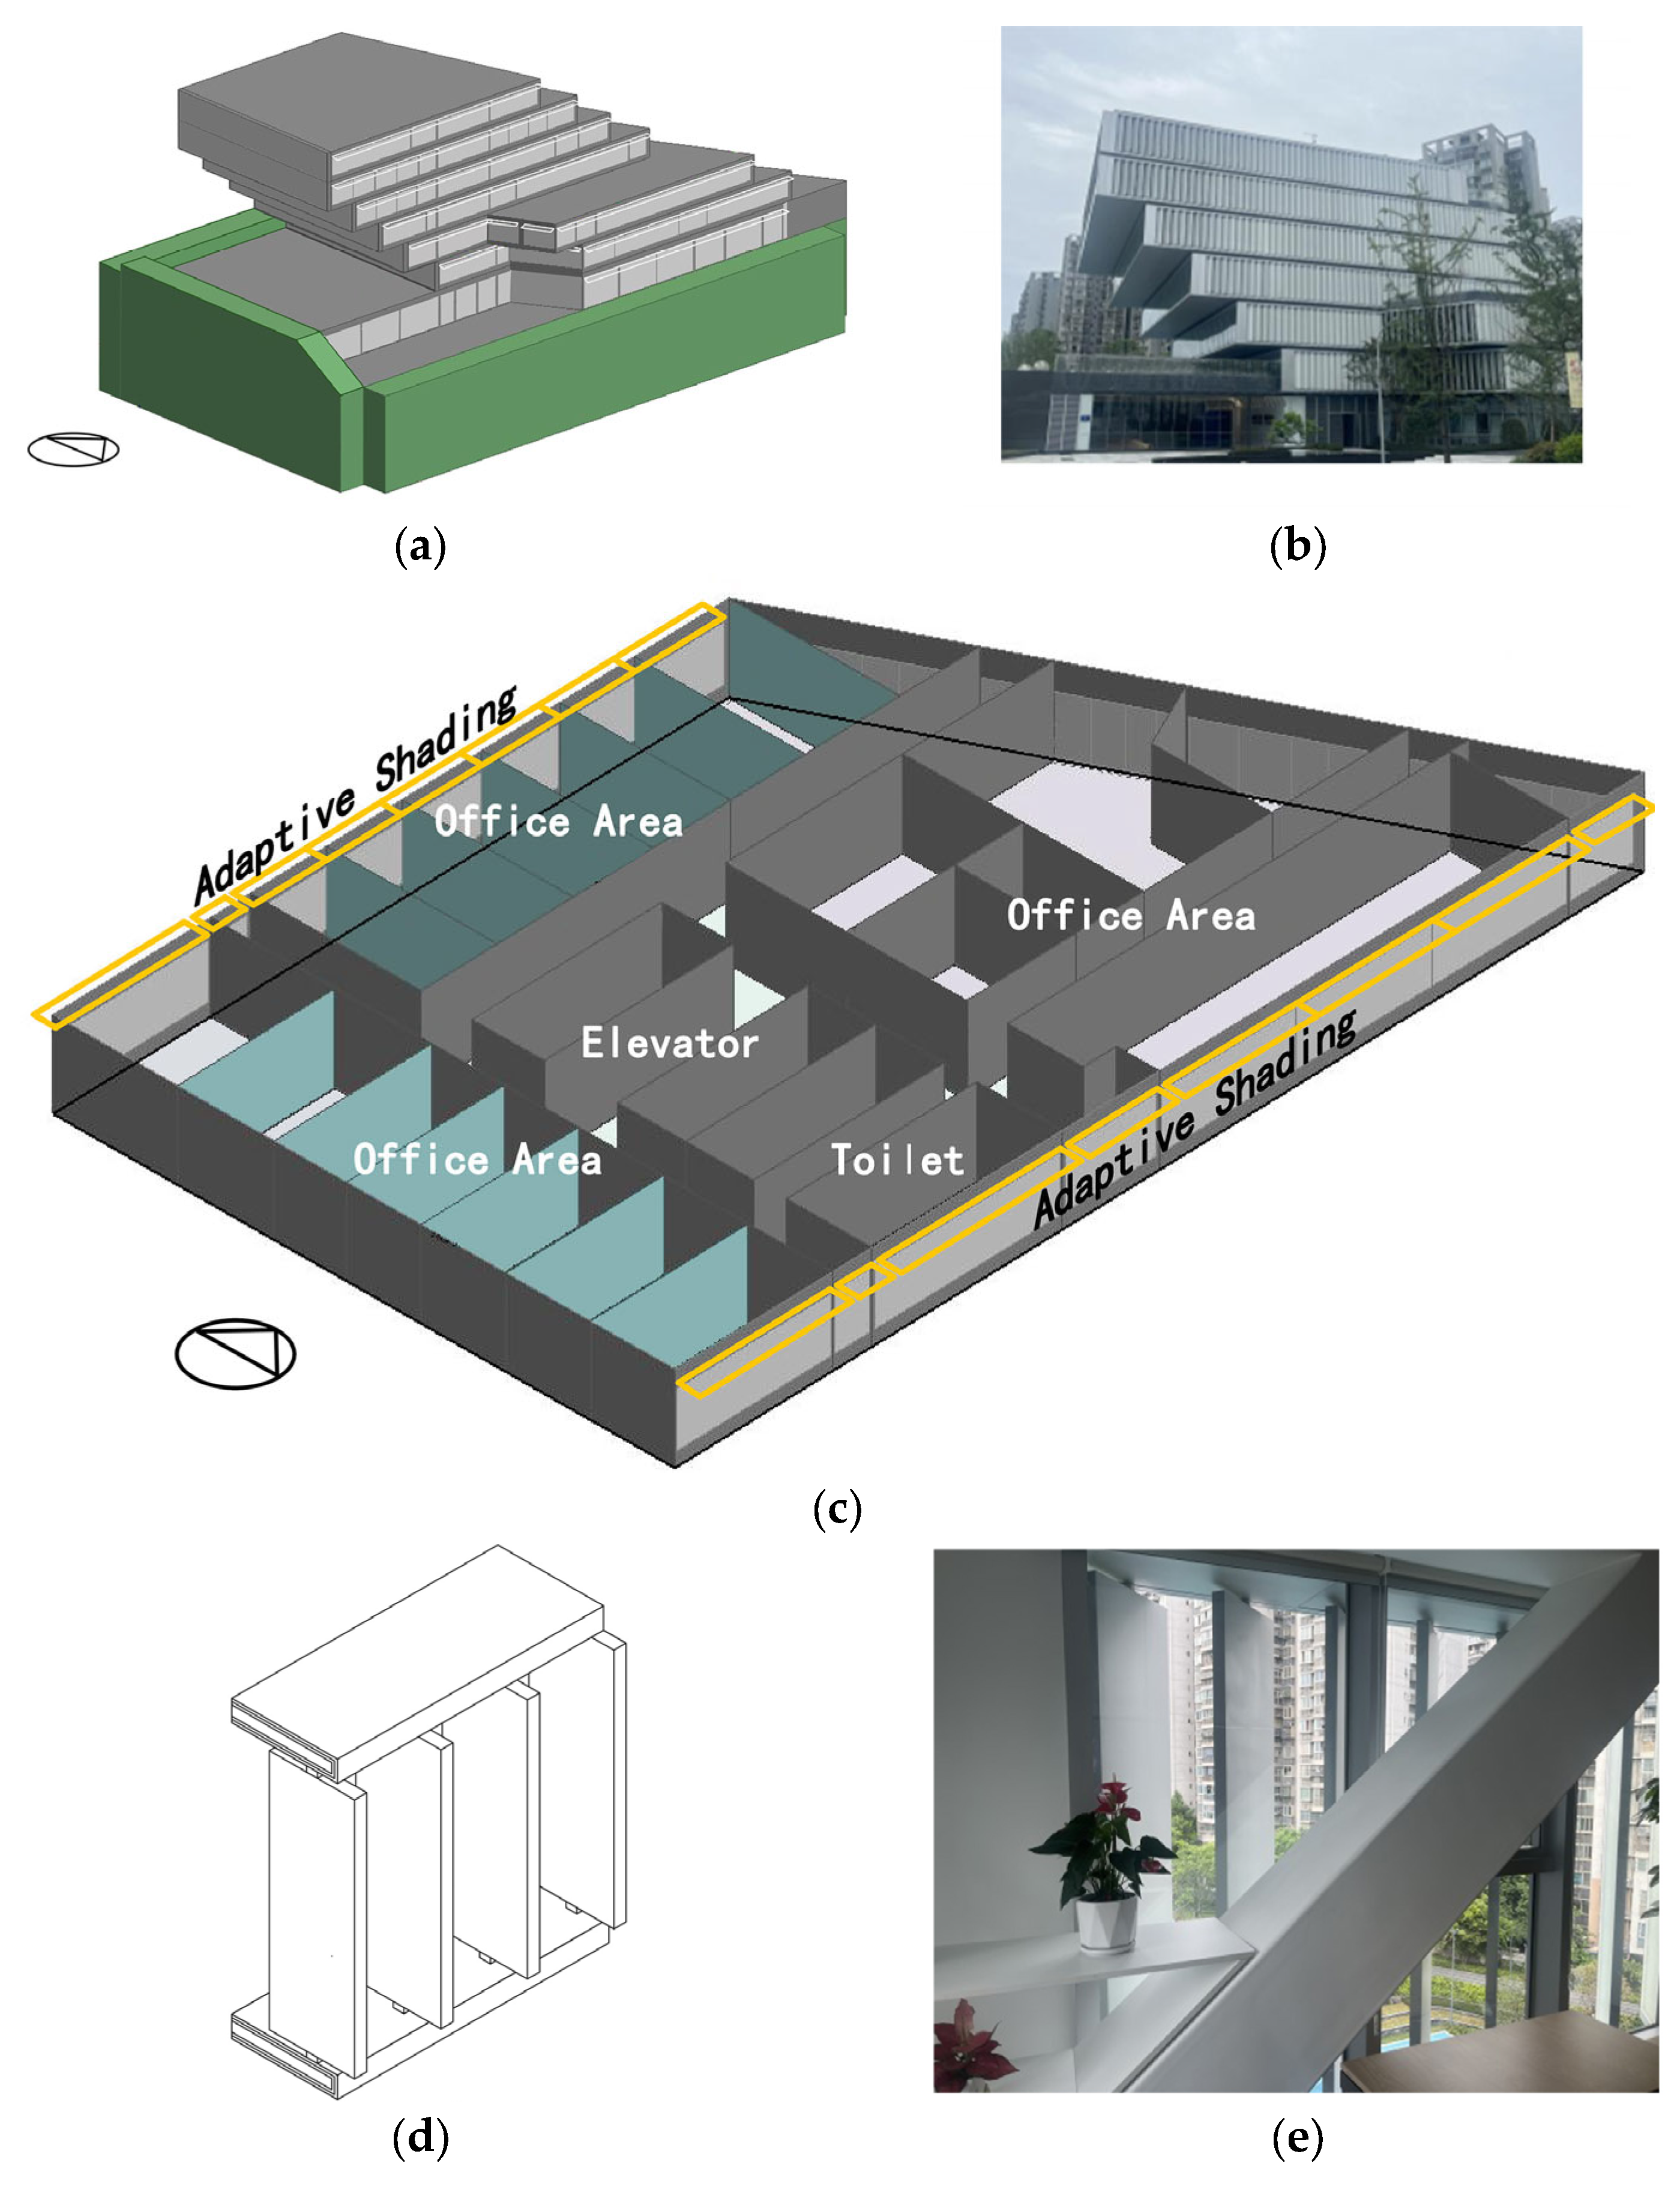
3.1. Case Study
3.2. Experimental Design
3.3. Numerical Modeling
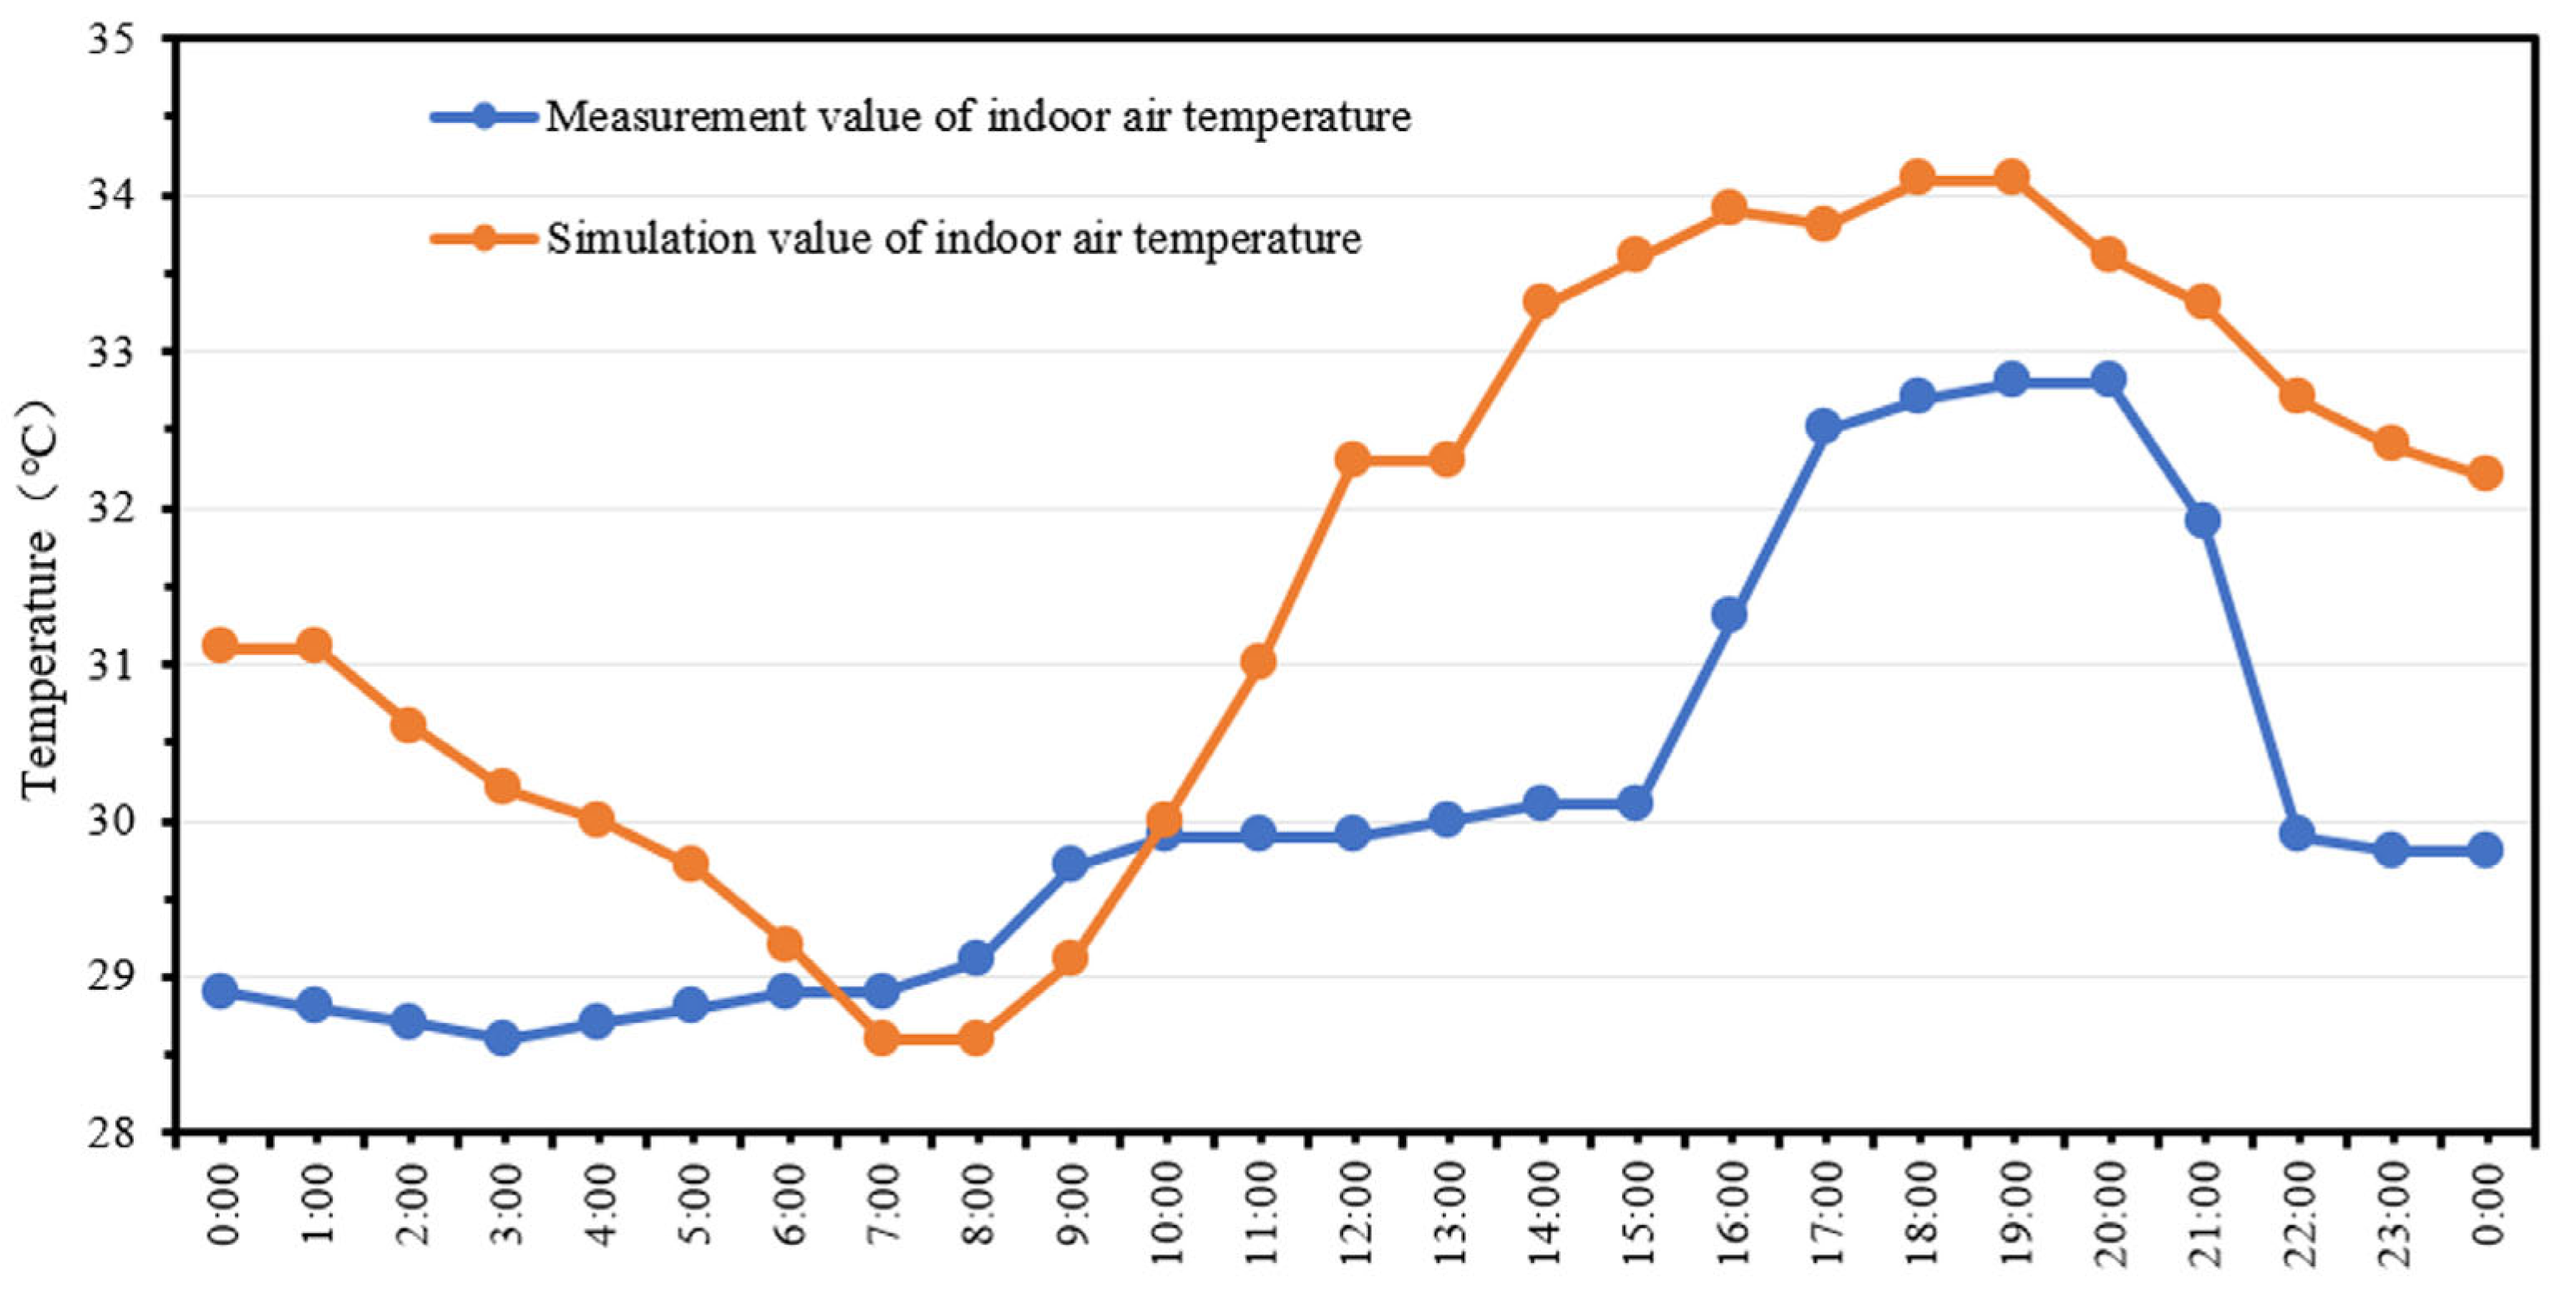
3.4. Model Validation
3.5. Orthogonal Experimental Design
3.5.1. Theoretical Background of Orthogonal Experiments
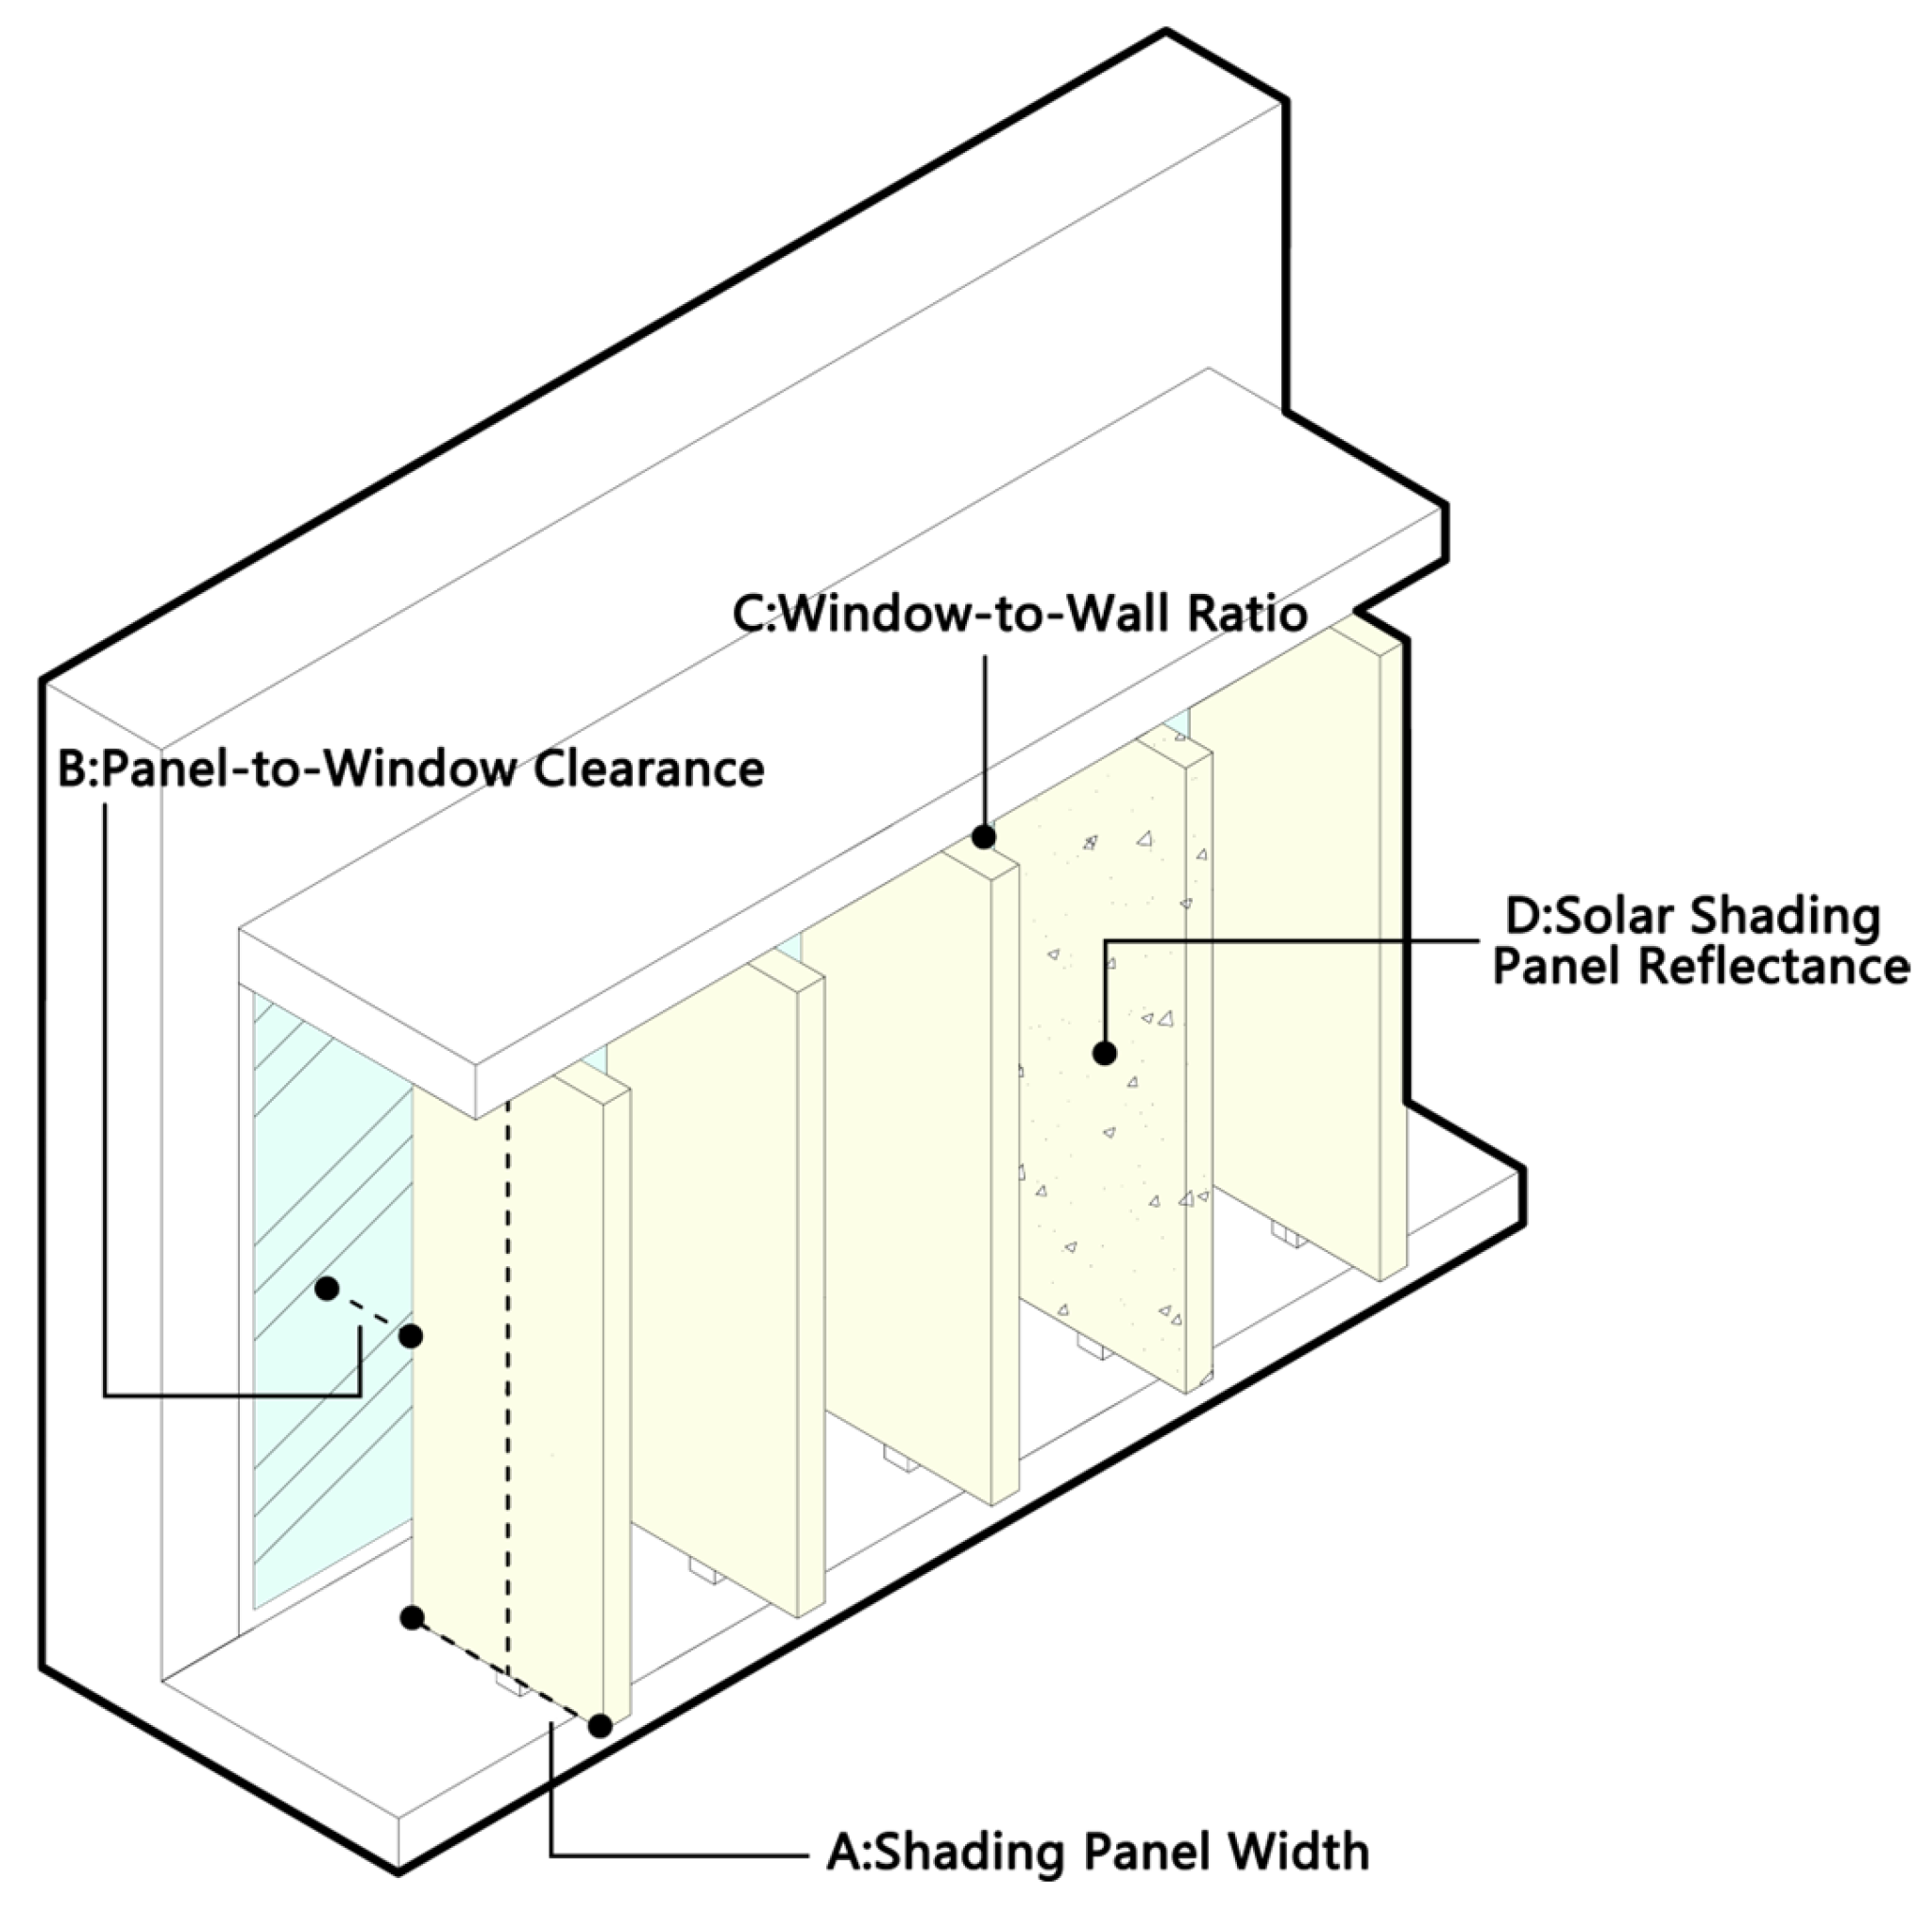
3.5.2. Experimental Variables and Level Design
4. Results and Discussion
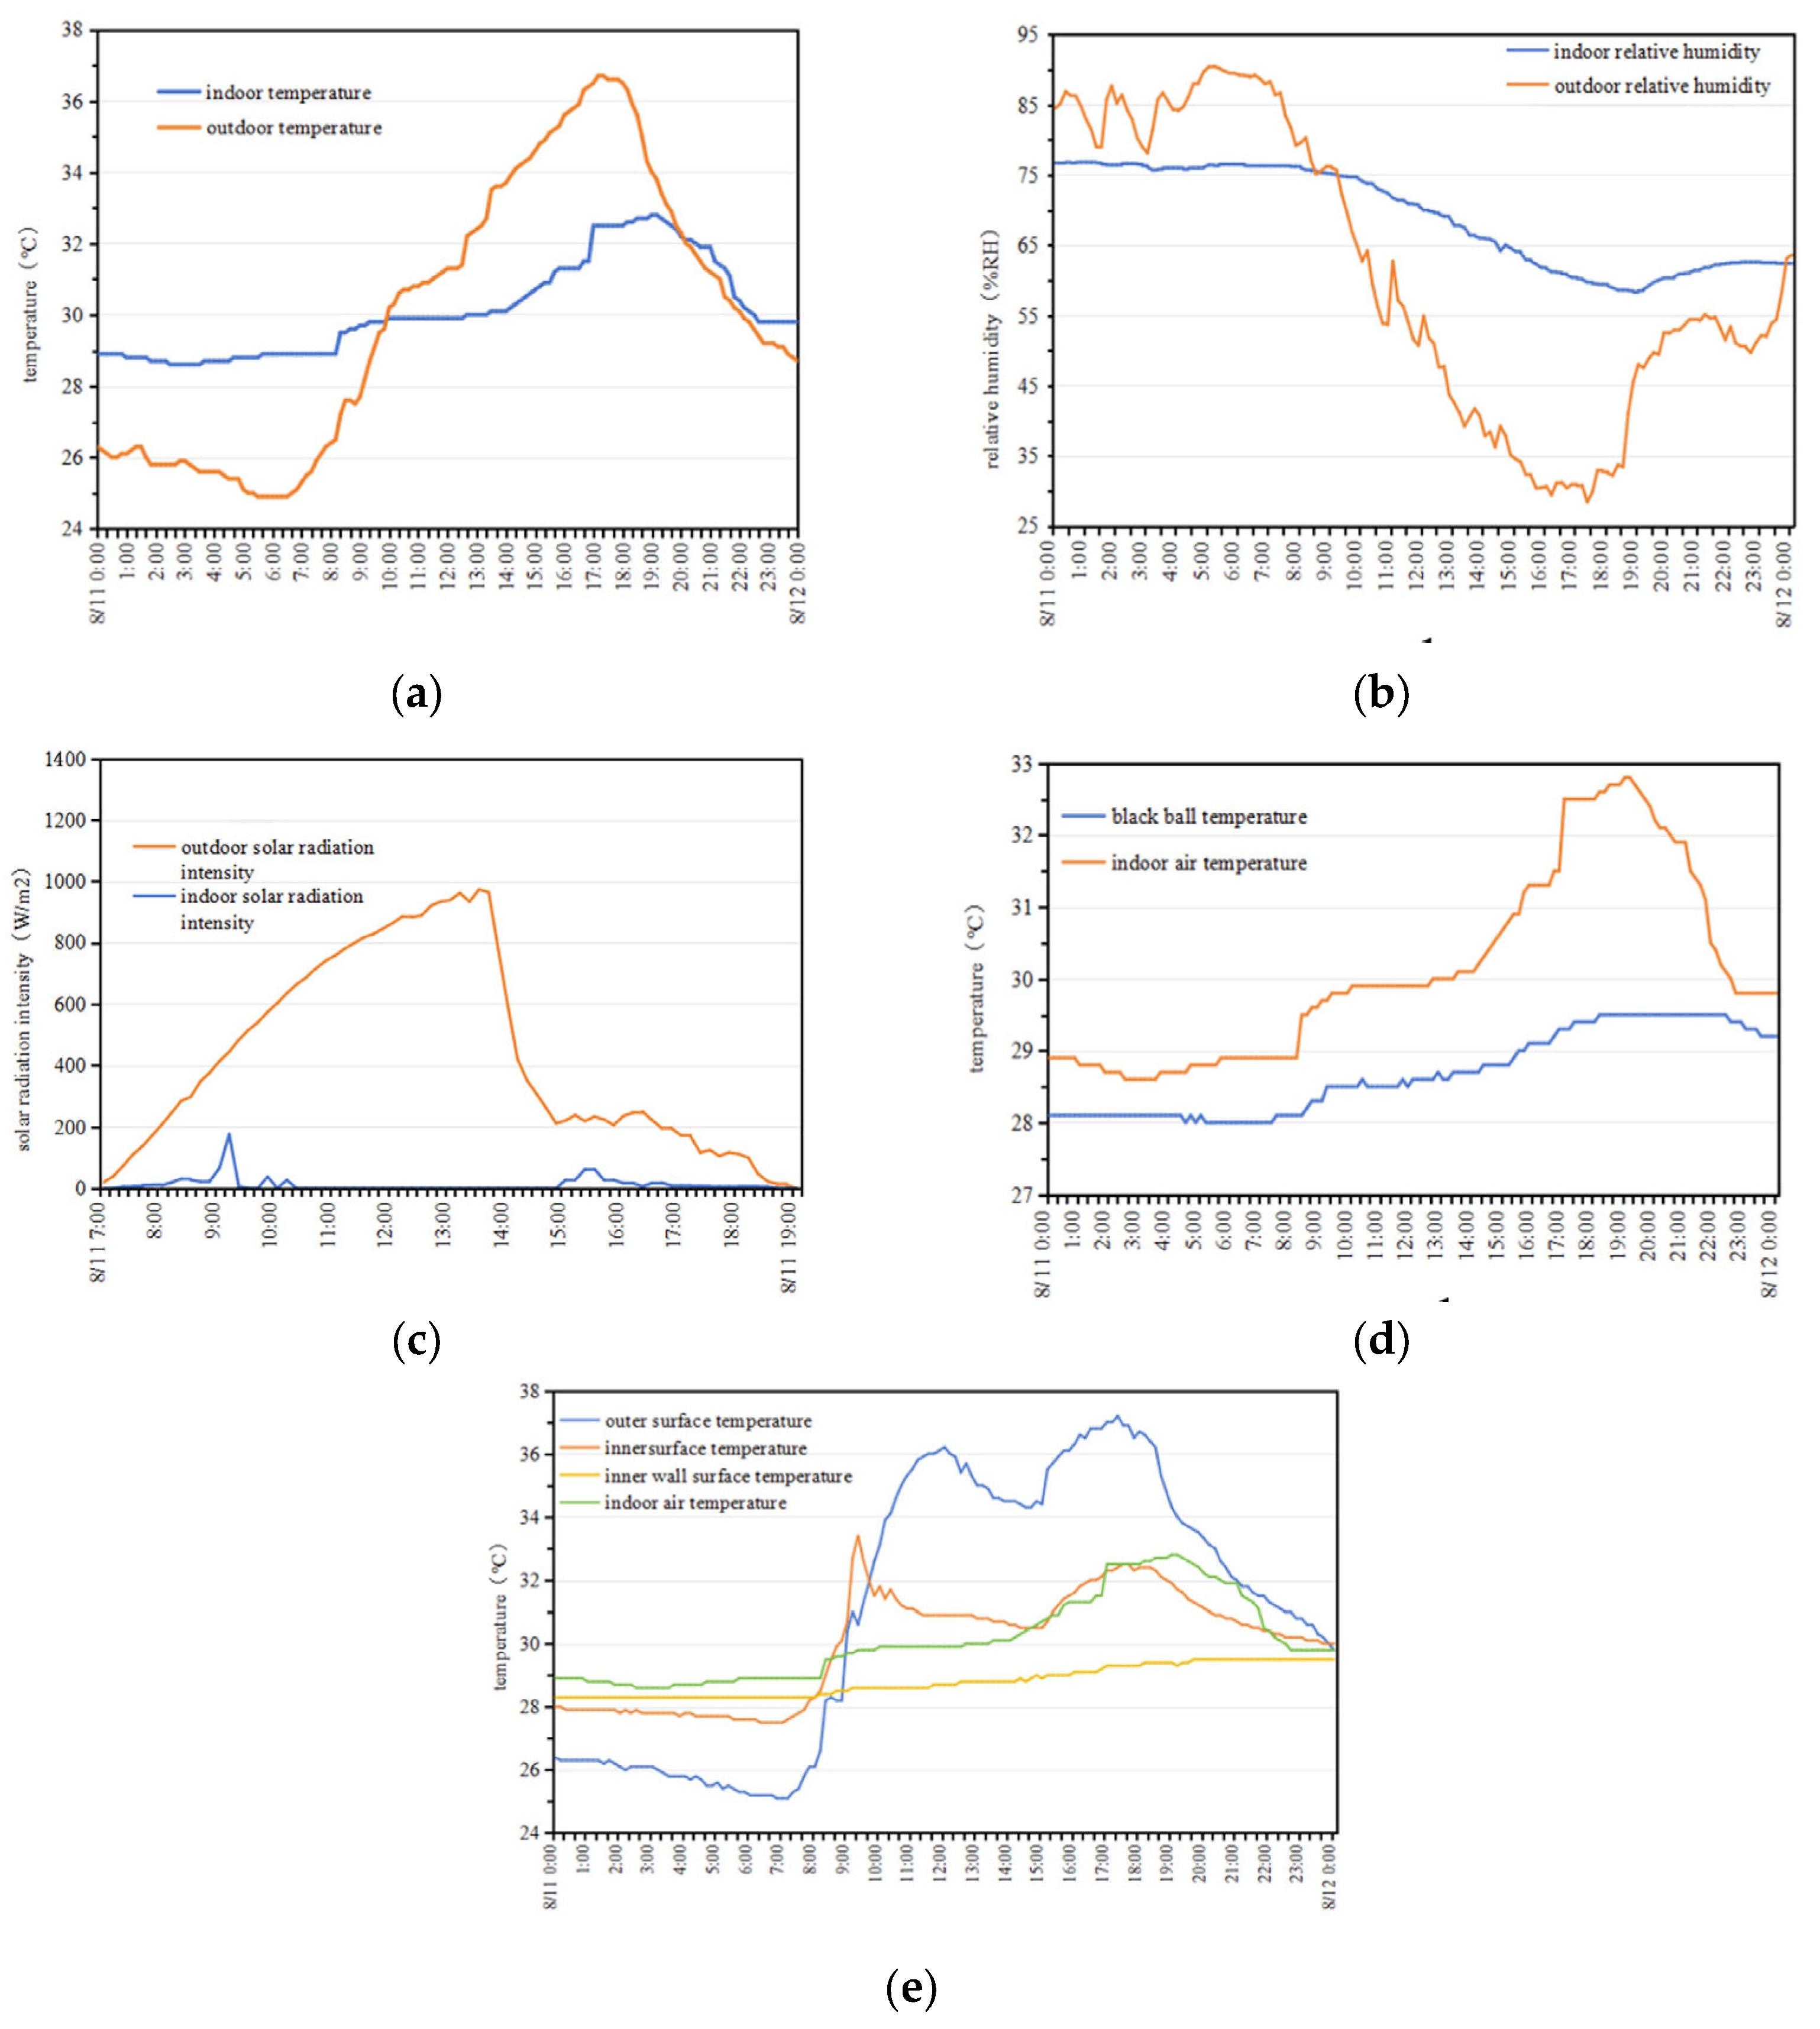
4.1. Experimental Results
4.2. Energy Simulation Results
4.2.1. ANOVA of Orthogonal Experimental Design Results
4.2.2. Range Analysis of Orthogonal Experimental Design Results
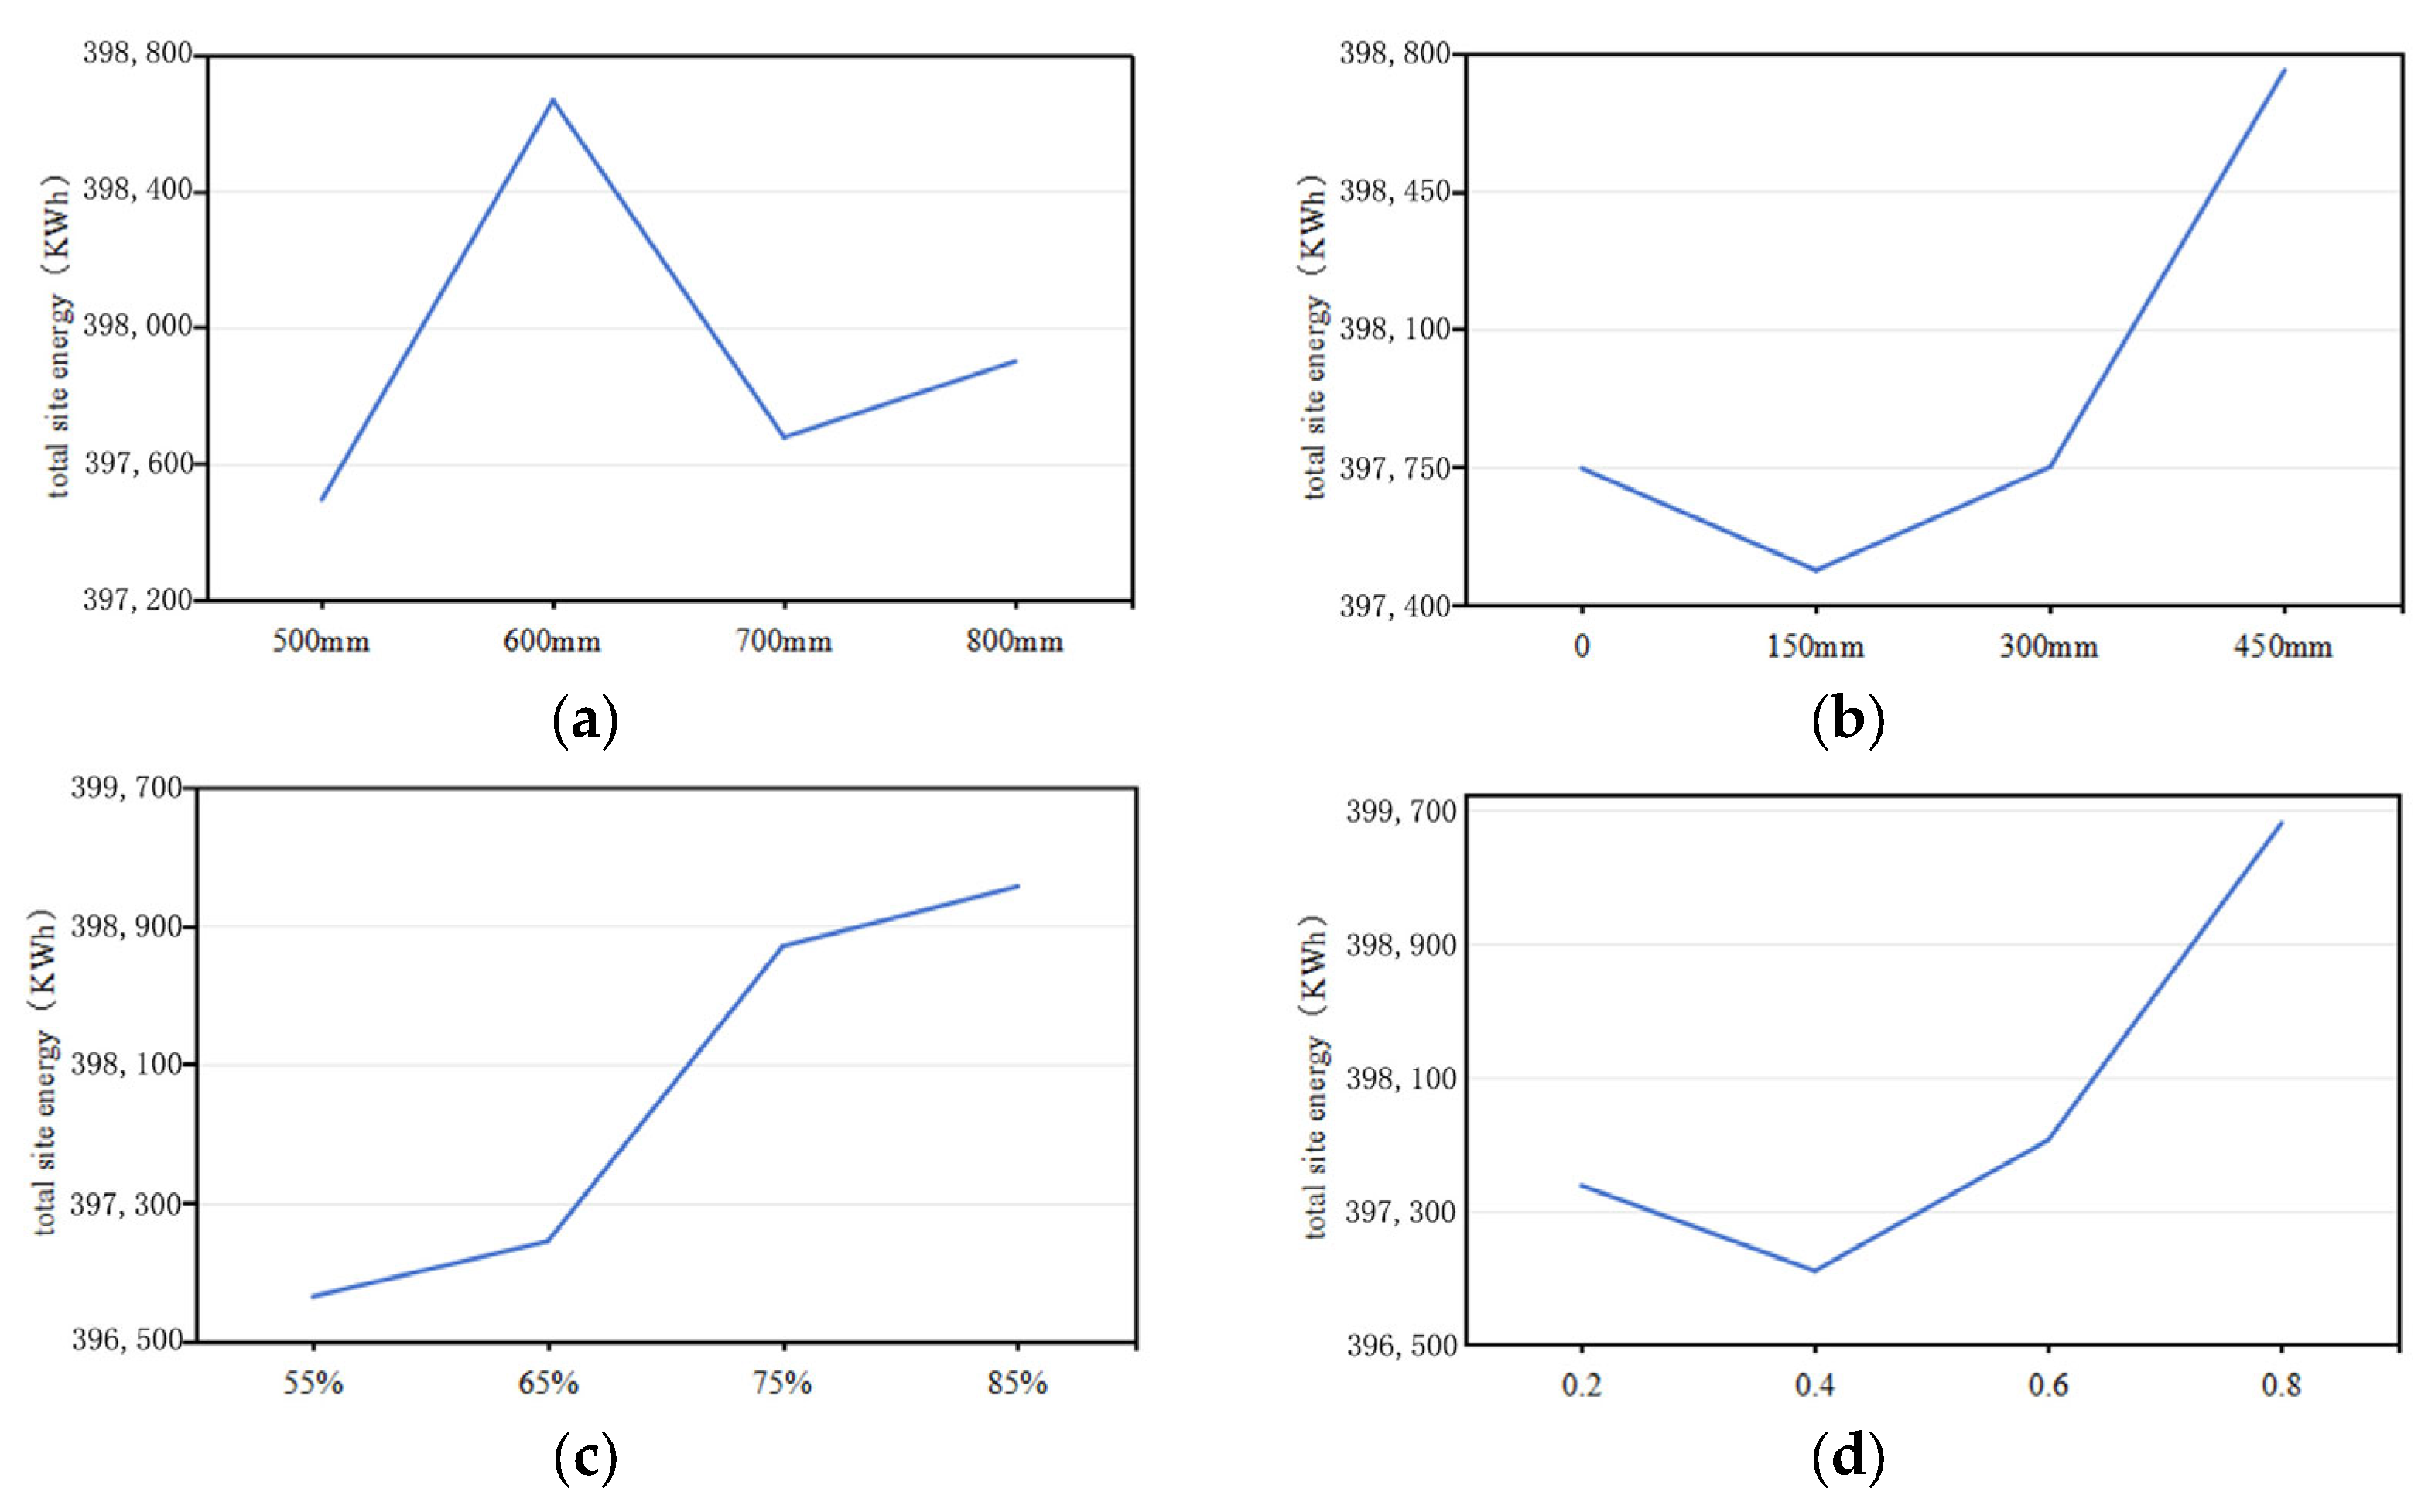
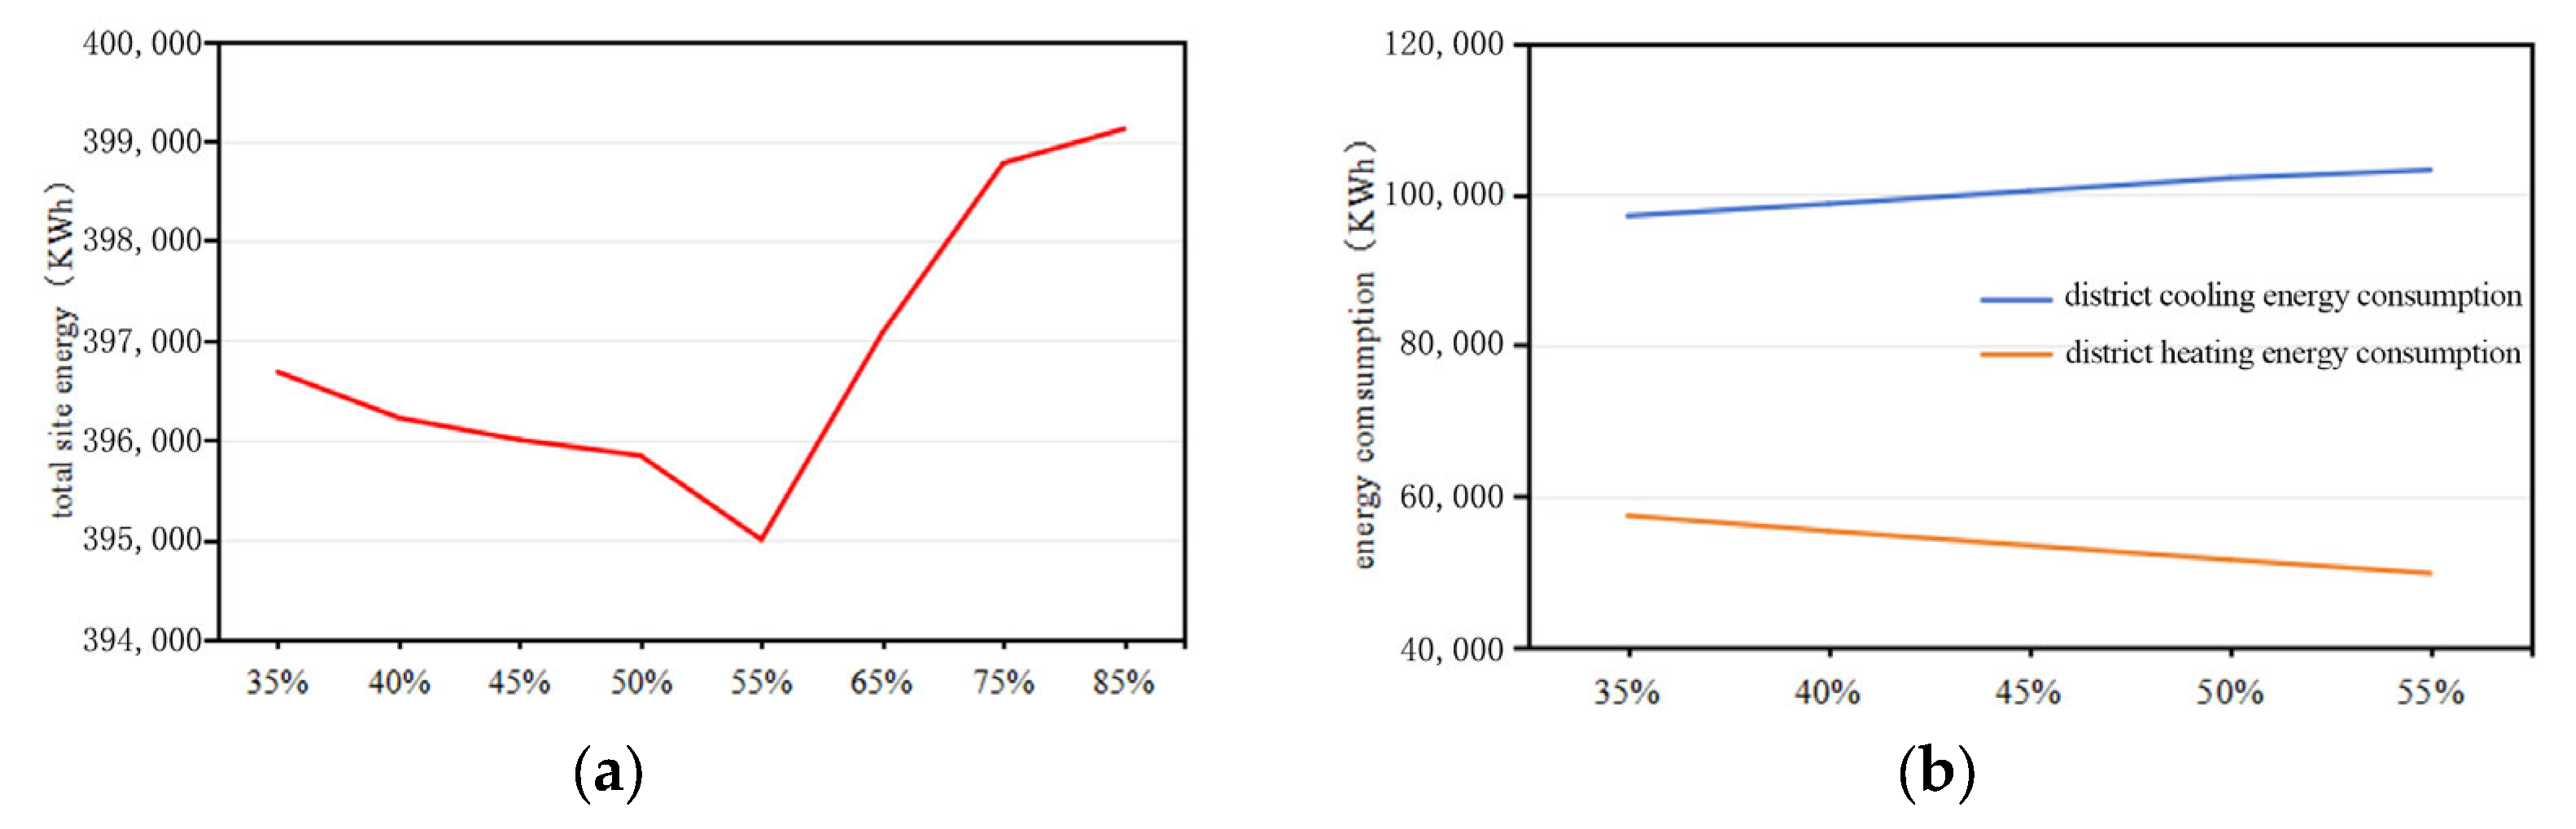
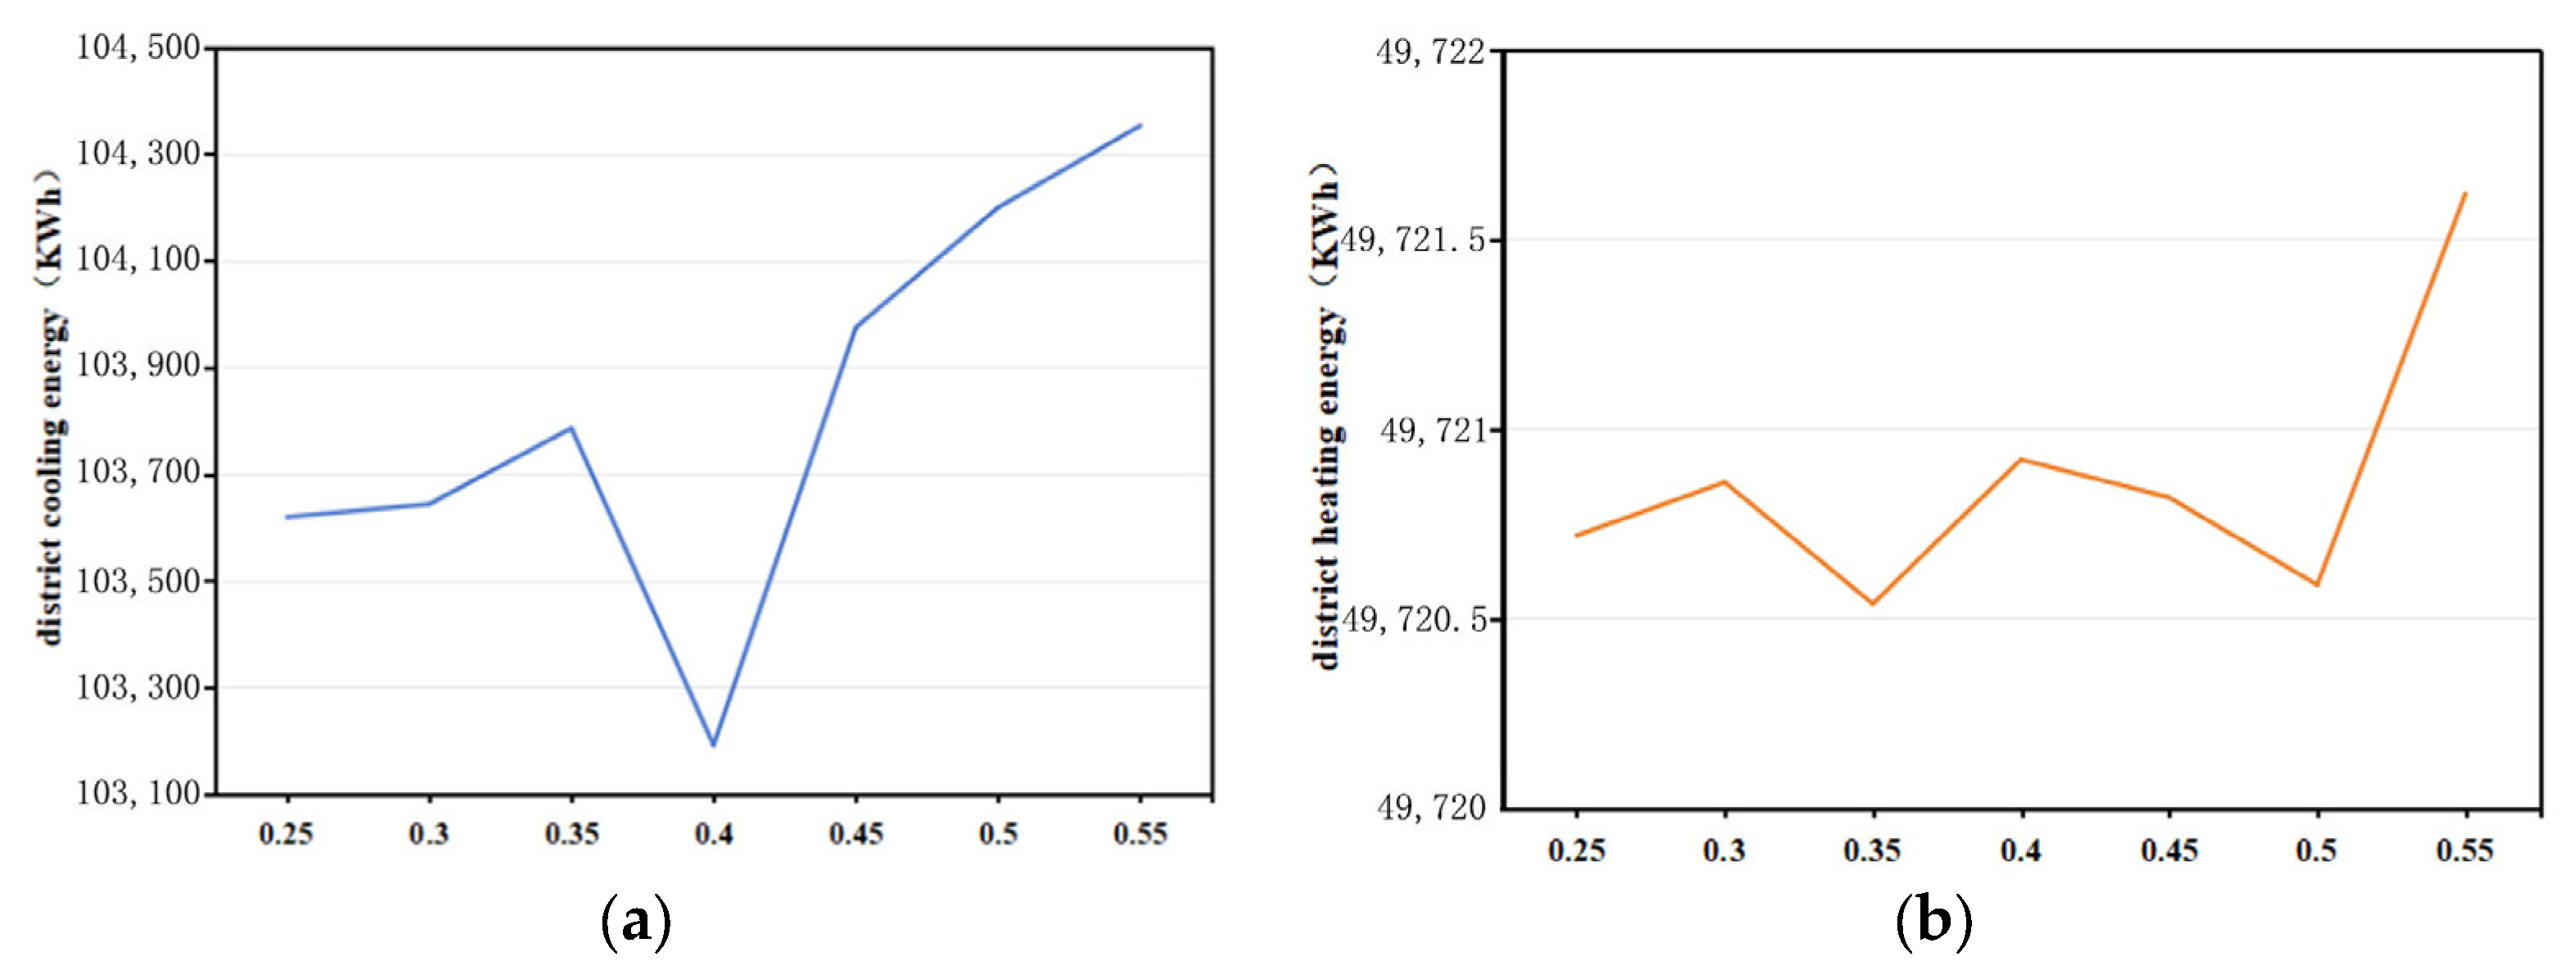
4.2.3. Single-Variable Parametric Analysis and Parameter Optimization
4.2.4. Orientation Parameter Optimization Analysis
5. Conclusions
Author Contributions
Funding
Data Availability Statement
Acknowledgments
Conflicts of Interest
Abbreviations
| NZEB | Nearly Zero Energy Building |
| WWR | Window-to-Wall Ratio |
| ASS | Adaptive Shading System |
| ESD | External Shading Device |
| PV | Photovoltaic |
| PVSD | PV Shading Device |
| TAW | Thermochromic Adaptive Windows |
| MPC | Model Predictive Control |
| AET | Adaptive Envelope Technology |
| SA | Slat Angles |
| MPL | Mismatch Power Loss |
| PSC | Partial Shading Conditions |
| HSCW | Hot Summer and Cold Winter |
| GHI | Global Horizontal Irradiance |
| DOE | Department of Energy |
| LBNL | Lawrence Berkeley National Laboratory |
| EPW | EnergyPlus Weather |
| CSWD | China Standard Weather Data |
| RMSE | Root Mean Square Error |
| NMBE | Normalized Mean Biased Error |
| CV(RMSE) | Coefficient of Variation of the Root Mean Square Error |
| ANOVA | Analysis of Variance |
| SST | Total Sum of Squares |
| SSA | Factor Sum of Squares |
| SSE | The Error Sum of Squares |
| BGT | Black Globe Remperature |
| TSEC | Total Site Energy Consumption |
| EEC | Equivalent Energy Consumption |
References
- Ekonomou, G.; Menegaki, A.N. The Role of the Energy Use in Buildings in Front of Climate Change: Reviewing a System’s Challenging Future. Energies 2023, 16, 6308. [Google Scholar] [CrossRef]
- Evangelisti, L.; Barbaro, L.; Guattari, C.; De Cristo, E.; De Lieto Vollaro, R.; Asdrubali, F. Comparison between Direct and Indirect Heat Flux Measurement Techniques: Preliminary Laboratory Tests. Energies 2024, 17, 2961. [Google Scholar] [CrossRef]
- Kunwar, N.; Cetin, K.S.; Passe, U.; Zhou, X.H.; Li, Y.H. Energy savings and daylighting evaluation of dynamic venetian blinds and lighting through full-scale experimental testing. Energy 2020, 197, 117190. [Google Scholar] [CrossRef]
- Chandrasekaran, C.; Sasidhar, K.; Madhumathi, A. Energy-efficient retrofitting with exterior shading device in hot and humid climate-case studies from fully glazed multi-storied office buildings in Chennai, India. J. Asian Archit. Build. Eng. 2023, 22, 2209–2223. [Google Scholar] [CrossRef]
- Wang, S.L.; Zhang, Q.; Liu, P.; Liang, R.; Fu, Z.T. A Parameterized Design Method for Building a Shading System Based on Climate Adaptability. Atmosphere 2022, 13, 1244. [Google Scholar] [CrossRef]
- Bazazzadeh, H.; Swit-Jankowska, B.; Fazeli, N.; Nadolny, A.; Safar Ali Najar, B.; Hashemi Safaei, S.S.; Mahdavinejad, M. Efficient Shading Device as an Important Part of Daylightophil Architecture; a Designerly Framework of High-Performance Architecture for an Office Building in Tehran. Energies 2021, 14, 8272. [Google Scholar] [CrossRef]
- Wu, H.R.; Zhang, T. Optimal design of complex dynamic shadings: Towards sustainable built environment. Sustain. Cities Soc. 2022, 86, 104109. [Google Scholar] [CrossRef]
- Norouziasas, A.; Tabadkani, A.; Rahif, R.; Amer, M.; van Dijk, D.; Lamy, H.; Attia, S. Implementation of ISO/DIS 52016-3 for adaptive facades: A case study of an office building. Build. Environ. 2023, 235, 110195. [Google Scholar] [CrossRef]
- Krarti, M. Performance of smart glazed overhang systems for US residential buildings. Build. Environ. 2022, 208, 108634. [Google Scholar] [CrossRef]
- Krarti, M.; Karrech, A. Evaluation of static and dynamic PV-Integrated shading systems for office spaces in Australia. Sol. Energy 2024, 277, 112736. [Google Scholar] [CrossRef]
- Wu, S.D.; Zhu, P.J.; Song, J.K.; Sun, H.L.; Cheng, Z.; Lin, B.R. Design and application optimization of static and dynamic shading technologies in multi-climate based on parameter simulation. Renew. Energy 2024, 237, 121846. [Google Scholar] [CrossRef]
- Bi, G.H.; Liu, J.Y.; Gao, G.; Zhao, L.H. Near-optimal adaptive predictive control model study for roller shades in office spaces. J. Build. Eng. 2023, 68, 105998. [Google Scholar] [CrossRef]
- Yang, S.Y.; Wan, M.P.; Ng, B.F.; Dubey, S.; Henze, G.P.; Chen, W.Y.; Baskaran, K. Model predictive control for integrated control of air-conditioning and mechanical ventilation, lighting and shading systems. Appl. Energy 2021, 297, 117112. [Google Scholar] [CrossRef]
- Tabadkani, A.; Roetzel, A.; Li, H.X.; Tsangrassoulis, A.; Attia, S. Analysis of the impact of automatic shading control scenarios on occupant’s comfort and energy load. Appl. Energy 2021, 294, 116904. [Google Scholar] [CrossRef]
- Tabadkani, A.; Tsangrassoulis, A.; Roetzel, A.; Li, H.X. Innovative control approaches to assess energy implications of adaptive facades based on simulation using EnergyPlus. Sol. Energy 2020, 206, 256–268. [Google Scholar] [CrossRef]
- Dong, H.; Vanage, S.; Cetin, K. Sensitivity analysis of sensor placement in energy-efficient, grid-interactive ready small office buildings with dynamic shading and lighting control. Sci. Technol. Built Environ. 2024, 30, 433–451. [Google Scholar] [CrossRef]
- Louis, R.; Shea, K. Solar-powered thermo-pneumatic actuators for passively controlled adaptive shading. Smart Mater. Struct. 2024, 33, 125034. [Google Scholar] [CrossRef]
- Stelzmann, M.; Zakner, F.; de Sosa, I.N.; Nemati, A.; Kahnt, A.; Maass, B.; Drossel, W.-G. Development of a Self-Regulating Solar Shading Actuator Based on the Thermal Shape Memory Effect. Actuators 2024, 13, 85. [Google Scholar] [CrossRef]
- Kunwar, N.; Cetin, K.S.; Passe, U. Calibration of energy simulation using optimization for buildings with dynamic shading systems. Energy Build. 2021, 236, 110787. [Google Scholar] [CrossRef]
- Dehwah, A.H.A.; Krarti, M. Energy performance of integrated adaptive envelope technologies for commercial buildings. J. Build. Eng. 2023, 63, 105535. [Google Scholar] [CrossRef]
- Liu, J.; Bi, G.; Gao, G.; Zhao, L. Optimal design method for photovoltaic shading devices (PVSDs) by combining geometric optimization and adaptive control model. J. Build. Eng. 2023, 69, 106101. [Google Scholar] [CrossRef]
- Zheng, Y.; Wu, J.; Zhang, H.; Lin, C.; Li, Y.; Cui, X.; Shen, P. A novel sun-shading design for indoor visual comfort and energy saving in typical office space in Shenzhen. Energy Build. 2025, 328, 115083. [Google Scholar] [CrossRef]
- Wang, W.; Xu, K.; Xiang, C. Study on the application of a dynamic photovoltaic integrated light shelf for office buildings. Energy 2025, 314, 134205. [Google Scholar] [CrossRef]
- Andrade, T.; Beirao, J.; Arruda, A.; Vinagre, N. Kinetic module in bimetal: A biomimetic approach adapting the kinetic behavior of bimetal for adaptive Facades. Mater. Des. 2024, 239, 112807. [Google Scholar] [CrossRef]
- Cheng, T.; Tahouni, Y.; Sahin, E.S.; Ulrich, K.; Lajewski, S.; Bonten, C.; Wood, D.; Rühe, J.; Speck, T.; Menges, A. Weather-responsive adaptive shading through biobased and bioinspired hygromorphic 4D-printing. Nat. Commun. 2024, 15, 10366. [Google Scholar] [CrossRef]
- Chen, P.; Tang, H. A Framework for Adaptive Façade Optimization Design Based on Building Envelope Performance Characteristics. Buildings 2024, 14, 2646. [Google Scholar] [CrossRef]
- Kuru, A.; Oldfield, P.; Bonser, S.; Fiorito, F. Performance prediction of biomimetic adaptive building skins: Integrating multifunctionality through a novel simulation framework. Sol. Energy 2021, 224, 253–270. [Google Scholar] [CrossRef]
- Liu, J. Adaptive Control of Photovoltaic Shading Louvers for Office Buildings in Guangzhou. Master’s Thesis, South China University of Technology, Guangzhou, China, 2023. [Google Scholar]
- Wang, M.; Jia, Z.; Tao, L.; Wang, W.; Xiang, C. Optimizing the tilt angle of kinetic photovoltaic shading devices considering energy consumption and power Generation—Hong Kong case. Energy Build. 2025, 326, 115072. [Google Scholar] [CrossRef]
- Jiang, M.Z.; Araji, M.T. Multivariate optimization towards energy balance with geometric constraints of building design and urban space intensity. Sustain. Energy Technol. Assess. 2023, 57, 103124. [Google Scholar] [CrossRef]
- Liu, P.; Hussein, A.A.; Alizadeh, A.; Baghoolizadeh, M.; Yan, G.; Zargari, M.; Alkhalifah, T. Multi-objective optimization of office building envelopes properties and Venetian blinds using NSGA-II to save energy consumption and enhance thermal and visual comfort. Case Stud. Therm. Eng. 2024, 64, 105484. [Google Scholar] [CrossRef]
- Anjum, S.; Khan, M.A.; Bodha, K.D.; Ahluwalia, D. Modeling and experimental validation of matrix structure photovoltaic array reconfiguration technique to harvest maximum power under continuous dynamic shading condition. Optik 2022, 271, 170141. [Google Scholar] [CrossRef]
- EI-Dabaa, R.; Abdelmohsen, S.; Mansour, Y. Programmable passive actuation for adaptive building facade design using hygroscopic properties of wood. Wood Mater. Sci. Eng. 2021, 16, 246–259. [Google Scholar] [CrossRef]
- Valitabar, M.; Mahdavinejad, M.; Skates, H.; Pilechiha, P. A dynamic vertical shading optimisation to improve view, visual comfort and operational energy. Open House Int. 2021, 46, 401–415. [Google Scholar] [CrossRef]
- GB/T 50378-2019; Assessment Standard for Green Building. Ministry of Housing and Urban-Rural Development of the People’s Republic of China: Beijing, China, 2019.
- GB 50176-2016; Code for Design of Lightning Protection of Buildings. Ministry of Housing and Urban-Rural Development of the People’s Republic of China: Beijing, China, 2016.
- GB/T 31155-2014; Evaluation Standard for Green Building Materials. Ministry of Housing and Urban-Rural Development of the People’s Republic of China: Beijing, China, 2014.
- ASHRAE 55-2020; Thermal Environmental Conditions for Human Occupancy. ASHRAE: Atlanta, GA, USA, 2020.
- ASTM E2813-2012; Standard Practice for Building Enclosure Commissioning. ASTM: West Conshohocken, PA, USA, 2012.
- GB/T 50785-2012; Technical Code for Indoor Environmental Pollution Control of Civil Building Engineering. Ministry of Housing and Urban-Rural Development of the People’s Republic of China: Beijing, China, 2012.
- GBZ/T 189.3-2007; Occupational Exposure Limits for Hazardous Agents in the Workplace—Part 3: Biological Exposure Indices. National Health Commission of the People’s Republic of China: Beijing, China, 2007.
- ISO 7726:2001; Ergonomics of the Thermal Environment—Instruments for Measuring Physical Quantities. ISO: Geneva, Switzerland, 2001.
- Carlucci, F.; Loonen, R.; Fiorito, F.; Hensen, J.L.M. A novel approach to account for shape-morphing and kinetic shading systems in building energy performance simulations. J. Build. Perform. Simul. 2023, 16, 346–365. [Google Scholar] [CrossRef]
- Bi, G. Adaptive Control of External Roller Shading Systems in Guangzhou Office Buildings. Master’s Thesis, South China University of Technology, Guangzhou, China, 2023. [Google Scholar]
- Liu, Z.; Hou, J.; Zhang, L.; Dewancker, B.J.; Meng, X.; Hou, C. Research on energy-saving factors adaptability of exterior envelopes of university teaching-office buildings under different climates (China) based on orthogonal design and EnergyPlus. Heliyon 2022, 8, e10056. [Google Scholar] [CrossRef]
- Aboelata, A.; Sodoudi, S. Evaluating urban vegetation scenarios to mitigate urban heat island and reduce buildings’ energy in dense built-up areas in Cairo. Build. Environ. 2019, 166, 106407. [Google Scholar] [CrossRef]
- Chowdhury, A.A.; Rasul, M.G.; Khan, M.M.K. Thermal-comfort analysis and simulation for various low-energy cooling-technologies applied to an office building in a subtropical climate. Appl. Energy 2008, 85, 449–462. [Google Scholar] [CrossRef]
- Rahman, M.M.; Rasul, M.G.; Khan, M.M.K. Energy conservation measures in an institutional building in sub-tropical climate in Australia. Appl. Energy 2010, 87, 2994–3004. [Google Scholar] [CrossRef]
- Zhao, J.; Du, Y. Multi-objective optimization design for windows and shading configuration considering energy consumption and thermal comfort: A case study for office building in different climatic regions of China. Sol. Energy 2020, 206, 997–1017. [Google Scholar] [CrossRef]
- ANSI/ASHRAE Standard 140-2004; Standard Method of Test for the Evaluation of Building Energy Analysis Computer Programs. ASHRAE: Atlanta, GA, USA, 2004.
- Hou, J.; Zhang, T.; Liu, Z.; Hou, C.; Fukuda, H. A study on influencing factors of optimum insulation thickness of exterior walls for rural traditional dwellings in northeast of Sichuan hills, China. Case Stud. Constr. Mater. 2022, 16, e01033. [Google Scholar] [CrossRef]
- Li, H.X.; Li, Y.; Jiang, B.; Zhang, L.; Wu, X.; Lin, J. Energy performance optimisation of building envelope retrofit through integrated orthogonal arrays with data envelopment analysis. Renew. Energy 2020, 149, 1414–1423. [Google Scholar] [CrossRef]
- Amaral, C.; Silva, T.; Mohseni, F.; Amaral, J.S.; Amaral, V.S.; Marques, P.A.A.P.; Barros-Timmons, A.; Vicente, R. Experimental and numerical analysis of the thermal performance of polyurethane foams panels incorporating phase change material. Energy 2021, 216, 119213. [Google Scholar] [CrossRef]
- Inman, R.H.; Pedro, H.T.C.; Coimbra, C.F.M. Solar forecasting methods for renewable energy integration. Prog. Energy Combust. Sci. 2013, 39, 535–576. [Google Scholar] [CrossRef]
- Liu, Z.a.; Hou, J.; Huang, Y.; Zhang, J.; Meng, X.; Dewancker, B.J. Influence of phase change material (PCM) parameters on the thermal performance of lightweight building walls with different thermal resistances. Case Stud. Therm. Eng. 2022, 31, 101844. [Google Scholar] [CrossRef]
- Wang, C.; Deng, S.; Niu, J.; Long, E. A numerical study on optimizing the designs of applying PCMs to a disaster-relief prefabricated temporary-house (PTH) to improve its summer daytime indoor thermal environment. Energy 2019, 181, 239–249. [Google Scholar] [CrossRef]
- Liu, M. ANOVA-Based Investigation of Orthogonal Experimental Design. Master’s Thesis, Northeast Forestry University, Harbin, China, 2011. [Google Scholar]
- Rao, C.R. Factorial Experiments Derivable from Combinatorial Arrangements of Arrays. Wiley R. Stat. Soc. 1947, 9, 128–139. [Google Scholar] [CrossRef]
- Dean, A.; Voss, D.; Draguljić, D. Design and Analysis of Experiments, 2nd ed.; Springer: Cham, Switzerland, 2017; pp. XXV–840. [Google Scholar]
- Zhang, L.; Hou, Y.; Liu, Z.a.; Du, J.; Xu, L.; Zhang, G.; Shi, L. Trombe wall for a residential building in Sichuan-Tibet alpine valley—A case study. Renew. Energy 2020, 156, 31–46. [Google Scholar] [CrossRef]
- Jandaghian, Z.; Lacasse, M.; Gaur, A. Solar Reflectance Index of Building Envelope Materials: A Comparative Review of North American and European Standards and Long-Term Performance. Buildings 2025, 15, 888. [Google Scholar] [CrossRef]
- Liang, X.; Zhang, H.; Sun, B. Parametric design of photovoltaic louver integrated shading devices for west facade windows of office buildings in central China. J. Asian Archit. Build. Eng. 2024, 24, 924–938. [Google Scholar] [CrossRef]
- Tawfeeq, H.; Qaradaghi, A.M.A. Optimising Window-to-Wall Ratio for Enhanced Energy Efficiency and Building Intelligence in Hot Summer Mediterranean Climates. Sustainability 2024, 16, 7342. [Google Scholar] [CrossRef]
- Togashi, E.; Muramatsu, H.; Nakagawa, J.; Yamada, K. Modeling a solar shading system that controls heat gain by using solar energy to change louver slat angles. Energy Build. 2024, 319, 114518. [Google Scholar] [CrossRef]


| Enclosure Structure | Thickness and Material of Each Layer from Outside to Inside | Designed Heat Transfer Coefficient K [(m2·K)/W] | Benchmark Heat Transfer Coefficient K [(m2·K)/W] | Schematic Diagram |
|---|---|---|---|---|
| Roof | Large roof: 10 mm Floor tile + 30 mm Cement mortar + 6 mm SBS modified asphalt waterproofing membrane + 20 mm Cement mortar + 40 mm STP vacuum insulation panel for buildings type I + 20 mm Cement mortar + 40 mm LC5.0 lightweight concrete + 120 mm Reinforced concrete | 0.12 | 0.50 |  |
| Terrace roof: 10 mm Floor tile + 30 mm Cement mortar + 6 mm SBS modified asphalt waterproofing membrane + 20 mm Cement mortar + 40 mm STP vacuum insulation panel for buildings type I + 20 mm Cement mortar + 30 mm LC5.0 lightweight concrete + 120 mm Reinforced concrete |  | |||
| Exterior wall | Brick wall: 3 mm Cement mortar + 20 mm STP vacuum insulation panel for buildings type I + 2 mm High polymer waterproof sheet + 18 mm Cement mortar + 200 mm Shale perforated brick | 0.41 | 0.80 | 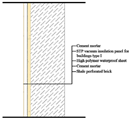 |
| Aluminum sheet: 5 mm Aluminum + 20 mm STP vacuum insulation panel for buildings type I + 50 mm Gypsum panel | 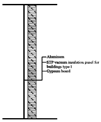 | |||
| Open floor | 20 mm Cement mortar + 120 mm Reinforced Concrete + 20 mm Cement mortar + 90 mm Rock wool band (ρ = 80~120) + 20 mm Cement mortar | 0.44 | 0.70 | 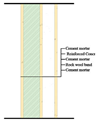 |
| Enclosure Structure | Thickness and Material of Each Layer from Outside to Inside | Designed Heat Transfer Coefficient K [(m2·K)/W] | Schematic Diagram | |
| Curtain wall | Double silver vacuum tempered warm edge argon-filled glass (All ultra clear glass) 6T + 12Ar + 6TL + 0.2V + 6T | 0.823 (SHGC = 0.33, VLT = 0.63) | 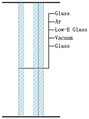 | |
| Exterior window | Double silver vacuum tempered warm edge argon-filled glass (All ultra clear glass) 6T + 12Ar + 6TL + 0.2V + 6T | 0.823 (SHGC = 0.33, VLT = 0.63) | 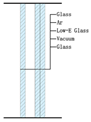 | |
| 12 mm + 2.28 PVB + 12 mm (All ultra clear glass) Tempered laminated glass | 4.339 (SHGC = 0.609, VLT = 0.756) | 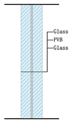 | ||
| Skylight | 6TL + 0.2V + 6T + 1.14EVA + 6T Vacuum laminated glass, Thermal break aluminum alloy profile | 1.0 (SHGC = 0.33, VLT = 0.63) | 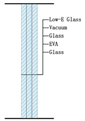 | |
| Parameter | Picture | Brand and Model | Range (Standard Range) | Accuracy (Standard Accuracy) |
|---|---|---|---|---|
| Air temperature |  | Testo, 174H-Mini Temperature and Humidity Recorder | −20 °C to +70 °C (−10 °C to +50 °C) | ±0.5 °C (±0.5 °C) |
| Relative humidity | 0 to 100% RH (0 to 100% RH) | ±3% RH (±5% RH) | ||
| Black globe temperature |  | JT TECHNOLOGY, JTR04 Black Globe Thermometer | −20 °C to +125 °C (−20 °C to +70 °C) | ±0.2 °C (±0.2 °C) |
| Wall temperature | −20 °C to +125 °C (−20 °C to +70 °C) | ±0.2 °C (±0.2 °C) | ||
| Global solar radiation |  | JTDL Four-Channel Solar Radiometer | 0 to 2000 W/m2 (0 to 2000 W/m2) | ≤±2% (≤±2%) |
| Room Type | Cooling Setpoint (°C) | Heating Setpoint (°C) | Fresh Air Supply (m3/h·person) | Occupancy | Lighting Power Density (W/m2) |
|---|---|---|---|---|---|
| Large Conference Room | 26 | 20 | 15 | 40 | 6.8 |
| Private Office | 26 | 20 | 30 | 16 | 5.12 |
| Open Office Area | 26 | 20 | 15 | 20 | 6.8 |
| Reception Area | 26 | 20 | 20 | 5 | 6.8 |
| Fire Control Room | 28 | 18 | 30 | 3 | 9.8 |
| Property Management Room | 26 | 20 | 30 | 3 | 6.8 |
| Cafeteria | 26 | 20 | 25 | 200 | 5.12 |
| Sections | Construction Materials | Heat transfer coefficient K [(m2·K)/W] |
|---|---|---|
| Top Panel | 10 mm Aluminum Sheet + 20 mm STP vacuum insulation panel for buildings type I + 50 mm Gypsum panel | 0.44 |
| Shading Panel | 2.5 mm Aluminum Alloy Sheet + 35 mm Polyurethane Insulation Core + 2.5 mm Aluminum Sheet | 0.48 |
| Bottom Panel | 10 mm Aluminum Sheet + 20 mm STP vacuum insulation panel for buildings type I + 50 mm Gypsum panel | 0.44 |
| Panel Properties | Parameter |
|---|---|
| Blind-to-Glass Distance (m) | 0.6000 |
| Panel Orientation | Vertical |
| Panel Width (m) | 0.60000 |
| Panel Separation (m) | 0.60000 |
| Panel Thickness (m) | 0.05000 |
| Panel Conductivity (W/m-K) | 0.900 |
| Panel Angle | 90.0 |
| Minimum Panel Angle | 0 |
| Maximum Panel Angle | 90.0 |
| Shading Properties | Parameter |
| Shading Form | Window shading |
| Type | Blind with high reflectivity panels |
| Position | 3-Outside |
| Cintrol Type | 4-Solar |
| Solar Setpoint (W/m2) | 200 |
| Panel Angle Control Type | 3-Block beam solar |
| Level | A: Shading Panel Width (mm) | B: Minimum Panel-to-Window Clearance (mm) | C: Window-to-Wall Ratio (%) | D: Solar Shading Panel Reflectance |
|---|---|---|---|---|
| 1 | 500 | 0 | 55 | 0.2 |
| 2 | 600 | 150 | 65 | 0.4 |
| 3 | 700 | 300 | 75 | 0.6 |
| 4 | 800 | 450 | 85 | 0.8 |
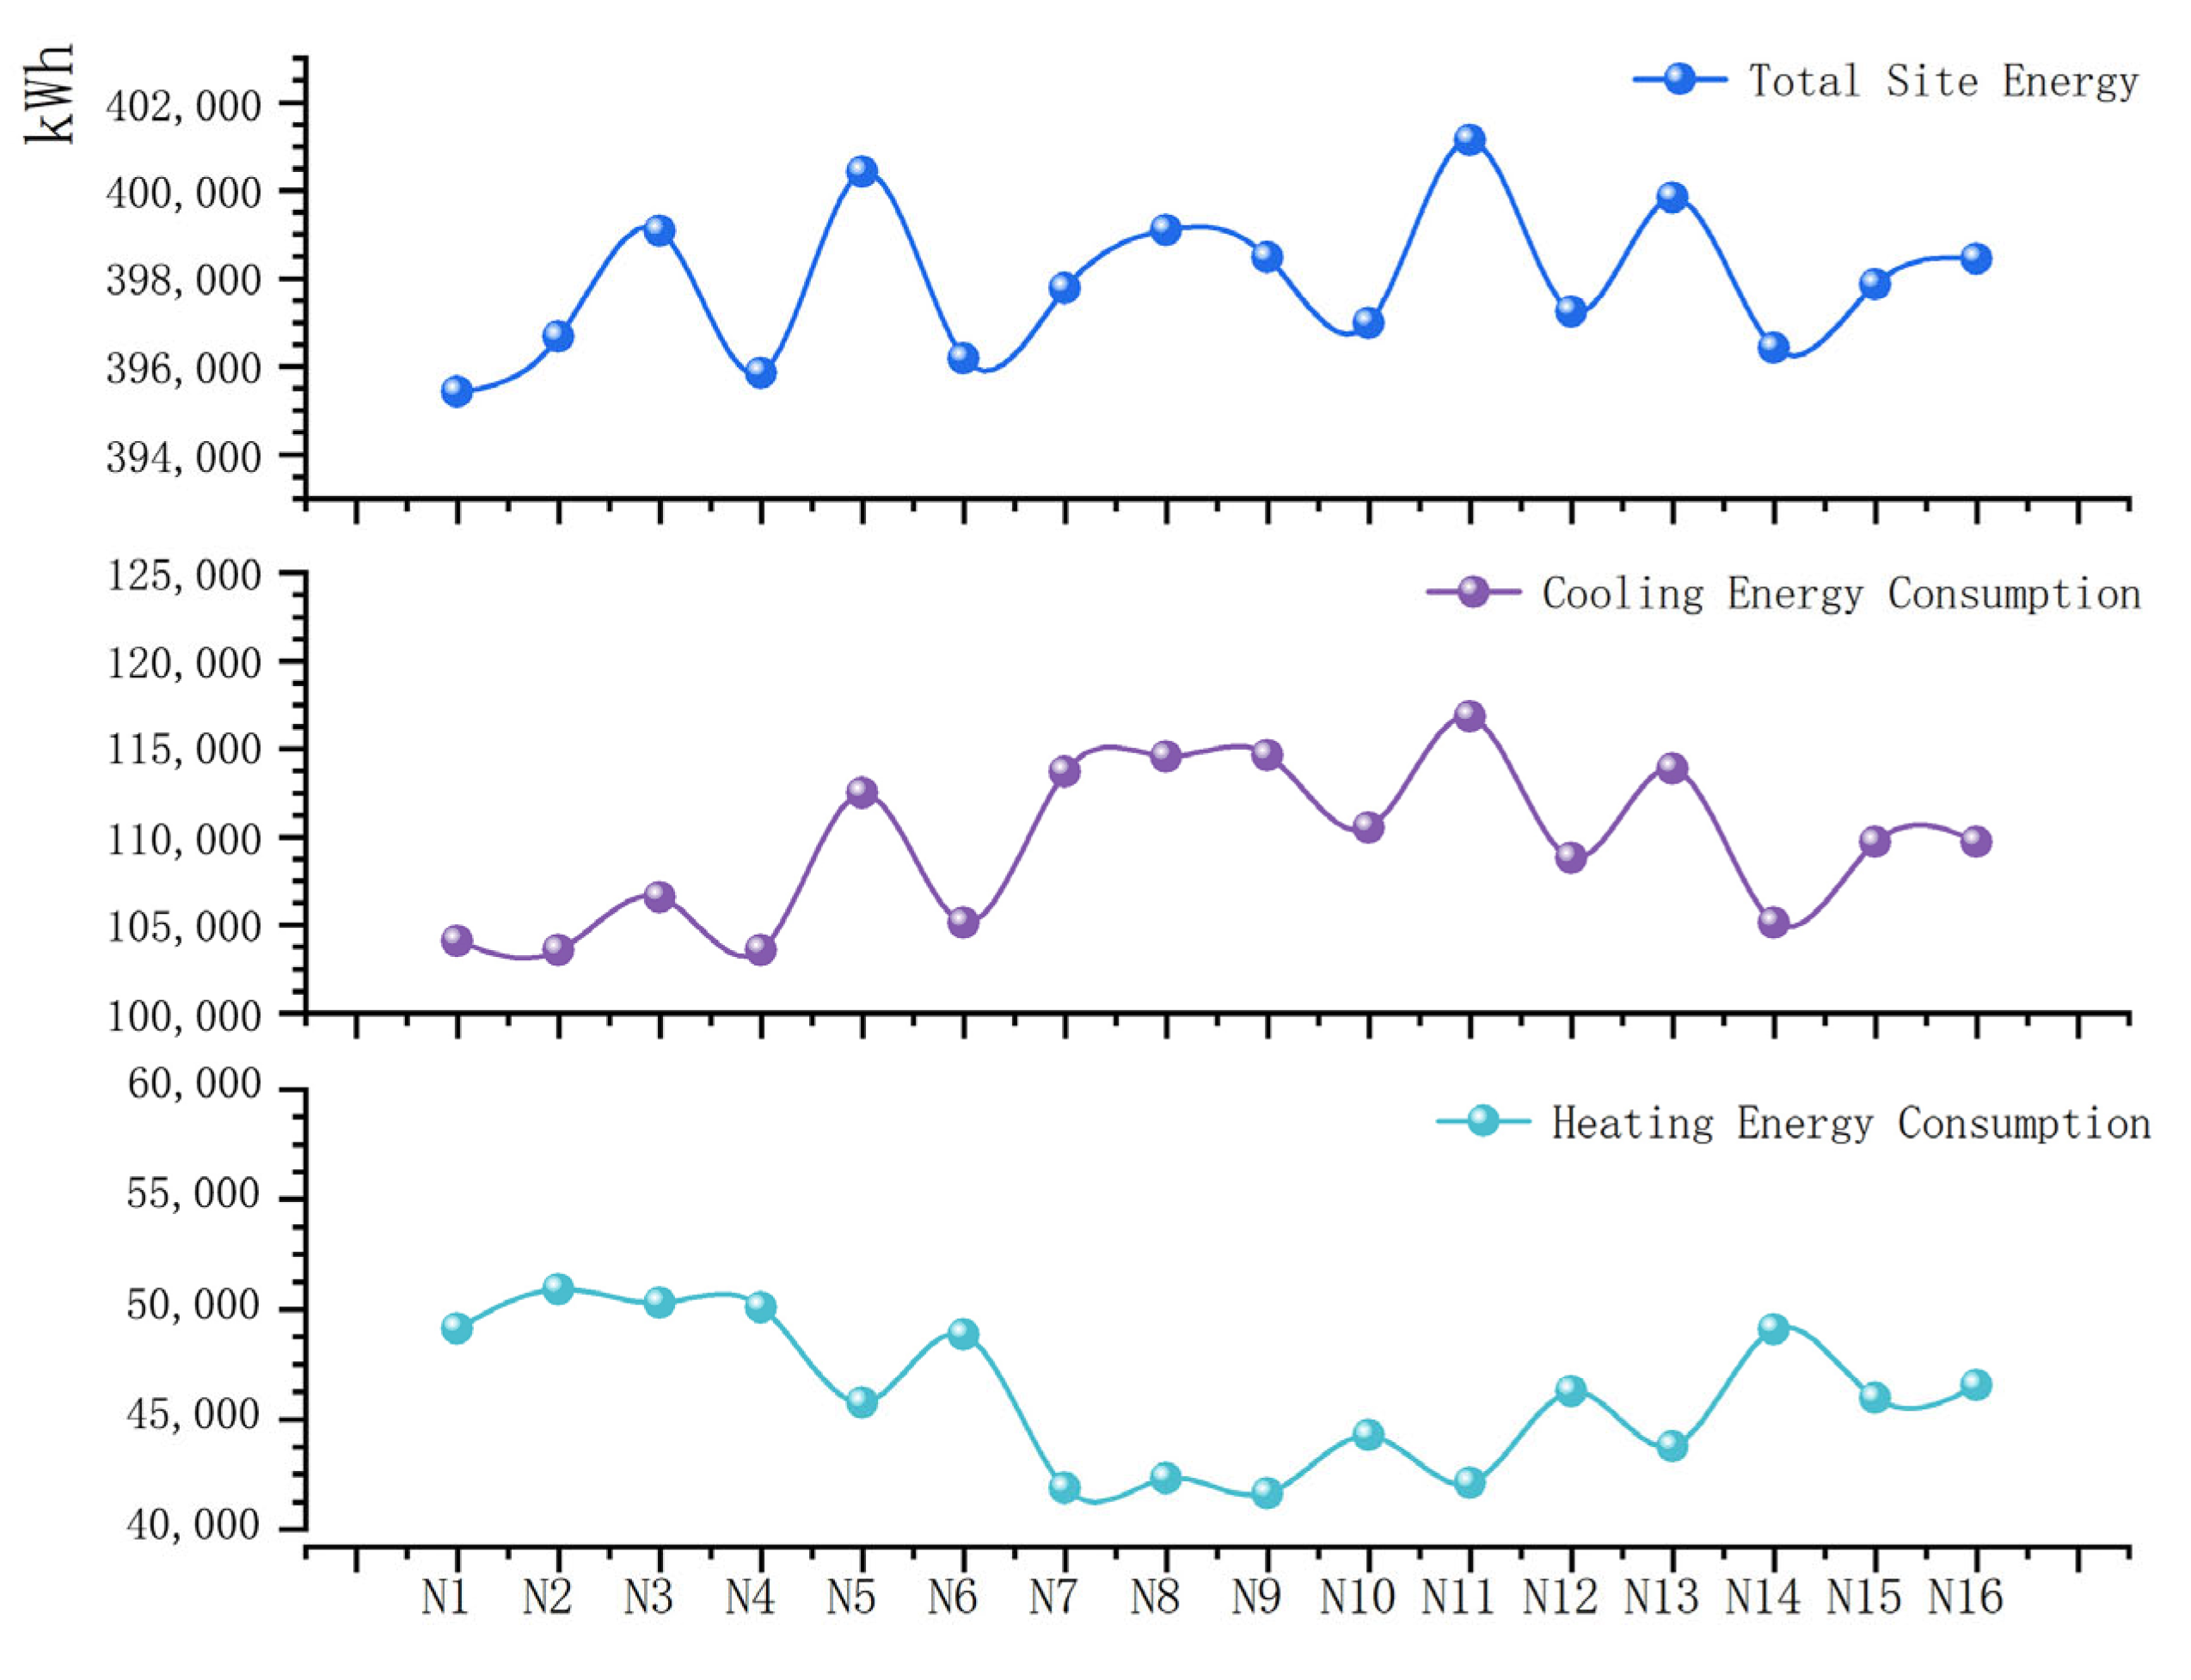
| Scenarios | A | B | C | D | Total Site Energy (kWh) | Cooling Energy Consumption (kWh) | Heating Energy Consumption (kWh) | Equivalent Energy Consumption (kWh/m2) |
|---|---|---|---|---|---|---|---|---|
| N1 | 1 | 1 | 1 | 1 | 395,422.00 | 104,091.10 | 49,141.33 | 51.58 |
| N2 | 3 | 3 | 1 | 3 | 396,671.43 | 103,558.67 | 50,922.98 | 51.74 |
| N3 | 4 | 4 | 1 | 4 | 399,078.05 | 106,591.00 | 50,297.00 | 52.06 |
| N4 | 2 | 2 | 1 | 2 | 395,856.41 | 103,576.00 | 50,090.00 | 51.64 |
| N5 | 2 | 4 | 3 | 1 | 400,417.92 | 112,481.19 | 45,746.95 | 52.23 |
| N6 | 4 | 3 | 2 | 1 | 396,184.63 | 105,130.5 | 48,864.35 | 51.68 |
| N7 | 3 | 2 | 4 | 1 | 397,773.73 | 113,710.85 | 41,873.10 | 51.89 |
| N8 | 1 | 4 | 4 | 3 | 399,107.08 | 114,574.26 | 42,343.04 | 52.06 |
| N9 | 4 | 1 | 4 | 2 | 398,472.75 | 114,640.26 | 41,642.72 | 51.98 |
| N10 | 1 | 3 | 3 | 2 | 396,995.64 | 110,537.74 | 44,268.13 | 51.79 |
| N11 | 2 | 3 | 4 | 4 | 401,143.40 | 116,840.49 | 42,113.13 | 52.33 |
| N12 | 2 | 1 | 2 | 3 | 397,247.38 | 108,794.31 | 46,263.29 | 51.82 |
| N13 | 3 | 1 | 3 | 4 | 399,838.07 | 113,876.30 | 43,771.99 | 52.16 |
| N14 | 3 | 4 | 2 | 2 | 396,422.76 | 105,135.78 | 49,097.20 | 51.71 |
| N15 | 4 | 2 | 3 | 3 | 397,864.29 | 109,709.86 | 45,964.65 | 51.90 |
| N16 | 1 | 2 | 2 | 4 | 398,448.68 | 109,719.37 | 46,539.53 | 51.98 |
| Factor | p-Value | Significance Level |
|---|---|---|
| A | 0.314 | non-significant |
| B | 0.268 | non-significant |
| C | 0.046 | significant |
| D | 0.048 | significant |
| Solar Shading Panel Reflectance | Total Site Energy (kWh) | Cooling Energy Consumption (kWh) | Heating Energy Consumption (kWh) | Equivalent Energy Consumption (kWh/m2) |
|---|---|---|---|---|
| 0.25 | 395,529.19 | 103,618.69 | 49,720.72 | 51.59 |
| 0.30 | 395,553.90 | 103,643.27 | 49,720.86 | 51.60 |
| 0.35 | 395,695.84 | 103,785.53 | 49,720.54 | 51.62 |
| 0.40 | 395,001.86 | 103,191.17 | 49,720.92 | 51.57 |
| 0.45 | 395,885.10 | 103,974.50 | 49,720.82 | 51.64 |
| 0.50 | 396,109.85 | 104,199.48 | 49,720.59 | 51.67 |
Disclaimer/Publisher’s Note: The statements, opinions and data contained in all publications are solely those of the individual author(s) and contributor(s) and not of MDPI and/or the editor(s). MDPI and/or the editor(s) disclaim responsibility for any injury to people or property resulting from any ideas, methods, instructions or products referred to in the content. |
© 2025 by the authors. Licensee MDPI, Basel, Switzerland. This article is an open access article distributed under the terms and conditions of the Creative Commons Attribution (CC BY) license (https://creativecommons.org/licenses/by/4.0/).
Share and Cite
Yang, F.; Zhou, H.; Chen, J.; Sun, Y.; Wang, D.; Sun, F.; Zhang, L. Energy-Saving Performance and Optimization Study of Adaptive Shading System—A Case Study. Buildings 2025, 15, 1961. https://doi.org/10.3390/buildings15111961
Yang F, Zhou H, Chen J, Sun Y, Wang D, Sun F, Zhang L. Energy-Saving Performance and Optimization Study of Adaptive Shading System—A Case Study. Buildings. 2025; 15(11):1961. https://doi.org/10.3390/buildings15111961
Chicago/Turabian StyleYang, Feining, Huangping Zhou, Jianxing Chen, Yu Sun, Dong Wang, Fengjun Sun, and Lili Zhang. 2025. "Energy-Saving Performance and Optimization Study of Adaptive Shading System—A Case Study" Buildings 15, no. 11: 1961. https://doi.org/10.3390/buildings15111961
APA StyleYang, F., Zhou, H., Chen, J., Sun, Y., Wang, D., Sun, F., & Zhang, L. (2025). Energy-Saving Performance and Optimization Study of Adaptive Shading System—A Case Study. Buildings, 15(11), 1961. https://doi.org/10.3390/buildings15111961