Review

Experiential Graphic Design: Informing, Inspiring, and Integrating People in Physical Spaces—A Review

by
Gorana Petković
1,*,
Suzana Pasanec Preprotić
1 and
Anamarija Kozjan Cindrić
2
1
University of Zagreb Faculty of Graphic Arts, Getaldićeva 2, 10000 Zagreb, Croatia
2
Independent Researcher, Design and Brand Standards Specialist at Unconditional Ltd., Radnička cesta 177, 10000 Zagreb, Croatia
*
Author to whom correspondence should be addressed.
Buildings 2025, 15(11), 1862; https://doi.org/10.3390/buildings15111862
Submission received: 23 April 2025 / Revised: 25 May 2025 / Accepted: 27 May 2025 / Published: 28 May 2025
(This article belongs to the Section Architectural Design, Urban Science, and Real Estate)

Abstract

Experiential graphic design (XGD) has increased in importance over the past decade, with technological advances and a focus on user engagement. While the acronym XGD has been used for years, many practitioners prefer the older acronym, EGD, which stands for environmental graphic design. XGD, however, more accurately reflects the field’s scope, which combines multiple design disciplines to enhance user experience through the visual interpretation of ideas in physical spaces. The objective of this study was to perform an extensive bibliometric analysis of the existing literature on XGD topics across a wide range of spatial contexts, with particular emphasis on open public spaces and enclosed architectural environments, structured around four research questions related to the following: (1) foundational studies and the evolution of the literature, (2) the main keywords and research trends, (3) XGD application environments, and (4) XGD’s key roles. The methodology involved analyzing 245 records on the XGD topic from the Scopus, Web of Science, and Google Scholar databases, following the preferred reporting items for systematic reviews and meta-analyses (PRISMA). Based on a comprehensive review of the literature, this study offers a general overview of XGD, exploring its applications across different built environments. In addition, it pairs theoretical concepts with practical examples to demonstrate XGD’s key roles, highlighting current trends, future developments, and the need to establish educational frameworks in the XGD field.

1. Introduction

Whether we are on our way to work, in a museum, in a shopping mall, running errands through the city, exploring new restaurants on vacation, or just having a relaxing walk through the park with a kid, our surroundings are constantly communicating with us. Regardless of the environment and space we are in, for successful communication with and within the environment, we all need the graphic communication of information in that built environment—experiential graphic design. Experiential graphic design (XGD), formerly known as environmental graphic design (EGD), is a multidisciplinary field of design in which graphic design, architecture, interior design, product design, and digital new media art seek to improve the user experience through the visual translation of ideas in the built space. There is great diversity among XGD products, but all of them are designed to engage individuals and enhance their understanding and emotional connection to a physical space or information [1,2,3,4].

1.1. Multisensory Strategies in XGD

By embracing a multisensory and inclusive design approach, experiential graphic design (XGD) effectively addresses the diverse ways in which people perceive and engage with their surroundings, ensuring clear and meaningful communication within built environments [5,6,7]. Visual elements, such as typography, color, symbols, and pictograms, should be designed to maximize clarity and accessibility, considering lighting conditions, viewing distance, and spatial composition, to support all users, including those with physical and cognitive challenges [5,8]. Tactile features, like Braille, raised maps, and textured surfaces, provide crucial spatial information for visually impaired users [7,9]. Auditory components, including spoken cues and ambient soundscapes, complement visual and tactile inputs, particularly benefiting users with limited vision [6,7,9]. Additionally, sound is frequently employed to evoke emotional responses in immersive environments. Digital and interactive technologies, such as touchscreens, motion sensors, and augmented reality, form a core aspect of contemporary XGD practice, supporting cross-modal experiences and enhancing user engagement through adaptive, real-time feedback [6,10]. By integrating these multisensory strategies, XGD upholds the principles of inclusive design, creating experiences that are accessible, meaningful, and usable for the broadest possible audience. This inclusive mindset not only improves accessibility for users with specific impairments but also enriches the experience for everyone [6,7]. Inclusion should transcend technical considerations, encouraging designers to collaborate with users as partners and to develop XGD solutions that foster physical, cognitive, and emotional well-being [7].

1.2. From Environmental Graphic Design (EGD) to Experiential Graphic Design (XGD)

Although humans were making marks on objects to communicate information visually long before paper was invented, EGD has gained recognition and importance over the past 50 years. In the last decade or so, EGD has gradually evolved into XGD, a broader and more immersive approach to the graphic communication of information within physical spaces. This shift has been significantly influenced by globalization and rapid technological developments. The need for faster and more efficient information and navigational understanding has increased with the increasing complexity of the built environment, urbanization, transport development, and the creation of consumer culture [1,11,12,13]. Different authors use different terminology, often choosing either EGD or XGD depending on context. The term EGD is typically used to describe a more traditional approach focused on wayfinding, signage, and spatial identity, with functionality and clarity as key goals. On the other hand, the term XGD is used when referring to approaches that build on EGD by incorporating interactive technologies, storytelling, and user-centered design, offering a more immersive and emotionally engaging experience. The Society of Experiential Graphic Design (SEGD), the most popular and best-known global community for the promotion and improvement of XGD, as well as for the refinement of its technical standards, was formed in 1973. At first, the name of the organization was the Society of Environmental Graphic Designers, but after focusing on the field rather than the practitioners, and when EGD stopped being just a visual language and became a fully sensory experience, the organization changed its name to today’s name in 2014 [1,4,12,14,15]. At present, they define XGD as a field that transforms spaces to be more inclusive and intuitive, efficient and engaging, and sustainable and shared [16]. When talking about the organizations within this industry, it is necessary to mention the International Sign Association (ISA) as well. ISA supports and promotes the signs, graphics, and visual communications industry through advocacy, education, technical resources, and networking. XGD is part of ISA’s effort to provide ongoing education and professional development opportunities for those in the sign and visual communication industries; therefore, in 2018, they established the ISA Experiential Design Program, a unique program for designers, architects, and brand managers that provides high-level education and exposure to the cutting-edge materials and technologies used in sign projects [17].
When it was first adopted, EGD was mostly related to architectural offices, and its products were often referred to as architectural graphics or architectural signing [1]. However, as the name suggests, EGD (now XGD) is primarily related to the field of graphic communications, and as a relatively newly established profession, it is embracing many other disciplines, including architecture, industrial design, and interior design [3,18]. To create a proper image of a physical space, graphic design must be integrated and responsible into each design discipline that is shaping the project. The main task of XGD is to, through different techniques ranging from something as simple as large-format printing, signage, the strategic use of color, or handmade art installation, add a layer of added value to the project and design unique and memorable moments in different physical spaces. Graphic elements such as typography, color, shape, pattern, imagery, illustration, and infographics can align with architectural features to transfer messages or produce experiences. Each of these elements plays a crucial role in transferring information, guiding navigation, and evoking emotional responses from users [3,12,19,20].

1.3. Traditional vs. Experiential Graphic Design

Although traditional graphic designers and experiential graphic designers both use the above-mentioned graphic elements while creating their products, the difference between traditional and experiential graphic designers is frequently very significant. Traditional graphic designers often rely on established design principles and techniques, their knowledge of color theory, typography, and layout, and their esthetic understanding to create visually appealing products [21,22,23]. Unfortunately, a typical education in graphic design usually only includes knowledge related to traditional printed graphic products and/or digital on-screen products. These products are often consumed passively, and the focus is primarily on the visual impact and clarity of the message. In addition, even after incorporating some cultural or historical motifs into the design to evoke nostalgia and familiarity, user interaction remains largely one-dimensional [24]. Experiential graphic designers must integrate spatial design, wayfinding design, and interactive technology with well-known graphic design principles and techniques to create engaging XGD products. XGD is not only about designing but also about planning and creating experiences through a combination of esthetics and strategy to develop physical spaces that inspire and connect with users [3,11]. While education on the topic of traditional graphic design is widespread, there are not many design schools in the world that teach the multidisciplinary thinking necessary for the new era of graphic designers and XGD designers [25]. Unlike traditional graphic designers, who may prioritize esthetic considerations above all else, experiential graphic designers consider how users interact with physical spaces and understand the importance of context and the environment in shaping user experience. For example, this includes the strategic placement of signage, the use of lighting, and the incorporation of tactile elements that enhance the overall experience. By focusing on the user’s journey through a physical space, designers can create environments that are not only visually appealing but also functional and intuitive [14,26].

1.4. Key Aims and Research Questions

Since XGD is a relatively new and broad multidisciplinary field, it is essential to conduct a comprehensive, objective, and critical review of the relevant existing research on the topic. Given its multidisciplinary nature, without a strictly defined terminological basis, finding relevant publications can be challenging. One of the primary objectives of this study is to conduct a comprehensive bibliometric analysis of the existing publications on the XGD topic. This analysis aims to identify the most significant publications, examining key characteristics such as publication year, keywords, word frequency, and source field. Building on an in-depth bibliometric review, the study aims to provide a general overview of XGD, examining its application across various environments. In addition, theoretical concepts will be paired with practical examples to highlight the power of experiential graphic design in informing, inspiring, and integrating people into physical spaces. The aim is to offer clear and accessible insights into the key roles of XGD while also considering future trends and developments within the context of the graphic communications field. The authors acknowledge the use of numerous abbreviations throughout this manuscript, intended to enhance its readability and fluency. However, recognizing the potential for occasional confusion, readers are encouraged to consult the comprehensive list of abbreviations provided at the end of the manuscript for clarity. In order to achieve the main aims of the research, four main research questions (RQ) were posed:
  • RQ1: What are the key foundational studies in the field of XGD and how has the scientific literature on XGD evolved over time?
  • RQ2: What are the established and emerging keywords within the XGD research domain and what are the dominant research trends?
  • RQ3: What are the primary application environments for XGD products, and what are their defining characteristics?
  • RQ4: What are the key roles of XGD, and how can these be effectively realized?

2. Methodology

A literature review is always a complex process, and there are many methods available for comparing the knowledge and gaps in the existing literature. The most common contemporary guideline is to use the preferred reporting items for systematic reviews and meta-analyses (PRISMA) method. The PRISMA 2020 checklist contains 27 key points that address different aspects of a systematic review, from the initial planning stage to the reporting of the results [27]. Therefore, the authors selected PRISMA to ensure clarity, transparency, and consistency in this review article.

2.1. Eligibility Criteria

According to the PRISMA 2020 checklist, the eligibility criteria specify the inclusion and exclusion criteria for a systematic review. Table 1 summarizes the inclusion and exclusion criteria used to select the relevant literature. As indicated in Table 1, the presented exclusion criteria were implemented through different phases of the literature selection process; more precisely, during the identification and screening phases of literature selection.

2.2. Information Sources

Initially, two primary academic and scientific databases, Web of Science and Scopus, were selected to obtain relevant scientific documents. After completing the literature selection process in accordance with the PRISMA method for these two databases, the authors decided to include the Google Scholar database as well. This addition was made to broaden the pool of publications, thereby enhancing the understanding of the topic and addressing all research questions. Of course, to ensure consistency, the same PRISMA method was applied to the Google Scholar database as well. Google Scholar differs significantly from established databases like Web of Science and Scopus, which have stricter selection criteria and better quality control. Therefore, it is important to highlight the advantages, to understand why the authors included this database in their publication selection process, and the limitations of incorporating Google Scholar into this research. Google Scholar offers a significantly broader coverage of academic materials compared to controlled databases such as Web of Science and Scopus, particularly in multidisciplinary subject areas like ours. In addition, its inclusion of non-peer-reviewed and non-English sources allows users to search and find a wide variety of materials, including articles, books, research reports, presentations, blogs, theses, conference proceedings, and much more. However, due to this openness, Google Scholar lacks quality control and has limited search functionalities. These limitations reduce its reliability for systematic reviews. Users must critically assess document types, check for duplicates, determine which results are suitable for their purposes, and use Google Scholar alongside established databases to ensure academic standards are maintained [28,29].

2.3. Search Strategy

To narrow down the literature search and focus on relevant publications in the selected databases, records were extracted using the following search equations:
  • Web of Science database search: (TITLE = (experiential graphic design) OR (environmental graphic design) OR (environmental graphics) OR (KEYWORDS = (experiential graphic design) OR (environmental graphic design) OR (environmental graphics)).
  • Scopus database search: (ARTICLE TITLE = (“experiential graphic design”) OR (“environmental graphic design”) OR (“environmental graphics”)) OR (KEYWORDS = (“experiential graphic design”) OR (“environmental graphic design”) OR (“environmental graphics”)).
  • Google Scholar database search: (find articles with ALL of the words = (“environmental graphic design”) OR (“experiential graphic design”) OR (“environmental graphics”) in the TITLE of the article).
While the term “experiential graphic design” has become more common among designers in recent years, it is still rarely mentioned in the academic literature. Many studies continue to use terms like “environmental graphic design” or “environmental graphics” instead. For this reason, authors decided to use these three terms to create search equations for all databases.

2.4. Selection Process

In accordance with the eligibility criteria and the PRISMA 2020 flow diagram, each author independently conducted the searches and performed all the PRISMA phases. Any discrepancies that arose were discussed and resolved through consensus. The final PRISMA flow diagram is shown in Figure 1. The initial search identified 245 publications across the Web of Science, Scopus, and Google Scholar databases.
In the first stage of identification, the authors applied the defined inclusion and exclusion criteria from Table 1, using the respective filtering functions in each database to refine the search. In the Web of Science database, after applying the initial filters for source type and language, the publication count was reduced from 73 to 50. After applying the same filters in Scopus, the number of publications decreased from 31 to 27. The filtered results from both databases were then exported to Microsoft Excel spreadsheets. Due to the limitations of Google Scholar, where filters cannot be applied directly and the results cannot be easily exported in Microsoft Excel, all 141 references were exported using Google Scholar Scraper. Subsequently, source type and language filters were applied manually in Microsoft Excel, reducing the total to 38 references. Next, duplicates across the databases and references without available abstracts were removed from all spreadsheets. As a result, the identification phase was completed with 35 publications from Web of Science, 19 from Scopus, and 27 from Google Scholar, yielding a total of 81 publications for the screening process.
In the first screening phase, 22 results were excluded after reviewing the titles. Following the abstract review, an additional eight results were excluded. A total of 51 publications remained for full-text retrieval, with 15 from Web of Science, 15 from Scopus, and 21 from Google Scholar. However, due to issues with unavailability or inaccessible full texts, 11 publications could not be retrieved. In the final phase, the full texts of the remaining publications were thoroughly read, resulting in the exclusion of 12 publications. As a result, 28 publications were included in the review: 11 from Web of Science, 8 from Scopus, and 9 from Google Scholar. The reasons for the final exclusions were as follows: one publication contained only an abstract in English, four publications lacked references or contained insufficient referencing, and the remaining seven publications were deemed irrelevant to the scope of this review. Four of these were focused on architecture, history or transportation, which were outside the scope of this review’s intended fields. One article was narrowly focused on illustrations within a specific type of EGD product. The remaining publications were overly specialized, discussing the application of EGD in specific contexts, such as the COVID-19 pandemic, and its application for religious purposes, which were not aligned with the broader themes of this review.

2.5. Data Management

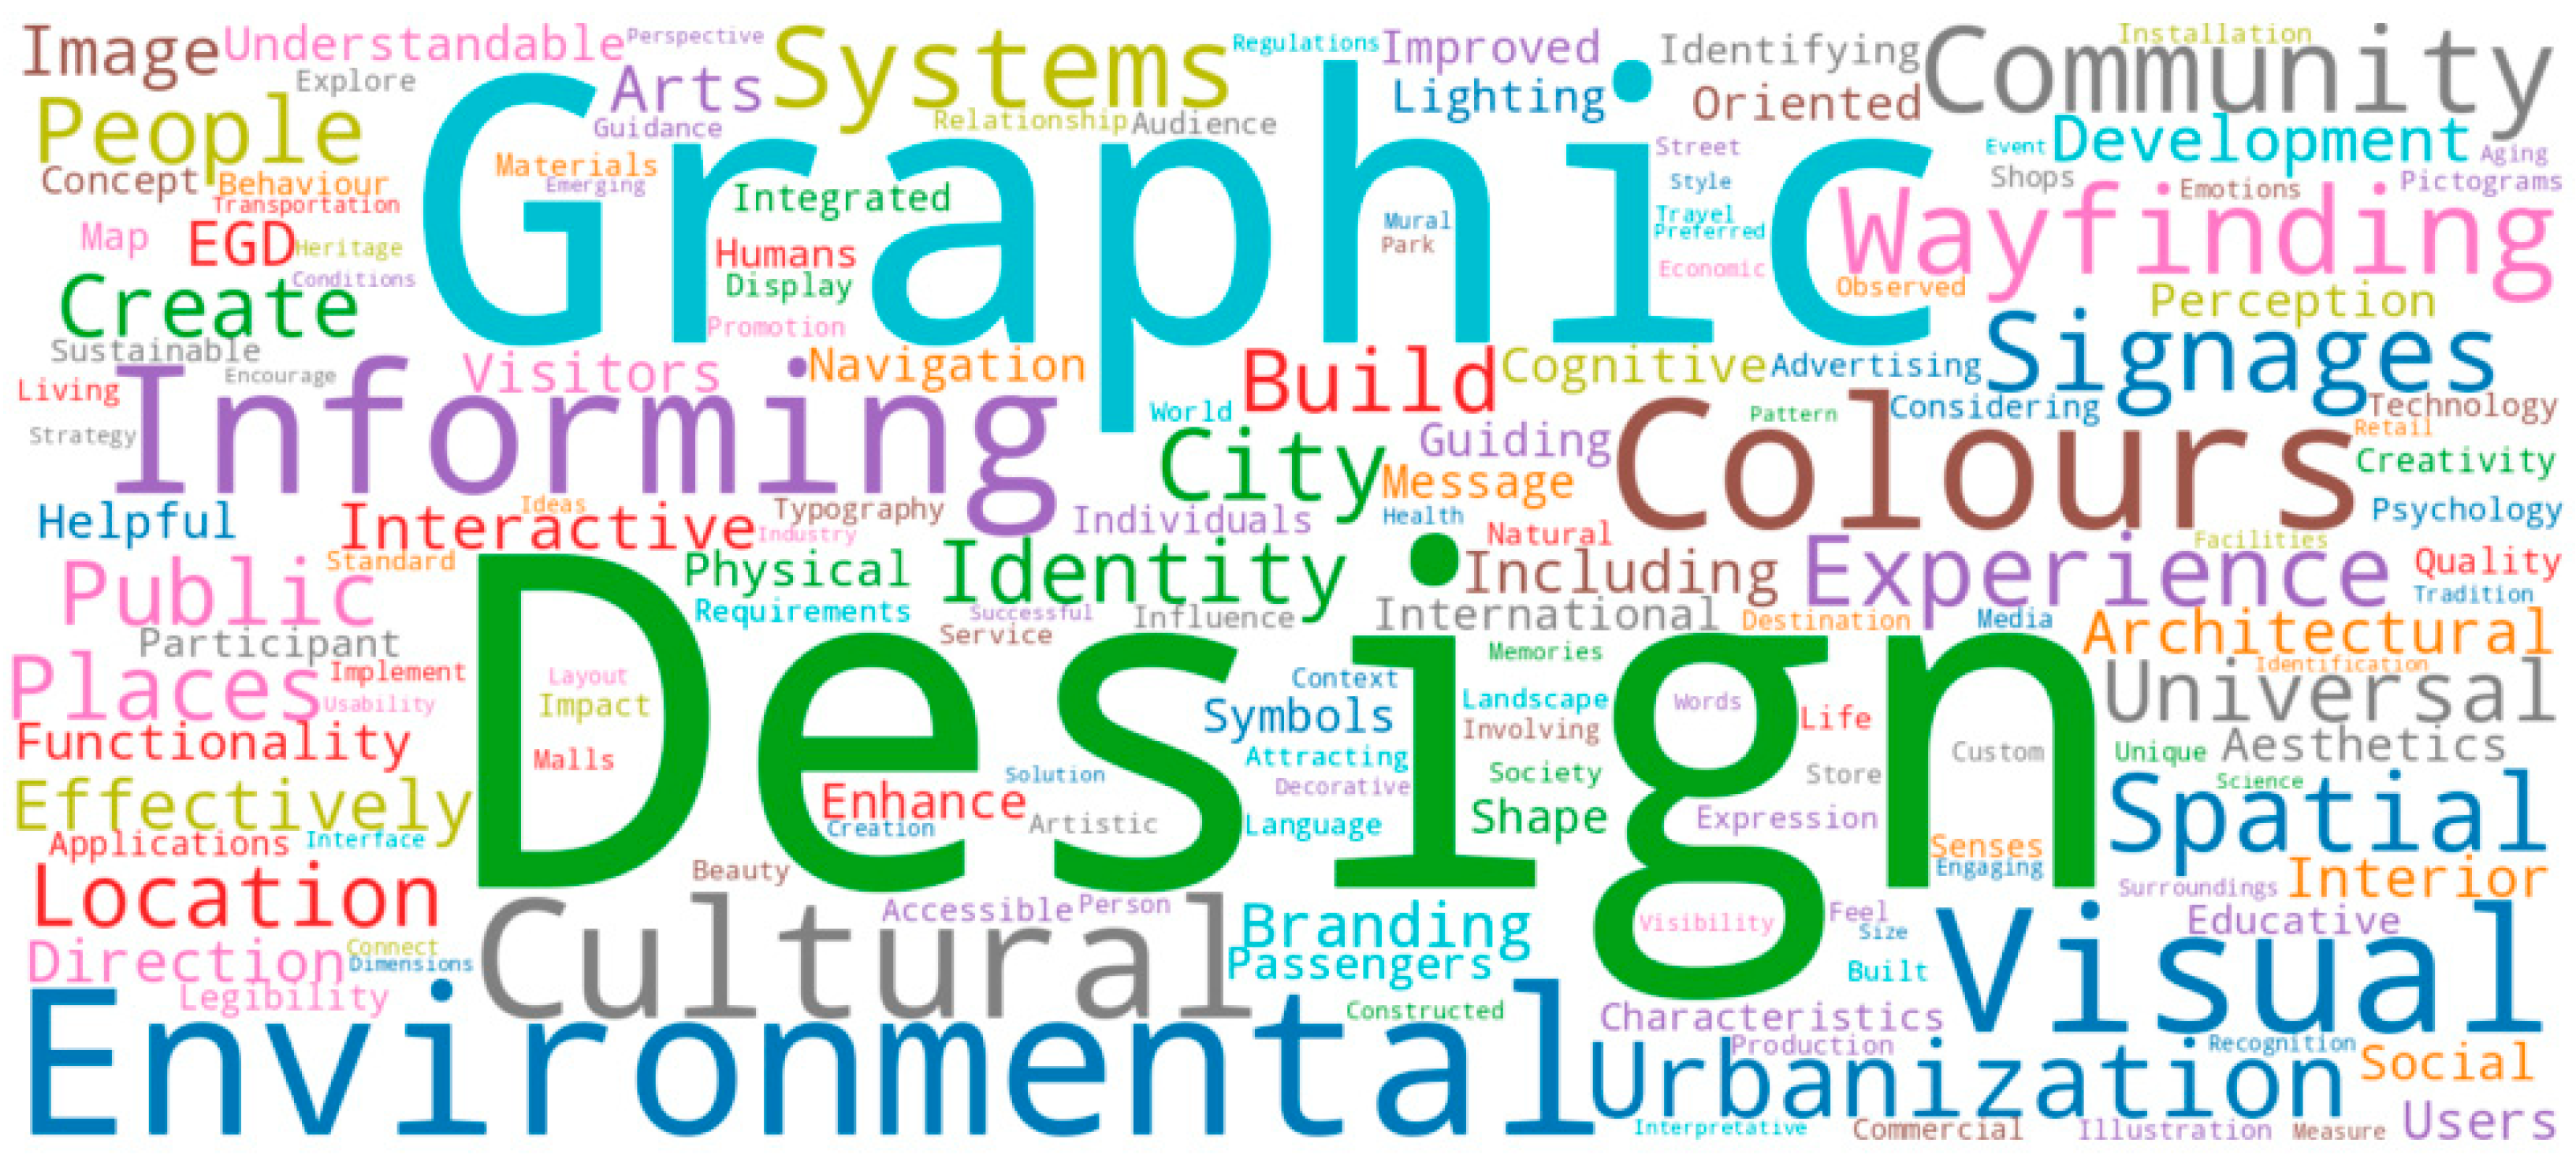
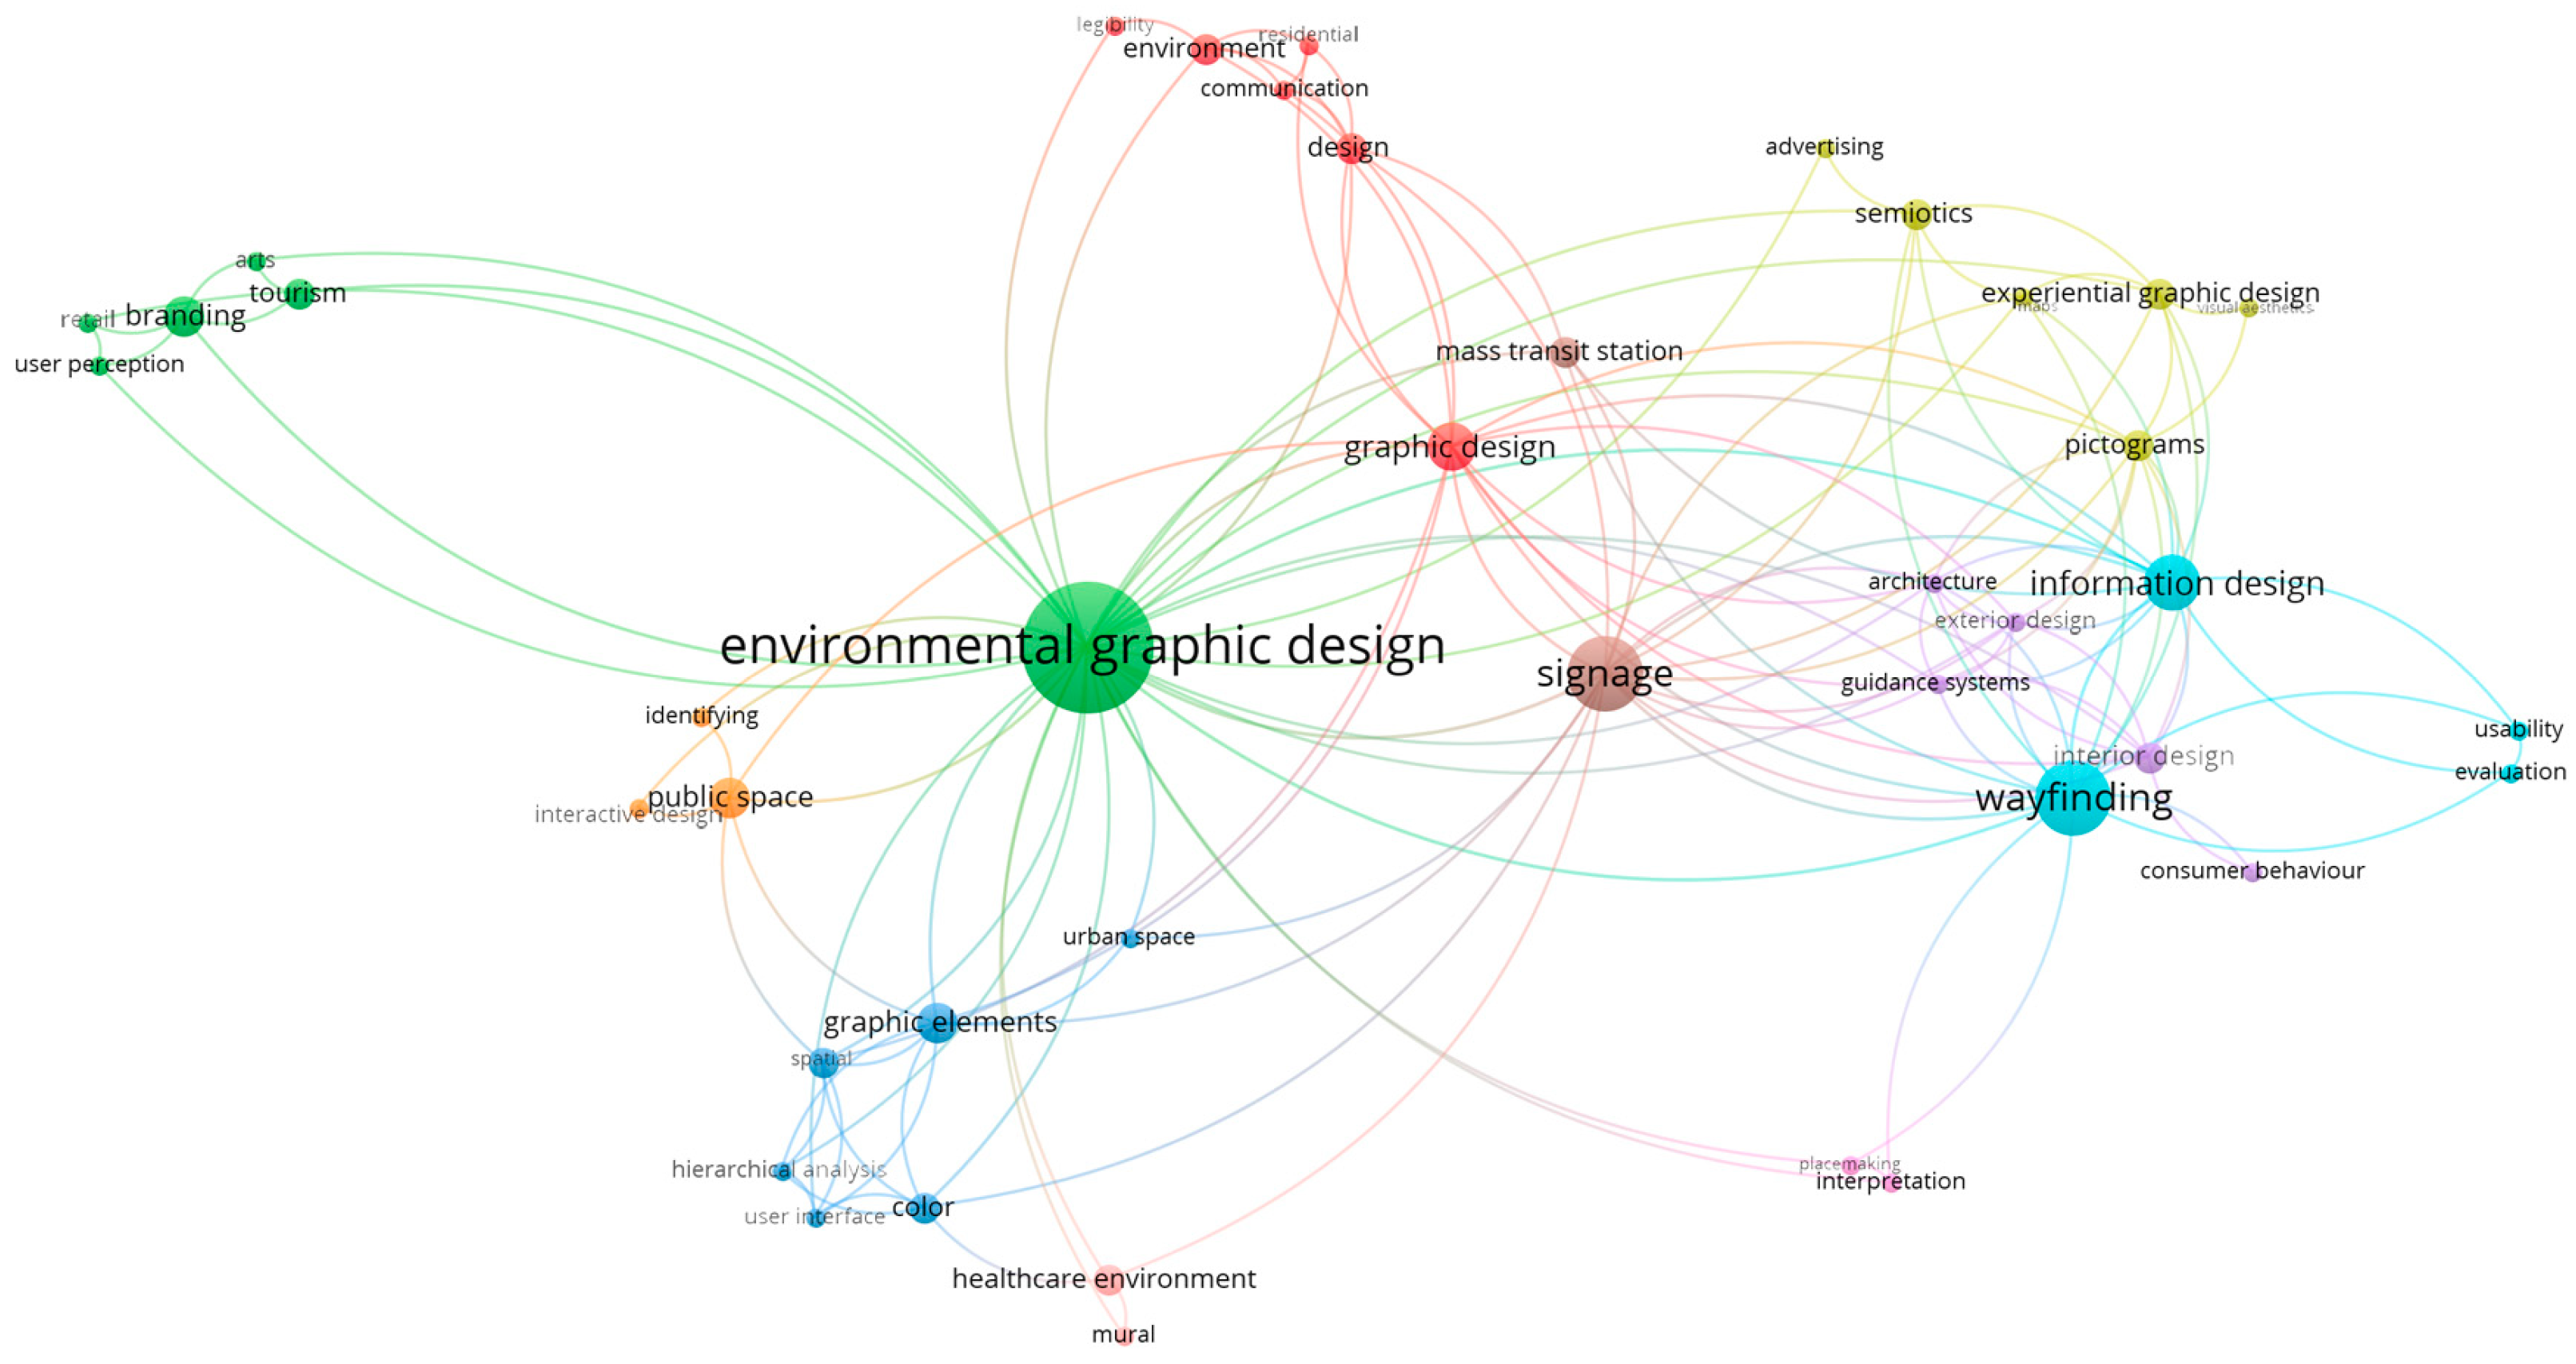
All bibliometric data were stored in Microsoft Excel spreadsheets (Microsoft 365, version 2410). This software played a crucial role in applying the exclusion criteria during the bibliometric identification phase and was helpful throughout the screening phases too, as well as in generating most of the graphs presented in this paper (Figures 2, 3 and 28). Word frequency visualizations were created using NVivo software (version 15) (Figures 5 and 27), while keyword visualization was generated with the open-source software VOSviewer (version 1.6.20) (Figure 6). Additionally, the illustrations depicting source fields were designed using the Canva graphic design web application (Figure 4), while the matrix chart was designed in Adobe Illustrator CS5 (Figure 7).

2.6. Results of Bibliometric Analyze

Through bibliometric analysis, it was determined that, out of the 28 publications selected for the review paper, 20 are original scientific articles, 7 are conference papers, and 1 is a book. These publications span from 2007 to 2025. To visually illustrate the growing interest in this topic, Figure 2 presents the number of publications per year, along with a polynomial trendline depicting the anticipated growth in publications in the coming years.
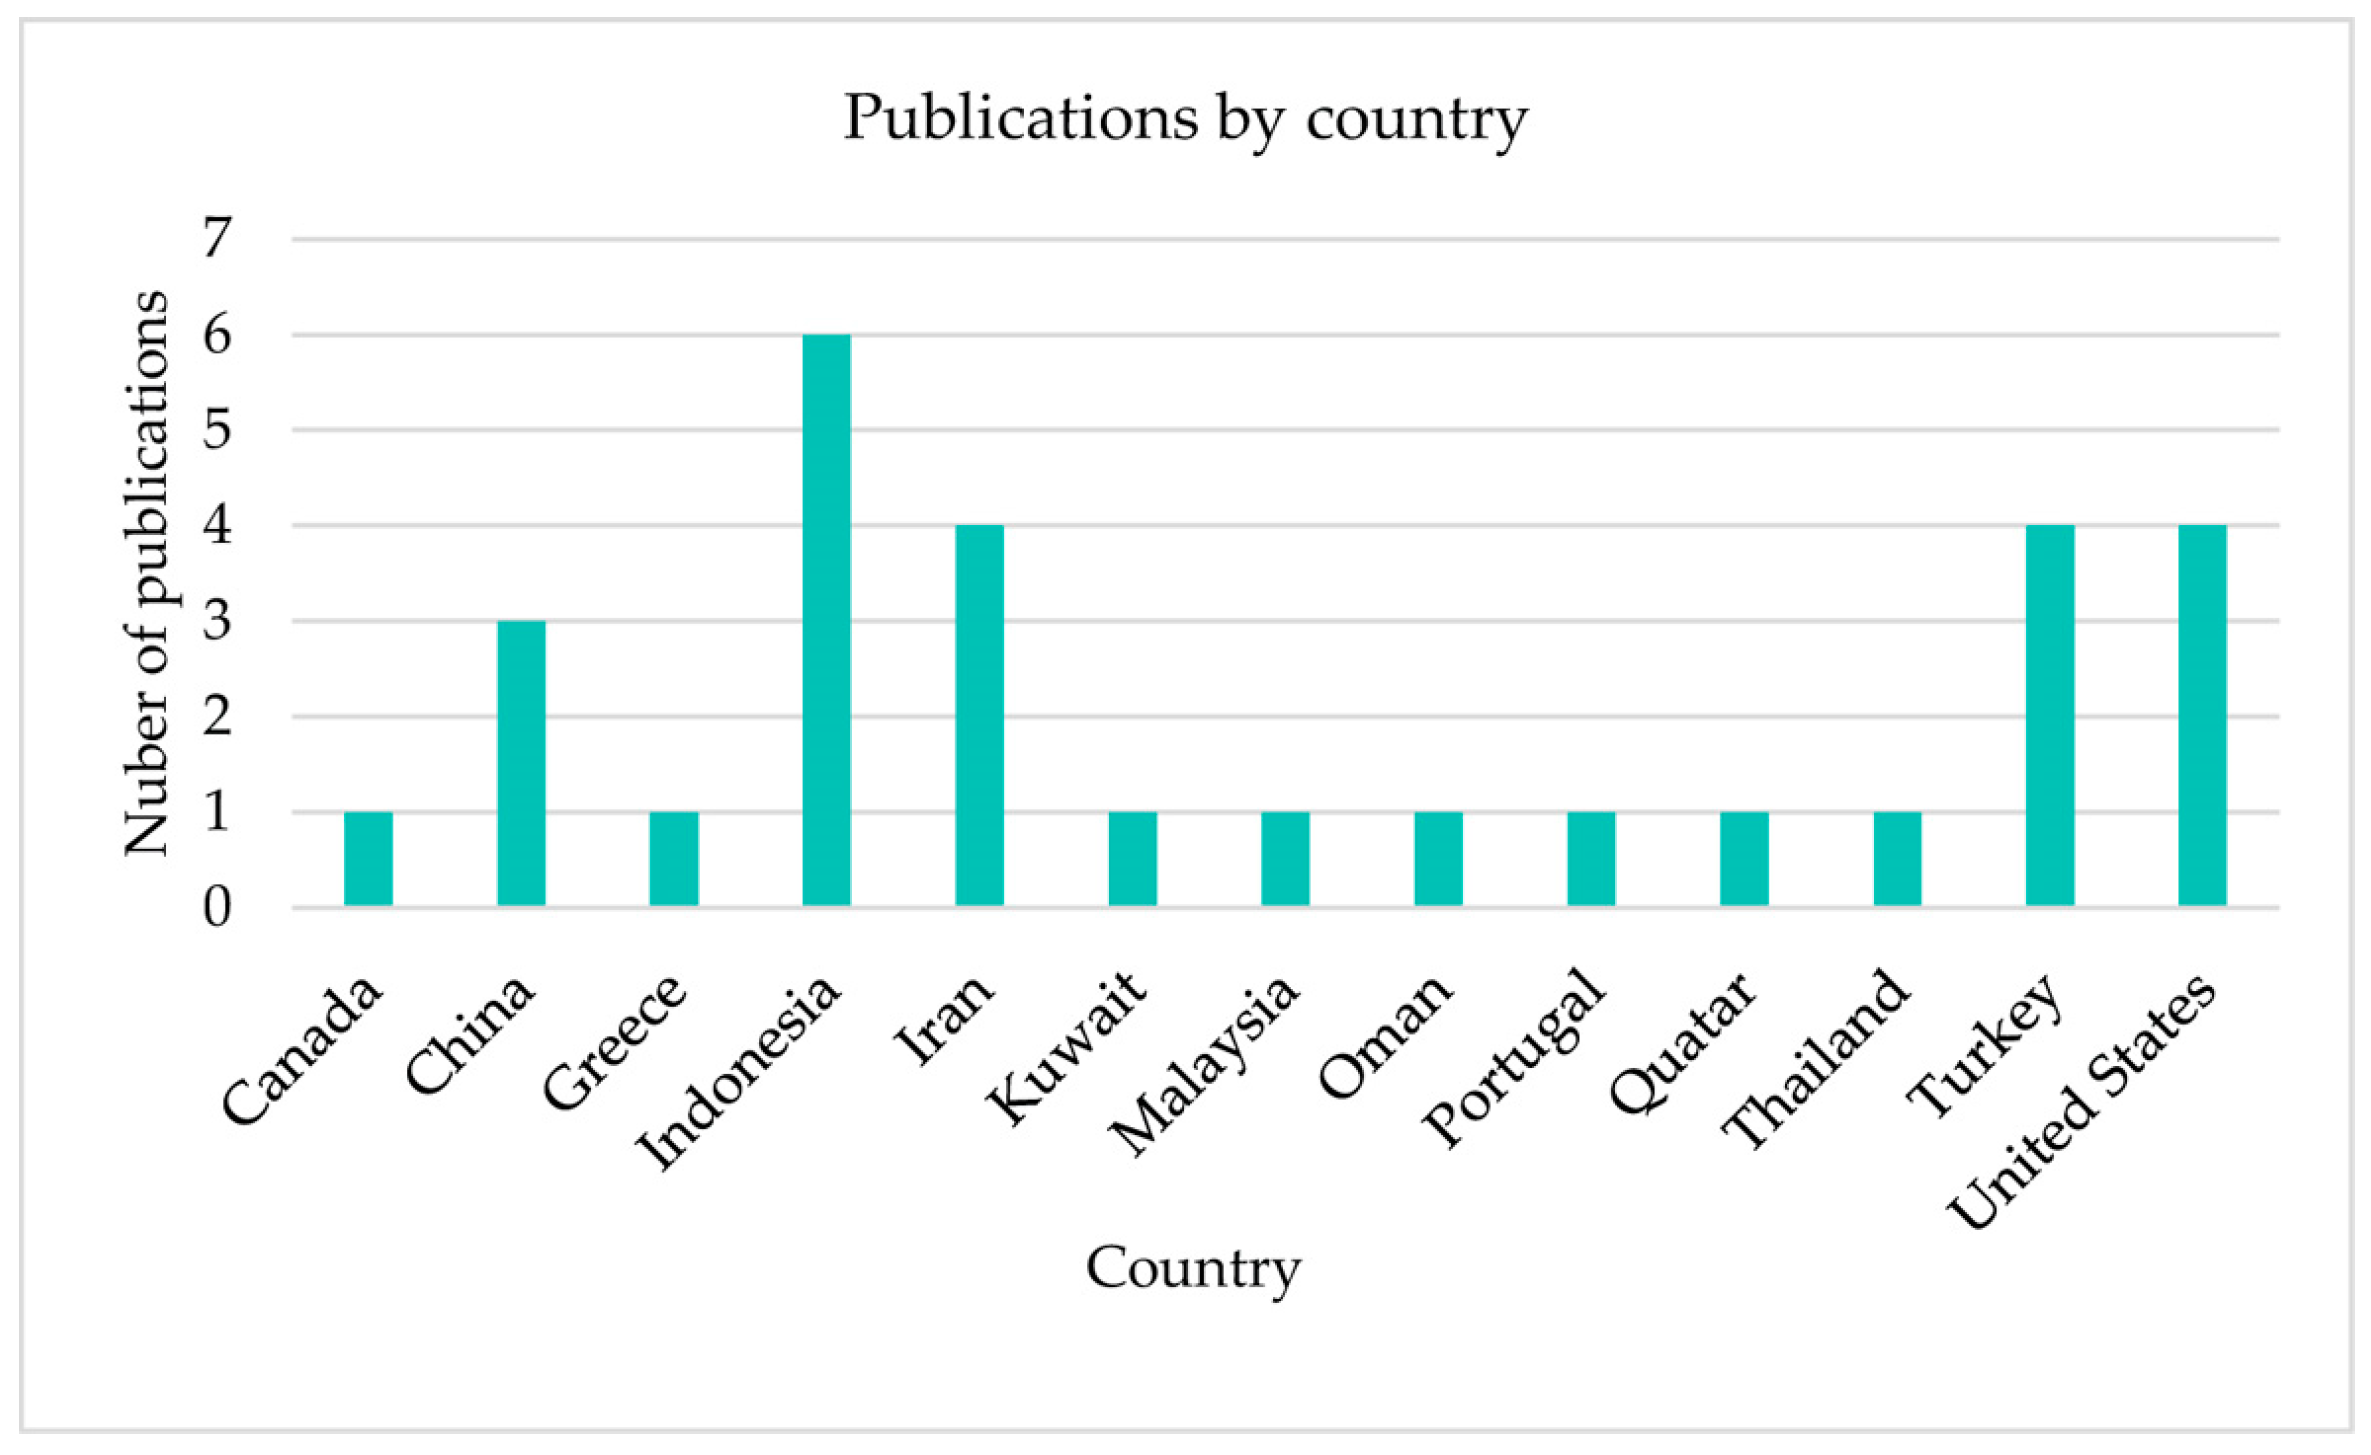
As shown in Figure 3, Indonesia leads in the number of publications, followed by Iran, Turkey, the United States, and China. Indonesia’s rapid urban growth in recent years has driven the demand for innovative and engaging design solutions, including experiential graphic design, for navigation, visual communication, and environmental awareness. Notably, all Indonesian publications were written within the past five years, in contrast to those from the United States, which are mostly older than five years. Considering that the United States remains one of the leading countries for driving innovation and trends in this field and shaping the global design landscape, its newer publications are likely to be more specialized, addressing specific issues within the experiential graphic design domain.
Figure 4 illustrates the source fields to which the included publications belong. As shown, the primary field is within the environmental domain, mainly general environmental sciences, although multidisciplinary engineering and art are also significantly represented. This highlights the multidisciplinary nature of experiential graphic design and underscores the need for collaboration among a diverse range of participants and experts from various fields to create functional, esthetically pleasing, and high-quality XGD products and systems.
A word cloud of the most frequently used terms in the selected publications, with the font size reflecting their weighted percentage, is presented in Figure 5. As anticipated, the most common terms are design (2.14%), graphic (1.26%), and environmental (0.89%), followed by colors (0.69%), informing (0.66%), and visual (0.61%). This word cloud enabled the authors to visually analyze and organize key concepts in the review paper, focus on the main themes, and identify gaps in the selected publications.
Additionally, Figure 6 highlights key research areas and interdependencies based on the main keywords used in the selected publications, offering valuable insights into emerging trends in existing scientific research articles on XGD. The size of each keyword circle corresponds to its occurrence in the publications. Together with the previous word frequency visualization, this visualization ensured that the authors covered all the essential information and identified missing elements in the selected publications to enhance their review paper with additional references focused on the key terms that were identified.
Building on the insights from the two previous visualizations, to systematically present the key findings from all the publications selected for this review paper, the authors decided to structure this paper into three thematic units: XGD in various application environments, the key roles of XGD and its advancement, and trends in and the future of XGD.

3. Experiential Graphic Design in Various Application Environments

3.1. XGD in Urban Spaces

The ongoing growth and diversification of urban environments, driven by capital flows and immigration, have underscored the importance of creating inclusive, navigable, and culturally sensitive public spaces. A number of studies have highlighted how experiential graphic design can contribute to achieving these goals in various urban contexts.
Atamaz (2014) [12] investigates how the integration of EGD in multicultural residential areas can foster a stronger sense of place and belonging. By shaping spatial identity and supporting emotional connections between people and their environments, EGD can aid in “healing” the communication gap between diverse urban populations and the spaces they inhabit, influence human behavior, and shape people’s actions, thoughts, and emotions. Building on this earlier work, Atamaz (2019) [30] later explored the role of visual elements, such as typography, illustrations, and pictograms, in alleviating urban isolation and enhancing orientation through placemaking and wayfinding strategies. His analysis of global examples highlights the value of a universal visual language in increasingly complex urban spaces. Similarly, Torbati (2018) [11] examines how EGD can enrich the identity of public spaces and facilitate community engagement. By aligning graphic interventions with spatial components and design principles, EGD becomes a tool for shaping and even redefining public space identities. This idea is reinforced by Ganoti and Laskari (2023) [14], who, through a literature review and case studies, demonstrate how EGD can contribute to a city’s humanization, economic advancement, a sense of safety, and communal pride, promoting inclusivity and place-based connection.
The role of EGD in mass transit systems is addressed by both Puttipakorn and Upala (2018) [31] and Utoyo and Thin (2023) [32]. While the former highlight how EGD supports passenger orientation and behavior in subways and other transit hubs, the latter offer a more critical perspective on signage system design. Utoyo and Thin argue that in rapidly growing urban environments, where the need for effective signage systems is becoming more important, relying solely on a systematic approach is common but not sufficient. They emphasize that signage design should go beyond basic functional requirements by including conceptual and esthetic elements, which are just as important for creating a meaningful and effective user experience [32].
Focusing on a recreational public park, Hananto et al. (2022) [33] conduct a design-based analysis of its existing graphic, informational, and hardware systems, including directional, regulatory, and orientation signage, as well as placemaking and interpretive signage. Their findings reveal inconsistencies in visual language, such as mismatched pictograms, color schemes, materials, and inadequate signage lighting, which undermine user orientation and overall esthetic cohesion. Their redesign proposal integrates geometric visual elements aligned with the park’s architecture while also considering the essential requirements of signage for outdoor environments and varying weather conditions.
Lastly, Talebzadeh and Nowghabi (2019) [34] examine the visual impact of commercial signage on the urban landscape, highlighting the vital role of urban design in shaping a city’s identity and expressing its cultural character. They position signage as a key element of urban design, capable of both enhancing and detracting from the visual coherence of the city. While poorly designed signage can disrupt the urban identity, well-executed signs can reflect a building’s character and convey the cultural identity of a city. In some cases, urban graphics may offer an efficient and cost-effective way to compensate for architectural flaws. They argue for coordinated design policies to ensure the proper placement and proportions of signs, as well as discussing the need for safety and cultural considerations, preventing visual pollution, and preserving the city’s identity.
These findings collectively underscore that XGD plays a pivotal role in enriching urban environments, not merely by improving orientation and function but also by embedding emotional depth and cultural sensitivity into public spaces. As urban landscapes become more complex, XGD offers a human-centered layer to the built environment.

3.2. XGD in a Healthcare Environment

The challenges of orientation, spatial coherence, and emotional stress in healthcare environments have led to increased interest in applying experiential graphic design to improve user experience and overall emotional well-being.
Aziz and Iskandar (2023) [26] examine EGD’s role in enhancing identity and information clarity within a pediatric clinic, highlighting challenges such as the inconsistent visual language across hospital departments and hospital branches, the lack of engaging spaces for children, and unreadable signage. Their descriptive analysis stresses the impact of design shortcomings on patient comfort and navigational ease.
Bubric et al. (2021) [35] present a user-centered evaluation methodology for hospital wayfinding systems, involving prototype testing to assess their effectiveness before full implementation. This proactive approach minimizes post-installation errors and can be adapted for various public environments beyond healthcare, reducing stress and improving spatial orientation. In line with this, Harper et al. (2019) [36] analyze wayfinding in large, multi-building hospital complexes, focusing on the integration of interactive interfaces, such as touchscreen kiosks. They argue that effective systems must harmonize with environmental graphics, and their success depends on user testing, appropriate placement, and alignment with the architectural context. The information provided by wayfinding kiosks or apps should work seamlessly with environmental graphics, including color coding, landmarks, room and elevator labels, and other signage.
In another noteworthy research paper related to medical institutions, Li et al. (2024) [37] explore how graphic design, especially the strategic use of color, can aid individuals with spatial or cognitive impairments to navigate more easily in elderly service centers. Their findings suggest that warm, high-contrast hues can enhance spatial recognition and emotional satisfaction, especially when combined with intuitive, low-saturation interfaces. Similarly, Dwiputri and Swasty (2019) [38] emphasize color coding as a key tool for wayfinding and spatial differentiation for visitors and patients in children’s hospitals. They showed how the thoughtful use of color not only clarifies building layout but also reduces anxiety in emotionally charged environments.
Together, these studies highlight the importance of user-orientated, visually coherent, and carefully crafted XGD solutions that respond to the emotional, cognitive, and navigational needs of patients, staff, and visitors, promoting comfort, clarity, and accessibility in healthcare environments.

3.3. XGD in an Educational Environment

Several recent studies highlight the significance of experiential graphic design in shaping educational environments, particularly in higher education.
Gbr and Soliman [39] (2023) propose integrating the principles of EGD with interactive interior design to create dynamic learning spaces that foster student engagement, exploration, and practical learning. Their guidelines aim to create environments that are not only functional and esthetic but also interactive and stimulating. Complementing this approach, Bigat (2024) [40] explores EGD from the perspective of information design, emphasizing the importance of EGD in everyday life through the implementation of guidance and marking systems. Primarily, this study investigates the role of typography in EGD across university campuses at the urban and spatial scale, using graphic design examples, in order to establish a sense of institutional identity by ensuring visual cohesion in color, forms, and font family. Similarly, Alansari (2022) [41] analyses wayfinding systems in educational institutions using an evidence-based design approach. His qualitative study identifies navigational challenges and proposes tailored signage strategies to enhance orientation and user experience in complex academic settings.
In a different context, Atamaz-Daut and Erdogan (2018) [42] present a case study focusing on a nursery environment, where a minimal graphic intervention transformed an indistinct corridor into a child-friendly, navigable space. The redesign, focused on spatial imagery, enhanced visual perception, spatial identity, and directional skills, illustrating how graphic design can effectively support architectural clarity and communication, especially for young users.
These contributions demonstrate how XGD, if thoughtfully applied across different educational contexts, can enhance functionality, communication, and the overall user experience by aligning visual elements with spatial, pedagogical, and learning goals.

3.4. XGD in Cultural and Tourism Spaces

In contemporary cultural and tourism spaces, there is a growing emphasis on creating meaningful and engaging visitor experiences. Experiential graphic design plays a key role in shaping these environments by enhancing spatial identity, supporting cultural narratives, and fostering emotional connections between people and places. Since the COVID-19 pandemic began, consumer perspectives of travel have shifted considerably. Today, people are more focused on the experience of the journey than on the attractions at their destination [43].
In an impactful scientific paper, Liu et al. (2023) [19] discuss the lack of cultural appeal and homogenized spatial expression methods in rural cultural tourism spaces. In order to improve this situation, this study illustrates the transformative power of EGD in revitalizing cultural heritage through thoughtful design interventions. Expanding on this theme, Zhang et al. (2024) [2], with their mixed-method approach, which includes the users’ subjective beauty evaluation (SBE) method, the analytic hierarchy process (AHP), and in-depth interviews with industry experts, identify six influencing factors of environmental graphic systems in rural cultural tourism spaces. In addition, the authors highlight that cultural identity, local traditions, and the natural environment play crucial roles in shaping effective design interventions. Setiawan and Khamadi (2024) [44] further advocate for integrating heritage elements, such as traditional carved motifs, into EGD to create a strong visual identity, strengthen the city’s unique brand, increase cultural awareness, and support local craftsmanship.
Emphasizing the importance of experiential graphic design, Wu (2024) [45] explores the integration of a digital user interface (UI) and graphic design to enhance visitor experience in museums. The author highlights how digital technologies can seamlessly blend with physical spaces to create engaging interactive spaces that redefine traditional museum experiences into dynamic and user-focused ones. Wu reminds designers to maintain brand consistency and cultural characteristics while integrating these elements into innovative design concepts. Emotional impact is a central focus for Zhang et al. (2024) [46], who investigate how EGD elements, such as spatial layout, lighting, design, and sound, can be strategically used to create an immersive atmosphere that connects visitors to the museum’s history, making the museum not just informative but impactful too.
With their user-centered approach, Calista et al. (2020) [47] provide a detailed and systematic description of the process of redesigning library signage systems to enhance functionality and reinforce the library’s institutional identity. Their work emphasizes the importance of prioritizing the needs and comfort of users when designing and making design decisions for EGD within large public spaces.
Lastly, Nestel (2019) [48] underscores the value of well-designed maps and signage in helping visitors understand and appreciate the cultural, historical, and natural significance of heritage sites. The author highlights the enriching potential of interactive technologies in XGD, such as audio tours, interactive displays, and augmented reality (AR). However, even in the absence of these features, well-designed and thoughtfully implemented static signage systems at archeological sites can enhance user experience, attract more visitors, and increase both visibility and funding, ultimately supporting long-term preservation efforts.
Together, these studies showcase how XGD can bridge tradition and innovation to deepen visitors’ cultural understanding while enhancing the quality of their experience. Whether through interactive technology or handcrafted elements, XGD proves instrumental in curating emotionally rich, memorable and inclusive experiences in cultural and tourism spaces.

3.5. XGD in Retail and Business Establishments

In retail and commercial settings, experiential graphic design is already recognized as a vital tool for enhancing user experience, strengthening brand visibility, and facilitating navigation. Several studies explore how strategically designed signage systems and interactive elements can shape customer perceptions and engagement.
Yauwerissa and Kusumowidagdo (2025) [49] demonstrate that, in shopping centers, the strategic placement of signage at key decision points significantly helps customers navigate from different angles and directions, while interactive elements such as digital screens or touchscreen displays make communication more engaging, offering real-time information and special promotions. Their findings also suggest that updating the EGD with seasonal changes can make the shopping environment feel fresh and inviting, showcasing the latest trends and themes to keep customers coming back. Complementing this, Roux (2020) [50] examines how customers engage with digital wayfinding screens. The study identifies four primary gratifications that users seek from digital wayfinding screens—convenience, interactive qualities, information, and entertaining content. This approach offers valuable insights into how such screens can be designed to meet user needs and preferences, thereby enhancing the effectiveness of wayfinding systems in retail environments.
Fontaine and Bradbury (2018) [51] address the challenges faced by small independent businesses while sharing their brand identities through signage. By analyzing both good and bad examples of business signs and community design regulations, the authors call for more supportive community design policies and regulations to ensure visibility and increase the creative expression of small businesses. This study emphasizes that a well-planned and implemented graphic identity is crucial for small, independent businesses to convey a vibrant, alternative message, distinguishing them from franchise-heavy commercial districts and malls.
Cumulatively, these studies illustrate the strategic impact of XGD in commercial settings, enabling intuitive navigation, reinforcing brand character, and fostering customer loyalty. From immersive displays to subtle signage, XGD is the main tool for shaping retail experiences and supporting brand differentiation in diverse commercial landscapes.

4. Key Roles of Experiential Graphic Design

As demonstrated in the previous chapter of this paper, XGD enables the graphic communication of information across various built and natural environments, such as hospitals, universities, schools, residential areas, recreational parks, tourist sites, transportation systems, museums, libraries, shopping malls, and different business establishments. To enable the effective graphic communication of information in these physical spaces, the market offers a wide range of XGD products, with new options emerging every day.
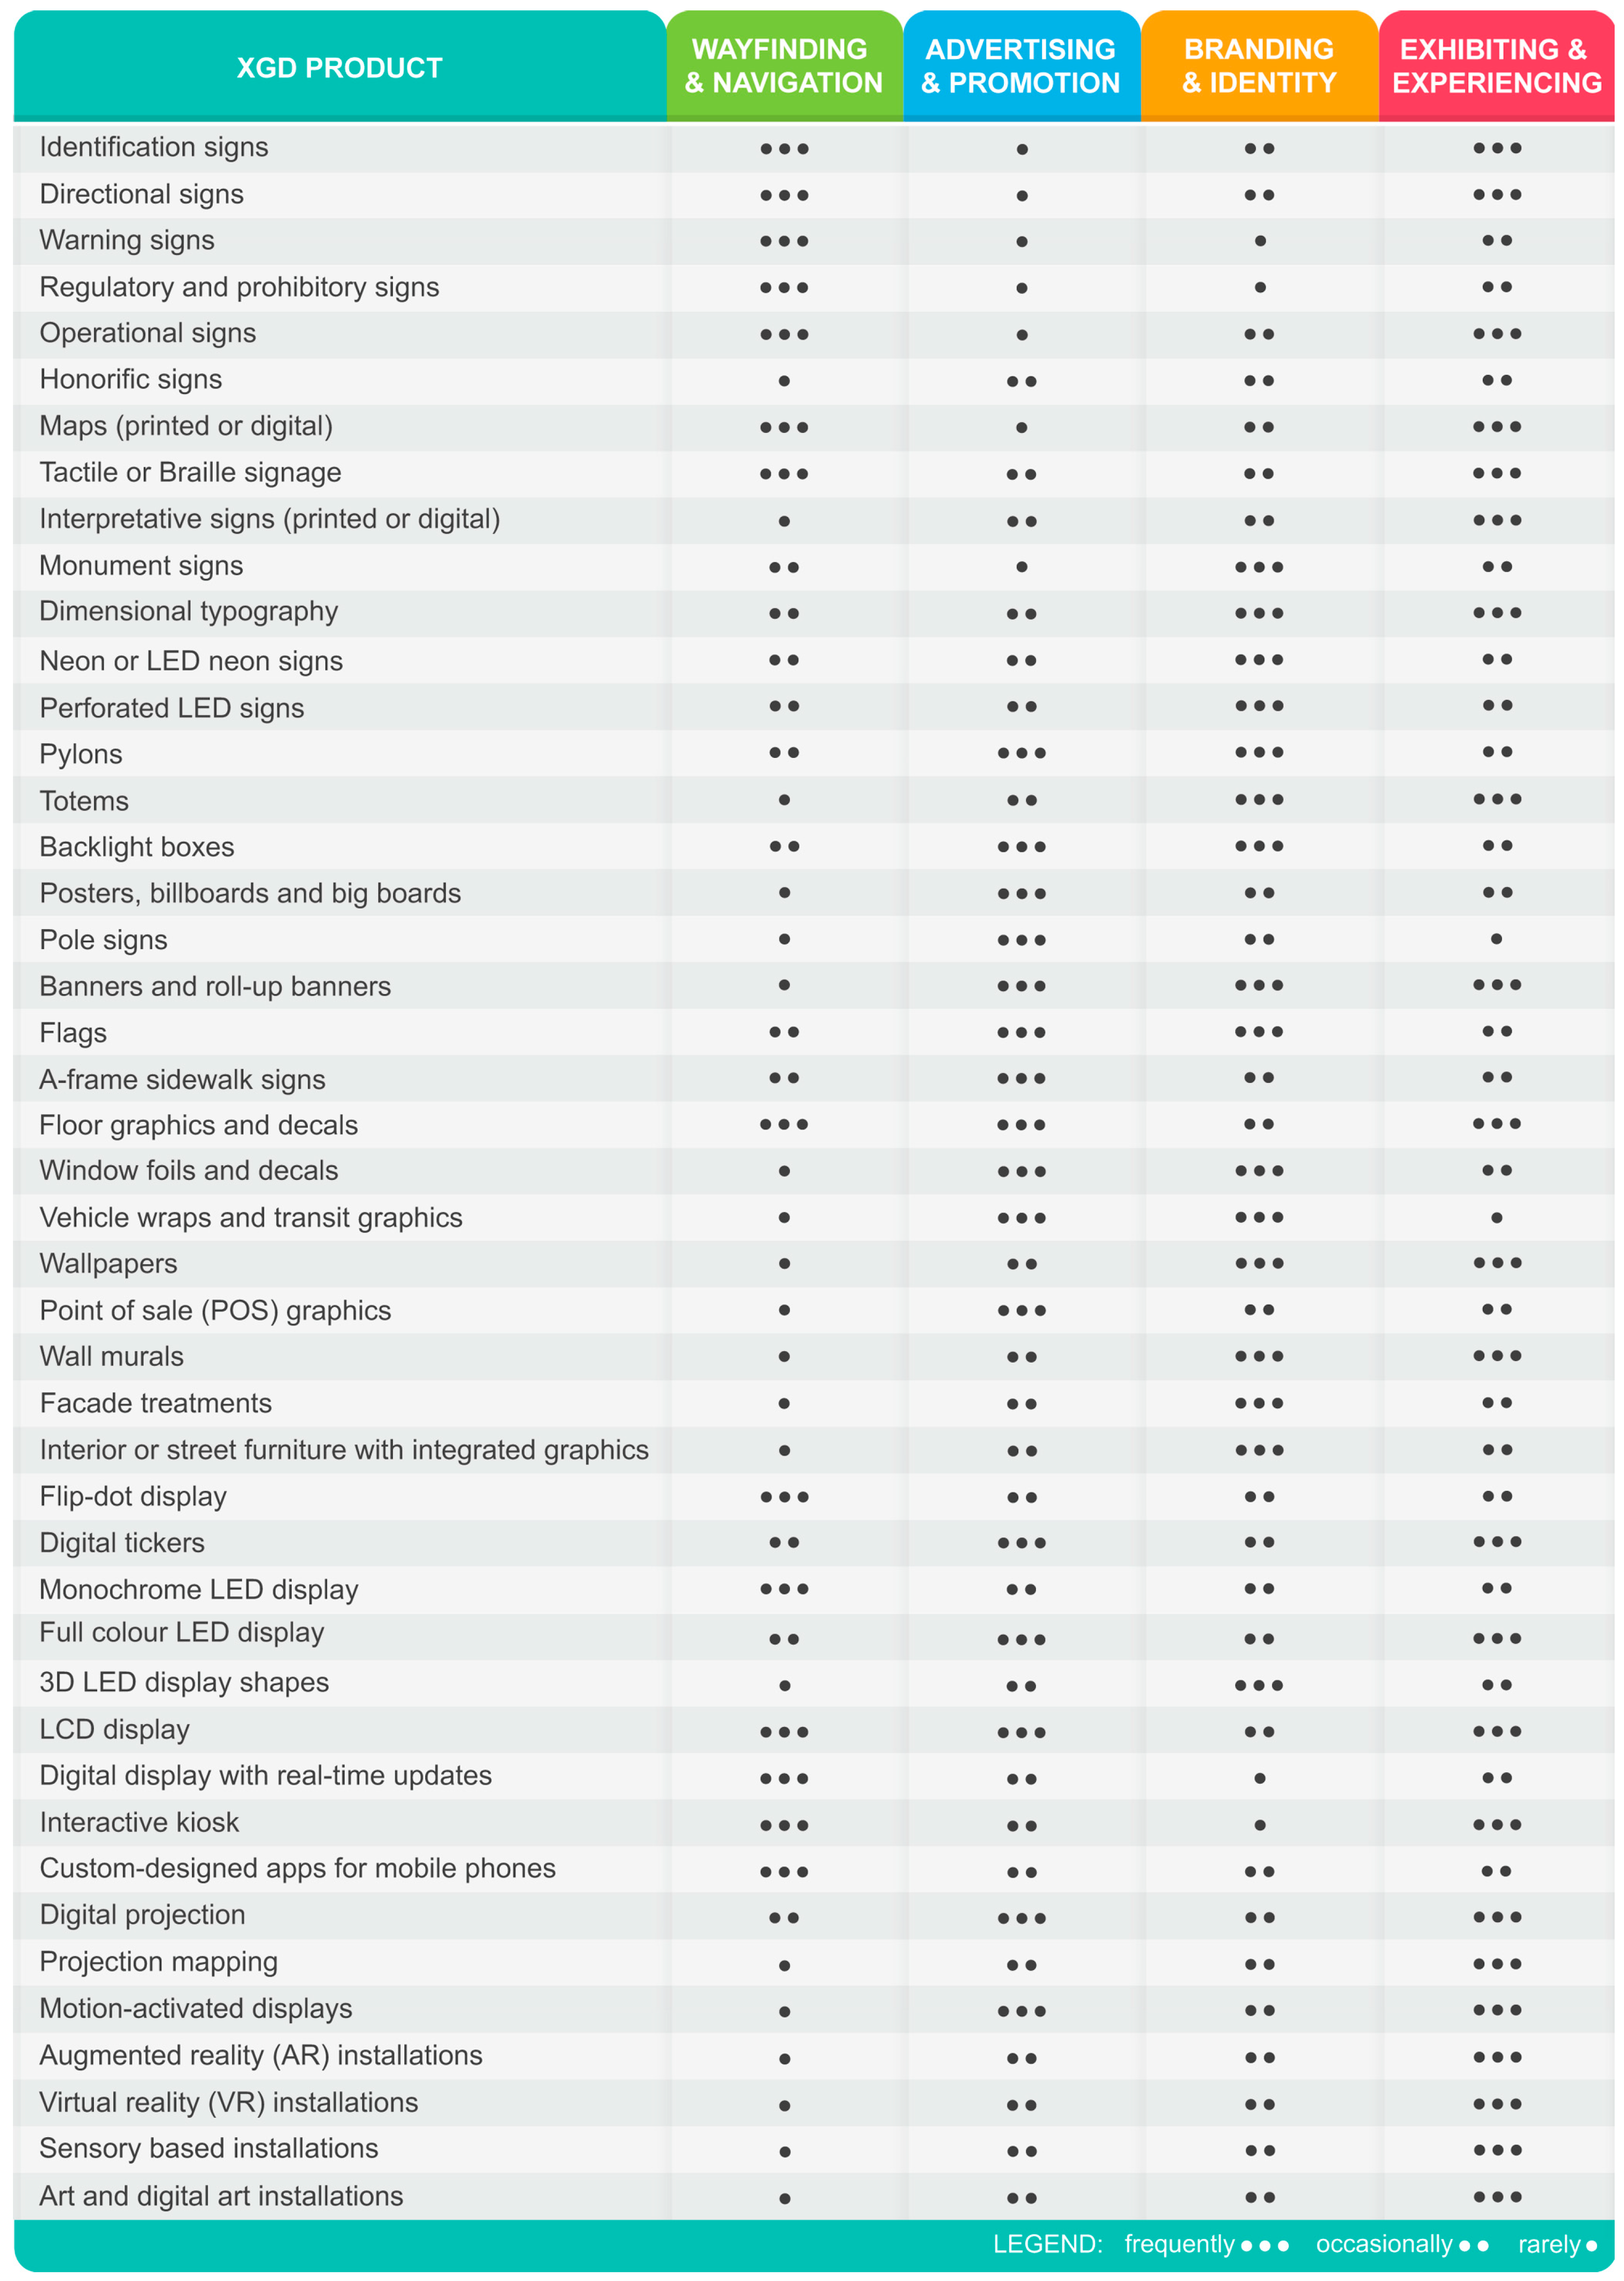
The purpose of these products can be categorized into four main areas: wayfinding and navigation, advertising and promotion, branding and identity, and exhibiting and experiencing. XGD products for wayfinding and navigation are designed to help people orient themselves and move efficiently through a space. XGD products with visual elements that are used to attract attention and communicate marketing messages have an advertising and promotion purpose. When the purpose is to enhance branding and identity, the XGD product should have design elements that reinforce a brand’s presence and values within a space. XGD products and installations designed to create immersive and engaging environments, enhance storytelling, provide education, or enrich user experience can be classified into the last category: exhibiting and experiencing. The matrix chart (Figure 7) presents a comprehensive list of XGD products, illustrating their usage frequency across these four purpose categories. No matter how many different XGD products are used, each XGD product can have one or more roles—to inform, to inspire, and to integrate people into physical spaces. Depending on the XGD project’s key role, designers use different approaches, design principles, or strategies for project realization.

4.1. Informing People in Physical Spaces

When the main role of experiential graphic design is to inform people in physical spaces, whether indoors or outdoors, it is necessary to combine several different approaches to conceptualize and organize the communication of information in physical spaces. The goal is to help people navigate, understand, and connect with physical spaces through visual and sometimes interactive elements [2,14]. In order to achieve this, designers should prioritize wayfinding approaches, contextual approaches, and, if necessary, an interactive approach. This means that the information on signage, maps, directional signs, and other wayfinding elements must be clear, quick to read, and intuitive [31,52,53]. Designers should also think about the environment in which the XGD product will be placed, because the design of the information must resonate with the surroundings and people’s behavior in that space [47,49]. For example, in a hospital, the design should be soothing and calm to reduce stress, while in a museum it can be more exploratory and engaging to enhance the learning experience [35,46,53,54]. For projects where the amount of information is very large, or where certain information is constantly changing and its updatability is extremely important, it is necessary to include XGD products that encourage interaction and provide information dynamically; for example, digital displays or interactive kiosks in airports, mass transit stations, or even shopping malls [4,14,36,49].
To ensure information is clear, engaging, and accessible to all users, there are certain design principles that should be considered—typeface legibility, symbols, the clarity of maps and infographics, the thoughtful use of color and color contrast, the logical layout and hierarchy of information, visibility, and consistency.
Most of the informational content of XGD products is conveyed by words [1]. Therefore, the first design principle that needs to be considered is related to typography—the suitability, longevity, and legibility of the typeface, factors that are highly interrelated. When choosing typefaces for informational XGD products, designers should have longevity in mind because trendy typefaces often quickly become dated, and informational XGD products are usually not temporary objects. Although every project is different, sans serif typefaces are generally better suited for use in informational XGD products. Additionally, title case treatment of the words is more legible than all-uppercase or all-lowercase treatment, along with the use of normal or slightly open (positive) letterspacing throughout a word. Legibility must always be prioritized, and information transfer should never be compromised due to esthetic concerns (Figure 8) [1,40,53,55].
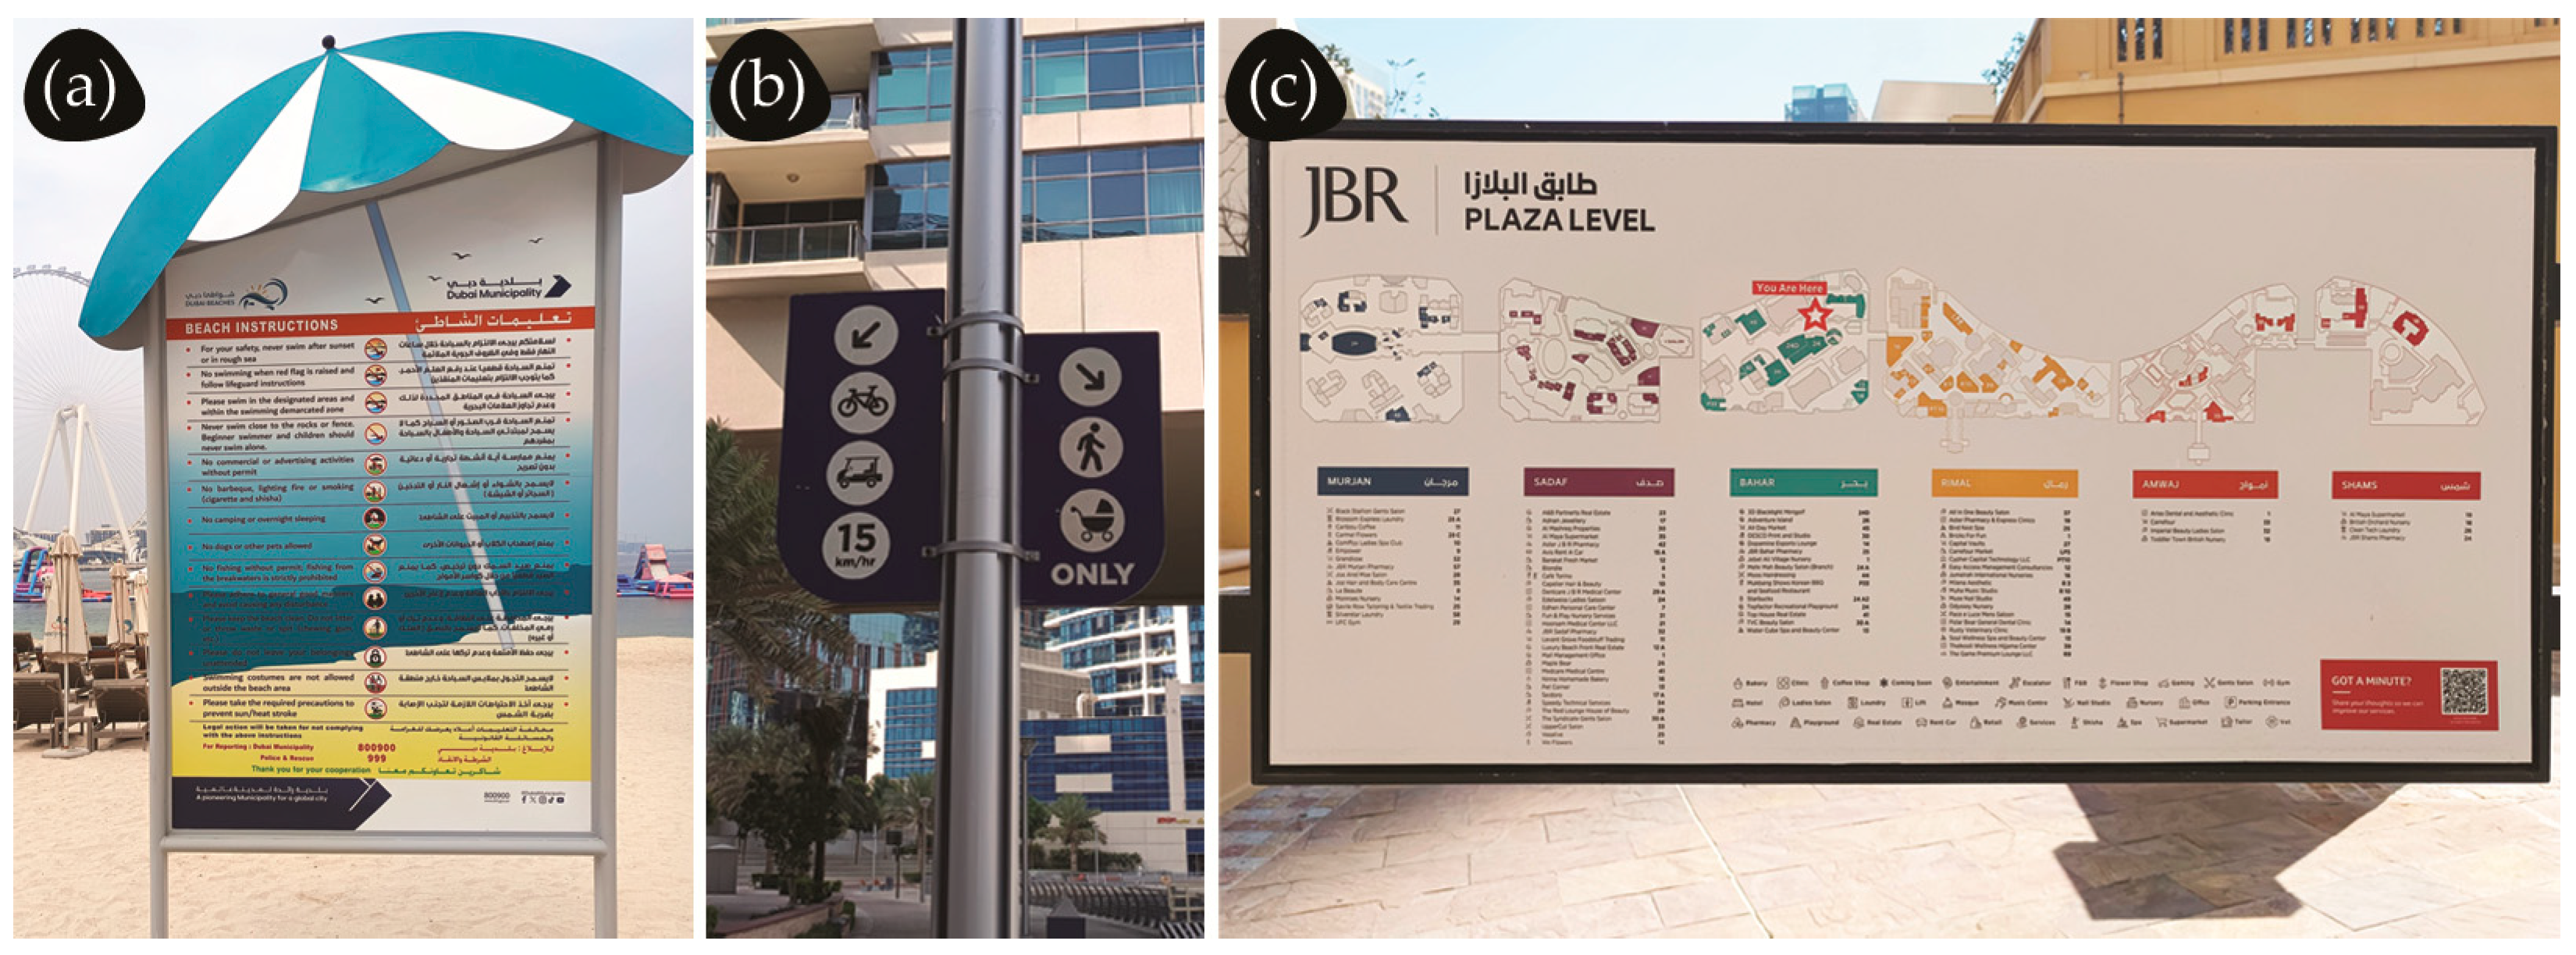
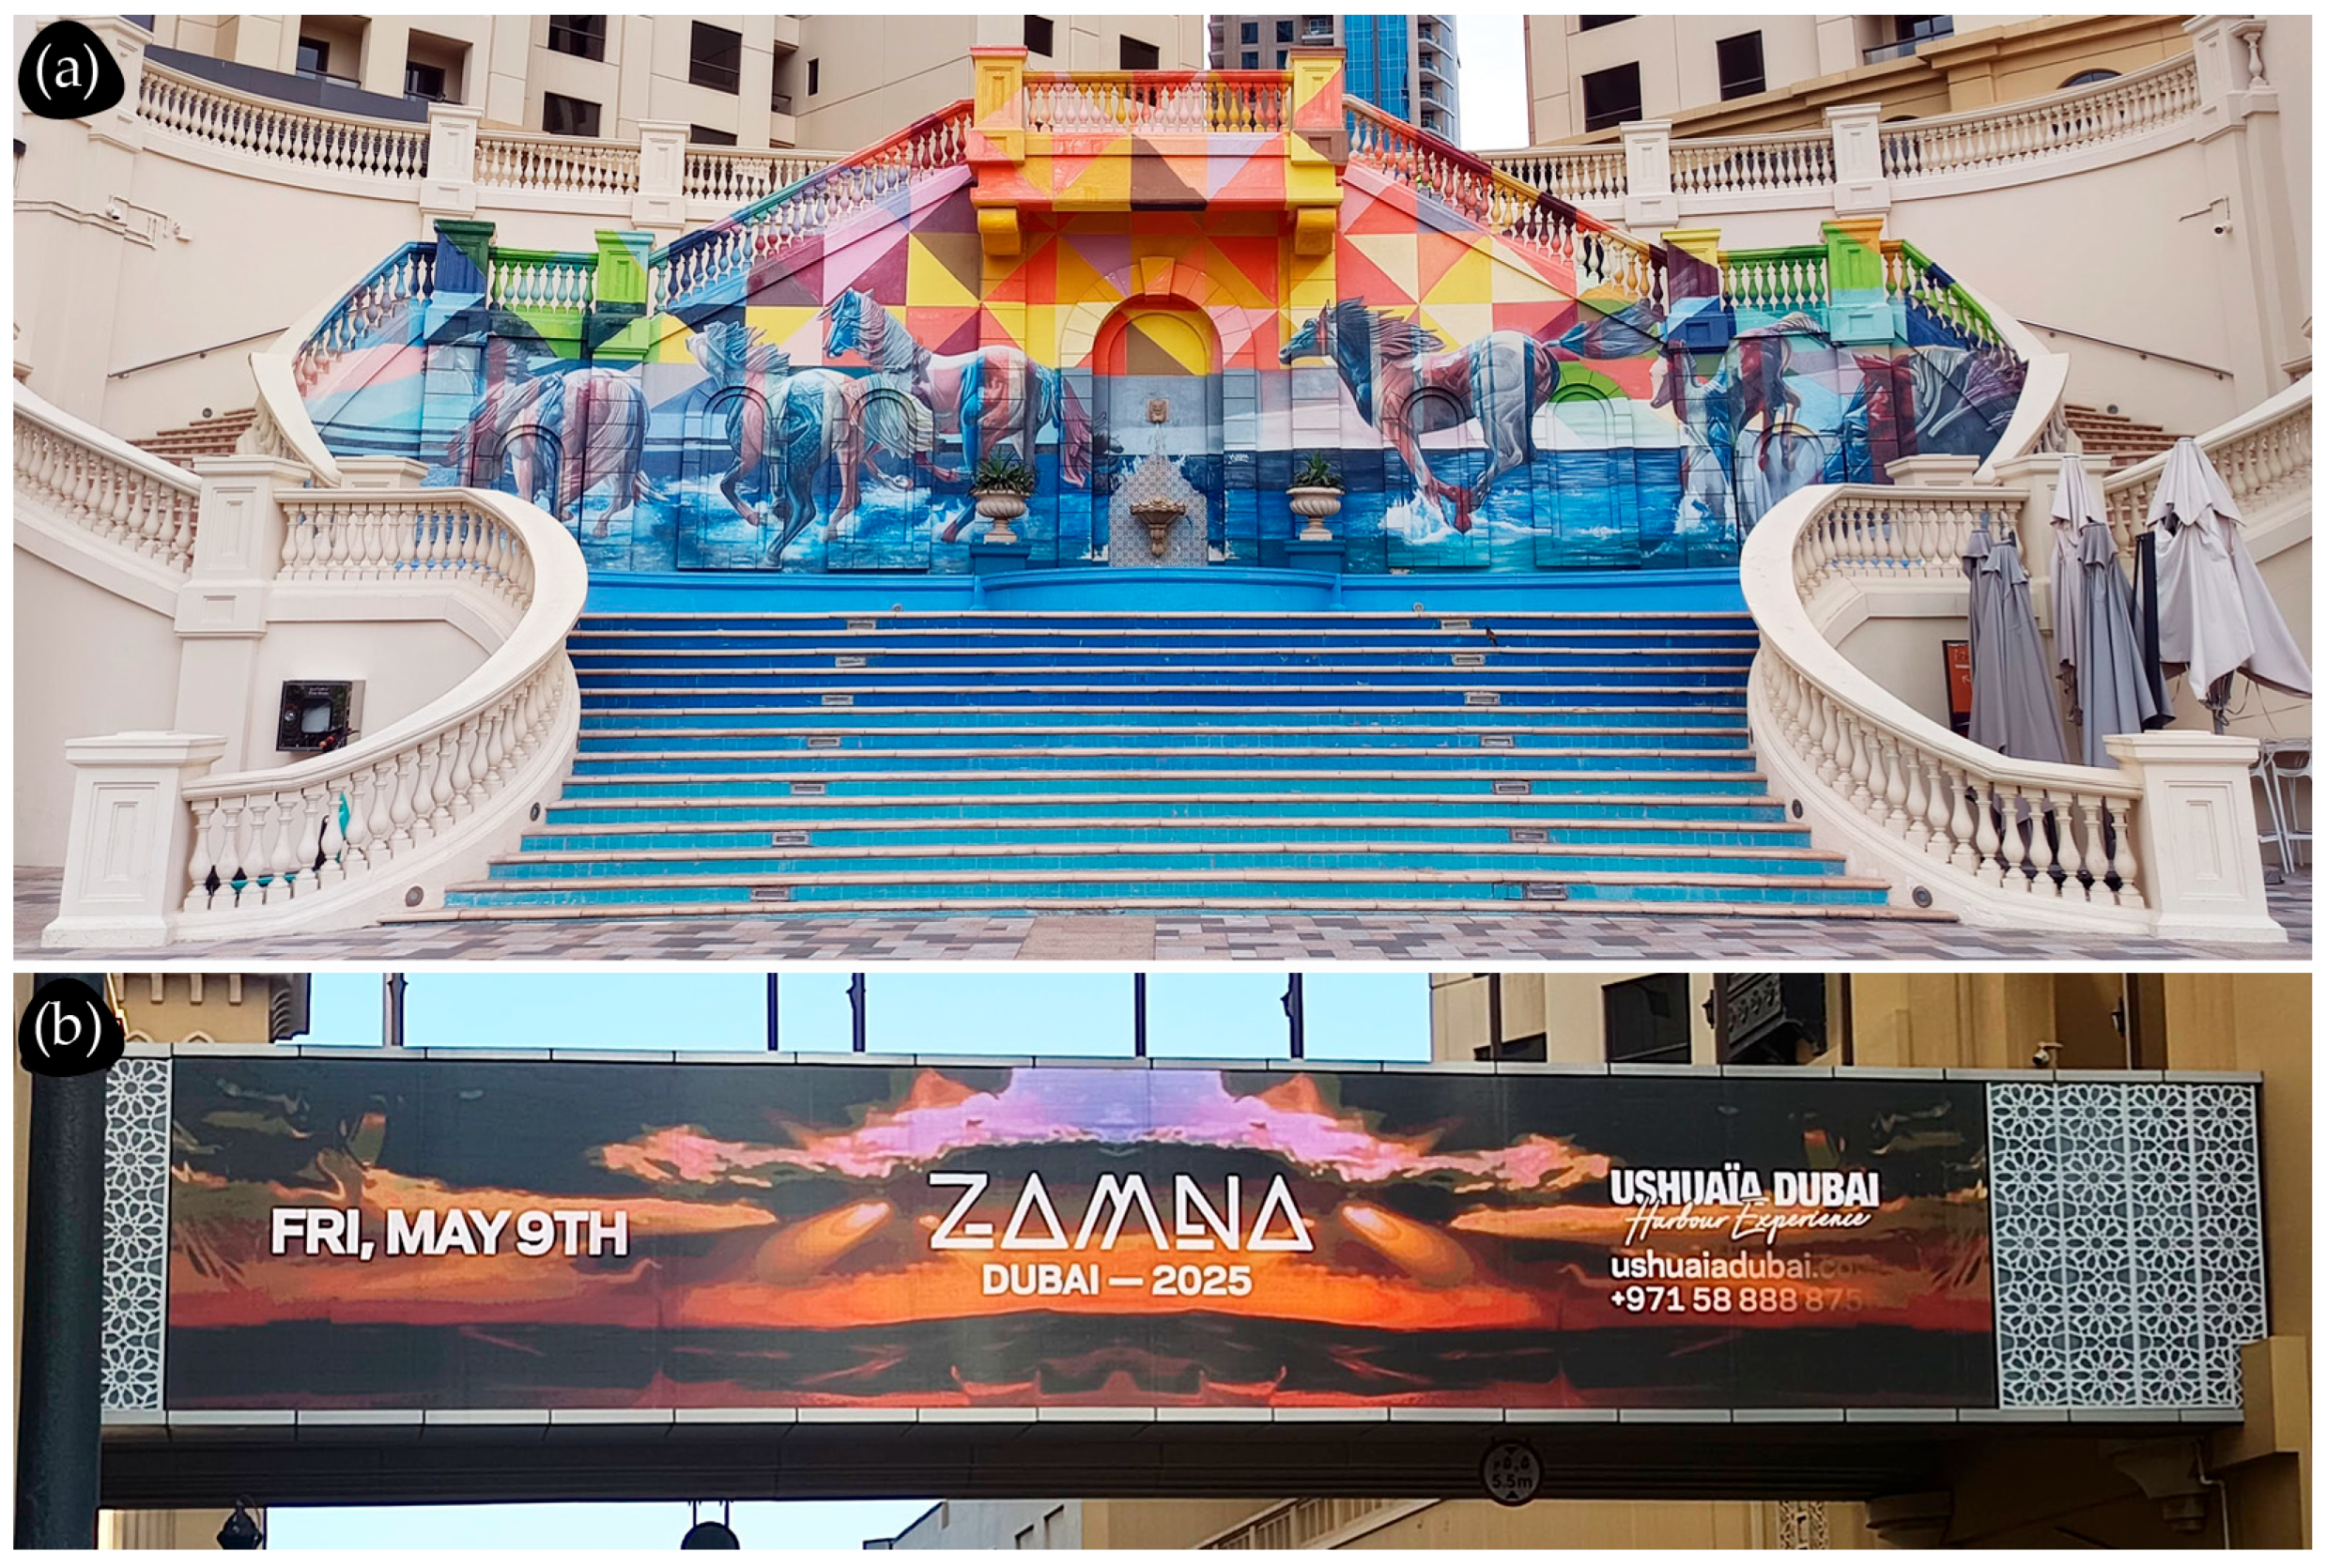
Sometimes, in XGD products, words can be replaced or supplemented (Figure 9a,b) by symbols or pictograms. This can be very useful in multilingual environments to reduce the need for multiple languages or to replace long verbal directions, for example, with just one arrow (Figure 9b). The symbols and pictograms must be easily understood by the users, universal, and recognizable, and tested among users of different ages, cultures, and education levels to avoid misinterpretation [1,40,53,56,57]. Maps and infographics should be custom-designed or customized to be stylistically uniform with other informational elements of the XGD project (Figure 9). On maps, for easier navigation and to better present the information, a clear orientation is very important. Most often, the best orientation is forward-up, where the top of the map is orientated in the direction the user is facing (Figure 9c) [1,58].
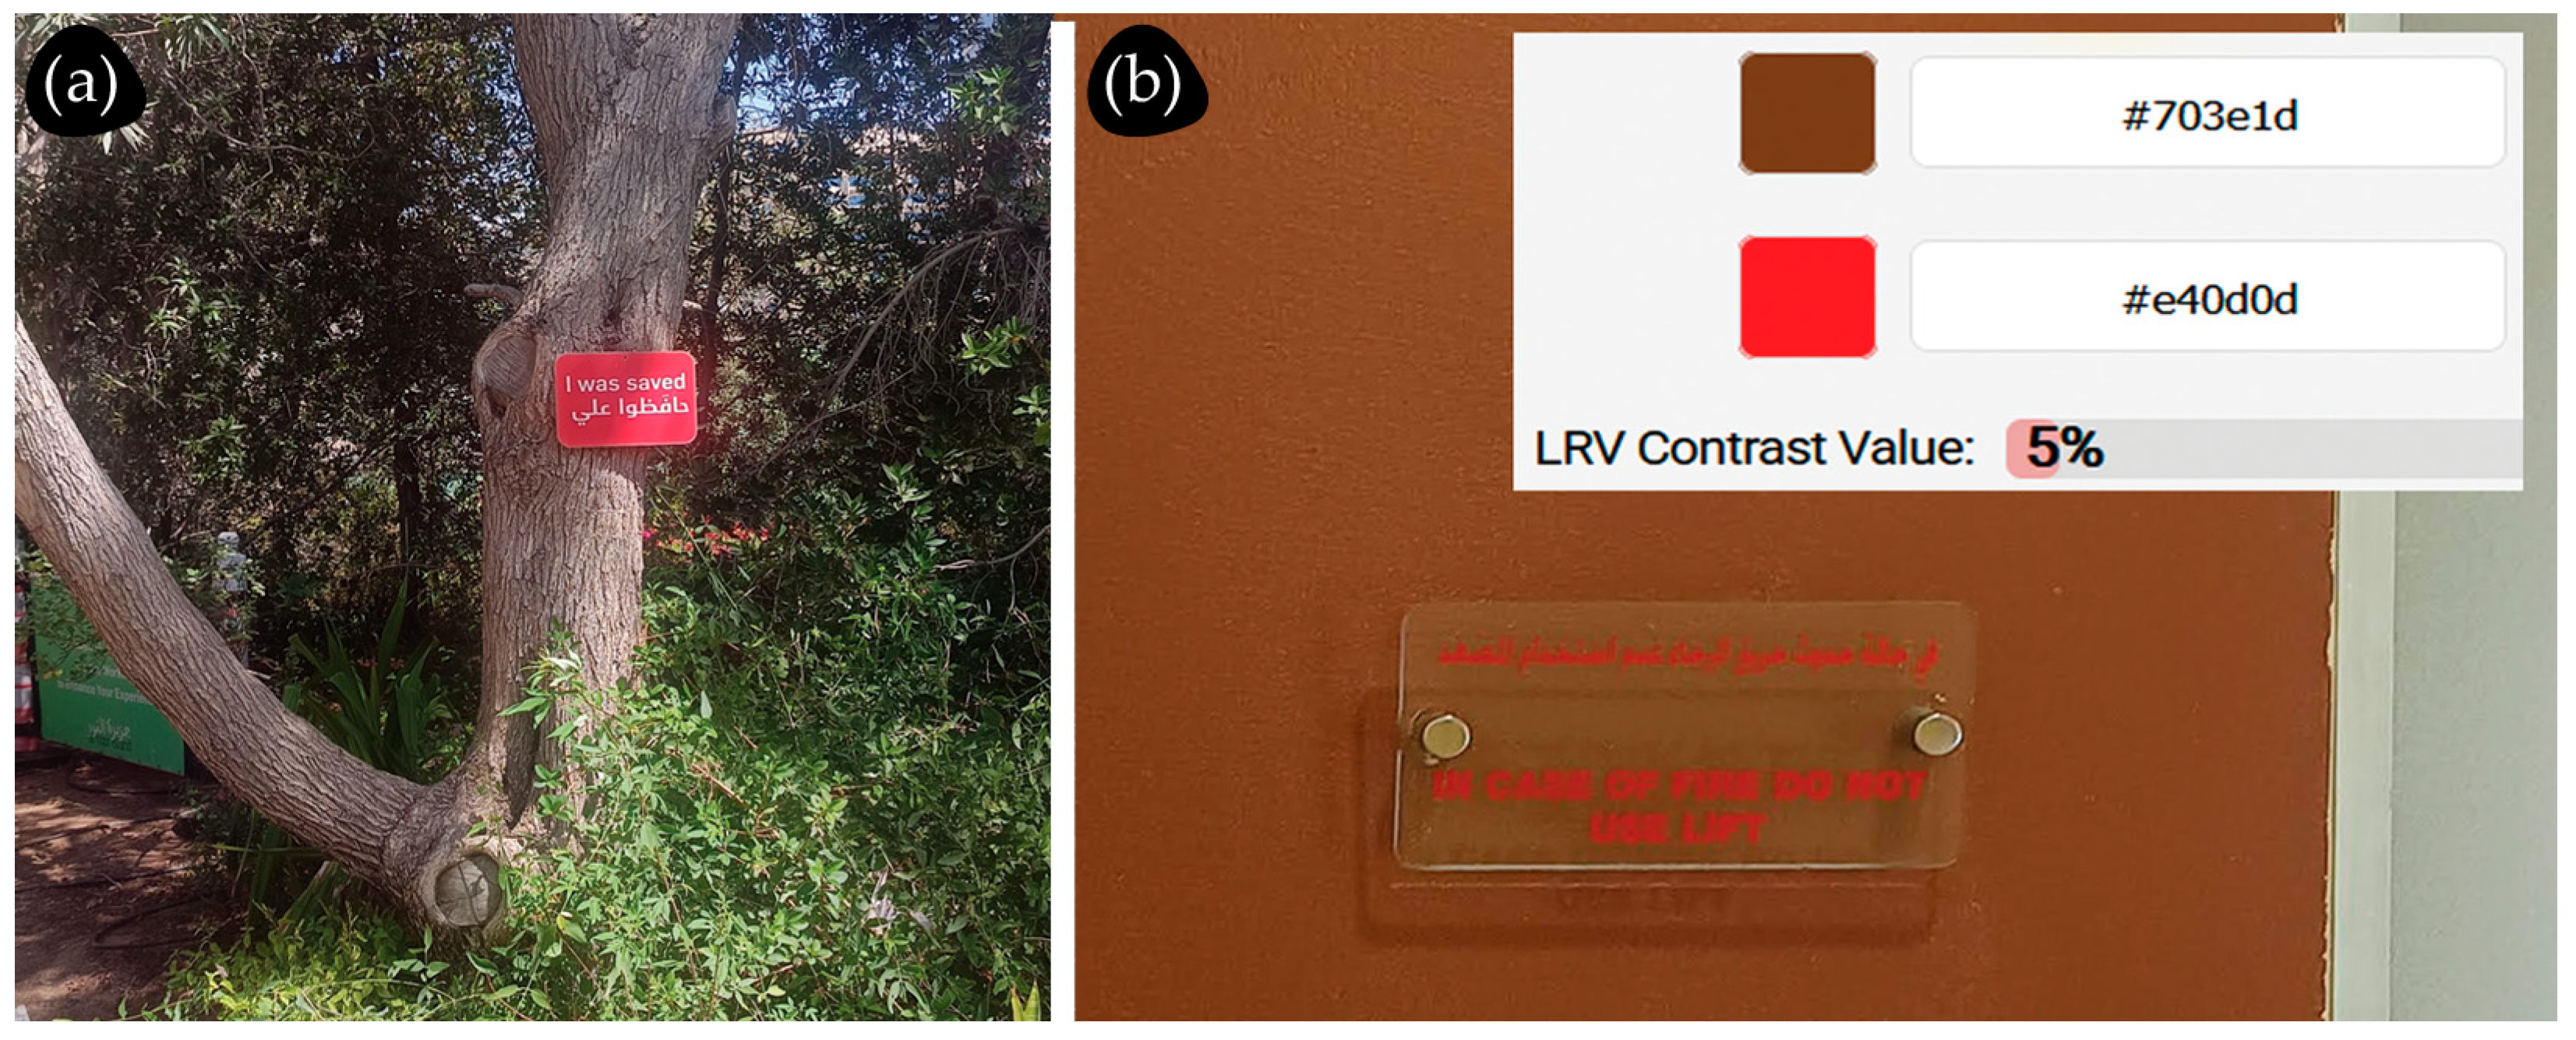
Color can play a major role in easier, faster, and more accurate information transfer and successful navigation through an environment (Figure 9c). With the thoughtful use of color, XGD products can stand out or blend in with the environment, depending on what is needed. The use of color can reinforce the meaning of messages or make it easier to distinguish the messages from one another [1,38,41,59]. For example, some colors have established meanings, like the color red, which is usually associated with emergency and warning [38,53]. The example in Figure 10a demonstrates an ineffective use of the color red and an ineffective form for the sign, which fail to align with the content it conveys. When choosing the colors of the background and foreground elements of an XGD product, it is also necessary to consider the color contrast to ensure the clarity and visibility of the information (Figure 10b). In order to make the XGD product visually striking and functional, the color contrast, or more precisely, the light reflectance value contrast (LRV), should be around 70%. Today, there are many websites with free LRV calculators, as well as various color contrast checkers [38,53,60].
For successful information hierarchy, information should be listed according to the degree of importance and emphasized using colors, different typefaces or symbol sizes, and typeface treatments (Figure 11). In addition, the amount of information determines the final size and proportion of the XGD products, but a logical layout prioritizes information and guides the viewer’s eye in a logical order through the use of size, spacing, color, typography, and symbol alignment [1,47,53,61].
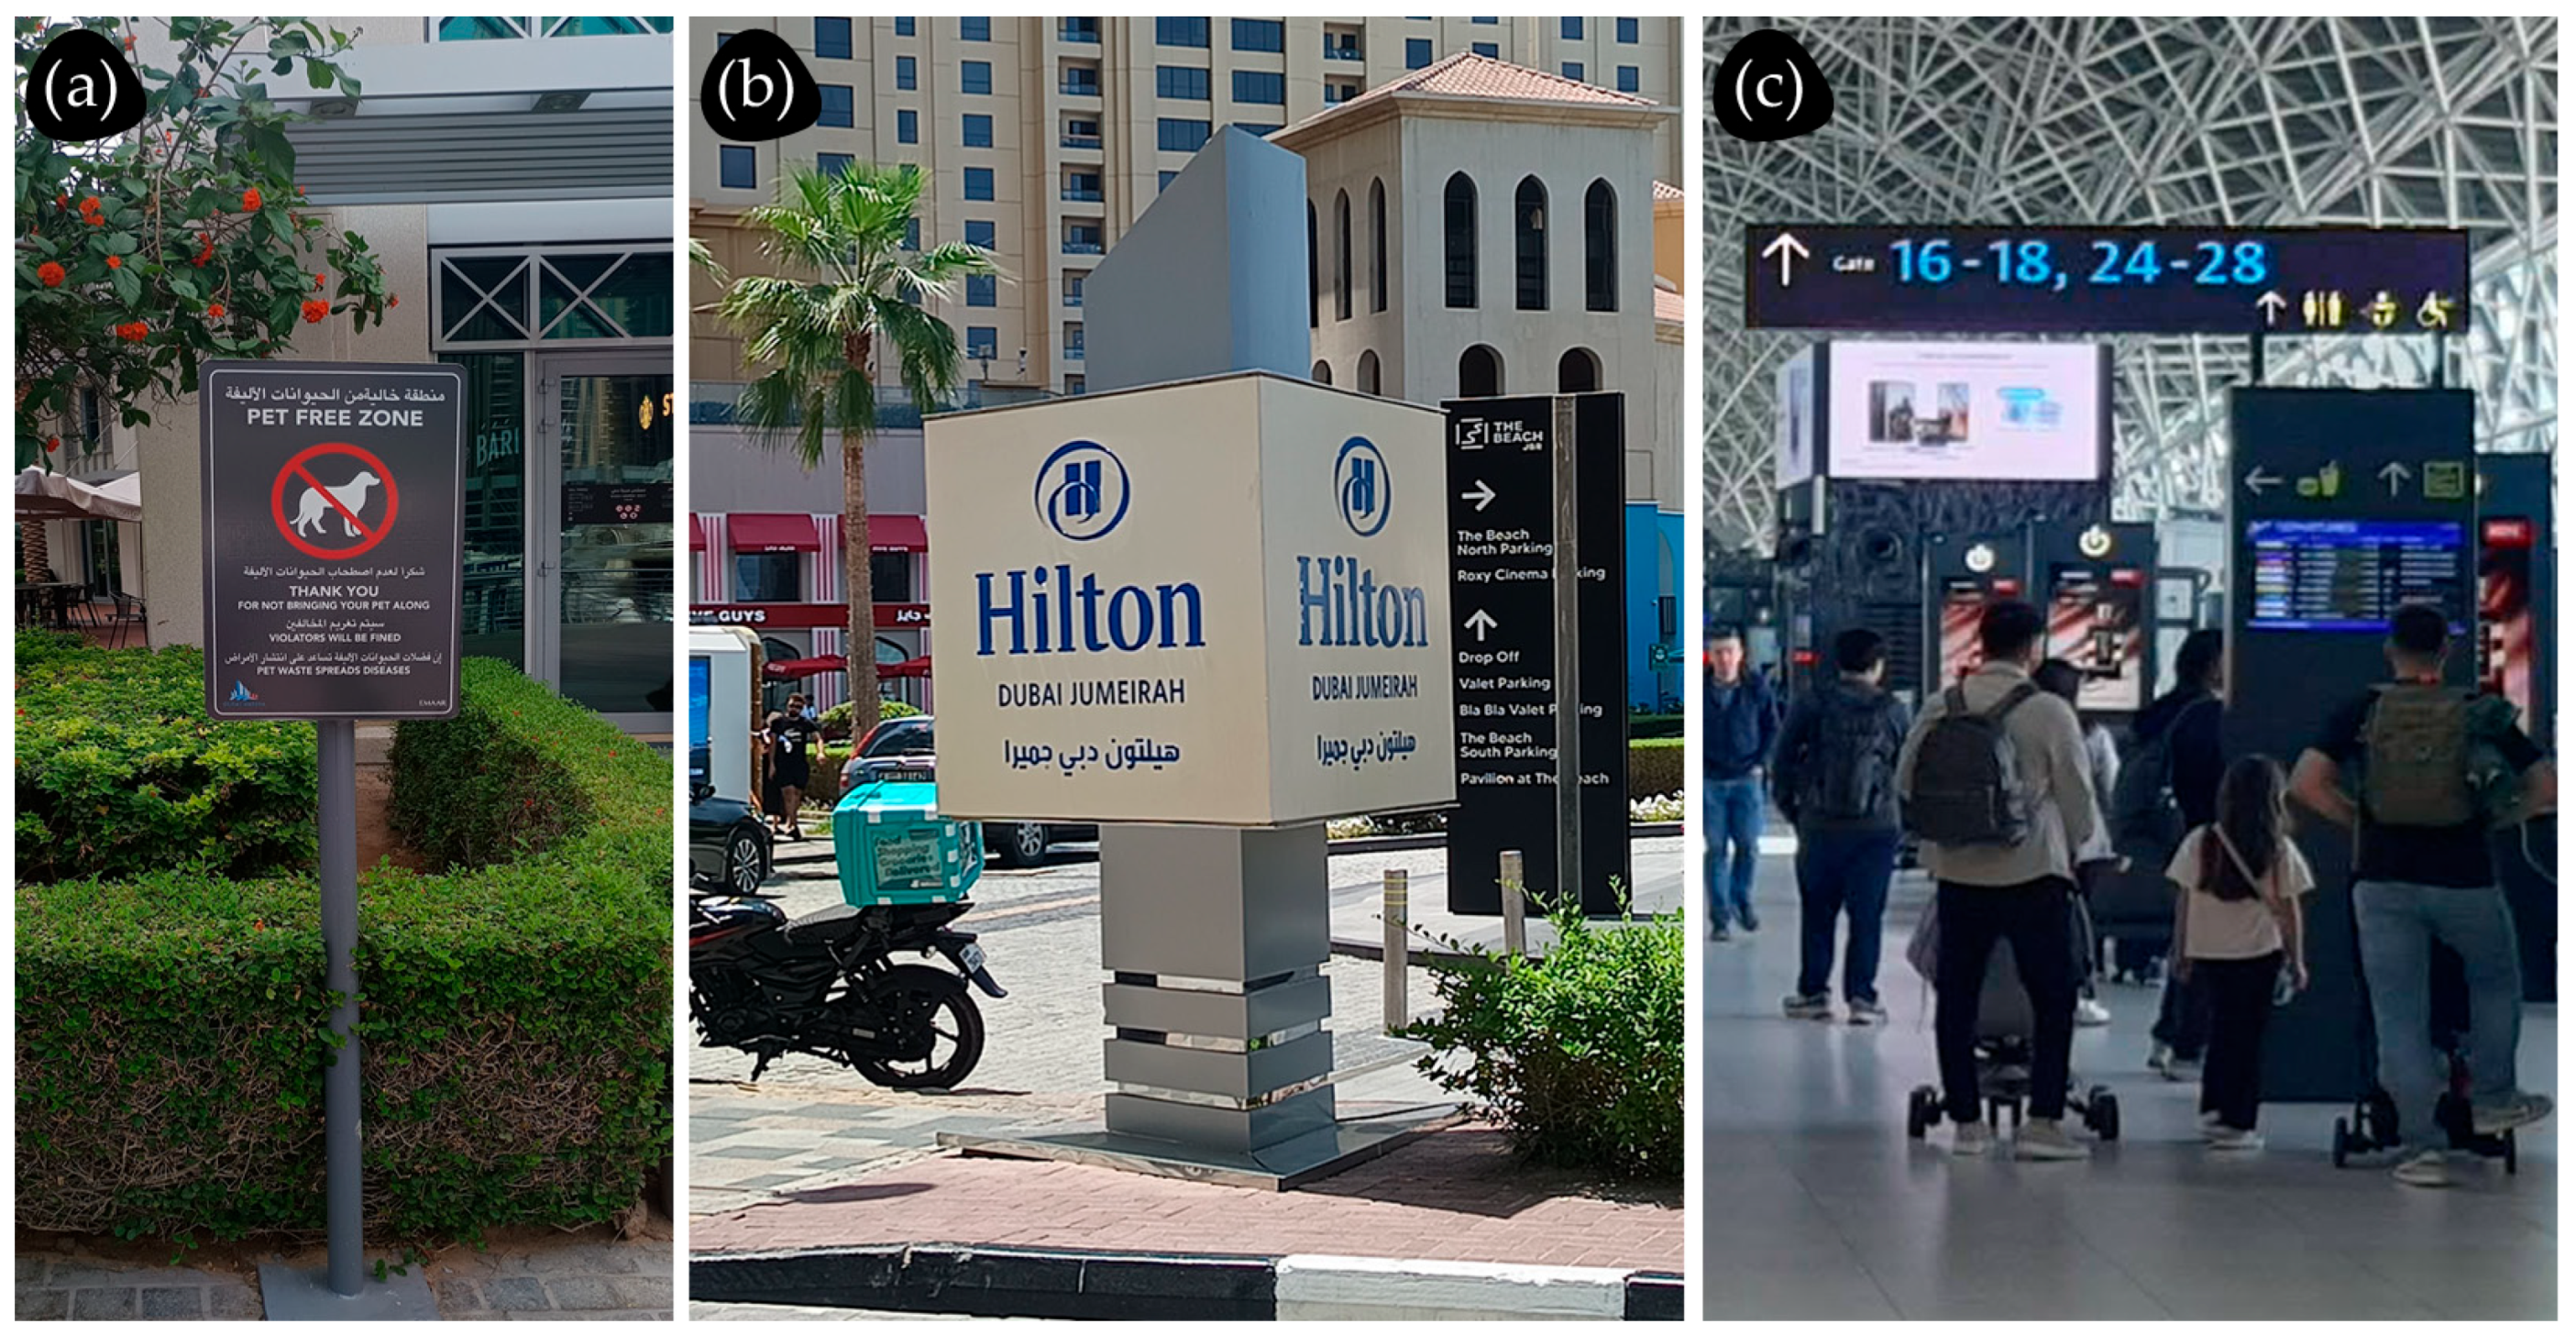
Visibility ensures that information is easy to spot from different angles and viewing distances, that users have enough time to read, understand, and act according to provided information, and that information is clear and legible with respect to the selected lighting or lack of lighting conditions. All these factors depend greatly on the physical characteristics of the space in which XGD products are implemented, but there are some basic guidelines that designers should keep in mind when planning and designing. The placement of an informative XGD product, if possible, should be in the eye-level zone of the users (Figure 12a). In addition, double- or multiple-sided products (Figure 12b) should be used if the objects can be approached from more than one angle or if the user viewing angle is greater than the horizontal angle of vision (up to 30 degrees). An overhead placement zone should be used for information that is read from greater distances (Figure 12c) [1,41,53].
There are many different guidelines regarding the size of typographic elements and symbols in relation to the distance of the viewer. Some of these theories also consider the height at which the information is placed, as well as the viewing angle, and if information must be visible from a moving vehicle, this becomes a very complex calculation. The most common and simplest recommendation is to increase the height of the letters by at least 2.5 cm for every 15 m of distance. In addition, viewers have different levels of visual acuity, and size considerations largely depend on the selected typeface’s anatomy, such as the stroke width and typeface treatments. Therefore, the best recommendation for choosing the right size is to test the size and legibility of the information at the location and learn from experience by observing the existing informative XGD products in one’s surroundings (Figure 13) [1,62,63,64].
Lighting conditions and XGD product illumination can have a major influence on the visibility and legibility of information (Figure 14). When the illumination of signs is internal, visibility is usually increased, but when using external lighting, materials must be chosen carefully to avoid reflection or glare, as shadows can be created if the light source is projected on the information and visibility can be reduced [41,53,61,65,66].
Consistency across graphic design elements fosters a cohesive visual language and contributes to the more effective, more intuitive, and faster transfer of information. Repeating colors, shapes, symbols, and typefaces create familiarity, allowing users to recognize important information, understand the information hierarchy, and navigate through physical spaces more easily (Figure 15). The level of consistency among all the XGD products throughout a project is extremely important, and each type of information should appear in the same format, size, and layout through the whole environmental setting [26,49,61].
Although digital information systems will likely never completely replace physical signs, their existence could simplify the process of information transfer. Integrated digital information systems should be easy to use, effective, accessible, and intuitive; otherwise, users will likely abandon the technology. Regarding their use to inform people in physical spaces, the various digital information systems are most often used to assist in navigation or to display changeable and updatable information, such as the arrival and departure of trains and airplanes. Regardless of whether an electronic display screen, interactive kiosks, or an application on a mobile device are used, the integration of technology should be achieved together with the overall XGD (Figure 16) in order to avoid a mismatch in terminology and orientation, to avoid the digital information system from becoming invisible in the physical space, and to ensure the efficiency of information transfer is not reduced [36,67,68]. Typeface and typeface treatment, color, contrast, symbols, size, and layout—these fundamental choices, just like in physical XGD products, define the extremely complex user interface (UI) design in digital information systems [69,70]. With endless combinations available, UI designers must thoughtfully balance principles such as clarity, consistency, efficiency, and accessibility to create intuitive systems that allow users to navigate and access content quickly and accurately [69]. A well-designed UI not only communicates information in a clear and visually coherent manner but also enhances the overall user experience (UX) by minimizing confusion and cognitive load [71]. In XGD, the UI becomes a critical touchpoint, especially within digital wayfinding systems and interactive displays. These systems must be easy to use across diverse user groups and contexts, with intuitive layouts, clear visual hierarchies, and responsive feedback. Inclusive and user-catered design approaches are essential in ensuring that these interfaces accommodate people with different abilities, cultural backgrounds, and levels of technological skill [70,71].
In order to communicate information effectively in a physical space, one of the main strategies for designers is to adapt the design to fit the purpose of the space and users, i.e., use contextual design strategy [72,73]. For example, museum exhibits may use thematic signage, while retail environments could focus on practical and clear design elements and interactive touchscreens to help customers navigate the store easily or quickly find the exact product they need. Information is best conveyed through integrated graphic systems, i.e., wayfinding systems that include signs, maps, digital displays, and other environmental graphics. Therefore, integrated systems that use technology are required to create a seamless experience where each of these elements works together and complements each other to guide and inform users [36,74]. In addition, durability and sustainability should be part of the strategy. For example, using materials that are long-lasting, weather-resistant, and environmentally friendly will ensure that the design remains functional and informative for a long time [75,76,77,78].

4.2. Inspiring People in Physical Spaces

When the goal of experiential graphic design is to inspire people, the focus shifts from simply providing information or guiding people through a space to creating an environment that motivates, uplifts, and sparks creativity or emotion. Inspiring XGD can foster positive change, motivate people, and evoke feelings of wonder, delight, and connection. This kind of project can be found in physical spaces where creativity and innovation are desired, such as museums, galleries, education centers, workspaces, and events and branded spaces.
In order to provoke an emotional or intellectual state in users, XGD designers use different approaches to realize their project. Most often, these are emotional, immersive, narrative, and artistic approaches [49,79,80,81]. Inspiration in XGD comes primarily from the emotional connection. With a strategic blend of typography, color, imagery, and technology, designers aim to evoke strong feelings, such as awe, curiosity, joy, or motivation. Through incorporating sound, touch, smell, and sometimes even taste, designers can create immersive multisensory experiences that deeply engage users and inspire them in ways that visuals alone may not [80,82,83]. Narrative elements can transform physical spaces into an engaging story and take people on a journey, stimulating their own creativity and encouraging personal reflection. Through collaboration with artists, XGD designers can produce stunning and unconventional physical spaces that inspire through their visual impact.
When the main role is to inspire, design principles slightly shift from functional and informational clarity to creating something that is esthetically pleasing, unique and impactful. XGD designers use textures and materials that add depth, play with extreme contrast, consider the scale of graphic elements and art installations, and use lighting elements and cutting-edge technologies [82,84,85,86].
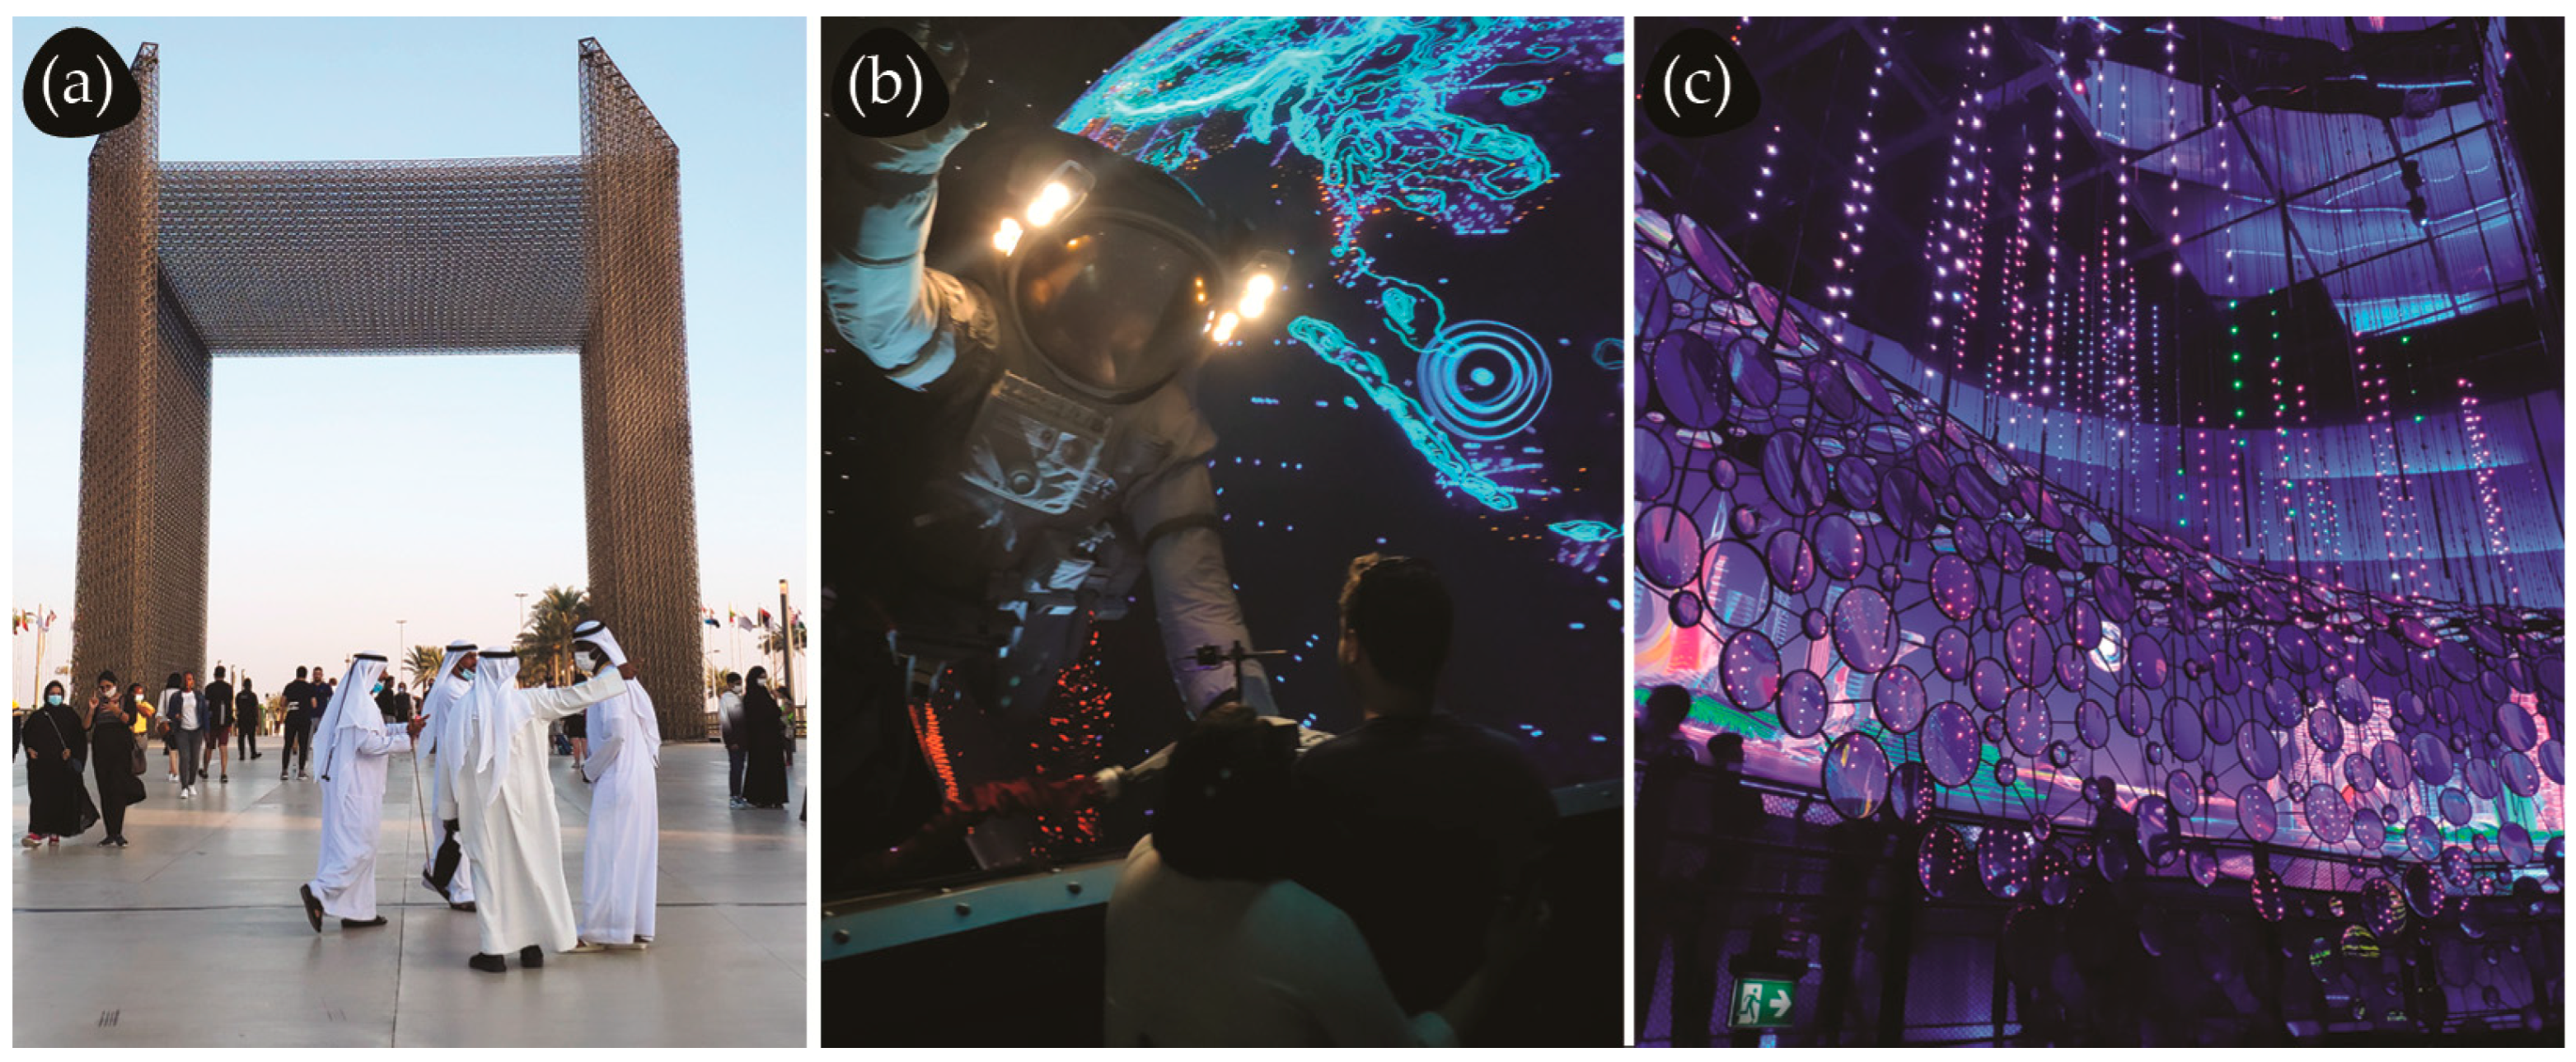
The strategies for creating inspiring physical spaces will be described for different dynamic contemporary spaces. For example, modern museums, galleries, and public exhibition spaces are shifting from traditional, passive exhibits to interactive, immersive environments in which visitors actively engage with the content. The main goal is to create an environment that allows visitors to not only receive information but also alter and interact with it, encouraging their participation in the creation and transformation of the space. By incorporating digital technologies such as virtual reality (VR), augmented reality (AR), and interactive projections, museums offer more personalized experiences (Figure 17). These advancements allow for a deeper understanding of the historical, cultural, and emotional contexts of exhibits. Interactive elements, such as touch screens, dynamic narrations, and auditory effects, help create an engaging, emotional connection between the visitors and the exhibits (Figure 18). The introduction of multimedia displays and visitor-centered content design encourages active participation and fosters a more personalized, engaging museum experience. This shift toward interactivity reflects the evolution of museums in the digital age, in which technology and art merge to offer more vibrant, memorable, and educational experiences [83,87,88].
Incorporating XGD in educational spaces can enhance the learning experience and reflect the values of the educational institution. The goal is, together with interior designers and architects, to design environments that are both functional and visually stimulating, fostering a more engaging and interactive atmosphere for learners. Creating spaces with distinct zones for study, collaboration, and social interaction, with an emphasis on flexibility, technological integration, and inspiring esthetics, can create a motivating atmosphere and foster creativity and deeper learning [89,90]. Through the thoughtful use of color, in accordance with color psychology, learners’ cognitive functions can be improved [59,91]. Colors with a cold hue have been shown to increase attention and improve performance in tasks involving attention and memory, thus supporting cognitive function more effectively than warm hues [91]. Additionally, the use of color in learning environments influences students’ behavior, emotional responses, and comprehension by enhancing focus, stimulating a positive mood, and even affecting physiological responses such as the release of hormones in the brain [59]. Carefully selected color schemes can therefore play a vital role in shaping educational spaces that support efficient learning, emotional well-being, and sustained engagement. Educational graphics, infographics, and interactive displays can be incorporated into the space to reinforce the curriculum content. These elements make abstract concepts more tangible and provide opportunities for hands-on learning (Figure 19) [92]. Integrating technologies like interactive displays, augmented reality (AR), and virtual reality (VR) enhances engagement, offering dynamic, immersive learning experiences that allow learners to explore real-world scenarios in a safe and controlled physical space [92,93]. Sensory stimulation, such as visual and tactile elements, can inspire creativity but must be carefully managed to avoid distraction [90].
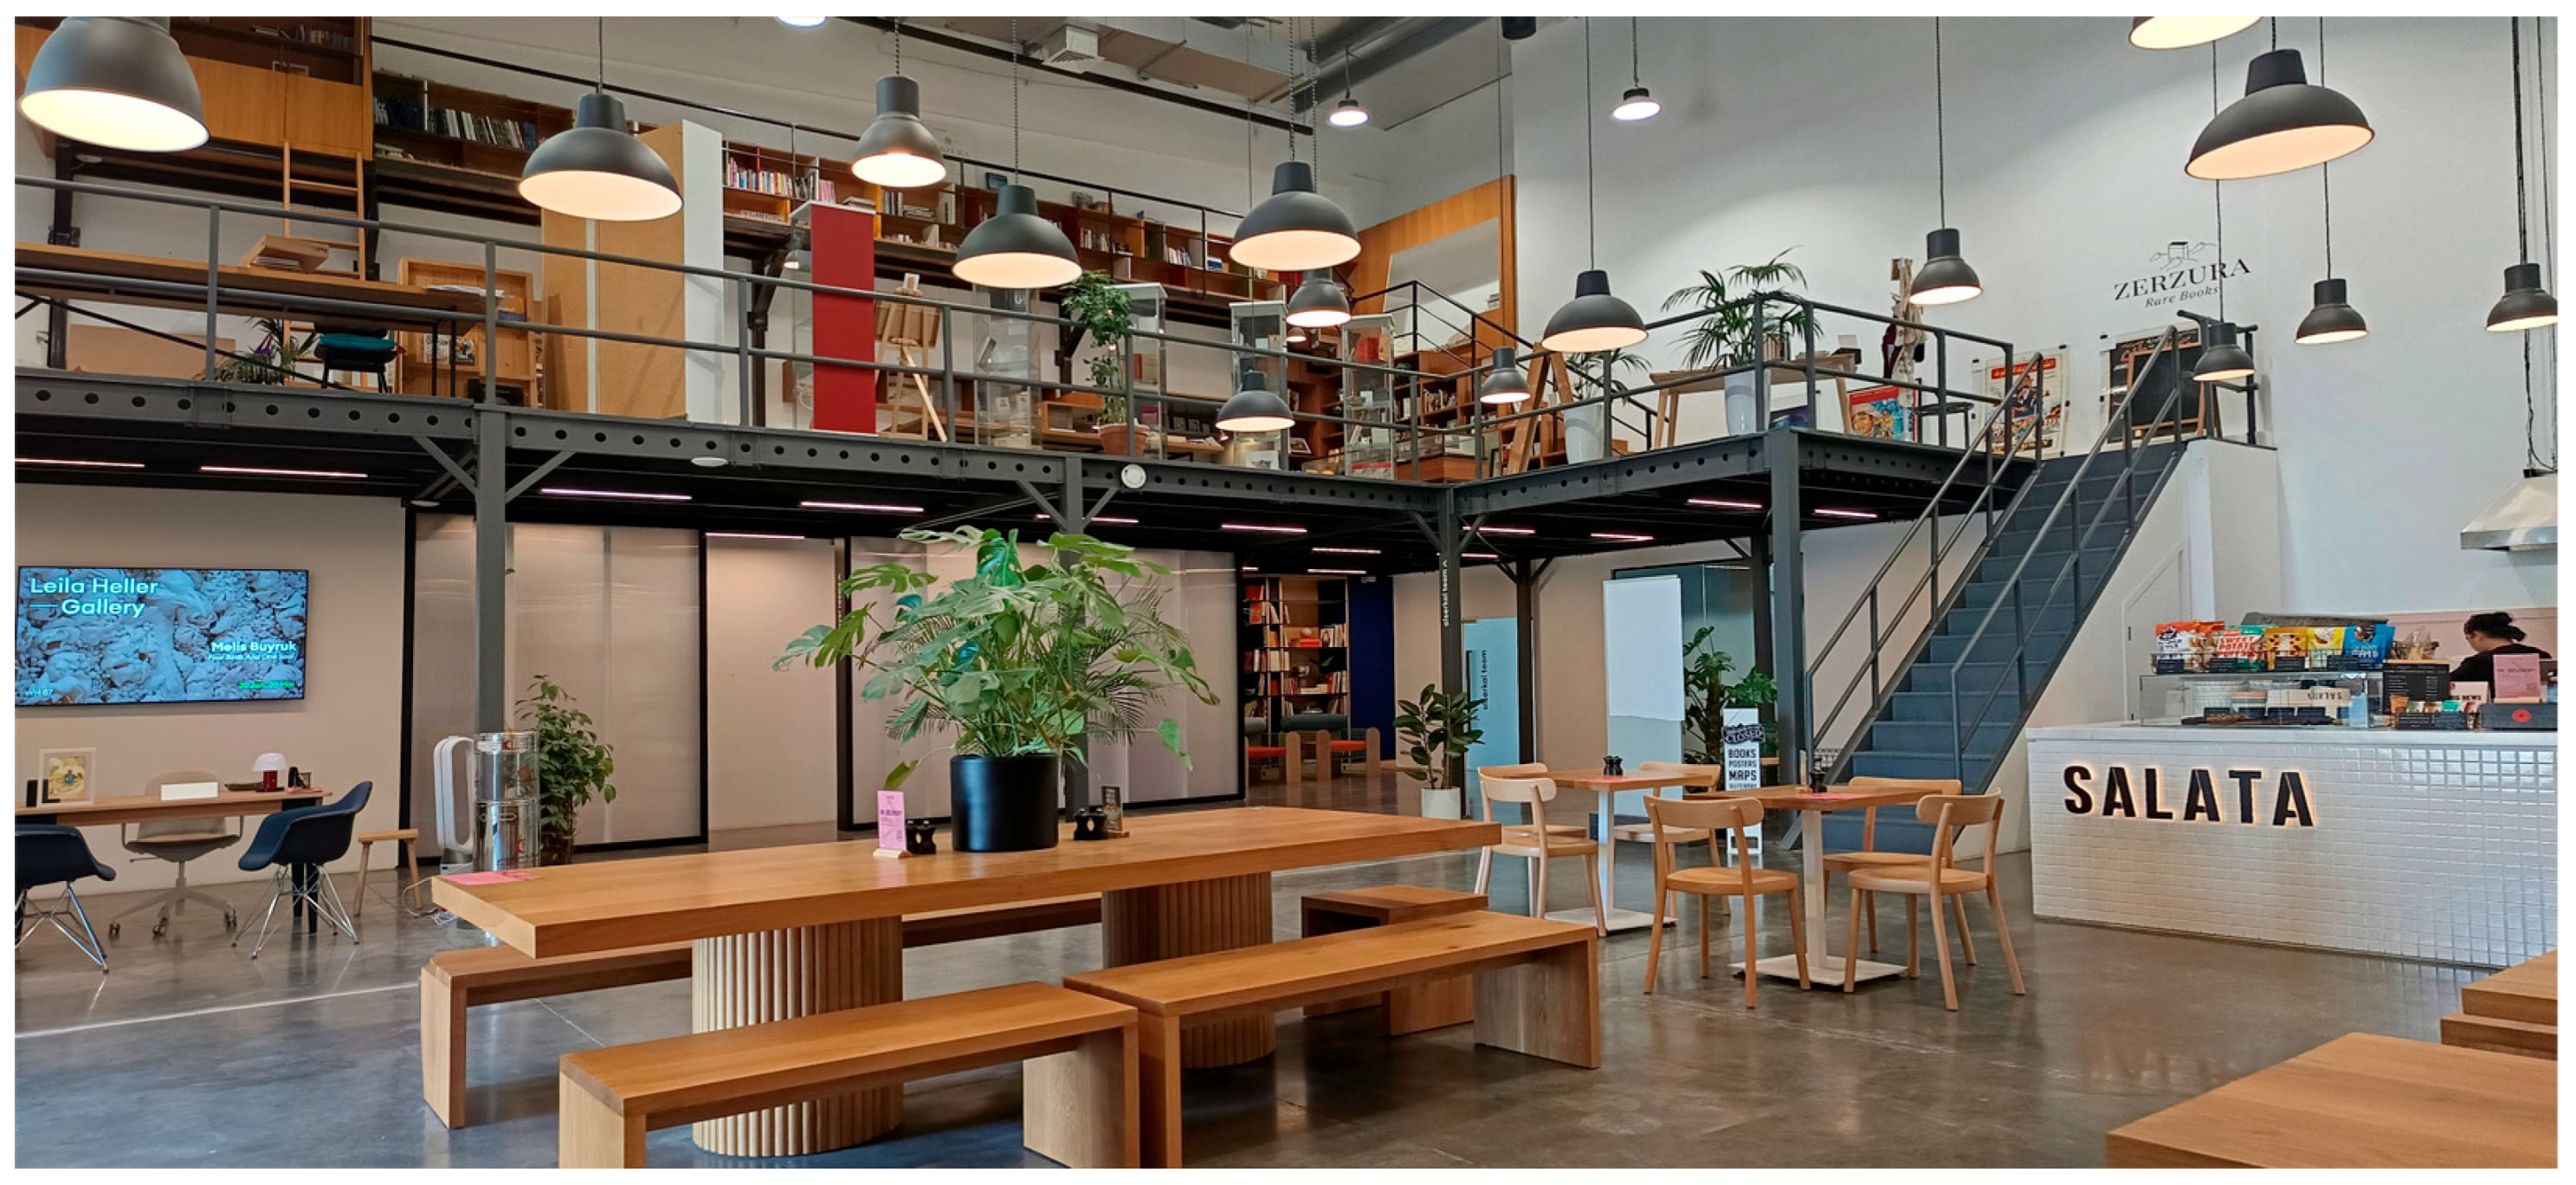
The concept of a creative workspace has been largely shaped by companies like Google, which pioneered the use of open-plan office spaces with unconventional furniture. Creative workspaces are physical environments that are intentionally designed, usually through the joint efforts of interior designers, architects, and XGD designers, to support creative work processes and stimulate innovation. These spaces often prioritize social interaction and collaboration (Figure 20), enabling informal communication among employees. At present, modern organizations are strategically focusing on creating work environments that enhance spatial interactions, shape organizational culture, influence behavior and work performance, and foster creativity and innovation [94,95,96].
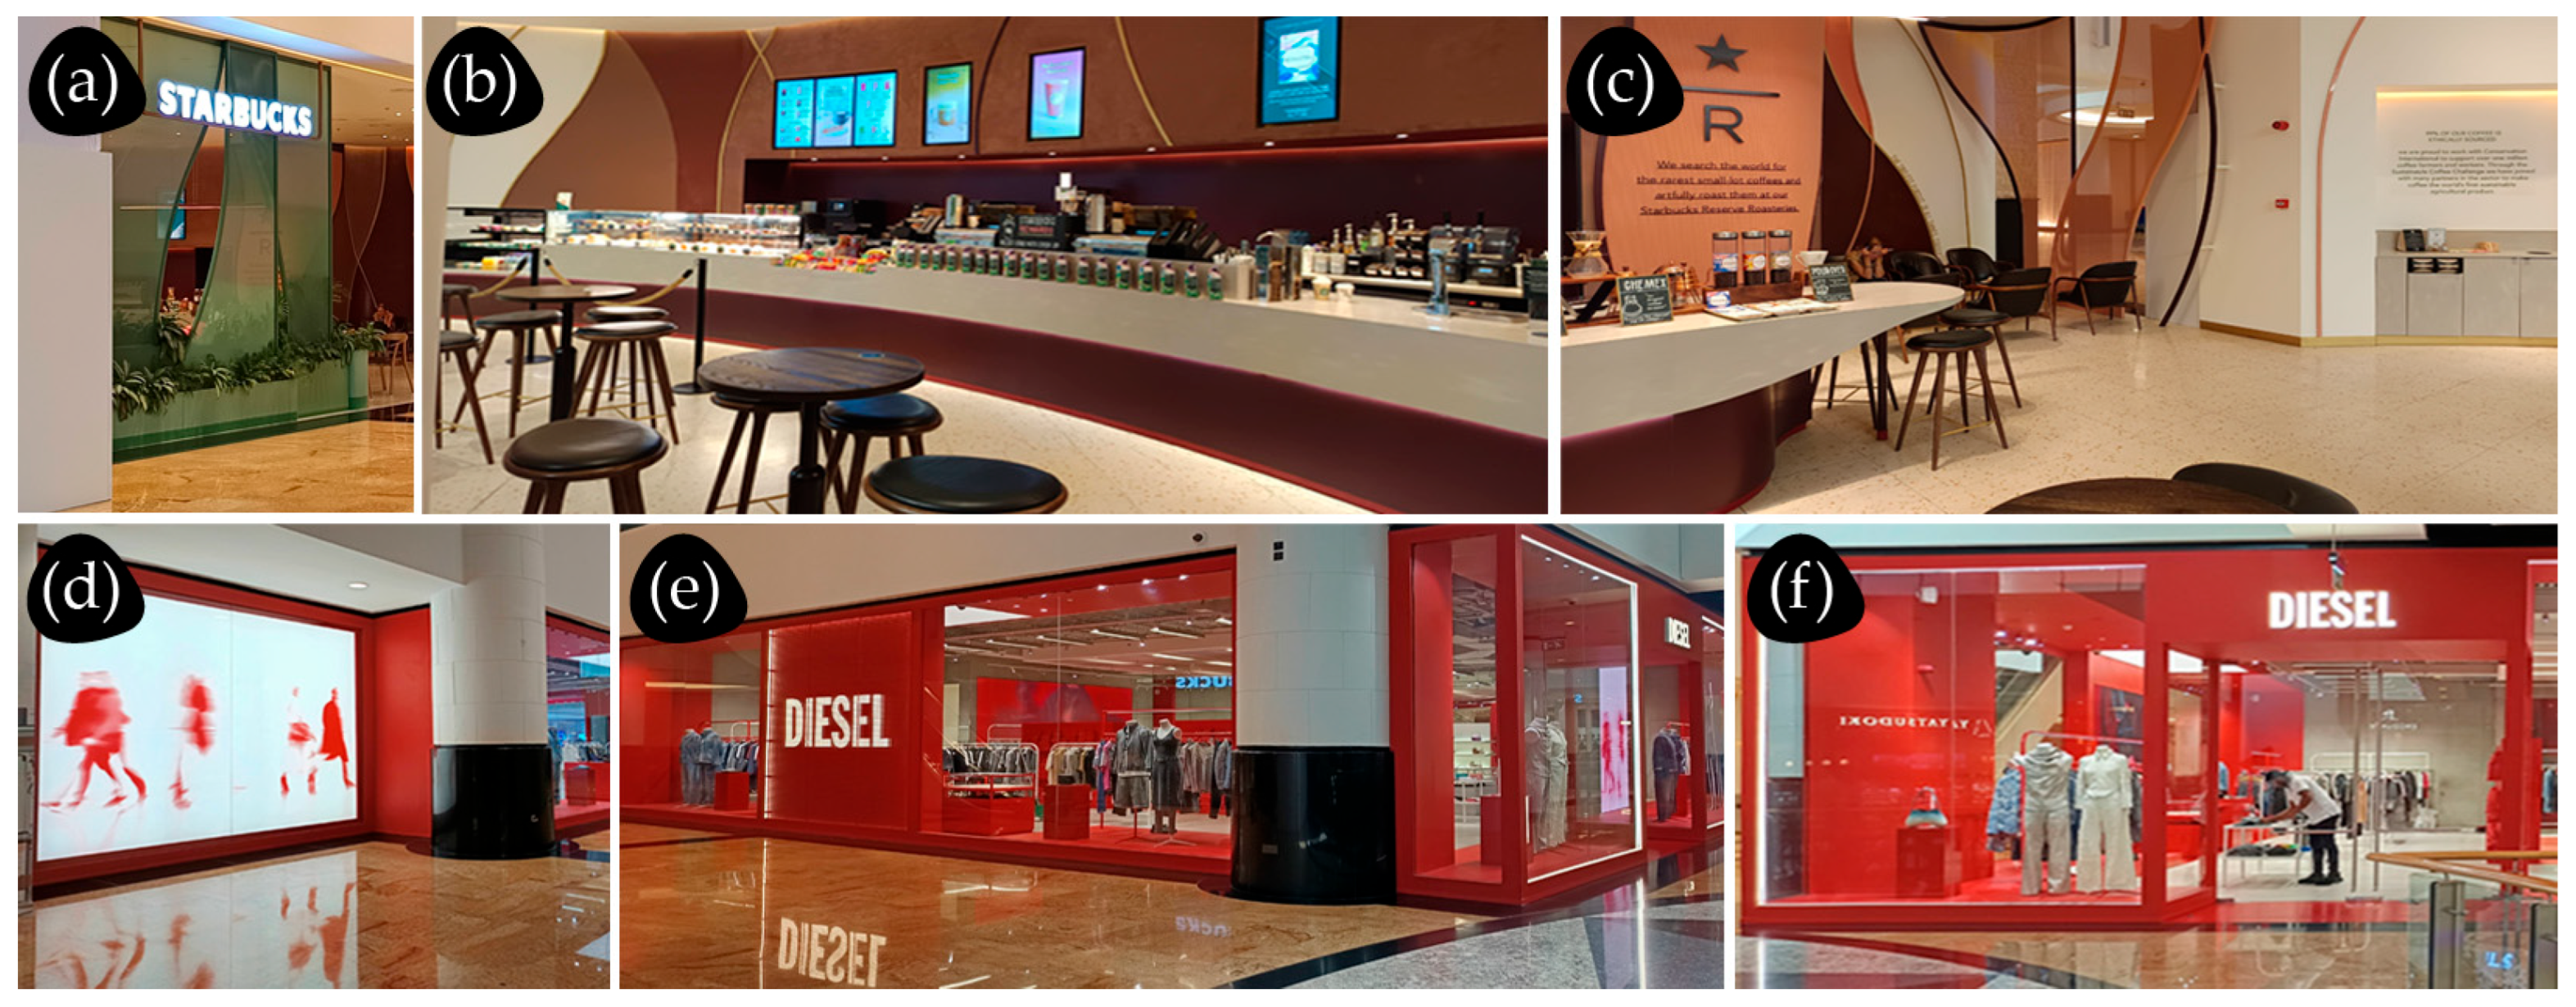
XGD is a powerful tool for enhancing brand recognition by creating multisensory experiences that forge strong emotional connections between consumers and brands. A brand is much more than just a logo or name; it represents the promised quality, the brand values, and a unique identity. The consistent use of a brand’s colors, typography, and messaging throughout a physical space helps seamlessly integrate the brand into the space and create a cohesive brand atmosphere that can increase brand awareness and foster loyalty (Figure 21).
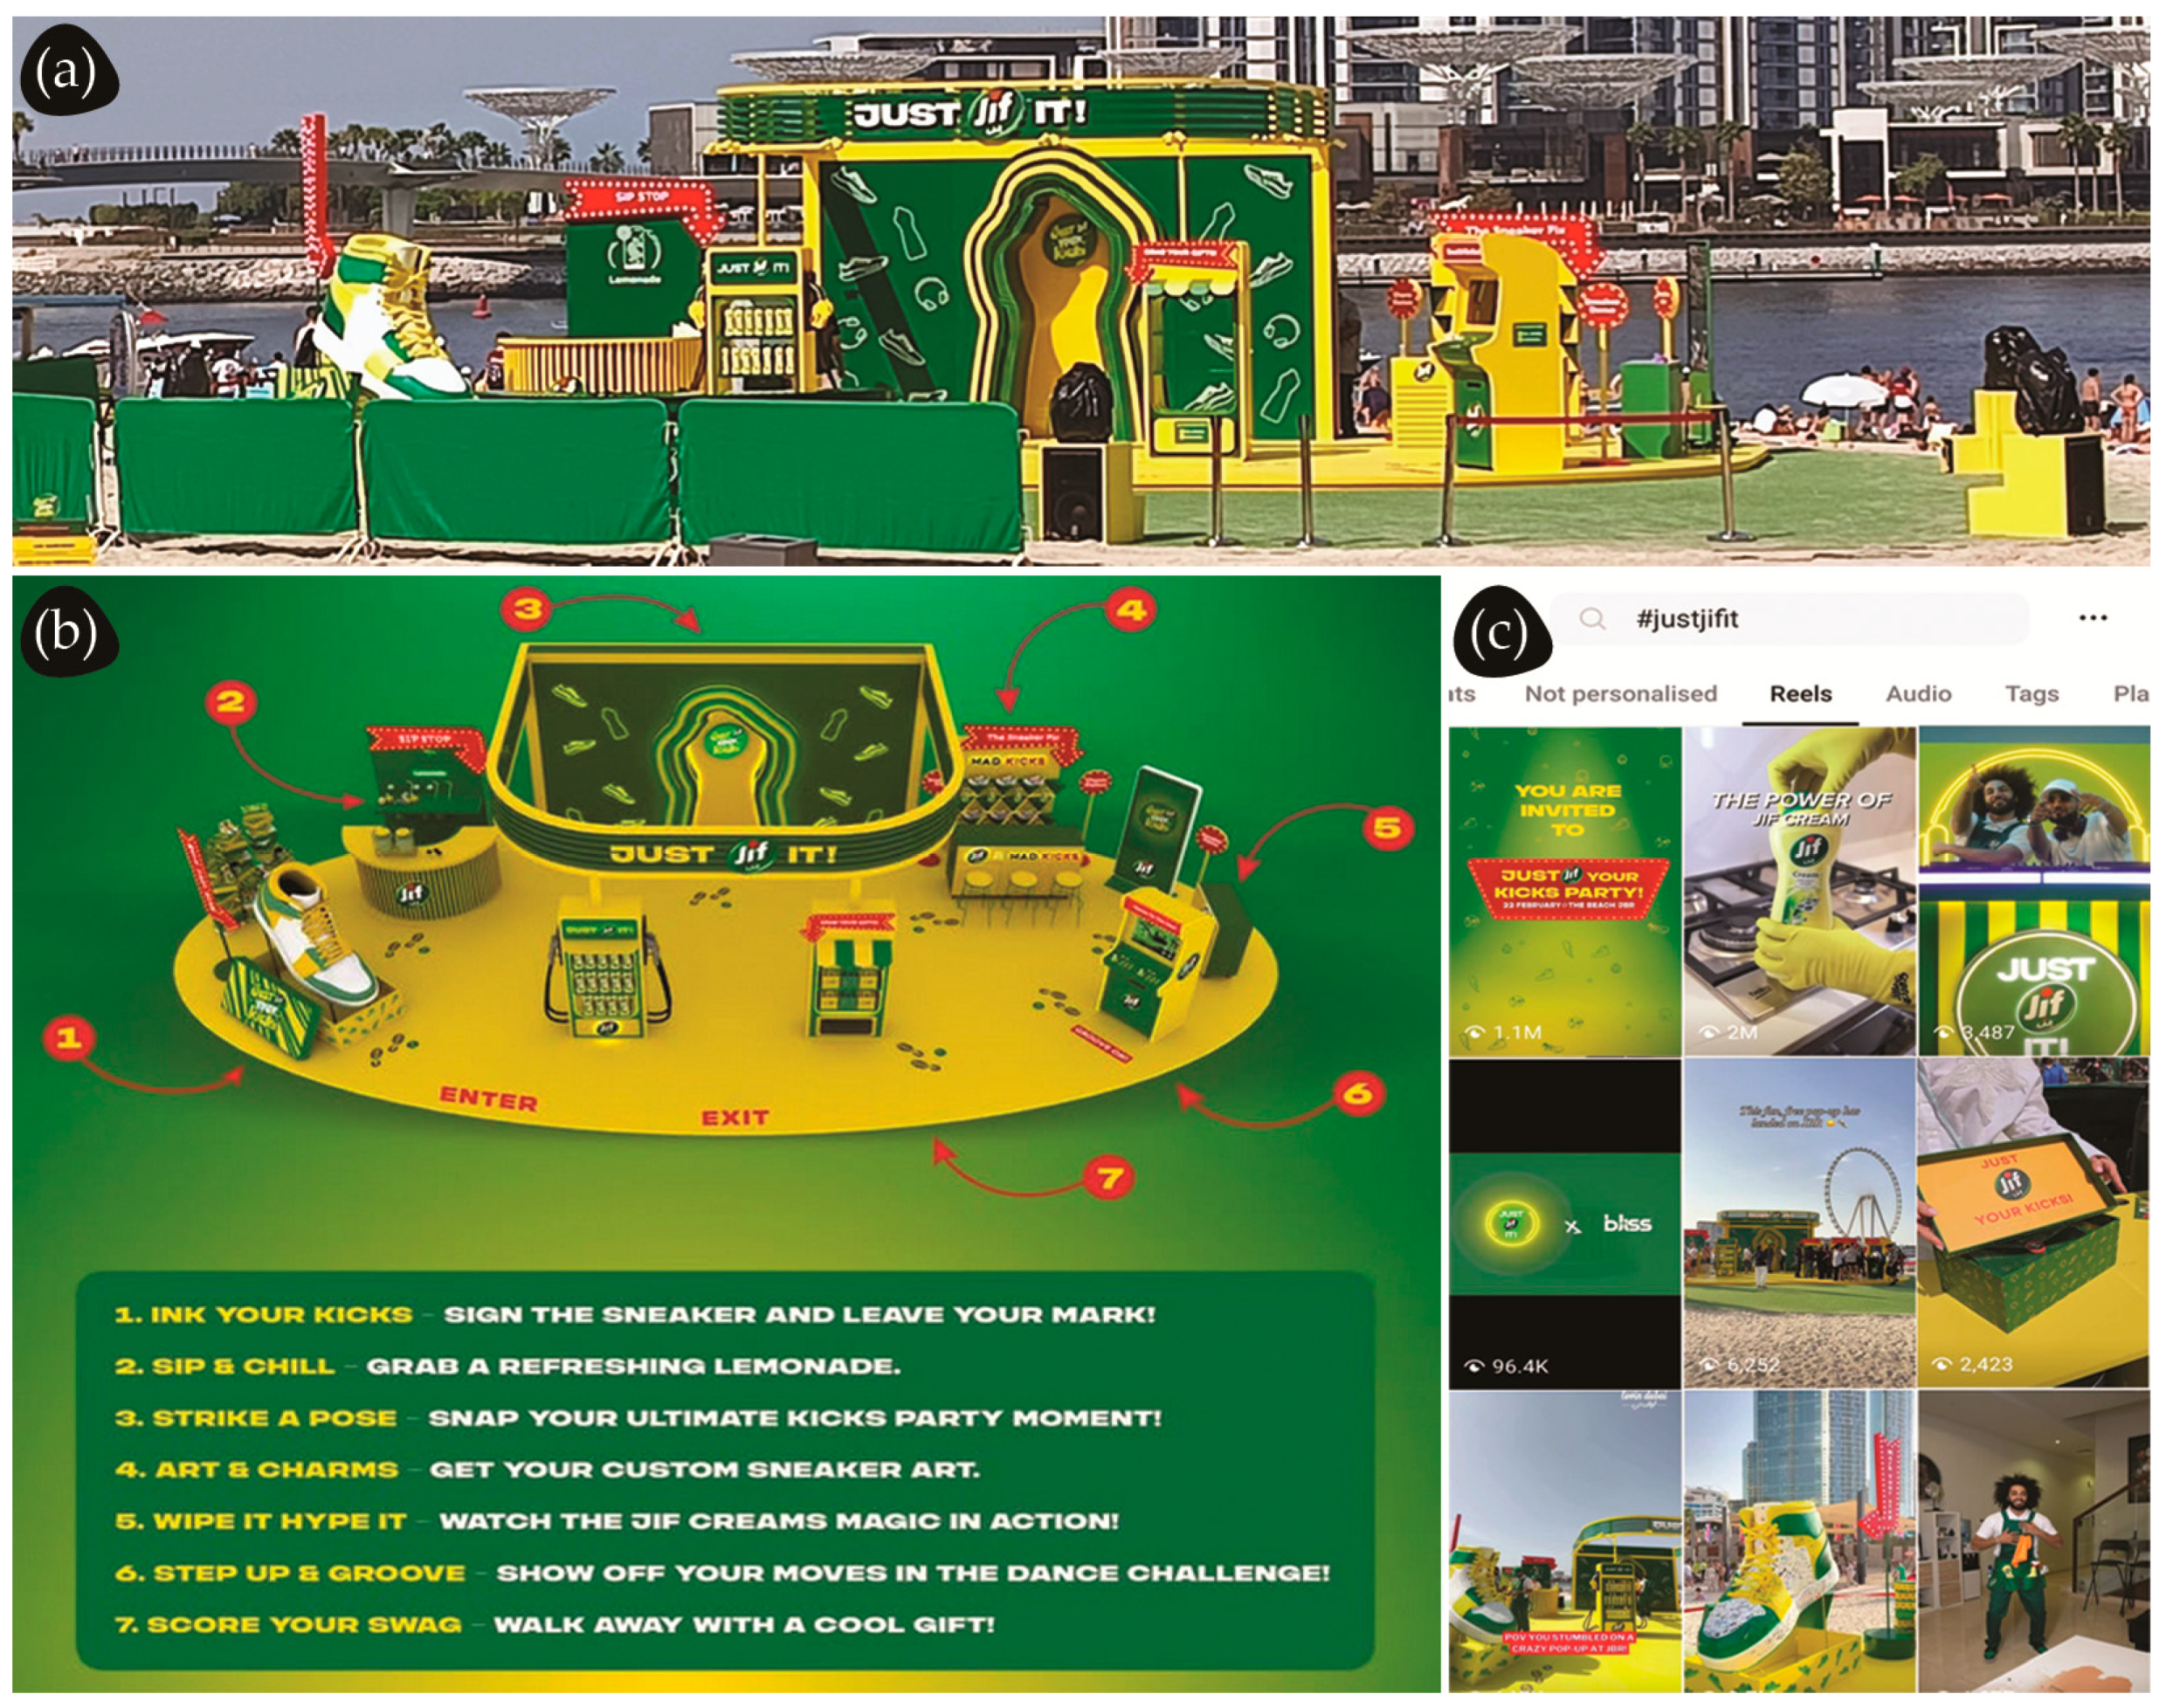
Branded spaces, with, for example, interactive displays and the strategic placement of graphic elements, like signs, typography, and color, are powerful storytelling mediums, leveraging visual, tactile, and auditory elements to guide customers through a brand’s history and vision, reinforcing a deeper understanding and emotional connection. Technological advancements like virtual reality (VR), augmented reality (AR), and interactive technology with customizable elements facilitate an immersive and personalized brand experiences, blurring the lines between the physical and digital worlds. These tools, combined with data analytics, optimize experiences and better engage the intended audience, making customers feel valued and understood. XGD can extend brand reach by creating shareable moments and Instagram-worthy spaces that encourage social media posts and user-generated content. In addition, XGD is part of every brand event or launch (Figure 22) and can make a company stand out in a crowded market by creating a memorable experience, allowing customers to interact with products or services in a sensory way, and leaving a lasting impression [3,44,79,80,84,97].

4.3. Integrating People in Physical Spaces

When the role of XGD is to integrate people into physical spaces, the focus is on creating environments that are welcoming, inclusive, and easy to navigate. At the same time, it is essential to foster opportunities for engagement and emotional connection. Integrating people into spaces requires the employment of the approaches, design principles, and strategies discussed in earlier chapters, which emphasize XGD’s role in informing and inspiring individuals. However, these principles and strategies must be tailored to suit the new primary objective: enhancing people’s integration. They should be applied in a way that ensures that the XGD products help people feel that the space is theirs, that they can comfortably interact with it, and that it serves their needs in both functional and emotional ways [6,10].
As cities become larger, more multicultural, and increasingly complex due to migration and globalization, the need for effective communication in public spaces becomes more significant. Inadequate communication can lead to feelings of isolation and alienation, especially for newcomers unfamiliar with urban life or the local language. XGD helps resolve these challenges by creating inclusive wayfinding systems (Figure 23), making spaces more navigable and accessible for everyone, regardless of their background, language, or abilities. By using universally and internationally recognized symbols, Braille signage, high-contrast color schemes, and legible typography, XGD designers can help everyone navigate the space [11,12,30,38,98]. This is critical in public spaces like hospitals, university campuses, train stations, bus stops, and airports. In public spaces like parks, beaches, hotels, retail environments, or cultural venues, to reflect the diversity of the people using the space and create an environment that feels welcoming and inclusive for everyone (Figure 24), XGD designers can incorporate diverse imagery and celebrate different cultures using culturally relevant visuals, colors, and symbols that are mindful of the context and audience, reinforcing mutual respect.
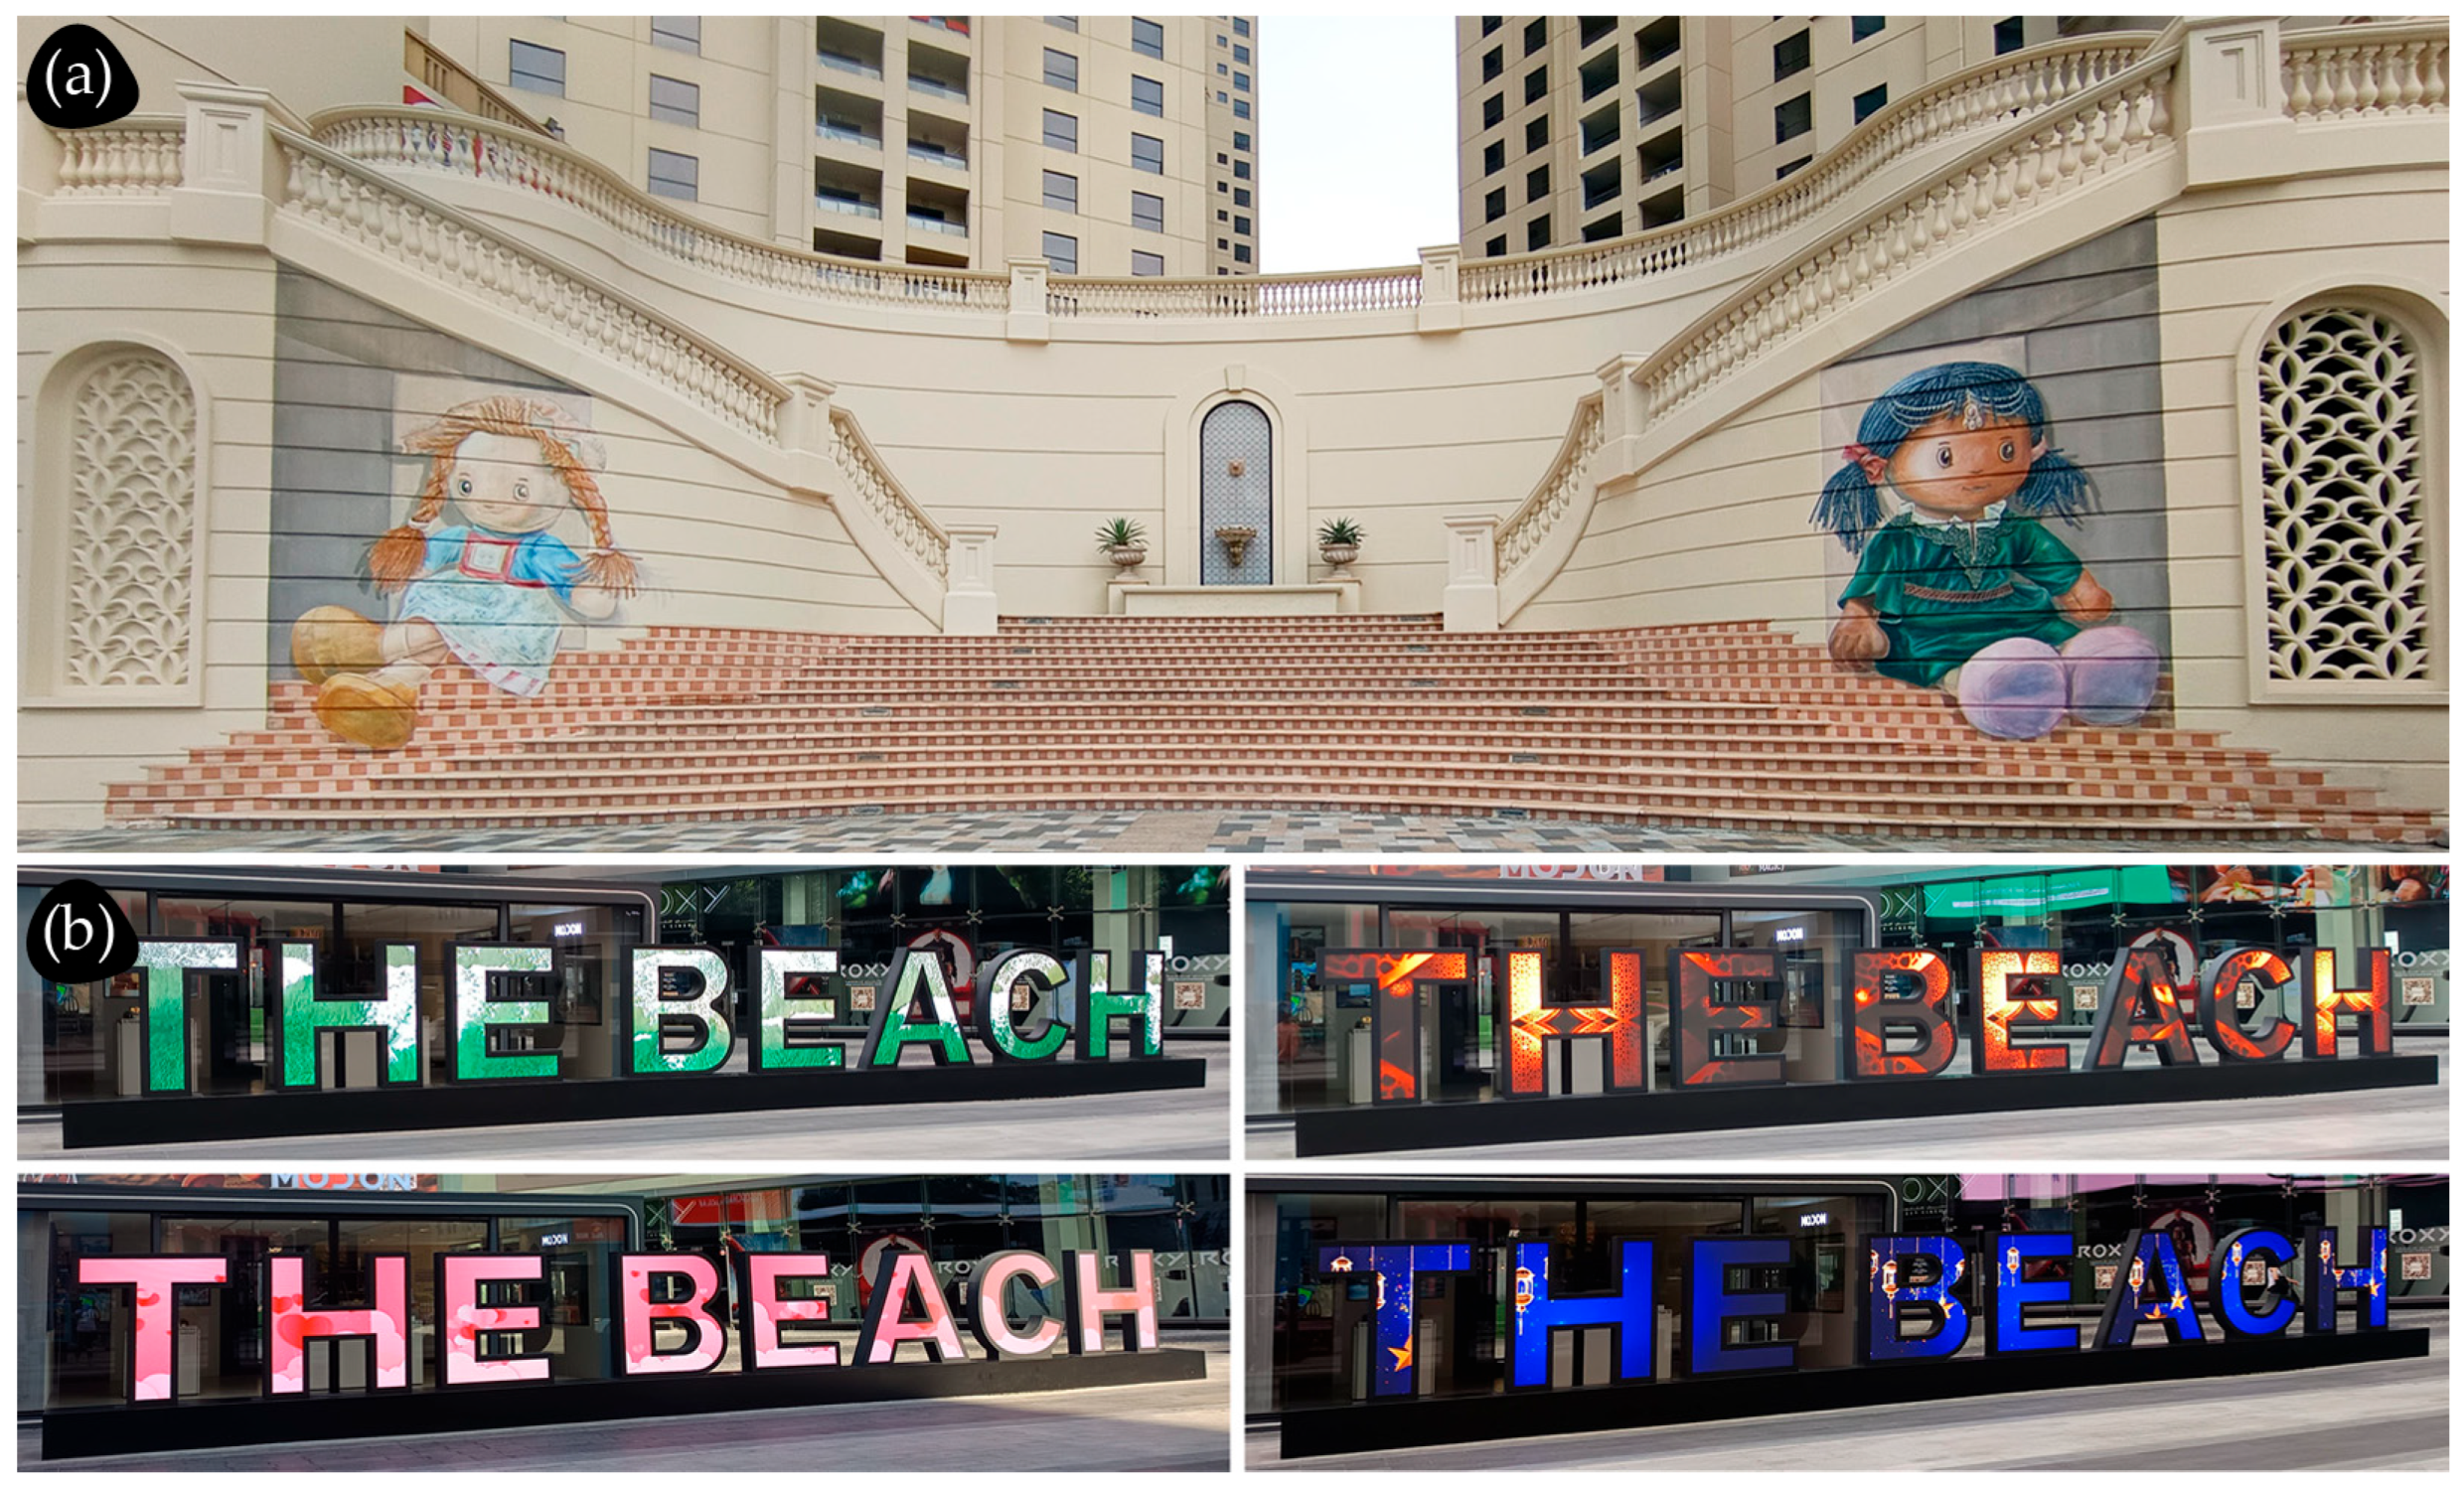
In addition, XGD can enhance the sense of place and restore and strengthen the cultural identity of an urban space by incorporating cultural, historical, and social elements. Understanding the local customs, values, and norms of a place allows designers to create spaces that respect and preserve its cultural essence (Figure 25), avoiding the blind replication of designs from other societies. This often involves collaboration with architects and community members in order to achieve the main goal: to create a meaningful space that connects with the audience on a deeper level [11,14,19,40,44].
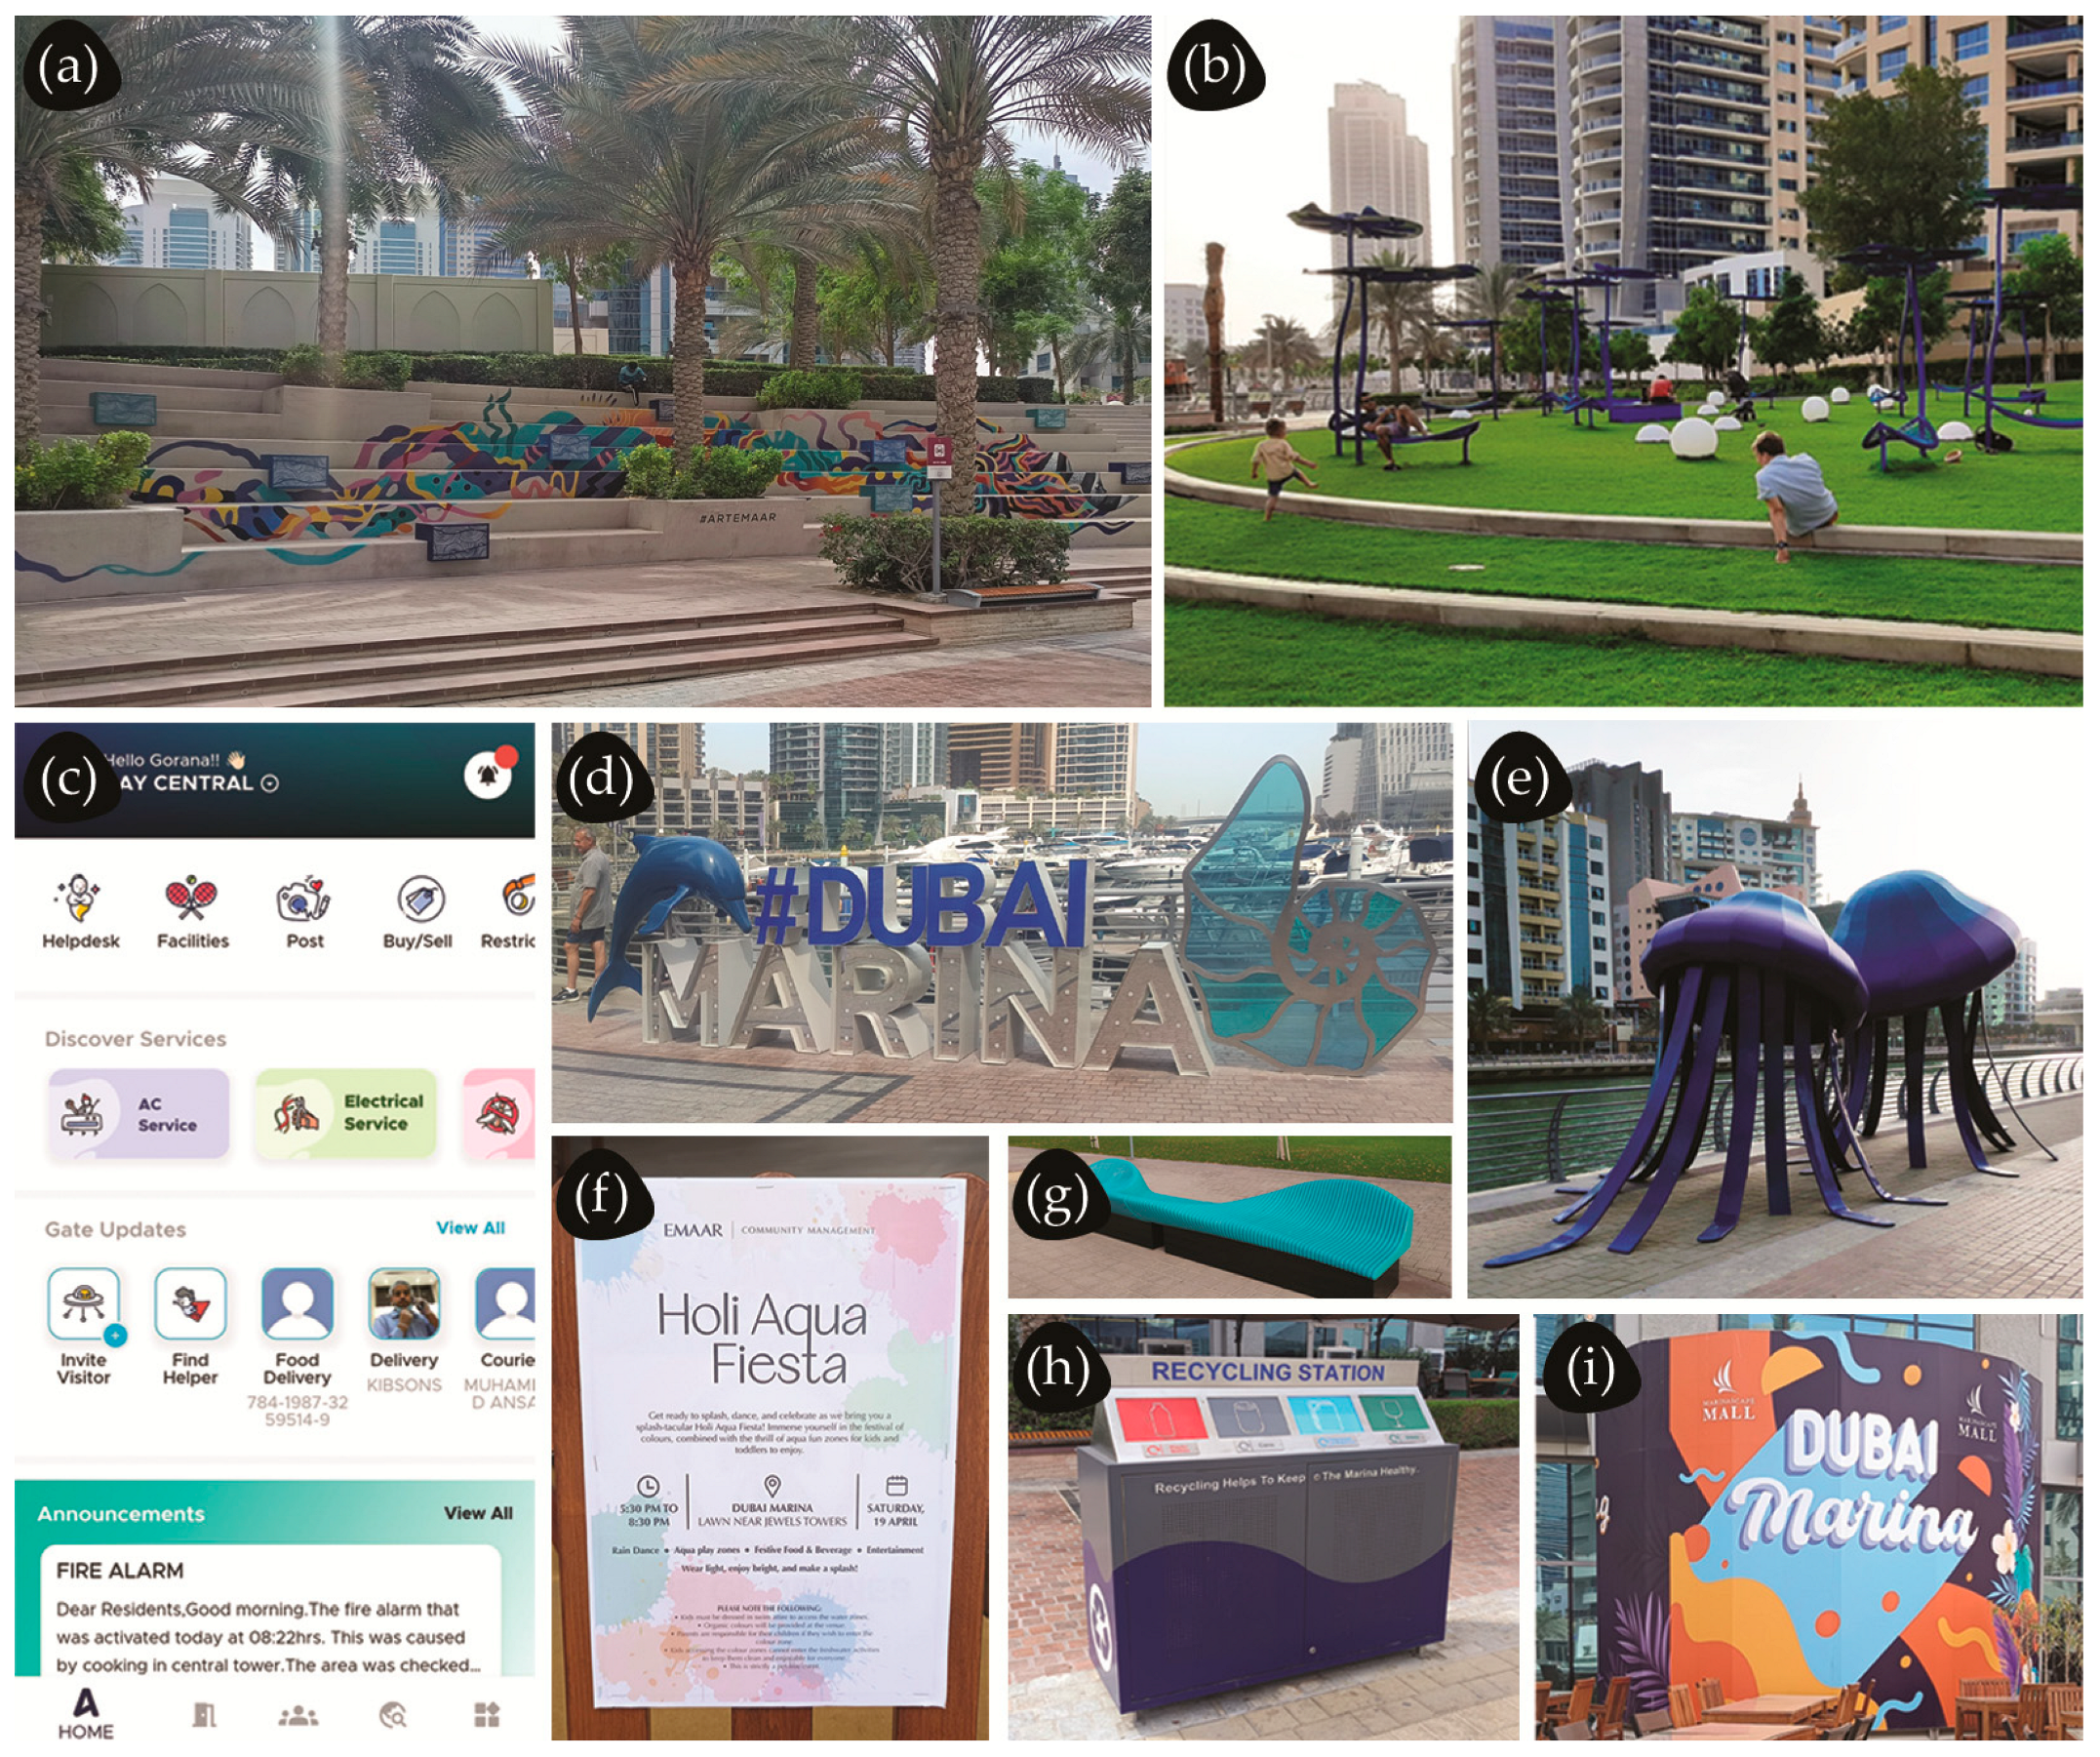
The design of public spaces through XGD can also foster a sense of community. People spend a significant portion of their daily lives in public spaces, and the design of these environments influences their lifestyle and behavior. The application of XGD in public spaces can play a key role in fostering a sense of community, helping individuals connect with both their surroundings and one another (Figure 26). By designing spaces that promote interaction and inclusivity, XGD can encourage a feeling of ownership and belonging. Public spaces such as plazas, recreational parks, playgrounds, community centers, and residential areas can be transformed to foster collaboration and social integration. This can be achieved through the use of shared seating areas (Figure 26a,b,g), open spaces for social interaction, community boards that highlight community and local events (Figure 26f), and interactive installations that engage individuals (Figure 26d,e). Features like touchscreens, mobile apps, or QR codes can further enhance connection, providing information, guiding people, or offering unique experiences that make individuals feel part of the space. In addition, personalization strategies, such as language options or tailored services, can deepen the sense of integration. Nevertheless, interactive experiences should be simple and accessible to people of all ages and abilities. Community-focused XGD products should prioritize emotional comfort, avoid overstimulation or confusion, and promote feelings of security and belonging. In order to foster a sense of shared identity and pride in a space, design elements highlighting shared values can be reflected through murals, quotes, or infographics; for example, community-focused design could encourage conversation and invite people to share their thoughts, ideas, or creations through simple physical installations like participatory walls or interactive displays and maps [2,14,40].

5. Advancements and Trends in, and the Future of Experiential Graphic Design

5.1. Trends and Terminological Shifts in Recent XGD Publications

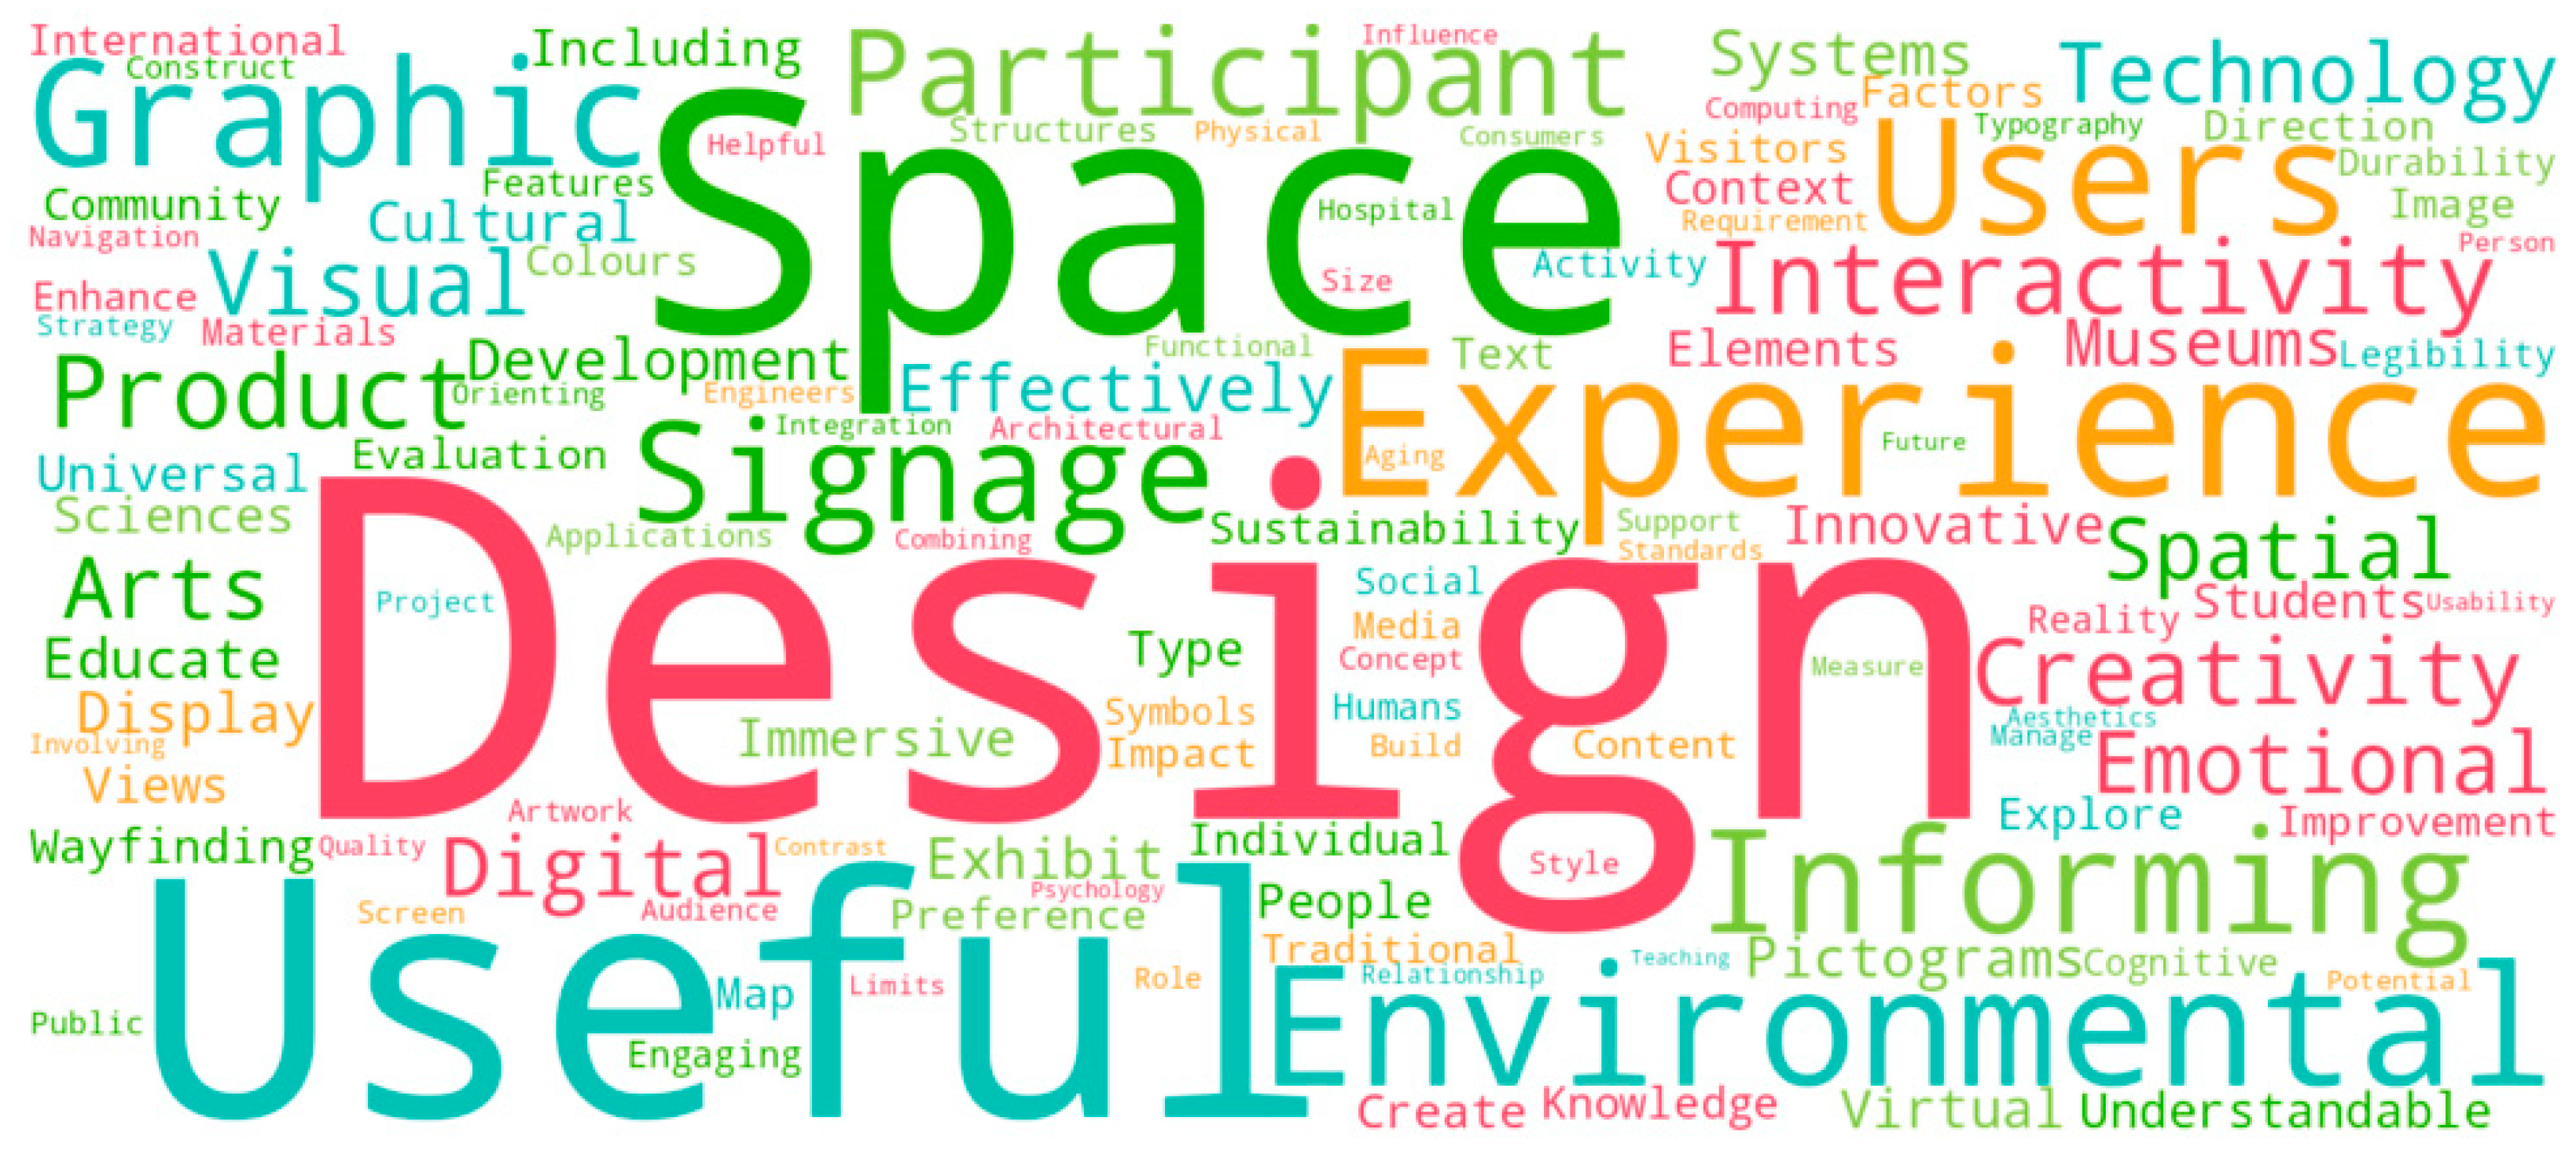
The publications selected for this review, based on the PRISMA strategy for systematic selection, provided the authors with a great basis for writing this review article. However, during the writing process, additional references were incorporated to further enhance the comprehensiveness of the review, highlight the main issues and future trends, and include some more specific current topics in the field of XGD. The authors expanded their selection by analyzing keywords (Figure 6) and word frequencies (Figure 5) within the initially chosen publications. As a result, Figure 27 shows a word cloud of the most frequently used terms in the additional publications included in this study.
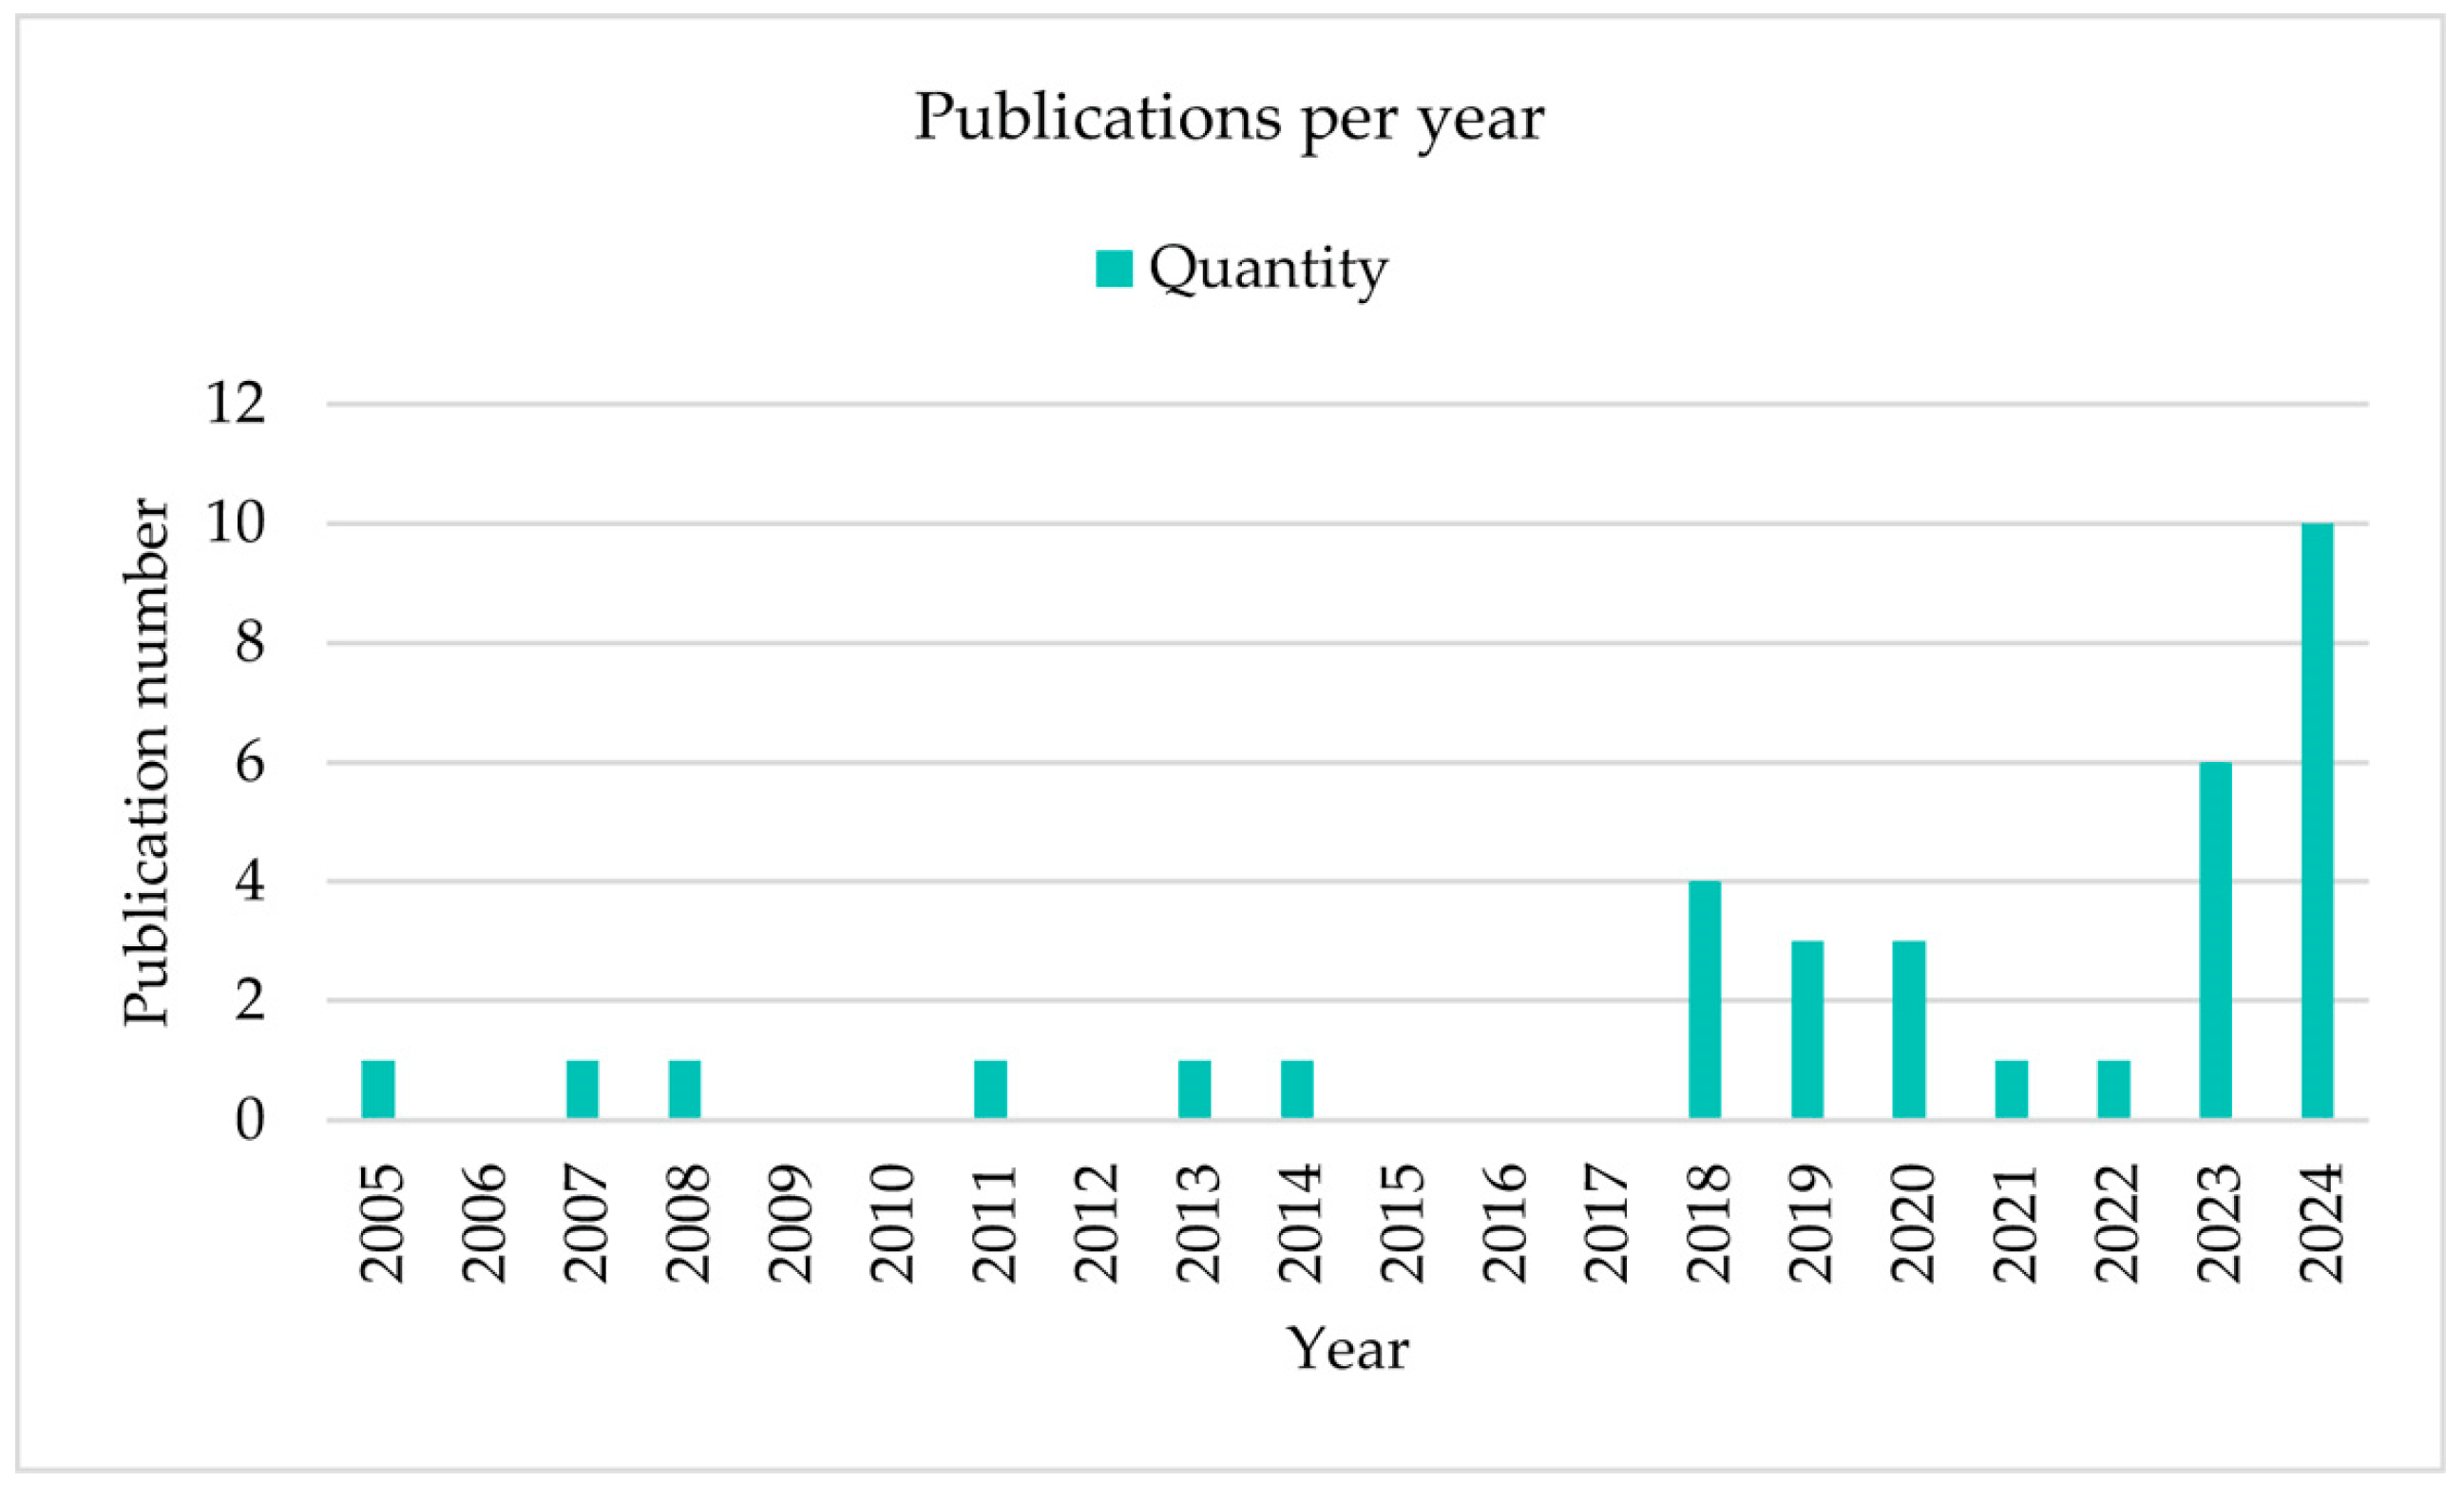
Figure 28 presents the number of additional publications per year in the last 20 years. This figure clearly illustrates that the majority of the additional publications included in this review are recent, with 60% of them being published within the last five years. As a result, the new word cloud can serve as a valuable tool for identifying words that emerged in the second group of publications—words that were either absent or less prominent in the first group of publications. Therefore, it provides insight into which topics increased in emphasis, helping us discern current trends in the XGD field.
The most common terms and their weighted percentage in this word cloud are design (1.65%), space (0.67%), useful (0.66%), experience (0.55%), and environmental (0.50%). As anticipated, design has reclaimed its position in first place. However, it is notable that the term “experience” has gained more prominence, surpassing “environmental”. This shift may indicate a growing acceptance of the term experiential graphic design (XGD) among researchers and practitioners, along with the opportunities and challenges it brings. While the focus of earlier publications was primarily on traditional environmental graphics, more recent studies explore the use of new technologies to deliver content through dynamic experiences across various spaces.
Further word analysis involved a comparison of the hundred most frequent terms, as shown in Figure 5 and Figure 27. While some terms appear in both figures, it is clear that the focus of the research is gradually shifting away from well-established topics such as wayfinding, direction, guiding, urbanization, city, and identity. Instead, greater emphasis is now placed on people, users, visitors, and participants, with a central focus on their experiences. Moreover, terms that were almost invisible in Figure 5 gain greater significance in Figure 27, appearing among the fifty most frequent terms. These include interactivity, technology, education, display, and sustainability. Additionally, new terms, like digital, virtual, innovative, immersive, science, knowledge, evaluation, media, durability, reality, engaging, screen, computing, and engineering, which were previously absent, are now emerging. Therefore, experiential graphic design is ready for a significant transformation, driven by technological innovations, growing sustainability concerns, and rising user expectations. This progress will, hopefully, be supported by more comprehensive design and engineering education, with a stronger focus on multidisciplinary thinking and sustainability.
Another noteworthy shift observed in Figure 27 is the reduced emphasis on traditional design disciplines such as graphic, interior, and architectural design. As the field of experiential graphic design continues to evolve, the boundaries between design disciplines like graphic design, architecture, and interior design are becoming increasingly blurred [6,16]. By embracing the synergy between these disciplines and many others, designers can transform ordinary spaces into unique, user-centered experiences. These spaces can be visually stunning but also engage multiple senses, offering interactivity, education, and the seamless integration of branding and storytelling, creating a truly holistic and impactful experience.

5.2. Emerging Technologies in the Design and Manufacturing of XGD

Advancements in the fabrication processes and manufacturing capabilities for more traditional XGD products, such as signs, totems, posters, wrap foils, and decals, remain important for the XGD industry. Using enhanced production techniques and production facilities, along with an almost limitless variety of materials, patterns, and colors, it is now possible to create fresh, unique products with intricate details and exceptional quality. In some cases, artificial intelligence (AI) technologies are also being introduced to improve precision, reduce material waste, and optimize certain stages of the manufacturing process. AI systems can assist in predicting a material’s performance, durability, and environmental impact, enabling more informed material choices and real-time monitoring. However, the high initial implementation costs and limited awareness of AI’s potential benefits still present challenges in its broader adoption within manufacturing processes in the XGD industry [99,100].
Nevertheless, the primary technological innovations in the field of XGD are currently focused on immersive technologies and their integration into the creation of interactive experiences. Virtual reality (VR), augmented reality (AR), and mixed reality (MR) will become integral components of XGD. With the seamless integration of these technologies into physical spaces, technology is moving towards hands-free experiences that deliver unparalleled levels of interaction [101,102]. In addition, the XGD field is experiencing a revolutionary change as AI becomes integrated into the design processes, tools, and outcomes.
At the level of design processes, designers working in XGD, whether creating museum exhibitions, branded environments, or public wayfinding systems, traditionally follow a series of steps: research, concept development, prototyping, and evaluation [103]. With the integration of AI, many of these steps can be simplified and enhanced. For example, when designing a wayfinding system for a large public facility such as a hospital or university campus, AI can assist in generating initial sign placement strategies based on factors like visitor demographics, accessibility standards, and spatial complexity. It can analyze movement data, such as common navigation errors or dwell times, collected using sensors and tracking technologies, to identify areas where users are most likely to need wayfinding guidelines [104,105,106]. Instead of relying solely on physical prototyping or post-installation observation, AI-based simulation tools can predict how different user groups will interact with the signage system in virtual replicas of the physical space, where confusion might occur, and how information hierarchy can be adjusted to improve clarity and orientation [107,108].
AI is also becoming an integral part of the XGD designer tools. Design platforms such as Adobe Photoshop, Adobe Illustrator, Figma, Rhino, and various CAD systems now have incorporated AI-powered features that enhance creative and technical workflows. In addition to these integrated tools, there is also a growing number of AI-driven online platforms, such as Adobe Firefly, MidJourney, Khroma, Designs.ai, Stable Diffusion, or OpenArt. These tools can automatically enhance images, generate visual content (e.g., Figure 14, Adobe Firefly), suggest layouts, color palettes, and typography, and produce numerous design variations tailored to specific audiences. When designing experiential graphic design (XGD) products for branded retail environments, effective collaboration among XGD designers, architects, and interior designers is essential. AI technologies can enhance this process by enabling seamless data sharing and real-time collaboration, as some of these tools support iterative design workflows, allowing teams to explore a wider range of options more efficiently and respond more effectively to client feedback [100,103,109,110,111,112,113].
When it comes to design outcomes, AI can help generate personalized, adaptive, and context-aware solutions [102,109,111,114]. For example, when creating a museum exhibition, personalized content can be created based on a visitor’s language, age, or interests, displaying different narratives or graphic sequences depending on who is present [104,114]. Augmented reality further enhances this by enabling immersive, real-time experiences that blend digital content with the physical exhibition environment. Through AR, museums can adjust the information shown to each visitor, such as providing age-appropriate animations, translations, or interest-based visual content, helping visitors to connect more deeply with what they see while preserving the authenticity of the original artifacts. This synergy between AI and AR supports more inclusive, informative, and memorable museum experiences for diverse audiences, while also helping them better understand and remember the information presented [115,116,117].
Despite significant advancements, the integration of AI into XGD, as in other design disciplines, presents numerous challenges, with concerns about originality, cultural and emotional sensitivity, the preservation of human creativity, and the implementation cost. Addressing these issues requires not only clearly defined evaluation criteria for AI-generated content, but also educational frameworks that promote ethical and social responsibility, privacy protection, data usage transparency, critical thinking, and visual literacy. Such an education should develop students’ ability to shape AI outputs through developing techniques and storytelling methods, enabling them to act as creative content creators at the intersection of science, art, and technology [100,103,104,109,110,111,113,114]. As AI technologies continue to evolve, designers and manufacturers will be inspired by AI-generated concepts, pushing the boundaries of creativity. In this context, XGD designers may begin to act more as curators than makers, guiding machine intelligence toward outcomes that are functional, memorable, inclusive, and user-centered, while still relying on human judgment and manual refinement [109,110,111].

5.3. Challenges in Experiential Graphic Design Education

The absence of dedicated academic programs for experiential graphic design forces aspiring designers to rely on self-directed learning or multidisciplinary experiences to acquire relevant skills. Designers in this field often come from diverse disciplines, entering through hands-on experience and interdisciplinary collaboration. This lack of specialized education highlights the urgent need for a shift in how future XGD professionals are trained. It emphasizes the necessity of developing educational frameworks specifically tailored to the unique demands of XGD [25,118,119].
An effective curriculum for XGD education should offer a comprehensive learning experience that blends theoretical knowledge, practical skills, and an understanding of emerging trends. Foundational courses should introduce designers to basic graphic design principles, the core concepts of visual communication, and spatial awareness through the basics of architecture and interior design. These courses would equip students with the ability to understand how graphic design interacts with physical spaces. Environmental psychology, a crucial aspect of experiential design, would provide students with insights into how physical environments influence human behavior. As students progress to more specialized courses, they should delve into topics such as wayfinding systems, interactive media, narrative design, and user engagement, learning how to craft immersive environments that resonate with users. A course on materials and fabrication processes would allow students to explore essential materials, understand their properties, and make sustainable and functional design choices. The curriculum should also encompass subjects such as perception, cultural semiotics, critical media analysis, and data visualization to broaden students’ understanding of how design communicates meaning and interacts with its audience. In addition to theoretical learning, students should be encouraged to apply their knowledge in real-world scenarios through internships and collaborations across various design disciplines. To stay ahead of technological advancements, courses should include the integration of AR/VR and other emerging technologies, ensuring students are well-prepared for the future of XGD. Education in sustainable design practices should be considered equally important, teaching students how to minimize environmental impact through eco-friendly materials and processes.

5.4. Sustainability in XGD

As in any other design discipline, in the XGD field, educational institutions, organizations, and professional societies should integrate sustainability principles into their core curricula and actively promote them within the industry, shaping future practices and inspiring positive change.
Sometimes, sustainability is misinterpreted as material durability. While durable materials stand up to traffic, weather conditions, and cleaning without degrading, this does not make them sustainable. Additionally, materials can be sustainable through requiring less replacement and thus producing less waste, but not automatically eco-friendly. Sustainability in design requires careful consideration of the environmental and social impacts throughout a product’s lifecycle, from raw material extraction to disposal and recycling. Designers should prioritize reducing resource consumption, minimizing waste and pollution, and improving energy efficiency [75,77,120,121].
As awareness of environmental issues grows, the need to integrate sustainability into design practices has become increasingly important. A key approach is systems thinking, which encourages a holistic perspective of design, considering the sourcing of materials, the production methods, and the societal impact. Some of the key strategies include using recycled materials, choosing low-carbon options, reducing material usage, and considering circularity in the lifecycle of materials [75,122]. Ethical responsibility also plays a crucial role, as design influences social values, behaviors, and norms. Sustainable design practices aim to balance esthetics, functionality, and environmental responsibility while promoting awareness and inspiring action toward sustainability. Currently, the most used methods for making objective sustainability choices are life-cycle analysis (LCA) and environmental cost indicators (ECI) [75,123,124]. In addition, a recent concept in the field of sustainable development, The Environmental, Social, and Governance framework (ESG), is a globally recognized approach to sustainable development and responsible investing. It addresses environmental impact, social responsibility, and corporate governance, helping organizations operate responsibly in aspects other than their financial performance. Traditionally, design often prioritizes client needs or esthetic goals at the expense of the broader public interest when these priorities conflict. However, by applying the ESG framework, XGD designers could integrate sustainable materials, promote inclusivity and accessibility, and ensure transparency throughout the design process. By doing so, they can create impactful physical spaces aligned with responsible business values and sustainability goals, enhancing clients’ brand reputation and increasing user engagement through ethical and human-centered design [125,126]. Several factors contribute to sustainable decision-making, including design choices, material selection, and management strategies. Prioritizing sustainable concepts, optimizing supply chains, and implementing eco-friendly production methods can drive positive change. While technologies like digital printing and biodegradable materials may seem secondary, they remain essential in achieving long-term sustainability goals [121].
Sustainability can be expensive, often requiring a large initial investment, but as sustainable innovations continue to evolve, more cost-effective solutions will emerge, especially in the wayfinding and signage areas of the XGD field [127]. The experiential graphic design industry has the power to visually shape the landscape of our world, and by embracing sustainable practices, XGD can contribute to creating a more responsible and environmentally conscious future [120].

6. Conclusions

While writing this review, the authors observed that, despite the term “experiential graphic design” being in use for a decade, researchers still predominantly rely on the older term “environmental graphic design”. This is understandable, given that “environmental graphic design” has long been used to describe graphics within built environments, such as large-scale graphics, signage, and dimensional typography. However, it is recommended that both professionals and researchers adopt the term “experiential graphic design” instead, as this better represents the current scope and future direction of the field. Furthermore, as sustainability has become a key focus across various industries, the term “environmental” is most often associated with eco-friendly practices, which can cause confusion and misinterpretation among clients and various stakeholders within the field. Additionally, the authors suggest shifting the focus in experiential graphic design (XGD) from the constant emphasis on its multidisciplinary nature to place greater emphasis on its interdisciplinary approach. While multidisciplinary involves different disciplines working alongside each other without necessarily integrating their methods, interdisciplinary collaboration fosters the integration of diverse expertise to solve complex challenges, resulting in more cohesive and innovative design outcomes. By working together rather than opposing one another, designers can craft unified experiences that are not only functional, informative, and visually compelling but also emotionally impactful, inspiring, and integrating. For example, architects can gain insights into visual communication from graphic design, graphic designers can enhance their spatial awareness through architecture, and industrial designers can apply their expertise to the selection of materials and fabrication.
The establishment of specialized educational frameworks in the field of XGD would not only equip future professionals with the technical skills required to produce XGD products and select appropriate materials and techniques, but also with the creative flexibility essential for thriving in this dynamic field. Given the current lack of high-quality academic publications and formal training pathways in XGD, this review aims not only to synthesize existing research but also to promote interdisciplinary collaboration and stimulate further scholarly engagement within the field. Moreover, encouraging communication and collaboration among community scholars across diverse design disciplines could strengthen the impact of XGD, presenting fresh, unique, and unexpected design solutions and innovative techniques, and introducing new technologies to the field. In addition, as AI continues to evolve, its impact on XGD is likely to grow, with AI not replacing human creativity but enhancing it and empowering designers to create more informative, inspiring, and integrating experiences within physical spaces.
We are constantly exposed to a steady stream of information and visual and sensory stimuli that shape our environment and affect how we feel. To curate and elevate the experience people have within various physical spaces, XGD practitioners should thoughtfully assess which spaces would truly benefit from specific XGD products, understanding that not every place requires or can accommodate such design interventions. Designers with limited experience usually seek to use the most advanced technologies, but for some XGD applications, advanced technology may not be necessary. For example, in wayfinding, even though digital wayfinding solutions or mobile devices offer the potential for enhanced navigation, physical signs will never disappear because they do not require a signal or battery to help us find our way in a space. To avoid visual pollution caused by excessive, disorganized, or poorly integrated visual elements within a space, designers should be focused on simplicity, align a design with its context, create a visual hierarchy, use technology responsibly, prioritize quality over quantity, and always keep sustainability in mind.
While this study primarily focuses on XGD implementation in open public spaces and enclosed architectural environments, where its impact is currently most prominent, the scope could be expanded by exploring XGD’s role in smaller-scale spatial contexts. Further investigations might examine how regional and cultural contexts shape XGD practices, highlighting both local distinctions and widespread trends as well as the integration of AI and AR technologies in real-world projects to evaluate their effects on user experience and the design process from technical and experiential perspectives. Moreover, attention could be given to how educational frameworks provide XGD designers with essential conceptual and technical skills and strategies for incorporating sustainable materials and practices. Complementing the literature reviews, case studies and surveys engaging professionals from XGD and related fields through interviews would provide valuable insights into the current practices, challenges, and perspectives of the future.

Author Contributions

Conceptualization, G.P. and A.K.C.; methodology, G.P. and S.P.P.; software, G.P., A.K.C. and S.P.P.; validation, G.P., A.K.C. and S.P.P.; formal analysis, G.P., A.K.C. and S.P.P.; investigation, G.P.; resources, G.P. and S.P.P.; data curation, G.P., A.K.C. and S.P.P.; writing—original draft preparation, G.P.; writing—review and editing, G.P. and S.P.P.; visualization, G.P. and A.K.C.; supervision, G.P. and S.P.P.; project administration, G.P. and S.P.P.; funding acquisition, G.P. and S.P.P. All authors have read and agreed to the published version of the manuscript.

Funding

This research received no external funding.

Conflicts of Interest

Author Anamarija Kozjan Cindrić was employed by the Unconditional Ltd. The remaining authors declare that the research was conducted in the absence of any commercial or financial relationships that could be construed as a potential conflict of interest.

Abbreviations

The following abbreviations are used in this manuscript:
AHPAnalytic Hierarchy Process
AIArtificial Intelligence
ARAugmented Reality
COVID-19Coronavirus Disease 2019
DNADeoxyribonucleic Acid
ECIEnvironmental Cost Indicators
EGDEnvironmental Graphic Design
ESGEnvironmental, Social, and Governance Framework
ISAInternational Sign Association
JBRJumeirah Beach Residence
LCALife Cycle Analysis
LCDLiquid Crystal Display
LEDLight-Emitting Diode
LRVLight Reflectance Value
MRMixed Reality
POSPoint of Sale
PRISMAPreferred Reporting Items for Systematic Reviews and Meta-Analyses
RQResearch Question
SBESubjective Beauty Evaluation
SEGDSociety of Experiential Graphic Design
UIUser Interface
UXUser Experience
VRVirtual Reality
XGDExperiential Graphic Design

References

  1. Calori, C.; Vanden-Eynden, D. Signage and Wayfinding Design, 2nd ed.; John Wiley & Sons, Inc.: Hoboken, NJ, USA, 2015; ISBN 978-1-118-69299-8. [Google Scholar]
  2. Zhang, J.; Liu, X.; Feng, Z.; Feng, X. Research on the Influencing Factors of Art Intervention in the Environmental Graphics of Rural Cultural Tourism Space. Land 2024, 13, 1680. [Google Scholar] [CrossRef]
  3. Bosque. Graphic and Branding Experiences for Spaces [Online Course]. Domestika. 2025. Available online: https://www.domestika.org/en/courses/945-graphic-and-branding-experiences-for-spaces (accessed on 22 April 2025).
  4. Li, Y. Construction of a Platform for Displaying Dialectalized Graphic Design Based on Virtual Reality Technology. Appl. Math. Nonlinear Sci. 2024, 9, 16. [Google Scholar] [CrossRef]
  5. Cornish, K.; Goodman-Deane, J.; Ruggeri, K.; John Clarkson, P. Visual Accessibility in Graphic Design: A Client-Designer Communication Failure. Des. Stud. 2015, 40, 176–195. [Google Scholar] [CrossRef]
  6. Lloyd-Esenkaya, T.; Lloyd-Esenkaya, V.; O’Neill, E.; Proulx, M.J. Multisensory Inclusive Design with Sensory Substitution. Cogn. Res. Princ. Implic. 2020, 5, 37. [Google Scholar] [CrossRef]
  7. Boucherit, S.; Maffei, L.; Masullo, M.; Berkouk, D.; Bouzir, T.A.K. Assessment of Sighted and Visually Impaired Users to the Physical and Perceptual Dimensions of an Oasis Settlement Urban Park. Sustainability 2023, 15, 7014. [Google Scholar] [CrossRef]
  8. Spina, C. Accessible and Engaging Graphic Design. Public Serv. Q. 2020, 16, 194–199. [Google Scholar] [CrossRef]
  9. Gupta, R. Perceiving Sequences and Layouts Through. In Proceedings of the 13th International Conference on Human Haptic Sensing and Touch Enabled Computer Applications, Hamburg, Germany, 22–25 May 2022; Seifi, H., Kappers, A.M.L., Schneider, O., Drewing, K., Pacchierotti, C., Abbasimoshaei, A., Huisman, G., Kern, T.A., Eds.; Springer: Hamburg, Germany, 2022. [Google Scholar]
  10. Hoffart, K. How Digital Technology Is Changing Interactive Displays at Museum & Interpretive Centres. Available online: https://exhibitstudio.ca/resources/blog/museum-and-interpretive-displays-digital-technology/ (accessed on 21 May 2025).
  11. Eshaghzadeh Torbati, H. The Role of Environmental Graphic in the Identification of Urban Public Spaces. Civ. Eng. J. 2018, 4, 1949–1954. [Google Scholar] [CrossRef]
  12. Atamaz, E. The Role of Graphic Design For Supplying Proper Space Image and Healing Communication Between People and Residential Environments. In Proceedings of the 3rd International Environment and Design Congress, İstanbul, Turkey, 11–12 December 2014; Bahcesehir University: Istanbul, Turkey, 2014. [Google Scholar]
  13. Poulin, R. Graphic Design + Architecture a 20th-Century History, 1st ed.; Rockport Publishers: Beverly, MA, USA, 2012; ISBN 978-1-59253-779-2. [Google Scholar]
  14. Ganoti, R.; Laskari, I. The Importance of Environmental Graphic Design in Urban Spaces. In Proceedings of the 4th International Conference on Environmental Design, Athens, Greece, 20–22 October 2023; EDP Sciences: Athens, Greece, 2023; Volume 436. [Google Scholar]
  15. Society of Experiential Graphic Design. 50 Years of Experience Design. Available online: https://segd.org/about/50-years-of-experience-design/ (accessed on 20 January 2025).
  16. Society of Experiential Graphic Design. What Is Experience Design? Available online: https://segd.org/about/what-is-experience-design/ (accessed on 20 January 2025).
  17. International Sign Association. About International Sign Association. Available online: https://signs.org/about/ (accessed on 10 January 2025).
  18. Walker, S. Research in Graphic Design. Des. J. 2017, 20, 549–559. [Google Scholar] [CrossRef]
  19. Liu, X.; Zhang, J.; Zhou, Z.; Feng, Z. Investigating the Impact of Environmental Graphics on Local Culture in Sustainable Rural Cultural Tourism Spaces. Sustainability 2023, 15, 10207. [Google Scholar] [CrossRef]
  20. Stotz, A. What Is Environmental Graphic Design? Available online: https://interiorarchitects.com/what-is-environmental-graphic-design/ (accessed on 21 January 2025).
  21. Shen, J.; Ling, S. The Construction of Visual Aesthetic Element System in Graphic Design Based on Big Data. Appl. Math. Nonlinear Sci. 2024, 9, 16. [Google Scholar] [CrossRef]
  22. Kanat, S. The Perceptions of Graphic Design Concept on Students Study on Graphic Design. J. Educ. Train. Stud. 2019, 7, 65–75. [Google Scholar] [CrossRef]
  23. Oladumiye, E.B. Graphic Design Theory Research and Application in Packaging Technology. Art Des. Rev. 2018, 6, 29–42. [Google Scholar] [CrossRef]
  24. Youjian, W.; Abdul Ghani, D. The Chinese Traditional Cultural Graphic Elements in Modern Graphic Design. Int. J. Acad. Res. Bus. Soc. Sci. 2023, 13, 458–470. [Google Scholar] [CrossRef]
  25. Awad, E.A.; Woodcock, A.; Super, K. Development of a Curriculum for Expanded Sign Design Practice. In Proceedings of the 7th International Technology, Education and Development Conference, Valencia, Spain, 4–6 March 2013; IATED: Valencia, Spain, 2013. [Google Scholar]
  26. Aziz, M.A.; Syahril Iskandar, M. Analysis of Environmental Graphic Design in the Interior of the Pondok Indah Hospital Pediatric Clinic. ARTic 2023, 5, 499–511. [Google Scholar] [CrossRef]
  27. Page, M.J.; McKenzie, J.E.; Bossuyt, P.M.; Boutron, I.; Hoffmann, T.C.; Mulrow, C.D.; Shamseer, L.; Tetzlaff, J.M.; Akl, E.A.; Brennan, S.E.; et al. The PRISMA 2020 Statement: An Updated Guideline for Reporting Systematic Reviews. BMJ 2021, 372, 71. [Google Scholar] [CrossRef]
  28. Halevi, G.; Moed, H.; Bar-Ilan, J. Suitability of Google Scholar as a Source of Scientific Information and as a Source of Data for Scientific Evaluation—Review of the Literature. J. Informetr. 2017, 11, 823–834. [Google Scholar] [CrossRef]
  29. Walters, W.H. Google Scholar Coverage of a Multidisciplinary Field. Inf. Process. Manag. 2007, 43, 1121–1132. [Google Scholar] [CrossRef]
  30. Atamaz, E. Environmental Graphic Design for Building Information Systems. Eurasian J. Biosci. 2019, 13, 2271–2278. [Google Scholar]
  31. Puttipakorn, P.; Upala, P. Comparative Analysis of Environmental Graphic Design for Wayfinding on the Exit Patterns of Mass Transit Stations. Open Transp. J. 2018, 12, 150–166. [Google Scholar] [CrossRef]
  32. Utoyo, A.W.; Thin, S. Study of Environmental Graphic Design Signage MRT Station Blok M. In Innovative Technologies in Intelligent Systems and Industrial Applications; Mukhopadhyay, S.C., Senanayake, S.N.A., Withana, P.C., Eds.; Springer: Cham, Switzerland, 2023; pp. 891–900. [Google Scholar]
  33. Hananto, B.A.; Calista, H.; Kusuma, S.; Leoni, V. A Design Case: Identification, Analysis, and Redesign Simulation for Scientia Square Park’s Environmental Graphic Design. Int. J. Des. 2022, 2, 37–52. [Google Scholar]
  34. Talebzadeh, A.; Nowghabi, A.S. The Visual Effects of Store’s Signage Displays in Urban Landscape. Civ. Eng. J. 2019, 5, 191–199. [Google Scholar] [CrossRef]
  35. Bubric, K.; Harvey, G.; Pitamber, T. A User-Centered Approach to Evaluating Wayfinding Systems in Healthcare. Health Environ. Res. Des. J. 2021, 14, 19–30. [Google Scholar] [CrossRef] [PubMed]
  36. Harper, C.; Jefferies, S.; Crosser, A.; Avera, A.; Duke, T.; Klisans, D.V. Exploring Hospital Wayfinding Systems: Touchscreen Kiosks, Apps and Environmental Cues. In Proceedings of the Internationa Symposium on Human Factors and Ergonomics in Health Care, Chicago, IL, USA, 24–27 March 2019; HFES: Chicago, IL, USA, 2019. [Google Scholar]
  37. Li, W.; Ma, S.; Liu, Y.; Lin, H.; Lv, H.; Shi, W.; Ao, J. Environmental Therapy: Interface Design Strategies for Color Graphics to Assist Navigational Tasks in Patients with Visuospatial Disorders through an Analytic Hierarchy Process Based on CIE Color Perception. Front. Psychol. 2024, 15, 1348023. [Google Scholar] [CrossRef]
  38. Dwiputri, A.; Swasty, W. Color Coding and Thematic Environmental Graphic Design in Hermina Children’s Hospital. J. Vis. Art Des. 2019, 11, 35–44. [Google Scholar] [CrossRef]
  39. Gbr, B.A.A.; Soliman, M.M.M.A. Kinetic Environmental Graphic Design and Its Impact on the Interactive Interior Space of University Educational Environments. In Proceedings of the 4th Barcelona Conference on Education 2023, Barcelona, Spain, 19–23 September 2023; IAFOR: Barcelona, Spain, 2023. [Google Scholar]
  40. Bigat, E.Ç. Exploring Guidance and Signing Systems in Environmental Graphic Design as Informational Design: A Study Using Graphic Design Examples. In Proceedings of the 12th International Symposium on Graphic Engineering and Design, Novi Sad, Serbia, 14–16 November 2024; University of Novi Sad—Faculty of Technical Sciences, Department of Graphic Engineering and Design: Novi Sad, Serbia, 2024. [Google Scholar]
  41. Alansari, A. Wayfinding Implementations: An Evidence-Based Design Approach to Redesign College Building. Int. Des. J. 2022, 12, 69–75. [Google Scholar] [CrossRef]
  42. Atamaz-Daut, E.; Ergun, E. Graphic Design Applications for Spatial Imagery and Examples from a Nursery School. Eurasia J. Math. Sci. Technol. Educ. 2018, 14, 947–957. [Google Scholar] [CrossRef]
  43. Jęczmyk, A.; Uglis, J.; Zawadka, J.; Pietrzak-Zawadka, J.; Wojcieszak-Zbierska, M.M.; Kozera-Kowalska, M. Impact of COVID-19 Pandemic on Tourist Travel Risk Perception and Travel Behaviour: A Case Study of Poland. Int. J. Environ. Res. Public Health 2023, 20, 5545. [Google Scholar] [CrossRef]
  44. Setiawan, A.; Khamadi, K. Environmental Graphics in Strengthening the Branding of Jepara Carving City. Gelar J. Seni Budaya 2024, 22, 1–8. [Google Scholar] [CrossRef]
  45. Wu, J. Research on the Combination of UI and Graphic Design in Museums in the Digital Age. Trans. Soc. Sci. Educ. Humanit. Res. 2024, 7, 366–370. [Google Scholar] [CrossRef]
  46. Zhang, Z.; Lu, J.; Zhang, X. Emotionally-Oriented Design in Museums: A Case Study of the Jewish Museum Berlin. Front. Psychol. 2024, 15, 1423466. [Google Scholar] [CrossRef]
  47. Calista, H.; Hananto, B.A.; Maradhona, A.; Wijaya, S. Signage & Wayfinding Design For The Indonesian National Library. J. Bhs. Rupa 2020, 3, 43–57. [Google Scholar]
  48. Nestel, C. Designing an Experience: Maps and Signs at the Archaeological Site of Ancient Troy. Cartogr. Perspect. 2019, 94, 25–47. [Google Scholar] [CrossRef]
  49. Yauwerissa, E.C.; Kusumowidagdo, A. Environmental Graphic Design in Commercial Interior The Case of Pakuwon-Supermal Surabaya. Serat Rupa J. Des. 2025, 9, 101–120. [Google Scholar] [CrossRef]
  50. Roux, T. Users’ Experience of Digital Wayfinding Screens: A Uses and Gratification Perspective from South Africa. Adv. Hum.-Comput. Interact. 2020, 2020, 7636150. [Google Scholar] [CrossRef]
  51. Fontaine, L.; Bradbury, S.L. Providing Brand Guidance for Independent Businesses:A Supplement to District Signage Standards. Interdiscip. J. Signage Wayfinding 2018, 2, 6–33. [Google Scholar] [CrossRef]
  52. Zhang, S.; Park, S. Study of Effective Corridor Design to Improve Wayfinding in Underground Malls. Front. Psychol. 2021, 12, 631531. [Google Scholar] [CrossRef]
  53. Rodrigues, R.; Coelho, R.; Tavares, J.M.R.S. Healthcare Signage Design: A Review on Recommendations for Effective Signing Systems. Health Environ. Res. Des. J. 2019, 12, 45–65. [Google Scholar] [CrossRef]
  54. Economou, M.; Young, H.; Sosnowska, E. Evaluating Emotional Engagement in Digital Stories for Interpreting the Past. The Case of the Hunterian Museum’s Antonine Wall EMOTIVE Experiences. In Proceedings of the 3rd Digital Heritage International Congress, San Francisco, CA, USA, 26–30 October 2018; Institute of Electrical and Electronics Engineers Inc.: San Francisco, CA, USA, 2018. [Google Scholar]
  55. Suroya, S.H.; Torrens, G.E.; Downs, S.T. Font Matters: Investigating the Typographical Components of Legibility. Int. J. Res. Innov. Soc. Sci. 2024, 8, 3368–3379. [Google Scholar] [CrossRef]
  56. Iftikhar, H.; Asghar, S.; Luximon, Y. A Cross-Cultural Investigation of Design and Visual Preference of Signage Information from Hong Kong and Pakistan. J. Navig. 2021, 74, 360–378. [Google Scholar] [CrossRef]
  57. Pour, M.H. Investigating Aesthetic Components of Environmental Graphics of Iran Birds Garden. Ukr. J. Ecol. 2018, 8, 181–190. [Google Scholar]
  58. Park, H.; Dixit, M.K.; Pariafsai, F. Towards Personally Relevant Navigation: The Differential Effects of Cognitive Style and Map Orientation on Spatial Knowledge Development. Appl. Sci. 2024, 14, 4012. [Google Scholar] [CrossRef]
  59. Kopec, D. Environmental Psychology for Design, 1st ed.; Fairchild Publisher: New York, NY, USA, 2006; ISBN 9781501316852. [Google Scholar]
  60. ASI Signage. LRV Calculator. Available online: https://old.asisignage.com/doc-resource/lrv-calculator/ (accessed on 15 February 2025).
  61. HealthShare NSW. Wayfinding for Healthcare Facilities; HealthShare: Sydney, New South Wales, Australia, 2022. [Google Scholar]
  62. Howett, G.L. Size of Letters Required for Visibility as a Function of Viewing Distance and Observer Visual Acuity; National Institute of Standards and Technology: Gaithersburg, MD, USA, 1983. [Google Scholar]
  63. Treasury Board of Canada Secretariat. Viewing Distance and Character Size. Available online: https://www.tbs-sct.canada.ca/fip-pcim/images/man/4-3_tbl02-450w-eng.html (accessed on 15 February 2025).
  64. Graphic Solutions Group. How Viewing Distance Affects Font Size. Available online: https://www.gsghome.com/blog-post/how-viewing-distance-affects-font-size/ (accessed on 24 February 2025).
  65. Rousek, J.B.; Hallbeck, M.S. Improving and Analyzing Signage within a Healthcare Setting. Appl. Ergon. 2011, 42, 771–784. [Google Scholar] [CrossRef] [PubMed]
  66. Basri, A.Q.; Sulaiman, R. Ergonomics Study of Public Hospital Signage. Adv. Eng. Forum 2013, 10, 263–271. [Google Scholar] [CrossRef]
  67. Riemer-Reiss Marti, L.; Wacker Robbyn, R. Factors Associated with Assistive Technology Discontinuance among Individuals with Disabilities. J. Rehabil. 2020, 3, 44–50. [Google Scholar]
  68. Wolke, L. Digital Trends in EGD. In Signage and Wayfinding Design; Calori, C., Vanden-Eynden, D., Eds.; John Wiley & Sons, Inc.: Hoboken, NJ, USA, 2015; pp. 242–243. [Google Scholar]
  69. Sawyer, B.D.; Dobres, J.; Chahine, N.; Reimer, B. The Great Typography Bake-off: Comparing Legibility at-a-Glance. Ergonomics 2020, 63, 391–398. [Google Scholar] [CrossRef]
  70. Conquest Creatives Navigating the Future: The Rise of Wayfinding Application in Urban Exploration. Available online: https://conquestcreatives.com/wayfinding-application-software/ (accessed on 21 May 2025).
  71. Vi, P.T.; Mishra, S.; Van Tanh, N. User Interface Design and Usability in Information Systems. In Creative Approaches Towards Development of Computing and Multidisciplinary IT Solutions for Society; Bijalwan, A., Bennett, R., Jyotsna, G., Mohanty, S.N., Eds.; Wiley: Hoboken, NJ, USA, 2024; pp. 359–372. [Google Scholar]
  72. Paun, G. Contextual Design: The Cornerstone of Visual Communications. Available online: https://artversion.com/blog/contextual-design-the-heart-of-visual-communication/ (accessed on 20 March 2025).
  73. Holtzblatt, K.; Beyer, H. Introduction. In Contextual Design: Design for Life; Holtzblatt, K., Beyer, H., Eds.; Elsevier: Cambridge, MA, USA, 2017; pp. 3–29. [Google Scholar]
  74. Jeffrey, C. Wayfinding Perspectives: Static and Digital Wayfinding Systems—Can a Wayfinding Symbiosis Be Achieved? In Information Design: Research and Practice; Black, A., Luna, P., Lund, O., Walker, S., Eds.; Routledge: London, UK, 2017; pp. 509–526. [Google Scholar]
  75. Wolters, B. Ten Steps to Sustainable Branding in Signage and Wayfinding. Available online: https://vim-group.com/insights/ten-steps-to-sustainable-branding-in-signage-and-wayfinding (accessed on 22 March 2025).
  76. Alahira, J.; Andrew Olu-, K. Sustainable Materials and Methods in Industrial Design: Bridging the Gap with Fine Arts and Graphic Design for Environmental Innovation. Eng. Sci. Technol. J. 2024, 5, 774–782. [Google Scholar] [CrossRef]
  77. Mesa, J.A.; Gonzalez-Quiroga, A.; Aguiar, M.F.; Jugend, D. Linking Product Design and Durability: A Review and Research Agenda. Heliyon 2022, 8, e10734. [Google Scholar] [CrossRef]
  78. Joseph, E. The Place of a Graphic Designer in Environmental Sustainability. Int. J. Eng. Appl. Sci. Technol. 2019, 4, 251–257. [Google Scholar]
  79. Richardson, J. Blurring the Lines: The Power of Branding in Architecture and Interior Design. Available online: https://www.littleonline.com/insights/blurring-the-lines-the-power-of-branding-in-architecture-and-interior-design/ (accessed on 1 March 2025).
  80. Napiane, M. The Power of Immersive Brand Experiences. Available online: https://www.linkedin.com/pulse/power-immersive-brand-experiences-martin-napiane (accessed on 1 March 2025).
  81. Ho, A. Exploring Emotional Impact in Interactive Digital Art. In Proceedings of the 3rd International Conference on Art Design and Digital Technology, Luoyang, China, 24–26 May 2024; EAI: Luoyang, China, 2024. [Google Scholar]
  82. PlayBook. Experiential Graphic Design: How to Blend Art, Space, and Storytelling. Available online: https://www.playbook.com/blog/experiential-graphic-design/ (accessed on 1 March 2025).
  83. Gao, J. Research on Interaction Design of Immersive Exhibition Space. Media Commun. Res. 2023, 4, 51–61. [Google Scholar] [CrossRef]
  84. Fabianski, A. What Is Experiential Graphic Design? 5 Must-See Examples. Available online: https://www.bridgewaterstudio.net/blog/what-is-experiential-graphic-design-5-must-see-examples (accessed on 15 March 2025).
  85. Brieber, D.; Nadal, M.; Leder, H.; Rosenberg, R. Art in Time and Space: Context Modulates the Relation between Art Experience and Viewing Time. PLoS ONE 2014, 9, e99019. [Google Scholar] [CrossRef]
  86. Mahboubeh, M.M. Semiotics of Environmental Graphics in the Appearance of the Place in Urban Advertising. Turk. Online J. Des. Art Commun. 2016, 6, 792–806. [Google Scholar] [CrossRef] [PubMed]
  87. Repina, E.; Sopin, N. Trends in Organisation of Interactive Exhibition Spaces. A Modern Example of Revising the Interaction of the Exhibition Space and the Visitor. In Proceedings of the International Scientific and Practical Symposium—The Future of the Construction Industry: Challenges and Development Prospects, Moscow, Russia, 18–22 September 2023; EDP Sciences: Moscow, Russia, 2023; Volume 457. [Google Scholar]
  88. Wang, J. Research on Interactive Exhibition Design in Art Museums Based on Audience Participation. J. Humanit. Arts Soc. Sci. 2024, 8, 976–980. [Google Scholar] [CrossRef]
  89. Jankowska, M.; Atlay, M. Use of Creative Space in Enhancing Students’ Engagement. Innov. Educ. Teach. Int. 2008, 45, 271–279. [Google Scholar] [CrossRef]
  90. Thoring, K.; Desmet, P.; Badke-Schaub, P. Creative Environments for Design Education and Practice: A Typology of Creative Spaces. Des. Stud. 2018, 56, 54–83. [Google Scholar] [CrossRef]
  91. Llinares, C.; Higuera-Trujillo, J.L.; Serra, J. Cold and Warm Coloured Classrooms. Effects on Students’ Attention and Memory Measured through Psychological and Neurophysiological Responses. Build. Environ. 2021, 196, 107726. [Google Scholar] [CrossRef]
  92. Cooper, G.; Thong, L.P.; Tang, K.S. Transforming Science Education with Virtual Reality: An Immersive Representations Model. EMI Educ. Media Int. 2024, 61, 229–251. [Google Scholar] [CrossRef]
  93. Sami Ur Rehman, M.; Abouelkhier, N.; Shafiq, M.T. Exploring the Effectiveness of Immersive Virtual Reality for Project Scheduling in Construction Education. Buildings 2023, 13, 1123. [Google Scholar] [CrossRef]
  94. Thoring, K.; Mueller, R.M.; Badke-Schaub, P.; Desmet, P. An Inventory of Creative Spaces: Innovative Organizations and Their Workspace. In Proceedings of the International Conference on Engineering Design, Delft, The Netherlands, 5–8 August 2019; Cambridge University Press: Delft, The Netherlands, 2019. [Google Scholar]
  95. Moultrie, J.; Nilsson, M.; Dissel, M.; Haner, U.E.; Janssen, S.; Van der Lugt, R. Innovation Spaces: Towards a Framework for Understanding the Role of the Physical Environment in Innovation. Creat. Innov. Manag. 2007, 16, 53–65. [Google Scholar] [CrossRef]
  96. Haner, U.-E. Spaces for Creativity and Innovation in Two Established Organizations. Creat. Innov. Manag. 2005, 14, 288–298. [Google Scholar] [CrossRef]
  97. Hasanin, A.A. Urban Legibility and Shaping the Image of Doha: Visual Analysis of the Environmental Graphics of the 15th Asian Games. Int. J. Archit. Res. 2007, 1, 37–54. [Google Scholar]
  98. De Lobo, T. Legibility for Users with Visual Disabilities. In Proceedings of the Technology Enhanced Learning: Quality of Teaching and Educational Reform, Athens, Greece, 19–21 May 2010; Springer: Athens, Greece, 2010. [Google Scholar]
  99. Rath, K.C.; Panda, L.P.; Rath, S.K.; Khadanga, S.P.; Olasoji, O.T. Enhancing Production Efficiency and Sustainability Through Smart Manufacturing. In Sustainable Advanced Manufacturing and Logistics in ASEAN; IGI Global: Hershey, PA, USA, 2025; pp. 11–32. [Google Scholar]
  100. Adewale, B.A.; Ene, V.O.; Ogunbayo, B.F.; Aigbavboa, C.O. A Systematic Review of the Applications of AI in a Sustainable Building’s Lifecycle. Buildings 2024, 14, 2137. [Google Scholar] [CrossRef]
  101. Imagineerium. Exploring Experiential Design Trends Shaping 2024. Available online: https://www.linkedin.com/pulse/exploring-experiential-design-trends-shaping-2024-imagineerium-pv5re (accessed on 22 March 2025).
  102. Rubenius Interior Wellbeing. Experiential Design Trends 2025: The Future of Immersive Spaces. Available online: https://www.linkedin.com/pulse/experiential-design-trends-2025-future-immersive-spaces-uainc (accessed on 23 March 2025).
  103. Hwang, Y.; Wu, Y. Graphic Design Education in the Era of Text-to-Image Generation: Transitioning to Contents Creator. Int. J. Art Des. Educ. 2025, 44, 239–253. [Google Scholar] [CrossRef]
  104. Brian Dressel Brand Activations Using AI: The Complete Guide to AI-Driven Experiences. Available online: https://www.bridgewaterstudio.net/blog/brand-activations-using-ai-the-complete-guide-to-ai-driven-experiences (accessed on 20 May 2025).
  105. Kendall, C. Creating a Seamless Patient Experience: Best Practices in Wayfinding. Available online: https://www.poppulo.com/blog/hospital-wayfinding-signage (accessed on 20 May 2025).
  106. Henry, J. The Evolution and Importance of Wayfinding Signage in 2025. Available online: https://nento.com/wayfinding-signage/?keyword=wayfinding_signage (accessed on 20 May 2025).
  107. Integrated Insight Wayfinding Design with AI-Based Simulation Modeling. Available online: https://integratedinsight.com/insightful-wayfinding-design-with-ai-based-simulation-modeling/ (accessed on 20 May 2025).
  108. Guo, W.; He, Y. Optimized Wayfinding Signage Positioning in Hospital Built Environment through Medical Data and Flows Simulations. Buildings 2022, 12, 1426. [Google Scholar] [CrossRef]
  109. Li, H.; Xue, T.; Zhang, A.; Luo, X.; Kong, L.; Huang, G. The Application and Impact of Artificial Intelligence Technology in Graphic Design: A Critical Interpretive Synthesis. Heliyon 2024, 10, e40037. [Google Scholar] [CrossRef]
  110. Clevertize Content Team. The Impact of AI on Graphic Design: Opportunities and Challenges. Available online: https://clevertize.com/blog/the-impact-of-ai-on-graphic-design-opportunities-and-challenges/ (accessed on 20 March 2025).
  111. Soni, C. The Impact of Artificial Intelligence on Graphic Design: A Comprehensive Guide. Available online: https://www.linkedin.com/pulse/impact-artificial-intelligence-graphic-design-guide-chitra-soni-cqbmf/ (accessed on 20 May 2025).
  112. Almaz, A.F.; El-Agouz, E.A.E.A.; Abdelfatah, M.T.; Mohamed, I.R. The Future Role of Artificial Intelligence (AI) Design’s Integration into Architectural and Interior Design Education Is to Improve Efficiency, Sustainability, and Creativity. Civ. Eng. Archit. 2024, 12, 1749–1772. [Google Scholar] [CrossRef]
  113. Mustafa, B. The Impact of Artificial Intelligence on the Graphic Design Industry. Arts Des. Stud. 2023, 104, 9. [Google Scholar] [CrossRef]
  114. Ki-Wi Digital The Future Is Here: How AI Is Transforming the World of Digital Signage. Available online: https://www.kiwisignage.com/blog/the-future-is-here-how-ai-is-transforming-the-world-of-digital-signage?gad_source=1&gad_campaignid=22596605188&gclid=Cj0KCQjwxdXBBhDEARIsAAUkP6gxglRpr3TbcOXOIyZZc68JxYDLbtPHdkrzpGQQLZfmC3nLSmlzH7saAuSUEALw_wcB (accessed on 20 May 2025).
  115. Li, J.; Tu, X.F.; Nie, J.W.; Ye, J.; Lv, C. Visitors’ Acceptance of Wearable AR Technology in Museums. SAGE Open 2024, 14, 21582440241. [Google Scholar] [CrossRef]
  116. Ribeiro, M.; Santos, J.; Lobo, J.; Araújo, S.; Magalhães, L.; Adão, T. VR, AR, Gamification and AI towards the next Generation of Systems Supporting Cultural Heritage: Addressing Challenges of a Museum Context. In Proceedings of the 29th International ACM Conference on 3D Web Technology, Guimarães, Portugal, 25–27 September 2024; Association for Computing Machinery (ACM): Guimarães, Portugal, 2024; pp. 1–10. [Google Scholar]
  117. Charr, M. How Museums Are Using Augmented Reality. Available online: https://www.museumnext.com/article/how-museums-are-using-augmented-reality/ (accessed on 20 May 2025).
  118. Edmates. Environmental Graphic Designer. Available online: https://www.edmates.com/career-guide/environmental-graphic-designer/ (accessed on 24 March 2025).
  119. The American Institute of Architecture Students. What Does An Experiential Graphic Designer Do? Available online: https://careers.aias.org/career/experiential-graphic-designer (accessed on 21 March 2025).
  120. Wax Digital. Environmental Responsibilities in Modern Graphic Design. Available online: https://waxdigital.design/insights/essential-graphic-design-ethics-responsibilities-sustainable-future/ (accessed on 22 March 2025).
  121. Lin, C.L. Sustainable Design Factors and Solutions Analysis and Assessment for the Graphic Design Industry: A Hybrid Fuzzy AHP–Fuzzy MARCOS Approach. Mathematics 2024, 12, 4014. [Google Scholar] [CrossRef]
  122. Jedlička, W. Sustainable Graphic Design: Tools, Systems and Strategies for Innovative Print Design; John Wiley & Sons: Hoboken, NJ, USA, 2009; ISBN 978-0-470-24670-2. [Google Scholar]
  123. Alahira, J.; Ninduwezuor-Ehiobu, N.; Andrew Olu-lawal, K. Eco-Innovative Graphic Design Practices: Leveraging Fine Arts to Enhance Sustainability in Industrial Design. Eng. Sci. Technol. J. 2024, 5, 783–793. [Google Scholar] [CrossRef]
  124. Kadas, S. An Effort to Integrate Social and Environmental Awareness into Graphic Design Education. In Care, Climate, and Debt; Wilson, B.C., Ed.; Palgrave Macmillan: Cham, Switzerland; London, UK, 2022; pp. 89–123. [Google Scholar]
  125. Li, W.; Yang, J. Exploring the Solutions of Sustainable Product Design: An ESG Perspective. In Frontiers in Artificial Intelligence and Applications; Jain, L.C., Balas, V.E., Wu, Q., Shi, F., Eds.; IOS Press BV: Amsterdam, Netherlands, 2024; Volume 383, pp. 754–763. [Google Scholar]
  126. Wang, D.; Wang, T. Does ESG Information Disclosure Improve Green Innovation in Manufacturing Enterprises? Sustainability 2025, 17, 2413. [Google Scholar] [CrossRef]
  127. Ekins, P.; Zenghelis, D. The Costs and Benefits of Environmental Sustainability. Sustain. Sci. 2021, 16, 949–965. [Google Scholar] [CrossRef]
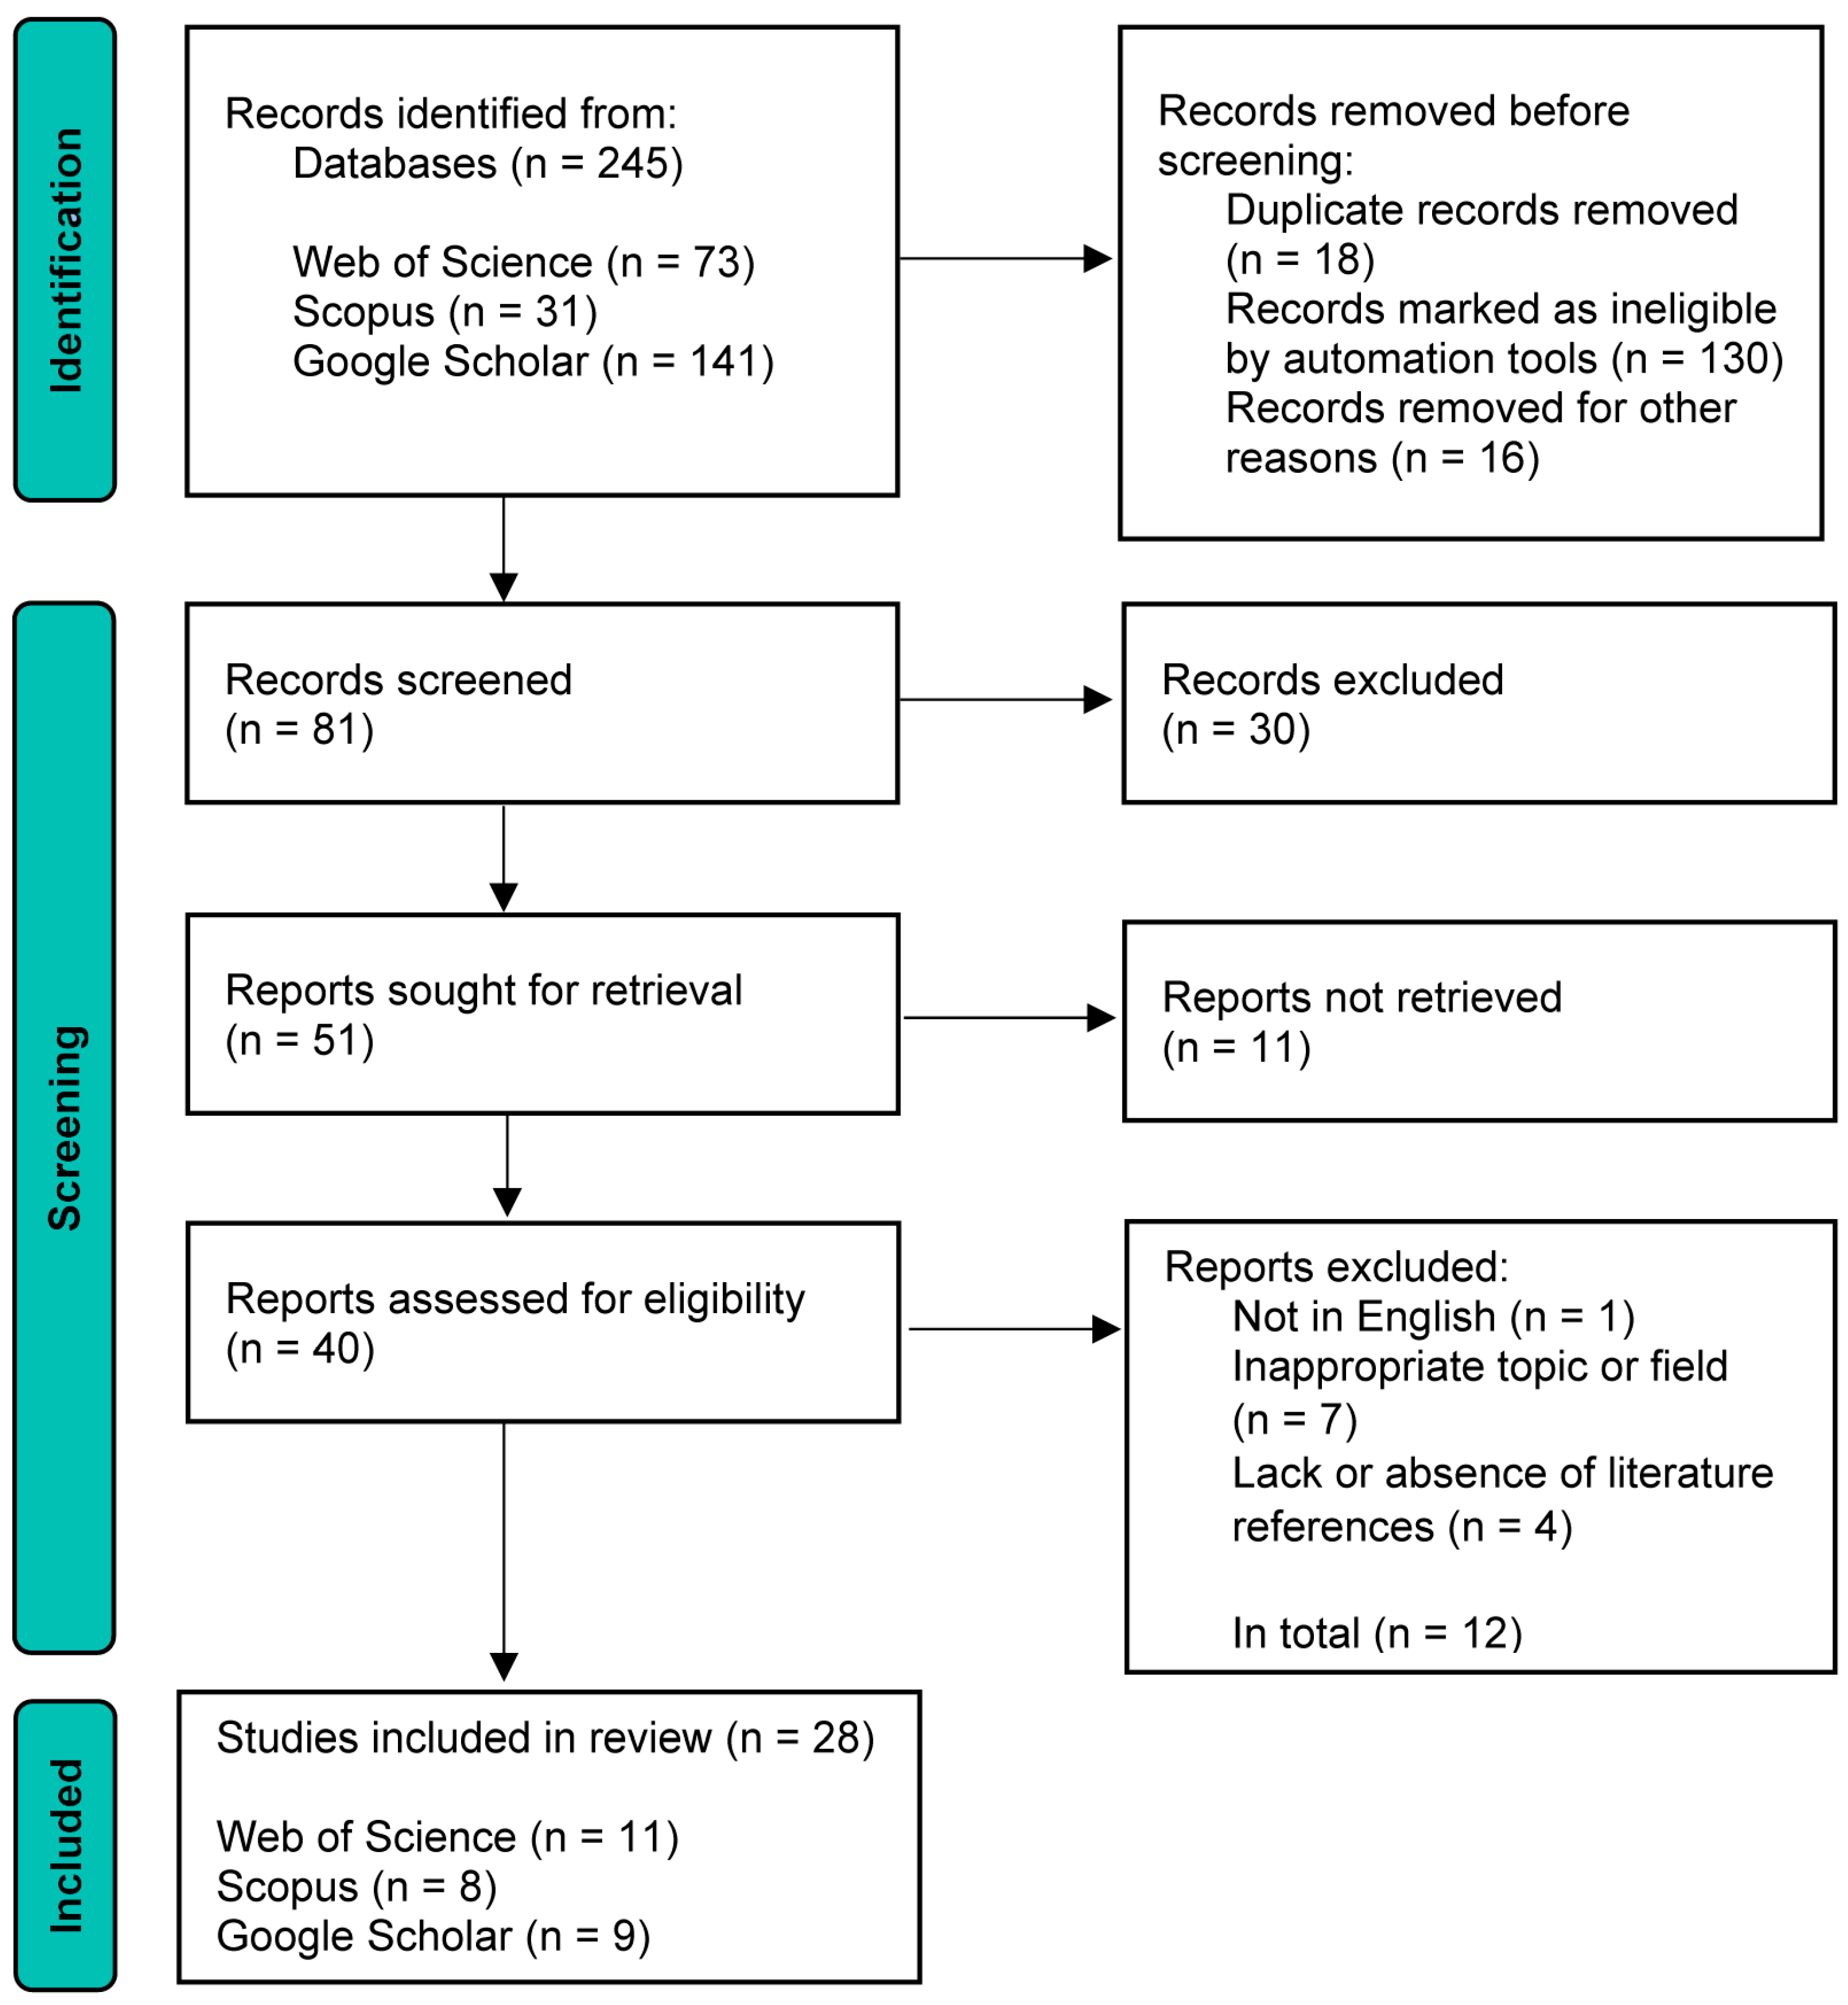
Figure 1. PRISMA 2020 flow diagram.
Buildings 15 01862 g001
Figure 2. Publications per year (2005–2024).
Buildings 15 01862 g002
Figure 3. Publications by country.
Buildings 15 01862 g003
Figure 4. Source fields of included publications.
Buildings 15 01862 g004
Figure 5. Word cloud of the most frequently used terms in the selected publications.
Buildings 15 01862 g005
Figure 6. Main keywords from the selected publications.
Buildings 15 01862 g006
Figure 7. Matrix chart with a comprehensive list of XGD products and their usage frequency across purpose categories.
Buildings 15 01862 g007
Figure 8. Example of poor, good, and best typeface legibility. (a) Typeface suitability and longevity: (1) Helvetica—a timeless sans serif, most legible due to its timeless design, longevity, and global use. (2) Gill Sans—also suitable and long-popular, but less globally used than Helvetica in 2025. (3) Times New Roman—good legibility and longevity, but outdated due to overuse and its serif style, which does not suit contemporary and digital designs. (4) Comic Sans—originally informal, now seen as a poor design choice due to its overuse and misuse. (b) Impact of typographic treatment on Helvetica’s legibility: (1) Title case with positive letterspacing offers optimal legibility for directional signs. (2) Title case with standard letterspacing provides good legibility. (3) All-lowercase treatment is occasionally used but less legible, and this choice often depends on geographical location. (4) All-uppercase is esthetically clean, but less legible than title case or all-lowercase treatment.
Buildings 15 01862 g008
Figure 9. (a) Multilingual regulatory sign supplemented by pictograms, a custom-designed and stylistically uniform sign that provides shade, making reading more comfortable for visitors, at The Beach, Jumeirah Beach Residence (JBR), Dubai. (b) Pictograms as a visual substitute for lengthy verbal instructions on Dubai Marina Walk, Dubai. (c) A custom-designed map of the JBR community (Dubai), featuring color-coded sections for six distinct residential areas, created to facilitate seamless navigation.
Buildings 15 01862 g009
Figure 10. (a) The choice of color and form of the sign “I was saved” poorly aligns with its message (trees were saved from being cut down) and the spatial context of Al Noor Island, Sharjah. (b) Poor visibility of the “In case of fire do not use lift” sign due to the low LRV contrast between the background color and the text color on the transparent glass sign in JBR, Dubai.
Buildings 15 01862 g010
Figure 11. Dubai International Airport showcases an effective information hierarchy using color, typography, and symbol size to highlight key information on directional signs.
Buildings 15 01862 g011
Figure 12. Different placements of an informative XGD products: (a) eye-level zone placement of regulatory sign (Dubai Marina Walk, Dubai), (b) multiple-sided totem (Hilton, The Beach, JBR, Dubai), and (c) gate information displayed in the overhead area (Zagreb Airport).
Buildings 15 01862 g012
Figure 13. Examples of proper and improper sizes and placements of pictograms: (a) oversized and repetitive frontal toilet pictograms, making the XGD visually unappealing (JBR, Dubai); (bd) visually appealing pictograms with an appropriate size, in harmony with the other signs within the same physical space (Mall of the Emirates, Dubai).
Buildings 15 01862 g013
Figure 14. Different XGD product illuminations: (a) front-lit, where the face of a letter or logo is illuminated, (b) halo-lit, when light is produced from behind a dimensional letter or logo, and (c) external lighting, where the logo is lit by an external light source (AI-generated images by the author, using text-to-image, Adobe Firefly).
Buildings 15 01862 g014
Figure 15. The consistent use of graphic design elements across various XGD products at or near tram stations enhances the speed of information transfer and simplifies navigation (Dubai Tram Station, JBR 1).
Buildings 15 01862 g015
Figure 16. Integrated wayfinding, physical, and digital navigation systems aligned in the Mall of Emirates, Dubai: (a) a mobile device application, (be) physical navigational signs, (f) an interactive kiosk, and (g) a map on the website.
Buildings 15 01862 g016
Figure 17. The Museum of the Future, Dubai, offers immersive experiences that transport visitors into futuristic worlds, exploring the intersection of technology, innovation, and sustainability while showcasing the cutting-edge concepts shaping tomorrow: (a) The Library, a visual DNA encyclopedia, is an awe-inspiring installation featuring 2400 illuminated jars containing specimens of existing and extinct species. (b,c) Robot (Cyberdog), one of the main museum’s attractions, showcases advancements in robotics and AI with its ability to walk, run, and interact with visitors.
Buildings 15 01862 g017
Figure 18. Expo 2020 in Dubai (held in 2021), a global event showcasing innovation, culture, and sustainability across various pavilions and exhibits: (a) the iconic 21 m carbon–fiber entry portal inspired by a traditional Arabic mashrabiya, providing shade and cooling; (b) astronaut with monitor showing visitors images via an interactive camera recognition system (Mobility Pavilion—Digital World); (c) a 23 m curved panoramic screen featuring synchronized light and sound, mirrored projections, and holograms that envision AI-powered future cities with drone networks and vertical ecosystems (Mobility Pavilion—Unified World).
Buildings 15 01862 g018
Figure 19. Experiential children’s museum with hands-on exhibits that nurtures joyful learning through play, supporting children’s development in creativity, problem-solving, social and motor skills, spatial awareness, and confidence (OliOli, Dubai): (a) the whimsical and inviting outdoor signage of the museum; (b) the Water Gallery, exploring the science of water through play, teaching children about motion, pressure, and gravity; (c) Air Gallery, teaching the principles of flight and aerodynamics through interactive wind experiments; (d) Future Park, with a digital aquarium where children’s drawings come to life and swim together.
Buildings 15 01862 g019
Figure 20. Vibrant and free co-working space offering a collaborative environment and stimulating social interactions (A4 Space, Alserkal Avenue, Al Quoz, Dubai). This space also houses Zerzura Rare Books and the small café Salata and frequently hosts presentations and displays of local, home-grown brands.
Buildings 15 01862 g020
Figure 21. XGD creates a cohesive brand atmosphere that strengthens brand recognition and encourages customer loyalty (Mall of the Emirates, Dubai): (ac) at this Starbucks location, XGD elements guide customers through the brand’s history and vision, fostering a deeper emotional connection; (df) the iconic Diesel red color in the retail store is a key part of the brand’s identity, symbolizing energy, passion, rebellion, and confidence—emphasizing Diesel’s edgy and provocative spirit.
Buildings 15 01862 g021
Figure 22. Pop-up brand event “Just Jif your kicks party” by Jif Arabia, 2025 (The Beach, JBR, Dubai: (a) event setup, designed to provide seamless brand integration and an engaging atmosphere; (b) leaflet showing the interactive activity stations for a memorable customer experience and product interactions (image from Jif Arabia’s Instagram); (c) Instagram-worthy activation promoting the brand reach and encouraging user-generated content via social media (#justjifit reels screenshot).
Buildings 15 01862 g022
Figure 23. Dubai Metro’s inclusivity features: (a,e) designated wheelchair spaces and priority seats for people with special needs; (b) tactile paving guides users to key areas like ticket counters, platforms, and exits; (c) elevators with Braille buttons for visually impaired passengers; (d) audible signals at stations and on trains provide essential information. In addition, the Braille manuals introduced by Dubai’s Roads and Transport Authority promote metro use and road safety education.
Buildings 15 01862 g023
Figure 24. XGD celebrating different cultures and the diversity of the people (JBR, Dubai): (a) the 3D mural “Anne & Aisha” by Leon Keer uses contrasting appearances to symbolize the connection between cultures, evoking empathy, unity, and the beauty of diversity; (b) a creative application of full-color LED displays in dimensional typography design celebrates cultural diversity and various holidays through easily interchangeable visuals tailored for a multicultural setting.
Buildings 15 01862 g024
Figure 25. XGD enhancing the sense of place and strengthening the cultural identity of an urban space: (a) the vibrant and colorful mural “Legend of the Arabian Horse” by Eduardo Kobra honors the Arabian horse, a historical and cultural symbol of beauty, loyalty, and resilience in the Middle East (JBR, Dubai); (b) a contemporary full-color advertising LED display featuring decorative elements inspired by traditional mashrabiya architecture (Al Gharbi Street, Dubai).
Buildings 15 01862 g025
Figure 26. XGD implementations in a residential area aiming to foster collaboration and social integration (Dubai Marina, Dubai): (a,b,g) diverse shared seating areas, (c) a community-focused mobile app, (d,e) engaging art installations, (f) an event board, (h) a recycling station, and (i) a construction site.
Buildings 15 01862 g026
Figure 27. Word cloud of the most frequently used terms in additional publications.
Buildings 15 01862 g027
Figure 28. Additional publications per year (2005–2024).
Buildings 15 01862 g028
Table 1. Eligibility criteria for literature selection.
CategoryInclusion CriteriaExclusion Criteria
IDENTIFICATIONDatabaseWeb of Science, Scopus, Google ScholarOther databases
Search phrasesDefined phrases in title and/or keywordsStudies with a title and/or keywords
not related to the defined phrases
Source typeJournal articles,
conference papers,
and books
Book reviews, notes, reports, meeting
abstracts, dissertations, theses, scripts, and presentations
LanguageEnglishNon-English; only abstract and/or
title in English
Duplication checkNon-duplicate studies from selected databasesDuplicate studies from selected
databases
SCREENINGAccessibilityFull-text accessOnly abstract and/or
title available
Topic and/or
field focus
Relevant studies on XGD/EGD (emphasis on graphic communications)Studies without a defined focus
or with an emphasis on different
fields (architecture, psychology, transportation, etc.)
Disclaimer/Publisher’s Note: The statements, opinions and data contained in all publications are solely those of the individual author(s) and contributor(s) and not of MDPI and/or the editor(s). MDPI and/or the editor(s) disclaim responsibility for any injury to people or property resulting from any ideas, methods, instructions or products referred to in the content.