Article

Post-Occupancy Evaluation of Campus Learning Spaces with Multi-Modal Spatiotemporal Tracking

School of Architecture, Yantai University, Yantai 264005, China
*
Author to whom correspondence should be addressed.
Buildings 2025, 15(11), 1831; https://doi.org/10.3390/buildings15111831
Submission received: 8 April 2025 / Revised: 15 May 2025 / Accepted: 19 May 2025 / Published: 26 May 2025

Abstract

:
As the core carrier of cognitive construction, the design optimization of campus learning space is crucial to the improvement of education quality, but the existing research focuses on the analysis of behavioral preferences and lacks an in-depth analysis of the psychological dynamics of users. Through multimodal questionnaires and spatiotemporal tracking, we developed an ‘expectation–perception–behavior’ framework to quantify discrepancies between users’ visual expectations and actual experiences. The results showed that blue and wood tones significantly enhanced learning efficiency; however, there was a significant difference between facility usability and sound insulation. Based on this, dynamic environment adjustment, virtual reality preview, and modular flexible space strategies are proposed to optimize spatial performance through biophilic design and intelligent regulation. This study provides interdisciplinary methodological innovation for architecture, education, and environmental psychology and promotes the transformation of campus space, injecting new momentum into the transformation of global stock space, the construction of a sustainable education ecology, and contributing to the overall improvement of social cognitive performance.

1. Introduction

As the global urbanization process encounters a turning point of stock renewal, the renovation of existing buildings on campuses has broken through the scope of pure technical renewal and evolved into a strategic issue related to educational transformation and sustainable social development. The existing building area of Chinese colleges and universities is huge, and a considerable proportion of these buildings were constructed during the period when functionalism prevailed in the 20th century. These buildings are facing dual challenges of solidified spatial paradigms and excessive energy consumption indicators, which are triggering a systemic crisis [1]. The serious misalignment between the spatial form of such buildings and contemporary educational concepts has led to many campus buildings being in a state of functional failure [2], creating an alarming sinking of spatial resources. In the field of higher education, the deepening development of constructivist learning theory has drastically impacted the traditional teaching-space paradigm. Surging demand for collaborative and blended learning modes exceeds the capacity of traditional classroom spaces [3,4]. Architects must wake up to the fact that the learning space has qualitatively changed from a container for educational activities to a key variable influencing cognitive construction, and that the current spatial crisis is essentially a structural obstacle to educational modernization. A large number of existing buildings on campus, especially old buildings that have assumed traditional teaching functions, generally have the problems of a single spatial form and rigid functional layout [5]. The spatial design of these old buildings is often based on past educational patterns and functional needs, which makes it difficult to adapt to the diversified and interactive learning activities in modern education, severely restricting further improvement of the quality of education and teaching and becoming a bottleneck for educational development. In view of the above dilemma, the transformation of indoor learning spaces has gradually become a key area of concern in campus construction and a hot topic in academic research. Among them, the transformation of campus informal learning spaces (ILS) is particularly important [6]. This kind of informal learning space is different from traditional formal classrooms and conventional public spaces, which not only provides learners with a personalized and independent learning environment but also carefully creates a place to promote social interaction, and at the same time provides a convenient channel for communication between users and school staff which meets the diversified functional needs of modern education [7]. Its unique spatial characteristics can effectively stimulate the independent learning consciousness of students and teachers, promote the occurrence of self-organized learning behaviors, and provide strong spatial support for innovative education models [8].
In recent years, with the continuous innovation of the education model and gradual deepening of the study of learning spaces, many scholars and architects have explored different dimensions, providing rich theoretical and practical support for the understanding and optimization of this type of space [9,10]. At the spatial design practice level, many studies have focused on improving the functionality and comfort of informal learning spaces through innovative design techniques. Scientific replanning of spatial layout, the use of half-wall division, and other design means can effectively integrate spatial resources to meet the complex functional needs of teachers and students in teaching, office, learning, and other aspects, thus creating a more efficient and comfortable learning and working environment [11]. From a theoretical point of view, Salih et al. constructed a set of perfect classification systems for informal learning spaces through systematic sorting and in-depth analysis of a large number of previous studies. ILS were divided into two major categories: informal private learning spaces and informal social learning spaces, which were further subdivided into six types: private indoor quiet spaces, semi-private/semi-public indoor spaces, public indoor spaces, public sustainable spaces, public outdoor spaces, and comprehensive spaces. At the same time, seven categories of design factors affecting these space types were identified, including personal factors, spatial design, physical environment, resources, social factors, natural environment, and perceived environment. Moreover, the positive outcomes of ILS in five aspects, namely learning efficacy, socialization, refreshment and relaxation, health, and sustainable development, were summarized [9].
In the academic research context of the deep integration of architecture and education, the design and post-use evaluation of campus learning spaces has become a key issue; the main tasks are to improve the quality of the environment, promote the rational optimization of campus space [12], and explore the synergistic development mode of information technology and campus space [13] in which the complex relationship between spatial environments and user perceptions [14] is a key area of research concern. With the revolution of educational concepts, the educational approach is gradually changing from traditional lecture-based learning to more diversified and interactive blended learning [15]. This change has prompted the need for research on campus learning spaces to gain a deeper understanding of the patterns of students’ interactive behaviors. In this process, the comprehensive use of space occupancy monitoring data, field observations, and interviews can accurately capture the actual use of various types of learning spaces on campus, thus providing a strong basis for improving the efficiency of campus resource allocation and the scientific nature of investment in teaching infrastructure [16]. In China, the campus environment, as a material carrier of educational activities, has become increasingly important for improving educational quality [17]. The booming development of information technology, as well as human perception technology, especially visual perception technology, has opened up new horizons and methods for campus learning space optimization research [18]. An in-depth investigation of the intrinsic connection between the spatial environment and user perception [19] not only helps to build a more perfect campus space design theory system but also provides architects with more targeted design strategies in practice. As far as the types of campus learning spaces are concerned, important learning places such as academic libraries occupy a central position in the campus learning ecosystem. Its spatial design, especially the planning and decision making of flexible learning spaces, is directly related to students’ learning experiences and learning outcomes [20]. Previous studies have deeply explored the mechanism of spatial design’s influence on users’ learning behavior and emotions through careful observation of users’ learning behavior in specific spaces in libraries, as well as comparative analysis before and after space renovation [21,22], accumulating valuable experience for subsequent studies. However, despite the achievements of current research on campus learning spaces, there is still huge research potential. Most existing research focuses on the influence of space attributes on students’ usage preferences and activity patterns [23], while there is a relative lack of in-depth analyses of the motivation behind user behavior, the process of psychological change, and cognitive feedback which can be improved in the post-use evaluation of learning spaces. With the in-depth expansion of interdisciplinary research, the research technology of multidisciplinary cross-fertilization has injected new vitality into the evaluation and optimization of campus learning spaces. For example, the research and development of multimodal intelligent flooring systems which integrate multidimensional information collection technology and neural network data analysis method, provide innovative ideas for the intelligent monitoring and interaction design of campus learning space [24]. The combination of deep learning technology and expectation confirmation theory, which constructs a model that can effectively predict the user’s satisfaction, provides new research perspectives and practical paths for the improvement of the quality of service of campus learning space [25]. The above studies provide new research perspectives for the post-use evaluation and transformation optimization of campus learning spaces. Based on the sorting and reflection of existing research results, this study proposes a set of more comprehensive and effective research methods for post-use evaluation (POE) of campus learning spaces [26]. By comparing the difference between users’ perception of the space icon and the degree of personal experience, this study explores users’ satisfaction with the use of a campus learning space, and puts forward targeted optimization suggestions. It makes up for the deficiency in the previous research system, which lacks in-depth analysis of users’ psychological dynamics [9], pays more in-depth attention to the user experience, and proposes optimization strategies. It provides references with a scientific basis and a practical guidance value for the transformation and evaluation of the future campus learning space and pushes the campus learning space in a direction that is more consistent with the needs of educational development and user experience. This will promote the campus learning space to evolve in the direction of better meeting the needs of educational development and user experience.

2. Methods

This study takes a specific learning space on a campus as the research object, collects and examines the differences between users’ satisfaction with the space’s “anticipatory perception” and “after-use experience” in terms of the research indicators, and analyzes the root causes of the differences. The study utilizes a combination of case studies, observations, interviews, and other multimodal and mixed research methods to collect basic data and conduct research. The specific process is illustrated in the first stage of the research design framework. Through literature combing based on the results of previous researchers, we accurately identify the key spatial design features that affect learning spaces which provide the basis for the subsequent research program. In the second phase of the research, we selected Tsinghua University Student Service Center as a case study for in-depth analysis. To comprehensively gather empirical data, the study combined mixed methods including questionnaires, behavioral observations, and interviews. To accurately capture cognitive differences, we developed an innovative “pre-expectation and post-experience comparative analysis” [27]: First, a pre-visit questionnaire incorporating photos and observational scenarios was administered to record students’ predicted satisfaction scores. Subsequently, a time–space behavior tracking questionnaire was conducted in real-world usage contexts to document shifts in satisfaction after actual experiences. This dual assessment mechanism enabled us to gather first-hand feedback on learning spaces, providing precise data support for future spatial optimization.
We collected first-hand information to understand students’ real feelings, needs, and expectations of learning spaces and to ensure the scientific reliability and validity of the research conclusions. The results of the study can help provide a basis for the targeted and continuous optimization and environmental transformation of the learning space in the school, improve students’ learning experience and learning effect.
The research framework of this study is shown in Figure 1.

2.1. Research Site

This study focuses on the Tsinghua University Student Service Center, which is an important exclusive space for student services and occupies a special position in the overall functional layout of the campus. It is located on the north side of Tsinghua University’s main campus, adjacent to the Bauhinia Student Residence, which provides great convenience for students to use the service center, effectively shortens the commuting distance of students, and enhances their spatial accessibility (Figure 2). Directly opposite to the service center is the Bauhinia playground and the rich and varied green campus landscape, forming a good visual relationship. The road between the playground and the plaza in front of the service center becomes the core location area for collective activities on campus, where club recruitment activities are held regularly every semester, which fully reflects the gathering capacity and vitality of public activities in this area. From the perspective of architectural design, the sightline design of the window area inside the service center is very important, and users can form a visual corridor through the windows to the dynamic landscape of the outdoor playground and road, which not only enriches the spatial experience of the indoor users but also enhances the interaction between the building and the external environment. The building was completed in 2002, and its overall form is a unique “C” shape, so it is figuratively called a “C Building” shape. It has a total floor area of 7700 square meters and is vertically divided into four floors above the ground and one underground. The functional planning of each floor closely focuses on the needs of the students, covering a variety of service functions. This hierarchical layout and functional configuration are based on an in-depth consideration of students’ behavioral patterns and usage needs, aiming to provide students with efficient, convenient, and comprehensive service experiences and to assist the orderly development of campus life from the level of architectural space.
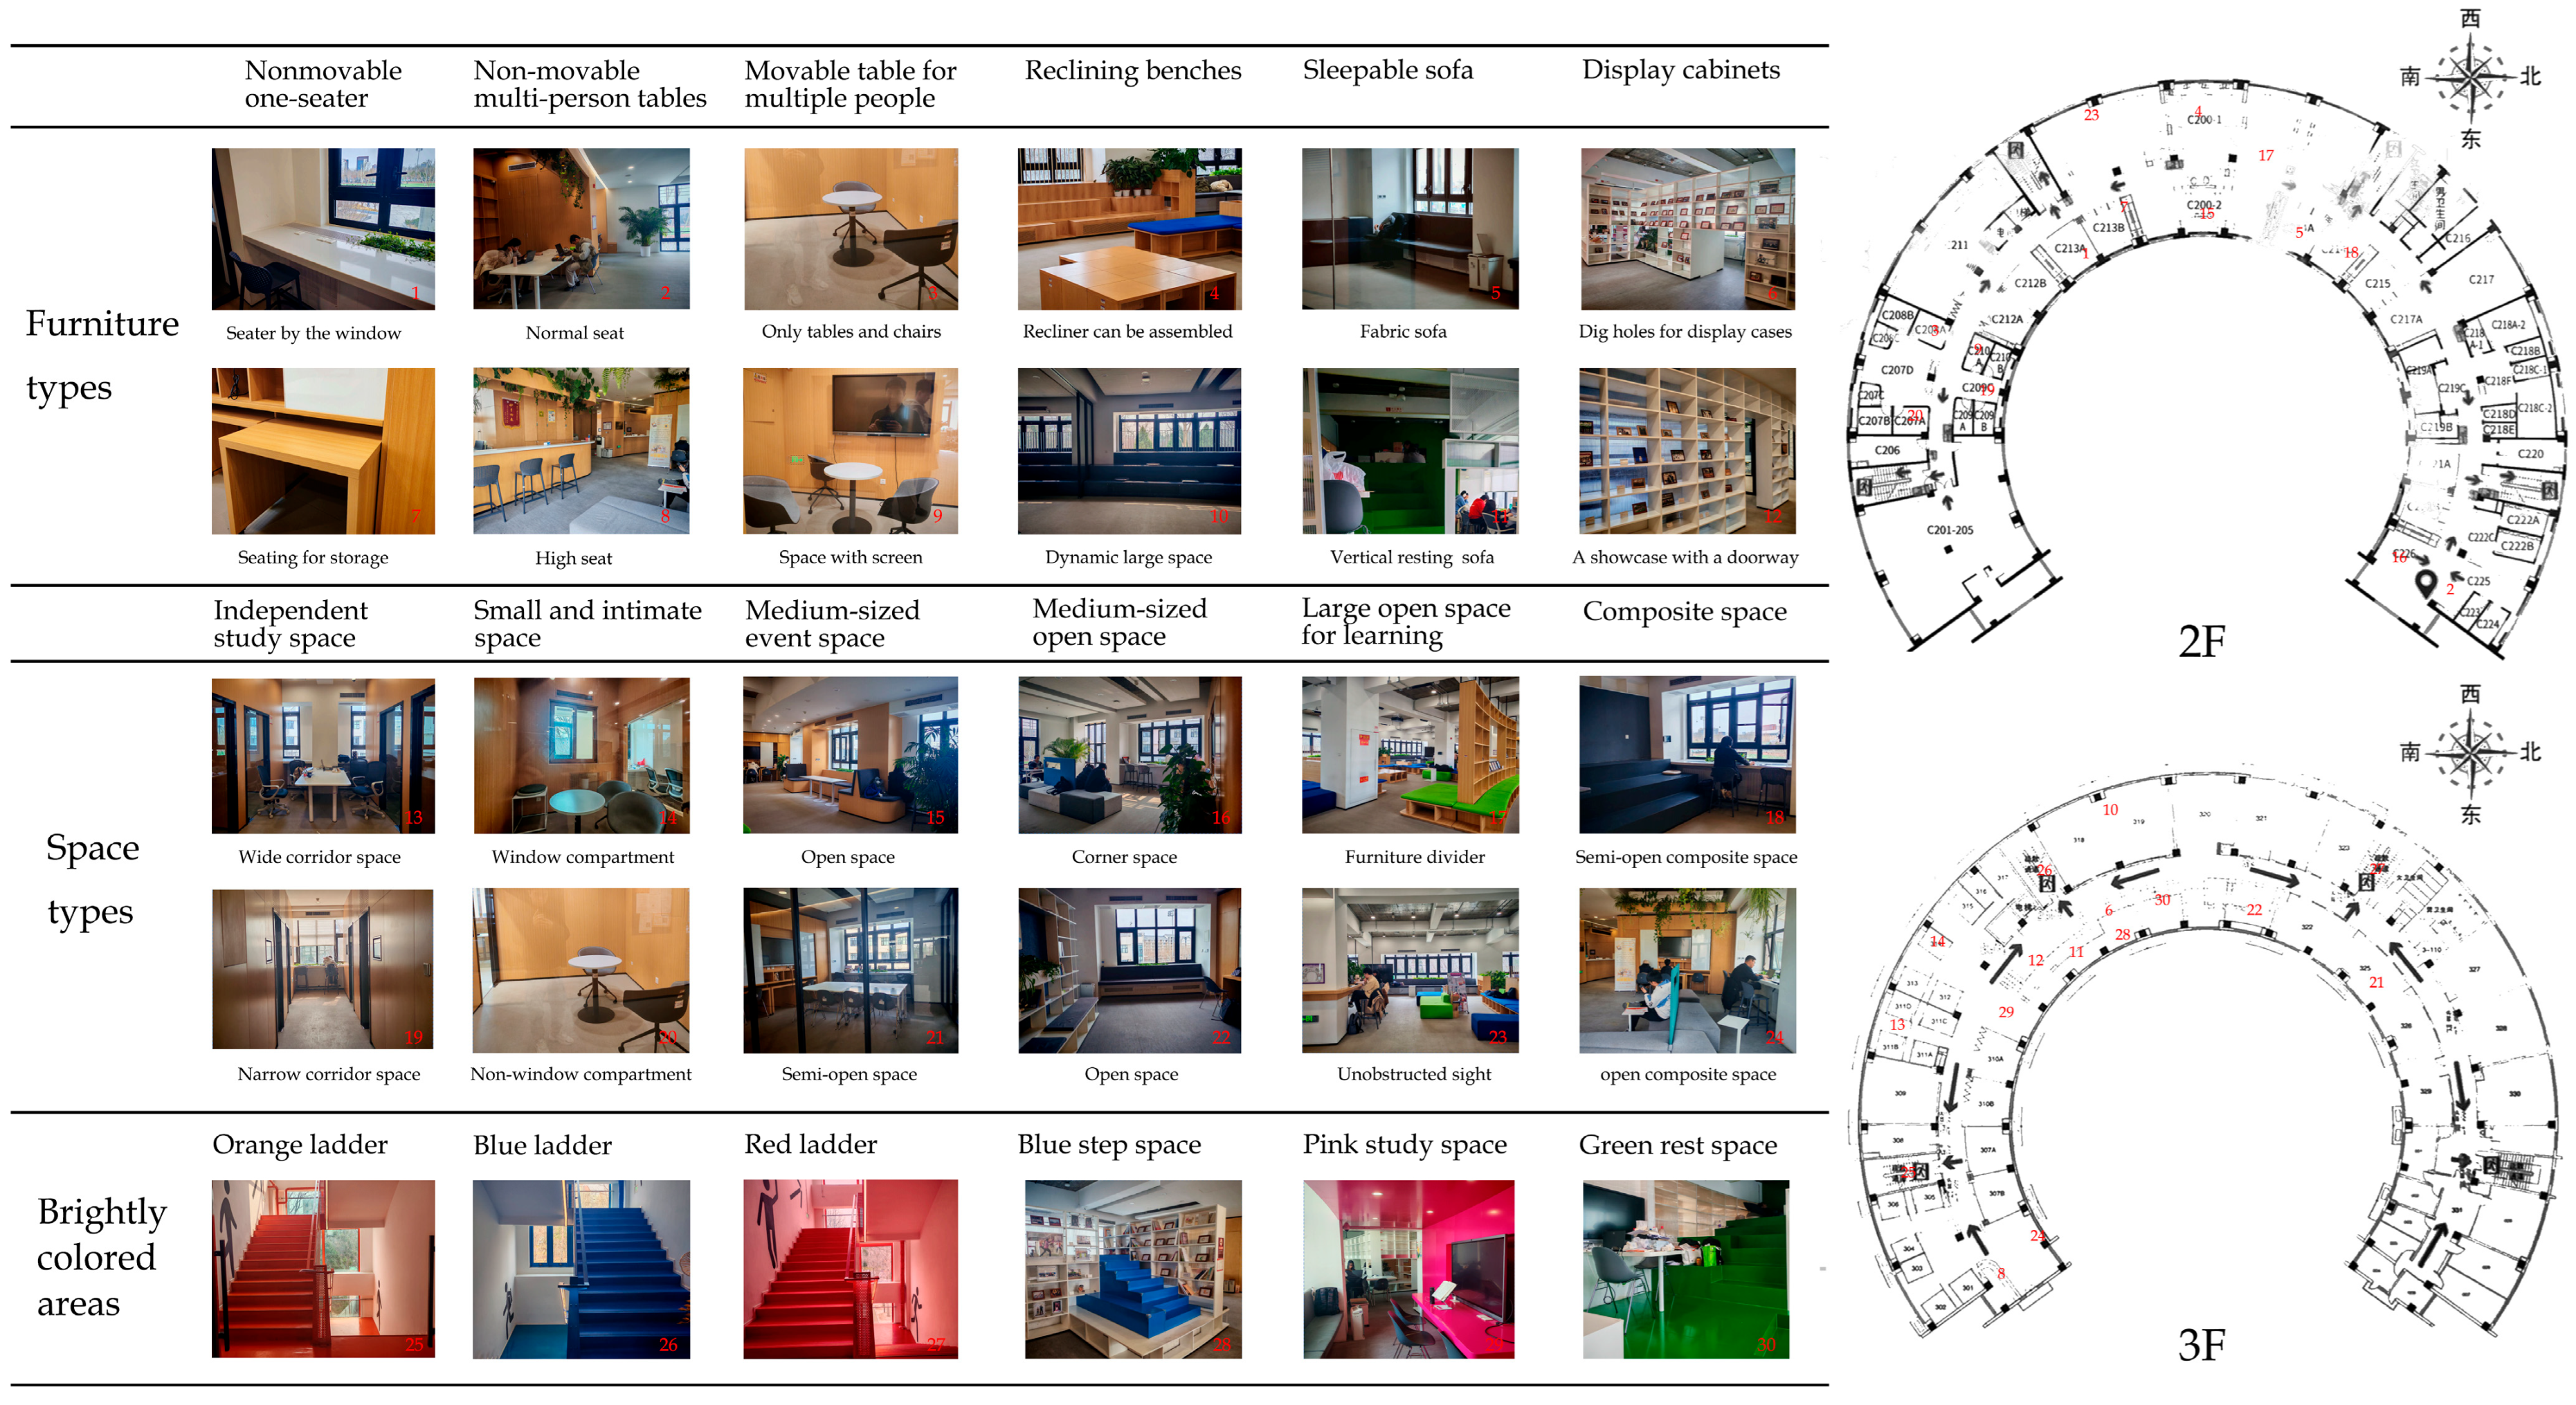
Before the renovation of Tsinghua University Student Service Center (C Building), the original space model had significant limitations. The rooms on both sides were closed and fixed, severely limiting the flexibility and openness of the space. The corridor in the middle was not only long and narrow but also had insufficient lighting, resulting in a dark space that affected the visual experience and mobility of the users. These problems made the space unable to meet the diverse learning, social, and living needs of the young students in this new era. In order to optimize the service and management functions of the student community, the interior space of C Building was remodeled in 2021–2023. By organizing interviews with designers, the core strategy of this remodeling was to break the original closed pattern, release the open service public space by removing partition walls, and reintegrate the spatial resources. In terms of functional zoning, it was constructed into a three-tier functional system with “special large function composite space” such as comprehensive sports, arts and crafts, music hall, international center, etc., as well as “living micro-space” to meet the needs of the students’ daily lives. This hierarchical space structure not only met the diverse functional needs of students but also improved the efficiency of space use and management convenience. Given that the second and third floors were the main areas of this renovation, the floor plans of the second and third floors were drawn using the professional drafting software AutoCAD to accurately record and analyze the spatial renovation (Figure 3). During the drawing process, various types of space, such as study area, communication area, and service area, as well as the arrangement of furniture, were categorized in detail and marked precisely. This not only helped in the in-depth analysis and optimization of space but also provided accurate data support and an intuitive visualization basis for the spatial analysis, as well as the post-use evaluation of this study, which is of great significance in promoting the rational design and sustainable development of campus building spaces.

2.2. Questionnaire Survey Research

In the research field of architectural space, an in-depth exploration of the differences in users’ perceptions of spatial attributes is of great significance for optimizing spatial design [28]. This study focuses on the differences between users’ visual perception and personal experience of this spatial attribute icon and analyzes the reasons behind them. By exploring the root causes of users’ behavioral changes in the process of using the space, this study explores the impact of these factors on the design of the space and then proposes targeted optimization strategies. In the research process, users entering the space were scientifically categorized into three groups: students, teachers, and managers. Given that students are the main users of the space, to ensure the comprehensiveness and representativeness of the research data, the questionnaires were distributed to the student group in accordance with the principle of a 1:1 male to female ratio to achieve a balanced consideration of the gender dimension. Participants were screened based on two criteria: prior familiarity with the service center, and weekly visitation frequency ≥ 1.
The study implemented a three-phase data collection protocol:
  • Pre-occupancy assessment: Participants completed visual perception evaluations through attribute-annotated spatial diagrams in a pre-questionnaire;
  • Behavioral engagement: Subjects autonomously conducted learning, social, and recreational activities within the space;
  • Post-occupancy evaluation: Upon activity completion, participants provided feedback via 5-point Likert scale ratings and open-ended responses.
To ensure the rigor of the methodology, the informed consent procedure preceded data collection, and then the questionnaire responses were systematically calibrated. Additionally, the behavioral options in the questionnaire were derived from behavioral statistics obtained through manual observation over a period of time, which were then summarized and extracted (Table 1). Irrelevant open-ended answers were filtered based on content to enhance the validity of the dataset, laying a solid foundation for subsequent spatial design analysis.

2.3. Multimodal Questionnaire Design

From the perspective of architects’ in-depth analysis of space and design optimization, this study adopts quantitative research methods to carry out an innovative spatiotemporal tracking survey. In spatial research, accurately grasping user perceptions and experiences of space is crucial for optimizing spatial design and improving spatial quality. For this reason, this study constructed a multimodal data collection and analysis system in which the multimodal form of an organic combination of photos, videos, and texts became the innovative highlight of this study. The questionnaire in the study was divided into two copies before and after forming a complete set of comparative analysis systems. The first was a pre-questionnaire that was distributed before the respondents went to the Student Service Center of Tsinghua University. When filling out the pre-questionnaire, respondents were required to clarify the purpose of going to the Student Service Center based on their own plans. At the same time, respondents were asked to evaluate the visual perception of the space in terms of various professional dimensions, such as scale, proportion, and color matching, which are the concerns of architects, based on the photographs in the paper questionnaire, and to provide their expected satisfaction based on this. In addition, respondents were required to choose their own focus of attention from a wide range of design elements, such as spatial layout, furniture selection, and decorative style, thus reflecting the diverse needs and expectations of different users for spatial design. The second questionnaire was the feedback questionnaire, which aimed to collect feedback from the respondents after they had actually experienced the space. This questionnaire focused on the difference between the actual experience of the space and the visual preconceptions of the illustrations. Respondents were asked to indicate where the difference between the actual experience and the preconception was most significant, such as the actual openness of the space and the ease of use of the facilities. The actual experience of the space was analyzed again. Subsequently, the actual satisfaction of the space experience was scored again, and a 5-point Likert scale from 1 to 5 was used for quantitative assessment. We used a paired samples t-test as the statistical test. Finally, after repeated analyses and integration, a logical and scientifically sound questionnaire was formed. Collecting data based on this questionnaire can reflect users’ real feelings and needs for space from multiple dimensions, providing solid data support for the subsequent optimization of spatial design. Its science and logic can be fully guaranteed, which is expected to provide a valuable reference for the development of campus learning space design.

3. Results

3.1. Reliability and Factor Analysis of the Questionnaire

To control the quantity of questionnaire data for the experiment, which measures satisfaction experience through the use of a before-and-after comparison, we used a paired samples t-test. First, 20 students were recruited to conduct a pre-survey to calculate the amount of actual effect (Cohen’s d-value) close to 0.25. This was generally set at a significance level of α = 0.05, and a statistical efficacy of 0.9, which meets the robustness and scientific reliability requirements. The above data were entered into the G*power to arrive at the final sample size required for the questionnaire, which was 102. To achieve this, 105 questionnaires were distributed with an effective return rate of 97.1%.
Cronbach’s alpha (Cronbach’s alpha coefficient) is a statistical measure of the scale of reliability. When Cronbach’s alpha is greater than 0.8, it usually indicates that the scale has high internal consistency reliability, that is, the correlation between items in the scale is strong, and it can measure the same trait or concept in a more stable way. In current research, the closer the value of Cronbach’s alpha is to 1, the higher the reliability. It is generally believed that 0.8 is a more desirable level of reliability, and reaching this level indicates that the scale or questionnaire is more reliable, and the results measured are more stable and credible, and can be used for further research and analysis. Since Cronbach’s alpha coefficient of this study was 0.92, it shows excellent reliability and trustworthiness (Table 2).
In the metric of KMO test statistics, 0.8 or above indicates that it is suitable for factorization, and the KMO sampling aptitude measure of this study is 0.811, which, according to this criterion, suggests that the data are suitable for factor analysis (Table 3). In addition, Bartlett’s Test of Sphericity has a significance of 0.000, which is less than 0.01, indicating that the original hypothesis is rejected at a very high confidence level, and the correlation coefficient matrix is considered to be significantly different from the unit matrix; there is a correlation between the variables, which makes it suitable for factor analysis.
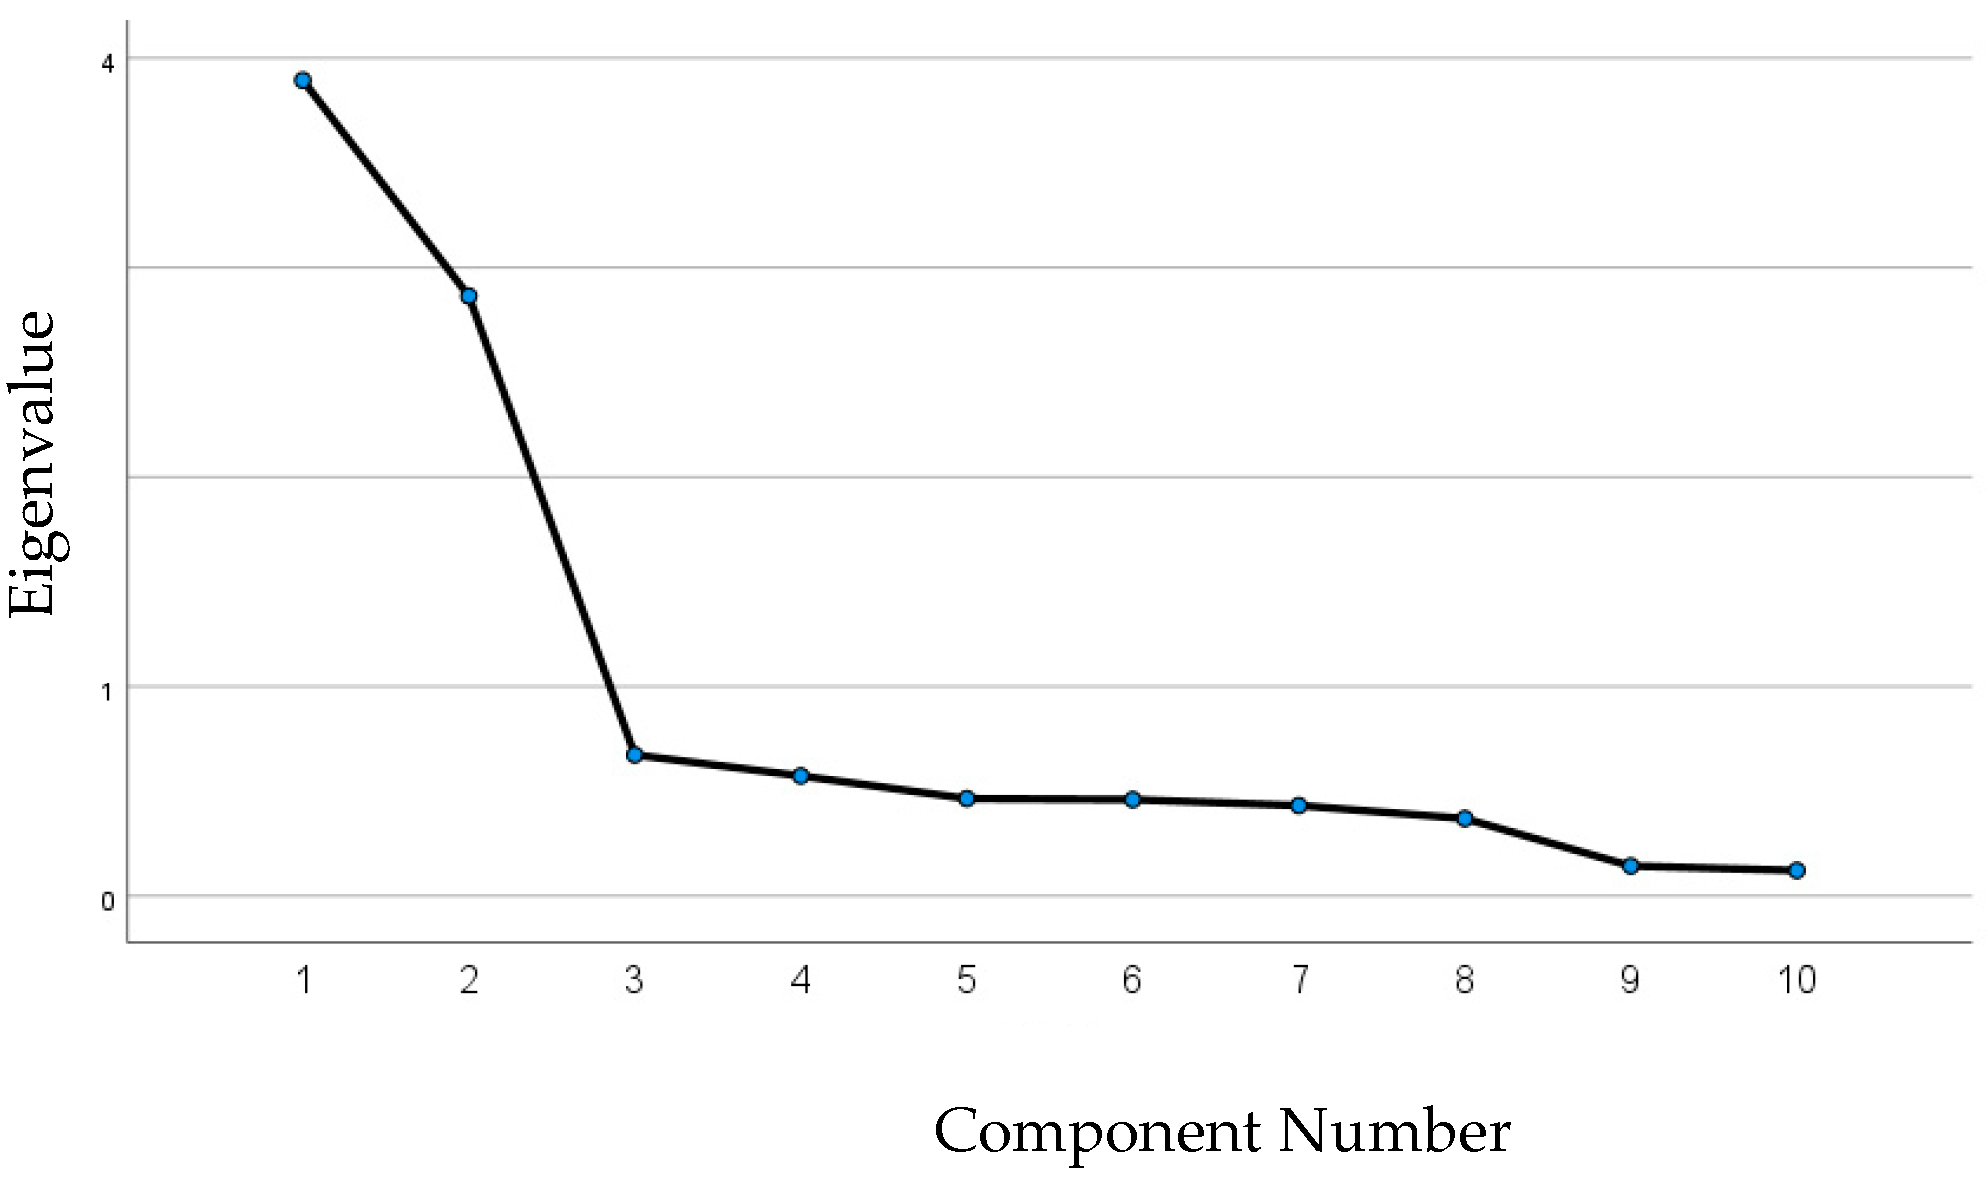
The following three graphs present the results of principal component analysis. In the total variance explained table (Table 4), among the initial eigenvalues, the first three principal components have larger eigenvalues of 3.895, 2.865, and 0.674, respectively, and their variance contribution rates are 38.949%, 28.646%, and 6.739%, respectively. The cumulative variance contribution rate of the first two principal components reached 67.595% and that of the first three components reached 74.334%, indicating that the first three principal components covered most of the information of the original variables. The latter principal components have smaller eigenvalues and contribute less to variance. The sum of the squares of the extracted loadings was partially consistent with the initial eigenvalues, indicating that no additional screening of the principal components was performed. After rotation, the variance contributions of the principal components were adjusted, although the cumulative variance contribution remained unchanged, and rotation made the structure of the principal components easier to interpret (Table 5). The horizontal coordinate of the gravel plot is the component number (principal component order), and the vertical coordinate is the eigenvalue (Figure 4). It is clear from the plot that the eigenvalues of the first three principal components decrease rapidly, and after the third principal component, the curve flattens out, forming a clear “elbow”. This further indicates that the first three principal components contain the main variation information of the data and are key components.

3.2. Correlation Analysis

The correlation coefficients between the factors were marked with a significance sign, indicating significant associations between the dimensions of prejudgment satisfaction. For example, the correlation coefficient between the prejudgment privacy score and facility availability was 0.424 (p < 0.001), indicating that there is a strong positive correlation between students’ prejudgment of privacy and prejudgment of facility availability; students who perceive privacy to be good tend to perceive facility availability to be high as well. The correlation coefficient between visual comfort and color satisfaction was as high as 0.865 (p < 0.001), suggesting that visual comfort and color satisfaction are strongly linked to students’ prejudgments and that color may have a strong influence on visual comfort in students’ perceptions. Similarly to prejudgment satisfaction, largely significant associations were found between the dimensions of actual satisfaction. For example, the correlation coefficient between actual privacy scores and facility availability was 0.449 (p < 0.001), suggesting that privacy and facility availability also interacted during the actual experience. The correlation coefficient between visual comfort and color satisfaction was 0.772 (p < 0.001), and the two remained strongly correlated in the actual experience, further confirming the importance of color in influencing the visual perception. Noise prediction was also significantly correlated with other dimensions, such as the correlation coefficient with actual privacy ratings of 0.511 (p < 0.001), suggesting that the noise situation in the actual experience affected students’ perception of privacy. Although the overall trend is consistent, the correlation coefficients may be different, suggesting that there are still different degrees of discrepancies between students’ preconceptions and actual experiences, and that attention should be paid to narrowing the gap between expectations and reality in the design of the space, and the provision of services (Table 6 and Table 7).

3.3. Descriptive Statistics

3.3.1. Distribution of Students’ Primary Intentions for Space Utilization

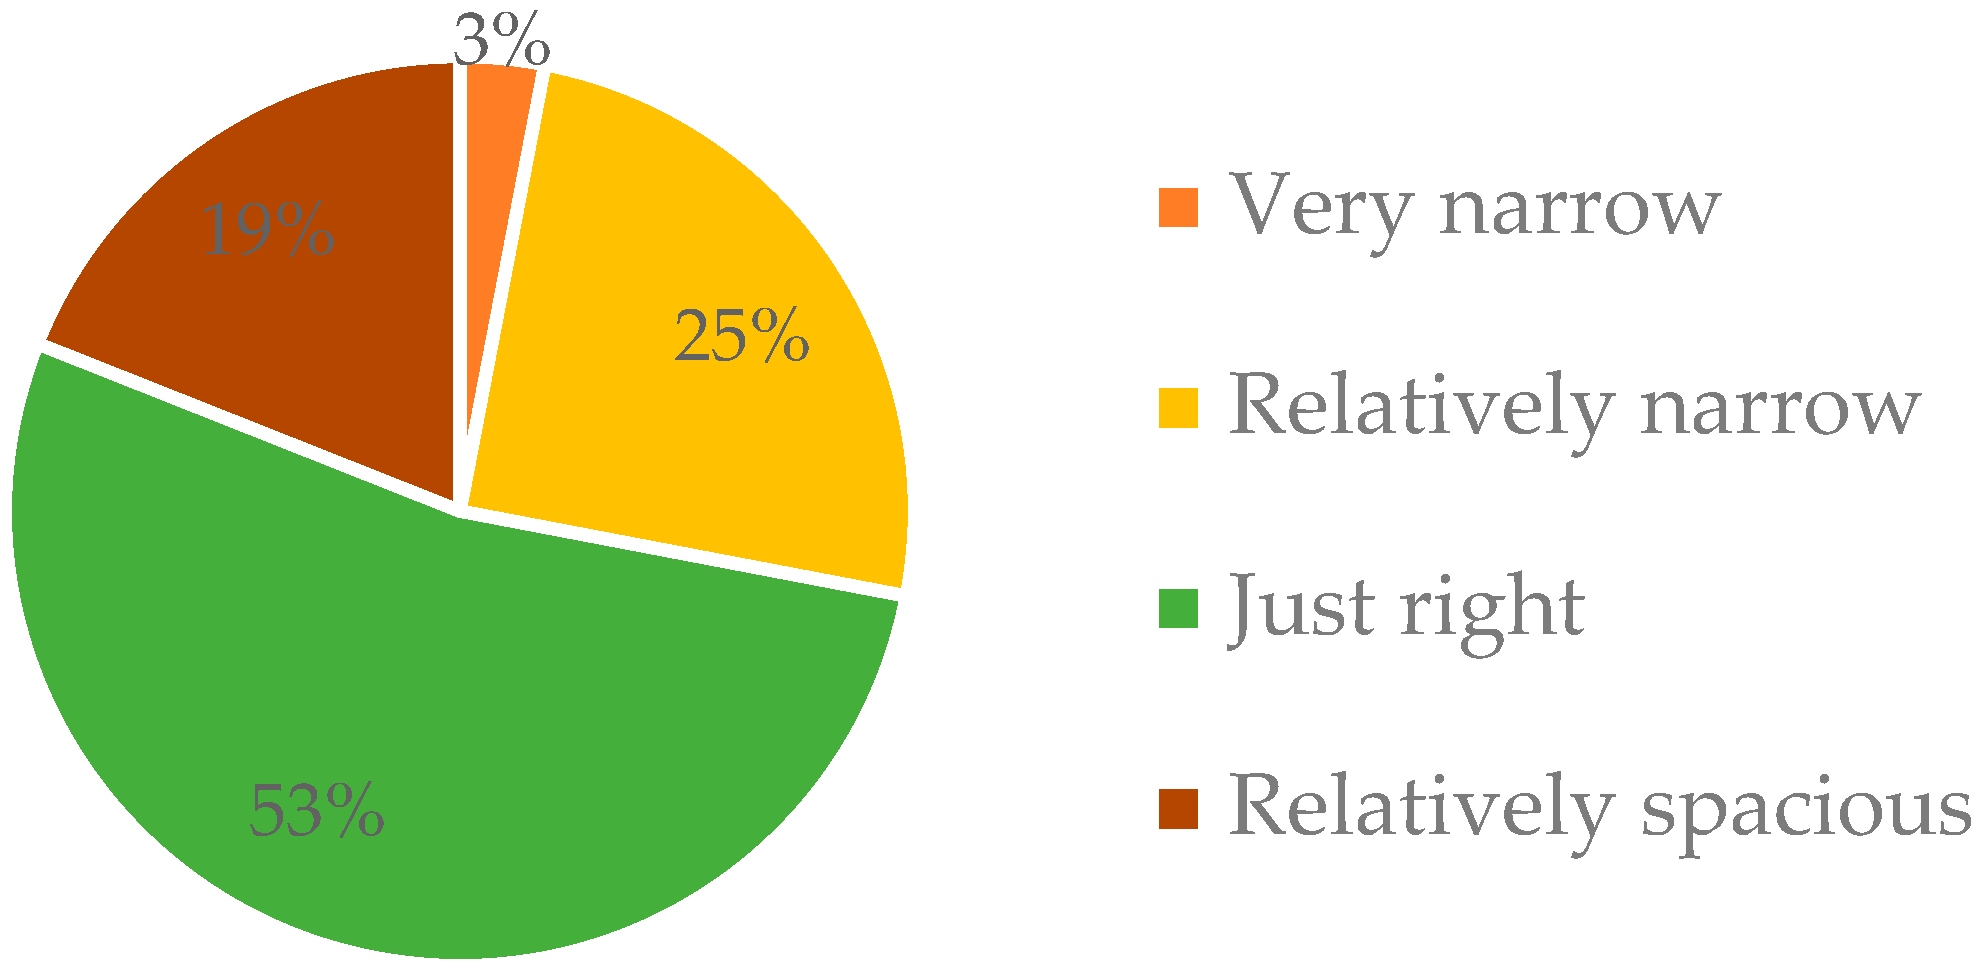
Students’ primary intentions for utilizing the study space tended to be for composite purposes (30%), multi-person meetings (38%), and single goals such as focused self-study (32%) (Figure 5). The evaluation of the visual perception of the space showed that most participants found the space to be relatively moderate. Approximately 53% of users perceived the space to be “just right”, indicating that most people did not perceive the space to be overcrowded or too spacious. In addition, 18.63% of users perceived the space to be “more spacious”, while 25% perceived the space to be “narrower”, and 3% perceived the space to be “very narrow” (Figure 6). This reflects that nearly one-third of the students are not satisfied with the visualization of space, and a small number of them have a negative evaluation of the perception of space. Therefore, although most users are satisfied with space perception, some still think that the space is slightly constricted, and the space layout or design can be moderately optimized in the future to improve users’ visual comfort. However, the design elements that users are most concerned about in this space mainly focus on functionality and comfort.
Outlet coverage (79.4%) and seating density (70.6%) were the two most important factors that the users were concerned about, reflecting the space’s need to provide adequate power and comfortable seating arrangements. This was closely followed by soundproof design (51.0%), showing the importance of a quiet, distraction-free learning environment for users. In contrast, lighting softness (39.2%) and visual effects (18.6%) also received some attention but were given lower priority compared to functional elements. On the other hand, decorative style (11.8%) was considered a key design element by fewer users, suggesting that users are more concerned with the actual functionality of the space than with decorative details. These figures highlight the high demand from users for practicality and comfort in the space (Figure 7).
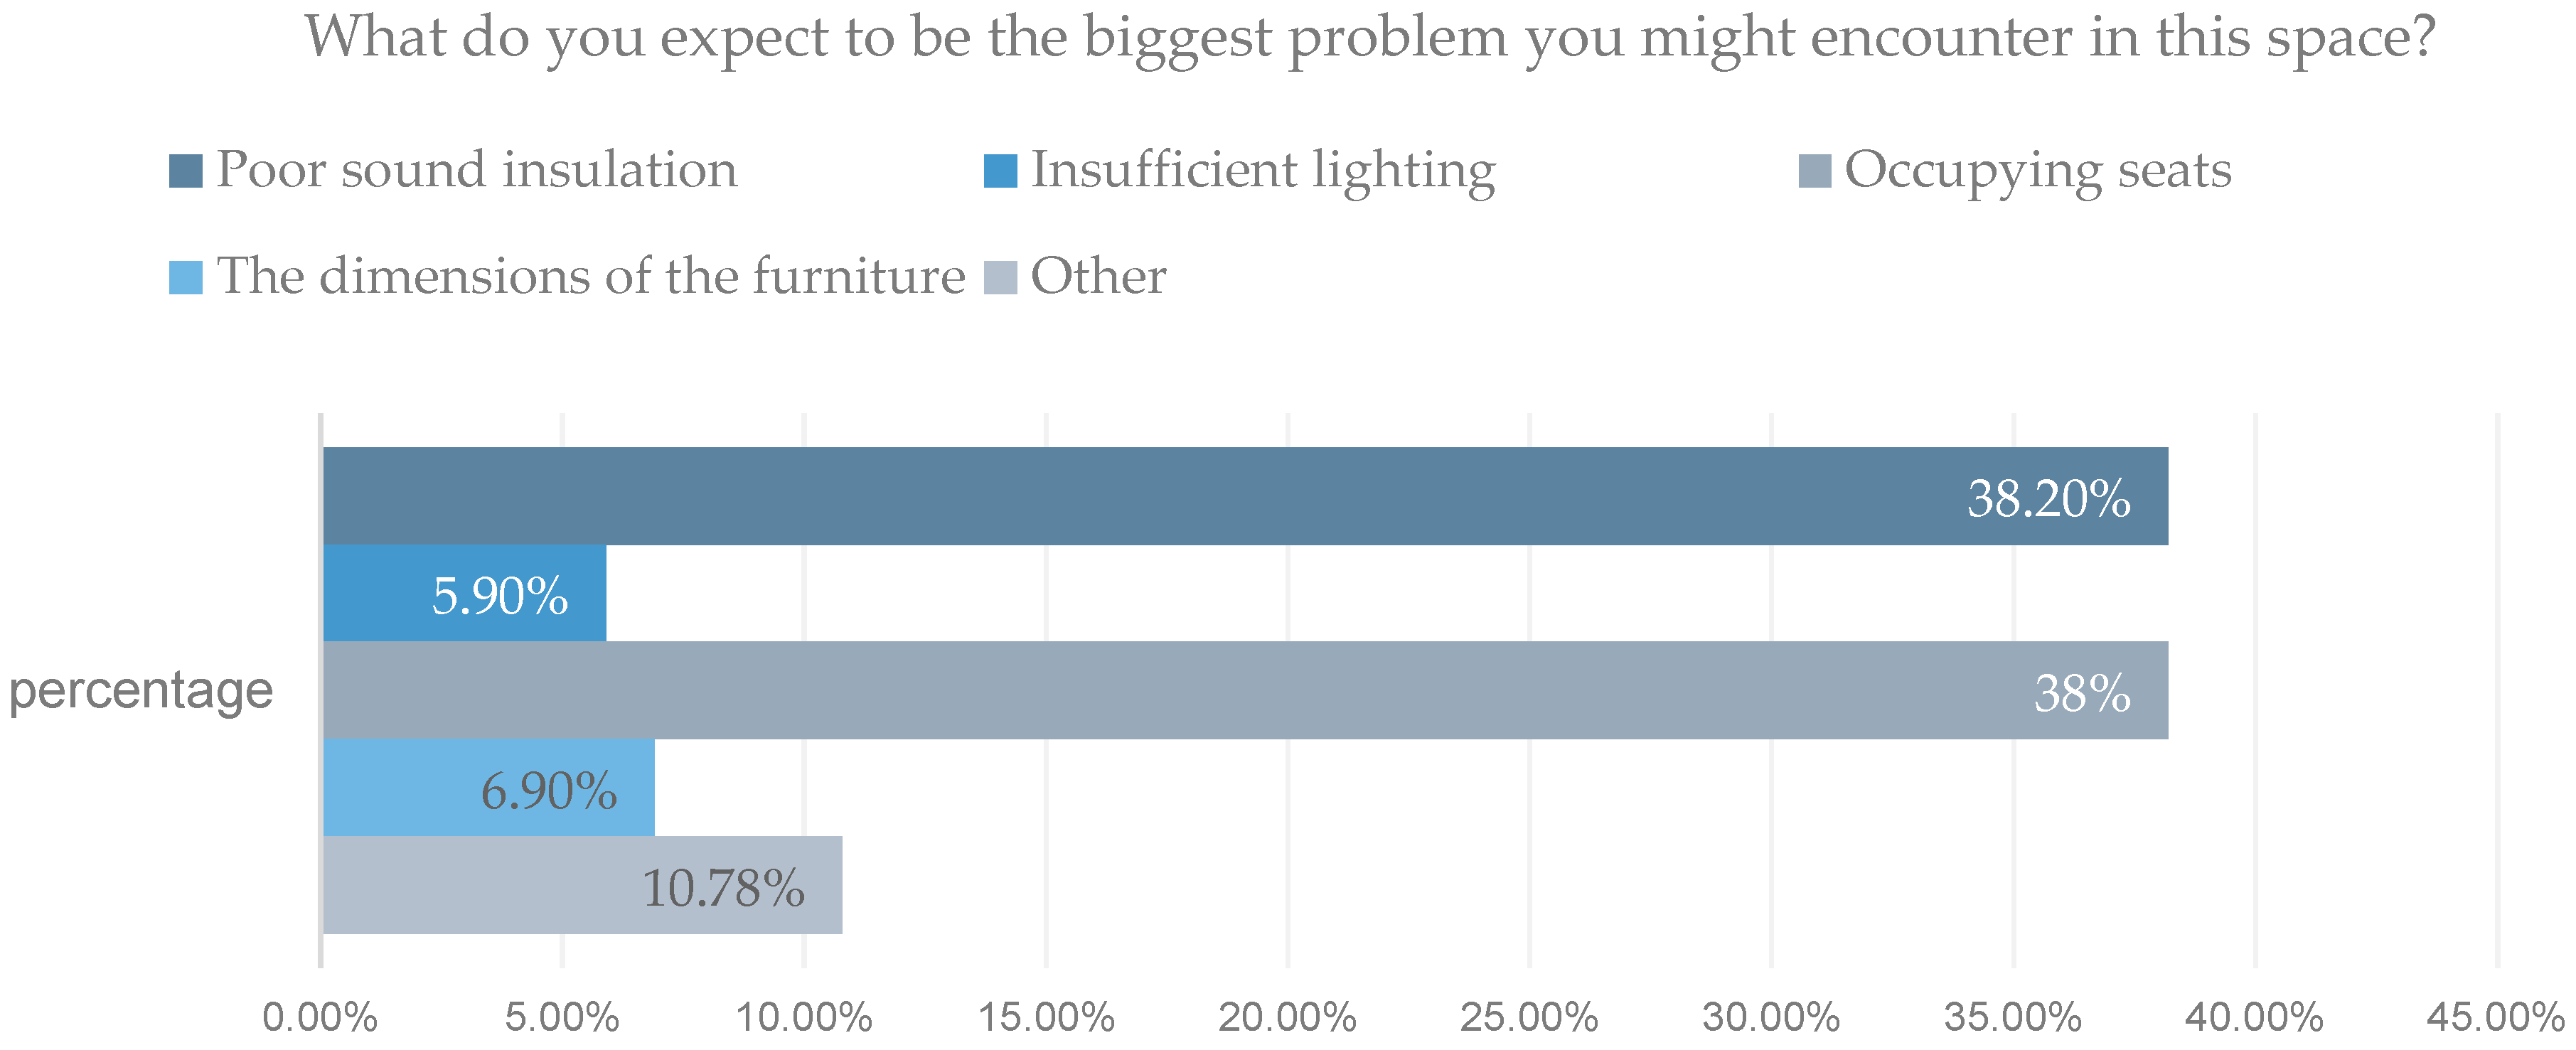
Problem-oriented results show that the biggest problems users may encounter in the space focus on the phenomenon of seat occupancy and poor sound insulation, with 38.2% of users listing these two as the most likely nuisances. This reflects the high demand for seating arrangements and a quiet environment when using the space, especially during high-demand hours when seat occupancy may lead to a degraded experience and sound insulation may affect study or work efficiency. Comparatively, discomfort with the scale of the seating furniture (6.9%) and insufficient lighting (5.9%) are considered minor issues, indicating that users have less need for comfort and natural lighting. Other issues (10.78%) include user personalization concerns, which may involve the layout or other details of the space design (Figure 8). These data suggest that future space designs should focus on seating arrangements and noise control to enhance the efficiency and comfort of space use.

3.3.2. The Difference Between Visual Expectations and Post-Use Evaluations

An analysis of visual expectations and post-assessment of actual-use discrepancies revealed that user expectations before space use were generally high, particularly in the areas of privacy, facility availability, visual comfort, color satisfaction, and noise control. However, post-actual-use feedback indicated that, despite high user satisfaction in most dimensions, there was still a significant gap between expectations and actual perceptions. Specifically, in terms of privacy, although approximately 25.49% of users were neutral about privacy expectations during the pre-testing phase, 17.65% of users gave unsatisfactory feedback after use, indicating that the privacy design did not fully meet the needs of some users. In terms of facility usability, although most users (78.42%) had high expectations for the facility’s functionality during the pre-testing phase, after actual use, although 31.37% of users gave a satisfactory rating, nearly 20% of users still indicated that they rated the facility’s usability as neutral or lower, which suggests that there is a gap between the facility’s utility and users’ needs. On the other hand, visual comfort expectations were high, with approximately 45.1% of users giving high ratings in the pre-screening stage, and ratings dropping after actual use, which reflects that the visual effect of the space fails to fully satisfy users’ expectations, especially in the design of lighting and color matching, which affects the visual comfort experience of some users. In addition, color satisfaction was also more positive in the pre-screening stage, with approximately 47.06% of users giving high scores. However, the feedback after actual use shows that although most users are still satisfied, approximately 12.74% of users still give a neutral evaluation, and 2.94% of users are not very satisfied, which indicates that there are differences in individual preferences for color design. In terms of noise control, 53.92% of the users expressed their concern about the noise problem at the pre-determination stage; however, the feedback after actual use showed that, although 20.59% of the users were satisfied with the noise control, a considerable portion of the users thought that the noise problem had not been effectively solved. This indicated that the noise control design did not fully meet the users’ expectations. These discrepancies reveal potential problems in the design of the space, particularly in terms of noise control, privacy protection, and physical usability of the facility (Table 8 and Table 9). Further design optimization is needed to close the gap between expectations and actual experience and to increase satisfaction with space use.

3.3.3. Behavioral Adaptation and Environmental Triggers

Active behavior change is mainly influenced by physiological needs, with an overall percentage of 73.5%, which is related to the normal metabolism of the human body. Second, spatial visual cues and furniture form induction further affect the behavior, which may originate from other users of the space or behavior change (Table 10).

3.4. Design Priorities for Future Optimization

An analysis of future design priorities for optimization based on the survey results revealed the most important concerns of users when using space. First, soundproofing was identified as the design area most in need of improvement. In this area, 48.04% of the users’ ratings were centered between 1 and 3 (Table 9), indicating that noise issues have a greater impact on users’ learning and working environments. Therefore, sound insulation is clearly a top priority for future design optimization, and there is an urgent need to improve it by optimizing building structures and introducing efficient sound insulation materials. Privacy is the second priority. In the predetermined satisfaction scores, 32.353% of the users gave lower scores (1 and 2) (Table 8), which indicates that some users were not satisfied with the existing privacy design. This result suggests that enhancing privacy is an important direction for improvement to meet user needs. Observing the other aspects: facility usability scored 3.922% out of 1 to 2 in actual satisfaction; visual comfort scored 1.96% out of 1 to 2 in actual satisfaction (Table 9); and color satisfaction scored 2.941% out of 1 to 2 in actual satisfaction, the proportion of low ratings in these aspects was relatively low (Table 9). As a result, facility availability, visual comfort, and color satisfaction were lower priorities in the minds of users than noise and privacy. While these areas still require attention, they are prioritized for improvement less than noise and privacy.

4. Discussion

4.1. Acoustic Problems in Multifunctional Spaces

The study found that students had high concerns about acoustic design before use but were generally dissatisfied with noise control after use. This contradiction reflects the acoustic design flaws of multifunctional rooms, particularly the glass partitions in the middle of the two rooms. Although glass partitions allow two small spaces to form one large space by opening them, this blurring of multifunctional space partitioning exacerbates the spread of noise, as pointed out by activity-based acoustic theory studies. This problem can be solved by, for example, retractable acoustic panels, a technique that has been proven effective in collaborative workspaces [29,30,31], which can reduce noise without affecting the mobility and multifunctional use of the space and can better satisfy the students’ need for a quiet learning environment; therefore it can be used to practice in learning spaces.

4.2. Perceptual Differences in Visual Design

Although the users’ preconceived ratings of visual comfort were high, they dropped after the actual experience. This is mainly due to the fact that the angle at which the photos were taken and the camera’s own filters filtered and self-optimized the actual lighting, as well as the texture of the interior materials to a certain extent, giving the students a visual perception that is inconsistent with the actual experience. A problem of this kind can be extended to renderings for engineering projects, many of which differ from the visual experience of the actual construction [32], resulting in architects not being able to complete the architectural work as expected, leaving the users dissatisfied. This is very important for the future problem of narrowing down the discrepancy between rendering and actual visualization. To narrow this gap, immersive VR simulation technology, which can experience different environments and tactile sensations of materials in different ways, can be used in the pre-design stage. At the same time, it can further optimize the learning space and material selection of the design scheme according to the immersive scene that one sees [33,34], and conduct a post-assessment of the effect of VR after the completion of the construction; thus, the actual effect of the virtual space can be improved through continuous iteration and improvement, narrowing the gap between it and the actual, avoiding the before-and-after visual psychological gap between architects and users.

4.3. The Influence of Physiologically-Driven Behavior on Design

The results of this study showed that physical needs play a dominant role in student behavior change, which challenges the traditional view that spatial aesthetics alone determine user behavior. Users are more likely to prioritize immediate physical needs such as thermal comfort and seat ergonomics. Although real-time sensor data were not collected in this study, there may be a potential link between microclimate change and seat-switching behavior [35]. Therefore, future learning space designs should incorporate responsive environmental systems such as IoT-enabled HVAC systems. By monitoring environmental data in real time, the indoor temperature and humidity can be automatically adjusted to meet the physiological needs of users and enhance the comfort of space use.

4.4. Color Design and Cognitive Performance

Students show a high affinity for green- and wood-toned environments, a preference that is consistent with biophilic design principles [36]. Natural tones can reduce cognitive fatigue and enhance attention, whereas artificial tones, such as pink, may interfere with attention (Figure 9). Therefore, in learning space design, color design should be used rationally according to the functions of different areas. For example, calm colors are used in the learning area to help students focus their attention, whereas vibrant colors are used in the cooperation area to stimulate students’ enthusiasm for communication and collaboration. Simultaneously, color design is combined with ecological plants, wood-colored materials, and learning space design [37] to create a restorative microenvironment to further enhance the students’ learning experience.
Color psychology studies demonstrate differential impacts of object colors versus illuminated colors on emotional responses. Specifically, natural wood tones enhance cognitive focus, while artificial pink hues may disrupt attention stability [38,39,40,41]. For red, green, and blue, object color was rated higher than “comfortable” and “stable” positive responses to light colors. However, for yellow, the response between the object color and the light color was only slightly different. In addition to the general color design principles, the characteristics of the target user group should also be considered. For example, users of different ages have different color preferences, and there is a correlation with the seasons [42]. By considering these factors, the color design of a space can be made more valuable for enhancing learning productivity.

4.5. Transformation of Space Design

“Comfort assurance” and “flexibility” are higher on the design priority list, reflecting the shift from static space design to user-centered adaptive space design. According to cybernetic design theory [43], real-time data collected by occupancy sensors and environmental monitors are utilized and fed into an artificial intelligence-driven system that can dynamically adjust the lighting, acoustics, and layout of a space. For example, spaces can be automatically converted to separate high-privacy spaces [44] when users require periods of high privacy, and zoning shrinks to promote collaboration among students during group project activities. This modular and adaptive design concept [45] can better meet the needs of different learning scenarios, particularly in terms of soundproofing, and improve the efficiency of space use and user satisfaction.

4.6. Research Limitations and Future Research Directions

This study had some limitations. On the one hand, while self-reported data captured subjective perceptions, future studies should integrate IoT sensors and eye-tracking to objectively quantify behavioral patterns [46]. These objective metrics are crucial for an in-depth understanding of students’ space use behaviors. On the other hand, this study did not consider the effect of seasons on space use, and there are differences in space needs among users from different disciplines [47]; therefore, there is a lack of comparative studies across disciplines. Future research could conduct longitudinal studies to track students’ space use in different seasons and course schedules, strengthen collaboration with environmental behavior [48], integrate the Internet of Things [49], and other multidisciplinary disciplines to obtain a more comprehensive study of space satisfaction richer datasets, optimize adaptive space design algorithms [50,51], and promote further development of learning space design.

5. Conclusions

Over time, this design field has gradually become a focus of attention in the education sector and even in the community, attracting the attention of many researchers, educators, and related professionals. Everyone realizes that a well-designed learning environment plays an indispensable role in the growth of students and the improvement of education quality [52,53]. This study systematically deconstructed the complex mechanism of the post-use evaluation of educational spaces using a multidimensional coupled analysis approach. It was found that the dynamic efficacy of the learning space and user behavioral patterns were characterized by significant spatiotemporal heterogeneity. And this revealed the structural contradiction between functional presets and behavioral realities: in the process of functional evolution of study space, the composite use scenario and the linear thinking of facility configuration produced a significant conflict. Quantitative studies of spatial perception dimensions have shown that there is a significant cognitive bias between visual comfort and spatial accessibility. Through the cross-analysis of spatial syntax and environmental psychology, it was found that about one-third of the users have spatial cognitive misalignment, and this cognitive bias is closely related to the modular design of the spatial layout. Behavioral adaptive adjustments in spatial use present obvious environmental triggering characteristics, and the coupling of physiological rhythms and spatial microclimate forms a dynamic behavioral response mechanism. Based on the results of empirical research, this study proposes a three-fold strategy framework for adaptive space optimization:
(1)
We build a dynamic response environment regulation system, realizing real-time adjustment of acoustic environment and thermal comfort through intelligent perception technology;
(2)
We establish a virtual reality preview mechanism for visual consistency, and eliminate the cognitive gap between the design anticipation and the use experience by using the digital twin technology;
(3)
We create a multi-scale spatial resilience design;
(4)
Finally, we create a multi-scale spatial elasticity design paradigm to realize flexible conversion of spatial functions through modular components and variable interfaces.
It is worth noting that this study found that the synergistic application of color psychology and biophilic design can significantly improve the quality of spatial experience. Neuroscience-driven design principles offer a novel pathway to humanize educational spaces. The methodological innovation of this study lies in the construction of a closed-loop evaluation system of “anticipation–perception–behavior”, which combines the mixed methods of quantitative and qualitative research and breaks through the static analytical framework of traditional post-use evaluation. However, there are still some limitations in this study, which are mainly manifested in the insufficient spatial and temporal density of behavioral data collection. Future research needs to deepen the exploration of the dynamic evolution law of spatial efficacy, enhance the spatial and temporal density of behavioral data collection through the Internet of Things (IoT) technology, and promote the interdisciplinary fusion of neuroscience, artificial intelligence, and environmental behavioral sciences to build a more biologically adaptive intelligent educational spatial ecosystem.

Author Contributions

Conceptualization, Y.G. and J.S.; methodology, Y.G.; software, Y.G.; validation, J.S. and Y.G.; formal analysis, Y.G.; investigation, Y.G.; resources, J.S.; data curation, Y.G.; writing—original draft preparation, Y.G.; writing—review and editing, J.S.; visualization, Y.G.; supervision, J.S.; project administration, J.S.; funding acquisition, J.S. All authors have read and agreed to the published version of the manuscript.

Funding

This research was funded by General Project of the Social Science Planning of Shandong Province, China, grant number No. 22CWYJ35; Funding Projects: (1) Research on the Renewal of Buildings and Their Environment Based on the POE Theory, a General Project of the Postgraduate Scientific Research Innovation Fund of Yantai University, GGIFYTU2558, Discipline Classification: Architecture. (2) Research on the Theoretical Interpretation and Realization Path of Rural Green Development from the Perspective of “Double Carbon”, a General Project of the Social Science Planning of Shandong Province in 2022, 22CWYJ35, Discipline Classification: Art.

Institutional Review Board Statement

After carefully studying and analyzing relevant Chinese laws, regulations, and policy documents, we believe that ethical approval is not required for this research. The specific basis is as follows: According to Article 32 of the “Measures for Ethical Review of Life Science and Medical Research Involving Humans”, when conducting research using human information data, if it does not cause harm to the human body, does not involve sensitive personal information, or commercial interests, ethical review can be waived. This questionnaire research has the following characteristics: (1) No harm to the human body: This questionnaire research only collects information such as the opinions, attitudes, and behaviors of participants by distributing questionnaires. The entire process does not involve any direct contact, intervention, or invasive operations on the participants’ bodies, and there is no possibility of causing physical harm to the participants. Moreover, during the research process, the design of our questions fully considers the possible psychological impacts on the participants. We avoid asking questions that may cause psychological discomfort or mental stress, fundamentally eliminating the risk of psychological harm to the participants. (2) No involvement of sensitive personal information: Referring to the “Personal Information Protection Law of the People’s Republic of China”, sensitive personal information includes biometric identification, religious beliefs, specific identities, medical health, financial accounts, travel trajectories, and other information, as well as the personal information of minors under the age of 14. The information collected in this questionnaire only focuses on general content related to the research topic and does not involve any of the above—mentioned sensitive personal information categories, effectively avoiding the risk of privacy leakage that may occur during information collection. (3) No association with commercial interests: This research is led by Yantai University. No enterprises or commercial institutions participate in or fund the entire research process, and the research results will not be used for commercial promotion, product marketing, or to serve specific commercial interests. There is no possibility that commercial interests will interfere with the objectivity of the research or damage the rights and interests of the participants. In conclusion, this questionnaire research fully complies with the circumstances stipulated in the “Measures for Ethical Review of Life Science and Medical Research Involving Humans” for waiving ethical review. In the “Institutional Review Board Statement” section, we hereby state that this research does not require ethical approval. The basis is Article 32 of the “Measures for Ethical Review of Life Science and Medical Research Involving Humans”. During the process of using human information data in this research, there is no situation of causing harm to the human body, involving sensitive personal information, or commercial interests. Since this research does not need to be reviewed and approved by an ethics committee, there is no name of an ethics committee providing an exemption. However, we solemnly promise that during the implementation of the research, we will strictly abide by relevant laws, regulations, and scientific research ethics norms, effectively protect the rights and interests of the participants, and ensure the authenticity and reliability of the research data, as well as the science and standardization of the research process.

Informed Consent Statement

Informed consent was obtained from all subjects involved in the study.

Data Availability Statement

Data will be made available on request. The data are not publicly available due to privacy.

Conflicts of Interest

The authors declare no conflicts of interest.

References

  1. Liu, Q.; Ren, J. Research on the building energy efficiency design strategy of Chinese universities based on green performance analysis. Energy Build. 2020, 224, 110242. [Google Scholar] [CrossRef]
  2. Wu, X.; Oldfield, P. How “Civic” the Trend Developed in the Histories of the Universities. Open J. Soc. Sci. 2015, 3, 11–14. [Google Scholar] [CrossRef]
  3. Wu, X.; Kou, Z.; Oldfield, P.; Heath, T.; Borsi, K. Informal learning spaces in higher education: Student preferences and activities. Buildings 2021, 11, 252. [Google Scholar] [CrossRef]
  4. Riddle, M.D.; Souter, K. Designing Informal Learning Spaces Using Student Perspectives. J. Learn. Spaces 2012, 1, 21586195. [Google Scholar]
  5. Lam, E.W.M.; Chan, D.W.M.; Wong, I. The Architecture of Built Pedagogy for Active Learning—A Case Study of a University Campus in Hong Kong. Buildings 2019, 9, 230. [Google Scholar] [CrossRef]
  6. Scott-Webber, L. Institutions, educators, and designers: Wake up! Current Teaching and Learning Places along with Teaching Strategies Are Obsolete-Teaching Styles and Learning Spaces Must Change for 21st-Century Needs. Gen. Inf. 2012, 20, 41–55. [Google Scholar]
  7. Alhusban, A.A.; Alhusban, S.A.; Al-Betawi, Y.N. The degree of the Hashemite university students’ desires, needs, and satisfaction with their campus urban design. J. Place Manag. Dev. 2019, 12, 408–448. [Google Scholar] [CrossRef]
  8. Chen, Y.; Wu, J.; Zou, Y.; Dong, W.; Zhou, X. Optimal Design and Verification of Informal Learning Spaces (ILS) in Chinese Universities Based on Visual Perception Analysis. Buildings 2022, 12, 1495. [Google Scholar] [CrossRef]
  9. Salih, S.A.; Alzamil, W.; Ajlan, A.; Azmi, A.; Ismail, S. Typology of Informal Learning Spaces (ILS) in Sustainable Academic Education: A Systematic Literature Review in Architecture and Urban Planning. Sustainability 2024, 16, 5623. [Google Scholar] [CrossRef]
  10. Cox, A.M. Space and embodiment in informal learning. High. Educ. 2018, 75, 1077–1090. [Google Scholar] [CrossRef]
  11. Martinez-Molina, A.; Boarin, P.; Tort-Ausina, I.; Vivancos, J.-L. Post-occupancy evaluation of a historic primary school in Spain: Comparing PMV, TSV and PD for teachers’ and pupils’ thermal comfort. Build. Environ. 2017, 117, 248–259. [Google Scholar] [CrossRef]
  12. Lotfy, M.W.; Kamel, S.; Hassan, D.K.; Ezzeldin, M. Academic libraries as informal learning spaces in architectural educational environment. Ain Shams Eng. J. 2022, 13, 101781. [Google Scholar] [CrossRef]
  13. Tian, Y. Informal Learning Spaces in the Libraries of American Colleges and Universities in the Information Age. In Design Community; China Construction Industry Press: Beijing, China, 2015; pp. 44–55. [Google Scholar]
  14. O’Neill, M. Limitless Learning: Creating Adaptable Environments to Support a Changing Campus. Plan. High. Educ. J. 2013, 4, 11–27. [Google Scholar]
  15. Singer-Brodowski, M. The potential of transformative learning for sustainability transitions: Moving beyond formal learning environments. Environ. Dev. Sustain. 2023, 1–19. [Google Scholar] [CrossRef]
  16. DeFrain, E.L.; Thoegersen, J.; Hong, M. Standing out or blending in: Academic libraries in the crowded informal learning space ecosystem. Coll. Res. Libr. 2022, 83, 45. [Google Scholar] [CrossRef]
  17. Feng, Z.; Hou, H.; Lan, H. Understanding university students’ perceptions of classroom environment: A synergistic approach integrating grounded theory (GT) and analytic hierarchy process (AHP). J. Build. Eng. 2024, 83, 108446. [Google Scholar] [CrossRef]
  18. Llinares, C.; Higuera-Trujillo, J.L.; Serra, J. Cold and warm coloured classrooms. Effects on students’ attention and memory measured through psychological and neurophysiological responses. Build. Environ. 2021, 196, 107726. [Google Scholar] [CrossRef]
  19. Peng, L.; Wei, W.; Gong, Y.; Jia, R. University library space renovation based on the user learning experience in two Wuhan universities. Int. J. Environ. Res. Public Health 2022, 19, 10395. [Google Scholar] [CrossRef]
  20. Yu, J.; Vermunt, J.D.; Burke, C. Students’ learning patterns and learning spaces in higher education: An empirical investigation in China. High. Educ. Res. Dev. 2021, 40, 868–883. [Google Scholar] [CrossRef]
  21. Bower, I.; Tucker, R.; Enticott, P.G. Impact of built environment design on emotion measured via neurophysiological correlates and subjective indicators: A systematic review. J. Environ. Psychol. 2019, 66, 101344. [Google Scholar] [CrossRef]
  22. Wu, X.; Oldfield, P.; Heath, T. Spatial openness and student activities in an atrium: A parametric evaluation of a social informal learning environment. Build. Environ. 2020, 182, 107141. [Google Scholar] [CrossRef]
  23. Peng, L.; Wei, W.; Fan, W.; Jin, S.; Liu, Y. Student experience and satisfaction in academic libraries: A comparative study among three universities in Wuhan. Buildings 2022, 12, 682. [Google Scholar] [CrossRef]
  24. Chen, Y.; Hong, J.; Xiao, Y.; Zhang, H.; Wu, J.; Shi, Q. Multimodal Intelligent Flooring System for Advanced Smart-Building Monitoring and Interactions. Adv. Sci. 2024, 11, 2406190. [Google Scholar] [CrossRef]
  25. Oh, S.; Ji, H.; Kim, J.; Park, E.; del Pobil, A.P. Deep learning model based on expectation-confirmation theory to predict customer satisfaction in hospitality service. Inf. Technol. Tour. 2022, 24, 109–126. [Google Scholar] [CrossRef]
  26. Jiang, H.; Wang, M.; Shu, X. Scientometric analysis of post-occupancy evaluation research: Development, frontiers and main themes. Energy Build. 2022, 271, 112307. [Google Scholar] [CrossRef]
  27. Sheridan, D.J.; Anderson, A.N.; Rapp, J.T. A Cross-Cultural Replication and Validation of the Generalized Pliance and Tracking Questionnaire. Psychol. Rec. 2024, 74, 313–317. [Google Scholar] [CrossRef]
  28. Song, X.; Wang, Z.; Meng, X.; Liu, M. A Qualitative Study on University Students’ Restorative Experience of the Library Space Environment. Buildings 2024, 14, 1641. [Google Scholar] [CrossRef]
  29. St-Jean, P.; Clark, O.G.; Jemtrud, M. A review of the effects of architectural stimuli on human psychology and physiology. Build. Environ. 2022, 219, 109182. [Google Scholar] [CrossRef]
  30. Li, J.; Chen, S.; Xu, H.; Kang, J. Effects of implanted wood components on environmental restorative quality of indoor informal learning spaces in college. Build. Environ. 2023, 245, 110890. [Google Scholar] [CrossRef]
  31. Bonett, D.G. Sample size requirements for testing and estimating coefficient alpha. J. Educ. Behav. Stat. 2002, 27, 235–240. [Google Scholar] [CrossRef]
  32. Kim, H.-S.; Ma, P.-S.; Kim, B.-K.; Kim, S.-R.; Lee, S.-H. Low-frequency sound absorption of elastic micro-perforated plates in a parallel arrangement. J. Sound Vib. 2019, 460, 114884. [Google Scholar] [CrossRef]
  33. Wang, Z.; Lu, X.; An, F.; Zhou, L.; Wang, X.; Wang, Z.; Zhang, H.; Yun, T. Integrating Real Tree Skeleton Reconstruction Based on Partial Computational Virtual Measurement (CVM) with Actual Forest Scenario Rendering: A Solid Step Forward for the Realization of the Digital Twins of Trees and Forests. Remote Sens. 2022, 14, 6041. [Google Scholar] [CrossRef]
  34. Delgado, J.M.D.; Oyedele, L.; Demian, P.; Beach, T. A research agenda for augmented and virtual reality in architecture, engineering and construction. Adv. Eng. Inform. 2020, 45, 101122. [Google Scholar] [CrossRef]
  35. Marougkas, A.; Troussas, C.; Krouska, A.; Sgouropoulou, C. Virtual reality in education: A review of learning theories, approaches and methodologies for the last decade. Electronics 2023, 12, 2832. [Google Scholar] [CrossRef]
  36. Lin, B.R.; Zhang, D.Y.; Zeng, Y.Y.; Li, S.S.; Yuan, M.F. Design and Exploration of Indoor Environment Creation in Healthy Buildings Based on a People-oriented Approach. Contemp. Archit. 2025, 1, 33–39. (In Chinese) [Google Scholar]
  37. Ko, W.H.; Schiavon, S.; Zhang, H.; Graham, L.T.; Brager, G.; Mauss, I.; Lin, Y.-W. The impact of a view from a window on thermal comfort, emotion, and cognitive performance. Build. Environ. 2020, 175, 106779. [Google Scholar] [CrossRef]
  38. Loredan, N.P.; Niemelä, E.P.; Šarabon, N. Classroom Interior Design: Wooden Furniture Prototype with Feedback from Students and Teachers. Buildings 2024, 147, 2193. [Google Scholar] [CrossRef]
  39. Lee, H.; Park, J.; Lee, J. Comparison between psychological responses to ‘object colour produced by paint colour’and ‘object colour produced by light source’. Indoor Built Environ. 2021, 30, 502–519. [Google Scholar] [CrossRef]
  40. Sun, Y.; Qi, N.; Zhan, J.; Yin, J. The Impact of Cool and Warm Color Tones in Classrooms on the Perceived Emotions of Elementary School Students in Northwest China. Buildings 2024, 14, 3309. [Google Scholar] [CrossRef]
  41. Hou, Y.; Gou, B.; Liao, J.; Zhang, Y.; Huang, Q.; Sun, B. Innovative Sports Venue Colors and Consumers’ Satisfaction Based on Multilevel Data: The Mediating Effect of Athletes’ Perceived Emotional Value. Buildings 2024, 14, 3674. [Google Scholar] [CrossRef]
  42. Tao, W.; Wu, Y.; Li, W.; Liu, F. Influence of classroom colour environment on college students’ emotions during campus lockdown in the COVID-19 post-pandemic era—A case study in Harbin, China. Buildings 2022, 12, 1873. [Google Scholar] [CrossRef]
  43. Wen, Y.; Chung, J.; Himeno, Y.; Yu, Y. Seasonal variations in city color preferences incorporating sex and age factors. J. Asian Archit. Build. Eng. 2024, 1–16. [Google Scholar] [CrossRef]
  44. Sweeting, B.; Sutherland, S. Design’s secret partner in research: Cybernetic practices for design research pedagogy. Syst. Res. Behav. Sci. 2023, 40, 765–771. [Google Scholar] [CrossRef]
  45. Gao, H.; Zhang, Z.; Zhao, H. Personalized Privacy Protection Based on Space Grid in Mobile Crowdsensing. Appl. Sci. 2023, 13, 12696. [Google Scholar] [CrossRef]
  46. Shen, L.; Han, Y. Optimizing the modular adaptive façade control strategy in open office space using integer programming and surrogate modelling. Energy Build. 2022, 254, 111546. [Google Scholar] [CrossRef]
  47. Liu, Y.; Zhou, J. A Review of Eye-Tracking Applications in Biophilic Design. Build. Environ. 2024, 267, 112179. [Google Scholar] [CrossRef]
  48. Sibilla, M.; Kurul, E. Exploring transformative pedagogies for built environment disciplines: The case of interdisciplinarity in low carbon transition. Build. Res. Inf. 2021, 49, 234–247. [Google Scholar] [CrossRef]
  49. Schweiker, M.; Ampatzi, E.; Andargie, M.S.; Andersen, R.K.; Azar, E.; Barthelmes, V.M.; Berger, C.; Bourikas, L.; Carlucci, S.; Chinazzo, G.; et al. Review of multi-domain approaches to indoor environmental perception and behaviour. Build. Environ. 2020, 176, 106804. [Google Scholar] [CrossRef]
  50. Zhou, C.; Ding, L.Y. Safety barrier warning system for underground construction sites using Internet-of-Things technologies. Autom. Constr. 2017, 83, 372–389. [Google Scholar] [CrossRef]
  51. Tabadkani, A.; Dehnavi, A.N.; Mostafavi, F.; Naeini, H.G. Targeting modular adaptive façade personalization in a shared office space using fuzzy logic and genetic optimization. J. Build. Eng. 2023, 69, 106118. [Google Scholar] [CrossRef]
  52. Luo, Z.; Sun, C.; Dong, Q.; Qi, X. Key control variables affecting interior visual comfort for automated louver control in open-plan office—A study using machine learning. Build. Environ. 2022, 207, 108565. [Google Scholar] [CrossRef]
  53. Zhussupbekov, M.; Memon, S.A.; Khawaja, S.A.; Nazir, K.; Kim, J. Forecasting energy demand of PCM integrated residential buildings: A machine learning approach. J. Build. Eng. 2023, 70, 106335. [Google Scholar] [CrossRef]
Figure 1. Evaluation process from data collection to strategy optimization.
Buildings 15 01831 g001
Figure 2. Location of the Student Service Center and its surrounding environment.
Buildings 15 01831 g002
Figure 3. Partitioning and locations of various types of learning spaces.
Buildings 15 01831 g003
Figure 4. Scree Plot.
Buildings 15 01831 g004
Figure 5. Distribution of intended uses for the learning space.
Buildings 15 01831 g005
Figure 6. User perceptions of visual space dimensions.
Buildings 15 01831 g006
Figure 7. Attention degree to spatial design elements.
Buildings 15 01831 g007
Figure 8. Prediction of spatial challenge problems.
Buildings 15 01831 g008
Figure 9. Color design and cognitive performance.
Buildings 15 01831 g009
Table 1. User behavior statistics of the space.
User Behavior and Classification Statistics
Main behaviorsAccompanied by other behaviors
Single
purpose
Focus on self-studyCharging with socket
Look out the window
Take a nap on your stomach
Go to the bathroom
Water connection
Small seminarsCharging with socket
Connect large screen
Eat snacks between meals
Play games
Rehearsal activities
Go to the bathroom
Rest and relaxSee the indoor exhibition
Lie down and sleep
Reading miscellaneous books
Go to the bathroom
Multiplayer meetingCharging with socket
Connect large screen
Water connection
Take notes
Composite purposeFocus on self-study + rest in other spaces
Focus on self-study + waiting for friends/activities
Relax + chat with friends
Small discussion + Entertainment
Table 2. Reliability statistical data of the questionnaire for the Student Service Center.
Cronbach’s AlphaNumber of Items
0.9210
Table 3. KMO correlation and Bartlett’s Test of Sphericity.
KMO and Bartlett’s Test
KMO Measure of Sampling Adequacy0.811
Bartlett’s Test of SphericityApproximate chi-square value
Degree of freedom (df)
Significance level (p-value)
576.947
45
0.000
Table 4. Results of the exploratory factor analysis of the satisfaction questionnaire for the Student Service Center: total variance results.
Total Variance Explained
ComponentInitial EigenvaluesSum of Squared Loadings ExtractedSum of Squared Loadings after Rotation
TotalPercentage of VarianceCumulative
%
TotalPercentage of VarianceCumulative
%
TotalPercentage of VarianceCumulative
%
13.89538.94938.9493.89538.94938.9493.43434.34534.345
22.86528.64667.5952.86528.64667.5953.32533.25067.595
30.6746.73974.334
40.5745.73680.070
50.4654.65284.722
60.4604.60489.326
70.4324.32093.646
80.3703.69897.344
90.1441.43698.780
100.1221.220100.000
Extraction method: Principal Component Analysis.
Table 5. Exploratory factor analysis of the satisfaction questionnaire for the student service center: rotated component matrix.
The Rotated Component Matrix
Component 1Component 2
Predict the satisfaction score0.0990.937
Facility Availability 0.1740.824
Visual Comfort −0.0290.685
Color Satisfaction−0.0990.794
Noise Prediction0.1770.802
Actual satisfaction score0.9370.109
Facility Availability0.7210.076
Visual Comfort0.827−0.011
Color Satisfaction0.7940.091
Noise Satisfaction0.8010.015
Table 6. Predict the correlation score of satisfaction.
Predicted PrivacyFacility AvailabilityVisual ComfortColor SatisfactionNoise Prediction
Predicted Privacy1 (0.000 ***)0.424 (0.000 ***)0.321 (0.001 ***)0.362 (0.000 ***)0.495 (0.000 ***)
Facility Availability0.424 (0.000 ***)1 (0.000 ***)0.577 (0.000 ***)0.545 (0.000 ***)0.251 (0.011**)
Visual Comfort0.321 (0.001 ***)0.577 (0.000 ***)1 (0.000 ***)0.865 (0.000 ***)0.331 (0.001 ***)
Color Satisfaction0.362 (0.000 ***)0.545 (0.000 ***)0.865 (0.000 ***)1 (0.000 ***)0.341 (0.000 ***)
Noise Prediction0.495 (0.000 ***)0.251 (0.011 **)0.331 (0.001 ***)0.341 (0.000 ***)1 (0.000 ***)
Note: ***, **, and * represent the significance levels of 1%, 5%, and 10%, respectively.
Table 7. Actual the correlation score of satisfaction.
Actual PrivacyFacility AvailabilityVisual ComfortColor Satisfaction Noise Satisfaction
Actual Privacy1 (0.000 ***)0.449 (0.000 ***)0.332 (0.001 ***)0.326 (0.001 ***)0.511 (0.000 ***)
Facility Availability0.449 (0.000 ***)1 (0.000 ***)0.633 (0.000 ***)0.605 (0.000 ***)0.34 (0.000 ***)
Visual Comfort0.332 (0.001 ***)0.633 (0.000 ***)1 (0.000 ***)0.772 (0.000 ***)0.366 (0.000 ***)
Color Satisfaction0.326 (0.001 ***)0.605 (0.000 ***)0.772 (0.000 ***)1 (0.000 ***)0.46 (0.000 ***)
Noise Satisfaction0.511 (0.000 ***)0.34 (0.000 ***)0.366 (0.000 ***)0.46 (0.000 ***)1 (0.000 ***)
Note: ***, **, and * represent the significance levels of 1%, 5%, and 10%, respectively.
Table 8. Predict the correlation score of satisfaction.
Descriptive Statistics of Predicted Satisfaction Scores
TitleScore12345
PrivacyFrequency924262320
Percentage (%)8.82423.52925.4922.54919.608
Facility availabilityFrequency15164733
Percentage (%)0.984.90215.68646.07832.353
Visual comfortFrequency33123846
Percentage (%)2.9412.94111.76537.25545.098
Color satisfactionFrequency3374148
Percentage (%)2.9412.9416.86340.19647.059
Noise predictionFrequency914323116
Percentage (%)8.82413.72531.37330.39215.686
Table 9. Scores related to actual satisfaction.
Descriptive Statistics of Actual Satisfaction Scores
TitleScore12345
PrivacyFrequency618322818
Percentage (%)5.88217.64731.37327.45117.647
Facility availabilityFrequency22145232
Percentage (%)1.9611.96113.72550.9831.373
Visual comfortFrequency11144640
Percentage (%)0.980.9813.72545.09839.216
Color satisfactionFrequency12135036
Percentage (%)0.981.96112.74549.0235.294
Noise satisfactionFrequency912283221
Percentage (%)8.82411.76527.45131.37320.588
Table 10. Proportions and percentages of inducing behavioral factors.
Inducing Behavioral FactorsFrequencyPercentage
Furniture Forms3231.4%
Physiological Drives7573.5%
Spatial Visual Cues3736.3%
Others22.0%
Disclaimer/Publisher’s Note: The statements, opinions and data contained in all publications are solely those of the individual author(s) and contributor(s) and not of MDPI and/or the editor(s). MDPI and/or the editor(s) disclaim responsibility for any injury to people or property resulting from any ideas, methods, instructions or products referred to in the content.