2. Materials and Methods
2.1. Research Object
Based on a comprehensive survey of 96 boiler rooms in Shenyang, the transformation modes of these facilities can be classified into two primary categories. The first category is community service-oriented transformation, which involves converting boiler rooms into facilities such as community service centers, nursing centers, and party or mass service centers. These transformations are designed to address the fundamental needs of residents, focusing on enhancing daily life and welfare services within the community. The second category is community- and social needs-oriented transformation, exemplified by conversions into badminton clubs, chess and card rooms, and bookstores. These transformations not only cater to community residents but also attract participation from external social groups, thereby offering greater openness and public engagement.
This study investigates the impact of these distinct transformation modes on the vitality of aging communities. To isolate the effects of boiler room renovation types and minimize the influence of external variables, several factors were controlled during the selection of research objects. First, the household group structure was standardized, with the three selected communities exhibiting similar population sizes and demographic profiles. Second, all three communities are situated within the same administrative district of Shenyang, sharing comparable urban development contexts and policy environments, which mitigates the impact of locational disparities. Third, the distribution of surrounding service facilities—such as schools, hospitals, and commercial establishments—is relatively balanced across the three communities, reducing the potential influence of external facility differences on community vitality.
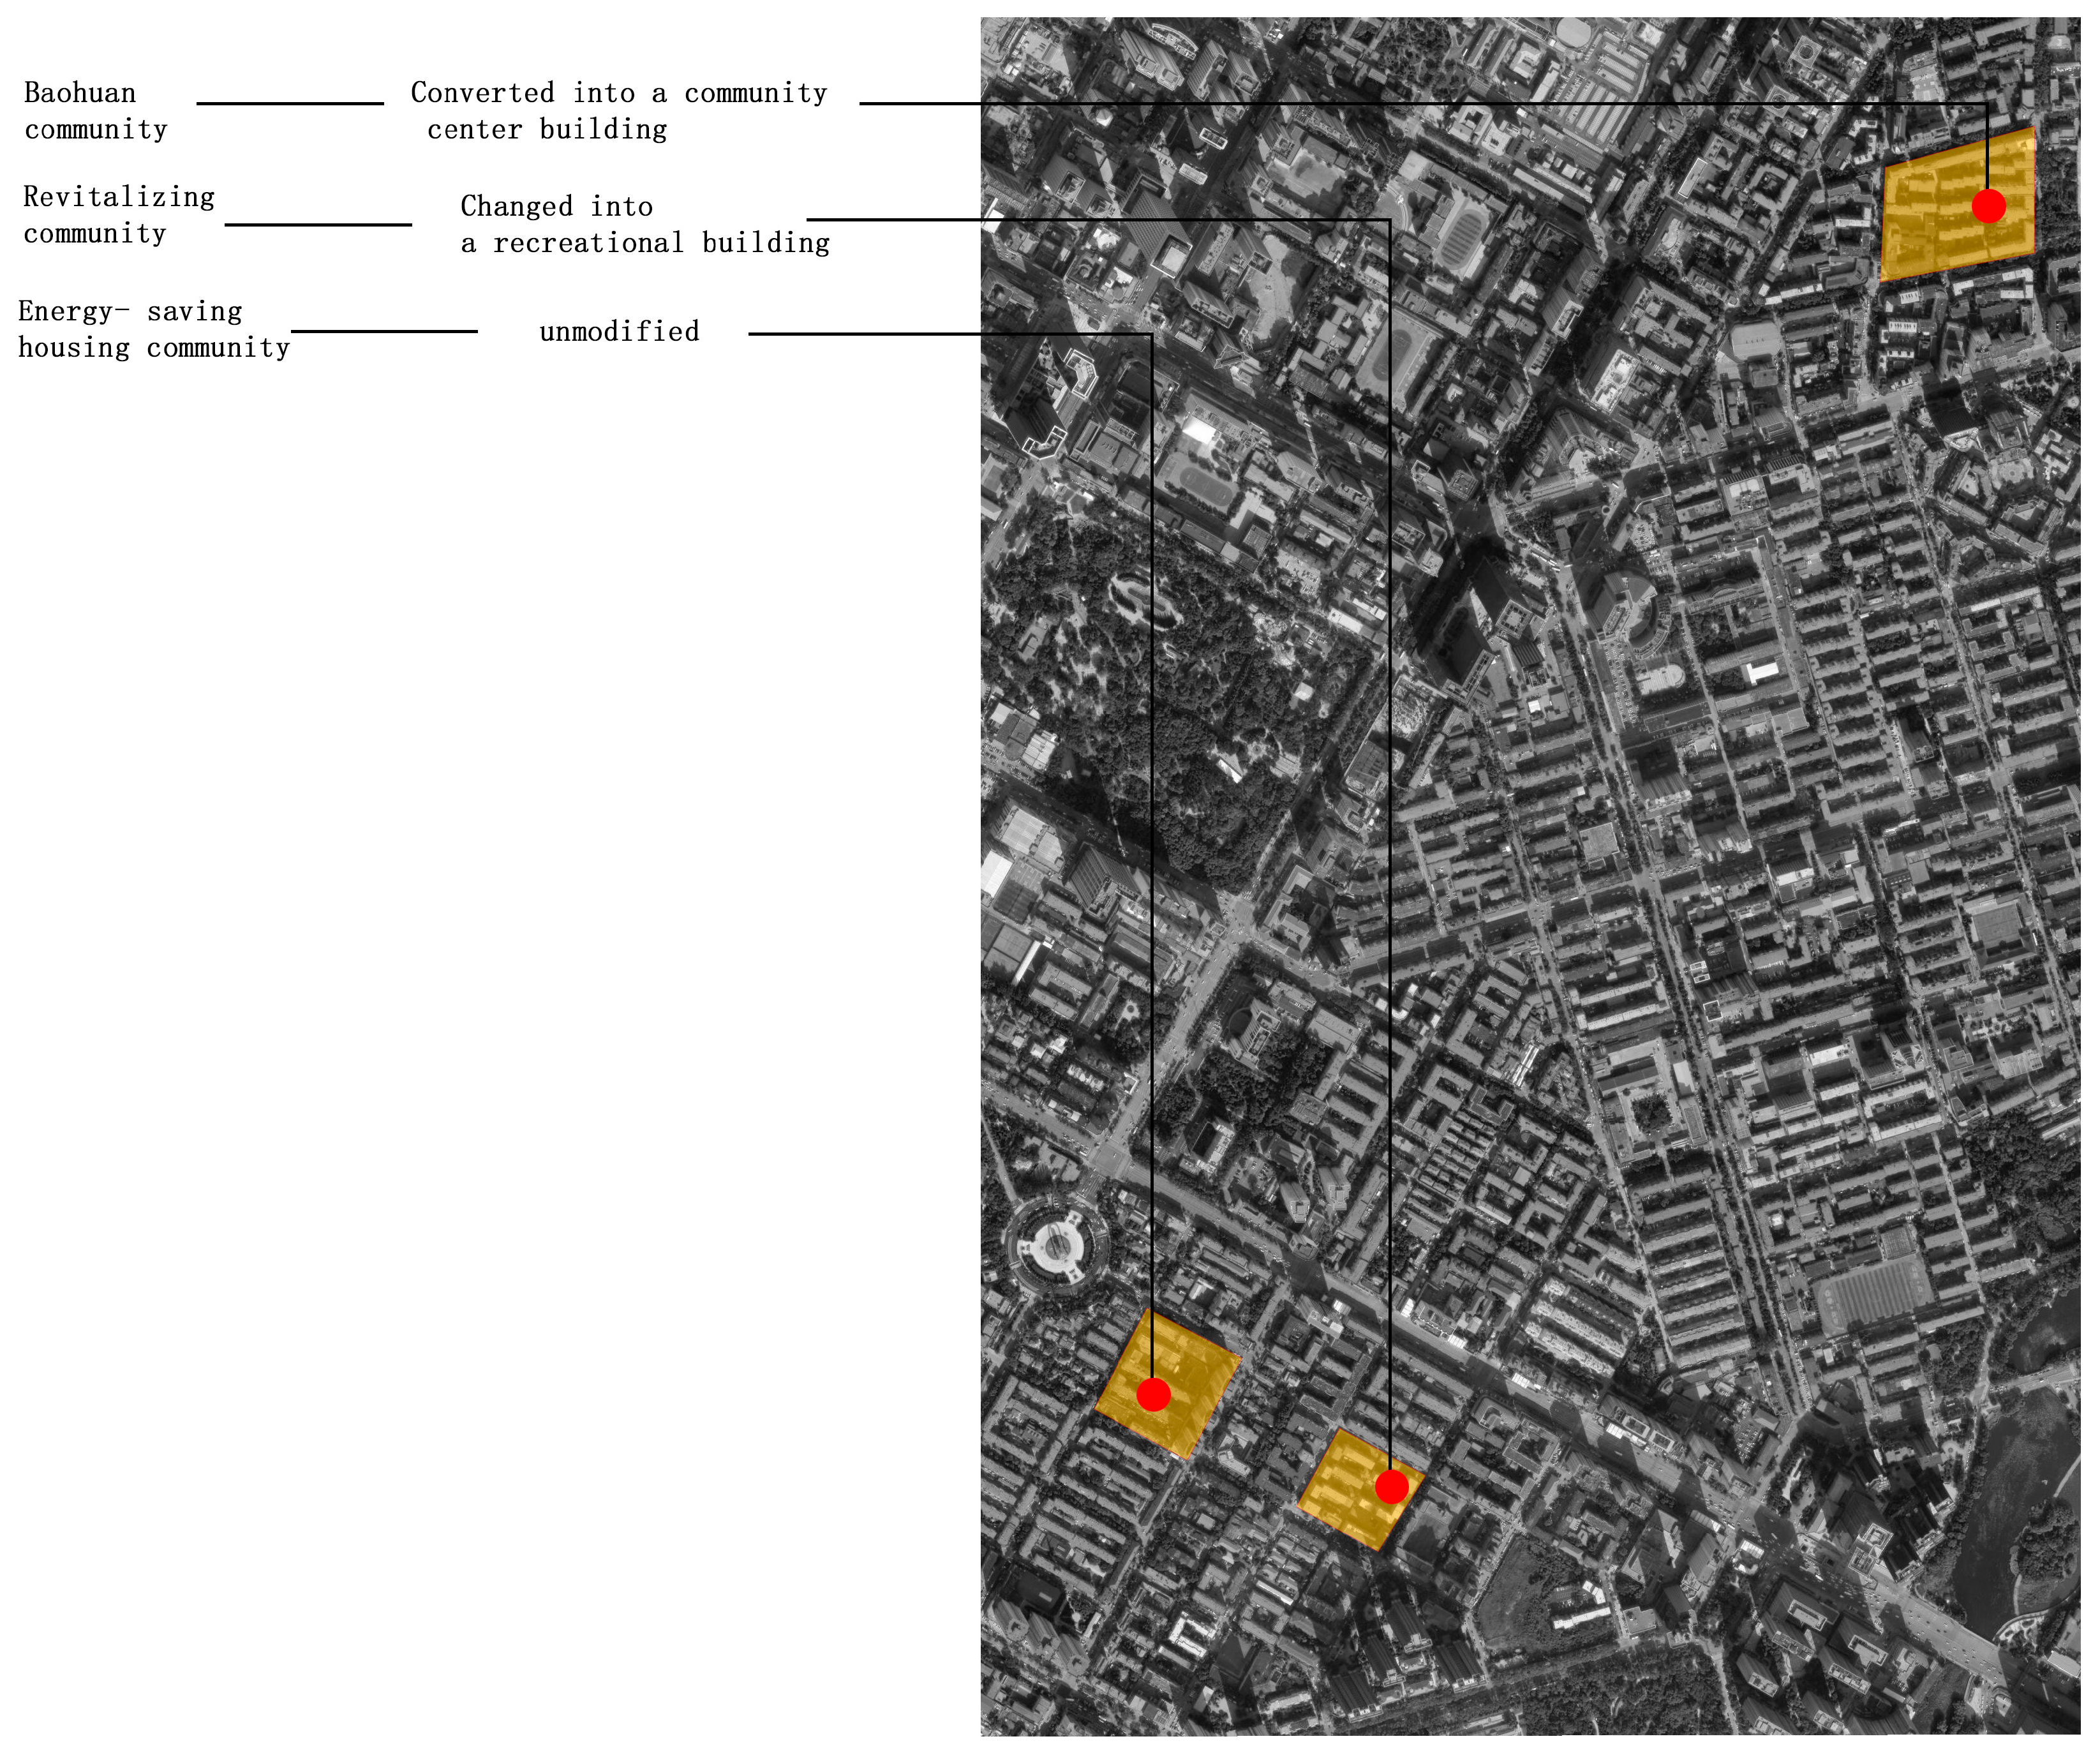
Through field investigations and an evaluation of location, scale, surrounding facilities, and resident demographics, three communities were selected for in-depth analysis: the Baohuan community, Revitalization community, and Energy-Saving Housing community. These communities represent, respectively, a community service-oriented transformation, a community and social needs-oriented transformation, and an untransformed, idle boiler room.
These case studies in Heping District, Shenyang (Liaoning Province), exhibit three boiler room utilization pathways: the Baohuan community’s government-led conversion (2010) into municipal service hubs, the Revitalization community’s private-sector renovation (2014) as commercial leisure venues, and the Energy-Saving Housing community’s preserved industrial relic maintaining its original status. Their differentiated spatial configurations are systematically documented in
Figure 1.
According to field surveys and interviews with community staff, the basic characteristics of the three communities are as follows. The Baohuan community covers an area of approximately 35,680 m2, with 3217 households and a population of around 5000. Residents aged 60 and above account for about 30% of the population. The Revitalization community covers an area of approximately 52,643 m2, with 3079 households and a population of around 5200. Residents aged 60 and above account for about 45% of the population. The Energy-Saving Housing community covers an area of approximately 43,200 m2, with 3504 households and a population of around 5500. Residents aged 60 and above account for about 40% of the population.
By analyzing and comparing the vitality of these three communities, this study aims to elucidate the influence of different boiler room transformation types on community vitality.
2.2. Research Methods
This study focuses on the vitality of residents in aging communities, with a particular emphasis on the elderly population [
25]. Given the complexity of defining and measuring the social vitality of elderly residents, as well as the lack of standardized metrics, a multi-method approach was adopted to ensure the scientific rigor and reliability of the research findings. By integrating multi-source data, this study aims to comprehensively assess the vitality of community residents.
In terms of indicator selection, this study constructs a three-dimensional evaluation model based on the “space–time–behavior” dimensions, selecting five core indicators—activity type, activity range, activity duration, activity frequency, and activity volatility—to comprehensively capture the multifaceted characteristics of residents’ social vitality. To ensure the scientific validity and authority of the indicator system, ten experts were invited to assign importance scores to each indicator following the principles of the Delphi method. Based on their evaluations, the final indicator weights were determined, as summarized in
Table 1, thereby ensuring the rationality and rigor of the assessment framework.
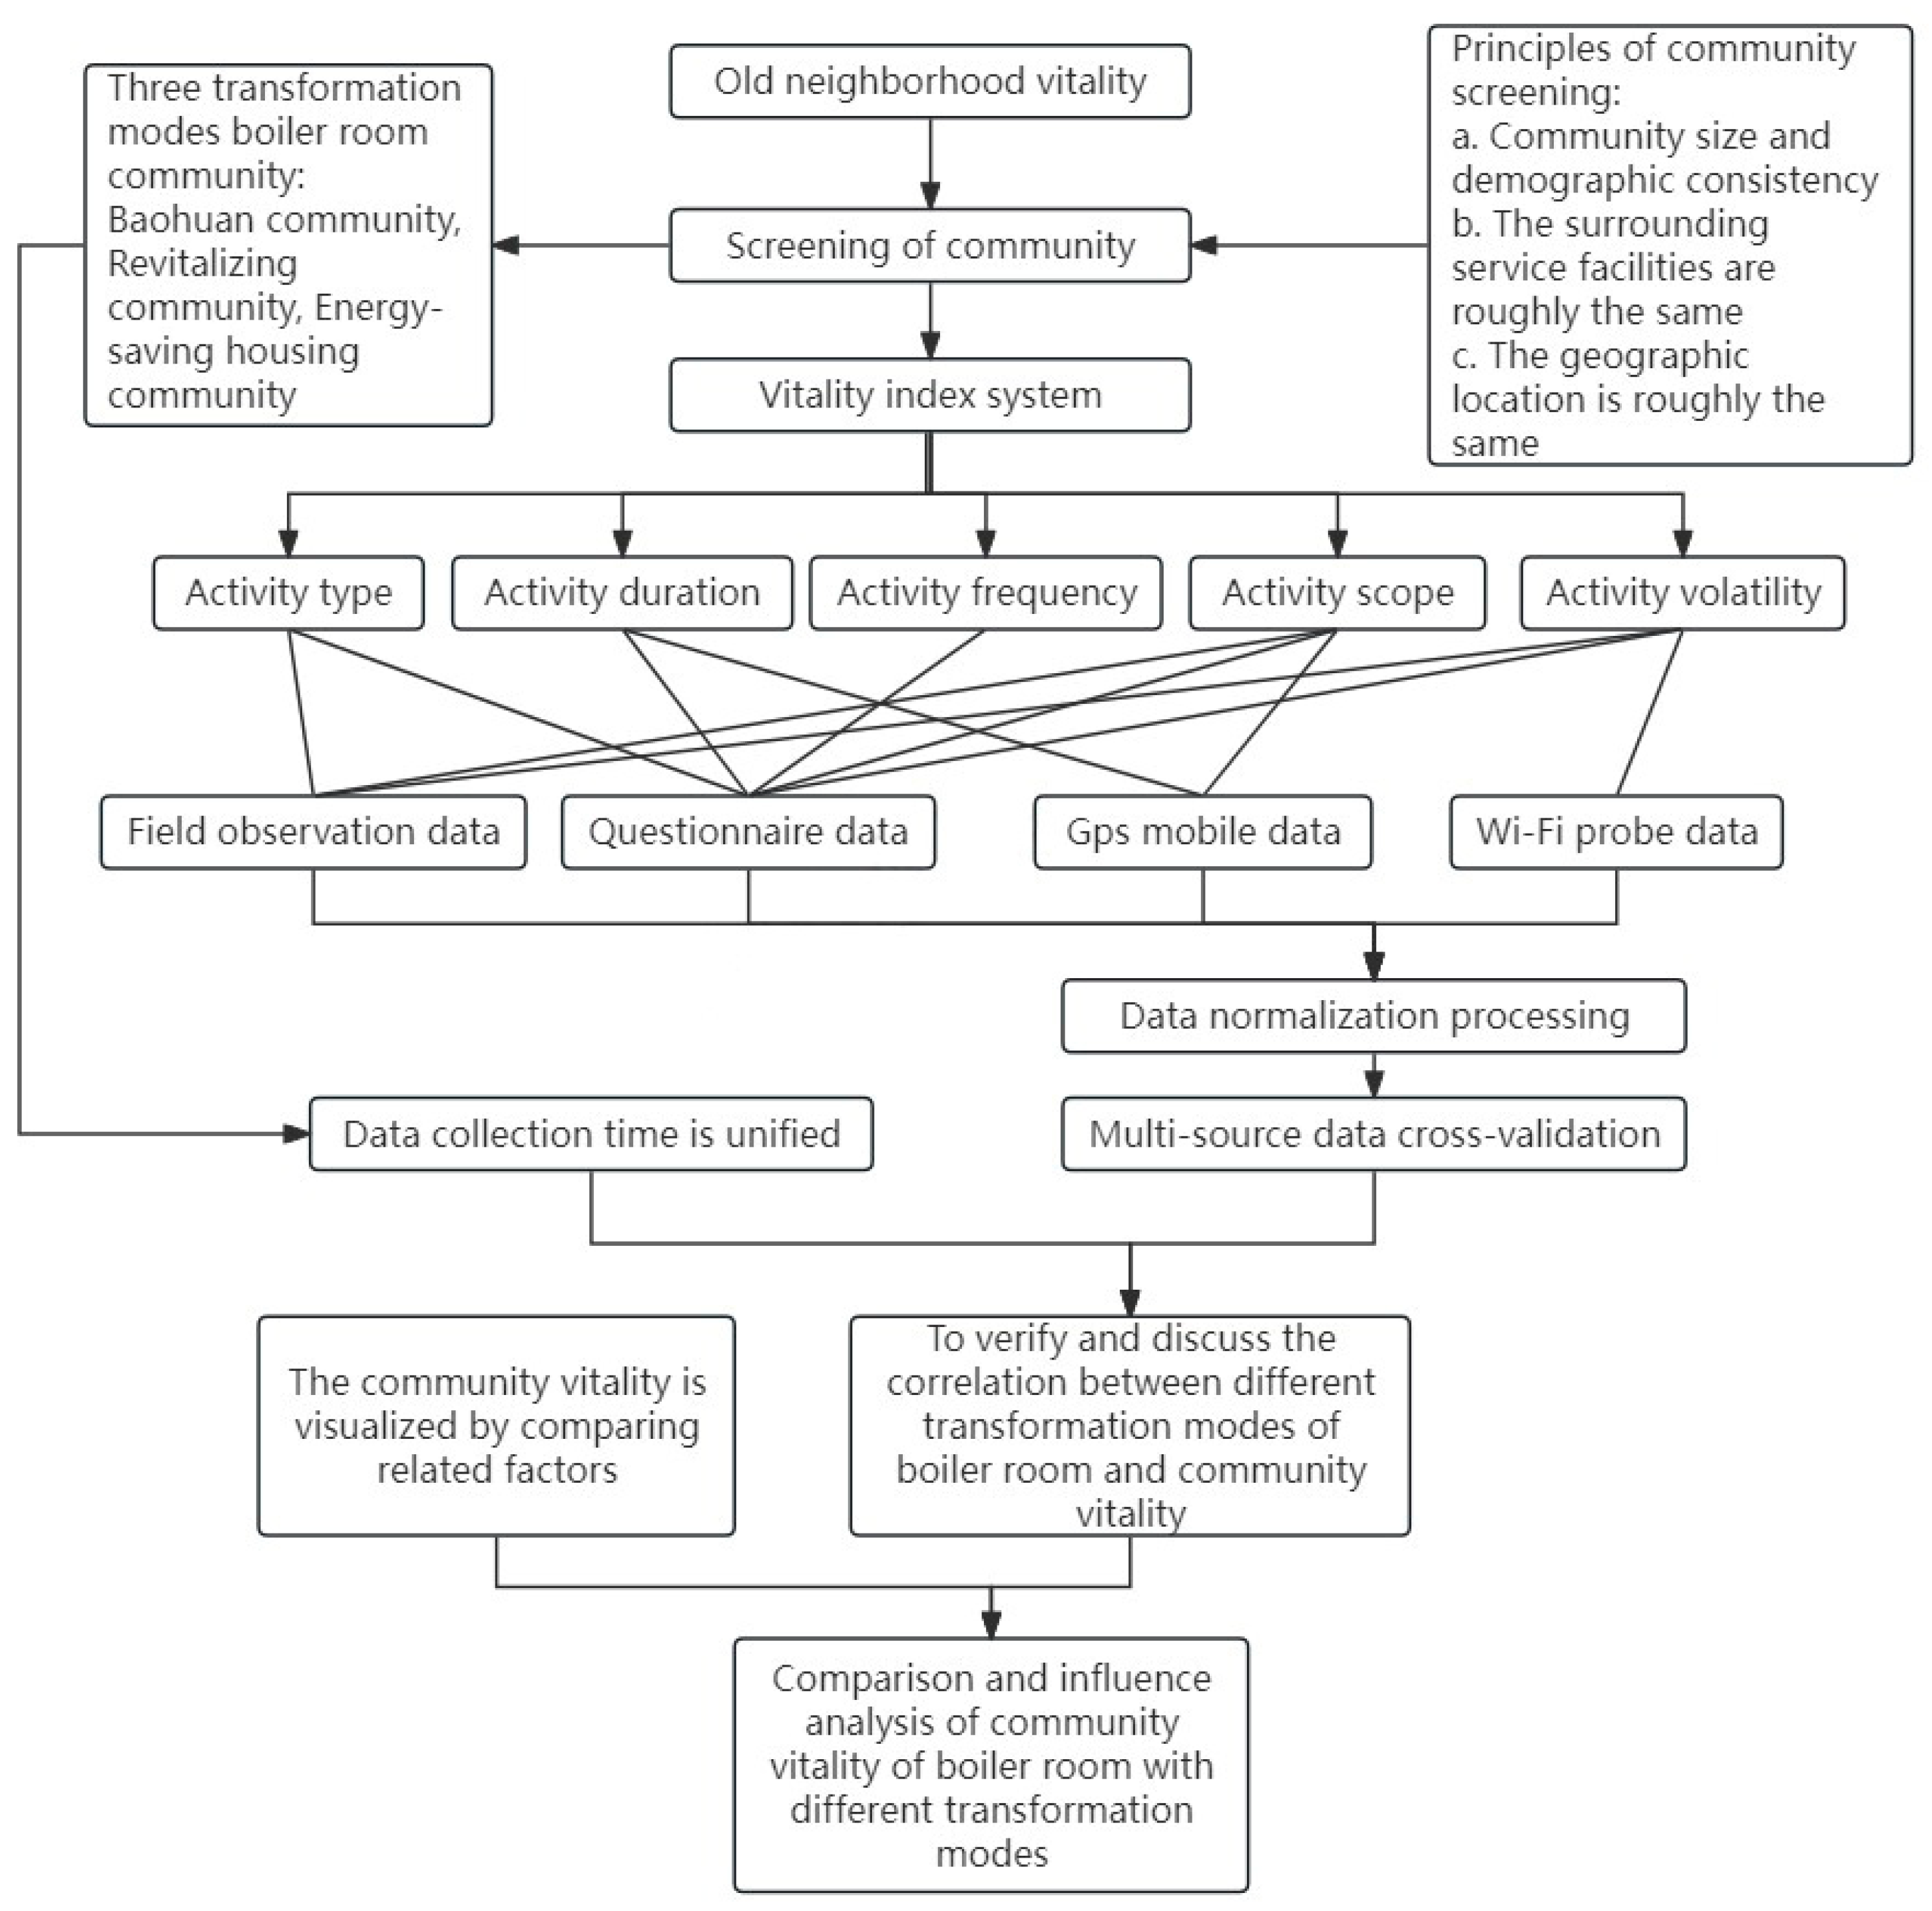
For data collection, a combination of methods was utilized, including questionnaire surveys, GPS tracking, Wi-Fi probe data, and field observations. These methods were designed to capture residents’ activity trajectories and behavioral patterns from multiple perspectives and levels. By cross-validating data from diverse sources, the accuracy and credibility of the data were enhanced, while potential biases associated with single-source data were minimized. Ultimately, based on these comprehensive quantitative data, an in-depth analysis of the social vitality of community residents was conducted to explore its intrinsic characteristics and influencing factors. This methodology establishes a solid scientific basis for assessing social vitality in aging neighborhoods, with the validation process and analytical relationships clearly illustrated in
Figure 2.
2.3. Research Data
2.3.1. Questionnaire Data
The questionnaire in this study was designed to systematically measure the social vitality of community residents. It focuses on five core indicators, namely activity type, activity duration, activity frequency, activity scope, and activity volatility, aiming to comprehensively capture the characteristics of residents’ daily activities.
The questionnaire was developed based on a review of relevant domestic and international studies on community vitality measurement and was further refined through expert review to ensure its scientific validity and applicability [
26,
27,
28]. A total of 120 valid questionnaires were collected, covering the three communities with different boiler room renovation modes involved in this study (approximately 40 from each community). The respondents were primarily residents aged 60 and above who were permanent residents of the communities. A stratified sampling method was employed, prioritizing a balanced representation of gender, age structure, and years of residence. To enhance the validity of the survey and increase participation among the elderly population, the data collection was conducted through face-to-face interviews and assisted questionnaire completion. Community staff assisted with the arrangements to minimize data errors arising from misunderstandings of the written questionnaires or difficulties in completing them among the elderly. The survey was conducted from early to mid-October 2024, with the survey period avoiding holidays to ensure that the data reflected the residents’ daily behavioral patterns.
2.3.2. GPS Mobile Data
Guided by the theory of time geography, this study utilized GPS technology to track the daily behavioral trajectories of elderly residents in communities with different boiler room transformation modes. The GPS data were collected using portable devices and validated through resident feedback [
29]. These data were used to measure three key indicators: activity range, activity duration, and activity volatility. By analyzing the GPS movement data, this study explored the utilization rates of the transformed boiler rooms and their impact on the daily lives of elderly residents.
2.3.3. Wi-Fi Probe Data
Wi-Fi probe data monitoring and field measurements were conducted in the three selected communities over a one-week period (8 October 2024 to 14 October 2024). The field measurements recorded the number of active individuals in the communities at different times of the day (6:00 a.m. to 10:00 p.m.), synchronized with the placement of Wi-Fi probes. The collected data were averaged and subjected to statistical analysis.
Wi-Fi probe technology identified smartphones or Wi-Fi-enabled devices (e.g., laptops, tablets) near wireless access points (APs) without requiring users to connect to the Wi-Fi network [
30,
31,
32]. One Wi-Fi probe device was deployed in each community, with the installation points located near the boiler room renovation areas to ensure coverage of the activity zones. The data sampling frequency was set at 5 s per interval, and the data were automatically uploaded to the server platform. The data were anonymized, retaining only the unique identifier and timestamp, without involving any personal privacy information. While this technology provides valuable insights, it has limitations, such as its inability to distinguish between community residents, passersby, and homebound individuals. Additionally, the lower usage rate of smart devices among the elderly may introduce data bias. To address these limitations, this study combined its Wi-Fi probe data with its field observation data, using the latter as the primary basis for analysis and the former for trend verification and supplementary reference. This integrated approach ensured the scientific rigor and reliability of the research findings.
2.3.4. Quantification of the Indicator System
To assess the impact of the boiler room renovation models on community vitality, this study selected five core indicators: activity type, activity duration, activity frequency, activity range, and activity volatility. These indicators collectively reflect the activity and interaction patterns of community residents. The specific quantification methods are as follows:
Activity Type: The types of activities participated in by community residents were recorded through questionnaires and field observations. Different activity types were assigned weights to calculate the total number of activity types in each community.
Activity Duration: The duration of the residents’ activities in the renovated boiler room areas was quantified in hours or minutes based on the questionnaire and GPS data, and the average activity duration was calculated.
Activity Frequency: The frequency of residents’ visits to the renovated areas within a specific time period was recorded using the questionnaire and GPS data. Based on this, the activity frequency for each community was determined.
Activity Range: GPS data were used to analyze the spatial extent of residents’ activities, calculating the radius or area of activity zones to reflect the spatial extensibility of community vitality.
Activity Volatility: The Wi-Fi probe and field observation data were combined to analyze the differences between the peak and trough periods of residents’ activities, quantifying activity volatility.
All data were subjected to missing value checks and outlier detection prior to analysis to ensure the scientific rigor and reliability of the results.
2.3.5. Normalization
Due to significant numerical disparities among the indicators, normalization was employed to mitigate excessive differences in scale, ensuring that each indicator contributed equally to the analysis. The min–max normalization method was adopted, and the normalization formula is as follows:
: Original data;
: Normalized data;
: Minimum value in the sample data;
: Maximum value in the sample data
2.4. Method of Analysis
This study employs a weighted composite method to construct a Social Vitality Index (S) to quantify community residents’ vitality. The index is obtained by a weighted summation of the following five core indicators:
where
,
,
,
, and
are the weights of each indicator, and the weights can be determined by methods such as the expert scoring method or the hierarchical analysis method (AHP).
,
are the quantitative results of each index, respectively.
3. Results
3.1. Analysis Based on Questionnaire Results
In this study, to further quantify the data, a Likert scale was used in the survey to assess residents’ satisfaction and engagement with the various indicators, such as the types, frequency, and duration of activities. Each indicator was rated on a five-point scale (e.g., 1 = very dissatisfied; 5 = very satisfied), ensuring the comparability and reliability of the data.
To validate the rationality of the 23 elements included in the questionnaire, the data from the 120 valid responses were processed and analyzed using SPSS 23.0. This study employed the Reliability Analysis Module to evaluate data consistency and measurement accuracy, with the corresponding statistical metrics comprehensively outlined in
Table 2. Cronbach’s alpha coefficient was 0.793, exceeding the threshold of 0.7 (a coefficient above 0.7 indicates that the questionnaire design is reliable, stable, and scientifically sound), demonstrating the high reliability of the collected data.
The Kaiser–Meyer–Olkin (KMO) value was 0.845, which is greater than 0.5 and falls within the range of 0.8 to 0.9, indicating that the data are suitable for principal component analysis. Bartlett’s test of sphericity yielded an approximate chi-square value of 3348.502 with 253 degrees of freedom, and the significance level (p-value) was 0.000, which is less than 0.001. This confirms that the data are highly correlated and appropriate for factor analysis.
A comparative analysis of the final scores for each indicator, as illustrated in
Figure 3, reveals that residents of the Baohuan community exhibit the highest overall activity levels, followed by those in the Revitalization community, while residents of the Energy-Saving Housing community demonstrate the lowest activity levels. Specifically, residents of the Baohuan community showed significantly higher activity types and frequencies compared to the other two communities, along with more stable activity volatility. In contrast, residents of the Revitalization community had longer activity durations but a smaller activity range. Meanwhile, residents of the Energy-Saving Housing community engaged in fewer activity types, with lower activity durations and frequencies, and a larger activity range. Spatial statistical analysis indicates that the community service center conversion area exhibits a multi-centric clustering pattern, with 78% of activity points located within a 500 m radius of the boiler house. Compared to the non-renovated community, residents’ average daily activity radius decreased from 1.2 km to 0.74 km (a 38% reduction), and the hotspot area expanded by a factor of 2.3 (
p < 0.01).
3.2. Spatial-Temporal Analysis Based on GPS Mobile Data
This study utilized GPS mobile data to analyze the vitality of residents in communities with different boiler room renovation modes. By processing and analyzing the positioning data of residents, the spatial distribution, activity scope, and activity frequency of residents were objectively reflected, providing critical evidence for evaluating the impact of boiler room renovation modes on community vitality [
33,
34].
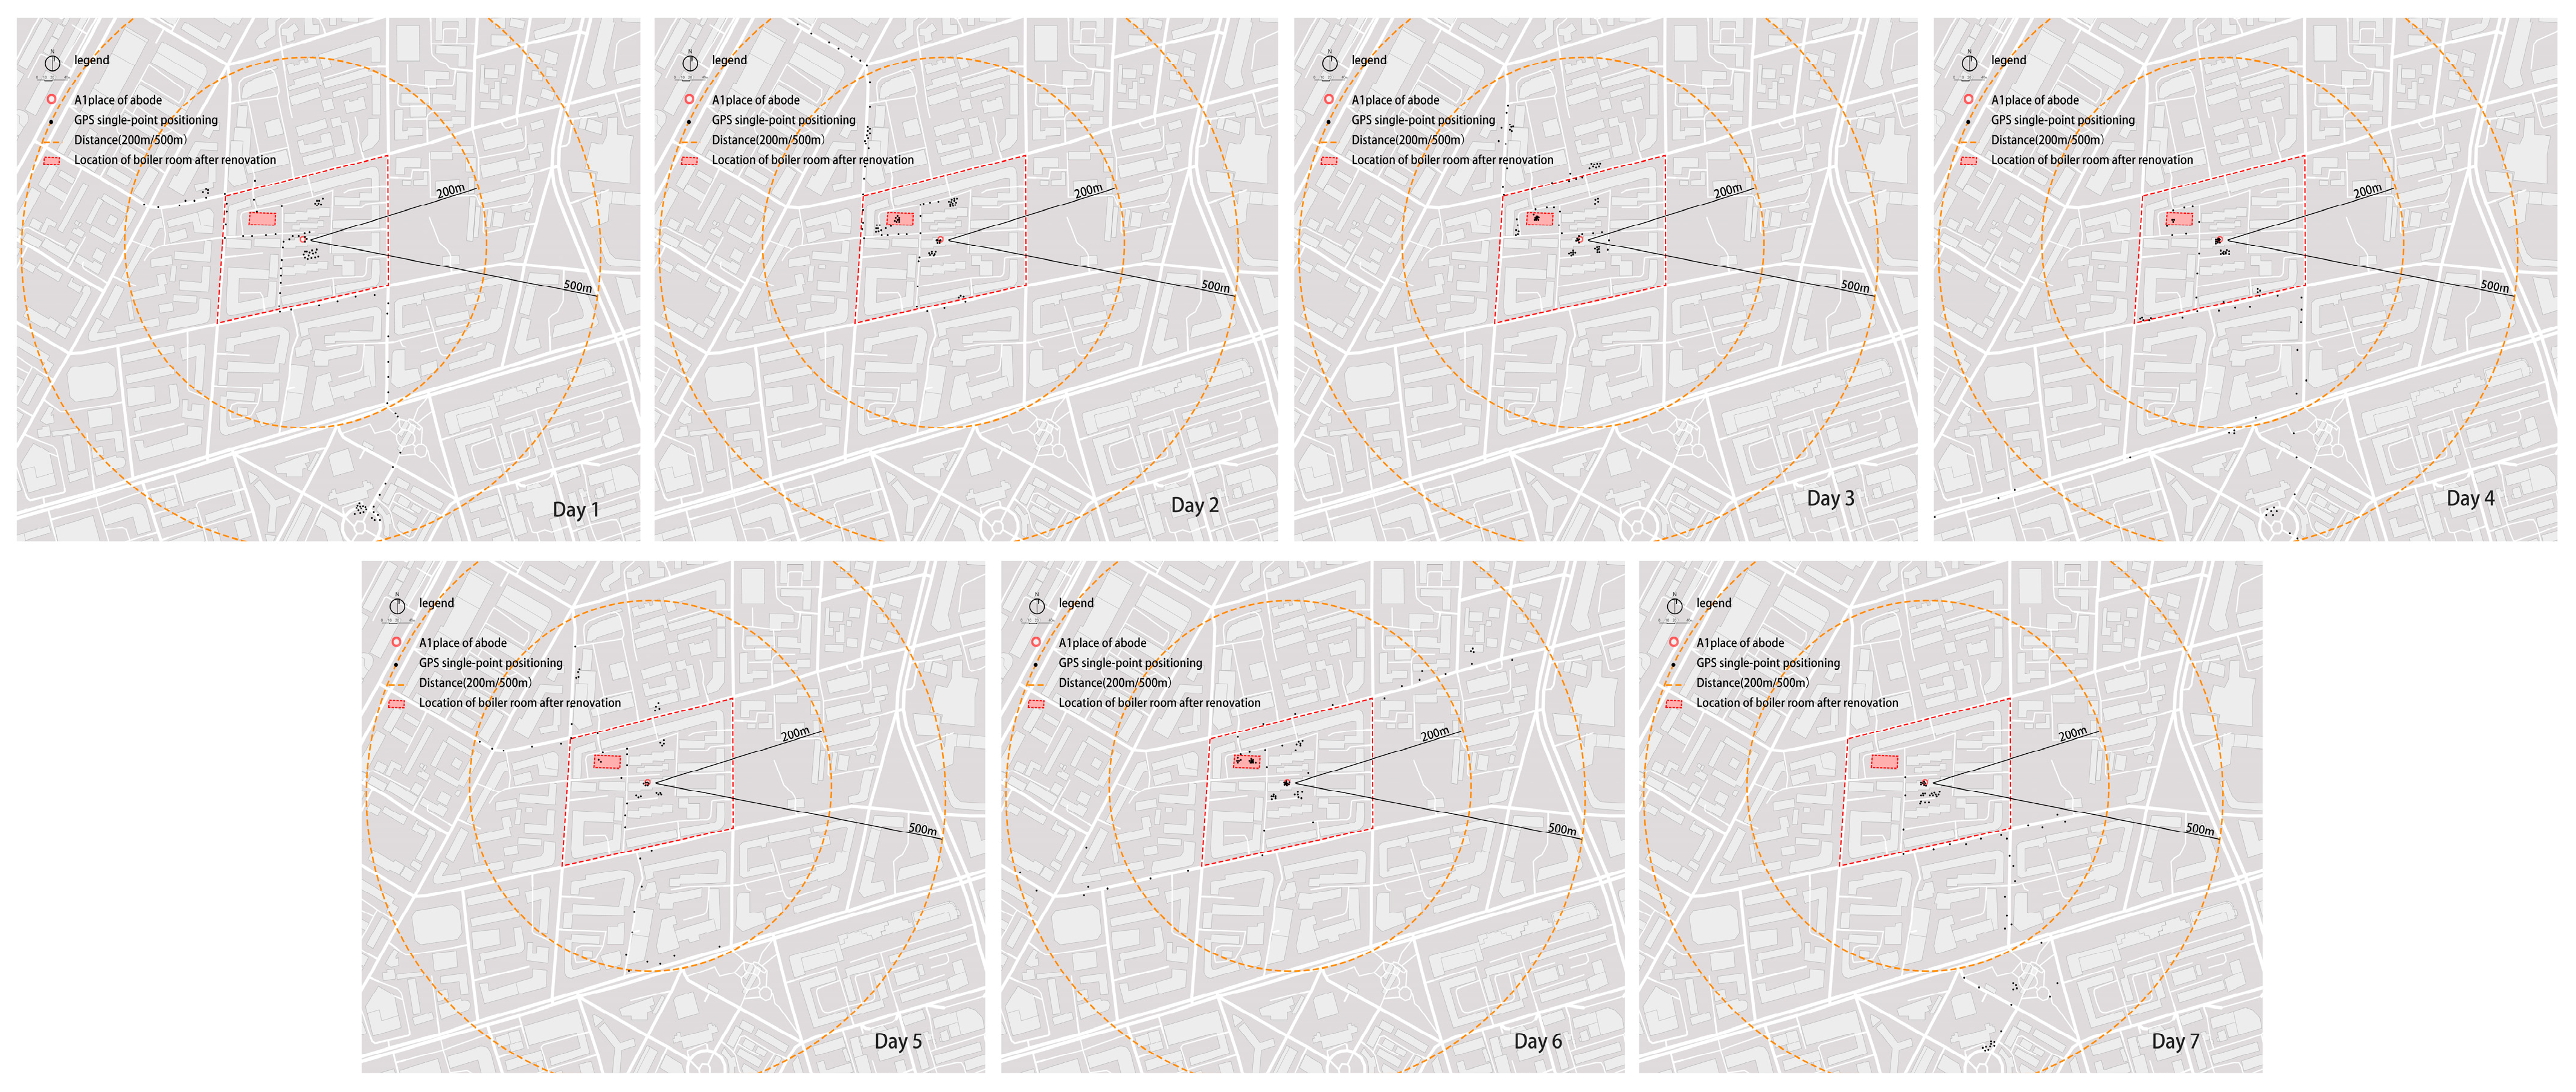
With the assistance of neighborhood committees, seven elderly residents were selected from each of the three communities to participate in the GPS data collection. The selected participants met the following criteria: (1) the ability to engage in daily travel activities, (2) residency in the community for over five years, and (3) familiarity with both the internal and external conditions of the community. Over a seven-day data acquisition period, GPS-enabled portable devices systematically captured geospatial coordinates at 10 min intervals, and the spatiotemporal sampling methodology and resultant positioning patterns are comprehensively visualized in
Figure 4.
This study captured 34,582 GPS data points, with post-processing retaining 33,600 valid entries, as quantified in
Table 3. Following geospatial coordinate importation into ArcGIS, analytical workflows involving data fusion and kernel density estimation yielded precise population agglomeration patterns, the spatially explicit results of which are cartographically rendered in
Figure 5.
3.3. Analysis Based on Wi-Fi Probe Results
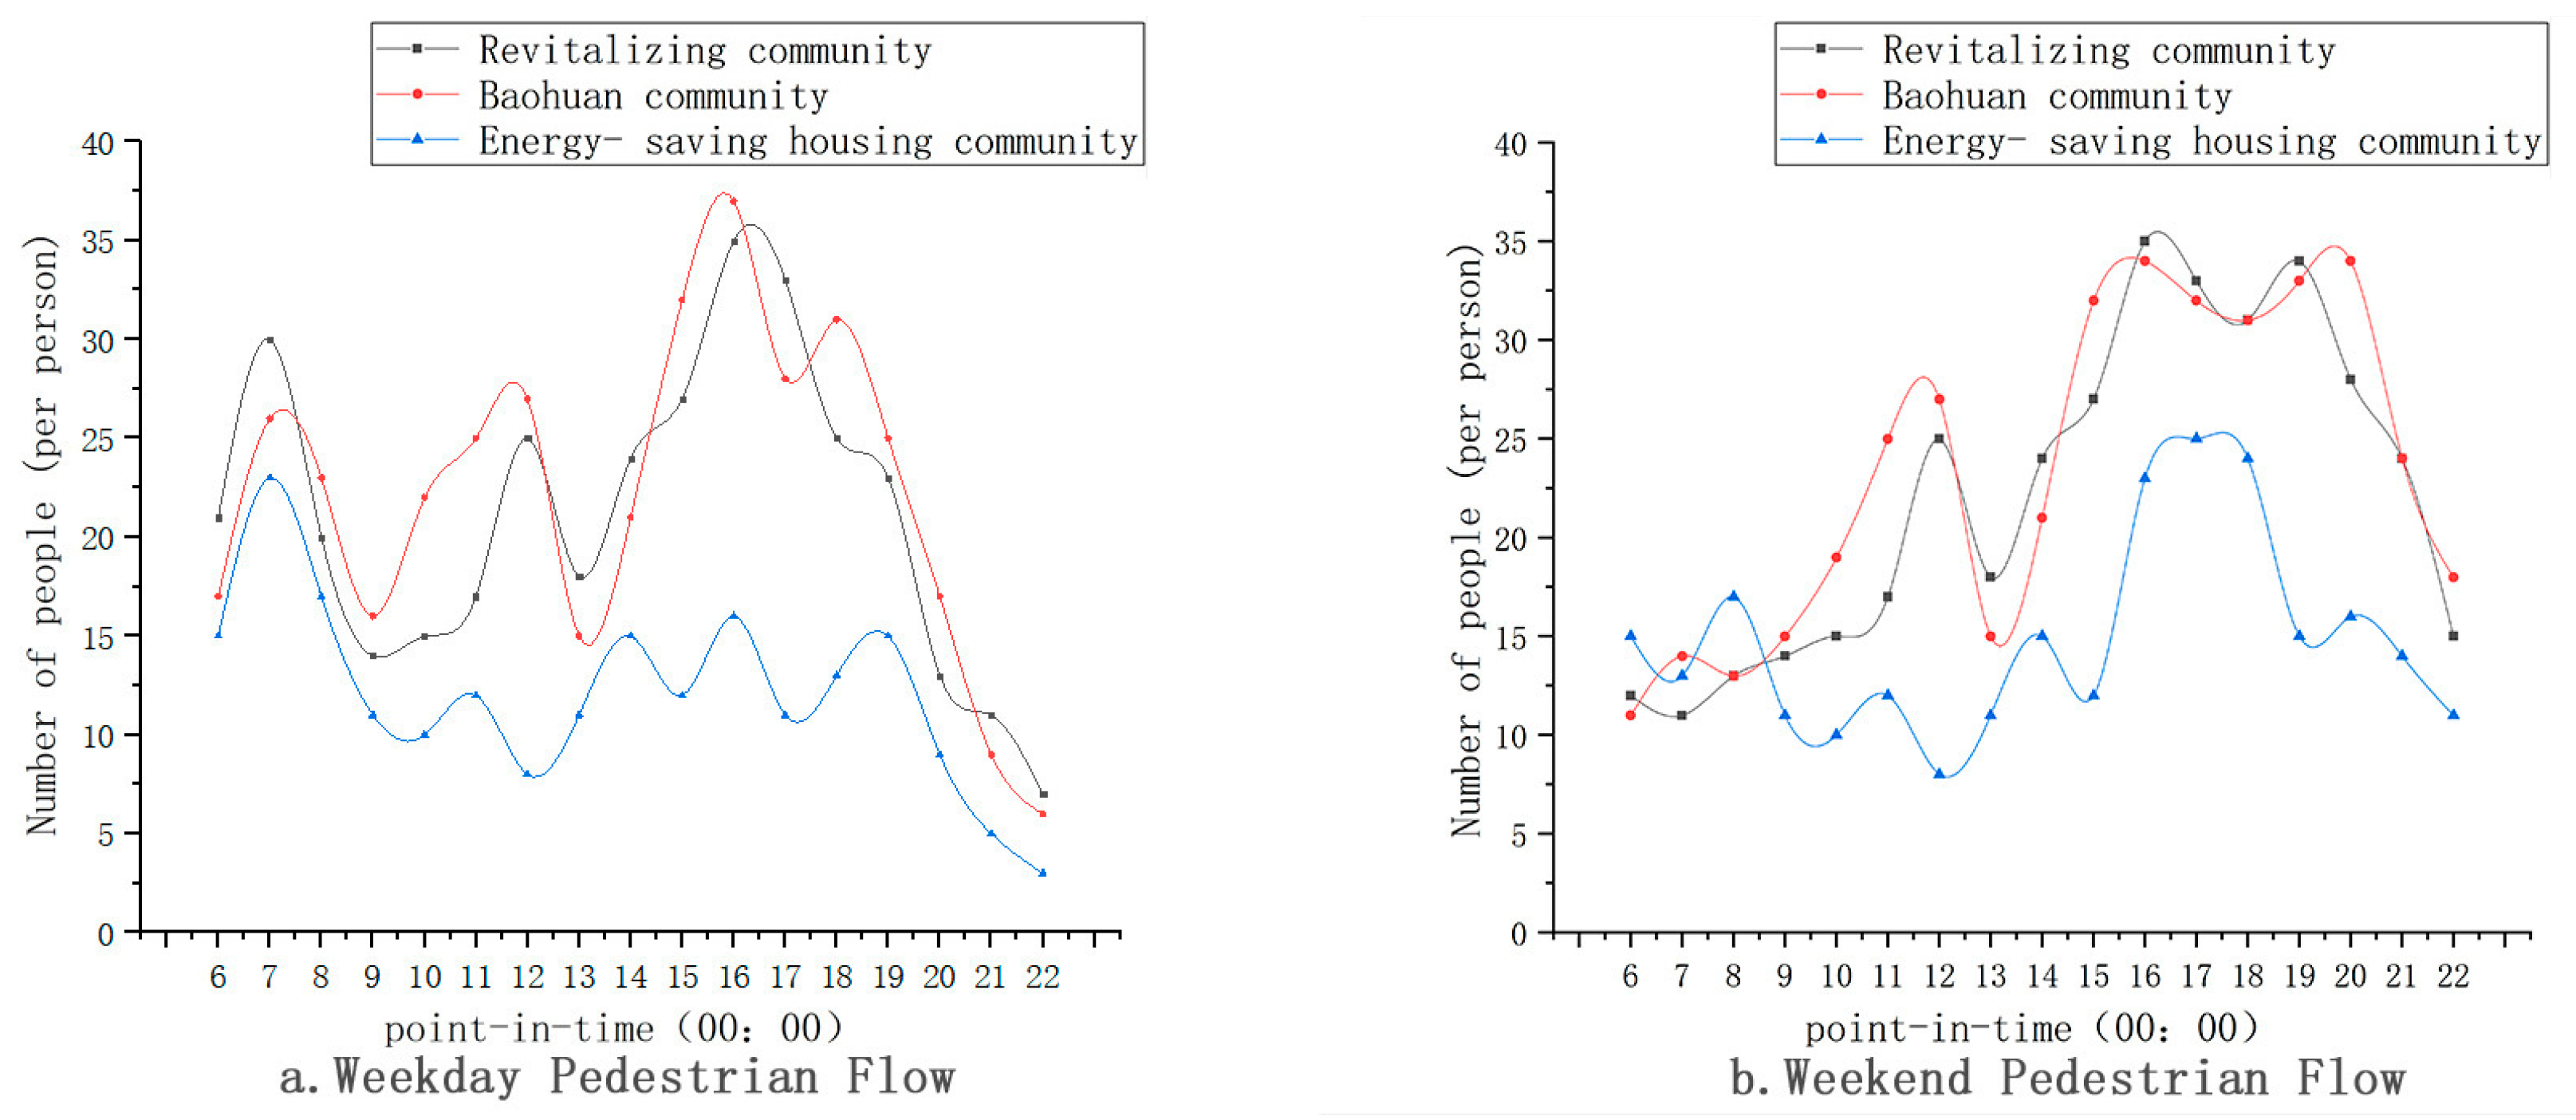
Wi-Fi probe data were used to quantify the number of active users in each time segment by tracking the spatiotemporal distribution of device MAC addresses within the community, as shown in
Figure 6. A “baseline vitality value”, defined as the mean of the daily minimum active user counts, served as the normalization reference. The analysis reveals distinct vitality patterns across the three community types:
Community Service Center Model (Baohuan Community):
Vitality Persistence: Maintains continuous vitality for 12 h per day (07:00–19:00), with active user counts always exceeding 65% of the baseline.
Peak Intensity: Weekend evening peak (15:00–17:00) reaches 39 users/hour, 2.6 times the concurrent peak in the unrenovated community (Energy-Saving Community).
Rhythmic Pattern: Exhibits a “three-peak, three-phase” pattern—a morning peak (07:00–09:00, fitness activities dominate), late-morning active period (10:00–12:00, social interactions dominate), and evening peak (16:00–19:00, social gatherings dominate).
Recreational Conversion Model (Zhenxing Community):
Vitality Gap: Active user counts drop sharply to 48% of baseline between 09:00 and 11:00, resulting in a 2.2 h daily low-activity period.
Peak–Trough Disparity: The weekend peak (16:00–17:00) reaches 210% of the baseline, but evening vitality decays 37% faster than in the Baohuan community.
Unrenovated Community (Energy-Saving Community):
Vitality Instability: Weekday vitality persists for only 8.5 h (07:00–15:30), and off-peak counts fall below 53% of the baseline.
Abnormal Volatility: The coefficient of variation of daily active user counts reaches 0.69, reflecting high uncertainty in space utilization.
3.4. Multi-Source Data Integration and Cross-Validation
Upon the completion of the data collation, cross-validation analyses were conducted for the five selected indicators: residents’ activity duration, activity scope, activity volatility, activity type, and activity frequency. Multi-source data cross-validation is a methodological approach that enhances the accuracy and reliability of research findings by integrating and corroborating information from diverse data sources.
In this study, the data from the questionnaire surveys, GPS tracking, Wi-Fi probes, and field measurements were combined to comprehensively analyze the multidimensional characteristics of residents’ activity behaviors. By comparing the results across different data sources, trends and features demonstrating high consistency were identified, ensuring the scientific rigor and robustness of this study’s conclusions. Detailed analyses of each indicator are presented in the following sections.
3.4.1. Analysis of Resident Activity Duration
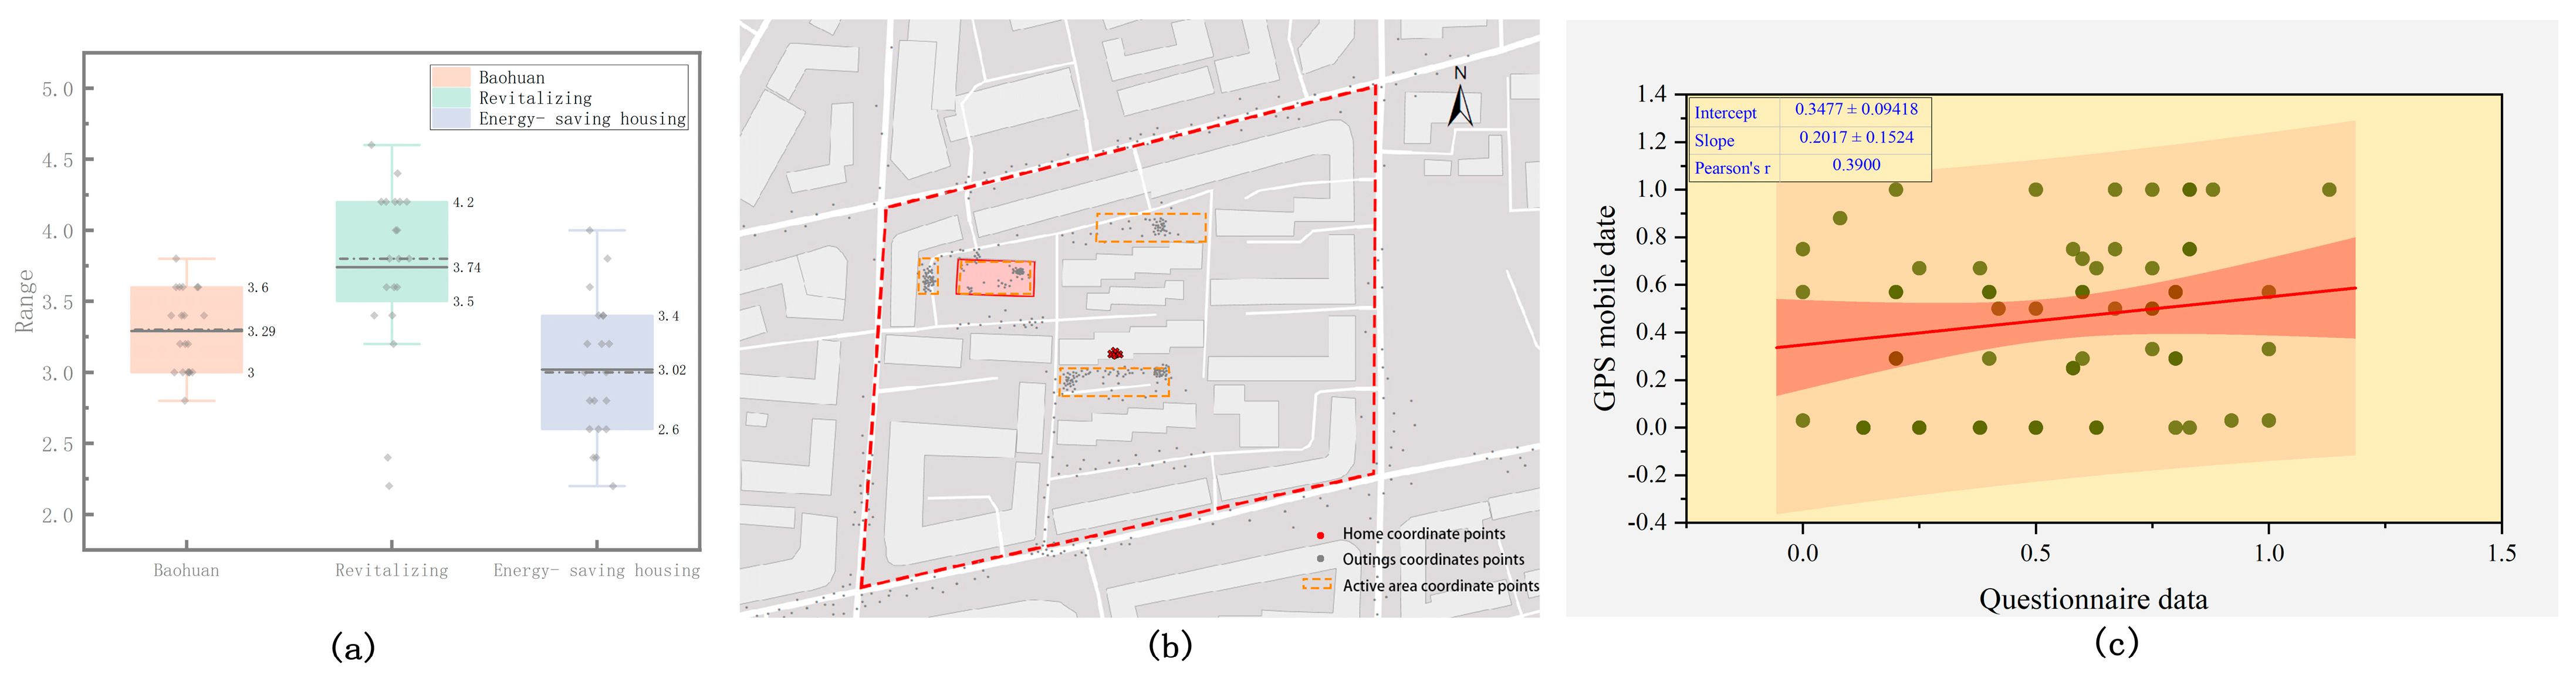
In the study of residents’ activity duration, questionnaire survey data and GPS mobile data were integrated for cross-validation. The assessment of activity duration based on questionnaire data evaluated using a five-point Likert scale revealed average scores of 3.29, 3.74, and 3.02 for the three communities, respectively. These results are illustrated in
Figure 7a to highlight the variations in activity engagement across the study areas. These results indicate that the Revitalization community had the longest activity duration, while the Energy-Saving community had the shortest.
To further validate these findings, GPS coordinate points were imported into ArcGIS for spatial analysis. To supplement the questionnaire findings, field observation data were incorporated to identify high-frequency resident activity zones. The density of recorded coordinate points served as an indirect indicator of activity duration. These spatial patterns are visualized in
Figure 7b. The analysis revealed that the Revitalization community had the highest density of points, while the Energy-Saving community had the lowest, aligning with the trends observed in the questionnaire survey results.
However, the GPS data exhibited significant deviations due to several limitations, including a scattered distribution of coordinate points, inconsistent recording intervals, and reduced positioning accuracy caused by poor indoor signals. Following data normalization, a correlation analysis was conducted to examine the relationship between the two datasets. As shown in
Figure 7c, the resulting correlation coefficient of 0.39 indicates a weak correlation, suggesting that the questionnaire data may provide a more accurate representation of residents’ activity duration.
In conclusion, while the GPS data provided objective behavioral trajectories, the questionnaire data demonstrated higher accuracy and reliability in measuring residents’ activity duration.
3.4.2. Analysis of Residents’ Activity Range
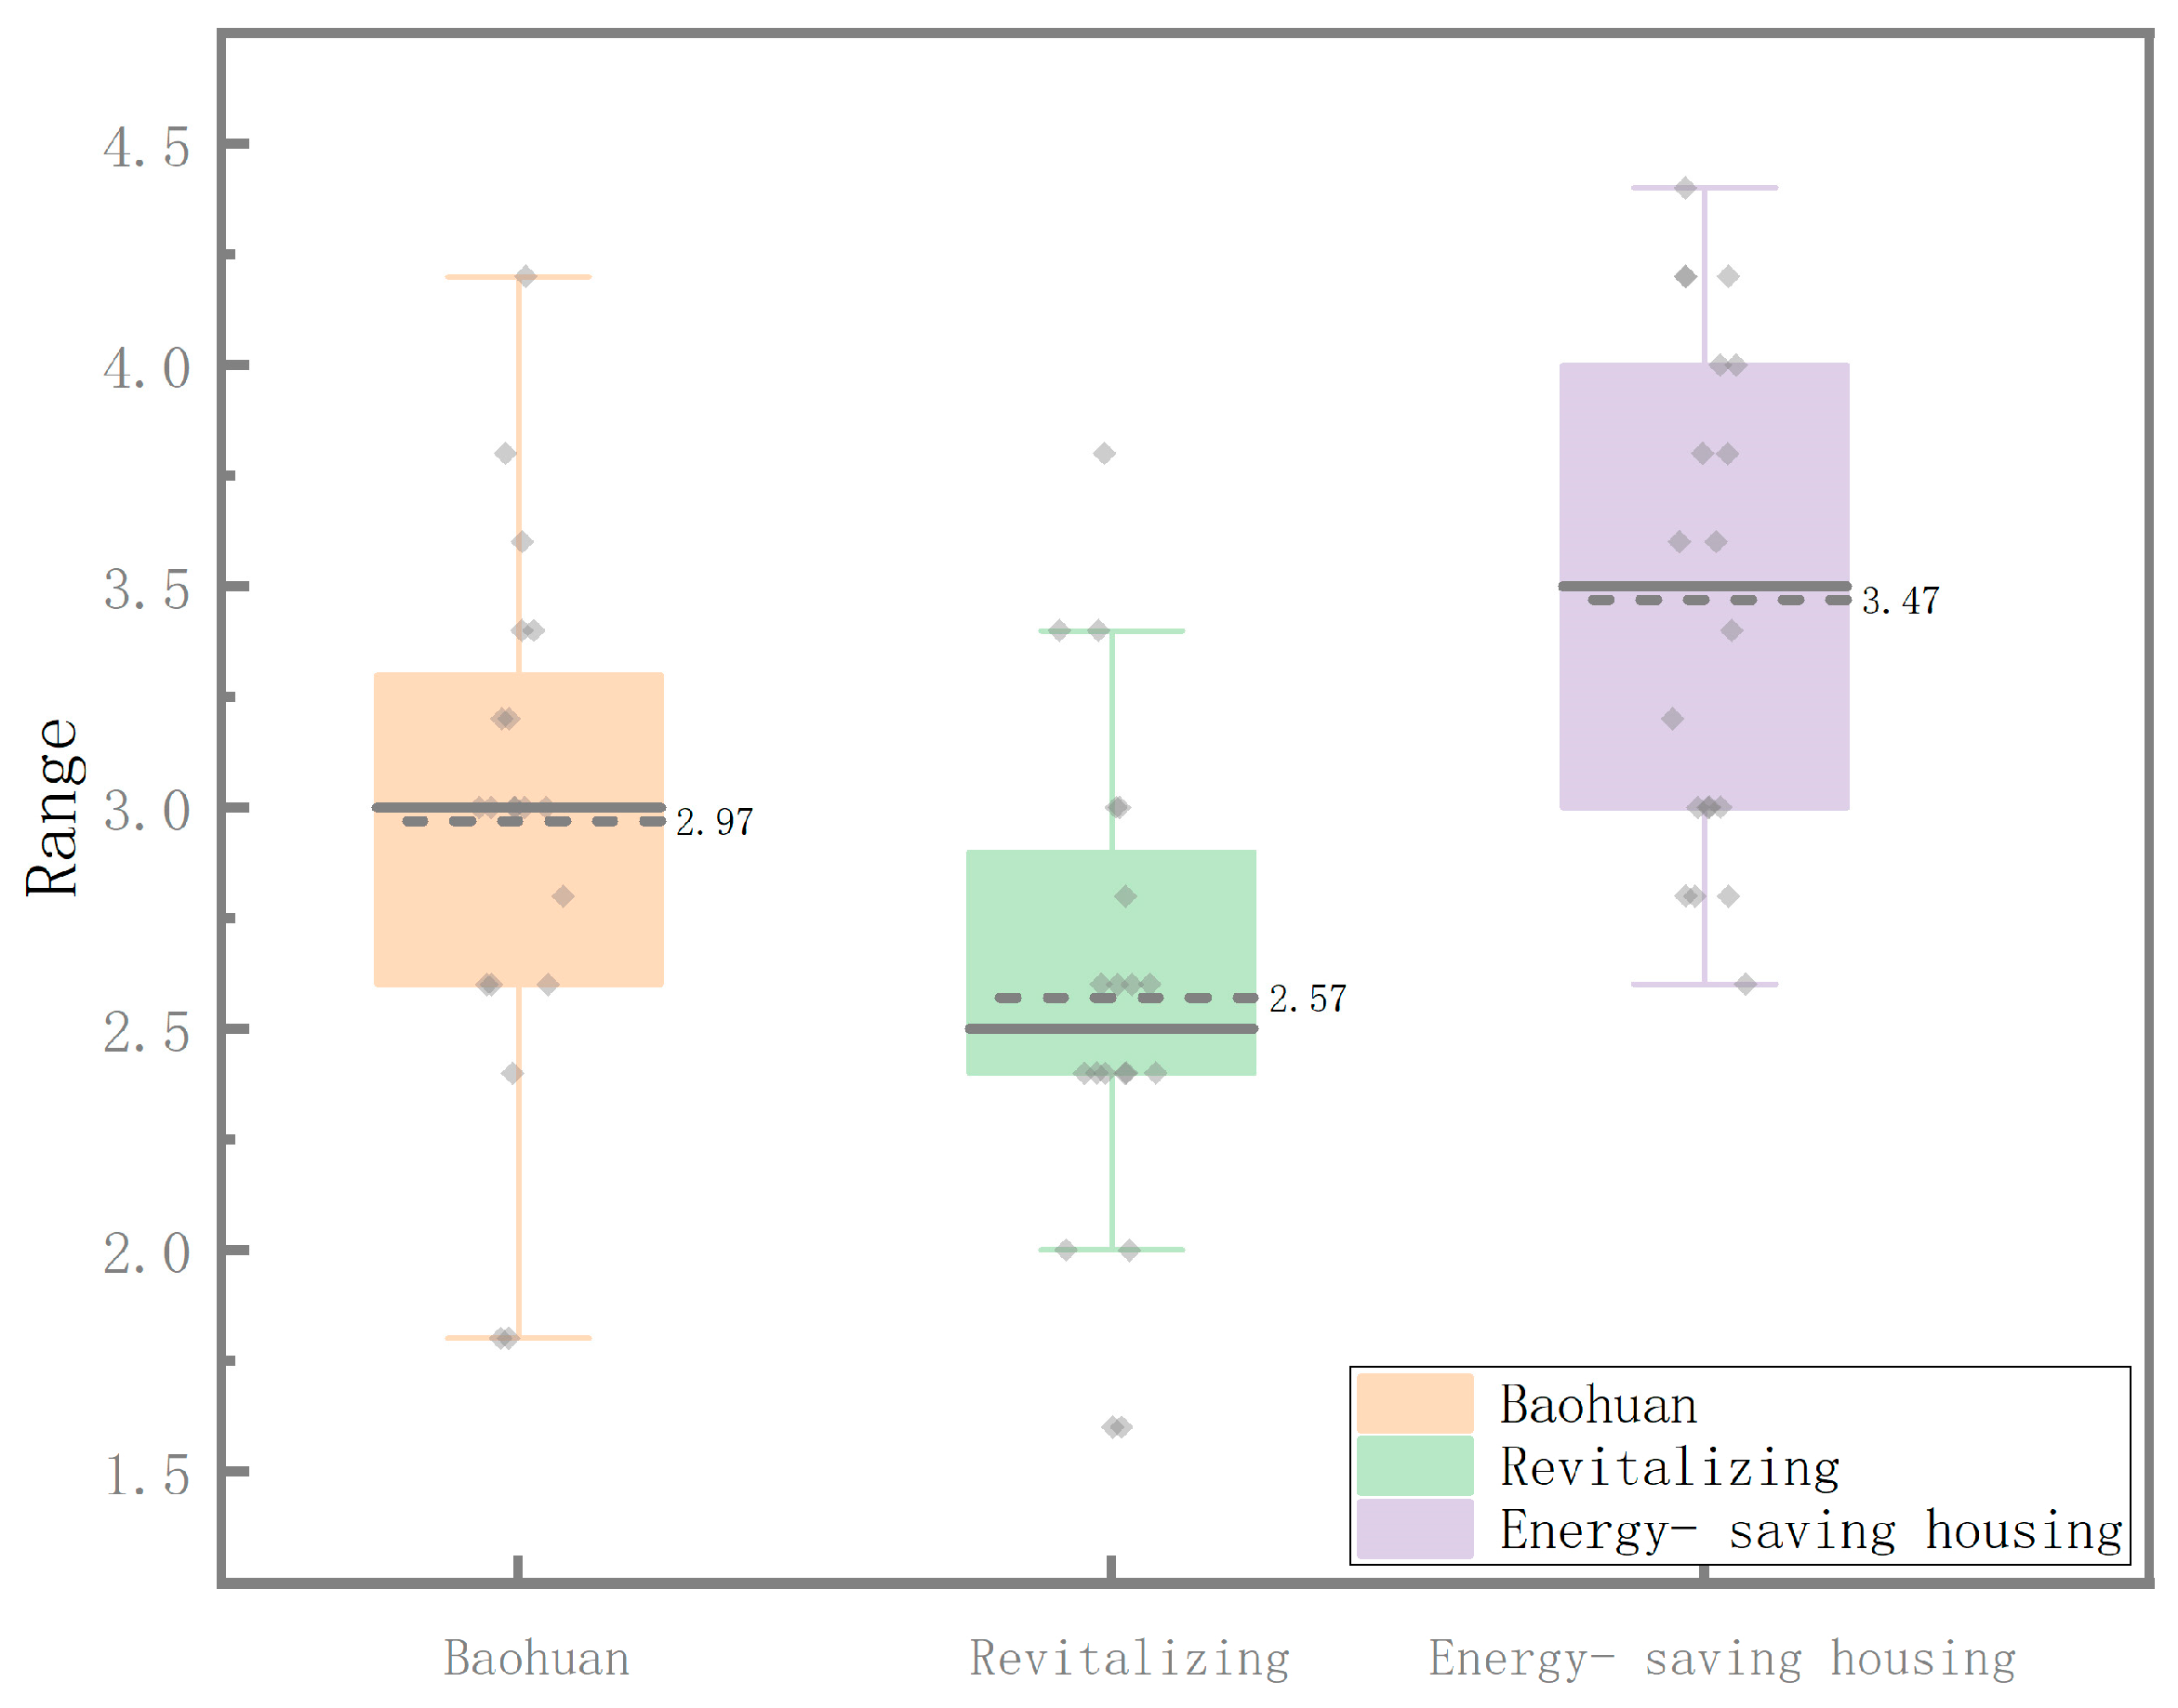
For the analysis of residents’ activity range, the questionnaire data and crowd heat maps derived from the GPS mobile data were cross-validated and analyzed. The spatial range of resident activity was assessed through the questionnaire responses, with scores derived using a five-point Likert scale. The analysis yielded average values of 2.97, 2.57, and 3.47 for the three communities, respectively, as presented in
Figure 8. The GPS-based mobile data, visualized as heat maps, demonstrated trends that were highly consistent with the questionnaire findings, as shown in
Figure 5. Specifically, the Energy-Saving Housing community, which scored the highest in the questionnaire (3.47), also exhibited the widest distribution of activity hotspots in the GPS heat map, indicating a significantly larger activity range compared to the other communities.
This consistency between the two datasets validates the accuracy of both methods in measuring residents’ activity range, demonstrating a high degree of confidence in this study’s findings.
The questionnaire method quantifies residents’ subjective perceptions of their activity ranges, facilitating statistical analysis and cross-community comparisons. In contrast, the GPS mobile data visualize the spatial distribution of residents’ activities through heat maps, identifying core areas of high-frequency activity. The integration of these two methods not only addresses the limitations of relying on a single data source but also provides a comprehensive portrayal of residents’ activity range characteristics from both subjective and objective perspectives. This approach significantly enhances the scientific validity and reliability of the research conclusions.
3.4.3. Analysis of Residents’ Activity Volatility
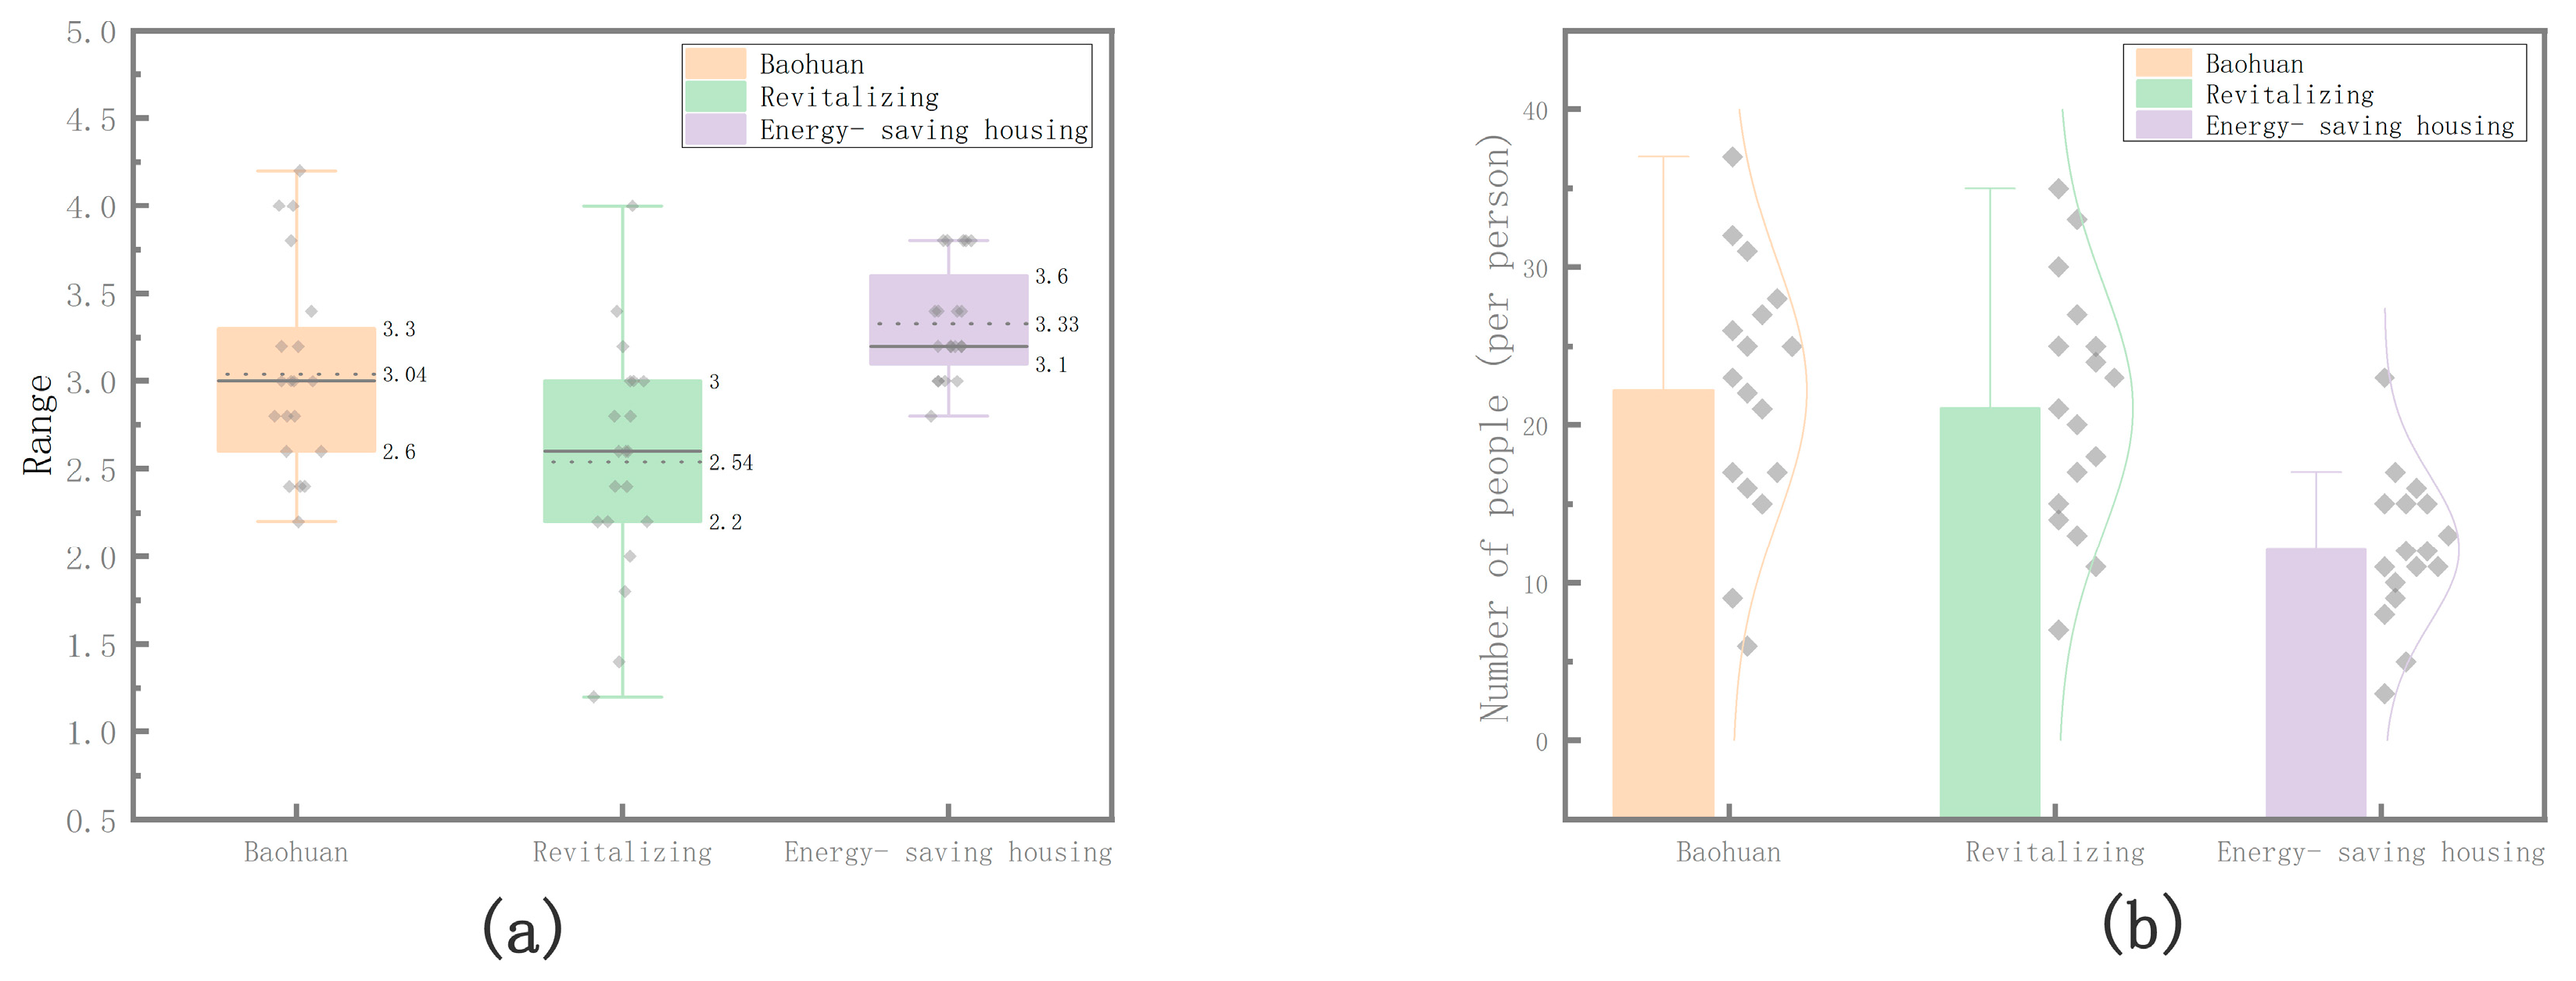
The residents’ activity volatility was assessed through the cross-validation of the questionnaire responses and Wi-Fi probe data. As shown in
Figure 9a, the questionnaire data—evaluated using a five-point Likert scale—produced average volatility scores of 3.04 for the Baohuan community, 2.54 for the Revitalization community, and 3.33 for the Energy-Saving community. These results indicate that the Energy-Saving community exhibited the highest level of activity volatility, while the Baohuan community displayed the lowest, with the Revitalization community falling in between.
To further quantify activity volatility, the following formula was applied to the Wi-Fi probe data:
: The average attendance per session;
: Mean value of pedestrian flow;
: Number of time intervals;
: Volatility of crowd activities.
The employed formula quantifies the volatility of crowd activities across time. As shown in
Figure 9b, the computed volatility values for the Baohuan, Revitalization, and Energy-Saving communities were 0.47, 0.42, and 0.85, respectively. These values exhibit a high level of consistency with the trends identified in the questionnaire data, thereby reinforcing the validity of the activity volatility indicator.
Although the Wi-Fi probe data may be subject to limitations such as uneven signal coverage or equipment errors, their strong corroboration with the questionnaire results significantly enhances the scientific validity and credibility of the research findings. In conclusion, the integration of these two methods not only addresses the limitations of relying on a single data source but also provides a more comprehensive and accurate perspective for studying residents’ activity volatility.
3.4.4. Analysis of Activity Types and Frequency
In this study, the analysis of residents’ activity types and frequency relied exclusively on the questionnaire survey data, as the other data collection methods (e.g., GPS, Wi-Fi probes) were unable to accurately capture these indicators at the time. The questionnaire was designed with structured questions to comprehensively assess the frequency of residents’ participation in various activities and the diversity of their activity types, providing robust data support for this study.
Although the use of a single data source presents certain limitations, the subjective and detailed nature of the questionnaire survey offers unique advantages in measuring residents’ activity behaviors. This approach effectively compensates for the shortcomings of the other data sources. Future studies could further validate and supplement these findings by integrating data from multiple sources.
3.4.5. Final Result Analysis
After completing the cross-validation of the five selected indicators using multi-source data, this study proceeded to normalize all variables and apply a weighted comprehensive evaluation method to quantify the level of social vitality among the residents in the different communities. The selection of data sources for each indicator was based on the reliability assessment from the previous validation process, as well as the applicability and quality of each data type. The following strategy was adopted for the final scoring:
Activity diversity and activity frequency were derived solely from questionnaire survey data. Given the current limitations of GPS and Wi-Fi probe technologies in capturing these subjective behavioral characteristics, the structured surveys were considered the most representative and complete method for obtaining relevant information.
For activity duration, although both the questionnaire and GPS data were available, the GPS-based measures showed limited accuracy and a weak correlation due to signal instability and positioning errors. As a result, the questionnaire data were selected as the basis for this indicator.
In the case of activity range, despite a high degree of consistency between the questionnaire responses and GPS heat maps, the GPS trajectory data were ultimately adopted. This decision was based on the spatial objectivity and intuitive visualization advantages of GPS data, which provide a more reliable representation of spatial movement patterns.
For activity volatility, the results from the Wi-Fi probe data closely matched those from the survey. Therefore, the final score for this indicator was computed as the average of both sources, enhancing both its objectivity and accuracy in the evaluation.
Based on the above selection of data sources and the indicator weights determined using the Analytic Hierarchy Process (AHP)—activity diversity: 0.4162; activity duration: 0.1611; activity frequency: 0.2618; activity range: 0.0986; and activity volatility: 0.0623—the comprehensive vitality scores for the three studied communities were calculated (see
Table 4).
3.5. Node Identification Based on Spatial Behavior Analysis
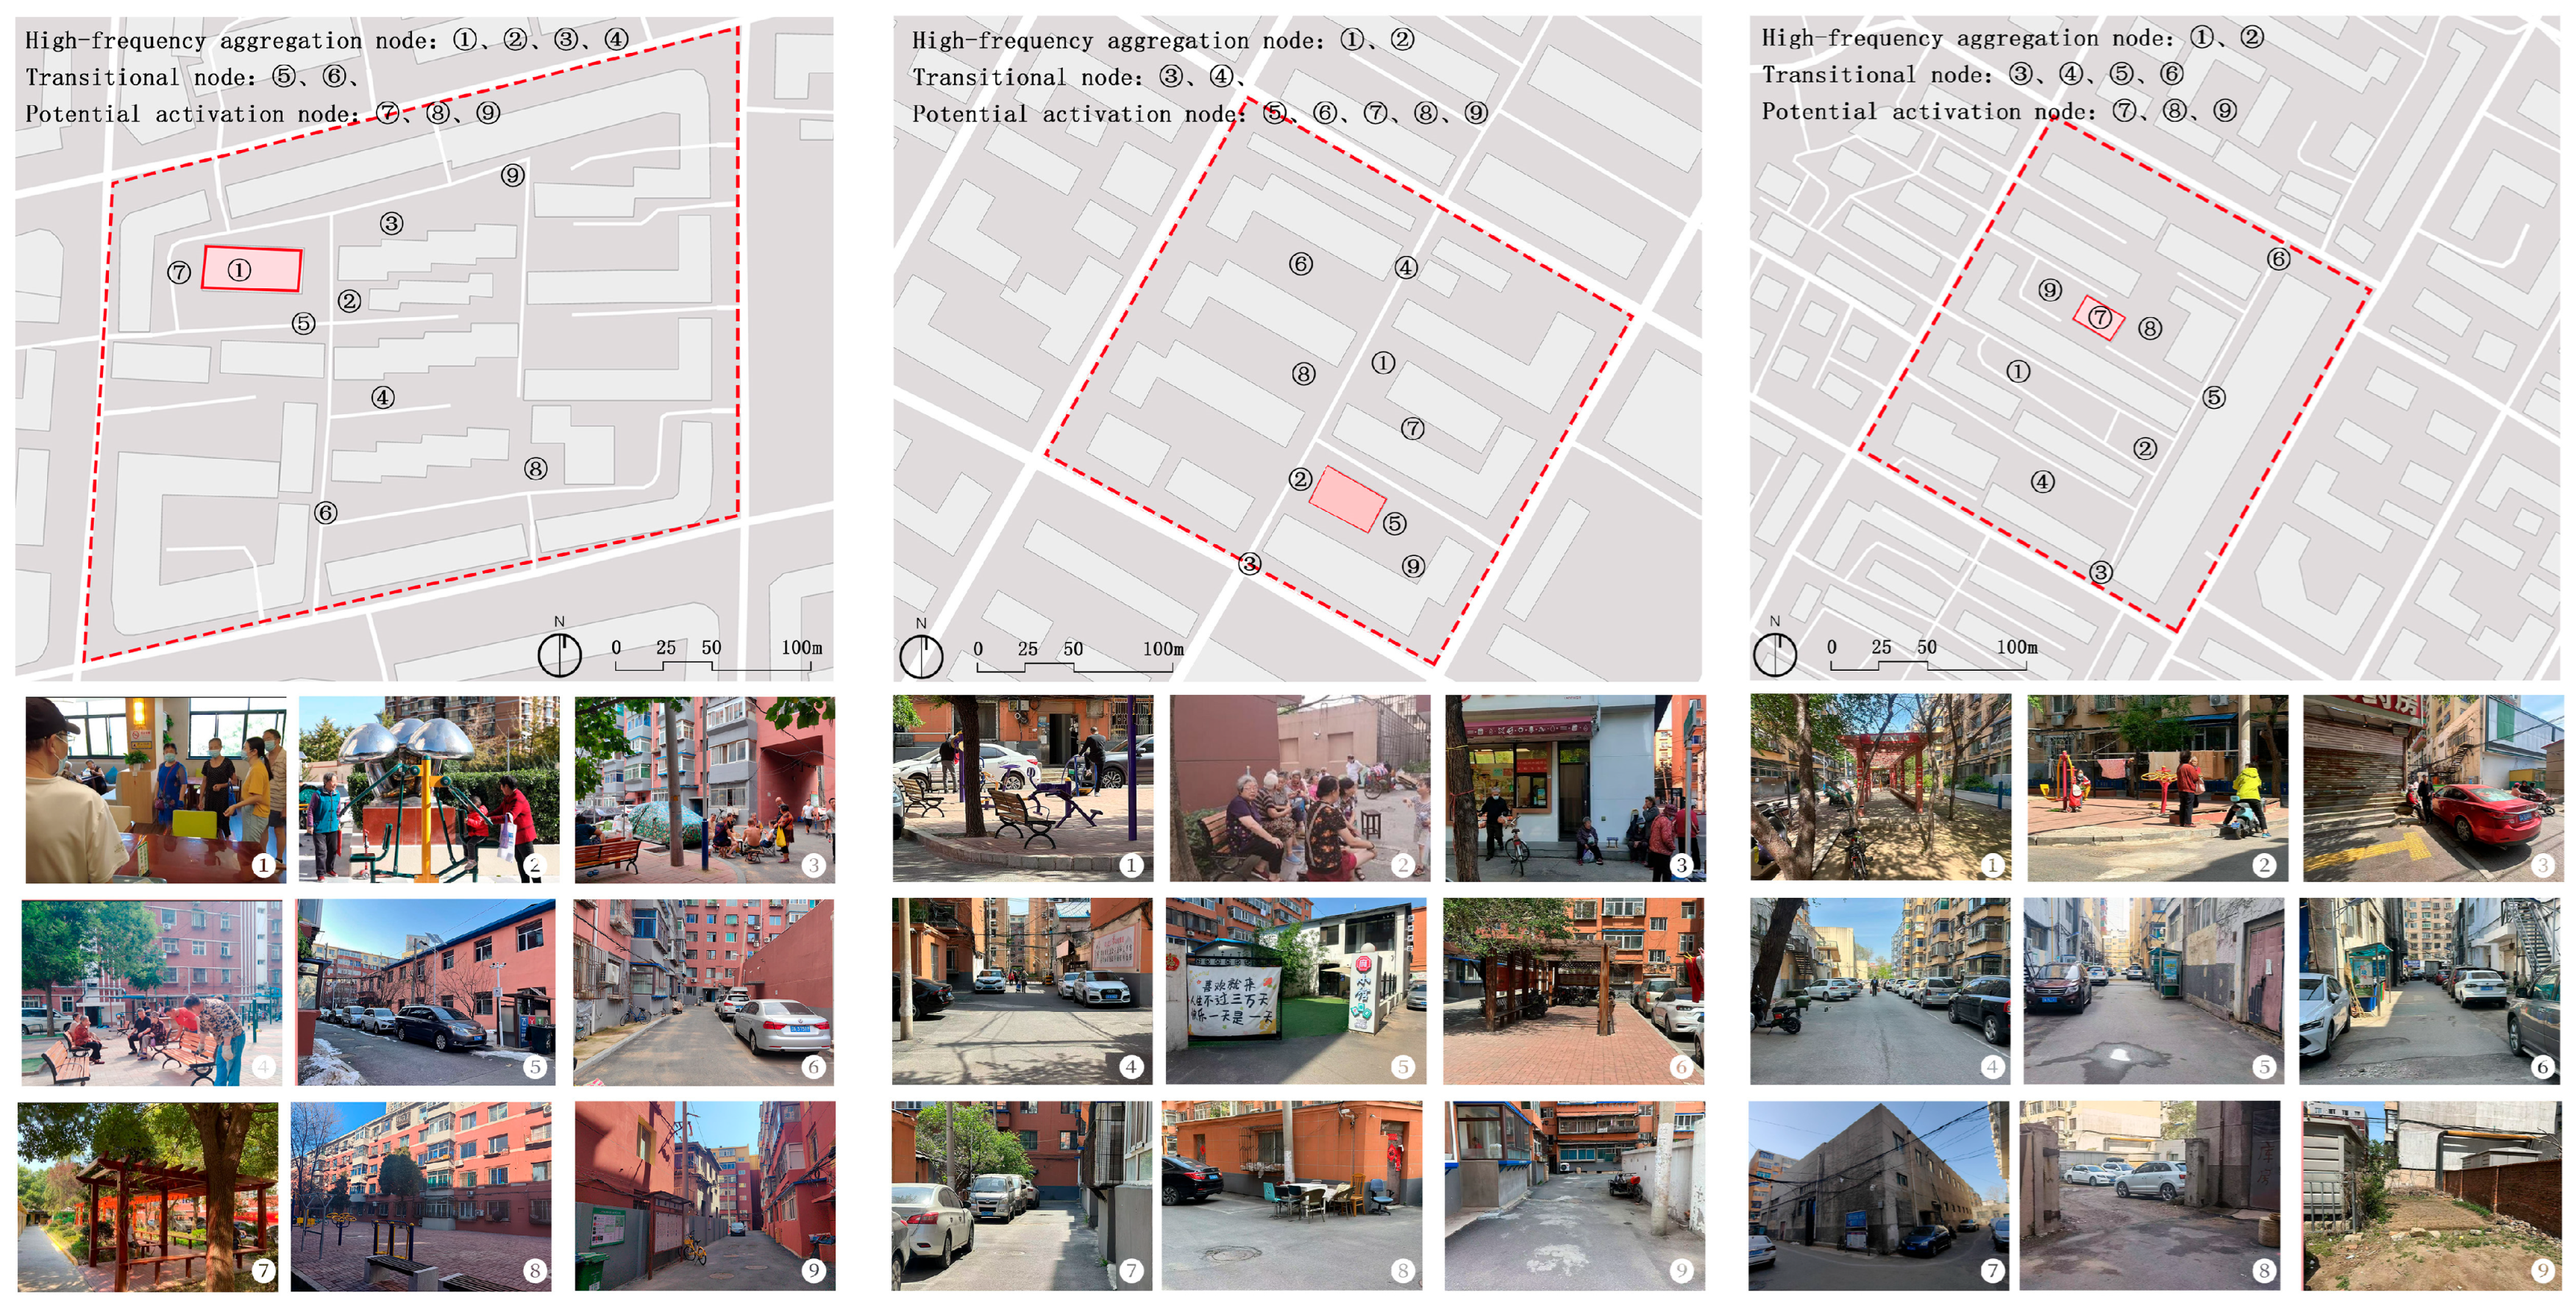
Building on the pronounced vitality gradients observed among the macro-level renovation modes, this study further adopts a spatial-behavioral perspective to enrich the micro-level analysis of the internal spaces in the community service centers, recreational venues, and unrenovated sites by identifying and classifying spatial nodes within the representative neighborhoods, as shown in
Figure 10. The nodes are categorized into three types:
High-frequency aggregation nodes: Areas with a strong physical draw—such as community plazas or seating zones—that maintain consistently high activity levels throughout the day.
Transitional nodes: Located at pathway intersections or peripheral spaces, these nodes offer strong connectivity but a low dwell time, functioning as zones dominated by “through-movement” behaviors.
Potential activation nodes: Currently exhibiting low activity but characterized by good accessibility or visual permeability, these nodes possess latent potential for reactivation through targeted micro-interventions.
4. Discussion
This study conducted a comprehensive analysis of community vitality across neighborhoods with varying boiler room renovation modes utilizing questionnaire data, GPS mobile tracking data, Wi-Fi probe data, and field measurements. To ensure the reliability of the data and the robustness of the conclusions, a multi-source data cross-validation method was employed before conducting the formal weighted composite analysis. This approach allowed for the mutual verification and complementarity of various data types. Through the comparison and integration of different datasets, consistent trends and features were identified, thereby enhancing the scientific rigor and credibility of the research findings. A multidimensional vitality evaluation framework was established, encompassing spatial utilization, temporal distribution, and activity diversity.
The results indicate a significant gradient in the capacity of different renovation modes to stimulate community vitality: the community service center model scored 3.64, followed by the cultural and recreational facilities at 3.16, and the non-renovated boiler rooms at 2.67. These findings not only align closely with the initial theoretical hypotheses but also empirically uncover the underlying mechanisms of vitality generation through scientific quantification. The core findings can be summarized in the following three dimensions:
Spatial restructuring effect: The community service center model maximizes spatial efficiency through functional integration, forming a multi-nodal activity network within a 500 m radius. Compared to the non-renovated communities, this model reduced residents’ average activity radius by 38% and increased spatial utilization by a factor of 2.2. In contrast, the cultural/recreational renovation model, due to its singular function, exhibited higher levels of activity concentration and 42% of temporal spatial idleness. This result is consistent with international research on adaptive reuse. For instance, Yung et al. (2024), in their study of Tianzifang in Shanghai, emphasized that the community-led adaptive reuse of historic buildings can enhance social networks, preserve traditional lifestyles, and promote sustainable development [
35].
Temporal distribution characteristics: Renovation projects significantly extended the duration of community vitality. The community service center model sustained continuous vitality for 12 h daily (7:00–19:00), with peak-hour foot traffic reaching 3.7 times that of non-renovated communities. Moreover, vitality during off-peak hours remained above 65% of the baseline level, forming a stable “dual-peak, three-phase” activity rhythm—morning exercise, midday rest, and evening gatherings.
Social interaction quality: Functional adaptability directly influences the intensity of social interaction. The community service center model generated an average of 152 social interactions per 1000 square meters per day, 58% higher than the cultural/recreational model. Notably, intergenerational interactions increased by 43%, demonstrating that integrated functional design effectively breaks down age-related social barriers. This result aligns with international research on adaptive reuse for sustaining community vitality. For example, Fabi studied the adaptive reuse practices of historic spa towns in Europe and found that the reuse of cultural heritage could promote local development and regional cohesion [
36].
However, macro-level vitality scores and the indicator system alone cannot fully reveal the spatial mechanisms and precise loci through which community vitality emerges. Accordingly, this study adopted a spatial-behavioral perspective, integrating field observations and GPS mobility data to examine crowd aggregation patterns, activity types, and interaction modes at representative spatial nodes. Based on these analyses, three node types were identified under different adaptive reuse modes—high-frequency aggregation nodes, transitional nodes, and potential activation nodes—to elucidate their roles and spatial characteristics within the community vitality transmission mechanism and to offer actionable spatial guidance for micro-renewal strategies, as shown in
Figure 10.
In the community service center model, nodes ①–④ function as high-frequency aggregation points: they sustain stable flows throughout the day and exhibit strong behavior-attraction effects and intergenerational exchange, with field photos showing peak-period gatherings twice as large as off-peak levels. These nodes are anchored by the boiler house’s multifunctional service mix (e.g., elder care, activity centers), creating a core attractor field. By contrast, in the recreational conversion model (Zhenxing community), node ⑤ shows initial aggregation but is characterized by pronounced temporal volatility—activity concentrates among older residents in morning and afternoon sessions, with sharp declines at night and on weekends. Its single-use nature and lack of intergenerational spaces constrain long-term, diversified vitality generation.
Transitional nodes also vary by their reuse context. In the Baohuan community, node ⑤ (at the interface of the service center and main pathway) is equipped with seating, landscaping, and a community bulletin board, fostering brief stops and informal neighbor exchanges. In the unrenovated Energy-Saving community, however, node ⑤—though located at a path intersection—lacks infrastructure and visual cues, resulting in rapid pass-through movements with minimal dwell time; the Wi-Fi probe data confirm substantially lower device-dwell durations than at renovated nodes.
The potential activation nodes demonstrate the greatest spatial differentiation. In the Zhenxing community, node ⑥ (the former boiler house’s east courtyard) has latent potential but remains underutilized by residents because it operates as a fee-based chess venue, limiting spontaneous use. In the Energy-Saving community, nodes ⑧ and ⑨—adjacent to an unused boiler house—have become impromptu parking areas, with obstructed sightlines and negligible human activity, typifying spatial “dead zones”. Compared to the other models, these communities host more potential activation nodes, indicating high spatial plasticity. By introducing micro-interventions—such as basic furnishings, participatory amenities, and enhanced permeability—these nodes could be reactivated, thereby elevating overall community vitality.
Importantly, this node-level identification and this behavioral analysis carry significant policy and governance implications. Community planners can leverage node mappings to pinpoint “vitality deficits” and target specific spatial units for optimization, while policymakers could incorporate “node vitality” metrics into urban renewal evaluations, shifting from isolated “point interventions” to an integrated “network activation” paradigm. Such micro-space-based strategies can substantively enhance residents’ daily quality of life.
This study confirms that boiler room renovation can serve as a catalyst for micro-scale urban renewal, with its vitality-enhancing effects following a transmission mechanism of “functional integration–spatial permeability–temporal continuity”. Among the renovation types, the community service center model, by constructing a 15 min living circle service matrix, achieved a precise alignment between its spatial resources and resident behaviors and is therefore recommended as a priority model for promotion. The spatial-temporal-behavioral three-dimensional evaluation framework developed in this research offers a quantifiable decision support tool for the renewal of urban stock spaces.
5. Conclusions
This study, by comprehensively analyzing community vitality in neighborhoods with boiler rooms under different renovation modes, elucidates the significant mechanisms through which spatial interventions influence community vitality. These findings not only offer new perspectives on the multidimensional nature of community vitality but also provide scientific guidance for urban planning and community policymaking.
At the neighborhood level, the community service center model markedly enhances residents’ quality of life. Through functional integration, this model maximizes spatial efficiency and establishes a multi-core activity network within a 500 m radius, reducing residents’ average activity radius by 38% and doubling space utilization compared to non-renovated communities. It also extends daily vitality duration and, by increasing intergenerational interaction frequency by 43%, effectively bridges age group divides—thereby reinforcing residents’ sense of belonging and community cohesion. In contrast, recreational-only renovations, while improving vitality, generate highly concentrated activity peaks and pronounced off-peak idle periods due to their single-purpose design.
From a policy perspective, this research provides a robust empirical foundation. It recommends that planners prioritize the community service center model in similar cold-region, aging neighborhoods. By implementing a 15 min living circle service matrix, this approach aligns spatial resources with resident behaviors, significantly elevating community vitality and overall well-being. Policymakers are encouraged to adopt a “node vitality” metric within their urban renewal evaluations to shift from isolated, point-based interventions toward integrated network activation—thereby transitioning from mere physical restoration to holistic social revitalization. Such micro-space-focused strategies can materially improve residents’ everyday experiences.
In terms of scientific contribution, this study innovatively integrates GPS tracking, Wi-Fi probe data, surveys, and field observations to construct a three-dimensional “space–time–behavior” evaluation model. This methodology enhances both the data reliability and the robustness of the conclusions, offering a quantifiable decision support tool for future inquiries. By classifying and mapping spatial nodes in representative communities, the research further reveals the micro-level vitality mechanisms across the renovation modes—providing urban planners and designers with precise, actionable insights to identify and address “vitality gaps” within neighborhoods.
In summary, this study not only furnishes scientific evidence for boiler-room adaptive reuse in cold-region aging communities but also delivers actionable recommendations for urban planning and community policy. By promoting the community service center paradigm and integrating the node vitality metric, practitioners can substantially boost community vitality and residents’ quality of life—thereby fostering a transition from purely physical transformations to enduring social and cultural revitalization.
Although this study provides scientific evidence for boiler room renovation and demonstrates the positive impact of spatial transformation on community vitality, there are still certain limitations, particularly regarding the small sample size, which may limit the generalizability of the results. Therefore, future research should focus on the following areas: first, expanding the sample size and conducting long-term dynamic monitoring to assess changes in community vitality under different renovation modes across various seasons and time periods; second, considering additional potential confounding factors, such as the community’s cultural background, residents’ needs, and the variability in renovation environments; and third, conducting a follow-up evaluation after policy implementation to verify the effectiveness of the proposed recommendations in the actual renovations, providing more scientifically grounded evidence for future policy adjustments.


