
Heat Risk Assessment in Arid Zones Based on Local Climate Zones: A Case of Urumqi, China
 , ,
, ,
Abstract
1. Introduction
- What is the distribution relationship between urban heat risk and LCZ types in arid zones?
- The heterogeneity of LCZ zoning in heat risk in arid zones.
- Strategy planning based on LCZ zoning in arid zones.
2. Materials and Methods
2.1. Study Area
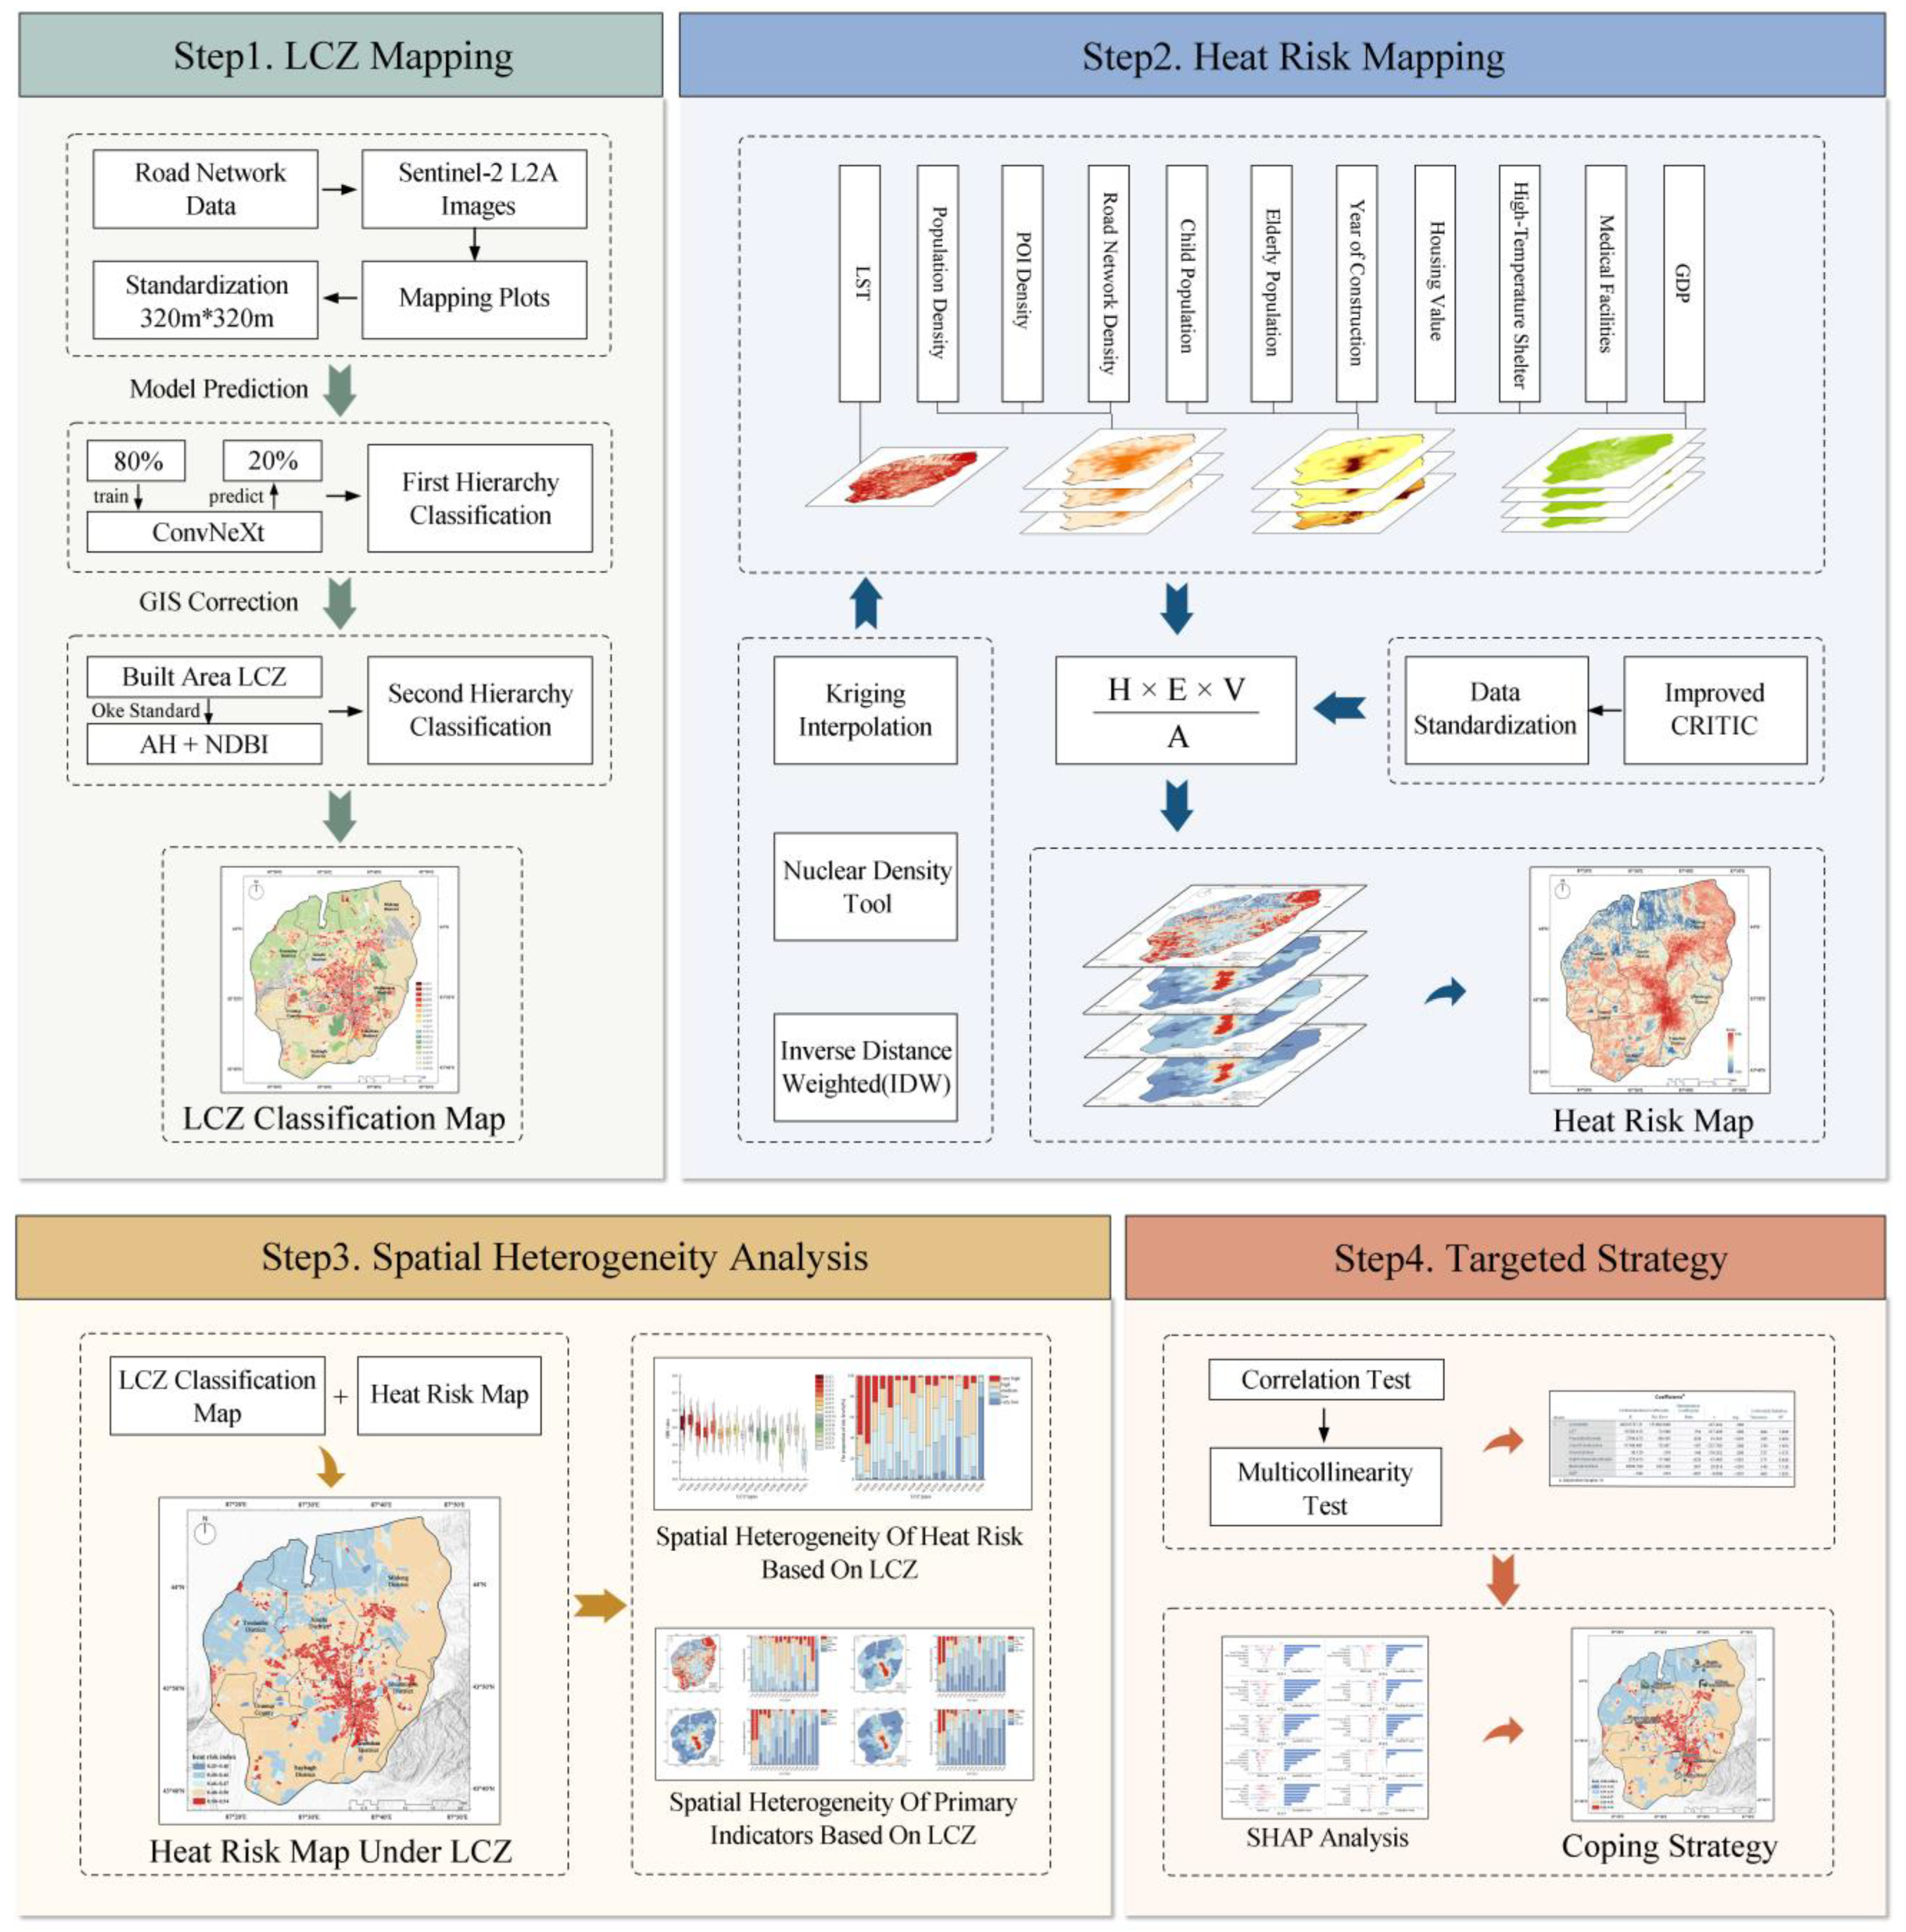
2.2. Research Methodology
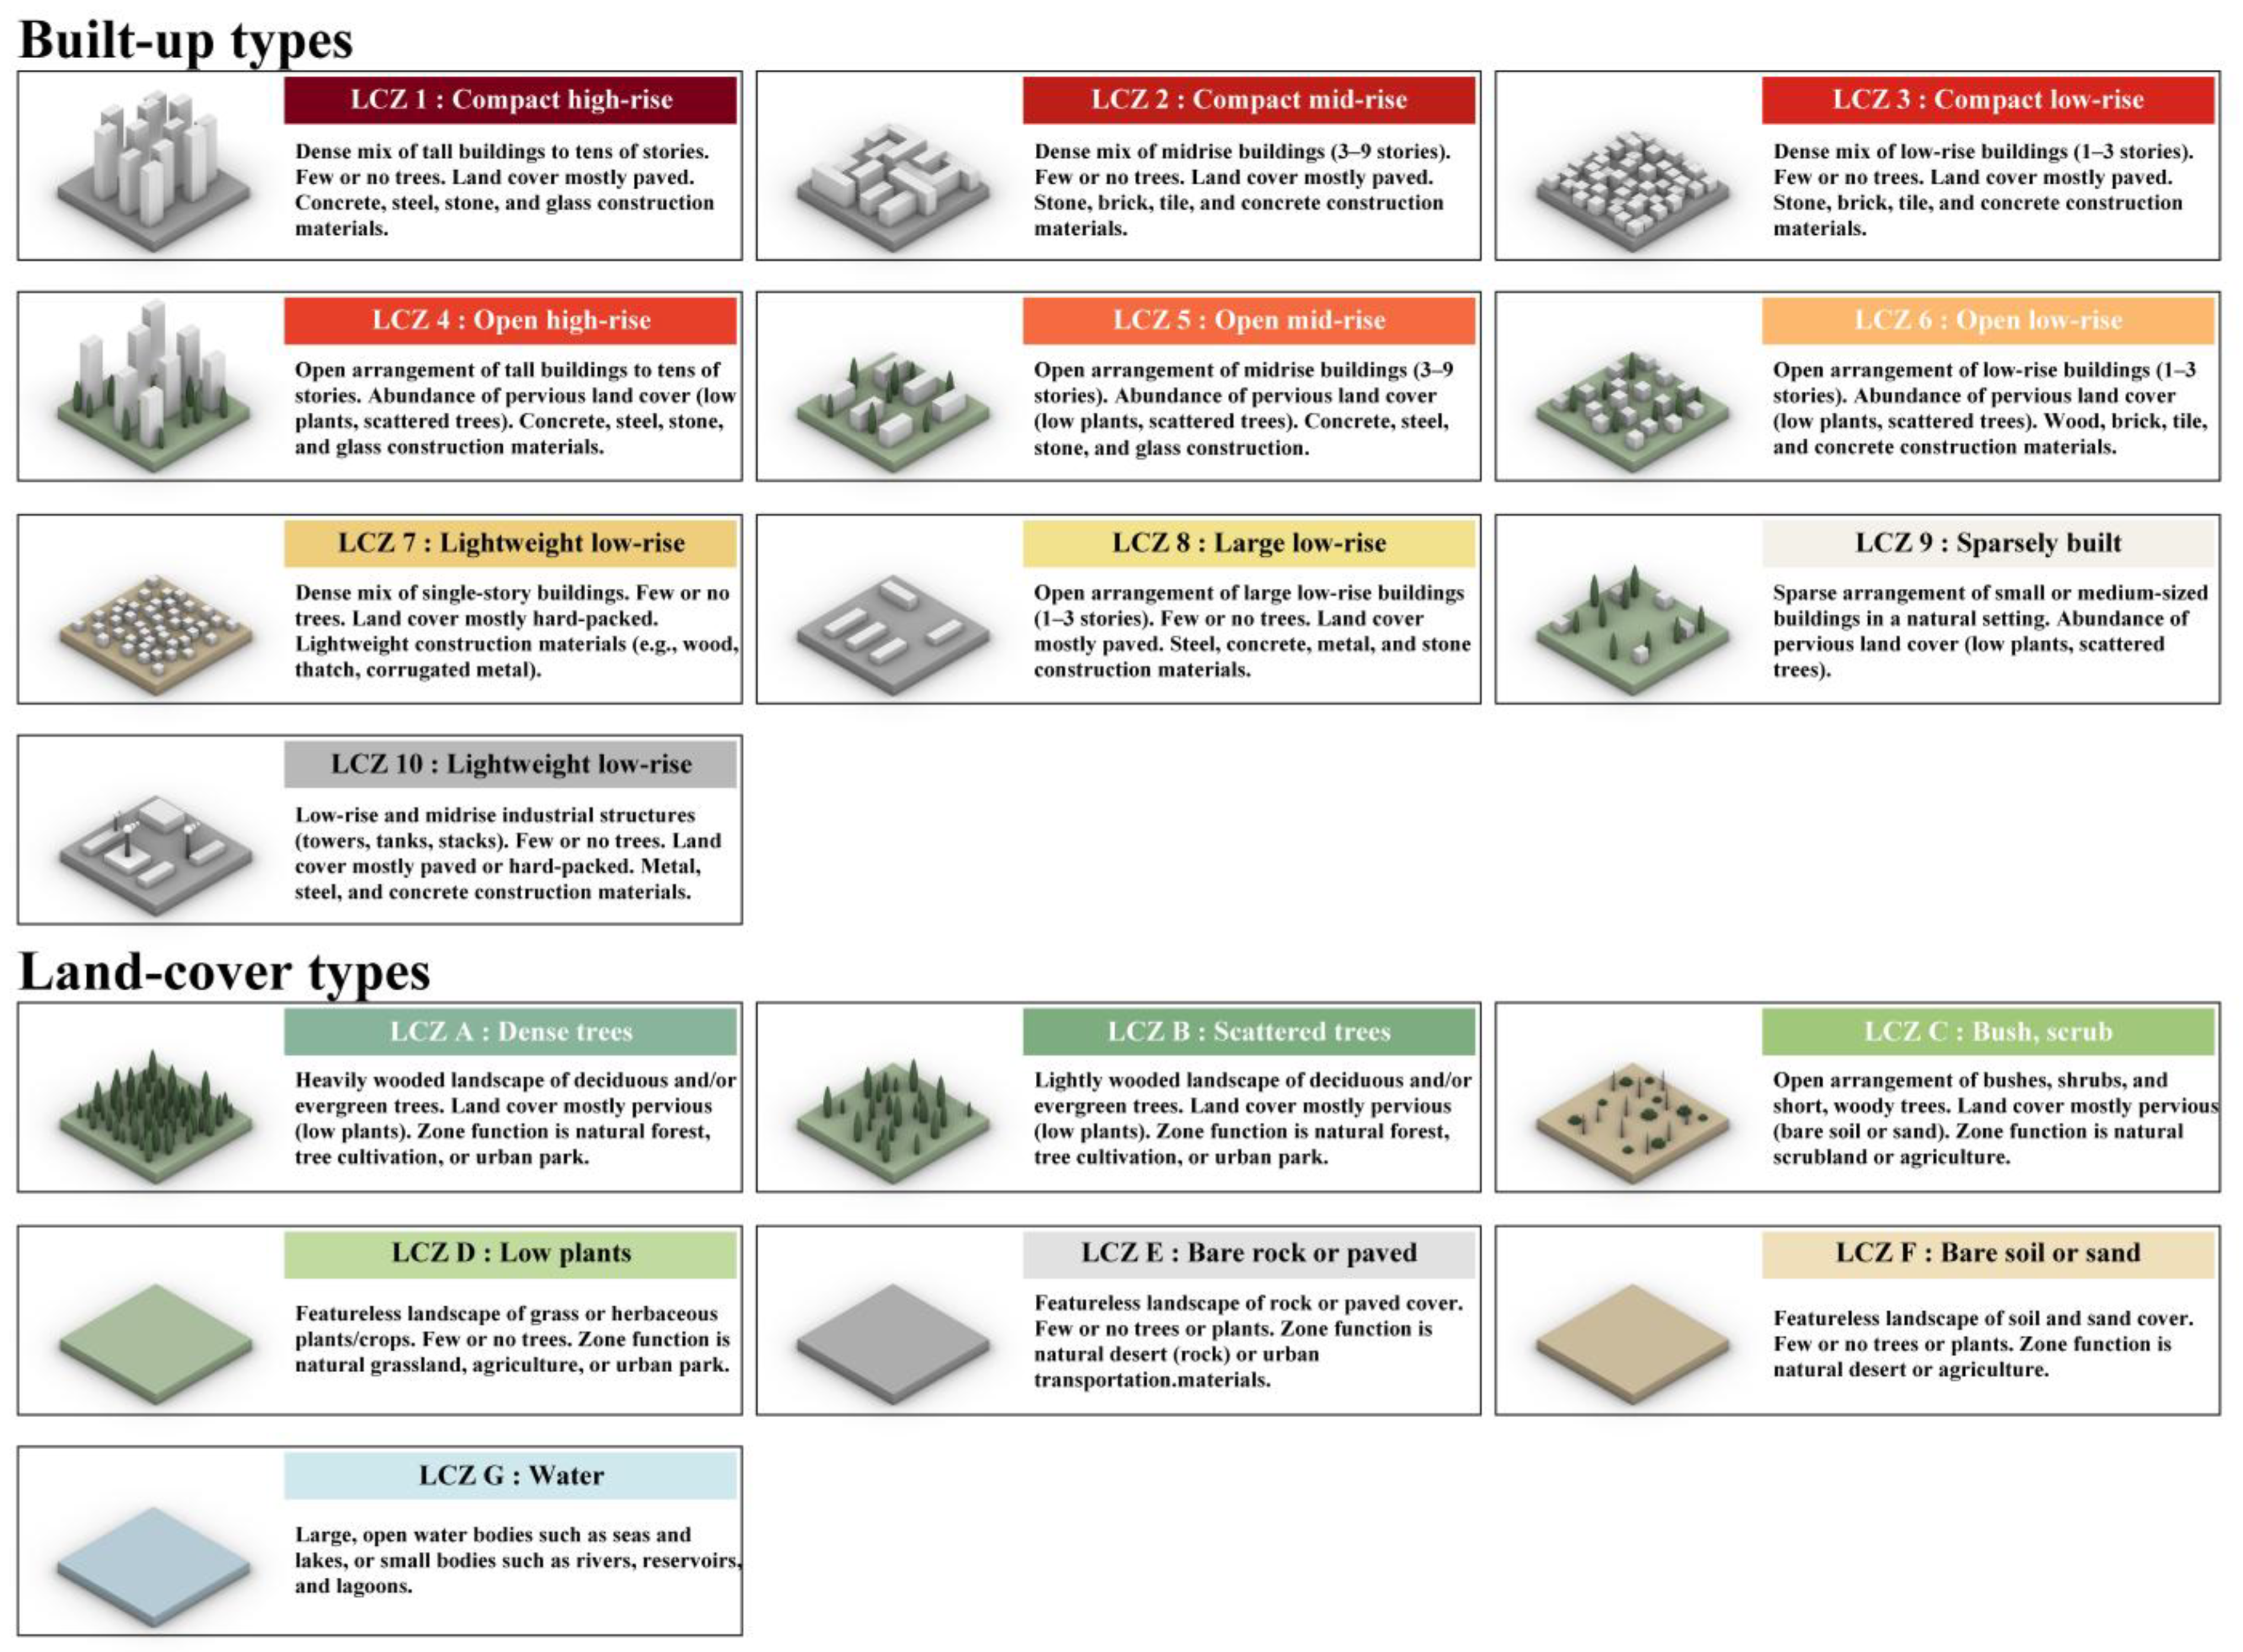
2.2.1. LCZ Mapping
2.2.2. Heat Risk System Selection
2.2.3. Data Sources and Standardization of Secondary Indicators
2.2.4. Improved CRITIC Assignment Methodology
- Calculation of contrast: The standard deviation is used in the CRITIC method as a mathematical representation of the degree of data dispersion within an indicator. According to the principle of statistics, the standard deviation, as an absolute measure of dispersion, is positively correlated with the fluctuation amplitude of the indicator data set: the standard deviation represents the contrast of the jth indicator, and an increase in the value of indicates that the heterogeneity of the distribution of the sample values of the jth indicator has increased significantly, and its information-carrying capacity and evaluation strength have also been increased. Based on the framework of information entropy theory, such indicators with high dispersion need to be given higher weights in the comprehensive evaluation process to accurately reflect their differentiated characteristics. The quantitative formula for indicator contrast can be expressed as follows:where denotes the data normalized to the jth indicator value for the ith sample, and denotes the mean of the data normalized to the jth indicator value.
- Calculation of conflictivity: this study defines conflictivity as a quantitative characterization of the degree of information redundancy between indicators. When two indicators show significant positive correlation, i.e., the value of conflictivity is small, it indicates that the information overlap between them is high, and their independence characteristics are subsequently decayed. This phenomenon will lead to highly correlated indicator groups forming information redundancy, weakening the marginal contribution of individual indicators in the comprehensive evaluation. Therefore, it is necessary to moderately reduce the weight proportion of such indicators in the weight allocation process to optimize the signal-to-noise ratio of the evaluation system. The conflicting formula is as follows:where indicates the correlation coefficient between indicator i and indicator j. The larger the conflictivity , the higher the indicator independence.
- Calculation of information carrying capacity: synthesize contrast and conflict to calculate the amount of indicator information:Determine the weight according to the proportion of information; the greater the information carrying capacity, the greater the weight. Set the weight of the first indicator as :
2.2.5. Establishment of a Heat Risk Assessment System
3. Results
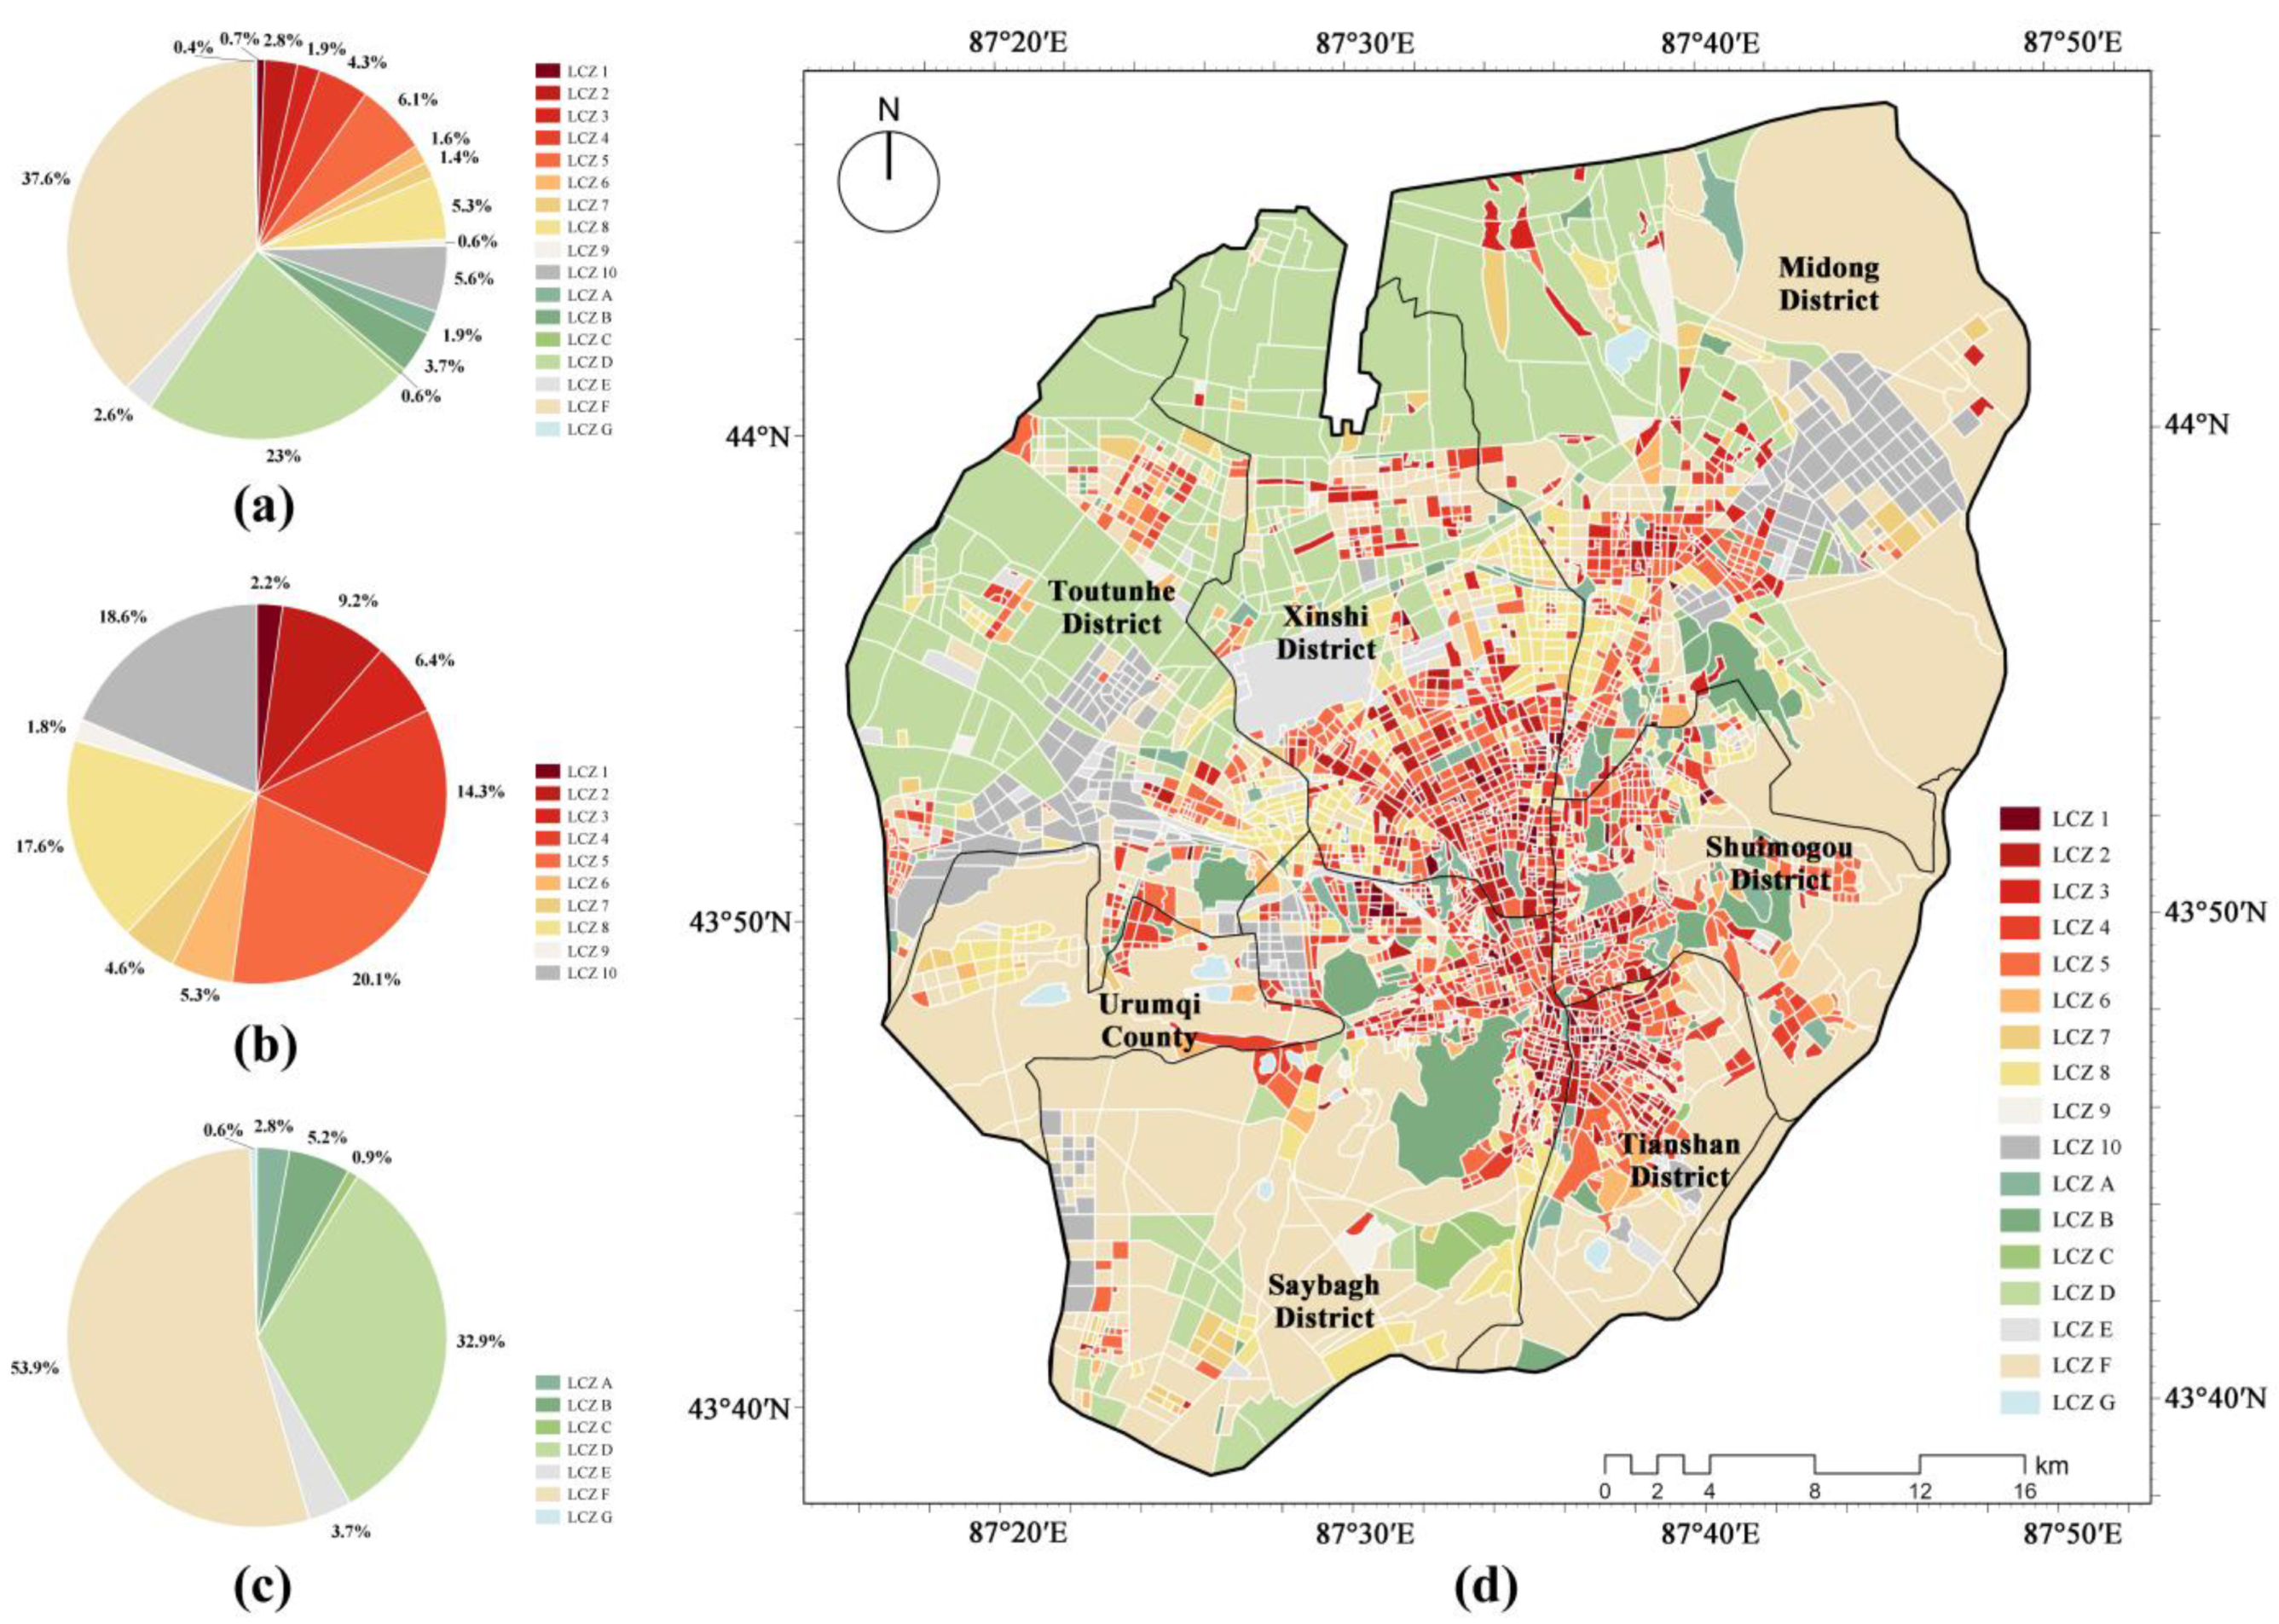
3.1. Description of the LCZ Map of Urumqi
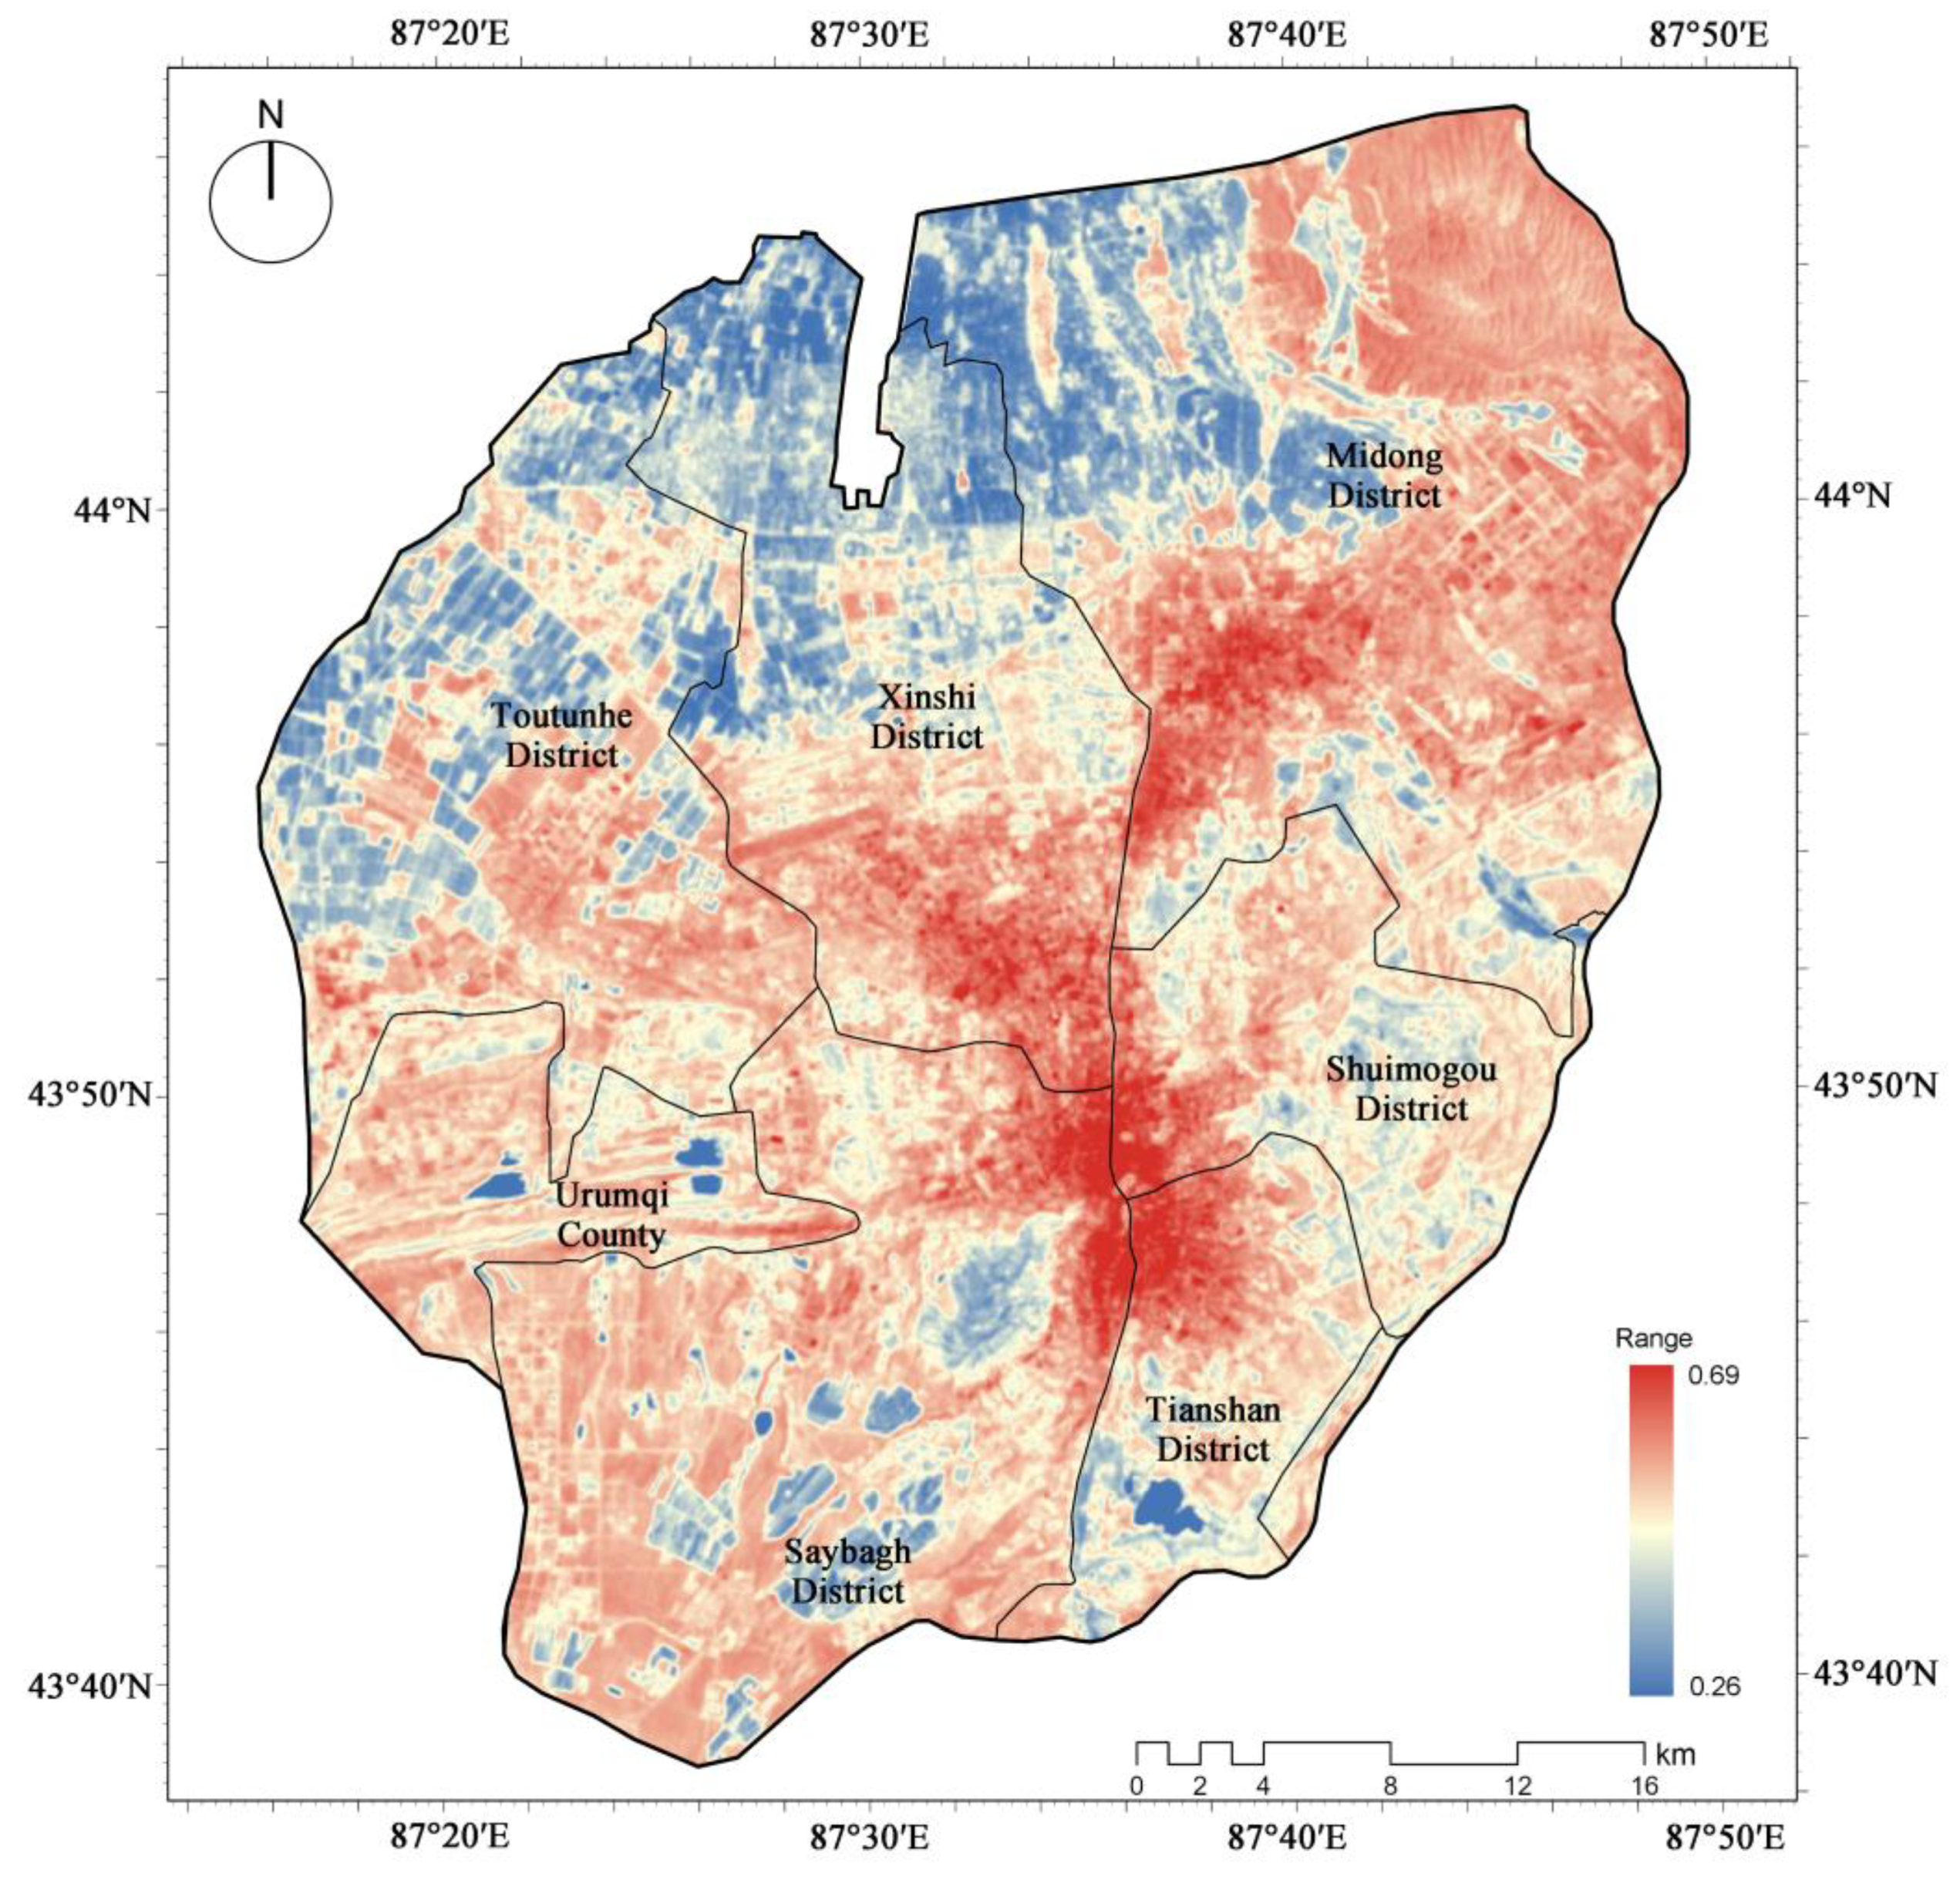
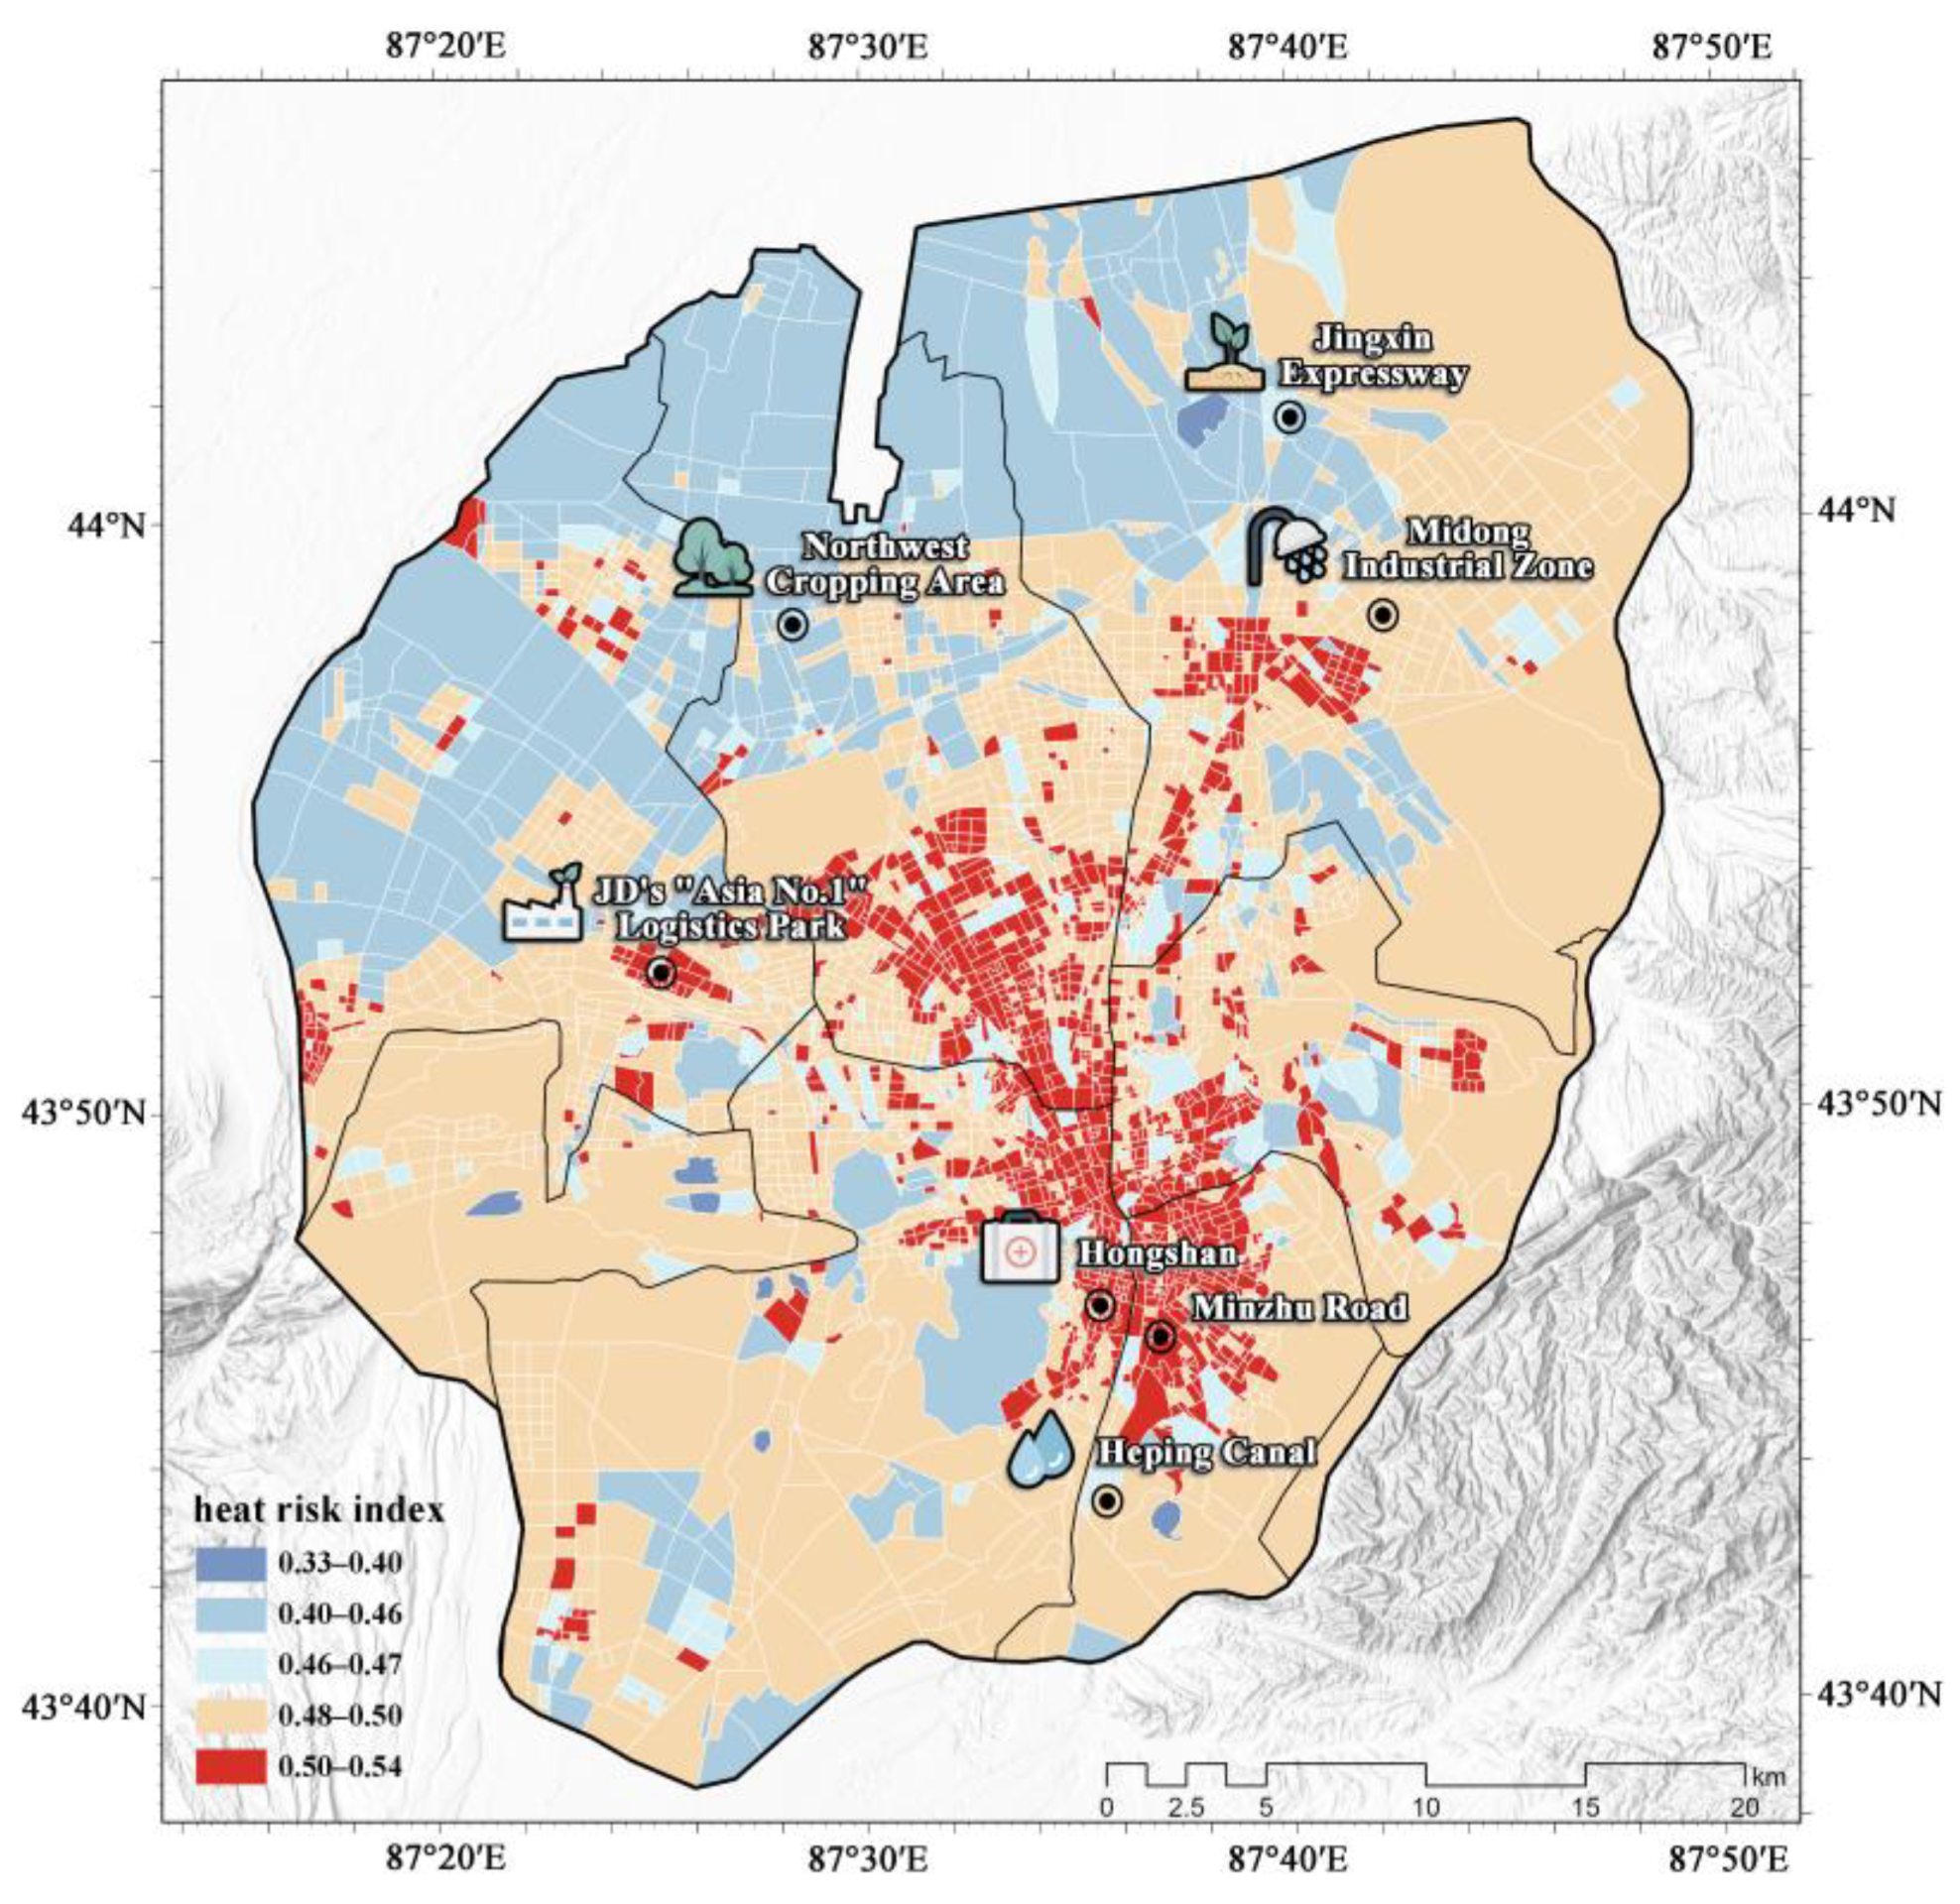
3.2. Heat Risk Assessment Map of Urumqi
3.3. LCZ-Based Heat Risk Analysis
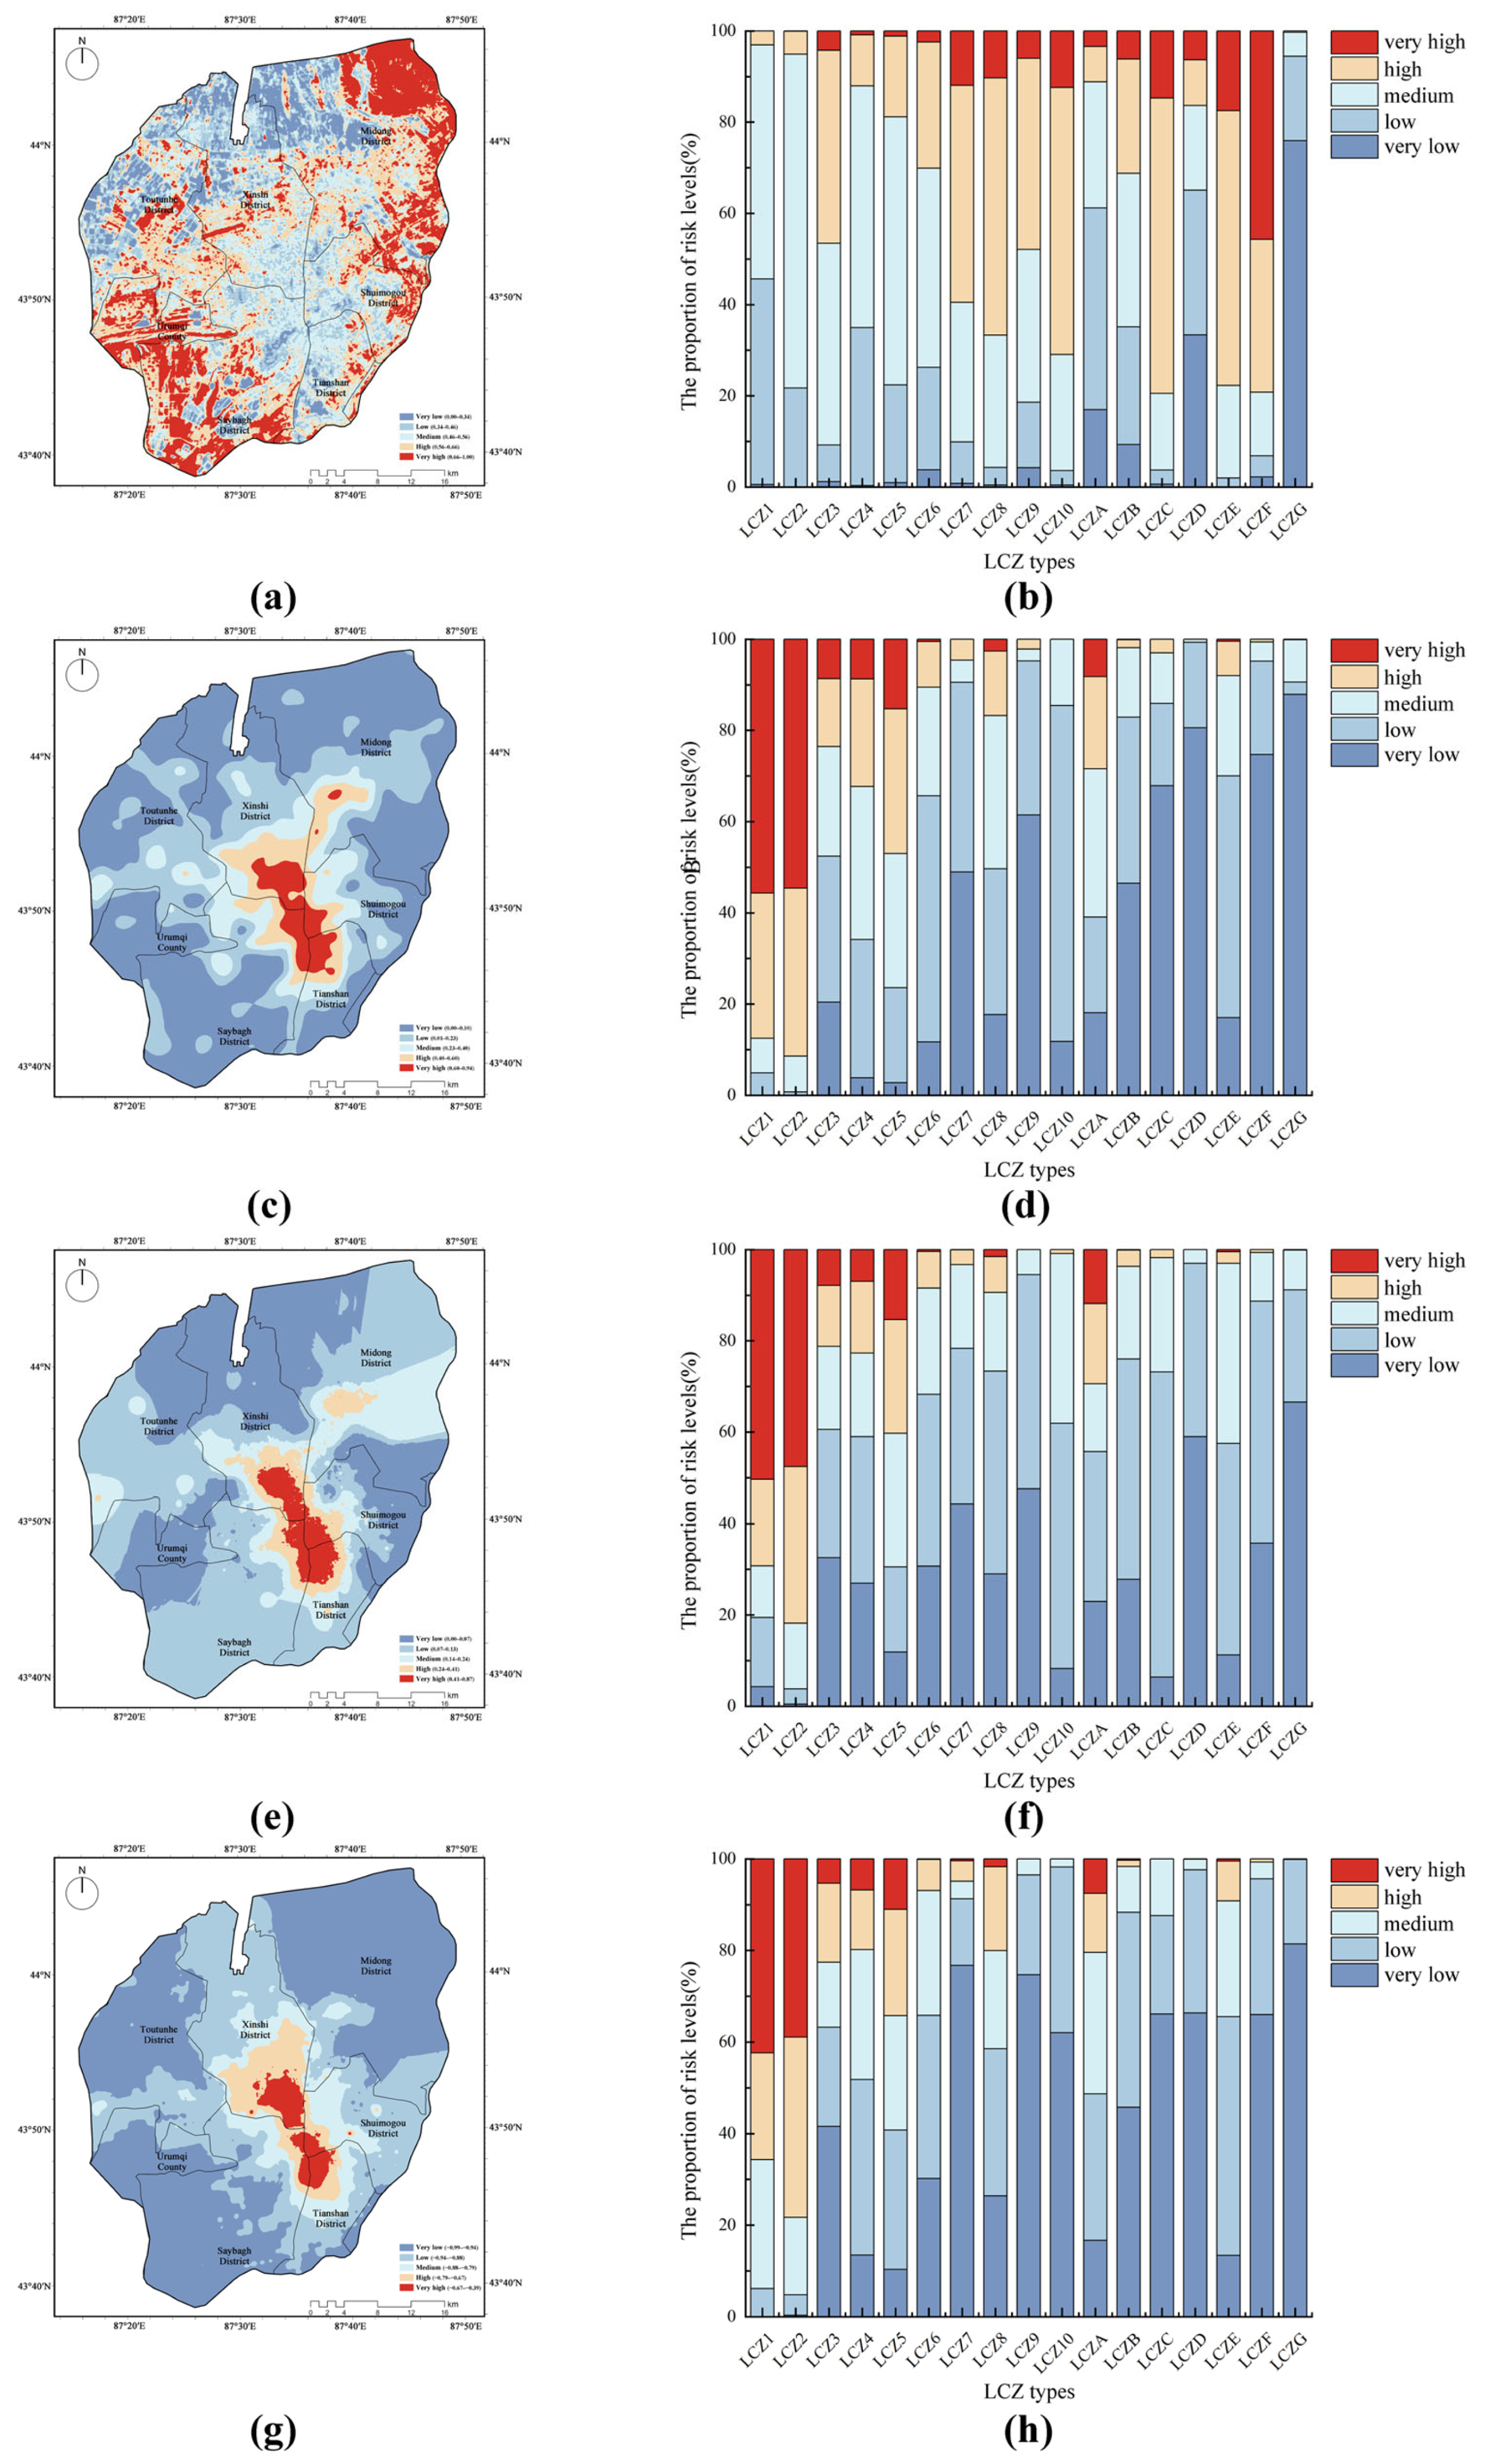
3.3.1. LCZ-Based Spatial Heterogeneity of Heat Risk
3.3.2. Spatial Heterogeneity of LCZ-Based Primary Indicators
4. Discussion
4.1. Heat Risk Heterogeneity in Arid Zones Under LCZ Framework
4.2. Neighborhood-Scale Coping Strategies for Heat Risk in Arid Zones
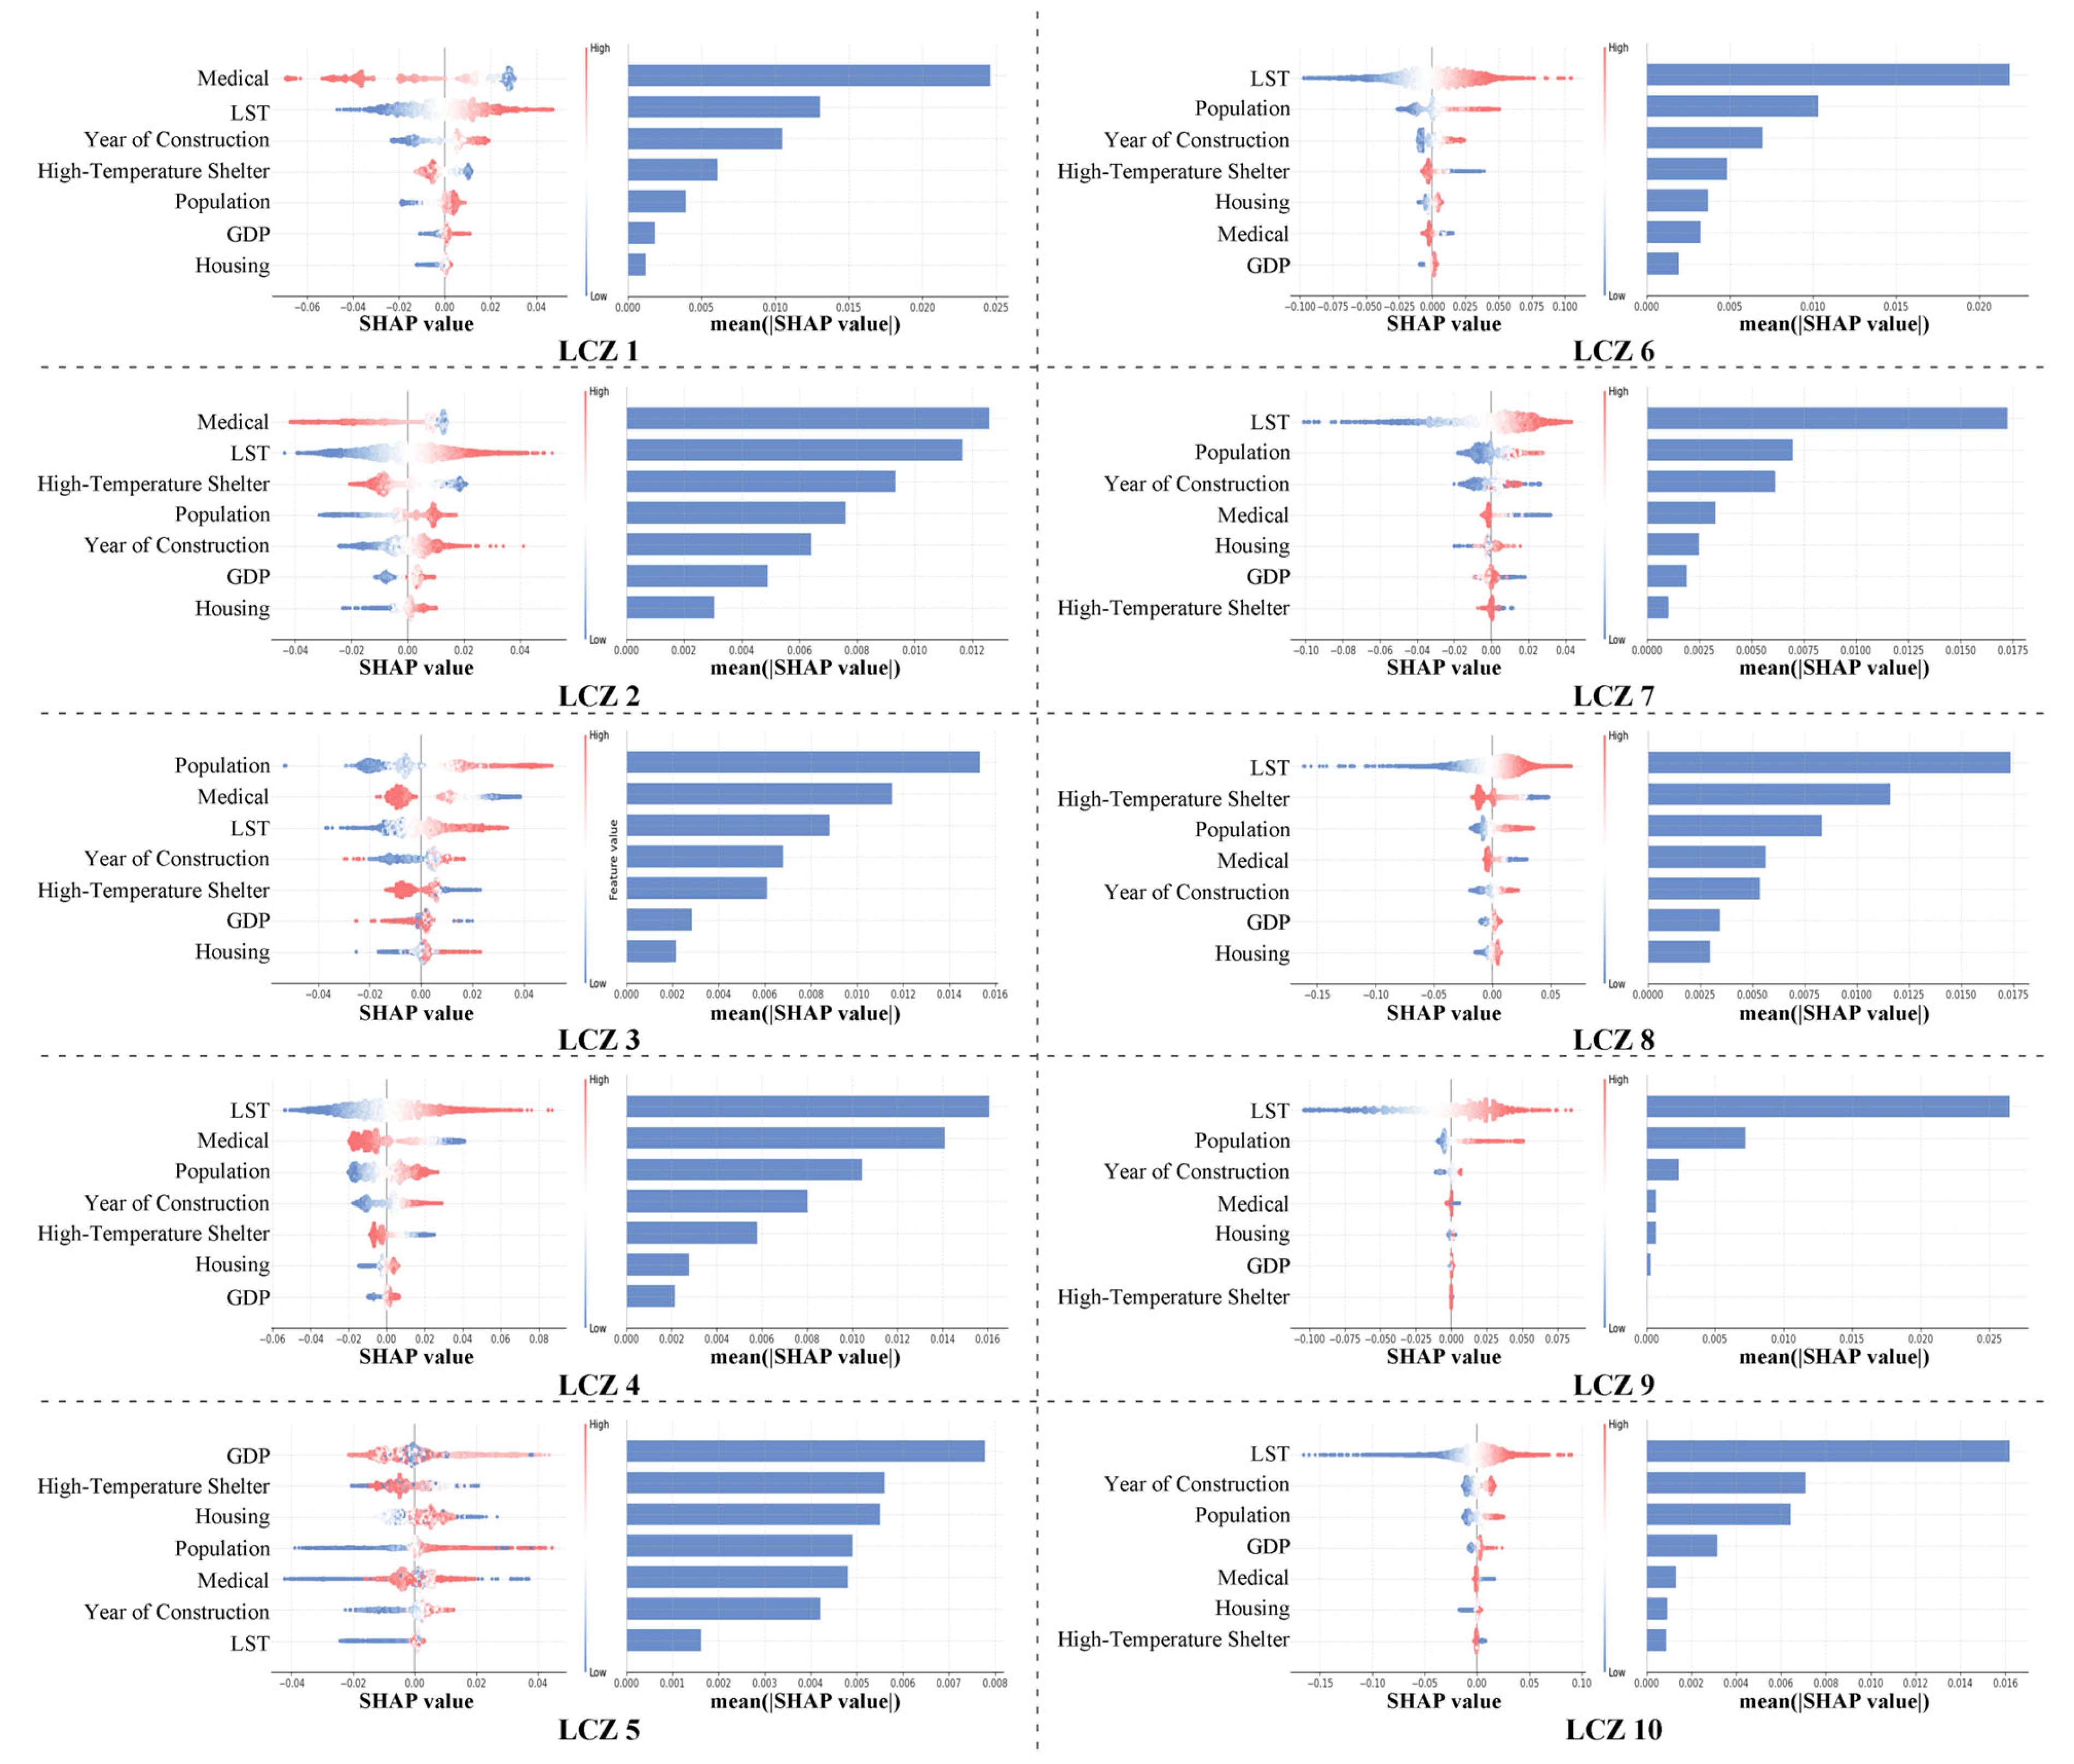
4.2.1. SHAP-Based Analysis of Indicator Contributions
4.2.2. Strategy Response
4.3. Limitations and Prospects
5. Conclusions
Author Contributions
Funding
Data Availability Statement
Conflicts of Interest
Abbreviations
| LCZ | Local Climate Zone |
| HEVA | Hazard–Exposure–Vulnerability–Adaptability |
| HEV | Hazard–Exposure–Vulnerability |
| HVI | Heat Vulnerability Index |
| SHAP | Shapley Additive Explanations |
| RS | Remote Sensing |
| GIS | Geographic Information System |
| PCA | Principal Component Analysis |
| EWM | Entropy Weight Method |
| CRITIC | Criteria Importance Though Intercriteria Correlation |
| LST | Land Surface Temperature |
| AH | Average Height |
| SUHI | Surface Urban Heat Island |
| NDBI | Normalized Difference Built-up Index |
| NDVI | Normalized Difference Vegetation Index |
| POI | Point Of Information |
| VIF | Variance Inflation Factor |
References
- United Nations, Department of Economic and Social Affairs, Population Division. World Urbanization Prospects: The 2018 Revision; United Nations: New York, NY, USA, 2019. [Google Scholar]
- Oke, T.R.; Cleugh, H.A. Urban heat storage derived as energy balance residuals. Bound.-Layer Meteorol. 1987, 39, 233–245. [Google Scholar] [CrossRef]
- Malede, D.A.; Andualem, T.G.; Yibeltal, M.; Alamirew, T.; Kassie, A.E.; Demeke, G.G.; Mekonnen, Y.G. Climate change impacts on hydroclimatic variables over Awash basin, Ethiopia: A systematic review. Discov. Appl. Sci. 2024, 6, 27. [Google Scholar] [CrossRef]
- Vujovic, S.; Haddad, B.; Karaky, H.; Sebaibi, N.; Boutouil, M. Urban Heat Island: Causes, Consequences, and Mitigation Measures with Emphasis on Reflective and Permeable Pavements. CivilEng 2021, 2, 459–484. [Google Scholar] [CrossRef]
- Oppermann, E.; Kjellstrom, T.; Lemke, B.; Otto, M.; Lee, J.K.W. Establishing intensifying chronic exposure to extreme heat as a slow onset event with implications for health, wellbeing, productivity, society and economy. Curr. Opin. Environ. Sustain. 2021, 50, 225–235. [Google Scholar] [CrossRef]
- Cichowicz, R.; Bochenek, A.D. Assessing the effects of urban heat islands and air pollution on human quality of life. Anthropocene 2024, 46, 100433. [Google Scholar] [CrossRef]
- Tomlinson, C.J.; Chapman, L.; Thornes, J.E.; Baker, C.J. Including the urban heat island in spatial heat health risk assessment strategies: A case study for Birmingham, UK. Int. J. Health Geogr. 2011, 10, 42. [Google Scholar] [CrossRef]
- Sharmin, T.; Chappell, A.; Lannon, S. Spatio-temporal analysis of LST, NDVI and SUHI in a coastal temperate city using local climate zone. Energy Built Environ. 2024. [Google Scholar] [CrossRef]
- Ketterer, C.; Matzarakis, A. Comparison of different methods for the assessment of the urban heat island in Stuttgart, Germany. Int. J. Biometeorol. 2015, 59, 1299–1309. [Google Scholar] [CrossRef]
- Ellena, M.; Melis, G.; Zengarini, N.; Di Gangi, E.; Ricciardi, G.; Mercogliano, P.; Costa, G. Micro-scale UHI risk assessment on the heat-health nexus within cities by looking at socio-economic factors and built environment characteristics: The Turin case study (Italy). Urban Clim. 2023, 49, 101514. [Google Scholar] [CrossRef]
- Lopes, H.S.; Vidal, D.G.; Cherif, N.; Silva, L.; Remoaldo, P.C. Green infrastructure and its influence on urban heat island, heat risk, and air pollution: A case study of Porto (Portugal). J. Environ. Manag. 2025, 376, 124446. [Google Scholar] [CrossRef]
- Aubrecht, C.; Özceylan, D. Identification of heat risk patterns in the U.S. National Capital Region by integrating heat stress and related vulnerability. Environ. Int. 2013, 56, 65–77. [Google Scholar] [CrossRef] [PubMed]
- Côté, J.-N.; Levac, E.; Germain, M.; Lavigne, E. Projected risk and vulnerability to heat waves for Montreal, Quebec, using Gaussian processes. Sustain. Cities Soc. 2024, 116, 105907. [Google Scholar] [CrossRef]
- Peres, L.d.F.; Lucena, A.J.d.; Rotunno Filho, O.C.; França, J.R.d.A. The urban heat island in Rio de Janeiro, Brazil, in the last 30 years using remote sensing data. Int. J. Appl. Earth Obs. Geoinf. 2018, 64, 104–116. [Google Scholar] [CrossRef]
- Inostroza, L.; Palme, M.; de la Barrera, F. A Heat Vulnerability Index: Spatial Patterns of Exposure, Sensitivity and Adaptive Capacity for Santiago de Chile. PLoS ONE 2016, 11, e0162464. [Google Scholar] [CrossRef]
- Ma, L.; Huang, G.; Johnson, B.A.; Chen, Z.; Li, M.; Yan, Z.; Zhan, W.; Lu, H.; He, W.; Lian, D. Investigating urban heat-related health risks based on local climate zones: A case study of Changzhou in China. Sustain. Cities Soc. 2023, 91, 104402. [Google Scholar] [CrossRef]
- Zhang, T.; Sun, Y.; Wang, R.; Yang, Y.; Yin, L.; Li, L.; Zhang, B. A new framework for assessing and dealing with heat risk from an urban resilience perspective. J. Clean. Prod. 2024, 479, 144008. [Google Scholar] [CrossRef]
- Kacker, K.; Srivastava, P.; Mukherjee, M. Heat stress risk at an intra-urban level: A case study of Delhi, India. Build. Environ. 2024, 264, 111897. [Google Scholar] [CrossRef]
- Peel, M.C.; Finlayson, B.L.; McMahon, T.A. Updated world map of the Köppen-Geiger climate classification. Hydrol. Earth Syst. Sci. 2007, 11, 1633–1644. [Google Scholar] [CrossRef]
- Wang, C.; Middel, A.; Myint, S.W.; Kaplan, S.; Brazel, A.J.; Lukasczyk, J. Assessing local climate zones in arid cities: The case of Phoenix, Arizona and Las Vegas, Nevada. ISPRS J. Photogramm. Remote Sens. 2018, 141, 59–71. [Google Scholar] [CrossRef]
- Wang, J.; Lu, L.; Zhou, X.; Huang, G.; Chen, Z. Spatio-Temporal Patterns and Drivers of the Urban Heat Island Effect in Arid and Semi-Arid Regions of Northern China. Remote Sens. 2025, 17, 1339. [Google Scholar] [CrossRef]
- Wang, C.; Li, Z.; Su, Y.; Zhao, Q.; He, X.; Wu, Z.; Gao, W.; Wu, Z. Impact of block morphology on urban thermal environment with the consideration of spatial heterogeneity. Sustain. Cities Soc. 2024, 113, 105622. [Google Scholar] [CrossRef]
- Gros, A.; Bozonnet, E.; Inard, C.; Musy, M. Simulation tools to assess microclimate and building energy—A case study on the design of a new district. Energy Build. 2016, 114, 112–122. [Google Scholar] [CrossRef]
- Larsen, L. Urban climate and adaptation strategies. Front. Ecol. Environ. 2015, 13, 486–492. [Google Scholar] [CrossRef]
- Kwok, Y.T.; Schoetter, R.; Lau, K.K.L.; Hidalgo, J.; Ren, C.; Pigeon, G.; Masson, V. How well does the local climate zone scheme discern the thermal environment of Toulouse (France)? An analysis using numerical simulation data. Int. J. Climatol. 2019, 39, 5292–5315. [Google Scholar] [CrossRef]
- Šećerov, I.; Savić, S.; Milošević, D.; Marković, V.; Bajšanski, I. Development of an automated urban climate monitoring system in Novi Sad (Serbia). Geogr. Pannonica 2015, 19, 174–183. [Google Scholar] [CrossRef]
- Wang, R.; Wang, M.; Ren, C.; Chen, G.; Mills, G.; Ching, J. Mapping local climate zones and its applications at the global scale: A systematic review of the last decade of progress and trend. Urban Clim. 2024, 57, 102129. [Google Scholar] [CrossRef]
- Stewart, I.D.; Oke, T.R. Local Climate Zones for Urban Temperature Studies. Bull. Am. Meteorol. Soc. 2012, 93, 1879–1900. [Google Scholar] [CrossRef]
- Jiang, S.; Zhan, W.; Yang, J.; Liu, Z.; Huang, F.; Lai, J.; Li, J.; Hong, F.; Huang, Y.; Chen, J.; et al. Urban heat island studies based on local climate zones: A systematic overview. Dili Xuebao/Acta Geogr. Sin. 2020, 75, 1860–1878. [Google Scholar] [CrossRef]
- Zhang, H.; Bai, J.; Zhao, J.; Guo, F.; Zhu, P.; Dong, J.; Cai, J. Application and future of local climate zone system in urban climate assessment and planning—Bibliometrics and meta-analysis. Cities 2024, 150, 104999. [Google Scholar] [CrossRef]
- Yan, Z.; Ma, L.; He, W.; Zhou, L.; Lu, H.; Liu, G.; Huang, G. Comparing Object-Based and Pixel-Based Methods for Local Climate Zones Mapping with Multi-Source Data. Remote Sens. 2022, 14, 3744. [Google Scholar] [CrossRef]
- Bechtel, B.; Alexander, P.J.; Beck, C.; Böhner, J.; Brousse, O.; Ching, J.; Demuzere, M.; Fonte, C.; Gál, T.; Hidalgo, J.; et al. Generating WUDAPT Level 0 data—Current status of production and evaluation. Urban Clim. 2019, 27, 24–45. [Google Scholar] [CrossRef]
- Wang, R.; Ren, C.; Xu, Y.; Lau, K.K.-L.; Shi, Y. Mapping the local climate zones of urban areas by GIS-based and WUDAPT methods: A case study of Hong Kong. Urban Clim. 2018, 24, 567–576. [Google Scholar] [CrossRef]
- Gál, T.; Bechtel, B.; Unger, J. Comparison of Two Different Local Climate Zone Mapping Methods. In Proceedings of the ICUC9—9th International Conference on Urban Climate jointly with 12th Symposium on the Urban Environment, Toulouse, France, 20–24 July 2015. [Google Scholar]
- Zhou, X.; Okaze, T.; Ren, C.; Cai, M.; Ishida, Y.; Mochida, A. Mapping local climate zones for a Japanese large city by an extended workflow of WUDAPT Level 0 method. Urban Clim. 2020, 33, 100660. [Google Scholar] [CrossRef]
- Zhou, D.; Xiao, J.; Bonafoni, S.; Berger, C.; Deilami, K.; Zhou, Y.; Frolking, S.; Yao, R.; Qiao, Z.; Sobrino, J.A. Satellite Remote Sensing of Surface Urban Heat Islands: Progress, Challenges, and Perspectives. Remote Sens. 2019, 11, 48. [Google Scholar] [CrossRef]
- Mohammed, A.M.S. The Heat Adaptation Priority Index (HAPI): A practical tool for urban heat risk assessment and mitigation priority. Sustain. Cities Soc. 2025, 126, 106420. [Google Scholar] [CrossRef]
- Ye, J.; Yang, F. Towards multi-scale and context-specific heat health risk assessment—A systematic review. Sustain. Cities Soc. 2025, 119, 106102. [Google Scholar] [CrossRef]
- El-Zein, A.; Tonmoy, F.N. Assessment of vulnerability to climate change using a multi-criteria outranking approach with application to heat stress in Sydney. Ecol. Indic. 2015, 48, 207–217. [Google Scholar] [CrossRef]
- Hua, J.; Zhang, X.; Ren, C.; Shi, Y.; Lee, T.-C. Spatiotemporal assessment of extreme heat risk for high-density cities: A case study of Hong Kong from 2006 to 2016. Sustainable Cities and Society. Sustain. Cities Soc. 2021, 64, 102507. [Google Scholar] [CrossRef]
- Xin, J.; Yang, J.; Jiang, Y.; Shi, Z.; Jin, C.; Xiao, X.; Xia, J.; Yang, R. Variations of Urban Thermal Risk with Local Climate Zones. Int. J. Environ. Res. Public Health 2023, 20, 3283. [Google Scholar] [CrossRef]
- Cai, Z.; Tang, Y.; Chen, K.; Han, G. Assessing the Heat Vulnerability of Different Local Climate Zones in the Old Areas of a Chinese Megacity. Sustainability 2019, 11, 2032. [Google Scholar] [CrossRef]
- Zhang, W.; McManus, P.; Duncan, E. A Raster-Based Subdividing Indicator to Map Urban Heat Vulnerability: A Case Study in Sydney, Australia. Int. J. Environ. Res. Public Health 2018, 15, 2516. [Google Scholar] [CrossRef] [PubMed]
- Wu, X.; Liu, Q.; Liu, G.; Huang, C.; Li, H. Risk Assessment of Heat Waves: A Review. J. Geo-Inf. Sci. 2019, 21, 1029–1039. [Google Scholar] [CrossRef]
- Guo, R.; Guo, F.; Dong, J.; Wang, Z.; Zheng, R.; Zhang, H. Finer-scale urban health risk assessment based on the interaction perspective of thermal radiation, human, activity, and space. Front. Archit. Res. 2024, 13, 682–697. [Google Scholar] [CrossRef]
- Guo, F.; Fan, G.; Zhao, J.; Zhang, H.; Dong, J.; Ma, H.; Li, N. Urban heat health risk inequality and its drivers based on local climate zones: A case study of Qingdao, China. Build. Environ. 2025, 275, 112827. [Google Scholar] [CrossRef]
- Wang, D.; Zhang, Q.; Zhu, X.; Shen, Z.; Fan, K.; Wu, Z. Multisource data evaluation of heat risk in Shanghai. J. Beijing Norm. Univ. (Nat. Sci.) 2021, 57, 613–623. [Google Scholar] [CrossRef]
- Zhang, S.; Lei, J.; Zhang, X.; Tong, Y.; Lu, D.; Fan, L.; Duan, Z. Assessment and optimization of urban spatial resilience from the perspective of life circle: A case study of Urumqi, NW China. Sustain. Cities Soc. 2024, 109, 105527. [Google Scholar] [CrossRef]
- Dong, H.; Wang, L.; Zhang, T.; Tao, W. Phthalate esters in urban multi-media in the arid city of Urumqi, Northwest China: Sources, bio-accessibility and health risks. Urban Clim. 2025, 59, 102291. [Google Scholar] [CrossRef]
- Li, Q.; Wang, W.; Jiang, X.; Lu, D.; Zhang, Y.; Li, J. Optimizing the reuse of reclaimed water in arid urban regions: A case study in Urumqi, Northwest China. Sustain. Cities Soc. 2019, 51, 101702. [Google Scholar] [CrossRef]
- Hini, G.; Eziz, M.; Wang, W.; Ili, A.; Li, X. Spatial distribution, contamination levels, sources, and potential health risk assessment of trace elements in street dusts of Urumqi city, NW China. Hum. Ecol. Risk Assess. 2020, 26, 2112–2128. [Google Scholar] [CrossRef]
- Liu, X.; Zhai, S.; Li, K.; Zhu, L.; Liu, S.; Shah, V.; Tai, A.P.K.; Geng, G.; Hou, X.; Mamtimin, A.; et al. Particulate matter (PM) and ozone air quality in Urumqi of Northwest China: Seasonality, trends, and sources. Atmos. Environ. 2025, 350, 121150. [Google Scholar] [CrossRef]
- Baqa, M.F.; Lu, L.; Guo, H.; Song, X.; Alavipanah, S.K.; Nawaz-ul-Huda, S.; Li, Q.; Chen, F. Investigating heat-related health risks related to local climate zones using SDGSAT-1 high-resolution thermal infrared imagery in an arid megacity. Int. J. Appl. Earth Obs. Geoinf. 2025, 136, 104334. [Google Scholar] [CrossRef]
- Wang, S.; Sun, Q.C.; Huang, X.; Tao, Y.; Dong, C.; Das, S.; Liu, Y. Health-integrated heat risk assessment in Australian cities. Environ. Impact Assess. Rev. 2023, 102, 107176. [Google Scholar] [CrossRef]
- Chen, Q.; Ding, M.; Yang, X.; Hu, K.; Qi, J. Spatially explicit assessment of heat health risk by using multi-sensor remote sensing images and socioeconomic data in Yangtze River Delta, China. Int. J. Health Geogr. 2018, 17, 15. [Google Scholar] [CrossRef] [PubMed]
- Xu, H.; Li, C.; Hu, Y.; Kong, R.; Wang, Q.; Zhou, Y. Long-term temporal and spatial divergence patterns of urban heat risk in the Beijing–Tianjin–Hebei urban agglomeration. Urban Clim. 2024, 56, 102085. [Google Scholar] [CrossRef]
- Yang, M.; Liu, R.; Gou, X.; Li, G.; Xu, Y. Spatial-temporal analysis and risk assessment of heat waves in the Chengdu-Chongqing economic circle. Comput. Tech. Geophys. Geochem. Explor. 2022, 44, 392–402. [Google Scholar] [CrossRef]
- Verdonck, M.-L.; Demuzere, M.; Hooyberghs, H.; Priem, F.; Van Coillie, F. Heat risk assessment for the Brussels capital region under different urban planning and greenhouse gas emission scenarios. J. Environ. Manag. 2019, 249, 109210. [Google Scholar] [CrossRef]
- Rinner, C.; Dianne, P.; Kate, B.; Shiraz, N.; Stephanie, G.; Campbell, M. The Role of Maps in Neighborhood-level Heat Vulnerability Assessment for the City of Toronto. Cartogr. Geogr. Inf. Sci. 2010, 37, 31–44. [Google Scholar] [CrossRef]
- Huang, H.; Ma, J.; Yang, Y. Spatial heterogeneity of driving factors for urban heat health risk in Chongqing, China: A new identification method and proposal of planning response framework. Ecol. Indic. 2023, 153, 110449. [Google Scholar] [CrossRef]
- Kim, J.; Yeom, S.; Hong, T. Analyzing the cooling effect, thermal comfort, and energy consumption of integrated arrangement of high-rise buildings and green spaces on urban heat island. Sustain. Cities Soc. 2025, 119, 106105. [Google Scholar] [CrossRef]
- Savić, S.; Marković, V.; Šećerov, I.; Pavić, D.; Arsenović, D.; Milošević, D.; Dolinaj, D.; Nagy, I.; Pantelić, M. Heat wave risk assessment and mapping in urban areas: Case study for a midsized Central European city, Novi Sad (Serbia). Nat. Hazards 2018, 91, 891–911. [Google Scholar] [CrossRef]
- Akbari, F.A.; Sharifi, A. Examining the suitability of the local climate zones (LCZ) framework in informal urban settlements: Insights from Kabul, Afghanistan. Sustain. Cities Soc. 2024, 114, 105797. [Google Scholar] [CrossRef]
- Bechtel, B.; Demuzere, M.; Mills, G.; Zhan, W.; Sismanidis, P.; Small, C.; Voogt, J. SUHI analysis using Local Climate Zones—A comparison of 50 cities. Urban Clim. 2019, 28, 100451. [Google Scholar] [CrossRef]
- Zhang, X.; Ye, R.; Fu, X. Assessment of Urban Local High-Temperature Disaster Risk and the Spatially Heterogeneous Impacts of Blue-Green Space. Atmosphere 2023, 14, 1652. [Google Scholar] [CrossRef]
- O’Malley, C.; Kikumoto, H. An investigation into heat storage by adopting local climate zones and nocturnal-diurnal urban heat island differences in the Tokyo Prefecture. Sustain. Cities Soc. 2022, 83, 103959. [Google Scholar] [CrossRef]
- Zhang, W.; Zhu, Y.; Jiang, J. Effect of the Urbanization of Wetlands on Microclimate: A Case Study of Xixi Wetland, Hangzhou, China. Sustainability 2016, 8, 885. [Google Scholar] [CrossRef]
- Sharmin, T.; Chappell, A. Detecting the changing impact of urbanisation on urban heat islands in a tropical megacity using local climate zones. Energy Built Environ. 2025. [Google Scholar] [CrossRef]
- Vu, D.H.; Muttaqi, K.M.; Agalgaonkar, A.P. A variance inflation factor and backward elimination based robust regression model for forecasting monthly electricity demand using climatic variables. Appl. Energy 2015, 140, 385–394. [Google Scholar] [CrossRef]
- Prentice, P.; Publishing, H. Advanced Diagnostics for Multiple Regression: A Supplement to Multivariate Data Analysis Multivariate Data Analysis. Available online: https://www.academia.edu/24541751 (accessed on 12 March 2025).
- Lundberg, S.; Erion, G.; Lee, S.-I. Consistent Individualized Feature Attribution for Tree Ensembles. arXiv 2018, arXiv:1802.03888. [Google Scholar] [CrossRef]


| Research Cities | Indicator System | Indicator Selection | Empowerment Methodology |
|---|---|---|---|
| Karachi, Pakistan [53] | HEV | Hazard: LST Exposure: population density Vulnerability: elderly population aged 60 years and over, children aged 10 years and under, illiterate population, building density, slum population, population with access to drinking water, bathrooms, electricity, children with a family size of 9 or more, poor population, normalized difference vegetation index (NDVI) | Principal Component Analysis (PCA) |
| Perth, Australia [54] | HEV | Hazard: LST Exposure: population density Vulnerability: age structure, ethnicity, socio-economic disadvantage, employment, living space, need for assistance, income, availability of internet connection and mobility | Equal Weighting System |
| Birmingham, UK [7] | HEV | Hazard: high resolution urban heat island maps Exposure: detailed commercial data per household Vulnerability: filtered exposure layer | Equal Weighting System |
| Changzhou, China [16] | HEV | Hazard: LST, frequency of high temperatures Exposure: population density, frequency of high temperatures Vulnerability: MNDWI, NDVI, night light data, population density over 65 years old | Entropy Weight Method (EWM) |
| Yangtze River Delta City Cluster, China [55] | HEV | Hazard: surface temperature Exposure: combination of enhanced vegetation index, nighttime lighting Vulnerability: elderly population aged ≥65 years, elderly population aged 60 years or older living alone, illiteracy or semi-illiteracy rate among population aged 15 years or older, total number of beds in health facilities, number of air conditioners per 100 households, GDP per capita | PCA/EWM |
| Hong Kong, China [40] | HEV | Hazard: hours of heat, hours of heat at night Exposure: population density Vulnerability: population aged 65 and over, uneducated population, households living alone, low-income households, renter population, population living in non-residential buildings | PCA |
| Santiago, Chile [15] | HVI | Exposure: LST Sensitivity: population over 60 years old, population with young children under 5 years old, population with disabilities, family structure, level of education, unemployed population Adaptability: population with access to communication technology, population with access to water supply, housing materials, medical facilities, road network density, NDVI | PCA |
| Beijing-Tianjin-Hebei, China [56] | HVI | Hazard: daily surface temperature Exposure: population density Sensitivity: elderly population, child population, female population, nursing homes, kindergartens and primary schools Adaptability: water cover, vegetation cover, night lighting, medical buildings | EWM |
| Turin, Italy [10] | HEVA | Hazard: urban heat island distribution Exposure: the over-65 population Vulnerability: women over the age of 65, population over 85 years old, low education rate, social isolation, housing overcrowding, ethnic minorities coming from poor countries with high migration pressure, presence of ischemic heart disease, presence of cerebral vasculopathies, presence of heart failure, presence of diabetes, residential buildings in poor conditions, building density, population density, distance from watercourses Adaptability: percentage of green area, average number of floors, possibility of conversion to green roofs, proximity to social welfare facilities, proximity to cool places | Equal Weighting System |
| Chengdu-Chongqing City Cluster, China [57] | HEVA | Hazard: frequency of heat waves, maximum body temperature of heat waves, maximum duration of heat waves, total duration of heat waves Exposure: habitat index Vulnerability: time to hospital Adaptability: river network density, gross regional product, number of beds in healthcare facilities, general public budget expenditure, residents’ savings balance | Criteria Importance Though Intercriteria Correlation (CRITIC) |
| Dalian, China [45] | HEVA | Hazard: radiant heat stress intensity Exposure: population density, point of information (POI) density, road network density Vulnerability: child population, elderly population, women’s population, twitter heat Adaptability: year of construction, hot shelter sites, medical sites, GDP | CRITIC |
| Primary Indicators | Secondary Indicators | Meaning of Indicators | Direction | Spatialization Methodology | Data Sources |
|---|---|---|---|---|---|
| Hazard | LST | Characterizing the intensity of surface thermal radiation | + | remote sensing inversion | LANDSAT8 remote sensing imagery |
| Exposure | Population Density | Characterizing anthropogenic heat exposure | + | Arcgis Kernel Density Tool | https://lbsyun.baidu.com. accessed on 1 August 2024. |
| POI Density | Characterizing the clustering effect of urban functions | + | Arcgis Kernel Density Tool | BIGEMAP | |
| Road Network Density | Characterizing the level of transport facilities | + | Arcgis Kernel Density Tool | BIGEMAP | |
| Vulnerability | Child Population | Characterizing the distribution of sensitive populations | + | Arcgis Kernel Density Tool | BIGEMAP |
| Elderly Population | Characterizing the distribution of sensitive populations | + | Arcgis Kernel Density Tool | BIGEMAP | |
| Year of Construction | Characterizing building thermal regulation capacity | - | IDW interpolation | https://wulumuqi.anjuke.com. accessed on 5 August 2024. | |
| Adaptability | Housing Value | Characterizing the ability to regulate living conditions | - | IDW interpolation | https://wulumuqi.anjuke.com. accessed on 5 August 2024. |
| High-temperature Shelter | Characterizing public thermal adaptability resource allocation | - | Arcgis Kernel Density Tool | BIGEMAP | |
| Medical Facilities | Characterizing health security capacity | - | Arcgis Kernel Density Tool | BIGEMAP | |
| GDP | Characterizing the potential for heat adaptability inputs | - | IDW interpolation | https://www.resdc.cn. accessed on 5 August 2024. |
| Primary Indicators | Primary Indicators Weights | Secondary Indicators | Secondary Indicators Weights |
|---|---|---|---|
| Hazard | 0.367 | LST | 1.000 |
| Exposure | 0.195 | Population Density | 0.317 |
| POI Density | 0.419 | ||
| Road Network Density | 0.264 | ||
| Vulnerability | 0.207 | Child Population | 0.253 |
| Elderly Population | 0.240 | ||
| Year of Construction | 0.507 | ||
| Adaptability | 0.231 | Housing Value | 0.332 |
| High-temperature Shelter | 0.206 | ||
| Medical Facilities | 0.202 | ||
| GDP | 0.260 |
| Research Cities | Köppen–Geiger Climate Classification | Risk Indicators | Highest Heat Risk Built-Up Type LCZ | Lowest Heat Risk Built-Up Type LCZ |
|---|---|---|---|---|
| Urumqi, China (this study) | BSk | HEVA | LCZ 2 | LCZ 9 |
| Karachi, Pakistan [53] | BWh | HEV | LCZ 3 | LCZ 8 |
| Kabul, Afghanistan [63] | BSk | LST SUHI | LCZ 8 LCZ 8 | LCZ 2 LCZ 35 |
| Phoenix, AZ, USA [20] | BWh | LST | LCZ 8 | LCZ 4 |
| Las Vegas, NV, USA [20] | BWh | LST | LCZ 8 | LCZ 4 |
| 50 cities in the world [64] | / | SUHI | LCZ 2 | LCZ 9 |
| Cardiff, UK [8] | Cfb | LST SUHI | LCZ 3 LCZ 8 | LCZ 9 LCZ 9 |
| Changzhou, China [16] | Cfa | HEV | LCZ 1 | LCZ 9 |
| Harbin, China [65] | Dwb | HEV | LCZ 2 | LCZ 9A |
| Research Cities | Köppen–Geiger Climate Classification | Risk Indicators | Highest Heat Risk Land-Cover Type LCZs | Lowest Heat Risk Land-Cover Type LCZs |
|---|---|---|---|---|
| Urumqi, China (this study) | BSk | HEVA | LCZ E | LCZ G |
| Karachi, Pakistan [53] | BWh | HEV | LCZ E | LCZ G |
| Kabul, Afghanistan [63] | BSk | LST SUHI | LCZ F LCZ F | LCZ B LCZ B |
| Phoenix, AZ, USA [20] | BWh | LST | LCZ E | LCZ G |
| Las Vegas, NV, USA [20] | BWh | LST | LCZ F | LCZ G |
| 50 cities in the world [64] | / | SUHI | LCZ F | LCZ D |
| Cardiff, UK [8] | Cfb | LST SUHI | LCZ F LCZ F | LCZ A LCZ A |
| Changzhou, China [16] | Cfa | HEV | LCZ E | LCZ G |
| Harbin, China [65] | Dwb | HEV | LCZ E | LCZ G |
| Model | Unstandardized Coefficients | Standardized Coefficients | t | Sig. | Collinearity Statistics | ||
|---|---|---|---|---|---|---|---|
| B | Std. Error | Beta | Tolerance | VIF | |||
| (Constant) | 34,531,757.206 | 151,893.600 | 227.342 | 0.000 | |||
| LST | 15,783.415 | 72.598 | 0.154 | 217.409 | 0.000 | 0.994 | 1.006 |
| Population Density | 2794.473 | 89.165 | 0.038 | 31.341 | 0.000 | 0.335 | 2.983 |
| Year of Construction | −17,188.481 | 75.457 | −0.187 | −227.793 | 0.000 | 0.739 | 1.353 |
| Housing Value | 39.129 | 0.218 | 0.149 | 179.252 | 0.000 | 0.727 | 1.375 |
| High Temperature Shelter | −270.473 | 17.490 | −0.026 | −15.465 | 0.000 | 0.171 | 5.840 |
| Medical Facilities | 8590.258 | 343.350 | 0.047 | 25.019 | 0.000 | 0.140 | 7.138 |
| GDP | −0.184 | 0.023 | −0.007 | −8.099 | 0.000 | 0.665 | 1.503 |
Disclaimer/Publisher’s Note: The statements, opinions and data contained in all publications are solely those of the individual author(s) and contributor(s) and not of MDPI and/or the editor(s). MDPI and/or the editor(s) disclaim responsibility for any injury to people or property resulting from any ideas, methods, instructions or products referred to in the content. |
© 2025 by the authors. Licensee MDPI, Basel, Switzerland. This article is an open access article distributed under the terms and conditions of the Creative Commons Attribution (CC BY) license (https://creativecommons.org/licenses/by/4.0/).
Share and Cite
Lan, H.; Zhang, H.; Gao, J.; Bai, J.; Wang, H.; Lu, C.; Geng, H. Heat Risk Assessment in Arid Zones Based on Local Climate Zones: A Case of Urumqi, China. Buildings 2025, 15, 1672. https://doi.org/10.3390/buildings15101672
Lan H, Zhang H, Gao J, Bai J, Wang H, Lu C, Geng H. Heat Risk Assessment in Arid Zones Based on Local Climate Zones: A Case of Urumqi, China. Buildings. 2025; 15(10):1672. https://doi.org/10.3390/buildings15101672
Chicago/Turabian StyleLan, Hongxuan, Hongchi Zhang, Jialu Gao, Jin Bai, Hanxuan Wang, Cheng Lu, and Haoxuan Geng. 2025. "Heat Risk Assessment in Arid Zones Based on Local Climate Zones: A Case of Urumqi, China" Buildings 15, no. 10: 1672. https://doi.org/10.3390/buildings15101672
APA StyleLan, H., Zhang, H., Gao, J., Bai, J., Wang, H., Lu, C., & Geng, H. (2025). Heat Risk Assessment in Arid Zones Based on Local Climate Zones: A Case of Urumqi, China. Buildings, 15(10), 1672. https://doi.org/10.3390/buildings15101672