Article

Environmental Impacts of Road Traffic and Route Variants: An Accurate Way to Support Decision-Making Processes of Mountain Roads and Tunnels in Austria †

Unit of Construction Management and Tunnelling, University of Innsbruck, 6020 Innsbruck, Austria
*
Author to whom correspondence should be addressed.
This article is an extended version of our conference paper Hausberger, L.; Flora, M.; Gschösser, F. Environmental Impacts of Road Traffic and Route Variants: An Accurate Way to Support Decision-Making Processes of Mountain Roads and Tunnels in Austria, which was published in the Proceedings of the 2nd International Conference on Construction Engineering and Management (iCCPMCE-2024), Sydney, Australia, 20–22 November 2024.
Buildings 2025, 15(10), 1669; https://doi.org/10.3390/buildings15101669
Submission received: 31 March 2025 / Revised: 5 May 2025 / Accepted: 13 May 2025 / Published: 15 May 2025

Abstract

Traffic contributes nearly 25% of global greenhouse gas emissions. For designing new traffic routes and decision-making processes, it is essential to incorporate integral life cycle assessments (LCAs) to ensure sustainable solutions and to achieve the UN Sustainable Development Goals (SDGs). This study compares two fictitious routes: a typical Austrian mountain pass road (Route A) with a 3% gradient and a new route (Route B) featuring a 1000 m tunnel, reducing distance and inclines. The LCA analyzes Route B’s lifecycle, from material supply to 100-year tunnel usage, comparing it against a traffic LCA of Route A’s operational emissions. The tunnel assessment considers the New Austrian Tunneling Method, local materials, and typical geology. Traffic effects are analyzed using Austrian vehicle stock data, following EN 17472 and EN 15804 standards. The results, based on Global Warming Potential, indicate that Route B’s construction, maintenance, and utilization generate lower environmental impacts than Route A’s traffic emissions. The tunnel offers overall environmental savings, with its construction and maintenance impacts offset within approximately 10 years. Traffic usage is identified as the primary long-term emission source. This research highlights the significance of integral LCAs in creating a sustainable built environment and supporting a decision-making process in transport infrastructure construction.

1. Introduction

Modern life and economic activity depend heavily on the movement of people and goods [1]. Transport infrastructure, including roads and railways, is crucial for connecting communities and facilitating access to basic needs such as housing, employment, education and leisure [1,2,3]. The quality and efficiency of these networks directly influence regional economic performance and public perception of transport corridors [2].
Evolving transport infrastructure must meet changing temporal, spatial, and modal demands [1]. Balancing the diverse perspectives of clients, contractors, residents, engineers, and politicians requires careful consideration of numerous factors. These include environmental impact, community well-being, route optimization, timeframe, costs, technical feasibility, and potential risks in order to develop the best possible transport corridors [1,2]. Designing new traffic routes is, therefore, a really complex process that poses significant challenges to all involved parties [1]. Traffic experts have to analyze the traffic situations and the number of journeys on the specific route and predict possible traffic growth in the future [2]. Civil engineers deal with designing the path through the natural habitat by considering the construction of roads, bridges, and tunnels as needed [2]. Above all, building a new traffic route is a big political and social issue [1,2]. Policymakers, as well as the general public, are highly involved [1]. Various aspects, such as costs, regional behavior, overall benefits, and social issues, affect the decision-making process when planning a new traffic route [2]. However, are environmental aspects such as LCAs or the environmental footprint sufficiently considered in early project phases?
As previous studies [4,5,6,7] have shown, the process of designing a new transport route is essential, especially in terms of the environmental footprint or environmental impact of the transport infrastructure. It is not the planning process itself that causes emissions, but rather the decisions made affect the amount of the environmental impact [7]. Route selection is the most influential factor in sustainable infrastructure development [4,5]. Situating the traffic route in the natural habitat essentially dictates the designing processes, the construction, the materials used, and ultimately the resulting, e.g., CO2 emissions [4,5,6,7]. Sustainable outcomes are most effectively influenced in early project phases, particularly during transport network design, where preliminary investigations are given a new important role and significance in terms of sustainable thinking [6].
To ensure sustainable transport infrastructures, corridor-level scenario studies are required in the early project phases [4,5]. A comprehensive and sustainable route comparison includes two main investigations per route: First, a structural sustainability assessment in compliance with EN 17472 [8] spanning ideally the entire lifecycle—from construction (A1–A5) and maintenance (B2) to demolition and disposal (C1–C4) [5]. Second, a detailed analysis of the traffic utilization (user’s utilization—B8) in accordance with EN 17472 [8], considering not just the distance but also the elevation gain [5,9,10]. This traffic analysis incorporates fuel consumption, vehicle emissions standards, vehicle technology, and the projected traffic flows over the assumed infrastructure’s service life [9,10]. Combining structural and traffic assessments enables a comprehensive, integral LCA for each route [9]. Therefore, comparing two new route options requires four separate LCAs (two structural LCAs and two traffic LCAs).
This study [11] seeks to illustrate the need to include integral life cycle assessments (LCA) more in the early stages of decisions and demonstrates the procedure using the following example. Therefore, an LCA study [11] of a new typical fictitious Austrian road variant with a tunnel (Route B) is carried out and is compared with the traffic emission of an existing fictitious mountain pass road (Route A). This study aims to identify the more environmentally favorable option based on the Global Warming Potential (GWP) impact indicator and to assess the overall environmental savings in the long term.

2. The Investigated Route Variants

2.1. General

To assess and compare the environmental impacts, two fictitious routes were investigated. An existing mountain road (Route A) and a new variant with a tunnel (Route B) are compared. Both routes represent typical Austrian conditions and are modeled in accordance with the Austrian standards and collaboration with field experts (e.g., tunneling experts).
In this case study, it is assumed that the roads connect two villages. Villages A and B are geographically separated from each other by a mountain range. In the existing situation, the traffic connection is realized by a small pass road (Route A) with one lane in each direction. To improve the general traffic situation and shorten travel times, a new option with a tunnel (Route B) is being discussed. Below, the two routes and the traffic flows are specified in detail.

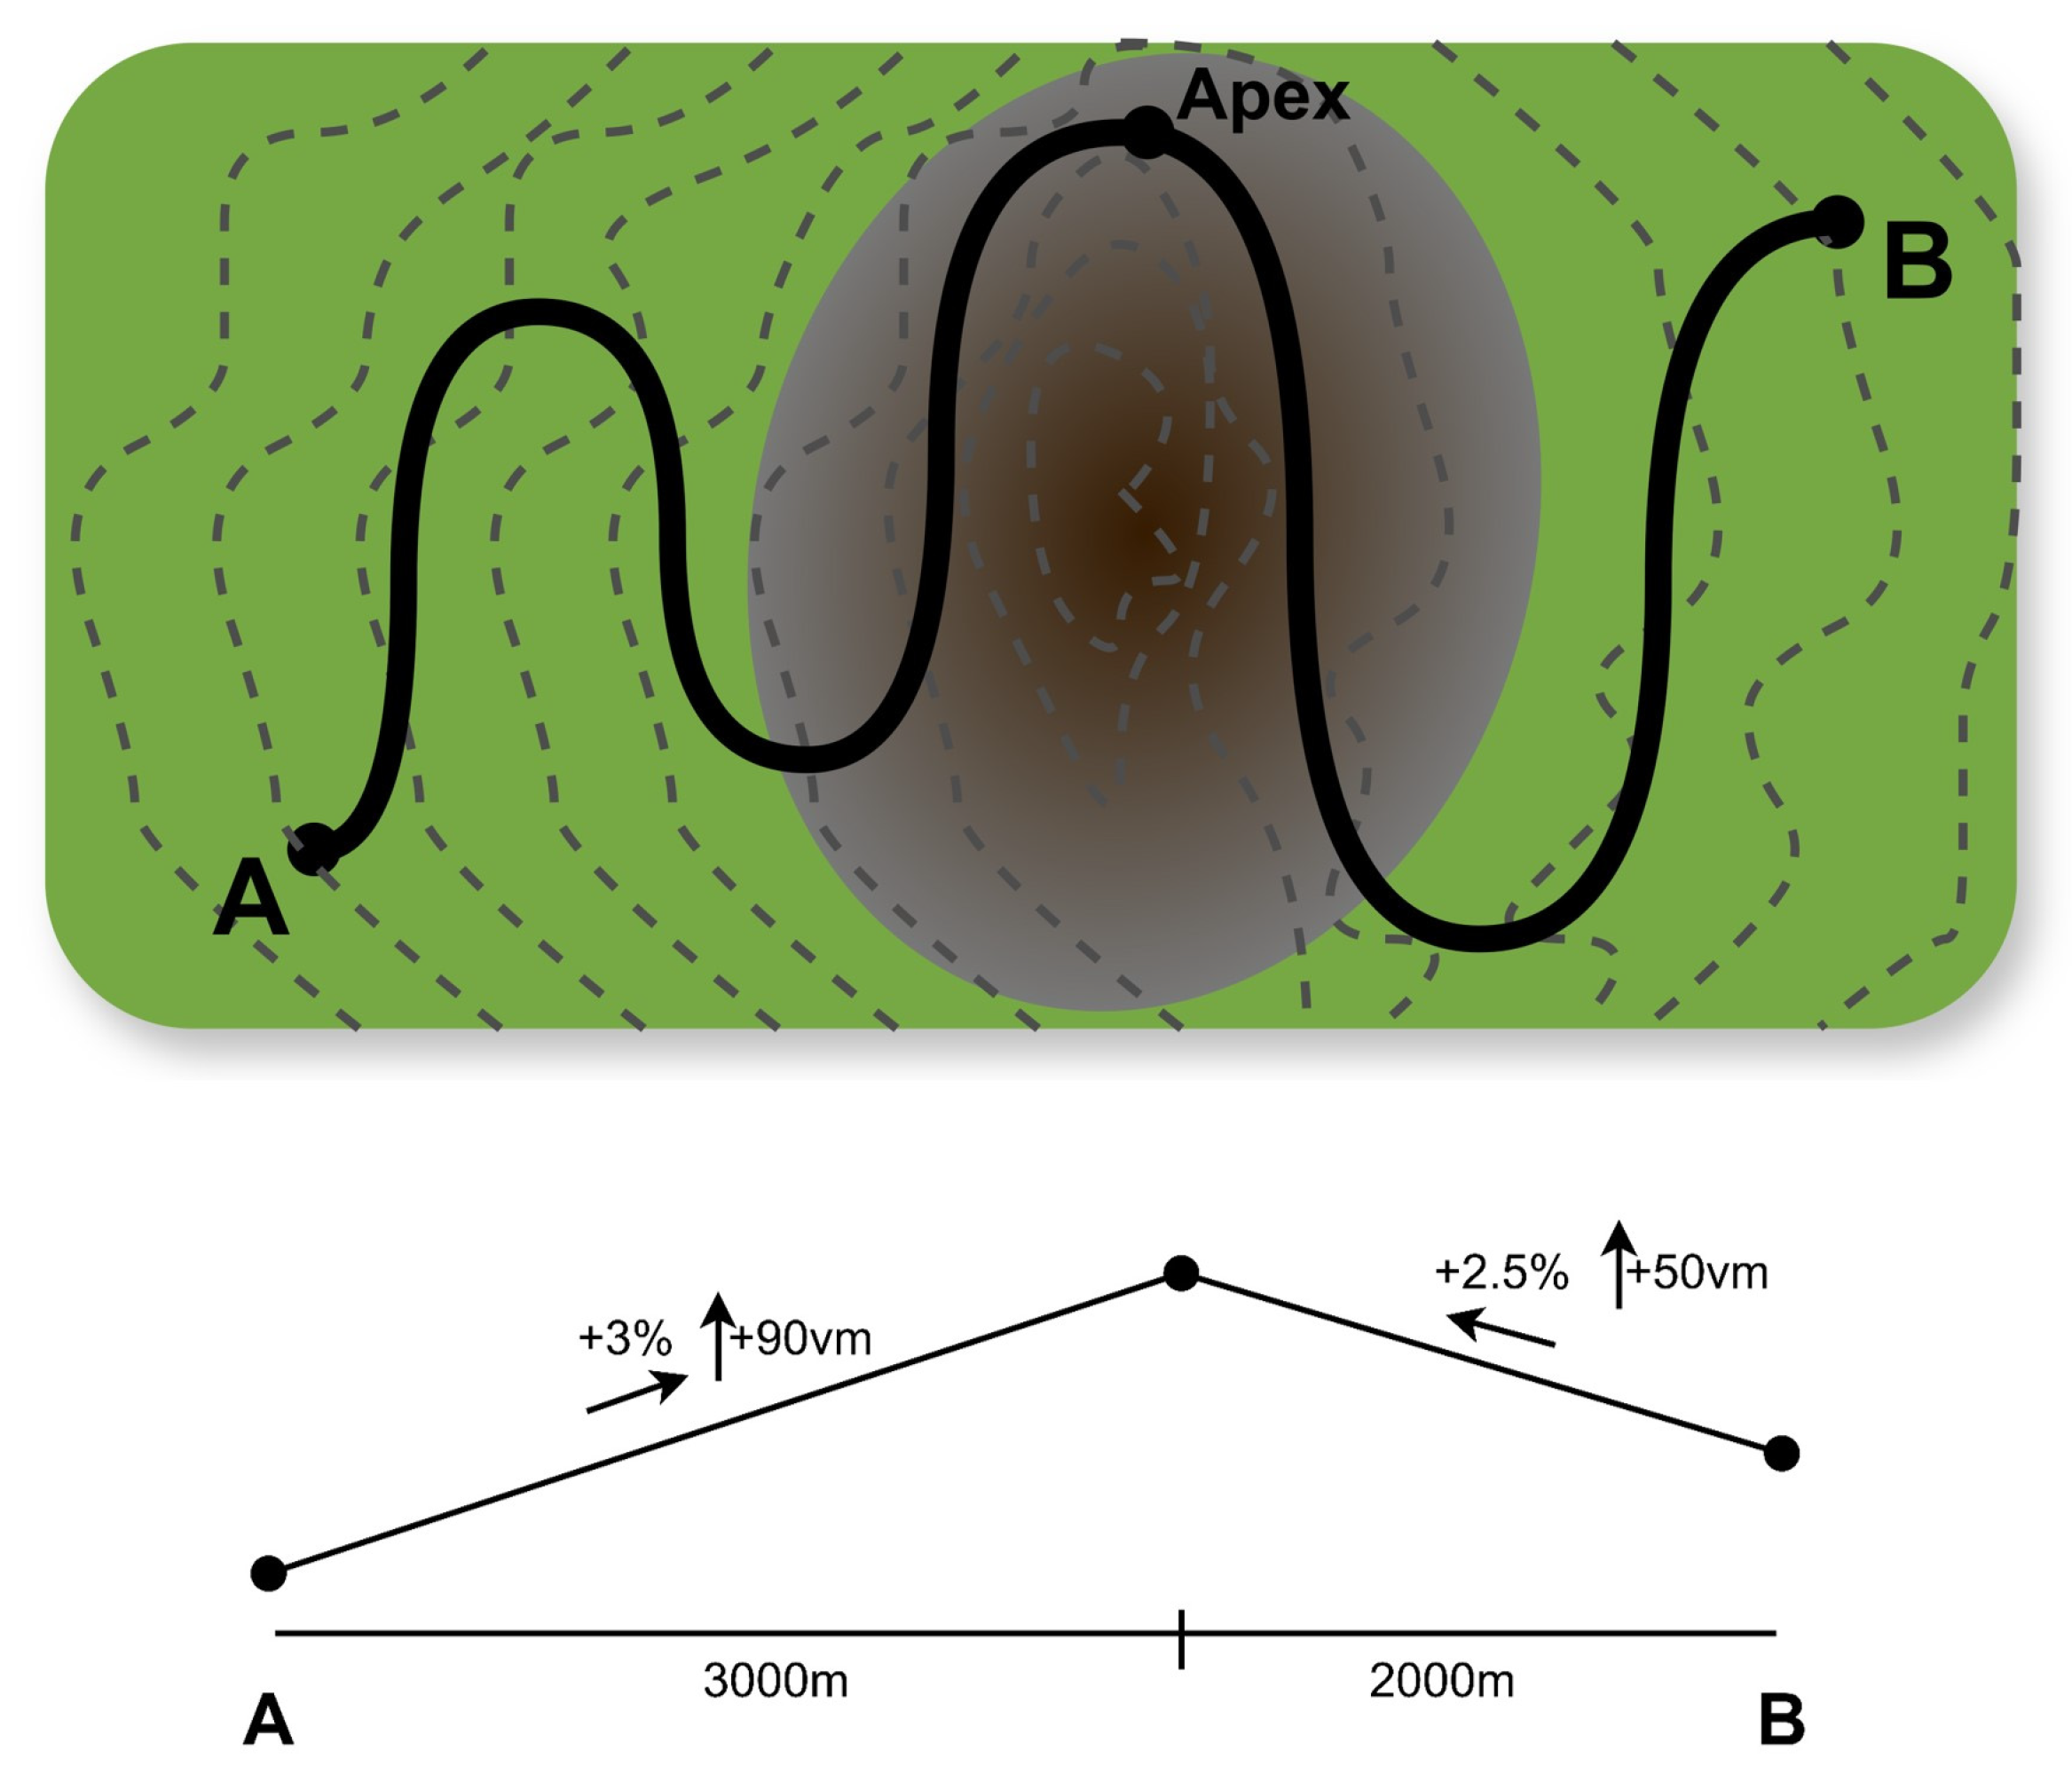
2.2. Route A—Mountain Pass Road
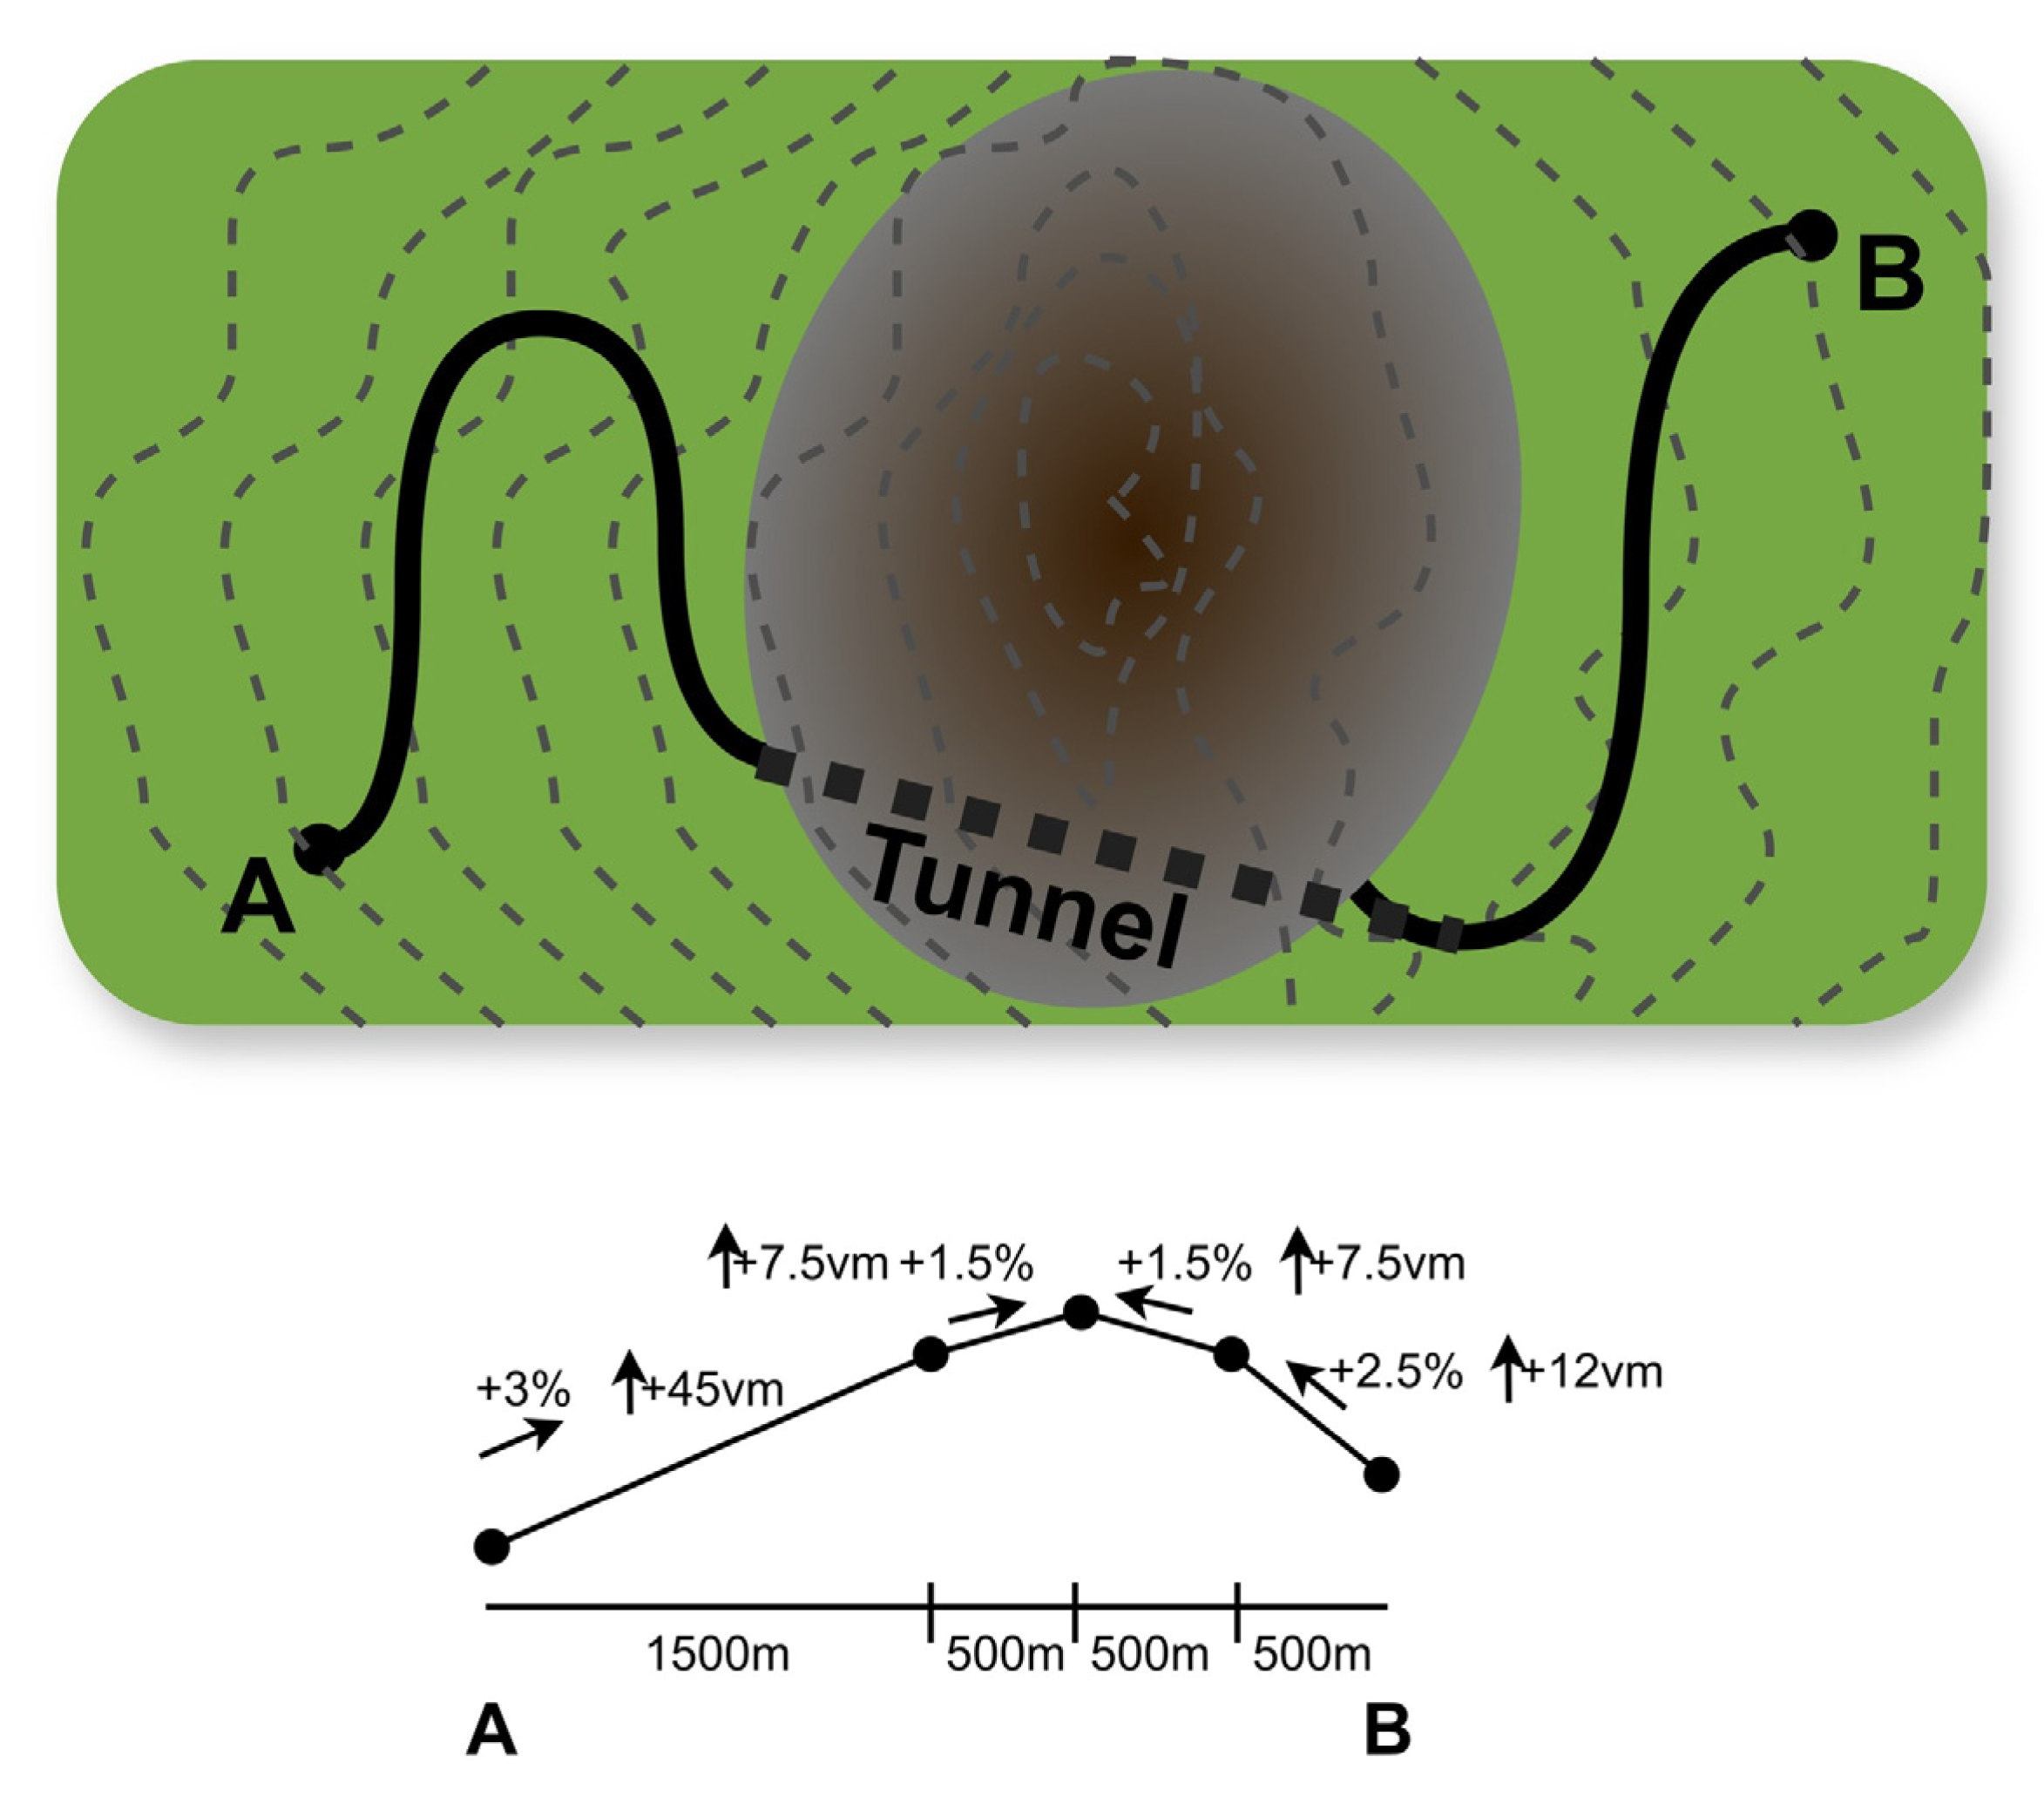
Route A represents a typical small Austrian mountain pass road with a total length of 5000 m and one lane in each direction. The examined road has two main sections (see Figure 1). Section one has a length of 3000 m and a gradient of 3%, while section two’s length is 2000 m with a 2.5% incline. Depending on the direction of travel, the elevation difference is 50 or 90 vertical meters (vm).
To consider the traffic influences in this fictitious analysis, the traffic loads per day were assumed to depend on the direction of travel (see Table 1). The estimated traffic load in Table 1 represents the average load on a small Austrian mountain pass road.
To simplify the traffic investigation, the number of vehicles was categorized into car-like vehicles (car equivalents) and truck-like vehicles (truck equivalents). The main direction of travel is assumed to be from location A to B.

2.3. Route B—Tunnel

The tunnel variant is about to shorten the general distance between the two fictitious locations, as well as to minimize the uphill and downhill driving. Therefore, Route B has a total length of 3000 m, including a 1000 m tunnel (see Figure 2). Route B retains the same lane configuration as Route A.
The vertical meters are reduced to 20 or 52.5 vm. The sections before and after the tunnel show the same inclines and declines from Route A: Section 1 with 3% and 1500 m and Section 2 with 2.5% and 500 m. The gradients in the tunnel are assumed to be ±1.5% because of a symmetrical and longitudinal roof section.
Regarding the traffic use of the new road variant, an increase of +20% in vehicles per day and direction of travel is expected (see Table 2), as it is anticipated that the traffic corridor will become more attractive.

3. Materials and Methods

3.1. The Life Cycle Assessments (LCAs)

This study [11] evaluates the environmental impacts of two route options by means of life cycle assessments (LCAs). The analysis encompasses three LCAs: one for Route A’s traffic and two for Route B—one for tunnel construction, maintenance, and operation, and another for its traffic emissions. The final result focuses on the evaluation of the environmental amortization period of the environmental impacts resulting from the construction of the shorter tunnel route.
The quantifications and calculations are performed by using the software SimaPro (version 9.6.0.1) and Excel to conduct an analysis in accordance with ISO 14040 [12], EN 17472 [8], and EN 15804 [13].
Because the scope of this article is to focus and illustrate a methodological approach for an LCA-based route evaluation, only the widely recognized environmental impact indicator, Global Warming Potential (GWP), with the unit kg CO2 eq, is utilized in this study. The following sections outline the methodological approach in detail.

3.1.1. Functional Unit

The functional unit [8,13,14] of this study is defined as the built tunnel, as well as the operational traffic use for a common period of 100 years [15,16,17].

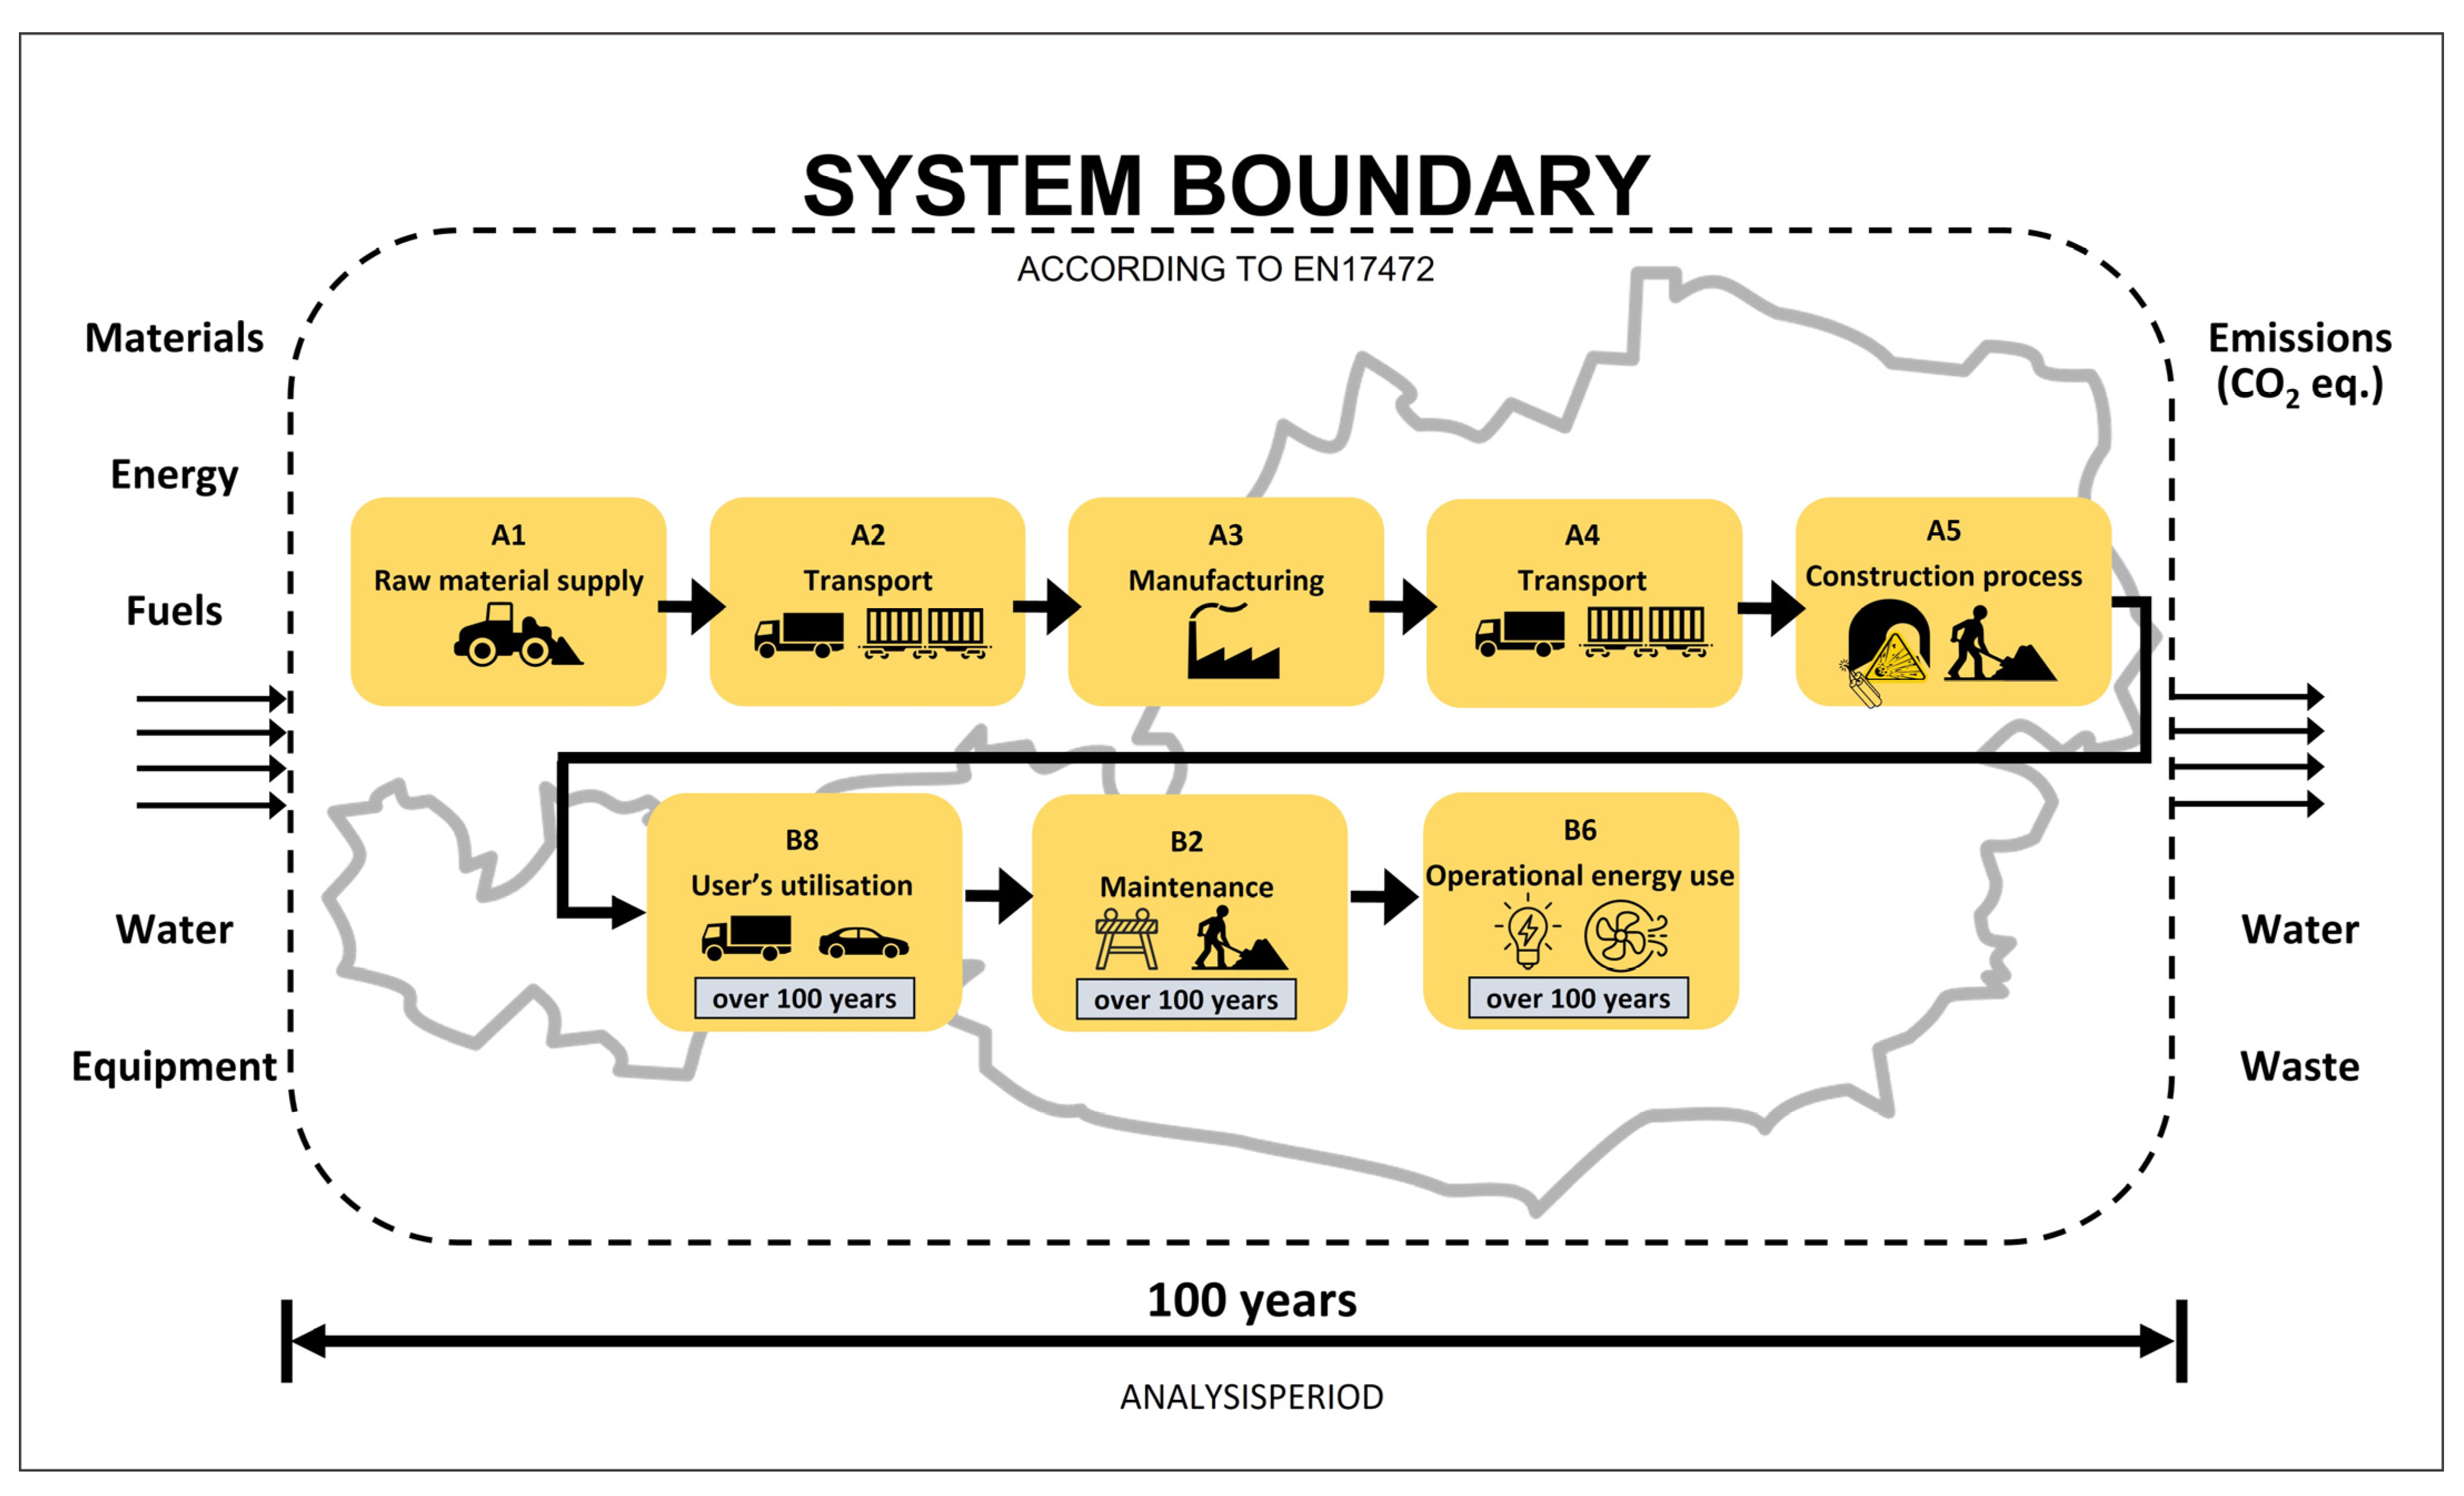
3.1.2. System Boundaries

Both variants examine the traffic process for the target pursuit. Route B additionally considers the construction of the new tunnel, its use (lighting and ventilation), and maintenance. System boundaries are always defined in an LCA to ensure differentiation and comparability [8,12,14,18]. In this case, only input and output flows that differ from each other and are relevant to the analysis are considered.
For Route A, the focus is purely on traffic usage over the above-mentioned 100-year lifespan. For the tunnel option, the entire construction phase, use, and maintenance are included in addition to the traffic (see Figure 3). With regard to maintenance, it must be mentioned that only processes that affect the tunnel are examined. For the sake of simplicity, it is assumed that the road pavement of the mountain pass road and the tunnel will be renewed in a similar cycle during the analysis period. The effect of this is assumed to be negligible for the route comparison. It is also assumed that neither transport route will be dismantled after 100 years. The disposal of the tunnel and the demolition/deconstruction of the mountain pass road are therefore not considered.
Furthermore, no scenarios that go beyond an average expected scope are integrated into the analysis. This means, for example, any damage caused by natural hazards, traffic accidents, or long road closures are not incorporated.
Applied data are mainly sourced from Austrian material suppliers, field experts, or eco-databases such as the ecoinvent database v3.10 [19] or ökobaudat [20]. So, the Austrian territory is selected as the geographical system boundary for the LCA [8].
Current technological standards are incorporated into the analysis. Future technological developments are disregarded, as this study’s focus is on demonstrating the methodological approach.

3.2. The Tunnel LCA

The LCA of the tunnel includes all processes from the raw material supply (A1–A3), transport to the construction site (A4), the construction (A5), the maintenance (B2) to the operation (B6—operational energy usage) over an analysis period of 100 years [8].
For the excavation and construction process, the New Austrian Tunneling Method (NATM) is applied [21]. For the modeling purposes, background data and expertise from Austrian (tunneling-)professionals are utilized. Typical energy consumptions, performance approaches, geological conditions, required construction and supporting materials, construction equipment, transport processes, etc., were modeled by representing a typical Austrian situation.
In designing the new tunnel, a common excavation line is used. The excavation area measures 110 m2. The final clearance complies with all Austrian regulations in accordance with RVS 09.01.22 [22] and allows bigger traffic loads on Route B in the future.
In collaboration with the tunneling experts, three tunnel classes were considered. These classes represent typical geological ratios from moderately to difficult excavatable geology (hard rock). The investigated tunnel is assumed to have 75% hard rock and 25% moderate geological conditions, but the whole excavation process is performed by blasting. The amount of the supporting materials (shotcrete, anchors, reinforcement steel, etc.), the explosives, the required energy for the construction machinery, and the specific length of advance are, therefore, correlated to the prevailing geological conditions. A construction cost calculation approach, adhering to NATM [21] principles and ÖNORM B 2203-1 [23], was used in the analysis. To accurately reflect the tunneling process, cross-sections were divided into crown, bench, and invert, enabling the determination of supporting materials, energy, and costs. Based on these calculations, material quantities for the 1000 m tunnel were determined (see Table 3).
The LCA utilized mainly specific eco-data and EPDs, because the used materials are primarily from Austrian material suppliers. These utilized eco-data are briefly described below.

3.2.1. Concrete and Cementitious Products

A wide variety of concrete products and cementitious products are used in tunnel construction. The concrete products were developed in a previous LCA study on the basis of an investigation carried out in cooperation with the Austrian Association of Ready-Mixed Concrete and reflect Austrian conditions [24]. In the present study, particular emphasis is placed on different eco-data for shotcrete, the inner concrete lining (vault), and the invert.
The following approach was used to account for additional cementitious materials applied during tunnel support work, such as anchor grout and cement injections. The anchor grout was represented using the “cement mortar” dataset from the ökobaudat database [20]. The environmental dataset for the cement injection was created from a specific analysis and a product data sheet provided by TPH Bausysteme GmbH (Norderstedt, Germany) [25].

3.2.2. Steel Products

For steel components, three main product categories can be distinguished: reinforcing steel for the shotcrete lining, steel arches used in certain cases for stabilization, and steel anchors for rock reinforcement.
The steel arches were considered in the LCA based on the EPD for structural steel from “bauforumstahl e.V.” (Düsseldorf, Germany) [26]. Eco-data for the reinforcing steel were sourced from the EPD of Stahl- und Walzwerk Marienhütte GmbH (Graz, Austria) [27]. The anchor steel was incorporated using a Norwegian EPD from Pretec Norge AS (Borgenhaugen, Norway) [28].

3.2.3. Bituminous Products

Data for asphalt pavement were sourced from the ökobaudat database [20], distinguishing between the base course, binder course, and wearing course.
For road drainage, datasets for slotted drains and the required drainage pipes were utilized from ökobaudat [20].

3.2.4. Transport

For this study [11], it was assumed that all freight transport was conducted using trucks. Accordingly, the EURO 6 diesel truck, commonly used in Austria [29,30,31], was selected for the LCA in anticipation of Section 3.3. Environmental data are sourced from the ecoinvent v3.10 database [19].
The dataset used covers the entire life cycle of the vehicle, including transport operations (full outward journey and empty return journey), manufacturing, operation, maintenance, and end-of-life disposal [19]. Fuel consumption is based on average values for European transport routes and specific technical standards [19].
Table 4 below presents the transport distances used in this study. These distances refer to the transportation of materials, goods, and equipment, with the distances representing the route from the production site (manufacturing plant—factory gate) to the construction site.
According to EN 17472 [8], the transport processes associated with the construction of the tunnel (e.g., the delivery and removal of construction equipment) are assigned to the life cycle phase A5. In the context of this study [11], the transportation distances of the construction equipment or the distances to be allocated to the construction (e.g., mucking out) were considered in life cycle phase A5 [8].

3.2.5. Construction

The construction and excavation processes are defined by the use of various machinery and equipment, such as three-arm drill rigs, wheel loaders, tunnel transporters, trucks, and fans. During the construction phase (life cycle phase A5 [8]), equipment sizes, performance parameters, as well as the associated consumption of diesel, lubricants, electricity, and other resources for tunnel construction were accounted for by using representative Austrian data and methodologies. All energy sources were incorporated into the life cycle assessment. Diesel fuel for the construction equipment was sourced from the ecoinvent v3.10 dataset “Diesel, burned in building machine {GLO}|Cut-off, Unit” [19], which also includes the proportionate impact of equipment manufacturing. Lubricant consumption was calculated separately and integrated via the ecoinvent dataset “Lubricating oil {RER}|market for lubricating oil|Cut-off, U” [19].
The climate impact of the electricity consumption was calculated based on the Austrian electricity mix (average values from the Austrian E-Control) and average distribution and transformation efforts. Electricity usage during the construction and tunneling phases primarily supports equipment and installations, such as lighting, fans, and drill rigs.
Process materials, including explosives, water, and drill steel wear, were accounted for through the ecoinvent database. The rebound shotcrete resulting from the supporting activities is disposed of. The disposed concrete is taken into account using the ecoinvent dataset “Waste concrete {CH}|market for waste concrete|Cut-off, U” [19].
Excavated rock material is transported using tire-bound vehicles and deposited near the construction site. For simplicity, it is assumed that the excavated material is uncontaminated and free of construction chemicals, foreign substances, or geogenic pollutants [32]. The aim of this study is to draw a general comparison between traffic use and the construction and operation of a tunnel. It also presents a possible methodological approach. Therefore, a detailed consideration of strict regulations regarding the handling of contaminated tunnel excavation material is not included in this fictitious study. In this course, the disposal of the tunnel excavation material is covered by the ecoinvent dataset “Inert waste, for final disposal {CH}|treatment of inert waste, inert material landfill” [19].
The formwork used for constructing the tunnel lining and the finishing equipment for post-construction treatment were considered in the analysis based on data from tunnel experts and the master’s thesis “Treibhausgas-Bilanz von Tunnelinnenschalen” [33].
Background data [34] on fuel and energy consumption for asphalt paving (including pavers, rollers, etc.) were used to incorporate road construction into the LCA. These available data [34] distinguish between the production of the wearing course, binder course, base course, and unbound base layer.

3.2.6. Tunnel Operation

For tunnel operation, the average energy consumption values were assumed for ventilation, lighting, and safety systems. The estimated energy demand was calculated over the specified 100-year assessment period. As previously noted, environmental data are derived from a separate life cycle assessment. The electricity mix applied reflects the current Austrian energy market composition.

3.2.7. Tunnel Maintenance

To simplify and in conformity with the experts’ recommendations and previous studies [34] several maintenance processes for the final tunnel were considered by applying a 5% surcharge to all construction processes.

3.3. The Traffic LCAs

Performing the traffic LCAs, the initial step is to study the longitudinal gradients of the traffic route. The longitudinal inclines and declines are decisive for the additional energy consumption of the vehicles and are ultimately responsible for the higher emission outputs [5,9,10,34]. Based on the longitudinal profiles of the two routes, the additional consumption from uphill and downhill driving is determined. To simplify matters, car equivalents and truck equivalents are used. The basis for these data is a traffic survey and LCA for cars in Austria [9]. For this purpose, the weighted composition of the various cars is taken into account on the basis of different drive systems, emission classes, masses, and vehicle ages [9].
Due to its widespread use in Austria [29,30,31], the EURO 6 diesel truck from the ecoinvent database v3.10 [19] is employed as the representative vehicle for truck equivalents in this study. This selection ensures consistency with fleet compositions and aligns with contemporary emission standards. The EURO 6 regulation, which imposes stringent limits on nitrogen oxides (NOx) and particulate matter (PM), has led to significant reductions in pollutant emissions compared with previous generations of diesel trucks [35]. Furthermore, the use of ecoinvent data [19] facilitates a comprehensive life cycle assessment by enabling a more accurate evaluation of environmental impacts.
Based on the familiar emissions and fuel consumption from driving in the plain, the additional consumptions associated with traveling uphill are calculated for each route section by using the approach from Liebl et al. [10]. The additional fuel consumption values are quantified by performing an LCA and are added to the emissions from driving in flat terrain afterward.
It is important to note that the calculated additional consumption is in correlation with the longitudinal gradient [9]. Theoretically, the fuel consumption from driving uphill should be compensated through potential energy when traveling downhill. However, in practice it turned out that the uphill journey is only partially compensated because of braking maneuvers [9,36]. In the case of cars, the uphill drive is compensated by 50% and for trucks by 10% [34].
The following equation from Liebl et al. [10] was used to calculate the additional consumption:
Fuel height L   or   kWh 100   km = vehicle   mass   kg · height   difference   m · 9.81 m s 2 · 1 1000   ×   3600 · ν Pe · 100 distance   km · 1 0.98 ν Pe L kWh   or   kWh consumption   efficiency ;   ν Pe , petrol = 0.264 ,   ν Pe , diesel = 0.220 ,   ν Pe , gas = 0.205 ,   ν Pe , electr . = 1
With the driving emissions from flat terrain and gradients, the route profiles, and the defined traffic flows per direction and day (see Table 1 and Table 2), the environmental footprints of the two traffic variants (with and without the tunnel) were analyzed.

4. Results

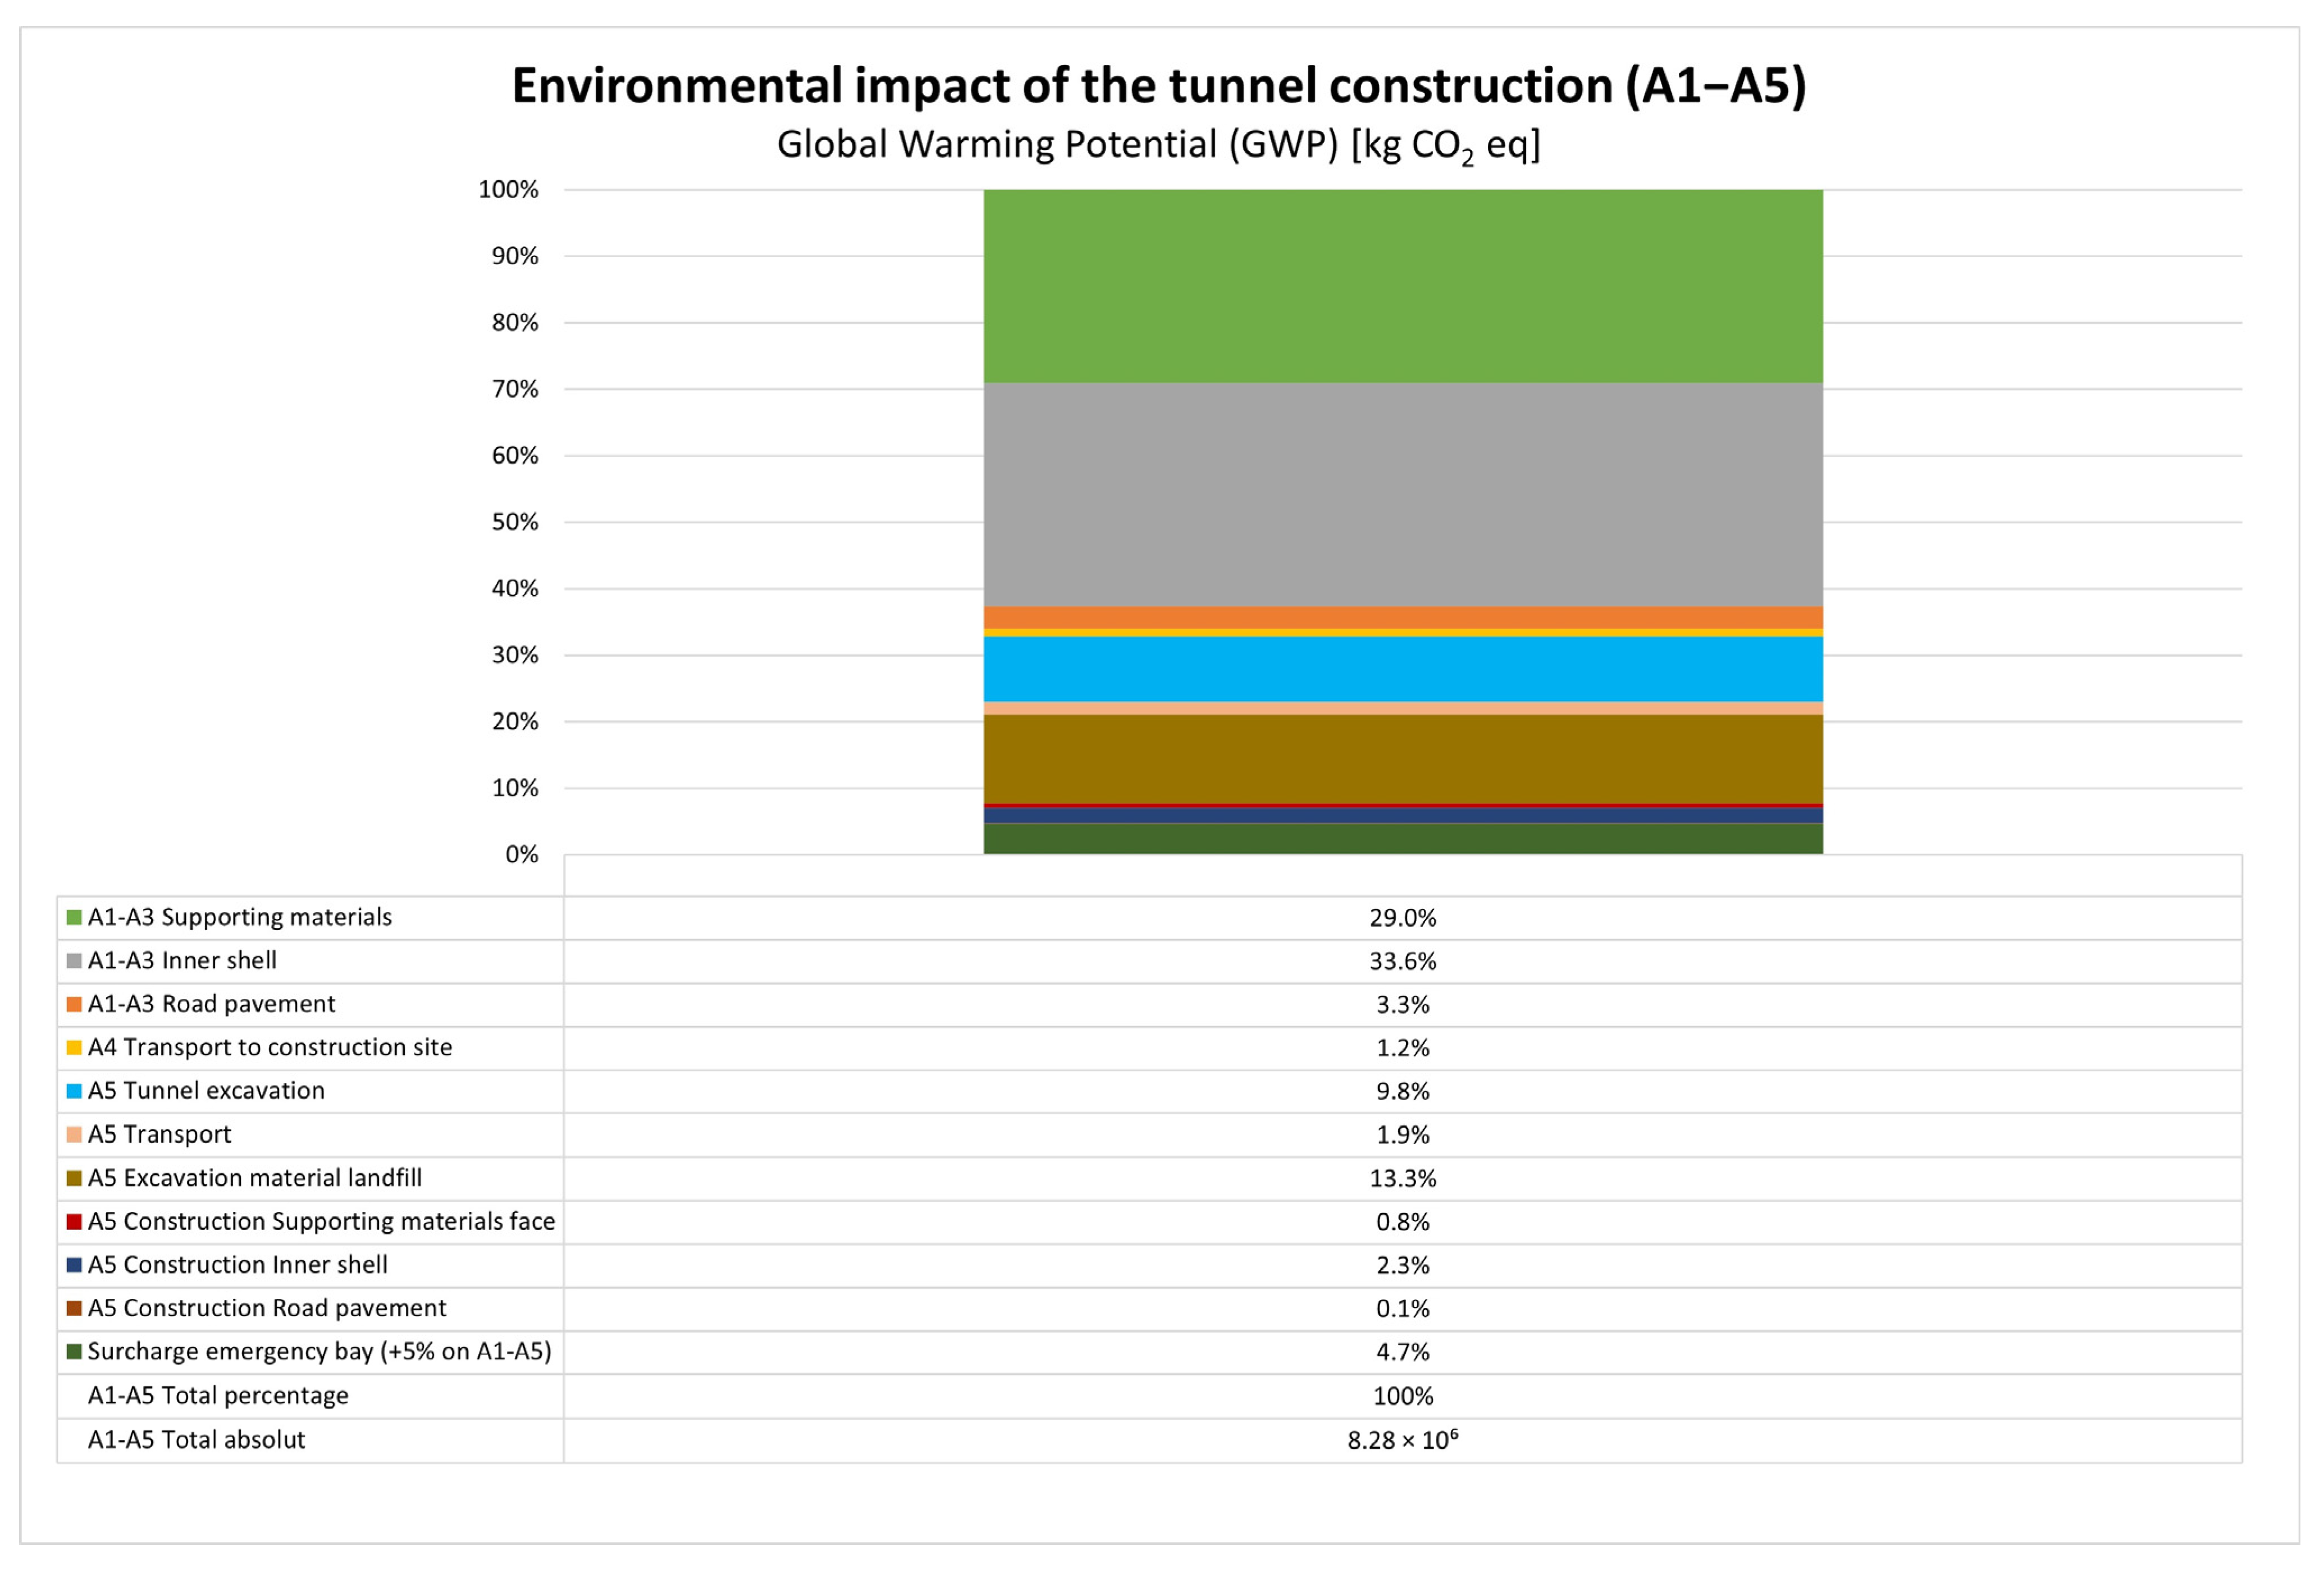
4.1. Tunnel Construction

The environmental impacts of constructing the new tunnel (life cycle stages A1–A5) were analyzed in detail through this investigation.
The results presented in Figure 4 focus on the materials used (supporting materials, inner shell, and road pavement), the transport to the construction site, and the excavation and construction processes, which provide a detailed assessment of these aspects. Maintenance and the additional construction efforts for larger cross-sections due to emergency bays are also considered in the analysis. As previously described, the maintenance and emergency bays are accounted for by applying a surcharge of 5% each to the total outcome of the A1–A5 processes [34]. This approach ensures a more comprehensive evaluation of the overall environmental impact. A percentage-based presentation of the results is visualized in Figure 4, offering a clear comparison of the contributions of the different aspects.
The LCA results in Figure 4 show the significant environmental impact of the construction materials. In particular, the supporting materials (shotcrete, anchors, reinforcing steel, etc.) and the inner shell have a significant influence on the construction phase (A1–A5), accounting for approx. 60% of the total GWP emissions. Compared with the materials used, the excavation process itself only accounts for approx. 10% of the environmental effects.
Beyond the construction phase, the operation and maintenance of the tunnel causes environmental impacts throughout the 100 years. In this context, the tunnel operation includes electricity for ventilation and lighting, which accounts for approx. 12 tons of CO2 eq per year.
As mentioned above, the maintenance activities and the additional effort required to construct the larger cross-section of the emergency bays were taken into account by applying a 10% surcharge to the total environmental footprint of tunnel construction (A1–A5). The maintenance activities and the emergency bays are each responsible for 376 tons of CO2 eq over 100 years.

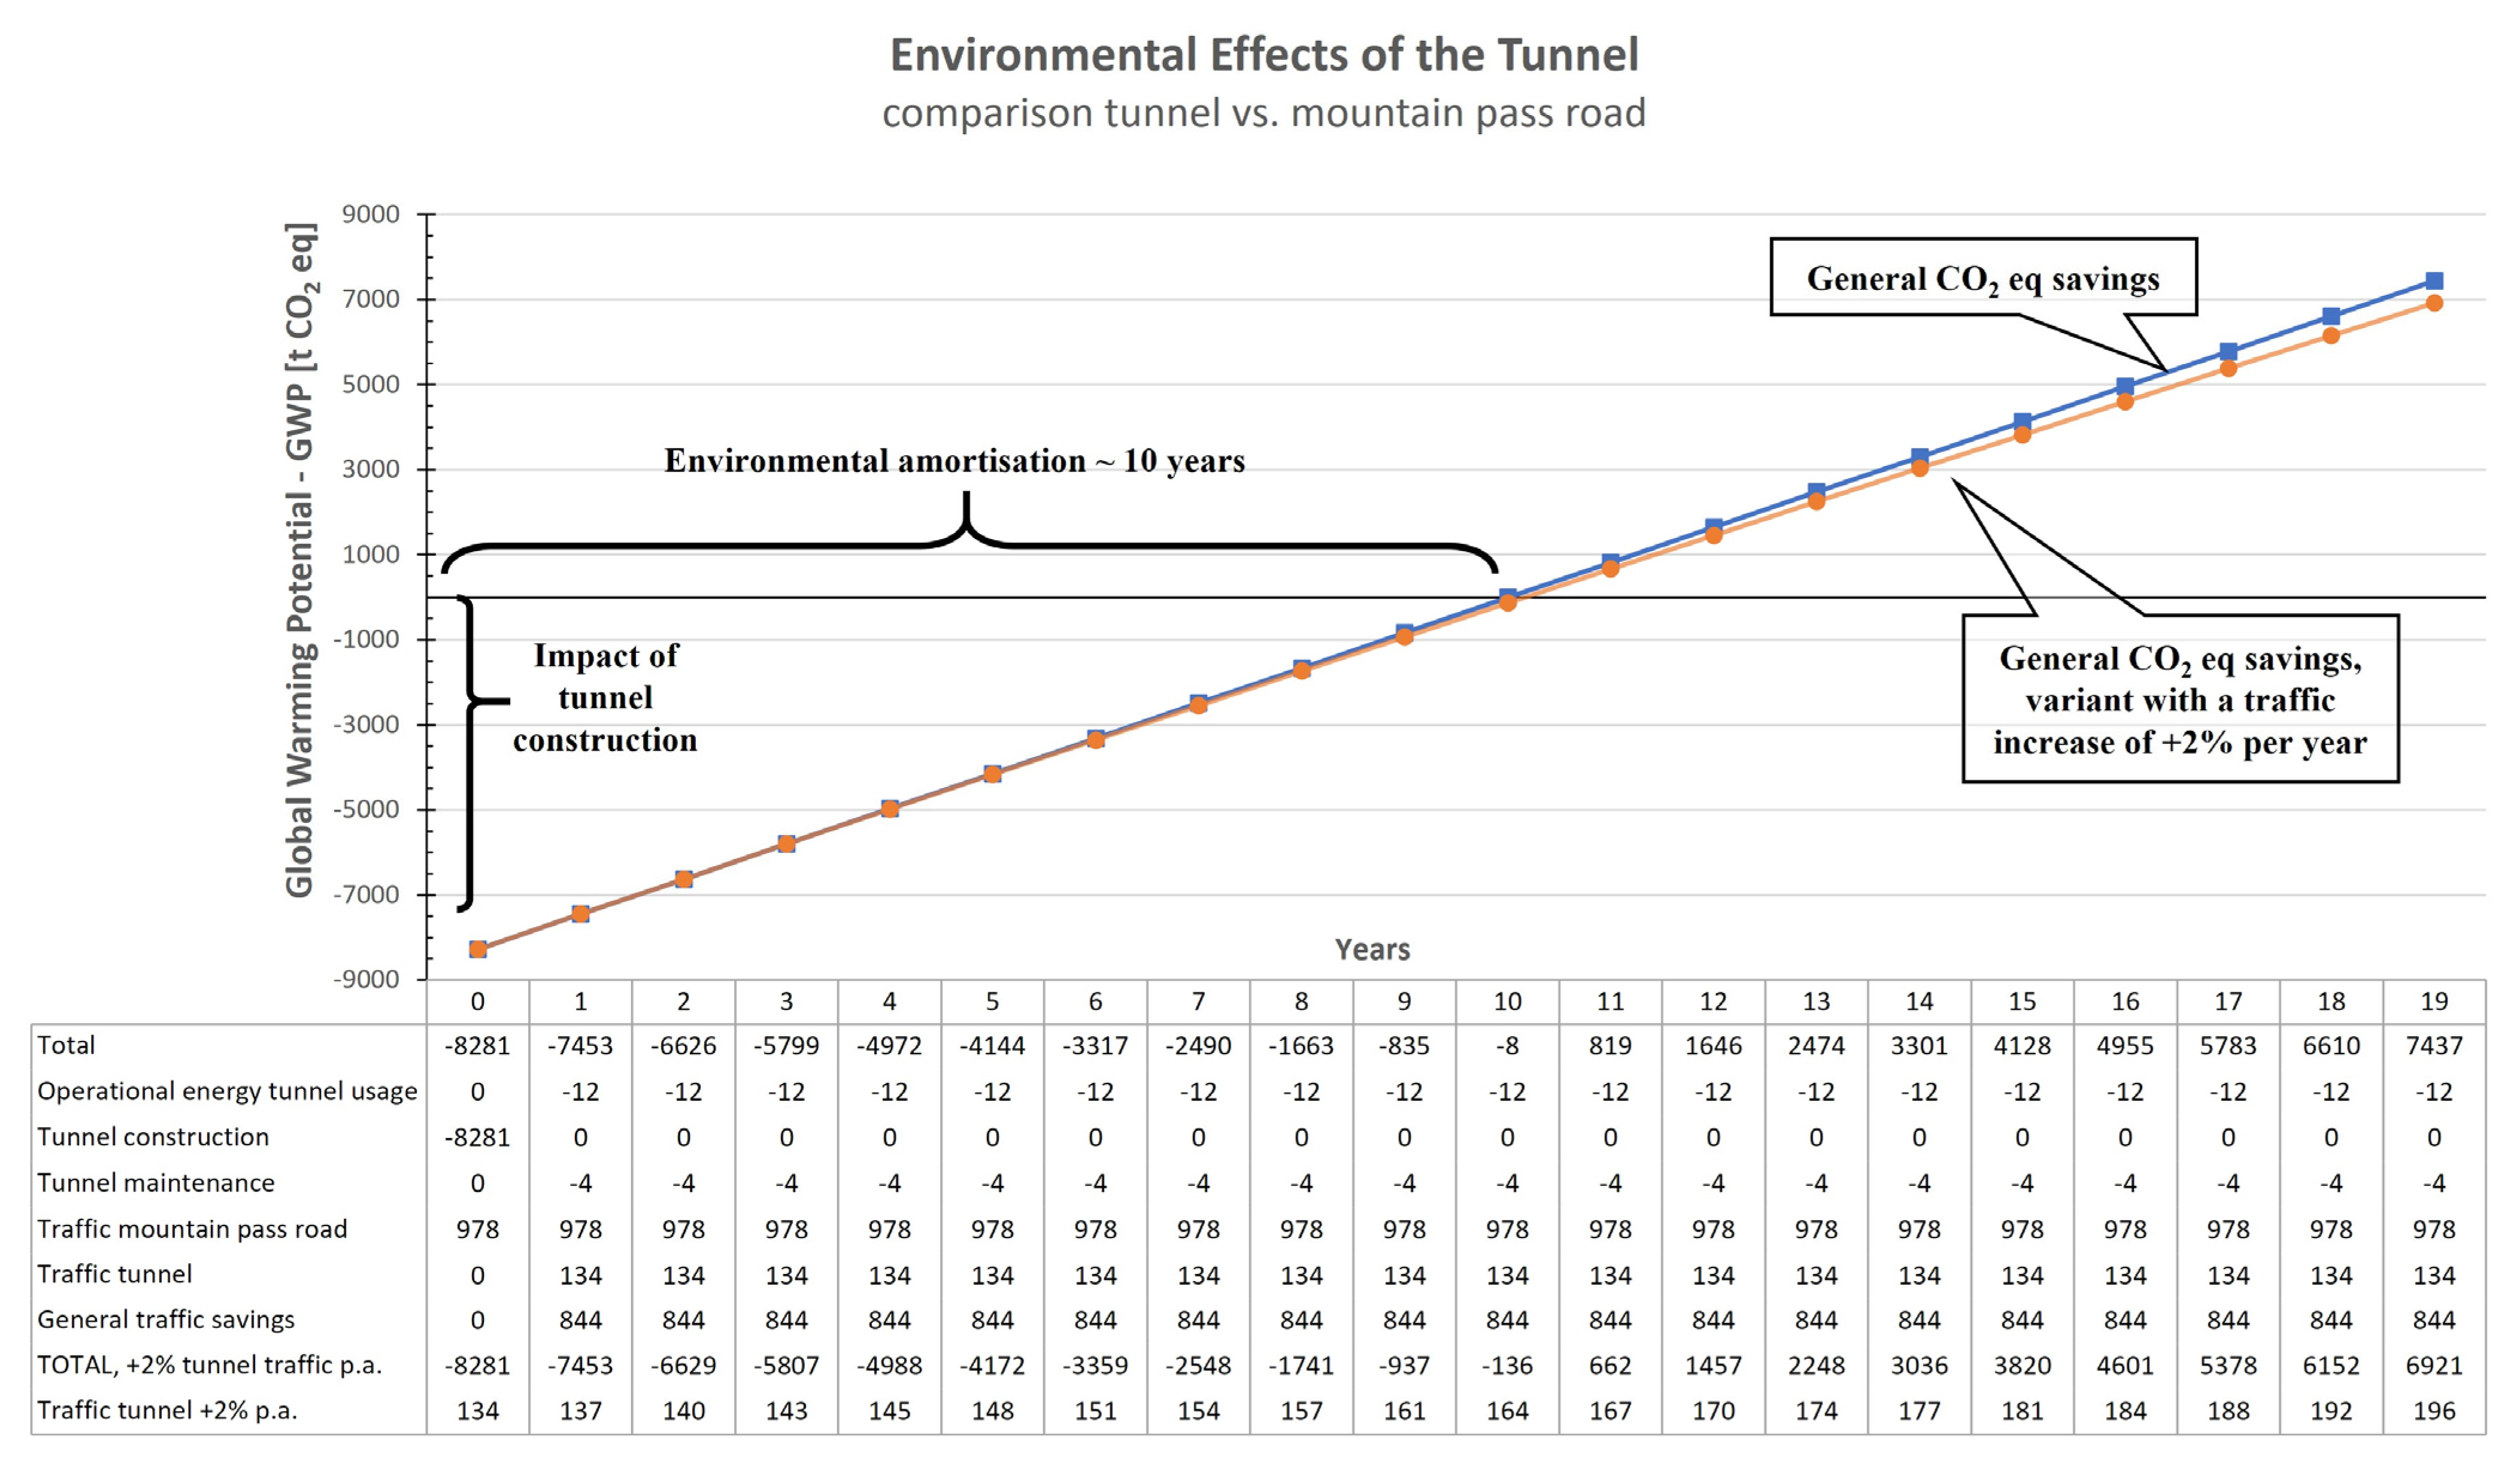
4.2. Tunnel vs. Traffic

The final part of this study [11] focuses on comparing the existing traffic emissions of the mountain pass road with the tunnel variant. The new tunnel construction (including maintenance and operation) and the increased traffic emissions of Route B are compared with the traffic emissions of Route A. Finally, the overall environmental savings from the route shortening and the tunnel are calculated. Figure 5 shows the environmental effects of the traffic route with the tunnel.
Initially, 8.2 million kg CO2 eq were emitted because of the construction of the tunnel, but a reduction in vertical meters traveled significantly minimizes traffic emissions. The overall environmental savings are calculated starting from the environmental investment of constructing the new tunnel minus the difference in traffic emissions of the two route variants. Despite the 20% higher traffic flow and the 40 m lower apex, the environmental impact of the new tunnel construction is environmentally amortized within approx. 10 years. This amortization is solely the result of the tunnel’s use.
Consistently increasing vehicle journeys, e.g., by about +2% per year (see Figure 5, orange graph), leads to slightly lower overall environmental savings and extends the duration of environmental amortization by several months.
However, it must be mentioned that this study is based on a linear approach. In other words, any effects resulting from technological developments, such as new driving systems or material improvements, were not taken into account, which means potential uncertainties may arise over 100 years. Nevertheless, it can be assumed that the amortization period will not change significantly. However, the general impact, as well as the overall savings, will be slightly lower. The graph from Figure 5 will not be linear anymore.

5. Discussion and Conclusions

The goal of this study [11] was to investigate the environmental differences between a new tunnel route and an existing mountain pass road and to implement a simple method to consider specific traffic operations in LCAs. Special focus was placed on the evaluation of the new tunnel route—in particular, the tunnel excavation and construction of the tunnel. The tunneling methods included in this study were developed for and in compliance with Austrian conditions in collaboration with tunneling experts. This means that primarily Austrian materials, energy sources and construction processes were incorporated into the LCA.
The key findings of this study can be summarized as follows:
  • Life Cycle Assessments (LCAs) are an effective method to support decision-making in transport infrastructure projects, even when applied to simplified or fictitious examples.
  • Tunnels can offer significant environmental benefits, particularly by minimizing elevation differences and route lengths, thereby reducing long-term greenhouse gas emissions.
  • The results emphasize that topographical optimizations—such as route shortening and reduced gradients—can lead to significant environmental savings throughout the long operational phase.
  • The environmental amortization period for tunnel construction is relatively short, even in scenarios with modest reductions in elevation and distance, highlighting the efficiency of such interventions.
  • The traffic-specific LCA methodology employed (based on Liebl’s approach) is adequate for assessing elevation-related emissions from uphill and downhill journeys at this level of consideration. However, for even more detailed analyses, more refined models are recommended that include factors such as gear changes and real driving behavior.
  • The applied LCA model was developed in accordance with Austrian construction and technology standards, ensuring high regional relevance. Future applications (e.g., for other regions) should always be based on local conditions, including specific materials, construction methods, energy sources, and vehicle fleet composition.
  • The early integration of LCA tools into the route selection process is essential to enable data-driven and environmentally responsible infrastructure planning.
  • This study concludes that LCAs can play a crucial role in identifying the most sustainable design alternatives and thus support the development of climate-resilient and resource-efficient transport infrastructure.
The presented concept and the key findings underline the importance of integral LCAs and their early integration into the planning process. To test and investigate the methodological approaches, the analyses were conducted using a fictitious example. The analysis processes were thereby mapped as accurately as possible for the Austrian conditions. Nevertheless, there are certain limitations in the test implementation, which are discussed and shown below in order to support future analyses further.
  • The analysis is based on a hypothetical case study and, therefore, only partially reflects the specific geographical, political, or socio-economic conditions that are typical for real infrastructure projects. Effects such as separation mechanisms and spatial crossing of certain areas (e.g., nature conservation areas and protected zones) because of the construction of new transport routes were not taken into account in the course of this study and should be included in further studies. Furthermore, this study is limited to an environmental perspective and does not take economic aspects into account. In order to support decision-making processes holistically, it is essential that costs are examined in the analysis.
  • The traffic analysis is based on simplified assumptions about vehicle types and driving behavior. Important factors such as gear changes, acceleration and braking patterns, and driver variability are not taken into account. For example, the traffic analysis was carried out using car equivalents and truck equivalents. Although this approach is not unusual, it could be considered for future detailed studies to include a detailed analysis of different modes of transport, e.g., electric cars, diesel cars, etc. A consideration of real driving cycles would also be conceivable in the future.
  • Technological advances that may occur over the 100-year assessment period—such as the increasing spread of electric vehicles or low-emission technologies and materials—are not taken into account by following this study’s objectives. The results are, therefore, based on a linear modeling approach that does not include dynamic interactions. Further studies could investigate these effects in detail.
  • To simplify and focus on the presentation of the methodological approach, as described in Section 3.1.2, “System boundaries”, only divergent input and output flows were included in this study. Certain assumptions were made in collaboration with the experts. For example, to simplify matters, it was assumed that the road surface on the pass road and in the tunnel is replaced in the same maintenance cycles. This assumption essentially excludes potential external factors such as natural hazards, climatic changes, traffic accidents, etc. It was also assumed that the two traffic routes would not be dismantled after 100 years. The scope of the LCA is therefore limited to selected phases (A1–A3, A4, A5, B2, B6, and B8), while processes at the end of the life cycle (C1–C4) are explicitly excluded. For the present fictitious example and this study’s objective, this procedure and approach appear to be sufficiently accurate. For further and more detailed analyses, however, it is recommended to map and evaluate all possible life cycle phases and external effects as accurately as possible.
To summarize, in the future, a broader application of LCA approaches/tools seems to be helpful in assessing transport infrastructures and finding the best route option in the early stages of design. Depending on the stage of consideration, the inclusion of different levels of detail and a more precise analysis are required. This study [11] has shown possible approaches and perspectives and made recommendations for future investigations. In order to enable faster and more flexible sustainability assessments at the corridor level (route selection) in the future, further work on the development of tools appears to be necessary. Hence, decision-making processes can be supported by these LCA results in choosing the most sustainable solution for traffic infrastructure.

Author Contributions

All authors have contributed to the current paper. Conceptualization, L.H. and F.G.; methodology, L.H. and F.G.; software, L.H. and F.G.; validation, L.H. and F.G.; formal analysis, L.H.; investigation, L.H.; resources, L.H., M.F. and F.G.; data curation, L.H. and F.G.; writing—original draft preparation, L.H., M.F. and F.G.; writing—review and editing, L.H., M.F. and F.G.; visualization, L.H.; supervision, F.G.; project administration, L.H. and F.G. All authors have read and agreed to the published version of the manuscript.

Funding

This research is part of the FFG-research project no. FO999900124 “LZinfra—Lebenszyklustool zur Nachhaltigkeitsbewertung von Verkehrsinfrastrukturen” and has received funding from the Austrian Research Promotion Agency.

Data Availability Statement

Data presented in this article are not publicly/readily available due to ongoing research activities and license regulations of the ecoinvent database.

Conflicts of Interest

The authors declare no conflicts of interest. The funders had no role in the design of this study, in the collection, analyses, or interpretation of data, in the writing of the manuscript, or in the decision to publish the results.

Abbreviations

The following abbreviations are used in this manuscript:
A1–A3raw material supply
A1–A5construction phase
A4transport
A5construction
approx.approximately
B2maintenance
B6operational energy use
B8user’s utilization
CO2greenhouse gas emission
C1–C4end-of-life stage
e.g.,for example
ENEuropean Standard
eq.equivalent
etc.et cetera
GWPGlobal Warming Potential
ISOInternational Organization for Standardization
kgkilogram
kmkilometer
kWhKilowatt hours
Lliter
LCALife Cycle Assessment
mmeter
m2square meter
m3cubic meter
NATMNew Austrian Tunneling Method
NOxnitrogen oxides
ÖNORMAustrian Standard
PMparticulate matter
RVSGuidelines and Regulations for Planning, Construction, and Maintenance of Roads
ssecond
SDGSustainable Development Goals
toton
UNUnited Nations
vmvertical meter

References

  1. Gertz, C. Verkehrsplanung, Bau und Betrieb von Verkehrsanlagen; Springer Fachmedien Wiesbaden: Wiesbaden, Germany, 2021; ISBN 978-3-658-29499-1. [Google Scholar]
  2. Spang, K. Projektmanagement von Verkehrsinfrastrukturprojekten; Springer: Berlin/Heidelberg, Germany, 2022; ISBN 978-3-662-64130-9. [Google Scholar]
  3. Maslow, A.H. A theory of human motivation. Psychol. Rev. 1943, 50, 396. [Google Scholar] [CrossRef]
  4. Österreichische Bautechnik Vereinigung. Ökologisierung & Nachhaltigkeit im Bauwesen—Sachstand; Österreichische Bautechnik Vereinigung: Wien, Austria, 2022; Available online: www.bautechnik.pro (accessed on 12 May 2025).
  5. Hausberger, L.; Gschösser, F. Nachhaltigkeit von Verkehrsinfrastrukturen: Bewertung auf drei Ebenen. Bau Aktuell 2023, 14, 154. [Google Scholar]
  6. Heissenberger, R.; Grunicke, U.H.; Raschendorfer, J.; Holzer, C. Sustainable Tunnelling—An infrastructure operator’s, planner’s, contractor’s and scientist’s perspective. Geomech. Tunn. 2022, 15, 811–820. [Google Scholar] [CrossRef]
  7. Aldrian, W.; Bantle, A.; Juhart, J. CO2 reduction in tunnel construction from a material technology point of view. Geomech. Tunn. 2022, 15, 799–810. [Google Scholar] [CrossRef]
  8. ÖNORM EN 17472; Nachhaltigkeit von Bauwerken—Bewertung der Nachhaltigkeit von Ingenieurbauwerken—Rechenverfahren. Austrian Standards International (ASI): Wien, Austria, 2022.
  9. Hausberger, L.; Lutterbach, J.; Gschösser, F. Modeling the Environmental Impact of Passenger Cars Driven on Hilly Roads in Austria: A More Accurate Valuation of Greenhouse Gas Emissions and Further Environmental Indicators for Integral Life Cycle Assessments of Road Infrastructures. Buildings 2024, 14, 263. [Google Scholar] [CrossRef]
  10. Liebl, J.; Lederer, M.; Rohde-Brandenburger, K.; Biermann, J.-W.; Roth, M.; Schäfer, H. Energiemanagement im Kraftfahrzeug; Springer Fachmedien: Wiesbaden, Germany, 2014; ISBN 978-3-658-04450-3. [Google Scholar]
  11. Hausberger, L.; Flora, M.; Gschösser, F. Environmental Impacts of Road Traffic and Route Variants: An Accurate Way to Support Decision-Making Processes of Mountain Roads and Tunnels in Austria. In Proceedings of the 2nd International Conference on Construction Engineering and Management (iCCPMCE-2024), Sydney, Australia, 20–22 November 2024. [Google Scholar]
  12. ÖNORM EN ISO 14040; Umweltmanagement—Ökobilanz—Grundsätze und Rahmenbedingungen. Austrian Standards International (ASI): Wien, Austria, 2021.
  13. ÖNORM EN 15804; Nachhaltigkeit von Bauwerken—Umweltproduktdeklarationen—Grundregeln für die Produktkategorie Bauprodukte. Austrian Standards International (ASI): Wien, Austria, 2022.
  14. Klöpffer, W.; Grahl, B. Ökobilanz (LCA): Ein Leitfaden für Ausbildung und Beruf; WILEY-VCH: Weinheim, Germany, 2007; ISBN 978-3-527-32043-1. [Google Scholar]
  15. Stefan, C.; Grunicke, U.; Prändl-Zika, V.; Weninger-Vycudil, A.; Hula, A.; Van Linn, A.; Brozek, B.; Prammer, D.; Mellert, L.D. Optimierte Instandsetzungsplanung der Tunnelspezifischen Baulichen und Elektromaschinellen Ausrüstung Mittels LCA: OptimAL; 2020. Available online: https://projekte.ffg.at/anhang/603383f3e02af_OPtimAL_Ergebnisbericht.pdf (accessed on 19 March 2025).
  16. Deutscher Ausschuss für unterirdisches Bauen e. V.—German Tunneling Committee. Empfehlungen für die Ermittlung von Lebenszykluskosten für Tunnel. 2023. Available online: https://www.daub-ita.de/fileadmin/documents/daub/gtcrec4/2023-03-24_DAUB_LZK_Empfehlung_mit_%C3%96PNV_und_DB.pdf?utm_source=chatgpt.com (accessed on 19 March 2025).
  17. Hoffeller, M. Bestimmung der Investitionskosten von Verkehrswegen, Brücken und Tunneln zum Zeitpunkt der Realisierungsentscheidung über die Gesamtnutzungsdauer unter besonderer Berücksichtigung der Objektkonzeption. Ph.D. Thesis, TUM School of Engineering and Design, Munich, Germany, 2023. [Google Scholar]
  18. Frischknecht, R. Lehrbuch der Ökobilanzierung; Springer Spektrum: Berlin/Heidelberg, Germany, 2020; ISBN 978-3-662-54762-5. [Google Scholar]
  19. Ecoinvent. ecoinvent v3.10 Database. Available online: https://ecoinvent.org/the-ecoinvent-database/ (accessed on 22 May 2024).
  20. Ökobaudat. Ökobaudat—Sustainable Construction Information Portal. Available online: https://www.oekobaudat.de/ (accessed on 22 May 2024).
  21. Flora, M.; Purrer, W.; Bergmeister, K. Characteristics and potential of the NATM, ADECO-RS and mechanised methods of tunnelling / Charakteristika und Potenziale der Tunnelbaumethoden NÖT, ADECO-RS und TVM. Geomech. Tunn. 2011, 4, 489–498. [Google Scholar] [CrossRef]
  22. Austrian Research Association for Roads, Railways and Transport. RVS 09.01.22 Tunnelquerschnitte; Austrian Research Association for Roads, Railways and Transport (FSV): Wien, Austria, 2010. [Google Scholar]
  23. ÖNORM B 2203-1: 2023 03 01; Untertagebauarbeiten, Teil 1: Zyklischer Vortrieb. Austrian Standards International: Wien, Austria, 2023.
  24. Hausberger, L.; Ressler, C.; Cordes, T.; Gschösser, F. Detaillierte Ökobilanzdaten für spezifische Betonsorten hergestellt in Österreich. Beton Stahlbetonbau 2024, 120, 263–270. [Google Scholar] [CrossRef]
  25. TPH Bausysteme GmbH. Datenblatt F8000; TPH Bausysteme GmbH: Norderstedt, Germany, 2023. [Google Scholar]
  26. Institut Bauen und Umwelt e.V. Baustähle: Offene Walzprofile und Grobbleche. Available online: https://ibu-epd.com/veroeffentlichte-epds/ (accessed on 29 August 2023).
  27. Bau EPD GmbH. EPD Betonstahl Marienhütte 2020. Available online: https://www.bau-epd.at/fileadmin/user_upload/epds_Deutsch/BAU-EPD-MARIENHUETTE-2020-1-Ecoinvent-Baustahl_20200326.pdf (accessed on 26 September 2024).
  28. Pretec Norge AS. EPD-Self-Drilling-Anchor. Available online: https://epd-global.com/getfile.php/13205229-1741716592/EPDer/Byggevarer/St%C3%A5lkonstruksjoner/NEPD-8850-8511_Self-Drilling-Anchor--Pc-Coat-.pdf (accessed on 19 March 2025).
  29. European Union. Eurostat—Lorries and Road Tractors by Age and Type of Vehicle. 2023. Available online: https://ec.europa.eu/eurostat/databrowser/view/road_eqs_lorroa/default/table?lang=en&category=road.road_eqs (accessed on 19 March 2025).
  30. IG-L—Abgasklassen-Kennzeichnungsverordnung—AbgKlassV: BGBl. II Nr. 120/2012 II. Available online: https://www.ris.bka.gv.at/GeltendeFassung.wxe?Abfrage=Bundesnormen&Gesetzesnummer=20007781 (accessed on 12 May 2025).
  31. Wirtschaftskammer Österreich. Feststellung der richtigen Euro-Abgasklasse. Available online: https://www.wko.at/transport/abgasklassenzuordnung (accessed on 19 March 2025).
  32. Europäische Kommission. Europäische Abfallartenkatalog (EAK), 2021. Available online: https://www.statistik.bayern.de/mam/statistik/bauen_wohnen/abfall/europabfallkatalog.pdf (accessed on 12 May 2025).
  33. Sprenger, J. Treibhausgas-Bilanz von Tunnelinnenschalen. Master’s Thesis, University of Innsbruck, Innsbruck, Austria, 2023. [Google Scholar]
  34. Gschösser, F. Fernpasstunnel—Ökobilanzstudie 2023, 2023. Available online: https://www.tirol.gv.at/fileadmin/buergerservice/Beauftragte_Gutachten_Studien_Umfragen/20230620_Fernpasstunnel_OEkobilanz_2023.pdf (accessed on 12 May 2025).
  35. Lischka, G. Weiterentwicklung der Lebenszyklusemissionsprognose für Fahrzeugflotten um Motorräder im Inlandsverkehr sowie LKW unter Berücksichtigung des Inlands- und Transitverkehrs. Master’s Thesis, Technische Universität Wien, Wien, Austria, 2022. [Google Scholar]
  36. Gschösser, F.; Purrer, W.; Sander, P. Expanding Boundaries—Environmental Effects of an Alpine Summit Tunnel 2016; vdf Hochschulverlag AG an der ETH Zürich: Zurich, Switzerland, 2016. [Google Scholar] [CrossRef]
Figure 1. Schematic overview and topographical visualization of Route A (mountain pass road).
Buildings 15 01669 g001
Figure 2. Schematic overview and topographical visualization of Route B (tunnel variant).
Buildings 15 01669 g002
Figure 3. Schematic visualization of the LCA system boundaries.
Buildings 15 01669 g003
Figure 4. Environmental impact of tunnel construction, including the maintenance processes.
Buildings 15 01669 g004
Figure 5. Environmental outcome due to the traffic use of the tunnel—presented for GWP.
Buildings 15 01669 g005
Table 1. Traffic load of Route A (mountain pass road) per day.
Direction of TravelCar Eq.Truck Eq.Total Vehicles
Location A to B1250451295
Location B to A1000201020
Table 2. Traffic load of Route B (tunnel) with a traffic increase of +20% per day.
Direction of TravelCar Eq.Truck Eq.Total Vehicles
Location A to B1500541554
Location B to A1200241224
Table 3. Summary of the key supporting and construction materials and energy sources for the 1 km tunnel.
DescriptionAmountUnitRelated to Life Cycle Phase
Shotcrete7705m3A1–A3
Reinforcing steel136toA1–A3
Anchors349toA1–A3
Arches40toA1–A3
Grouting (Mortar and Injections)109toA1–A3
Concrete inner lining13100m3A1–A3
Asphalt pavement1350m3A1–A3
Diesel144034LA5
Electricity956559kWhA5
Water682m3A5
Explosives169toA5
Table 4. Overview of the assumed transport distances of the main materials and construction equipment.
DescriptionDistanceUnitRelated to Life Cycle Phase
Excavated rock material5kmA5
Shotcrete15kmA4
Concrete inner lining15kmA4
Reinforcing steel200kmA4
Anchors and Arches200kmA4
Grouting (Mortar and Injections)15kmA4
Asphalt pavement20kmA4
Unbound base course10kmA4
Machinery and equipment20kmA5
Disclaimer/Publisher’s Note: The statements, opinions and data contained in all publications are solely those of the individual author(s) and contributor(s) and not of MDPI and/or the editor(s). MDPI and/or the editor(s) disclaim responsibility for any injury to people or property resulting from any ideas, methods, instructions or products referred to in the content.

