Walkability Evaluation of Historical and Cultural Districts Based on Multi-Source Data: A Case Study of the Former Russian Concession in Hankou


Abstract
1. Introduction
2. Literature Review
3. Materials and Methods
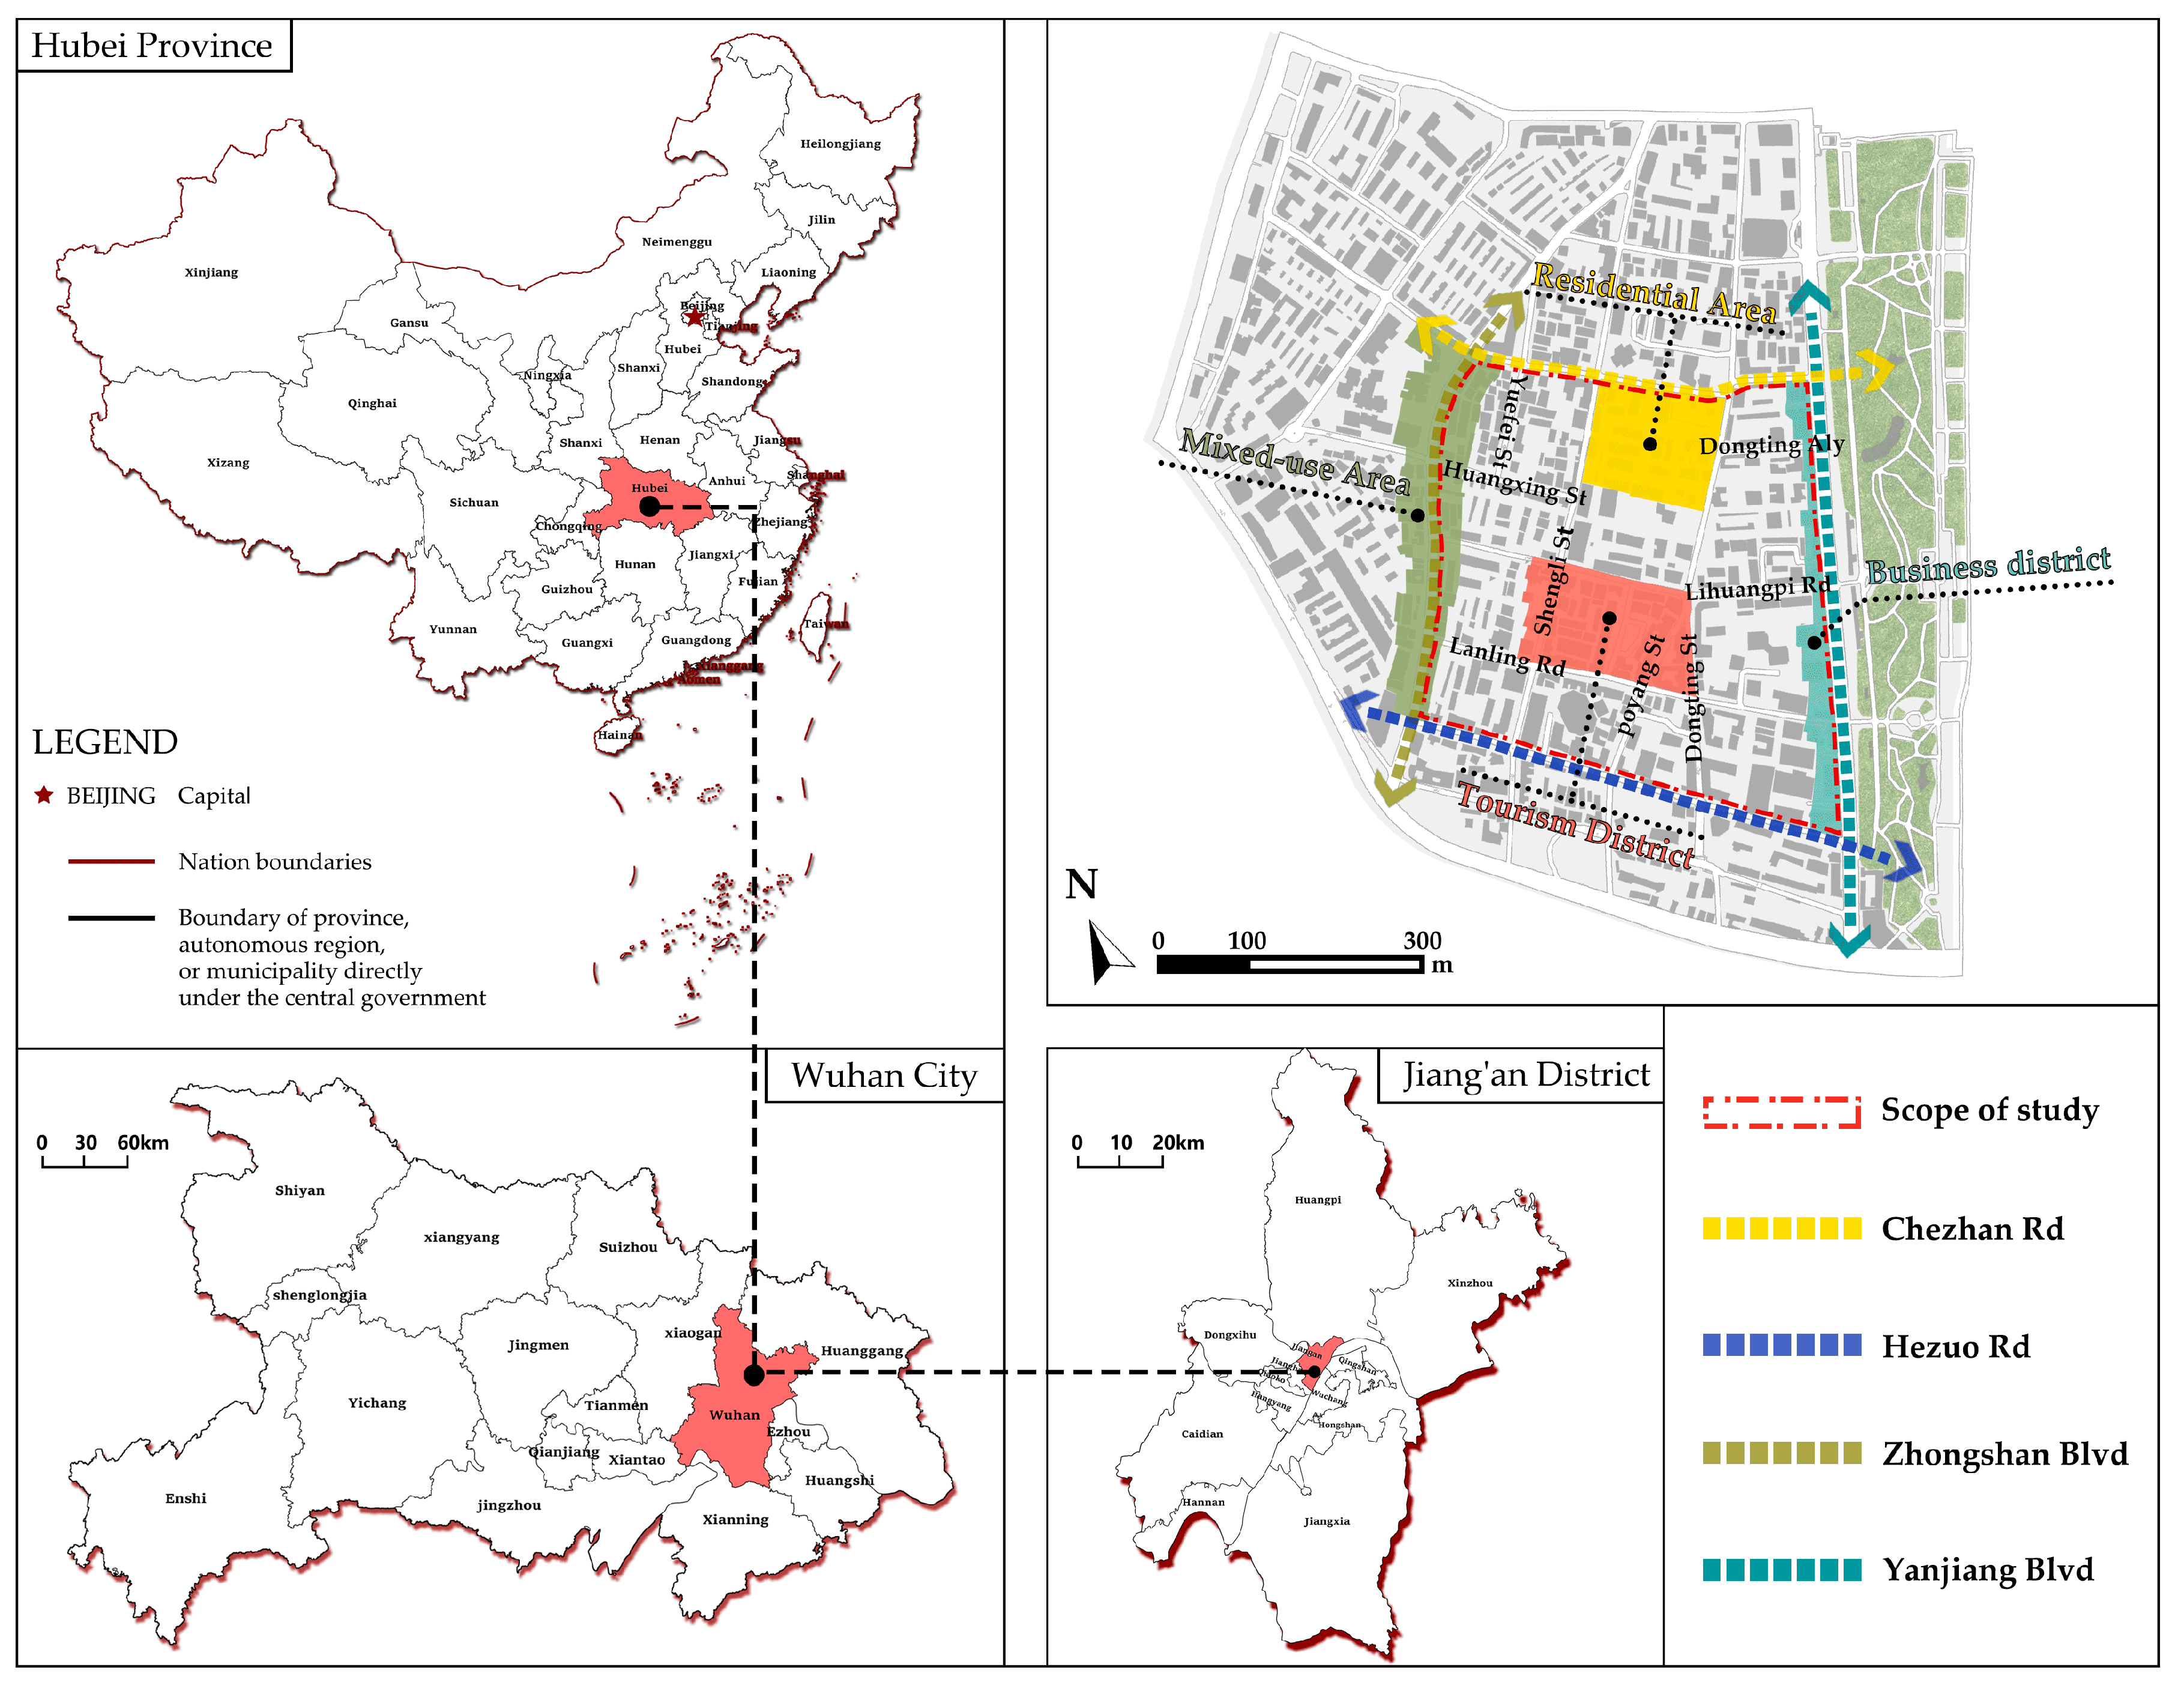
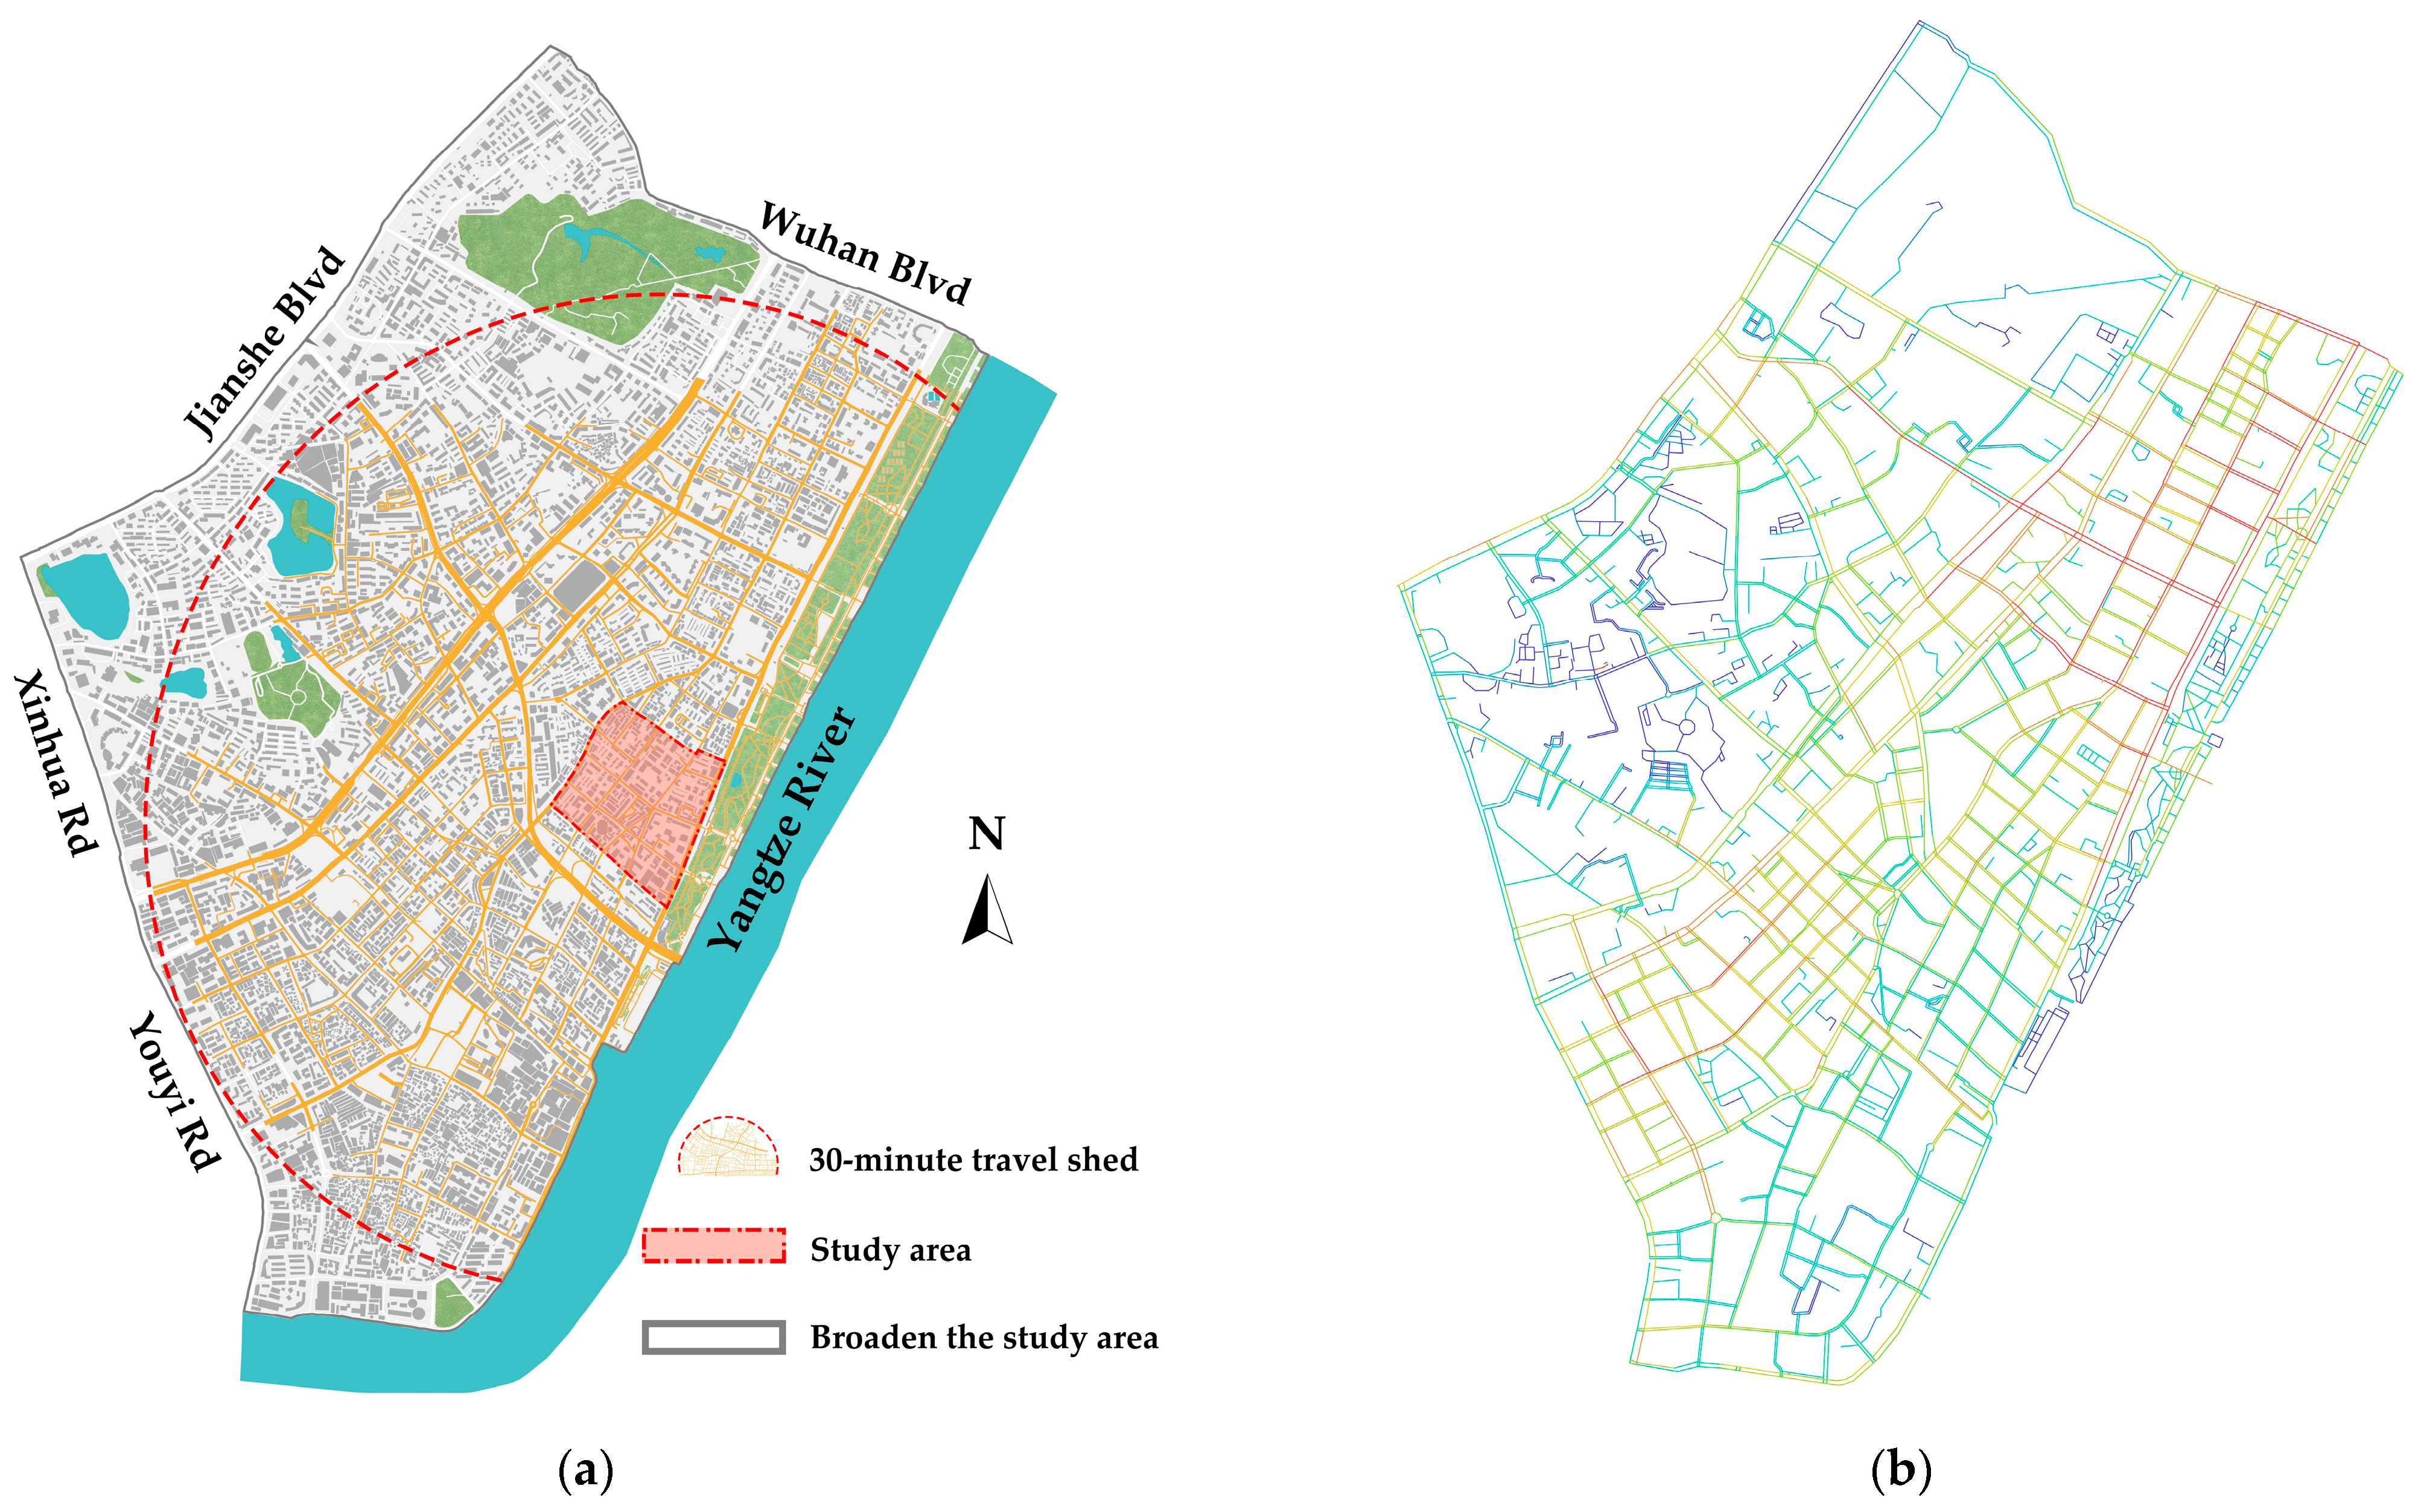
3.1. Study Area
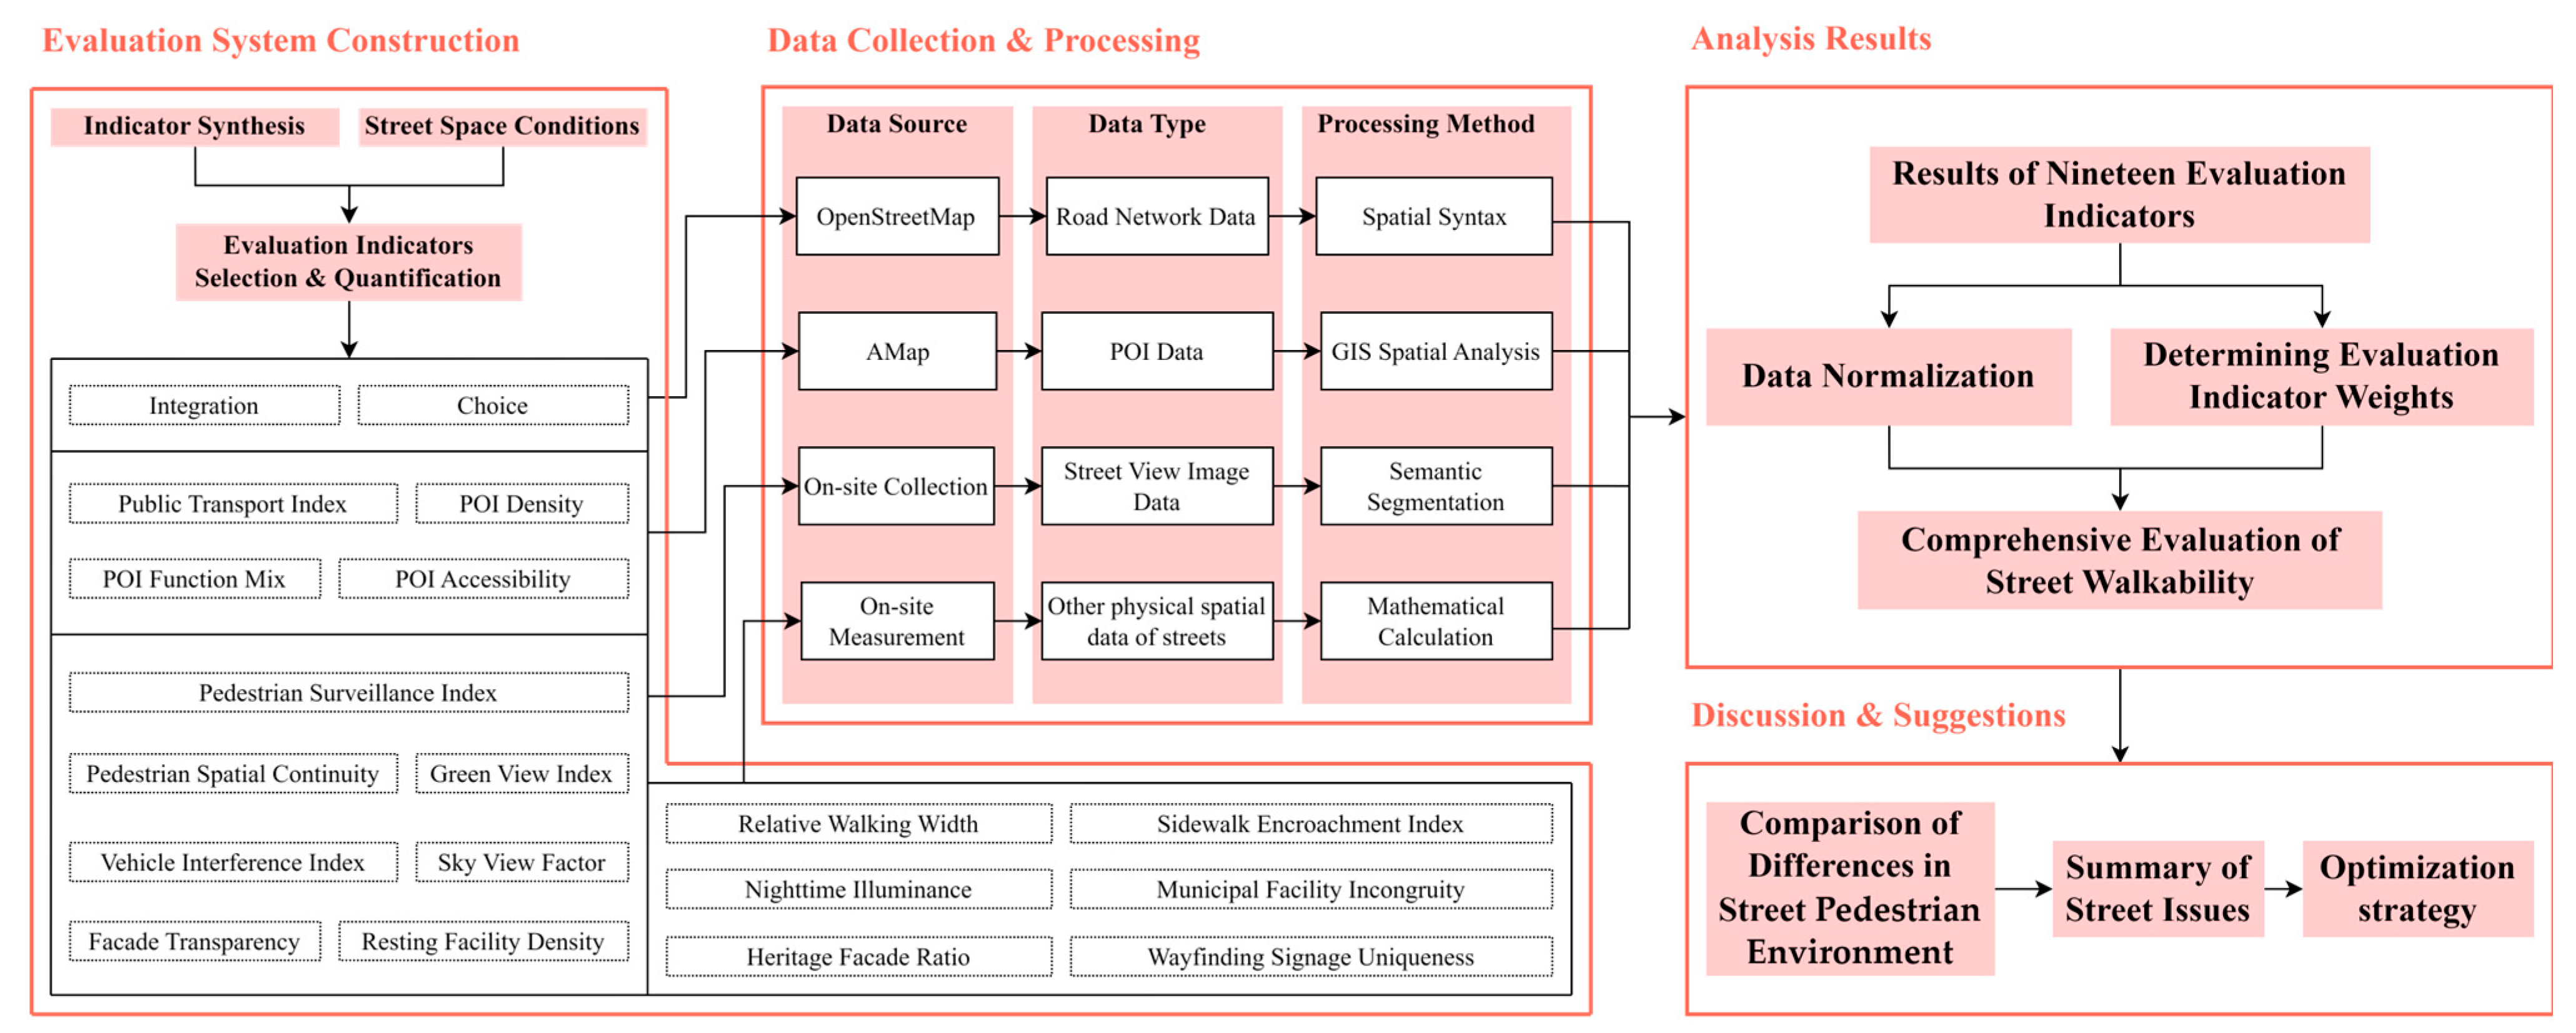
3.2. Research Framework
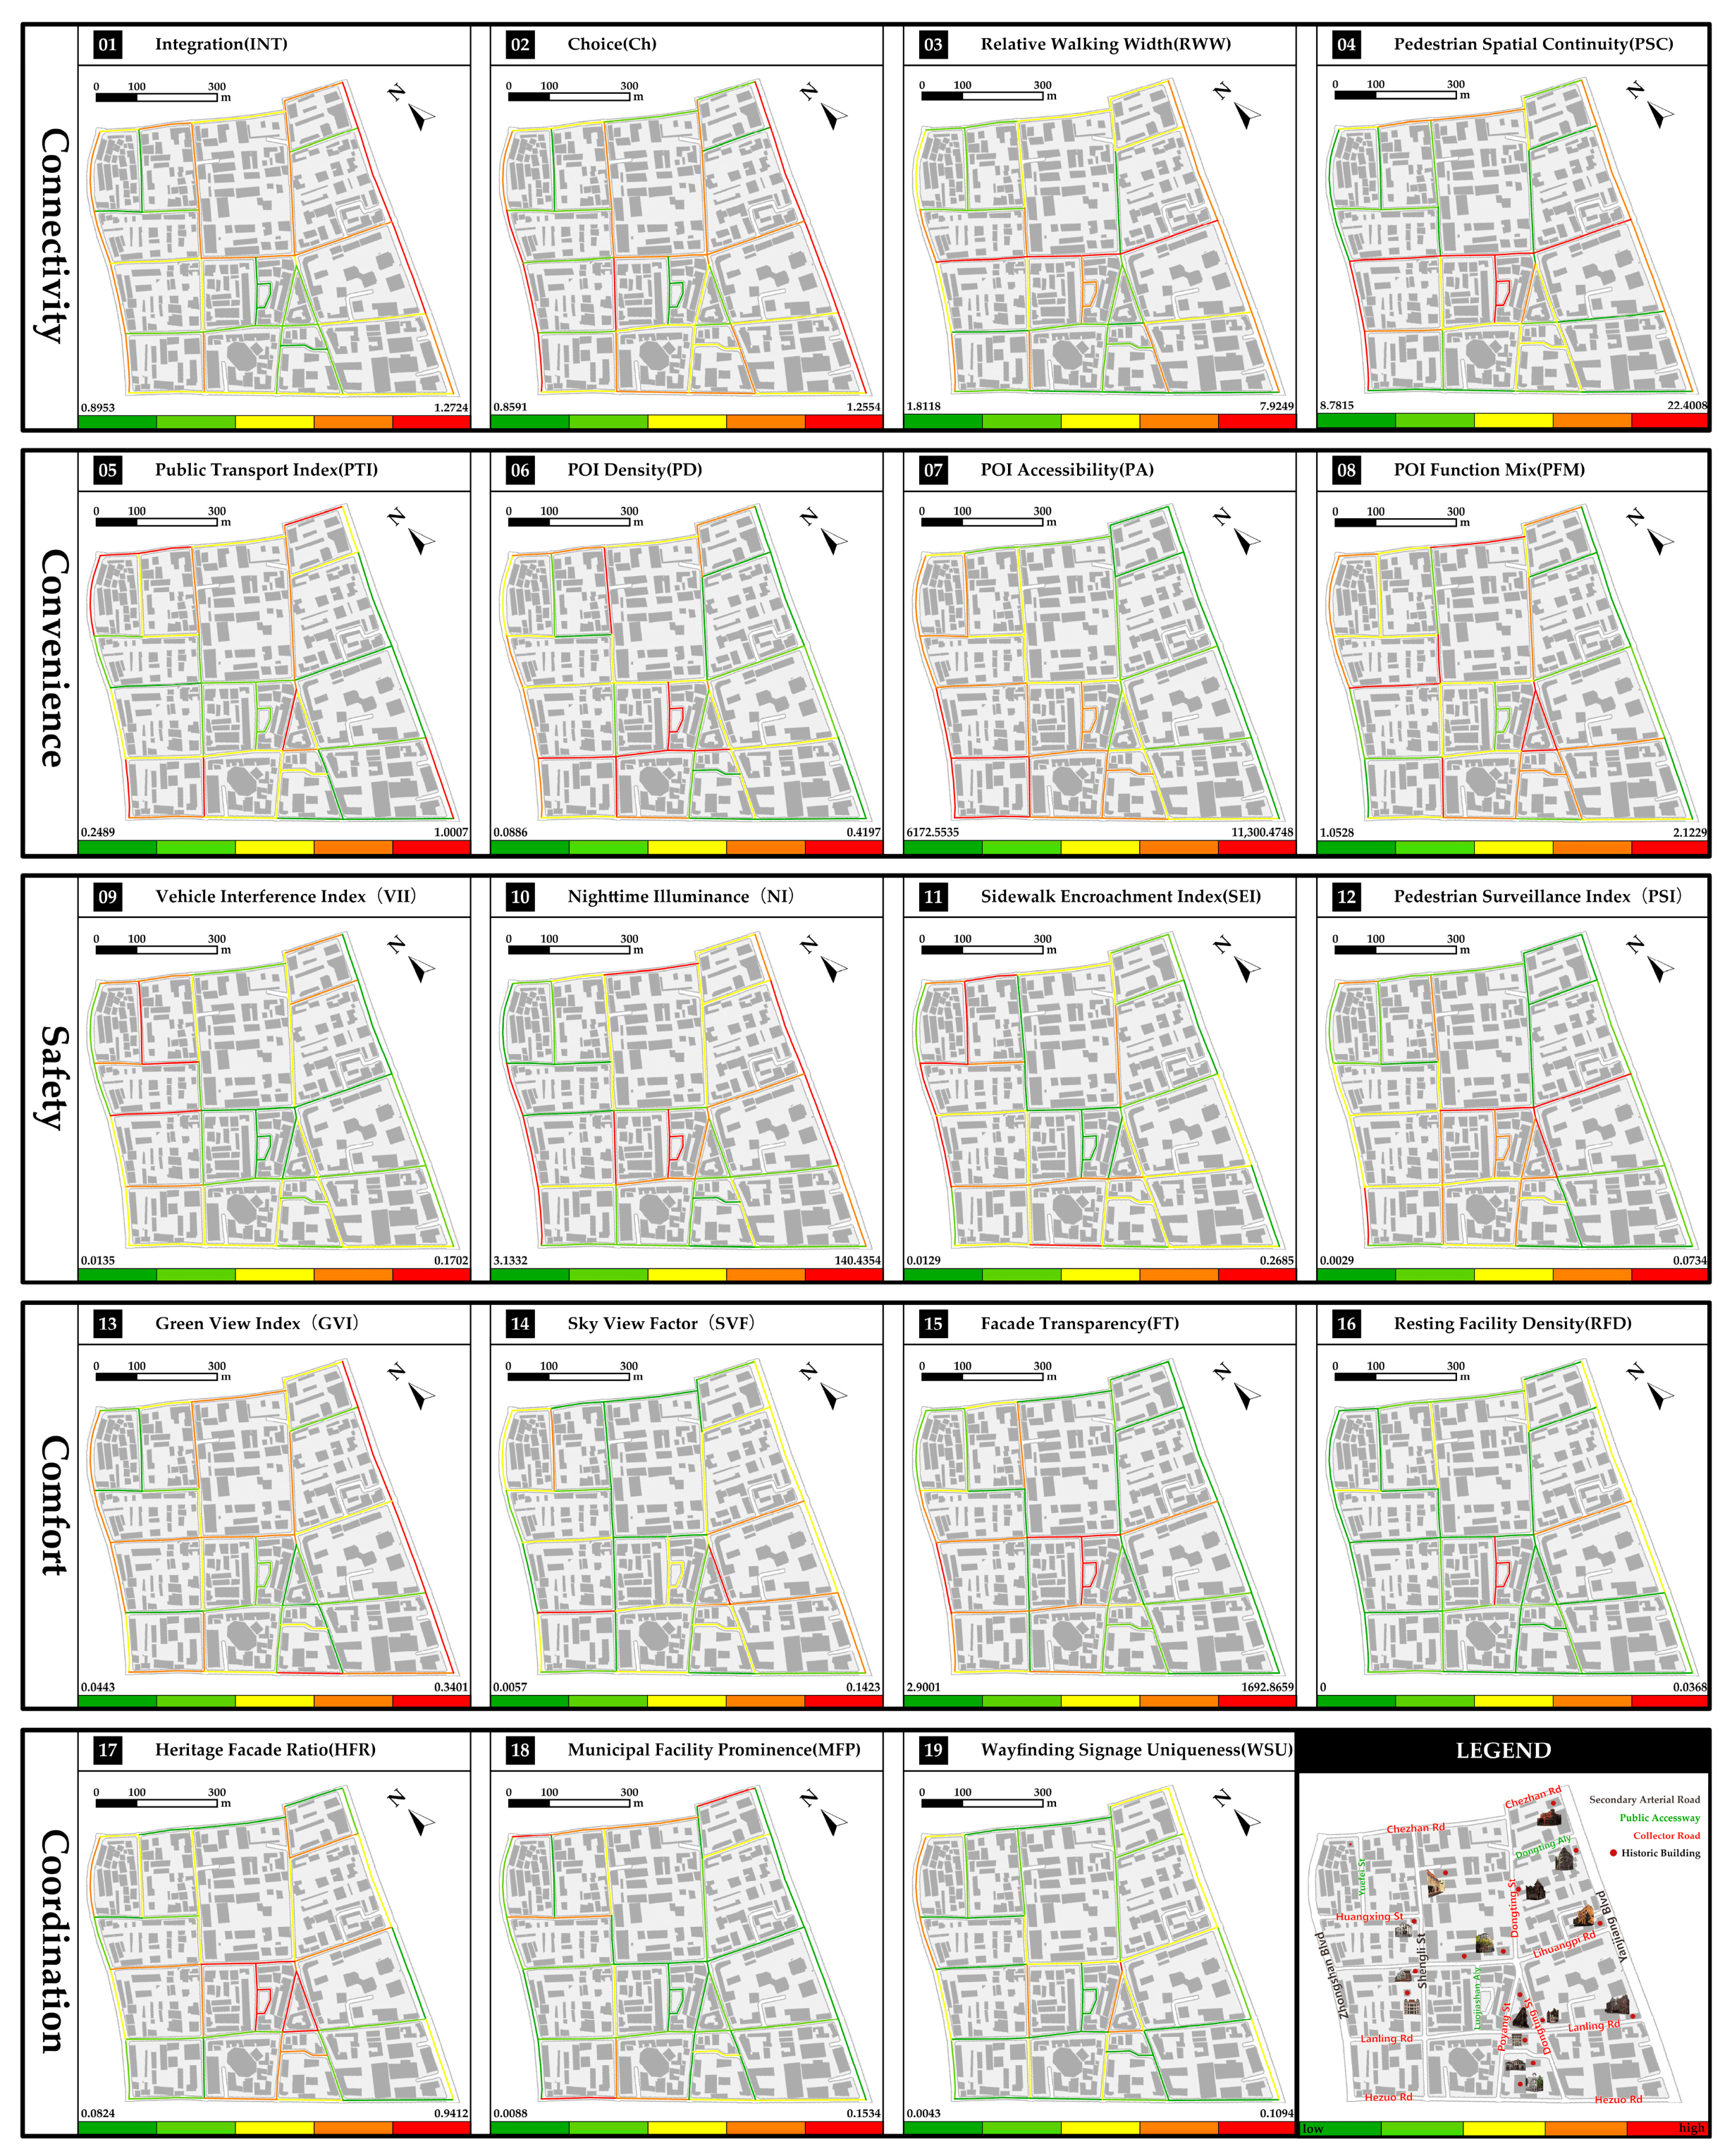
3.3. Evaluation Indicator Extraction and Calculation
- Imbalance in Right-of-Way Allocation
- 2.
- Spatial Disorder
- 3.
- Functional Dislocation
- 4.
- Fragmentation of Historical Context
3.4. Data Collection and Processing
3.4.1. Data Collection Methods
- (1)
- Road Network Data: Road network data covering the study area and its surrounding region were obtained from the OpenStreetMap (OSM) open data platform. These data served as the foundation for subsequent spatial syntax modeling and GIS network analysis.
- (2)
- POI Data: POI data for the study area and its surrounding region were obtained using web crawler tools through the AMap API.
- (3)
- Street View Image Data: To better capture the influence of street environments on pedestrian experience during walking activities and to address the limitations of using Baidu panoramic static image APIs—such as outdated imagery and missing segments—this study employed a self-collected street view image approach. Sampling points were set every 10 to 15 m along the streets. At each point, two images were taken (one facing forward and one facing backward) using a smartphone camera held at eye level, in order to simulate the pedestrian visual experience during actual walking. To ensure consistency in pedestrian activity, image collection was conducted between 9:00 and 11:00 a.m. in May 2024. Additionally, since this study focused on the physical spatial characteristics of streets. Holidays and other special periods were avoided during data collection to minimize visual obstruction caused by crowd gatherings.
- (4)
- Nighttime Illumination Data: Sampling points were set at 10 m intervals along the streets within the study area. At each point, nighttime illumination data were collected using a digital lux meter to measure the illuminance level. (5) Other Physical Spatial Data of Streets: Sidewalk width and the length and width of public facilities were measured on-site using a laser rangefinder. The quantities of public facilities along the streets—such as streetlights, traffic signals, fire hydrants, trash bins, and public benches—were obtained through manual counting.
3.4.2. Data Processing
- Road Network Data Processing
- 2.
- POI Data Processing
- 3.
- Street View Image Data Processing
4. Results
4.1. Results of Nineteen Evaluation Indicators
4.2. Analysis of Comprehensive Street Walkability
- Data Normalization Processing
- 2.
- Determining Evaluation Indicator Weights
- 3.
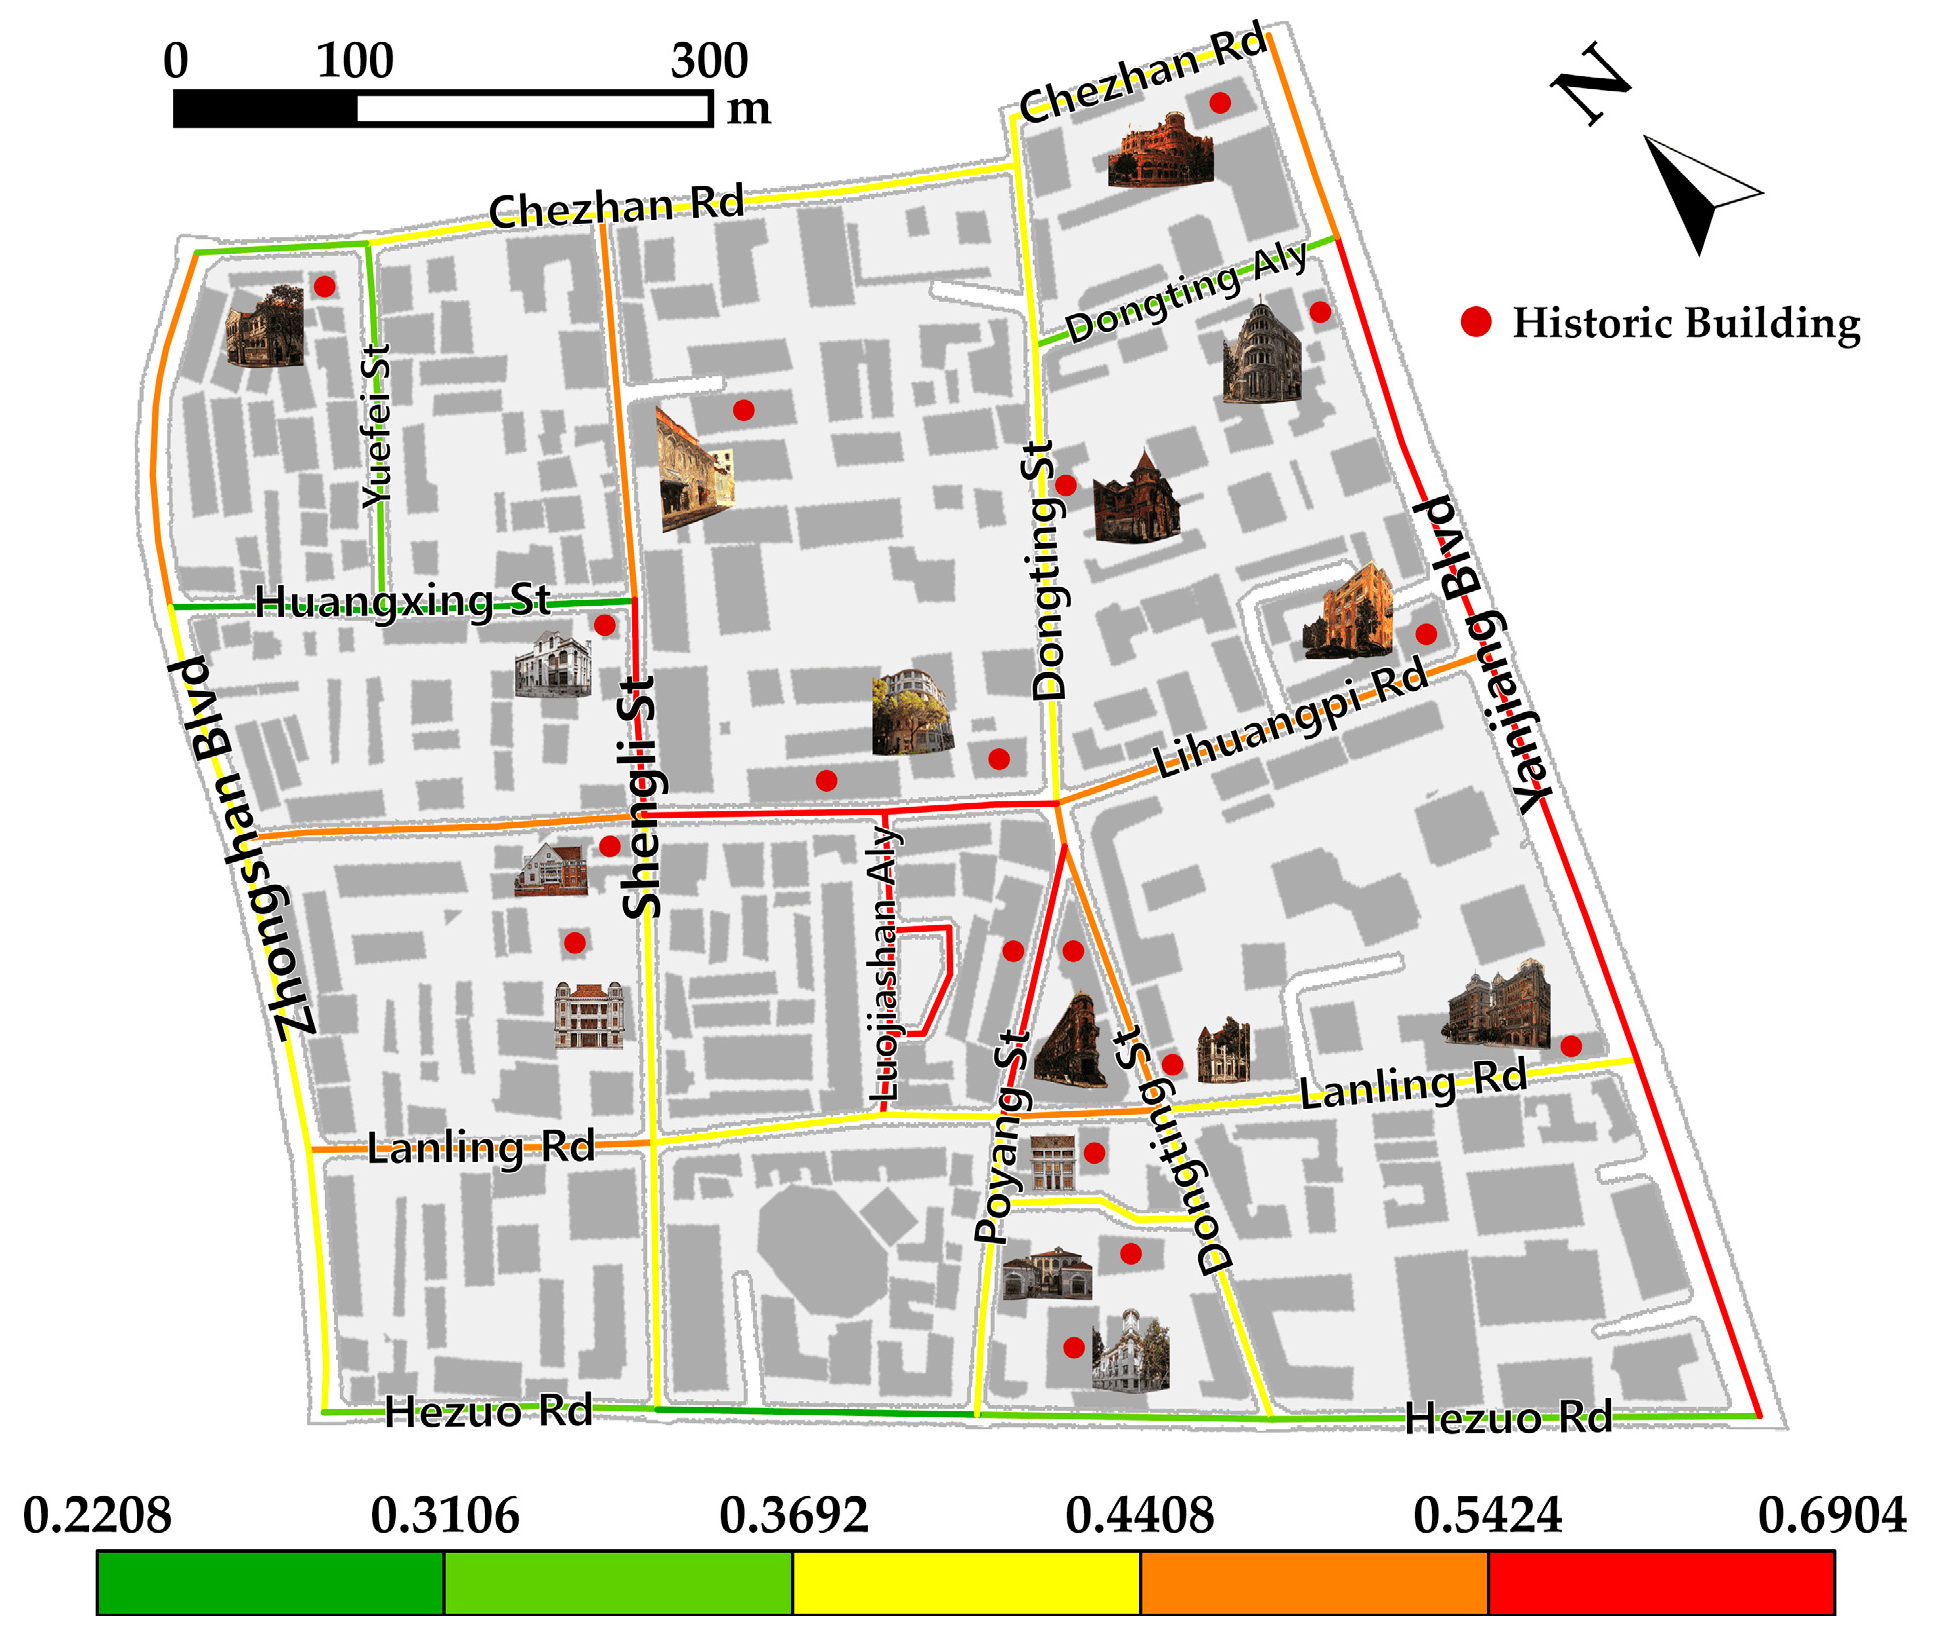
- Comprehensive Walkability Evaluation of Streets
5. Discussion
5.1. Comparison of the Differences in Pedestrian Environments Between Yanjiang Boulevard and Zhongshan Boulevard
5.2. Comparison of the Differences in Pedestrian Environments Between Chezhan Road and Hezuo Road
5.3. Comparison of the Differences in Pedestrian Environments Between Lihuangpi Road and Lanling Road
5.4. Summary
- Insufficient Effective Walking Width
- 2.
- Poor Quality of Street Space
- 3.
- Disordered Street-Level Service Functions
- 4.
- Distortion of Historical Features of the Neighborhood
6. Proposed Guidelines
6.1. Expanding Effective Walking Width
6.2. Improving the Spatial Quality of Streets
6.3. Optimizing Street Service Functions
- Rational allocation of commercial functions based on existing cultural and tourism resources
- ●
- The building fabric along Zhongshan Avenue has been relatively well preserved, with the northern section retaining a large number of arcade buildings. By drawing on the cultural legacy of this century-old commercial street, it is possible to develop a distinctive arcade-style commercial corridor;
- ●
- Lihuangpi Road and Luojiashan Street have undergone pedestrianization, resulting in pedestrian spaces that are free from motorized traffic interference and suitable for the development of pedestrian commercial routes.
- ●
- Yanjiang Avenue is built along the river and benefits from a prime geographical location, making it suitable for the development of a riverside business route.
- ●
- A large number of historic and cultural buildings are preserved along the central section of Shengli Street, as well as Poyang Street and Dongting Street. These resources should be reasonably utilized to develop a cultural experience route supported by relevant cultural industries, in order to highlight the cultural identity of the district.
- 2.
- Enrich street-level service facilities and enhance functional diversity
- ●
- The ground floors of buildings within residential land use areas can accommodate daily service facilities such as clinics, fruit-and-vegetable markets, repair stations, and convenience stores to meet residents’ everyday needs.
- ●
- Large supermarkets should be uniformly located on one side of the block to meet the needs of the ten-minute living circle, while avoiding damage to the overall street fabric of the historical and cultural district.
- ●
- On streets with a high concentration of historic buildings, cultural facilities should be prioritized. Other types of daily service facilities may be added where appropriate, as long as they do not compromise the overall cultural atmosphere of the street.
6.4. Harmonizing the Historical Character of the District
- Repairing Fragmented Urban Fabric
- ●
- Unified facade renovation: Employ materials, colors, window types, and other design elements that are compatible with the surrounding historic architecture to reduce stylistic conflicts and ensure the continuity of the historical atmosphere.
- ●
- Transitional design: Introduce gradual visual transitions between historic and modern buildings. For example, commercial structures can adopt materials and decorative details similar to those found in adjacent historical buildings to avoid abrupt stylistic breaks.
- ●
- Enhanced facade detailing: Modern buildings may incorporate traditional architectural elements—such as porches, arches, or cornices—into their facades to strengthen overall visual consistency along the street.
- ●
- Color palette coordination: Apply color schemes commonly found in the historical district or use natural and muted tones to unify the visual appearance of the area and minimize perceptual dissonance.
- 2.
- Introducing Cultural Symbols
- ●
- Wayfinding signage enhancement: Install wall-mounted directional signs that align with the architectural texture of historic buildings, improving visual coordination while freeing up pedestrian space.
- ●
- Utility box improvement: Use perforated aluminum panels or graphic wraps that incorporate local historical and cultural elements to visually integrate utility boxes with the surrounding environment.
- ●
- Bus stop design optimization: Design bus stops using forms and materials compatible with the historical character of the district. In addition to standard signage, consider integrating relief sculptures, historical narratives, or other localized cultural elements into the design.
- ●
- Lighting facility enhancement: Select lighting fixtures whose forms and materials reflect the historical identity of the street. Beyond conventional forms, consider embedded lighting systems that incorporate cultural motifs to enhance both function and aesthetic continuity.
7. Conclusions and Future Work
Author Contributions
Funding
Data Availability Statement
Conflicts of Interest
References
- Lu, Z.; Wang, M.; Ding, Y.; Han, M.; Zhu, M. Research on the success factors of preserving historical and cultural districts. Int. J. Environ. Sustain. Prot. 2021, 1, 36–40. [Google Scholar] [CrossRef]
- Moradi, A.M.; Yazdanfar, S.A.; Norouzian Maleki, S. Exploring the sense of place components in historic districts: A strategy for urban designers and architects. Iran Univ. Sci. Technol. 2020, 30, 30–43. [Google Scholar]
- ElSerafi, T. Guidelines for sustainable urban mobility in historic districts from international experiences. Int. J. Urban Civ. Eng. 2018, 12, 729–737. [Google Scholar]
- Lei, B.; Gao, Q.; Cui, Y. Strategies for activating historic district: Micro-reform implement in Qiulin District, Harbin. E3S Web Conf. 2021, 237, 04003. [Google Scholar] [CrossRef]
- Yu, C.; Wang, X.; Zheng, Z.; Lau, S.S.Y. How do urban environments impact walkability? An analysis using multi-source data of Beijing. Land 2024, 13, 2101. [Google Scholar] [CrossRef]
- Ma, S.; Huang, W.; Cui, N.; Cai, Z.; Xu, Y.; Qiao, Y. Exploring non-linear and synergistic effects of street environment on the spirit of place in historic districts: Using multi-source data and XGBoost. Sustainability 2024, 16, 5182. [Google Scholar] [CrossRef]
- Brownson, R.C.; Hoehner, C.M.; Day, K.; Brennan, L.K.; Sallis, J.F. Measuring the built environment for physical activity: State of the science. Am. J. Prev. Med. 2009, 36 (Suppl. S4), S99–S123. [Google Scholar] [CrossRef]
- Gebel, K.; Bauman, A.E.; Sugiyama, T.; Owen, N. Mismatch between perceived and objectively assessed neighborhood walkability attributes: Prospective relationships with walking and weight gain. Health Place 2011, 17, 519–524. [Google Scholar] [CrossRef]
- Sundquist, K.; Eriksson, U.; Kawakami, N.; Skog, L.; Ohlsson, H.; Arvidsson, D. Neighborhood walkability, physical activity, and walking behavior: The Swedish Neighborhood and Physical Activity (SNAP) study. Soc. Sci. Med. 2011, 72, 1266–1273. [Google Scholar] [CrossRef]
- Xu, M.; Xin, J.; Su, S.; Wang, Y.; Zhu, X.; Huang, G. Social inequalities of park accessibility in Shenzhen, China: The role of park quality, transport modes, and hierarchical socioeconomic characteristics. J. Transp. Geogr. 2017, 62, 38–50. [Google Scholar] [CrossRef]
- Wu, H. Research on the Big Data Measurement of Urban Street Walkability Based on Human-Scale: A Case Study of Nanjing Central City. Master’s Thesis, Southeast University, Nanjing, China, 2018. [Google Scholar]
- Xu, W.; Ma, H.; Cheng, Y.; Li, J. Exploring the influencing factors of vitality around Beijing subway stations. Beijing Plan. Rev. 2018, 3, 40–46. [Google Scholar]
- Cao, Z.; Gu, P.; Han, Z.; Zhang, L. Evaluation of Street Walkability and Bikeability: A Case Study of Tianjin. Urban Transp. China 2018, 16, 43–53. [Google Scholar]
- Zhang, Z.; Xu, G.; Li, W.; Chen, Y. The impact of the micro-scale built environment of historic street on visitor’s walking behaviors: A case study on Wudaoying Hutong in Beijing. Archit. J. 2019, 3, 96–102. [Google Scholar]
- Su, S.; Zhou, H.; Xu, M.; Cai, Z.; Zhi, Y.; Zhang, Y. Auditing street walkability and associated social inequalities for planning implications. J. Transp. Geogr. 2019, 74, 62–76. [Google Scholar] [CrossRef]
- Zhou, H.; He, S.; Cai, Y.; Wang, M.; Su, S. Social inequalities in neighborhood visual walkability: Using Street View imagery and deep learning technologies to facilitate healthy city planning. Sustain. Cities Soc. 2019, 46, 101605. [Google Scholar] [CrossRef]
- Long, Y.; Zhang, Z.; Li, P.; Chen, X. Key techniques in urban physical examination evaluation for Beijing Xicheng district. Beijing Plan. Rev. 2019, S2, 180–188. [Google Scholar]
- Frank, L.D.; Sallis, J.F.; Conway, T.L.; Chapman, J.E.; Saelens, B.E.; Bachman, W. Many pathways from land use to health: Associations between neighborhood walkability and active transportation, body mass index, and air quality. J. Am. Plan. Assoc. 2006, 72, 75–87. [Google Scholar] [CrossRef]
- Wu, J.; Qin, W.; Peng, J.; Zhang, L. The evaluation of walkability and daily facility distribution reasonability of Futian district, Shenzhen based on walk score. Urban Dev. Stud. 2014, 21, 49–56. [Google Scholar]
- Su, S.; Pi, J.; Xie, H.; Cai, Z.; Weng, M. Community deprivation, walkability, and public health: Highlighting the social inequalities in land use planning for health promotion. Land Use Policy 2017, 67, 315–326. [Google Scholar] [CrossRef]
- Zhou, Y.; Long, Y. Large-scale evaluation for street walkability: Methodological improvements and the empirical application in Chengdu. Shanghai Urban Plan. Rev. 2017, 1, 88–93. [Google Scholar]
- Zhang, Q. The Building of Comprehensive Evaluation Framework Centering Walkability in Zhujiang New Town Core Area and the Quantitative Studies of its Mechanism of Action. Master’s Thesis, South China University of Technology, Guangzhou, China, 2016. [Google Scholar]
- Yao, X. Study on the Walkability of Urban Streets Based on Walk Score and Population Density: A Case Study of Nanshan District, Shenzhen. Master’s Thesis, Shenzhen University, Shenzhen, China, 2018. [Google Scholar]
- Ran, S.; Xu, J. Quantitative study of urban street walkability: A case of Zhengzhou old city. Urban Archit. 2019, 16, 7–9, 20. [Google Scholar]
- Gu, H.; Zhou, K.; Wang, L. Improvement of walk score from the perspective of public health: Jing’an district of Shanghai as a case study. Urban Plan. Int. 2019, 34, 43–49. [Google Scholar] [CrossRef]
- Duncan, D.T.; Aldstadt, J.; Whalen, J.; Melly, S.J.; Gortmaker, S.L. Validation of Walk Score® for estimating neighborhood walkability: An analysis of four US metropolitan areas. Int. J. Environ. Res. Public Health 2011, 8, 4160–4179. [Google Scholar] [CrossRef]
- Dong, S.; Long, C. Community walkability measurement methodology and development strategy analysis based on fuzzy comprehensive assessment: A case study of typical communities in Chongqing. J. Hum. Settlem. West China 2015, 30, 106–112. [Google Scholar]
- Bai, Y. The Comprehensive Evaluation Walkability and Optimization Design of Nanning “San Jie Liang Xiang” Historic Conservation Block. Master’s Thesis, South China University of Technology, Guangzhou, China, 2017. [Google Scholar]
- Yao, Y. Evaluation of Chinese Cities’ Walkability. Urban Transp. China 2019, 17, 85–88, 126. [Google Scholar]
- Yang, J.; Wu, H.; Zheng, Y. Research on characteristics and interactive mechanism of street walkability through multi-source big data: Nanjing central district as a case study. Urban Plan. Int. 2019, 34, 33–42. [Google Scholar] [CrossRef]
- Liu, B. Research on the Walkability of Beijing Historical and Cultural Districts Based on Multi-Source Data. Master’s Thesis, Beijing University of Technology, Beijing, China, 2020. [Google Scholar]
- Qin, J.; Feng, Y.; Sheng, Y.; Liu, C.; Zhang, J. Evaluation of pedestrian-perceived comfort on urban streets using multi-source data: A case study in Nanjing, China. ISPRS Int. J. Geo-Inf. 2025, 14, 63. [Google Scholar] [CrossRef]
- Wuhan Natural Resources and Urban-Rural Development Bureau. Planning System for Historical and Cultural Districts and Streetscape Zones in Wuhan’s Main Urban Area. 2013. Available online: https://zrzyhgh.wuhan.gov.cn/zwgk_18/fdzdgk/ghjh/zzqgh/202001/t20200107_602819.shtml (accessed on 10 April 2025).
- Lin, L.; Fan, Y.; Yang, Y.; Chen, X. Walking distance threshold of older adults and its influencing factors in Guangzhou from the perspective of health. Mod. Urban Res. 2022, 2, 1–9. [Google Scholar]
- Ministry of Housing and Urban-Rural Development of the People’s Republic of China. Urban Residential Area Planning and Design Standards. 2018. Available online: https://www.mohurd.gov.cn/gongkai/zc/wjk/art/2018/art_17339_238590.html (accessed on 10 April 2025).
- Ministry of Housing and Urban-Rural Development of the People’s Republic of China. Guidelines for Building Complete Communities. 2021. Available online: https://www.gov.cn/zhengce/zhengceku/2022-01/12/content_5667815.htm (accessed on 10 April 2025).
- Li, S. Research on Evaluation of Walk Score of Street Block in Historic Areas. Master’s Thesis, Huazhong Agricultural University, Wuhan, China, 2022. [Google Scholar]
- Fang, J. Research of Walking Accessibility Based on POI in Nanshan District, Shenzhen. Master’s Thesis, Harbin Institute of Technology, Harbin, China, 2017. [Google Scholar]
- Song, W. Study on the Walkability Environment of Urban Blocks Based on Multi-Source Data Analysis: A Case Study of Xueyuanlu Sub-District in Beijing. Master’s Thesis, Beijing Forestry University, Beijing, China, 2021. [Google Scholar]
- Zhang, L.; Liang, T.; Wei, X.; Wang, H. An improved indicator standardization method for multi-indicator composite evaluation: A case study in the evaluation of ecological civilization construction in China. Environ. Impact Assess. Rev. 2024, 108, 107600. [Google Scholar] [CrossRef]
- Wei, Z.; Cao, K.; Kwan, M.-P.; Jiang, Y.; Feng, Q. Measuring the age-friendliness of streets’ walking environment using multi-source big data: A case study in Shanghai, China. Cities 2024, 148, 104829. [Google Scholar] [CrossRef]
- People’ s Government of Jiang’an District, Wuhan. The 13th Five-Year Plan for Urban Road Construction in Jiang’an District. 2017. Available online: https://www.jiangan.gov.cn/jaxxw/zfxxgk/zc_41333/qtzdgkwj/qzfwj/202010/t20201027_1478199.shtml (accessed on 10 April 2025).
- Yin, D.; Hirata, T. Comprehensive comparative analysis and innovative exploration of green view index calculation methods. Land 2025, 14, 289. [Google Scholar] [CrossRef]
- Zheng, Z.; Sun, N.; Chen, H.; Liu, Y.; Wu, Y. Exploring the association between openness scale of campus street spaces, street greenery, campus walkabilitsaay and physical activity of college students. J. Transp. Health 2024, 38, 101897. [Google Scholar] [CrossRef]


| Evaluation Dimension | Evaluation Indicator |
|---|---|
| Connectivity | 1. Intersection density; 2. Street network density; 3. Linearity of walking routes; 4. Pedestrian accessibility; 5. Global integration; 6. Local integration; 7. Mean depth value; 8. Choice; 9. Pedestrian continuity; 10. Relative walking width; 11. Average pedestrian segment length; 12. Network legibility; 13. Block betweenness centrality; 14. Entrance and exit convenience |
| Convenience | 1. Functional density; 2. Functional mix; 3. Functional accessibility; 4. Functional completeness; 5. Functional satisfaction; 6. Public transport convenience; 7. Linearity of walking routes; 8. Signage and wayfinding; 9. Parking facility density; 10. Crossing facility density; 11. Potential destination density |
| Safety | 1. Motorized traffic impact; 2. Nighttime illumination; 3. Pedestrian safety; 4. Pedestrian density; 5. Proportion of high-risk buildings; 6. Pedestrian crossing facilities; 7. Accessibility facilities; 8. Sidewalk encroachment ratio; 9. Presence of sidewalks; 10. Accident rate; 11. Urban road signage and markings; 12. Street security |
| Comfort | 1. Green view index; 2. Sky view factor; 3. Street height-to-width ratio; 4. Building alignment ratio; 5. Air quality; 6. Street gradient; 7. Facade transparency; 8. Facade complexity; 9. Pavement comfort; 10. Environmental noise; 11. Resting space density; 12. Environmental satisfaction |
| Coordination | 1. Proportion of historical facade interfaces; 2. Municipal facility incongruity; 3. Wayfinding signage uniqueness; 4. Street furniture coordination; 5. Street color coordination; 6. Coordination of advertising and promotional facilities |
| Analysis Dimension | Evaluation Index | Quantitative Method | Metric Attributes | Formulas | Formula Explanation |
|---|---|---|---|---|---|
| Connectivity | Integration (INT) | Space Syntax | Positive | i is the current spatial unit; n is the total number of spatial units; d(i, j) is the shortest path distance from spatial unit i to j | |
| Choice (Ch) | Space Syntax | Positive | i is the current spatial unit; j is another spatial unit; d(i, j) is the shortest path distance from spatial unit i to j | ||
| Relative Walking Width (RWW) | Mathematical Calculation | Positive | Sn is the actual walkable area available to pedestrians; L is the total length of the street | ||
| Pedestrian Spatial Continuity (PSC) | Semantic Segmentation | Positive | σw is the standard deviation of the proportion of sidewalk pixels in all street view images within the street coverage area | ||
| Convenience | Public Transport Index (PTI) | GIS | Positive | L is the total length of the street; ti is the time cost required to reach a public transportation station from the i-th street segment; li is the length of the i-th street segment | |
| POI Density (PD) | GIS | Positive | Npoi is the number of POIs within the street buffer zone; L is the total length of the street | ||
| POI Accessibility (PA) | GIS | Positive | min is the minimum (shortest) path distance; wi is the length of each segment in the road network; n is the total number of segments in the path | ||
| POI Function Mix (PFM) | GIS | Positive | n is the category of service facilities on the street; Pi is the proportion of a specific type of POI on the street relative to the total number of POIs on that street | ||
| Safety | Vehicle Interference Index (VII) | Semantic Segmentation | Negative | ∑Vi is the total number of pixels corresponding to vehicles (including cars, motorcycles, and bicycles) in the image; An is the total number of pixels in the n-th image | |
| Nighttime Illuminance (NI) | Mathematical Calculation | Positive | n is the number of sampling points; Ei is the nighttime illuminance value at the i-th sampling point | ||
| Sidewalk Encroachment Index (SEI) | Mathematical Calculation | Negative | Le is the length of the encroached sidewalk; L is the total length of the street | ||
| Pedestrian Surveillance Index (PSI) | Semantic Segmentation | Positive | Pn is the number of pedestrian pixels in the n-th image; An is the total number of pixels in the n-th image | ||
| Comfort | Green View Index (GVI) | Semantic Segmentation | Positive | Gn is the number of vegetation pixels in the n-th image; An is the total number of pixels in the n-th image | |
| Sky View Factor (SVF) | Semantic Segmentation | Positive | Sn is the number of sky pixels in the n-th image; An is the total number of pixels in the n-th image | ||
| Facade Transparency (FT) | Semantic Segmentation | Positive | Bn is the number of building pixels in the n-th image; Wn is the number of wall pixels in the n-th image | ||
| Resting Facility Density (RFD) | Semantic Segmentation | Positive | Rn is the number of resting facility pixels in the n-th image; An is the total number of pixels in the n-th image | ||
| Coordination | Heritage Facade Ratio (HFR) | Mathematical Calculation | Positive | Lhf is the length of street interfaces that conform to the historical character of the district; L is the total length of the street | |
| Municipal Facility Incongruity (MFI) | Mathematical Calculation | Negative | Nmf is the number of municipal facilities that do not conform to the historical character of the district; L is the total length of the street | ||
| Wayfinding Signage Uniqueness (WSU) | Mathematical Calculation | Positive | Nws is the number of wayfinding signs that conform to the historical character of the district; L is the total length of the street |
| Facility Category | Facility Subcategory |
|---|---|
| Public Service Facilities | 1. Secondary school; 2. Primary school; 3. Kindergarten; 4. Sports venue or national fitness center; 5. Mother-and-baby room; 6. Elderly care home; 7. Cultural activity center; 8. Community service center |
| Commercial Service Facilities | 1. Fresh food market; 2. Shopping mall or supermarket; 3. Convenience store; 4. Catering facilities; 5. Bank branch; 6. Telecommunications service outlet; 7. Postal service outlet; 8. Beauty and hair salon; 9. Laundry shop; 10. Repair station; 11. Leisure and entertainment facilities |
| Transportation Hubs | 1. Rail transit station; 2. Bus stop; 3. Parking lot |
| Basic Supporting Facilities | 1. Public toilet; 2. Charging facility; 3. Emergency shelter facility |
| Medical Service Facilities | 1. General hospital; 2. Specialized hospital; 3. Clinic; 4. Pharmacy |
| Scenic Spots and Historic Sites | 1. Park; 2. Public square; 3. Historical and cultural site |
| Public Administration Facilities | 1. Government agency; 2. Social organization |
| Goal Layer | Criterion Layer | Weight | Indicator Layer | Weight |
|---|---|---|---|---|
| Street walkability assessment | Connectivity | 0.2054 | Integration (INT) | 0.1821 |
| Choice (Ch) | 0.2507 | |||
| Relative Walking Width (RWW) | 0.2254 | |||
| Pedestrian Spatial Continuity (PSC) | 0.3418 | |||
| Convenience | 0.1988 | Public Transport Index (PTI) | 0.3395 | |
| POI Density (PD) | 0.1589 | |||
| POI Accessibility (PA) | 0.3361 | |||
| POI Function Mix (PFM) | 0.1655 | |||
| Safety | 0.2515 | Vehicle Interference Index (VII) | 0.3237 | |
| Nighttime Illuminance (NI) | 0.2843 | |||
| Sidewalk Encroachment Index (SEI) | 0.2966 | |||
| Pedestrian Surveillance Index (PSI) | 0.0954 | |||
| Comfort | 0.2111 | Green View Index (GVI) | 0.2241 | |
| Sky View Factor (SVF) | 0.3619 | |||
| Facade Transparency (FT) | 0.1028 | |||
| Resting Facility Density (RFD) | 0.3112 | |||
| Coordination | 0.1332 | Heritage Facade Ratio (HFR) | 0.5961 | |
| Municipal Facility Prominence (MFP) | 0.1907 | |||
| Wayfinding Signage Uniqueness (WSU) | 0.2132 |
| Street Name | Pedestrian Environment | Sidewalk | Municipal Facilities | Service Facilities |
|---|---|---|---|---|
| Yanjiang Blvd |  | 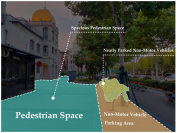 | 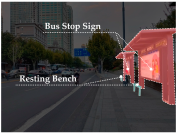 | 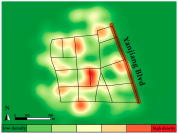 |
| GVI = 0.3185 VII = 0.0509 | RWW = 5.8951 PSC = 16.9022 | MFI = 0.0479 | PD = 0.1205 PA = 6872.6125 | |
| Zhongshan Blvd | 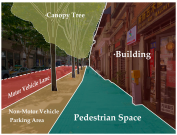 | 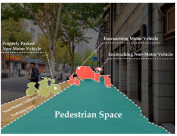 | 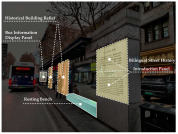 |  |
| GVI = 0.2207 VII = 0.1655 | RWW = 4.4389 PSC = 12.8409 | MFI = 0.0299 | PD = 0.3094 PA = 10,517.6925 |
| Street Name | Sidewalk | Street Facade | Service Facilities | |
|---|---|---|---|---|
| Chezhan Rd | 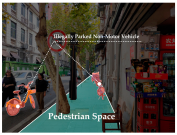 | 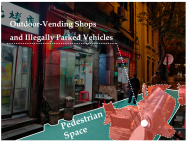 | 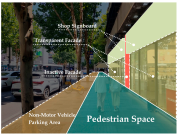 | 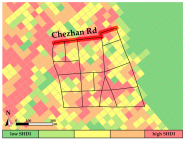 |
| RWW = 2.2364; PSC = 11.6901; SEI = 0.3922 | FT = 44.4532 NI = 60.6157 | PD = 0.2011 PFM = 1.8142 | ||
| Hezuo Rd | 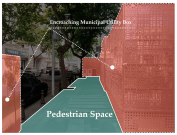 | 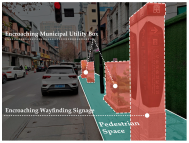 | 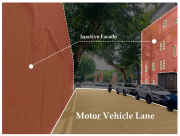 |  |
| RWW = 1.9897; PSC = 10.9271; SEI = 0.4134 | FT = 27.5362 NI = 26.5543 | PD = 0.2945 PFM = 1.4998 | ||
| Street Name | Pedestrian Environment/ Sidewalk | Street Facade | Service Facilities |
|---|---|---|---|
| Lihuangpi Rd | 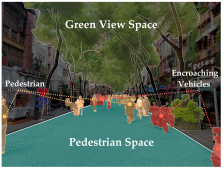 | 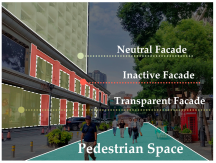 | 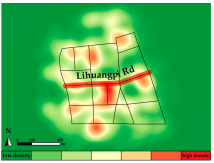 |
| GVI = 0.3125; PSI = 0.0453 RWW = 6.6777; PSC = 19.6991 | FT = 158.1606 | PD = 0.2384 | |
| Lanling Rd |  |  |  |
| GVI = 0.1162; PSI = 0.0258 RWW = 3.3451; PSC = 13.5388 | FT = 86.5397 | PD = 0.3357 |
| Problem Illustration | Street View | Problem Description | Optimization Strategy Illustration | Optimization Strategy |
|---|---|---|---|---|
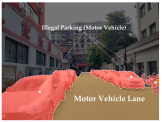
 |  | Illegal vehicle parking on sidewalks |  | Integrate seating with bike parking to regulate disorderly parking and prevent vehicle encroachment |
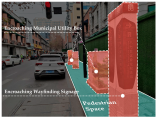
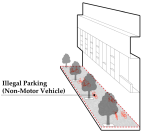 |  | Sidewalk too narrow for non-motor vehicle parking | 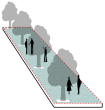 | Implement traffic control to restrict non-motor vehicle parking and restore pedestrian space |
 |  | Redundant municipal utility boxes on sidewalks | 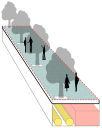 | Relocate utility boxes and pipelines underground to free sidewalk space |
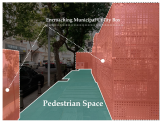
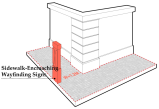 |  | Wayfinding signage occupying the sidewalk | 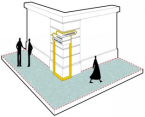 | Move signage to facades to free sidewalk space |
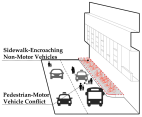 |  | Discontinuous sidewalks with non-motor vehicle encroachment and pedestrian–motor vehicle conflict | 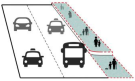 | Use tidal lane management to temporarily convert part of the motor vehicle lane into pedestrian space during peak non-motor traffic hours |
 | 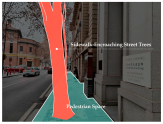 | Street trees encroaching on pedestrian space | 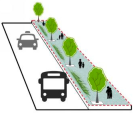 | Replace large-diameter trees with hierarchical greening to reduce motor vehicle impact on pedestrian activity without lowering GVI |
| Problem Description | Diagram of Issues and Strategies | Optimization Strategy |
|---|---|---|
| Excessive GVI and low SVF | 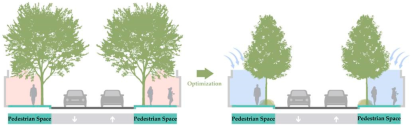 | Replace large-canopy trees with a greening system of small trees, shrubs, and groundcover to maintain an appropriate GVI while improving SVF |
| Excessive SVF and low GVI | 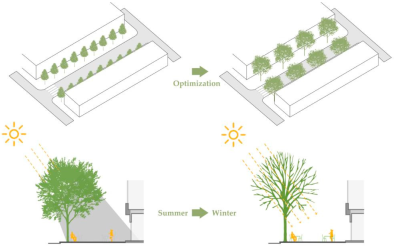 | Replace small high-density trees with large low-density trees (e.g., plane trees) to provide summer shade and allow winter sunlight in pedestrian spaces |
| Excessive GVI and low NI | 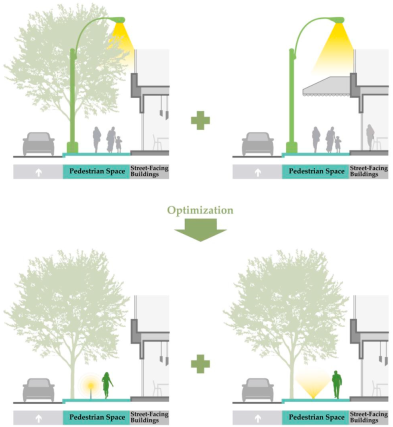 | Tree canopies and awnings block lighting; low-mounted fixtures help restore nighttime illumination |
| Low FT and NI | 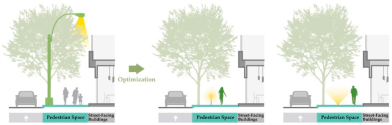 | Closed facades and high windows limit indoor light spill; open ground-floor interfaces enhance street illumination |
| Low FT |  | Shops, supermarkets, and restaurants can enhance facade transparency through glass curtain walls, while historic buildings can reduce inactive facades by refining facade details |
Disclaimer/Publisher’s Note: The statements, opinions and data contained in all publications are solely those of the individual author(s) and contributor(s) and not of MDPI and/or the editor(s). MDPI and/or the editor(s) disclaim responsibility for any injury to people or property resulting from any ideas, methods, instructions or products referred to in the content. |
© 2025 by the authors. Licensee MDPI, Basel, Switzerland. This article is an open access article distributed under the terms and conditions of the Creative Commons Attribution (CC BY) license (https://creativecommons.org/licenses/by/4.0/).
Share and Cite
She, H.; Sun, J.; Zeng, Y.; Tu, W.; Ao, G.; Shang, W. Walkability Evaluation of Historical and Cultural Districts Based on Multi-Source Data: A Case Study of the Former Russian Concession in Hankou. Buildings 2025, 15, 1603. https://doi.org/10.3390/buildings15101603
She H, Sun J, Zeng Y, Tu W, Ao G, Shang W. Walkability Evaluation of Historical and Cultural Districts Based on Multi-Source Data: A Case Study of the Former Russian Concession in Hankou. Buildings. 2025; 15(10):1603. https://doi.org/10.3390/buildings15101603
Chicago/Turabian StyleShe, Haoran, Jing Sun, Yuchen Zeng, Wenyu Tu, Guang Ao, and Wei Shang. 2025. "Walkability Evaluation of Historical and Cultural Districts Based on Multi-Source Data: A Case Study of the Former Russian Concession in Hankou" Buildings 15, no. 10: 1603. https://doi.org/10.3390/buildings15101603
APA StyleShe, H., Sun, J., Zeng, Y., Tu, W., Ao, G., & Shang, W. (2025). Walkability Evaluation of Historical and Cultural Districts Based on Multi-Source Data: A Case Study of the Former Russian Concession in Hankou. Buildings, 15(10), 1603. https://doi.org/10.3390/buildings15101603