Article

Digital Twin-Enabled Building Information Modeling–Internet of Things (BIM-IoT) Framework for Optimizing Indoor Thermal Comfort Using Machine Learning

1
Department of Sustainable Resources Management, State University of New York College of Environmental Science and Forestry, Syracuse, NY 13210, USA
2
Department of Mechanical and Aerospace Engineering, Syracuse University, Syracuse, NY 13244, USA
*
Author to whom correspondence should be addressed.
Buildings 2025, 15(10), 1584; https://doi.org/10.3390/buildings15101584
Submission received: 4 April 2025 / Revised: 3 May 2025 / Accepted: 6 May 2025 / Published: 8 May 2025
(This article belongs to the Special Issue Energy Consumption and Environmental Comfort in Buildings)

Abstract

As the world moves toward a low-carbon future, a key challenge is improving buildings’ energy performance while maintaining occupant thermal comfort. Emerging digital tools such as the Internet of Things (IoT) and Building Information Modeling (BIM) offer significant potential, enabling precise monitoring and control of building systems. However, integrating these technologies into a unified Digital Twin (DT) framework remains underexplored, particularly in relation to thermal comfort. Additionally, real-world case studies are limited. This paper presents a DT-based system that combines BIM and IoT sensors to monitor and control indoor comfort in real time through an easy-to-use web platform. By using BIM spatial and geometric data along with real-time data from sensors, the system visualizes thermal comfort using a simplified Predicted Mean Vote (sPMV) index. Furthermore, it also uses a hybrid machine learning model that combines Facebook Prophet and Long Short-Term Memory (LSTM) to predict the future indoor environmental parameters. The framework enables Model Predictive Control (MPC) while providing building managers with a scalable tool to collect, analyze, visualize, and optimize thermal comfort data in real time.

1. Introduction

The building sector is a significant contributor to global energy consumption and environmental pollution, accounting for over 40% of global energy use and 33% of greenhouse gas emissions [1]. Energy consumption in buildings is mainly driven by Heating, Ventilation, and Air Conditioning (HVAC) systems, lighting, domestic hot water systems, and electronic appliances. Among these, HVAC systems are the most energy-intensive, often consuming the largest share of a building’s total energy expenditure. HVAC systems are responsible for maintaining indoor thermal comfort, a critical factor considering people spend around 90% of their time indoors, with 70% of that time in residential settings. The International Energy Agency (IEA) reports approximately 3.6 billion cooling systems are currently in use globally, with an expected 400% increase by 2050. Enhancing HVAC efficiency could save 1300 gigawatts of energy. However, reducing HVAC energy use cannot be achieved simply by lowering system operation (e.g., reducing operating hours or lowering temperature setpoints beyond the required), as thermal comfort and energy consumption are deeply interdependent and complex [2]. Consequently, HVAC systems, while essential for comfort, often result in higher energy costs, contributing significantly to overall building energy consumption.
Recent research in the built environment focuses on integrating Building Information Modeling (BIM) with Internet of Things (IoT) technologies to optimize building performance through the Digital Twin (DT) concept in different domains, i.e., photovoltaic (PV) system monitoring [3], HVAC optimization, lighting control, and occupancy-based energy management [4]. BIM’s integration with IoT allows for dynamic digital representations of physical buildings, enabling real-time data exchange between the physical and digital replicas, which facilitates enhanced monitoring, management, and optimization of building systems [5]. By adding thermal comfort indices into the BIM model and DT platform, real-time data on factors like air temperature, humidity, and air velocity can be used to optimize HVAC operations. Such integration could lead to the emergence of the DT concept to maintain indoor thermal comfort and energy efficiency of buildings as an essential innovation in the built environment (BE), enabling more accurate simulations, predictive maintenance, and the optimization of HVAC systems.
Despite significant advancements in DT technology across industries such as manufacturing, healthcare, and transportation, its adoption in the BE, specifically for thermal comfort assessment and HVAC control, remains in its early stages [6]. While the American Society of Heating, Refrigerating, and Air-Conditioning Engineers (ASHRAE) Standard 55 provides guidelines for thermal comfort assessment using traditional models like the Predicted Mean Vote (PMV), its adoption in a DT environment presents substantial challenges [7]. The PMV model relies on a range of inputs, including air dry bulb temperature, mean radiant temperature, humidity, air velocity, clothing insulation, and metabolic rate, which are difficult to monitor in real time [8,9]. Even if such devices are developed to monitor all these parameters in real time, the setup will be costly, and not just to develop but in maintenance as well. Therefore, traditional Building Automation and Control (BAC) systems often prioritize temperature regulation over the thermal comfort index, neglecting the occupants’ thermal comfort needs [10]. Existing research has aimed to develop enhanced models and indices for assessing thermal comfort that are more adaptable to real-world applications; however, the challenge of integrating these models with DT environments persists. Despite ongoing efforts to implement advanced technologies in BE like BIM, IoT, and Machine Learning (ML), combining these tools into a DT platform to effectively to optimize both thermal comfort and energy efficiency remains a significant challenge.
To address these issues, this study extends the DT concept to BE for thermal comfort optimization by developing a virtual model of a physical building for remote real-time monitoring and management of indoor environments. The main purpose of this study is to develop a DT-based framework that integrates BIM-IoT and ML to monitor and predict real-time thermal comfort in the BE, aiming to improve occupant thermal comfort and optimize HVAC operations. By integrating BIM and IoT technologies and utilizing predictive tools for time series analysis, the research develops a web-based DT platform. This platform allows users to remotely monitor thermal comfort parameters and the simplified Predicted Mean Vote (sPMV) index in real time within a BIM environment. Furthermore, the recorded data are also processed using ML algorithms, which predict optimal thermal conditions and the PMV index based on observed trends and seasonal variations. Based on these predictions, the system dynamically adjusts the Air Conditioning (AC) setpoint to optimize occupant comfort.
The DT framework developed in this study is based on open-source tools, enabling the real-time calculation, prediction, and visualization of thermal comfort indices within a BIM environment. For thermal comfort assessment, the framework utilizes simplified sPMV models, which, as demonstrated in recent studies, offer a more practical easily adoptable and justifiable approach by requiring fewer inputs [11]. This simplification further enhances the adoption of ML in DT environments [12], and its integration with DT technologies improves the effectiveness and adaptability of the sPMV models for real-time monitoring and prediction [13]. This combination supports human-centered HVAC systems, which prioritize occupant comfort [14]. As global energy demands rise due to HVAC operations, adopting open-source tools is also equally important [15]. Open-source tools are cost-effective and offer flexible solutions that promote customization, open standards, and interoperability, making them highly valuable for developing countries by enabling a broader range of users to adapt [16]. The experimental study conducted is proof of concept that the developed framework allows facility managers and owners to make informed adjustments, improving occupant thermal comfort remotely in a DT environment. This research demonstrates the feasibility of scalable DT-driven building management solutions for thermal comfort management, promoting the adoption of cost-effective digital solutions for wide adoption globally.
The rest of the paper is organized as follows: Section 2 reviews the relevant literature on thermal comfort models, ML algorithms, and DT frameworks, establishing the context for the research. Section 3 highlights the unique aspects and purpose of the proposed framework. The approach, detailed in Section 4, discusses the development of a BIM-based DT platform, integrating IoT monitoring, a real-time database, and a user interface, along with thermal comfort modeling and ML-based prediction. Section 5 showcases the setup for the experimental study. Section 6 discussed the results, demonstrating the system’s precision and an actual implementation of the methodology. Section 7 presents key discussions, this study’s limitations, and future directions. Finally, Section 8 provides concluding remarks for this research.

2. Background

2.1. Thermal Comfort Models

The ASHRAE defines thermal comfort as a state of mind that indicates satisfaction with the thermal environment and is evaluated subjectively [17]. Thermal comfort models have evolved over the years to address the complex interplay between environmental conditions and human thermal sensations. The most widely recognized model in this field is the model proposed by Fanger. The PMV index determined by this model depends on a variety of physiological and environmental variables like clothing insulation, metabolic rate, air velocity, mean radiant temperature, indoor temperature, and relative humidity. Equation (1) can be used to compute the PMV index [18]. The second metric, Predicted Percentage of Dissatisfied (PPD), provides a numerical estimate of the proportion of occupants who will feel uncomfortable at a specific temperature [19]. Figure 1 shows the typical relationship between PMV and PPD [20].
P M V = [ 0.303 × e 0.036 M + 0.028 ] × { ( M W ) 3.05 × 10 3 × [ 5733 6.99 × ( M W ) P a ] 0.42 × [ ( M W ) 58.15 ] 1.7 × 10 5 × M × ( 5867 P a ) 0.0014 × M × ( 34 t a ) 3.96 × 10 8 × f c l × [ ( t c l ( t ] f c l × h c × ( t c l t a ) }
where PMV is the index of thermal comfort; M shows the metabolic rate (W/m2), indicating the body’s energy expenditure; W represents effective mechanical power (W/m2), and water vapor pressure is denoted by Pa (Pa), while ta indicates the air temperature (°C) and tr represents the mean radiant temperature (°C). The clothing area ratio fcl describes the proportion of the body covered by clothing; tcl signifies the temperature of the clothing’s outer surface (°C). Lastly, hc is the convection heat transfer coefficient (W/(m2·K)).
Despite the adoption of Fanger’s PMV model by various standards, it often falls short in real-world applications due to its extensive data requirements and its reliance on high-precision sensors [20,21]. Accurately measuring all the parameters required for Fanger’s model requires specialized and costly equipment that may not be feasible or available in all environments. The deployment of these sensors, even for a single location, is expensive, and many of them require regular calibration to maintain accuracy, adding to operational and maintenance costs. To address this, researchers have developed thermal models suited for real-world scenarios that work with limited data. Kim et al. [22] created a Personal Comfort Model (PCM) that predicts individual thermal comfort using IoT and ML. Although PCMs consider individual physiology and sensations, they face challenges due to the subjective nature of thermal comfort and the need for multiple sensors. Buratti et al. [11] developed an sPMV that evaluates thermal comfort by measuring only temperature and humidity. The sPMV model improves the Rohles model by extending its applicability to a wider range of clothing insulation values (0.25–1.65 clo) while requiring only air temperature and relative humidity measurements. It provides a more accurate PMV estimation, with separate equations for men, women, and combined groups across different insulation ranges, reducing errors and improving reliability. The model achieves a mean standard deviation of 0.22, ensuring a consistent ±0.2 variation in PMV calculations, making it a reliable tool for thermal comfort assessment. Its simplified approach is particularly useful for DT applications where only limited environmental data are available in real time.

2.2. Machine Learning Algorithms in Predicting Thermal Comfort
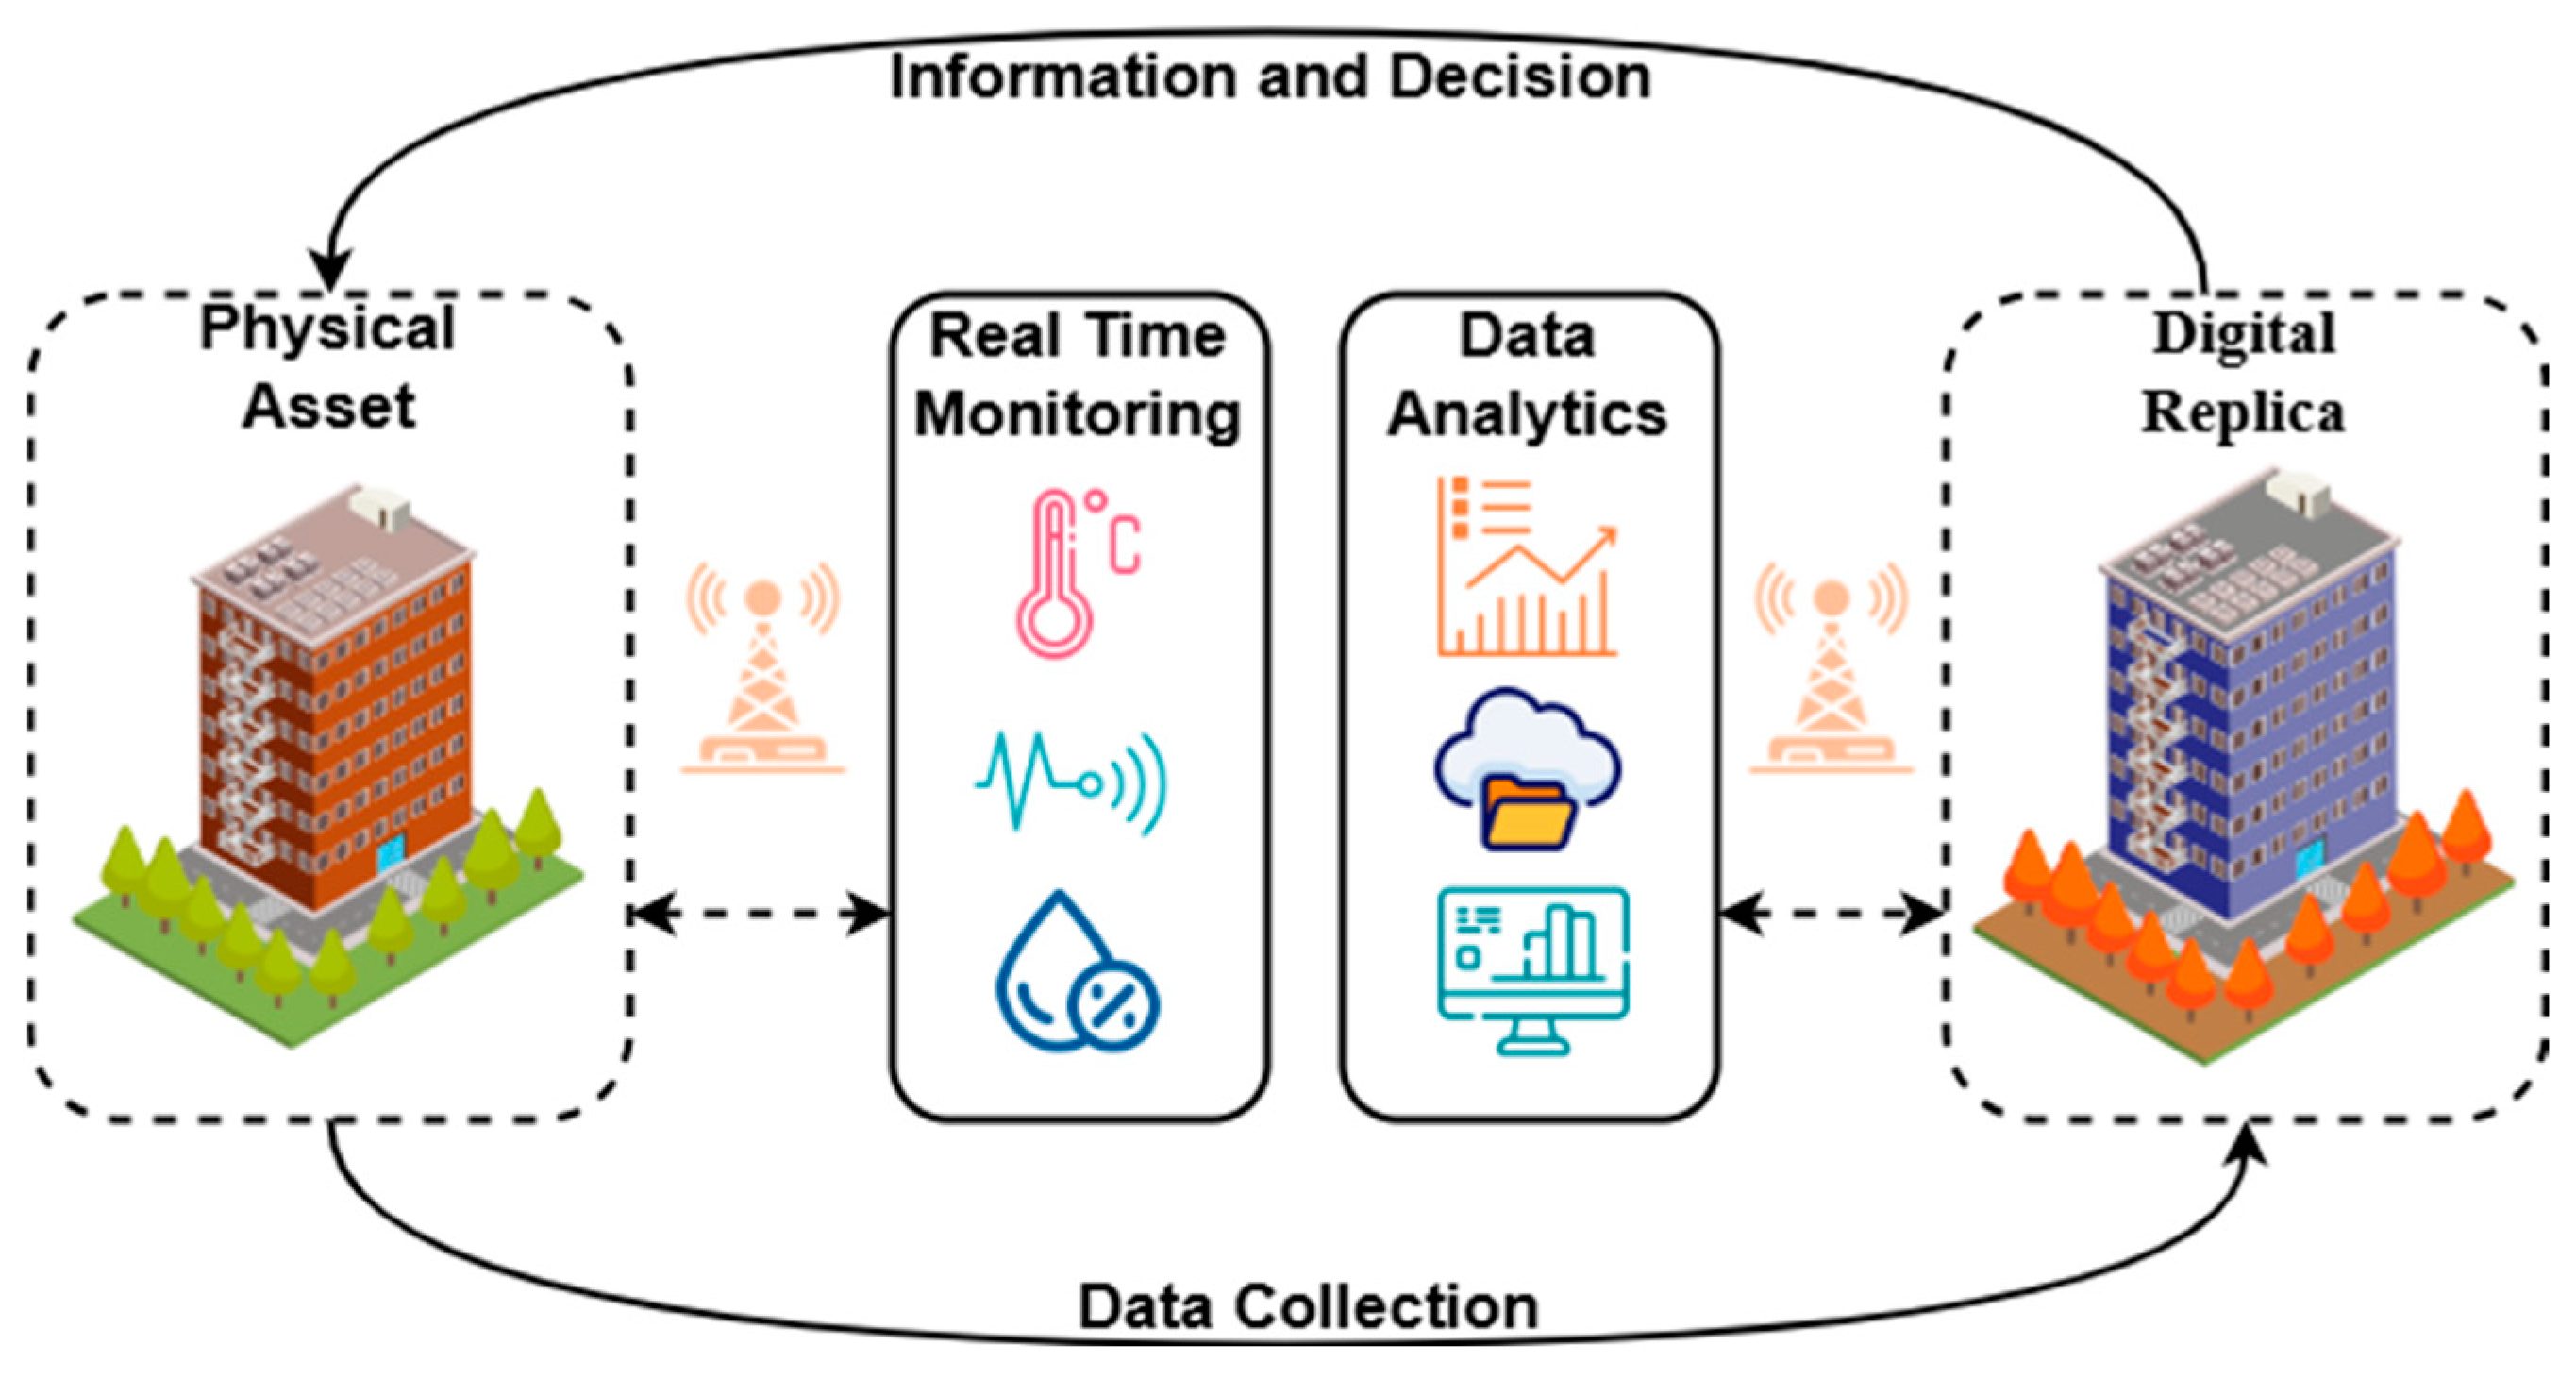
Advances in ML have progressively enhanced the accuracy of thermal comfort predictions. Early studies primarily relied on Support Vector Machines (SVMs) and traditional regression models, but with the increasing availability of complex datasets, researchers have shifted toward more advanced techniques. Long Short-Term Memory (LSTM) networks gained prominence due to their ability to handle sequential data, making them particularly effective for time-series forecasting. More recently, Artificial Neural Networks (ANN) and ensemble learning methods, such as Gradient Boosting, Decision Tree (DT), and Random Forest (RF), have been widely adopted for their ability to capture nonlinear relationships and improve predictive performance [23,24]. Over time, these models have demonstrated significant improvements in key metrics such as accuracy, F1 score, precision, and recall, making them increasingly effective for optimizing HVAC control and thermal comfort assessment [25,26]. For instance, Zhang et al. [27,28] developed a thermal comfort model using an enhanced Random Forest and Bayesian meta-learning approach for PCM, while Chai et al. [29] predicted thermal comfort votes using ANN. According to Fard et al. [30] and Fathi et al. [31], the most commonly used models in thermal comfort prediction algorithms are ANN, SVM, and ensemble learning methods. This preference is largely influenced by the nature of the available data, as many studies rely on ASHRAE dataset II and Fanger’s PMV model, which are often supplemented with questionnaire-based survey responses to capture subjective thermal comfort feedback.
Since the choice of an ML model depends on the type of data used for training and testing, this study specifically focuses on the sPMV thermal comfort assessment model in real-time settings. The data collected in this study are time-series data, characterized by temporal dependencies, seasonality, and trends that require models capable of capturing such dynamics. While traditional models like ARIMA, SARIMA, and gradient boosting methods have been applied to time-series forecasting, they often fall short in capturing complex nonlinear patterns inherent in environmental data [32,33]. However, recent research in the domain of ML highlights that models like FB Prophet and LSTM as more effective solutions for time series data forecasting due to their ability to model seasonality and long-term dependencies. Consequently, integrating FB Prophet and LSTM into thermal comfort prediction frameworks offers a promising pathway to optimize HVAC systems and improve occupant comfort. Nevertheless, the integration of ML-based thermal comfort models with traditional PMV models remains an active area of research, continually aiming to enhance predictive accuracy and operational efficiency.

2.3. Digital Twin

As ML and PMV models pave the way for improved thermal comfort models, DT technology offers the BE sector a powerful framework for real-time data monitoring, asset tracking, maintenance, and energy optimization. DT technology has gained more rapid acceptance in AEC sectors than BE, with the construction industry adopting innovative technologies faster, while the BE sector has been slower to evolve [34,35,36]. Nevertheless, DT hold transformative potential for the BE sector due to its ability to make data-driven decisions throughout an asset’s lifecycle. Recent studies highlight this potential. Hasamo et al. [37] developed a DT framework for HVAC systems that integrates BIM and real-time data to optimize energy use and thermal comfort. However, the study uses BMS sensor data and ANN for prediction, while effective, ANN may not capture long-term patterns. Additionally, it relies on proprietary software like MATLAB R2022a and Autodesk Revit 2022, making it an expensive option. It also lacks a user-centric interface for facility managers or occupants to interact with the system, limiting accessibility and making it less cost-effective for broader adoption. Lydon et al. [38] developed a DT-centric thermal design for a lightweight roof structure, optimized for renewable geothermal energy, covering the entire building simulation during both design and operational phases. Similarly, ElArwady et al. [39] applied DT approaches to model indoor environments, using Autodesk Forge as an online viewer for BIM models. However, the study did not consider any thermal comfort assessment index, limiting its ability to quantitatively evaluate occupant comfort. Shahinmoghadam et al. [40] combined BIM, IoT, and Virtual Reality (VR) to develop an immersive application designed for real-time monitoring of thermal comfort. The prototype, tested in a controlled environment, demonstrated a strong correlation between the system’s output and the observed thermal sensations of users. However, the use of Augmented Reality (AR) and Virtual Reality (VR) technologies may lead to increased implementation of costs at actual project sites.
The literature review highlights that much of the existing research remains fragmented, focusing separately on BIM, ML, or thermal comfort indices without utilizing their combined potential. Studies that attempt integration often rely on proprietary software, which presents challenges related to scalability, cost, and interoperability. The lack of integration between different software and real-time data feeds further limits the development of adaptive, closed-loop control systems necessary for dynamically optimizing thermal comfort [41]. Despite advancements in tools and models for improving thermal comfort and energy efficiency, most research still relies on the Fanger PMV model as the foundational framework, which lacks adaptability for real-time, data-driven decision-making. To meet the evolving demands of the construction industry and digital automation, linking thermal comfort indices with BIM tools in the context of DT is essential. Models such as sPMV offer greater flexibility and accuracy, as they can be more effectively integrated with ML algorithms and DT platforms, enabling predictive control and enhanced occupant comfort [42,43].
This study introduces a novel framework that integrates thermal comfort indices into a DT platform built using BIM and enhanced by real-time data from IoT sensors. This integration allows for dynamic monitoring of and adjustments to indoor thermal conditions based on real-time data. Traditional BMSs often lack the ability to dynamically adjust thermal comfort index in real time, which leads to inefficiencies in energy consumption and occupant discomfort. The proposed approach addresses this gap by enabling continuous monitoring of environmental parameters such as temperature and humidity through real-time IoT data. This remote real-time integration allows for more accurate assessments of thermal comfort and facilitates dynamic adjustments to HVAC systems, optimizing occupant thermal comfort [44]. A key novelty of this study is the integration of a thermal comfort index sPMV into the DT platform, enabling real-time thermal comfort assessments in large-scale BMSs. By incorporating machine learning models for predictive analytics, the system can also forecast thermal comfort changes, facilitating proactive HVAC control. This approach significantly enhances occupant satisfaction by maintaining optimal thermal conditions. To ensure optimal system performance, digital solutions were selected based on specific criteria, including cost-effectiveness, interoperability, scalability, and support for real-time data handling. Platforms such as Firebase were selected for their robust capabilities in managing real-time sensor data streams, while IFC.js, an open-source library, was used for web-based 3D BIM visualization. BIM integration followed openBIM standards to ensure flexibility and system compatibility. Key performance indicators (KPIs) for the system included system responsiveness, ease of user thermal comfort assessment, data accuracy, scalability, and cost effectiveness. The use of open-source tools and cost-effective IoT devices ensures the scalability and accessibility of the solution, making it applicable in diverse environments, including regions with limited resources [45].

3. Research Aim

With rising energy demands driven by an increase in cooling appliances, researchers have focused on developing and implementing digital technologies to optimize HVAC system operations. However, these efforts often concentrate on isolated applications, such as PMV models or the use of IoT sensors, without fully exploring the potential for a comprehensive, real-time framework that works throughout the building lifecycle [46]. While DT and ML hold significant promise for enhanced predictive capabilities through the integration of ML and IoTs, their application within open-source BIM platforms is not widely addressed. This limitation hinders the broader implementation of DT solutions, particularly in contexts where cost and accessibility are critical factors. To address these research gaps, this study aims to develop an integrated system that uses open-source tools, real-time IoT data, and advanced ML algorithms for optimizing indoor environments. The specific objectives are as follows:
  • To create a web-based, open-source, user-friendly platform integrated with IoT sensors for the real-time monitoring and visualization of thermal comfort indices in a BIM environment.
  • To improve thermal comfort assessments by employing ML algorithms such as LSTM networks and FB Prophet, enabling the prediction and maintenance of optimal indoor conditions tailored according to the user’s custom preferences.
  • To establish a DT framework that facilitates automated dynamic control and optimization of HVAC preventing it from becoming over-controlled, as excessive temperature adjustments and compressor cycling can lead to high power consumption without achieving optimal thermal comfort.

4. Materials and Methods

This study employs a design science research approach, involving the development of an integrated IoT-based system, experimental data collection, and predictive modeling to optimize thermal comfort and energy efficiency in buildings. The methodology is divided into two phases: (1) system development and (2) data processing. The first phase focuses on developing an IoT device for monitoring thermal comfort parameters and controlling the HVAC system by adjusting the AC setpoint. It also includes the development of a web-based BIM platform and cloud data storage for real-time monitoring. The second phase addresses the post-collection processing of data, specifically the thermal comfort model and ML algorithms applied to analyze and predict thermal comfort indices.
The framework of the developed real-time thermal comfort monitoring and DT system comprises temperature and humidity sensors that continuously record temperature and humidity in a specified location over time. These sensors are wired to the core controller, which allows for the governance of their key functions, data collection, and transmission of collected data to a cloud database via wireless communication modules. The data stored in the cloud database connects to the user interface of the DT platform through database API. In the DT visualizer, when the data retrieved is processed and sPMV index is calculated and displayed. The platform also allows the user to automatically control the AC setpoint using ML-based predicted thermal environment or manually from the dashboard. In such cases, an infrared (IR) signal is sent from the IoT device to the AC controller, which adjusts the AC cooling/heating setpoint as per the signal. An overview of the framework architecture can be seen in Figure 2. This section details the components of the developed system, starting with the development of IoT devices and the web platform, followed by the adopted thermal comfort indices and ML algorithms.

4.1. System Architecture and Components

4.1.1. IoT Module Hardware Configuration

The IoT framework for monitoring thermal comfort parameters and the control of the AC setpoint integrates several hardware components, including sensors and IR modules and the ESP32 Wroom board [47]. The ESP32 microprocessor, developed by Espressif Systems, is a versatile prototype board. With its built-in Wi-Fi and Bluetooth capabilities, dual-core processing, and extensive connectivity options, the ESP32 is particularly suitable for IoT applications. Its affordability, significant memory capacity, and strong community support make it an ideal choice for various projects, from home automation to wearable devices.
The circuit for the developed IoT-based device is designed for efficient data collection and communication. Specifically, it contains an ESP32, a DHT22 sensor, a clock module, an SD card module, a power controller, power jack, battery, and IR transmitter. The actual prototype and circuit diagram can be seen in Figure 3. Table 1 details the specifications of the modules used. The ESP32 acts as the central microcontroller, interfacing with the DHT22 to gather temperature and humidity data, while the DS3231 clock module provides real-time timestamps in case of no connection with the internet. The SD card module is used for data storage backup in case of an internet outage, and the IR transmitter enables communication with the HVAC system. The power controller ensures a stable voltage supply from either an external power jack or battery. All components share a common ground, with VCC connections depending on the voltage requirements (typically 3.3 V or 5 V) provided by the power controller.

4.1.2. IoT Architecture

This study employs a five-layer IoT architecture, as outlined by Zhong et al. [48], to support real-time thermal comfort monitoring and HVAC control through IR technology. The IoT architecture enables seamless communication and compatibility among devices, facilitating efficient data collection and exchange on thermal comfort parameters, thereby enhancing the ability to monitor and adjust indoor environments for optimal comfort [49], as shown in Figure 4.
  • Sensor Layer
The Sensor Layer forms the foundation of the IoT architecture and is responsible for gathering data from the physical environment. This layer includes various sensors, such as temperature and humidity sensors, as well as devices like the KY005, which receives and transmits infrared (IR) signals between air terminals.
2.
Communication Layer
The Communication Layer facilitates data transfer between devices, sensors, and the cloud. Sensor data from the sensing module are transmitted to the database, while control setpoints are retrieved from the database and sent back to the device to communicate with the HVAC terminal unit. In the office case study in this research, an IR module is used to interface with the HVAC system; however, this should be viewed as a simplified implementation. In scenarios where IR communication is not feasible, an alternative approach involves using an additional ESP module wired directly to the HVAC control system, allowing for integration with the DT platform. But, in any case, the main function of this layer is to establish secure connections, manage data transmission protocols, and ensure reliable and seamless communication between all system components.
3.
Support Layer
The Support Layer is responsible for the backup of the SD card, processing, analyzing, and interpreting raw data from the sensors. This layer applies algorithms, machine learning models, and data analytics techniques to extract insights, detect patterns, and make informed decisions.
4.
Application Layer
The Application Layer provides an interactive platform for users to engage with the IoT system. This layer presents the processed data in a user-friendly format, allowing users to monitor, control, and adjust settings, receive notifications, and interact with the system through dashboards, apps, or voice assistants.
5.
Security Layer
The Security Layer protects the IoT system against unauthorized access, data breaches, and cyber threats. This layer implements robust security protocols and encryption methods when connecting with the database to ensure the integrity and secure transmission of the data.

4.1.3. Digital Twin Elements

A DT serves as a detailed digital representation that integrates various data and information sources, such as CAD drawings, 3D models, simulations, analytics, and sensor data, to mirror a physical object or system [50]. Figure 5 illustrates the three basic elements of a Digital Twin: physical assets, a digital replica, and connections. However, the DT framework proposed in this study is specifically designed to support the real-time monitoring of HVAC performance and indoor thermal conditions to ensure smooth operation while using an open-source approach. Two additional components are also included: a Data Container and a Service Provider. The Data Container allows for the storage and management of both real-time and historical data, supporting scalable and responsive operation, while the Service Provider facilitates data analysis and control in a user-friendly platform. The combination of these components contributes to a comprehensive DT model that not only enables real-time monitoring but also provides predictive capabilities and integration with other digital systems to optimize HVAC operation management and indoor thermal comfort effectively.
Physical Object
The physical asset refers to the real-world object or system that is mirrored by a digital replica. The DT collects real-time data from the physical asset, enabling enhanced monitoring and management. By simulating various scenarios, the DT predicts the asset’s behavior under different conditions, optimizing its functionality, effectiveness, and lifespan. This integration of physical and digital systems supports data-driven decisions, ultimately improving asset performance and longevity.
Digital Replica
A digital replica, also known as a virtual replica, is a virtual representation of a physical object, system, or process, created by combining 3D models, data integration, simulations, and analytics. It replicates the characteristics, properties, and behavior of a physical entity. Laser scanning technology or CAD modeling captures the precise measurements and dimensions of a building, providing the foundation for creating a detailed 3D digital model, which is subsequently represented by a highly detailed BIM model. Digital replicas can be exported in formats like IFC, a standardized data model that enables interoperability across different software platforms. By using digital replicas, industries can optimize the design, operation, and maintenance of physical assets, leading to improved decision-making, increased efficiency, and enhanced innovation.
Connection
In the development of DT, connection represents the critical link between the physical asset and its digital replica. Connection allows for real-time data flow from sensors and IoT devices, keeping the DT in sync with the physical asset’s current state. In the developed DT, assets in the BIM model are mapped to real-time data recording and IR signal-processing IoT modules in developed web applications through the use of IFC schema. The IFC scheme enables a standardized framework for representing and exchanging information about building components, systems, and their attributes. The developed web platforms and cloud databases are connected through the use of API, the connection supports bidirectional communication, enabling the DT to receive data and send commands to the physical asset.

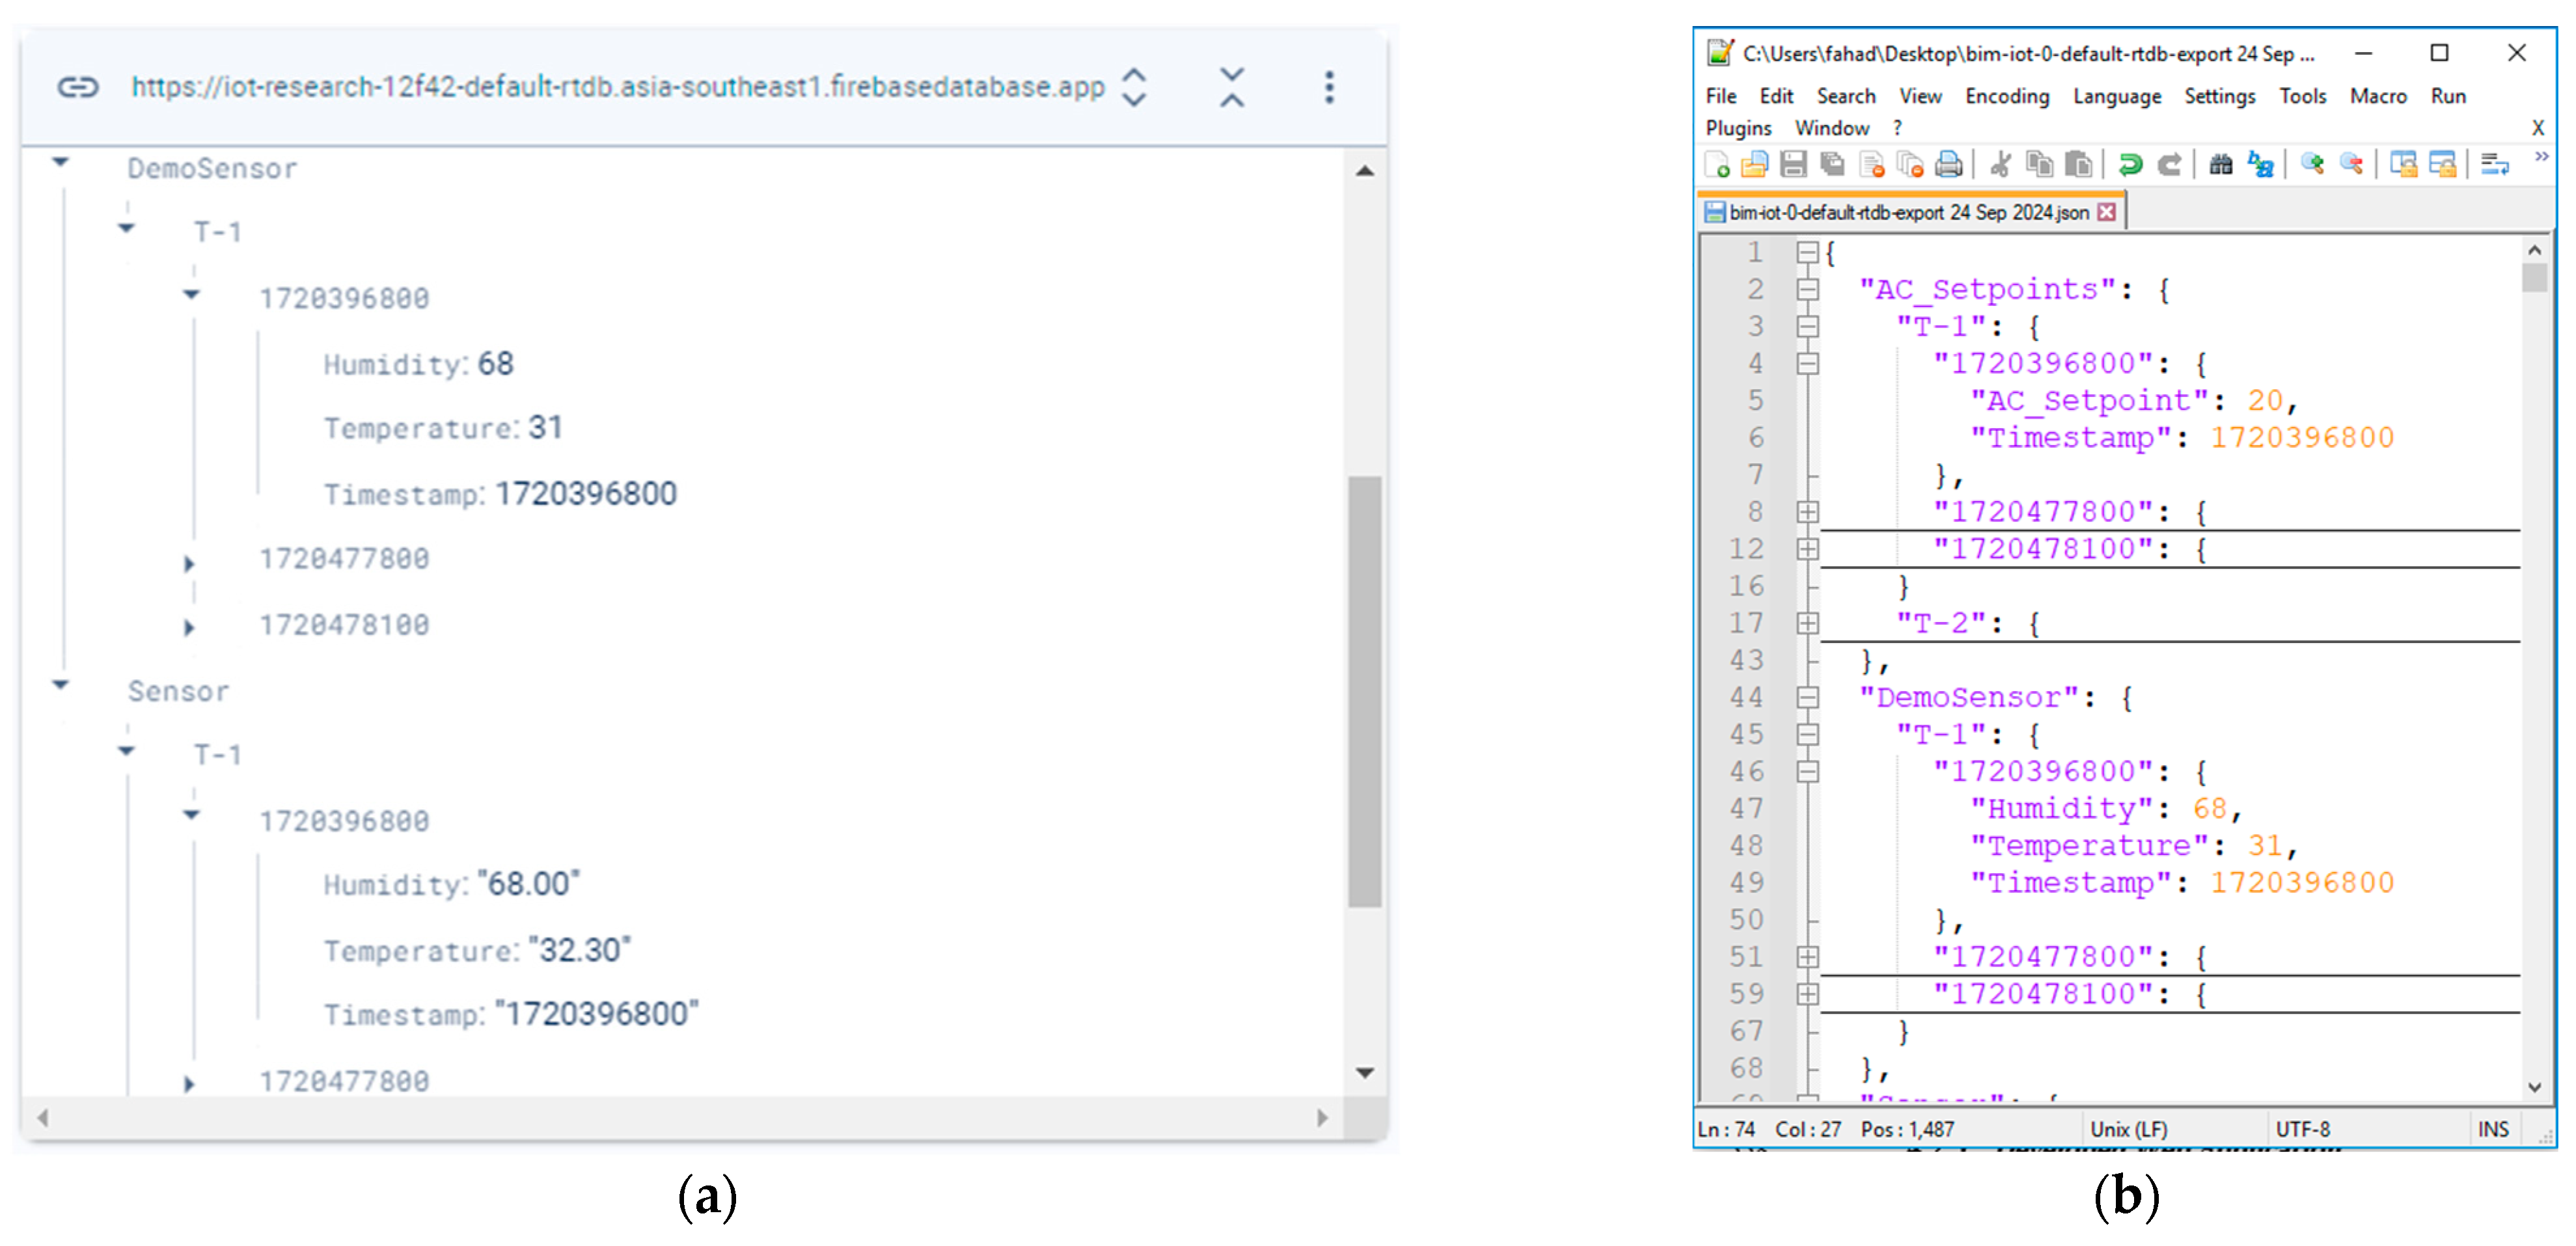
4.1.4. Real-Time Database

Once the thermal comfort parameters are recorded by the sensor, the IoT device transmits the data to a real-time database via Wi-Fi. In this study, Firebase’s Database, a cloud-based NoSQL solution that operates on a client-server architecture, is used due to its efficiency and versatility [51]. One of Firebase’s key benefits is real-time bidirectional data syncing via WebSockets, ensuring that updates are immediately reflected across all connected devices, and a generous free tier. This capability is crucial for applications that require real-time information, such as monitoring and adjusting thermal comfort in real-time. The cloud database stores data as a hierarchical JSON tree, accessible via a RESTful API or WebSockets. For this study, the data within Firebase are structured to support different operations. In Figure 6a, demo data recorded in a sensor-simulated style for testing and debugging purposes can be seen under the path of DemoSensor; second, there is a path for experimental data recorded by the IoT device and stored in the database under Sensor path; and third, there is a path for AC setpoint data, where the DT platform stores information that the IoT device accesses to adjust the AC settings, as illustrated in Figure 6b.
Data security is ensured through Hypertext Transfer Protocol Secure, which uses Secure Sockets Layer or Transport Layer Security encryption during the connection between the device and the database, protecting the integrity of the data as they are transmitted between the device and the Firebase services. Specifically, our study utilizes secure authentication methods, including email/password authentication for the IoT device, OAuth, and secret keys for secure API access on the DT web visualizer side. Firebase also provides a comprehensive suite of tools, including python libraries, user authentication, cloud storage, and usage analytics. These features streamline application development and management by securing user access, offering scalable storage solutions, and providing insights into application performance. The free tier for starter projects significantly reduces initial costs, making it accessible for small-scale implementations and rapid prototyping.

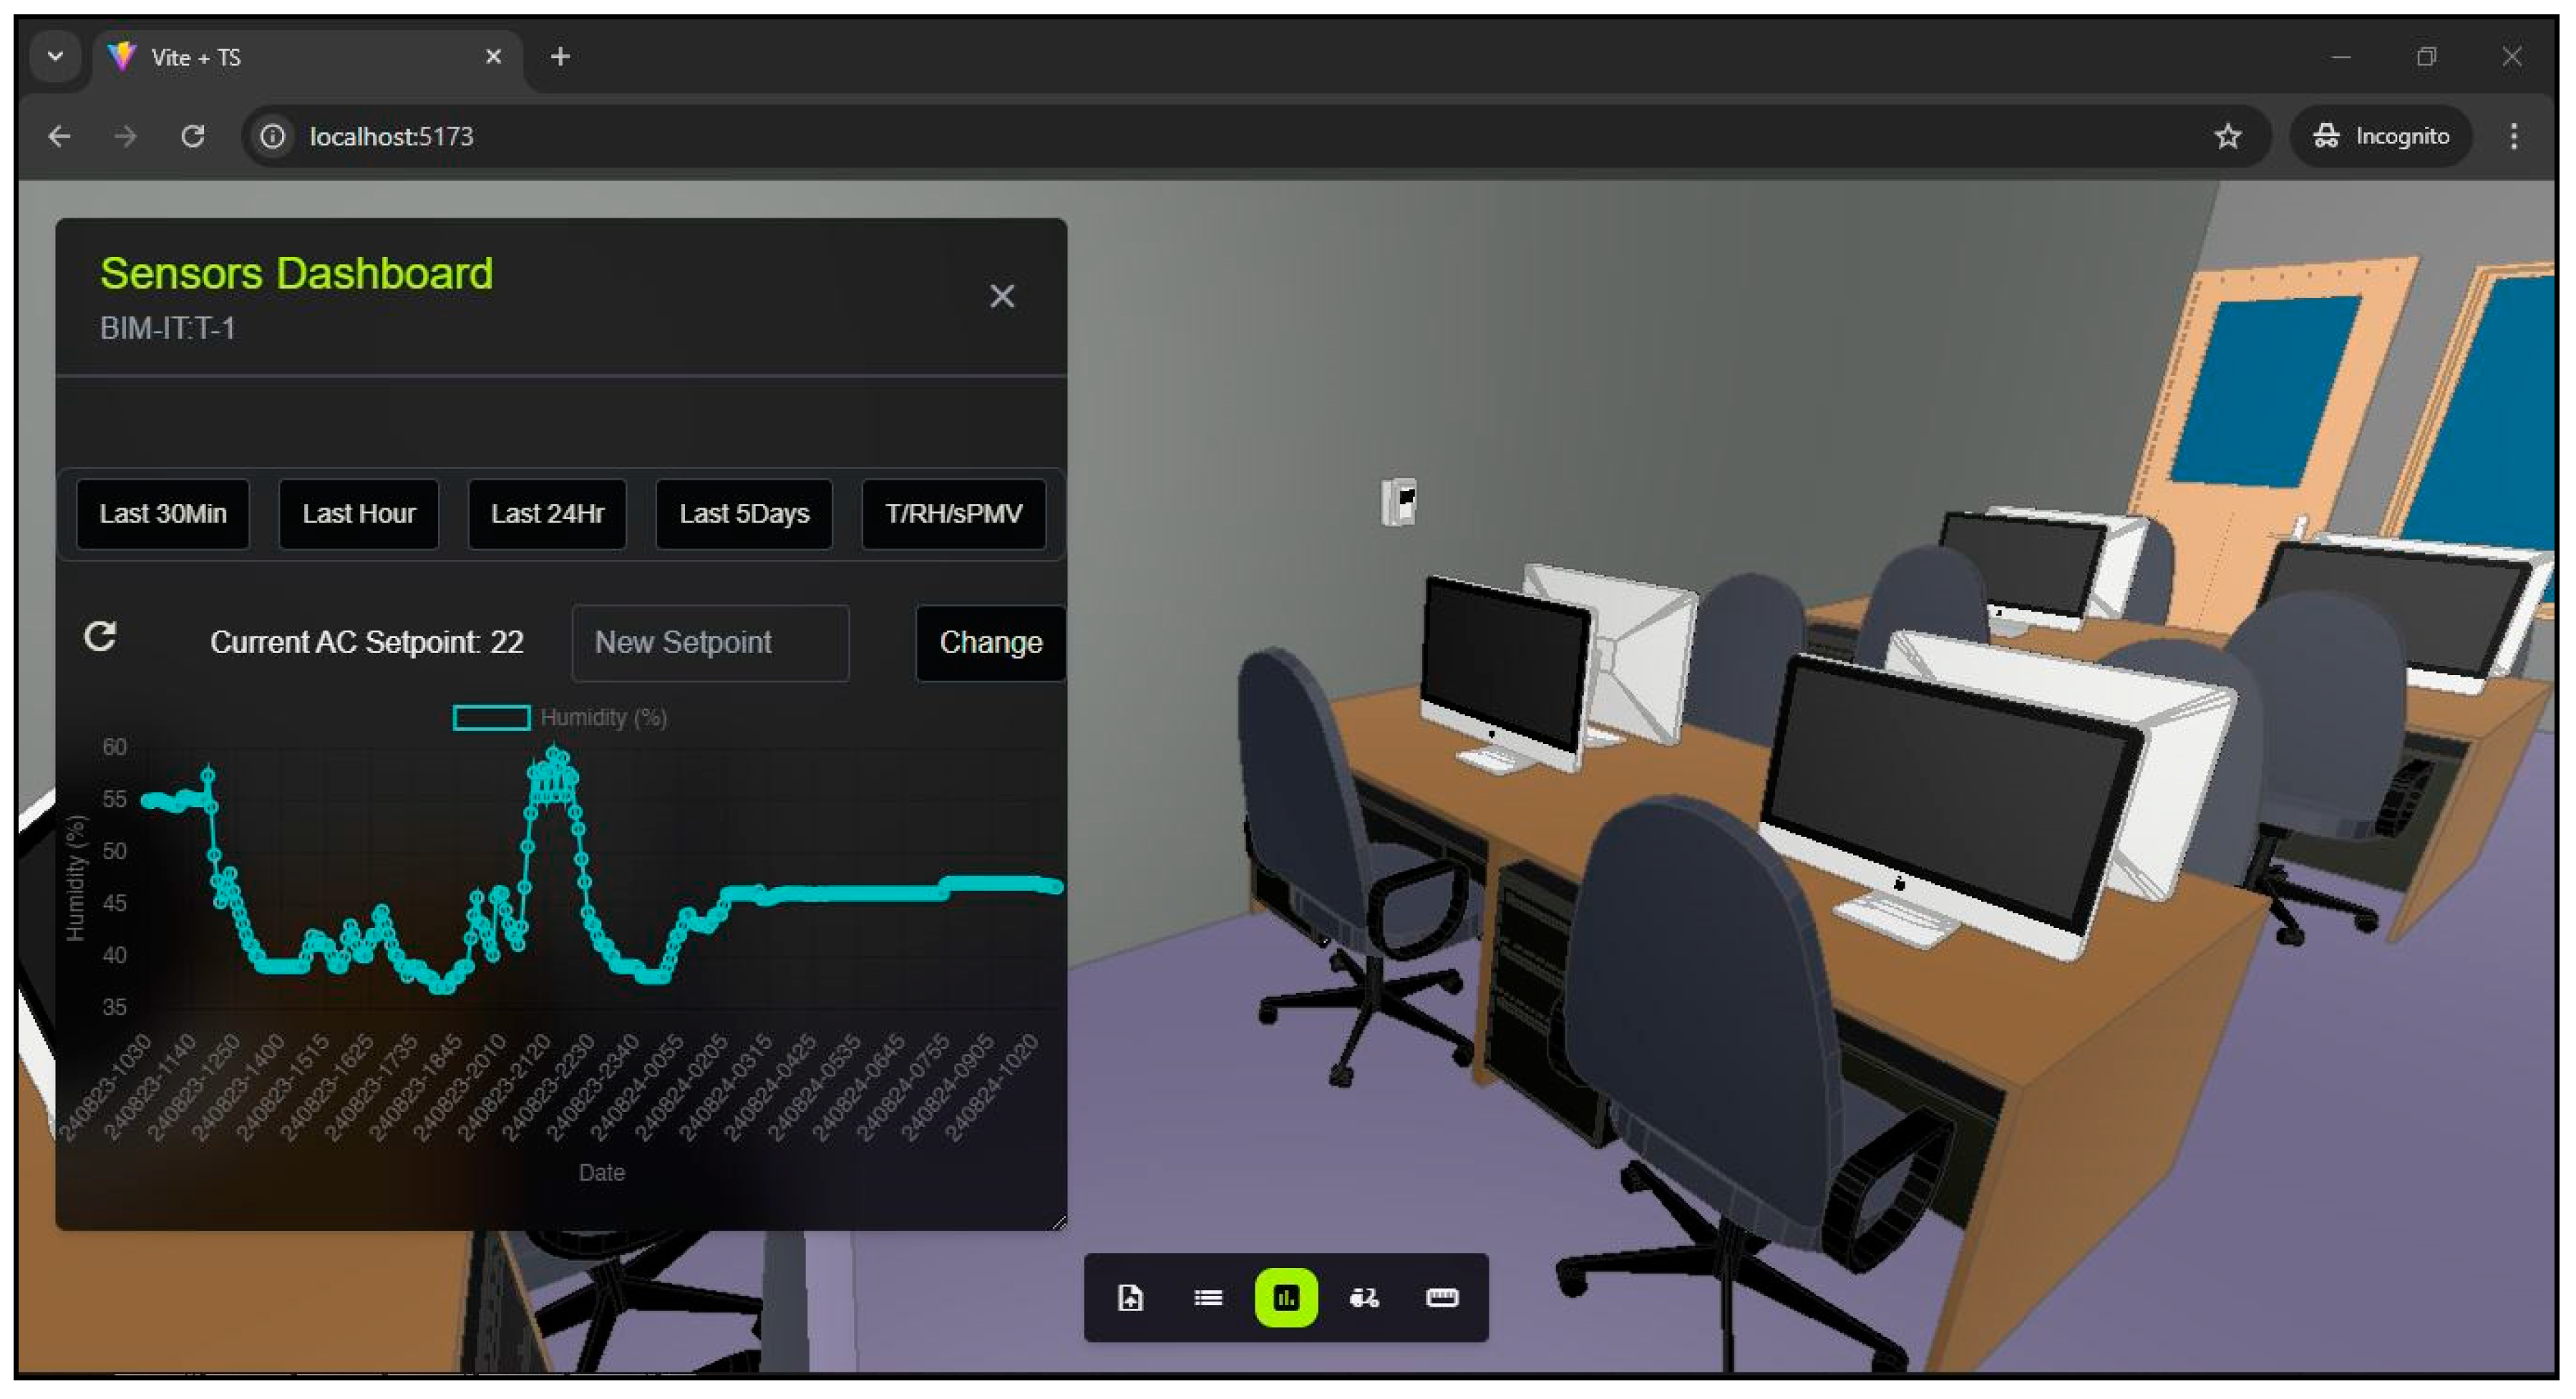
4.1.5. Developed Web Application

In this study, a web-based DT platform for thermal comfort monitoring, prediction, and control of AC setpoints is developed, as can be seen in Figure 7. The DT platform was built upon the code and framework developed by ThatOpen, earlier known as IFC.js. Custom modification has been performed in the IFC.js framework to connect it with the cloud database and visualize the results of the monitored data. The DT platform is developed using TypeScript and three.js, where three.js is employed for visualizing the 3D environment of the monitored space. The user interface is designed with JavaScript, HTML, and CSS [52]. As part of the system’s capabilities, the DT visualizer serves two main functions: monitoring and control. Through monitoring, users can track real-time data, while the control function allows them to adjust settings based on the information provided. Once the IFC file is loaded into the platform, it explores and visualizes the model as per the IFC scheme. Each device within the BIM model, i.e., the thermostat, air terminal, and custom sensor, is represented as an IFC object, with specific attributes like device type, manufacturer, installation location, and connection status. The connection between the web application and the cloud database is achieved through the Firebase API, allowing for real-time data synchronization and remote access for further analysis. For data visualization on the front end, Plotly.js v2.26.1 was utilized to display interactive thermal comfort data. The application is also connected with Python-based ML algorithms using Node.js server libraries (e.g., Express for routing, CORS for handling cross-origin requests, and spawn for running external processes). A hybrid ML model is implemented using Scikit-learn, prophet modules which facilitate predicting thermal comfort parameters.
The developed web application features a user-friendly interface that simplifies the access to and analysis of sensor data, prioritizing ease of use for efficient monitoring and evaluation of environmental conditions. With just a single click, users can retrieve the temperature, humidity, and sPMV index of space. The platform offers flexible data retrieval options, allowing users to access data for the last 30 min, hours, 24 h, or 5 days. Once the data are visualized, any new data sent by the IoT device are automatically loaded and displayed on the graph. The graph can be customized to show temperature, relative humidity, or the sPMV index through a toggle button on the right in the sensor dashboard menu. Additionally, the platform provides users with the option to remotely monitor and adjust the AC cooling setpoint. By offering real-time insights into the thermal conditions of space, the platform enables facility managers and owners to remotely adjust the AC setpoint to achieve the desired thermal comfort level. Furthermore, the platform supports the dynamic adjustment of the AC setpoint based on the ML predictions of thermal conditions, ensuring optimized comfort. Figure 8 illustrates the dataflow chart for the web application.

4.2. Data Processing

4.2.1. Thermal Comfort Model

Thermal comfort in indoor environments is often evaluated using the model proposed by Fanger et al., which is also adopted by international standard organizations and ASHRAE. Thermal comfort calculated using this model is represented as the PMV index. It is known for its precision in determining the optimal temperature range for a wide number of users. However, it requires several input parameters, and acquiring real-time data for all these variables can be challenging [53]. For effective real-time monitoring with fewer parameters, a simplified model is necessary to maintain accuracy without the complexity of the full PMV model.
An enhanced model of sPMV originally proposed by Rohles, refined by Burrett, as detailed in [54], has extended its applicability to a broader range of clothing insulation levels. This improved model uses only indoor air temperature and relative humidity as input parameters for a specific clothing insulation factor, which simplifies the evaluation of thermal comfort while closely approximating the results of the Fenger model. This simple approach makes it easier to operate and still provides reliable comfort assessments, as can be calculated in Equation (2). Previous studies have validated this method by comparing it to more complex models and real-world thermal comfort data. The results consistently showed that this improved model delivers accurate predictions of occupant comfort. The mean value of the standard deviation is 0.22 when applying the new model, meaning the calculated value of PMV varies, on average, by ±0.2. This is a good result, as it provides a reliable estimation of the comfort conditions in the environment, confirming the model’s effectiveness in practical applications.
I P M V = a T + b P v c
P v = R H 100 × 0.611 × 10 7.5 × T 273.3 + T
where IPMV is the index value of PMV; T is dry bulb indoor temperature in °C; Pv is vapor pressure kPa derived from relative humidity RH and temperature as described in Equation (3); and a, b, and c are known parameters from Burrett’s study based on clothing insulation level Icl.

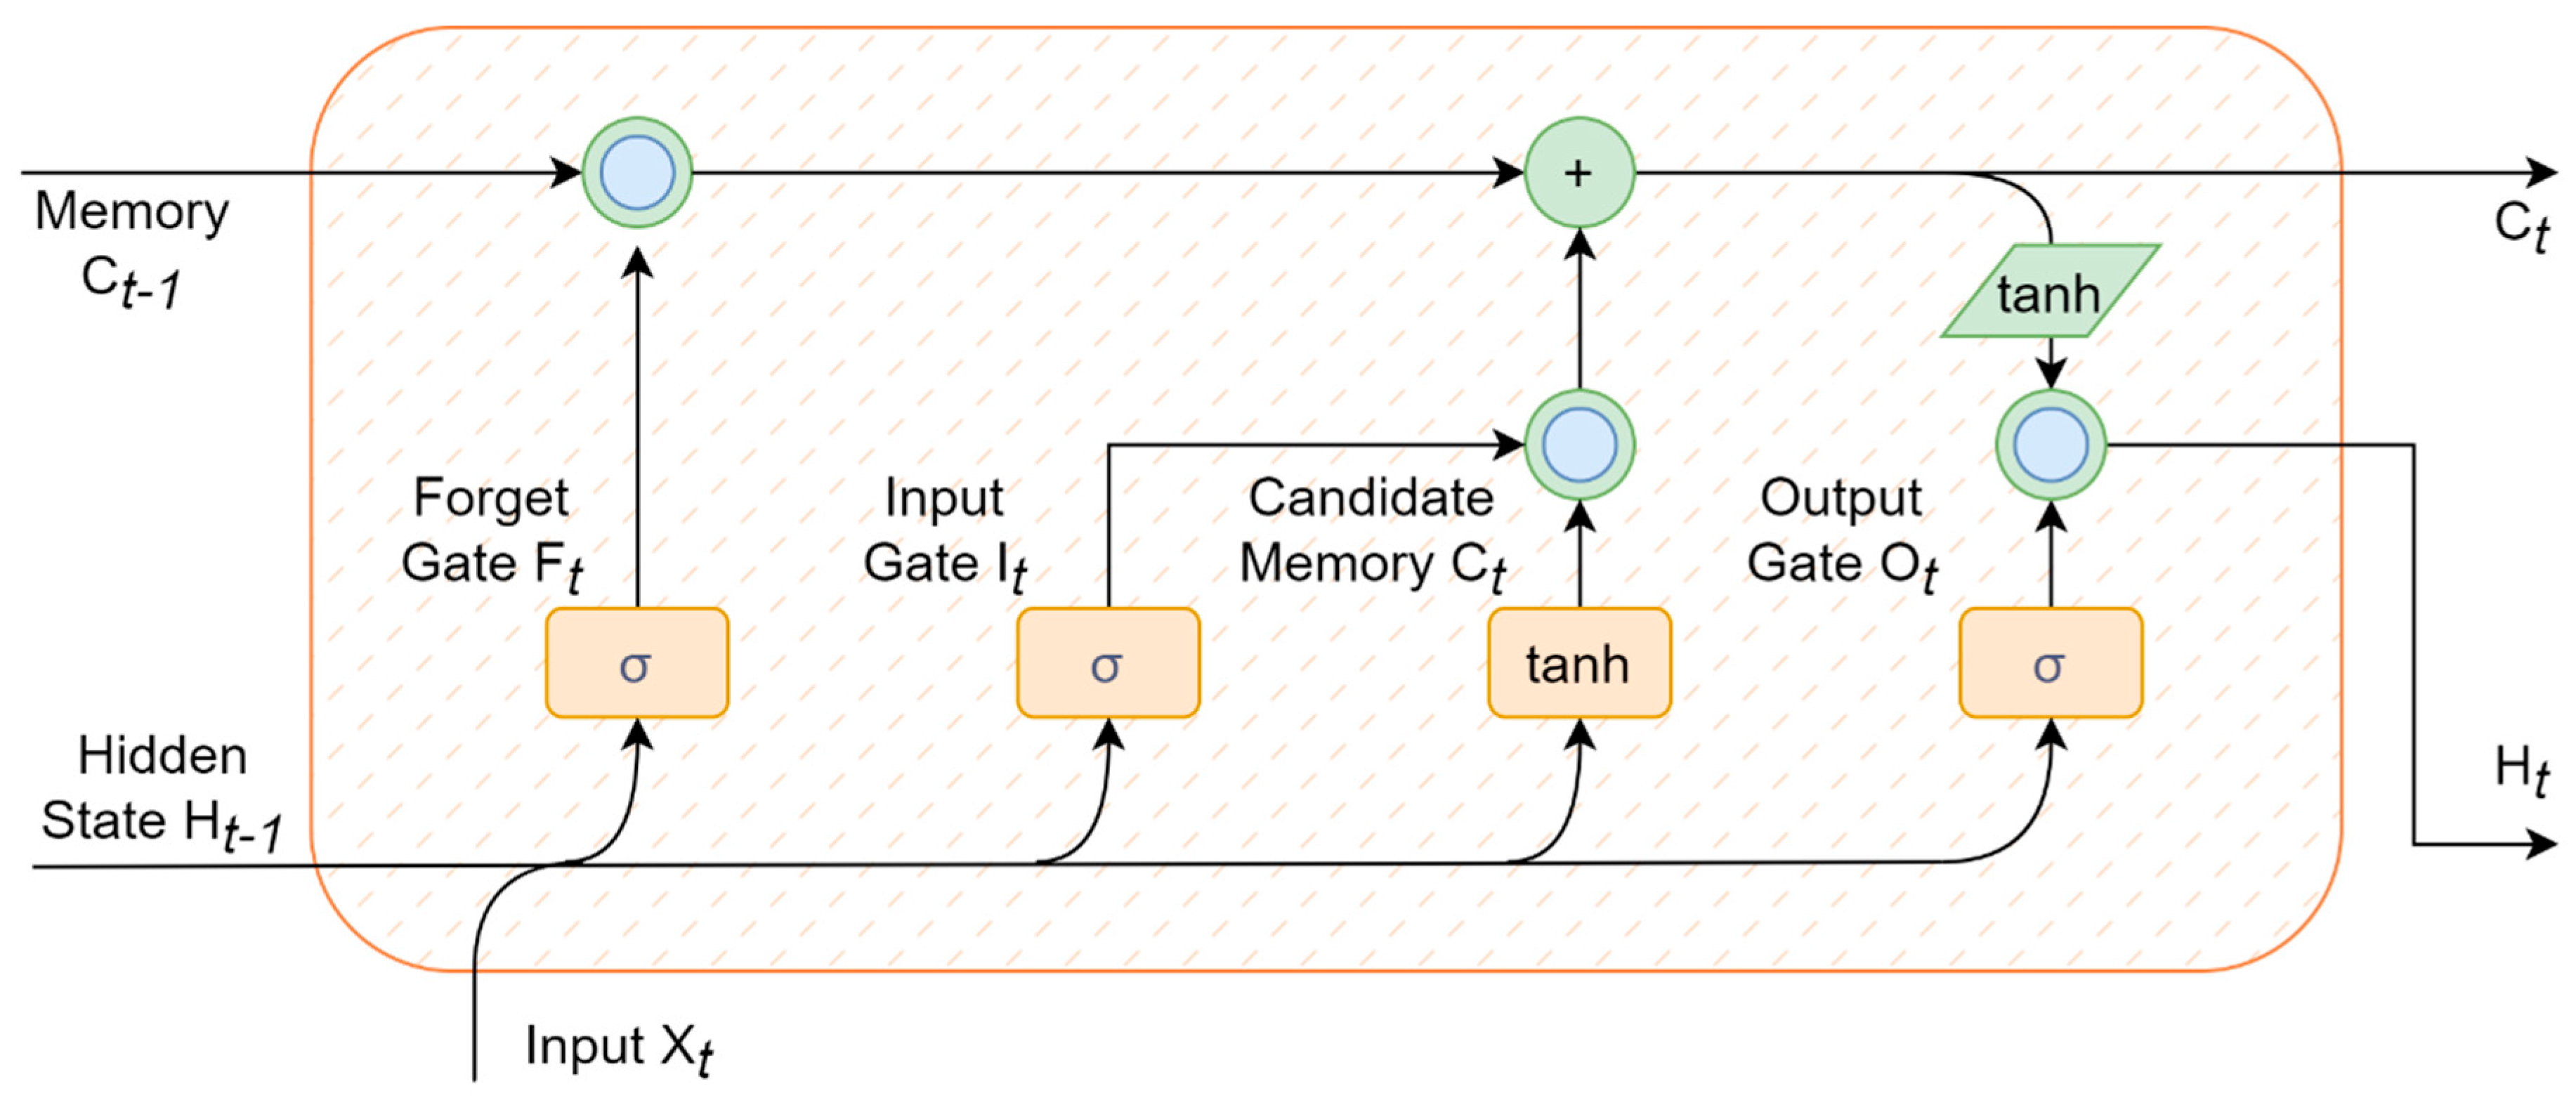
4.2.2. Machine Learning Tools

This research focused on thermal comfort assessment through the sPMV model, collecting time series data on dry bulb temperature and relative humidity at five-minute intervals. Therefore, this study adopts a hybrid time series forecasting model that combines the strengths of FB Prophet and LSTM networks for indoor thermal condition prediction. By integrating the outputs of FB Prophet and LSTM, a robust and effective forecasting model is created.
Facebook and Neural Prophet
Facebook Prophet is a time series forecasting model developed by Facebook’s Core Data Science Team [55]. It is designed to handle various components of time series data, including trends, seasonality, and holidays. Prophet models these elements separately and then combines them to produce forecasts, as described in Equation (7).
y ( t ) = g ( t ) + s ( t ) + h ( t ) + e ( t )
where y(t) is the forecasted value at time t. This equation combines four key components: g(t), the trend component, which can be specified as a linear or logistic function; s(t), the seasonality component, represented as a sum of Fourier terms to capture daily, weekly, and/or yearly cycles; h(t), the holiday component, accounting for the impact of irregularly occurring holidays; and e(t), the error component, representing the residual changes not captured by the model [33]. Figure 9 provides an overview of the forecasting process.
The forecasting process begins with generating time series forecasts based on parameters and specifications that are easily interpretable. The model then assesses its forecast performance; if the results are found to be suboptimal, it signals a human analyst for review. This human-in-the-loop approach allows the analyst to adjust the model based on feedback, facilitating iterative refinement and enhancing the accuracy of the forecasting results.
Long Short-Term Memory Network
A type of recurrent neural network (RNN) known as LSTM networks is designed to effectively mitigate the short-term memory problem found in traditional RNNs while addressing the challenge of learning long-term dependencies [56]. The fundamental structure of an LSTM model comprises four key layers, as illustrated in Figure 10: the forget gate layer, input gate layer, memory cell layer, and output gate layer. The behavior of these gate layers is defined by Equations (5)–(10).
f t = σ h t 1 W f + x t U f
i t = σ h t 1 W i + x t U f
C ^ t = t a n h h t 1 W g + x t U g
C t = σ f t C t 1 + i t C ^ t
o t = σ h t 1 W o + x t U o
h t = o t t a n h C t
In the above equation, x represents the input signal; f denotes the forget layer cell; h indicates the hidden layer; Cb refers to the candidate hidden state; C represents the unit’s internal memory; ot signifies the output; U is the weight matrix connecting the input layer to the hidden layer; and W represents the connection between the previous and current hidden layers.
Combining LSTM with FB Prophet
The hybrid model adopted in this study combines the strengths of LSTM and FB Prophet by integrating their outputs. The model operates in two stages: first, it fits the Prophet model to the training data using indoor temperature or humidity as the target variable (y) along with outdoor temperature and humidity as an additional regressor and generates initial predictions using the predict() function. In the second stage, the FB prophet prediction and actual values are used as input to train the LSTM model, which captures complex temporal dependencies and residual patterns that the Prophet alone may not address. FB Prophet is particularly well suited for handling time series data with strong seasonality and external regressors, while LSTM excels at capturing long-term dependencies and nonlinear relationships, making them a more effective combination for time series forecasting compared to traditional statistical models like ARIMA or ML algorithms like Random Forest, which may struggle with sequential dependencies. By using Prophet’s capability to model seasonality and external regressors and LSTM’s strength in learning nonlinear relationships, the hybrid approach delivers improved forecasting performance, making it particularly effective in scenarios with mixed linear and nonlinear dynamics.
To address potential weaknesses in either method, a safety net mechanism is integrated into the hybrid model. If the accuracy of one method falls significantly below the other, surpassing a 2% mean average percentage error threshold, the underperforming model is automatically excluded from the hybrid framework. This threshold, established through empirical testing across various datasets, provides a balance between robustness and adaptability. By dynamically adjusting the model’s composition, the safety net ensures that the hybrid approach consistently maintains optimal performance, even when one of the methods is less effective.

5. Experimental Design
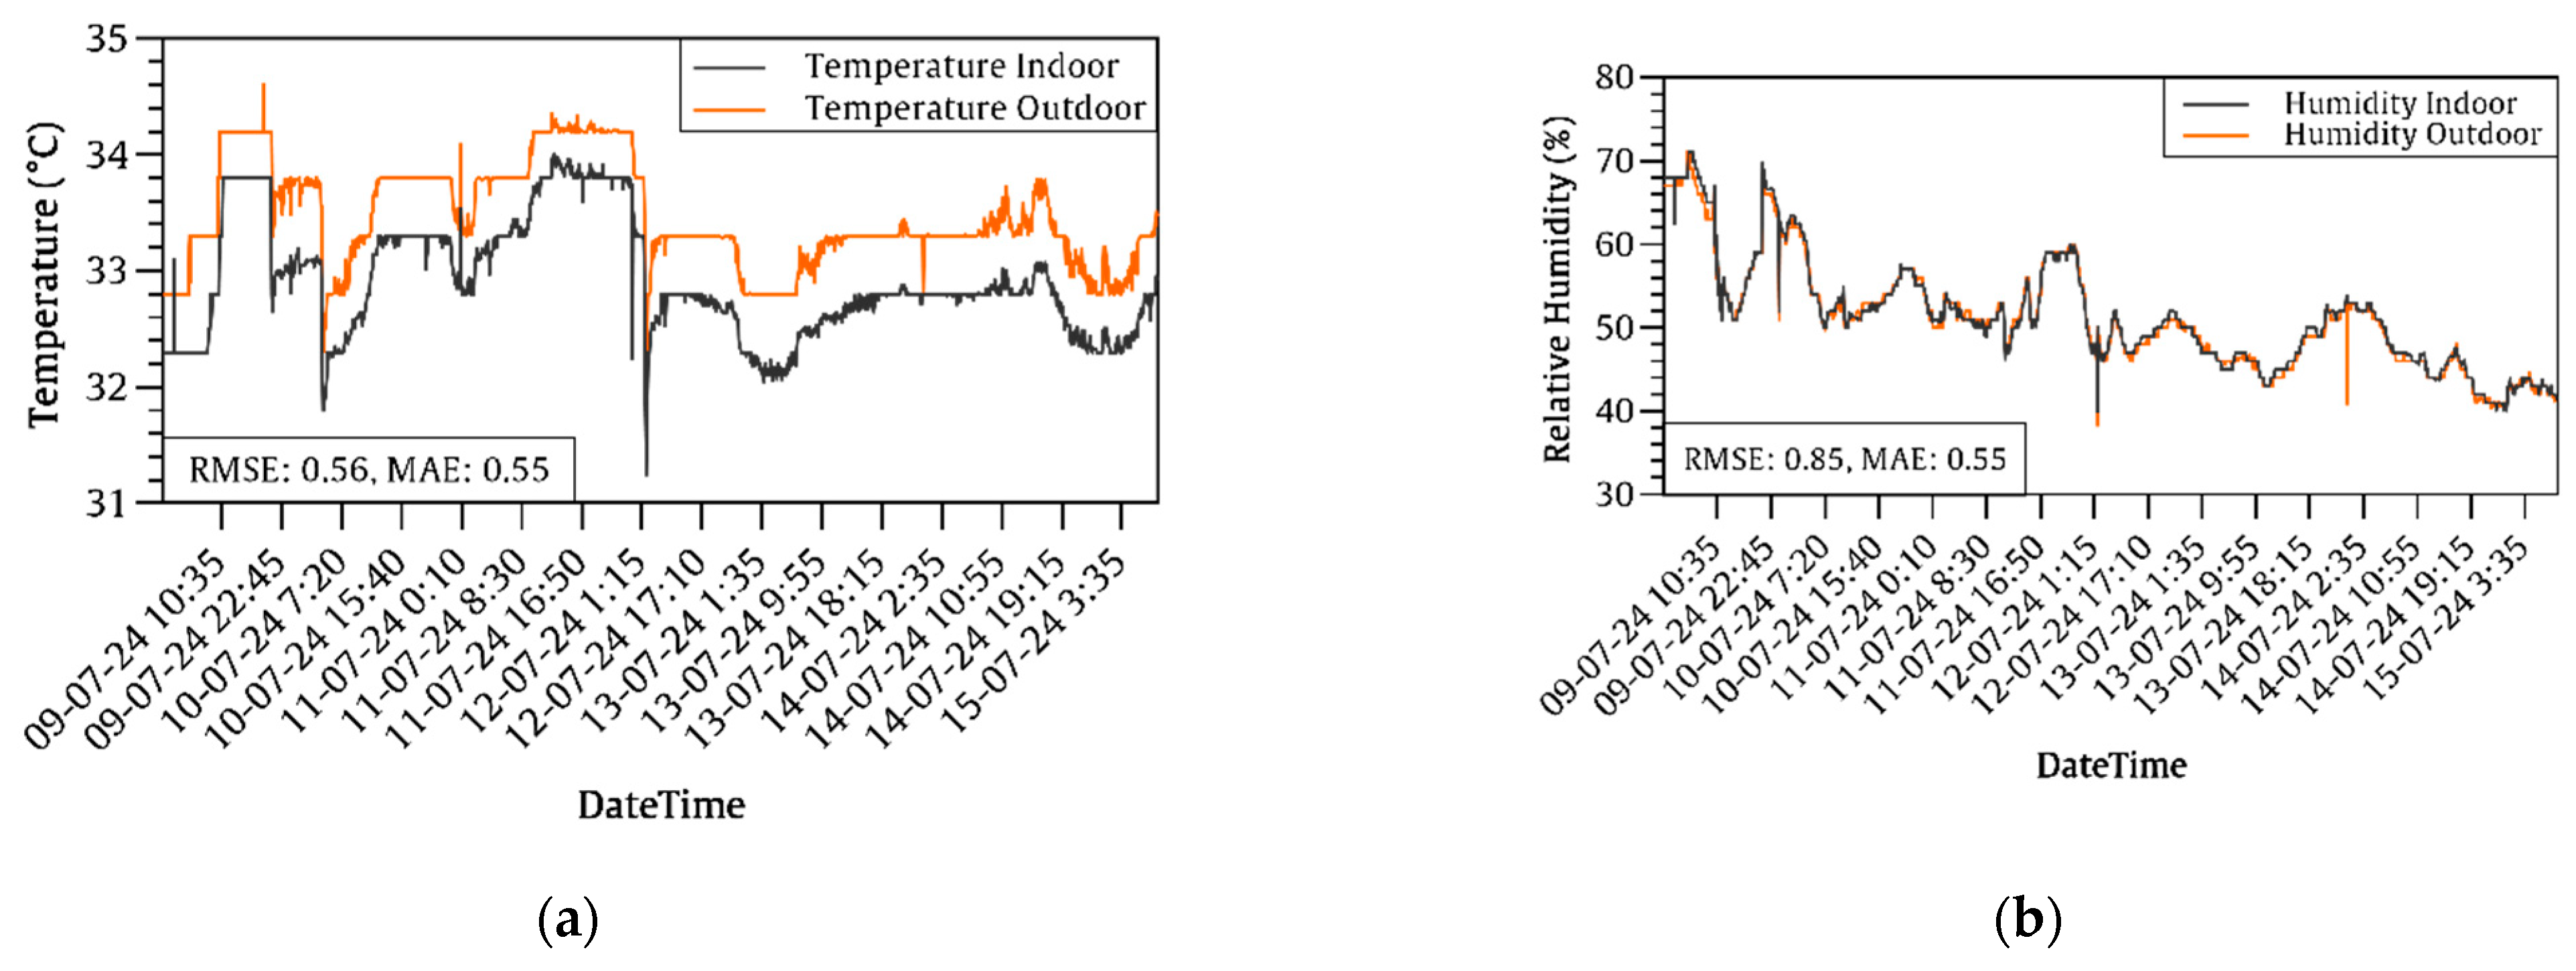
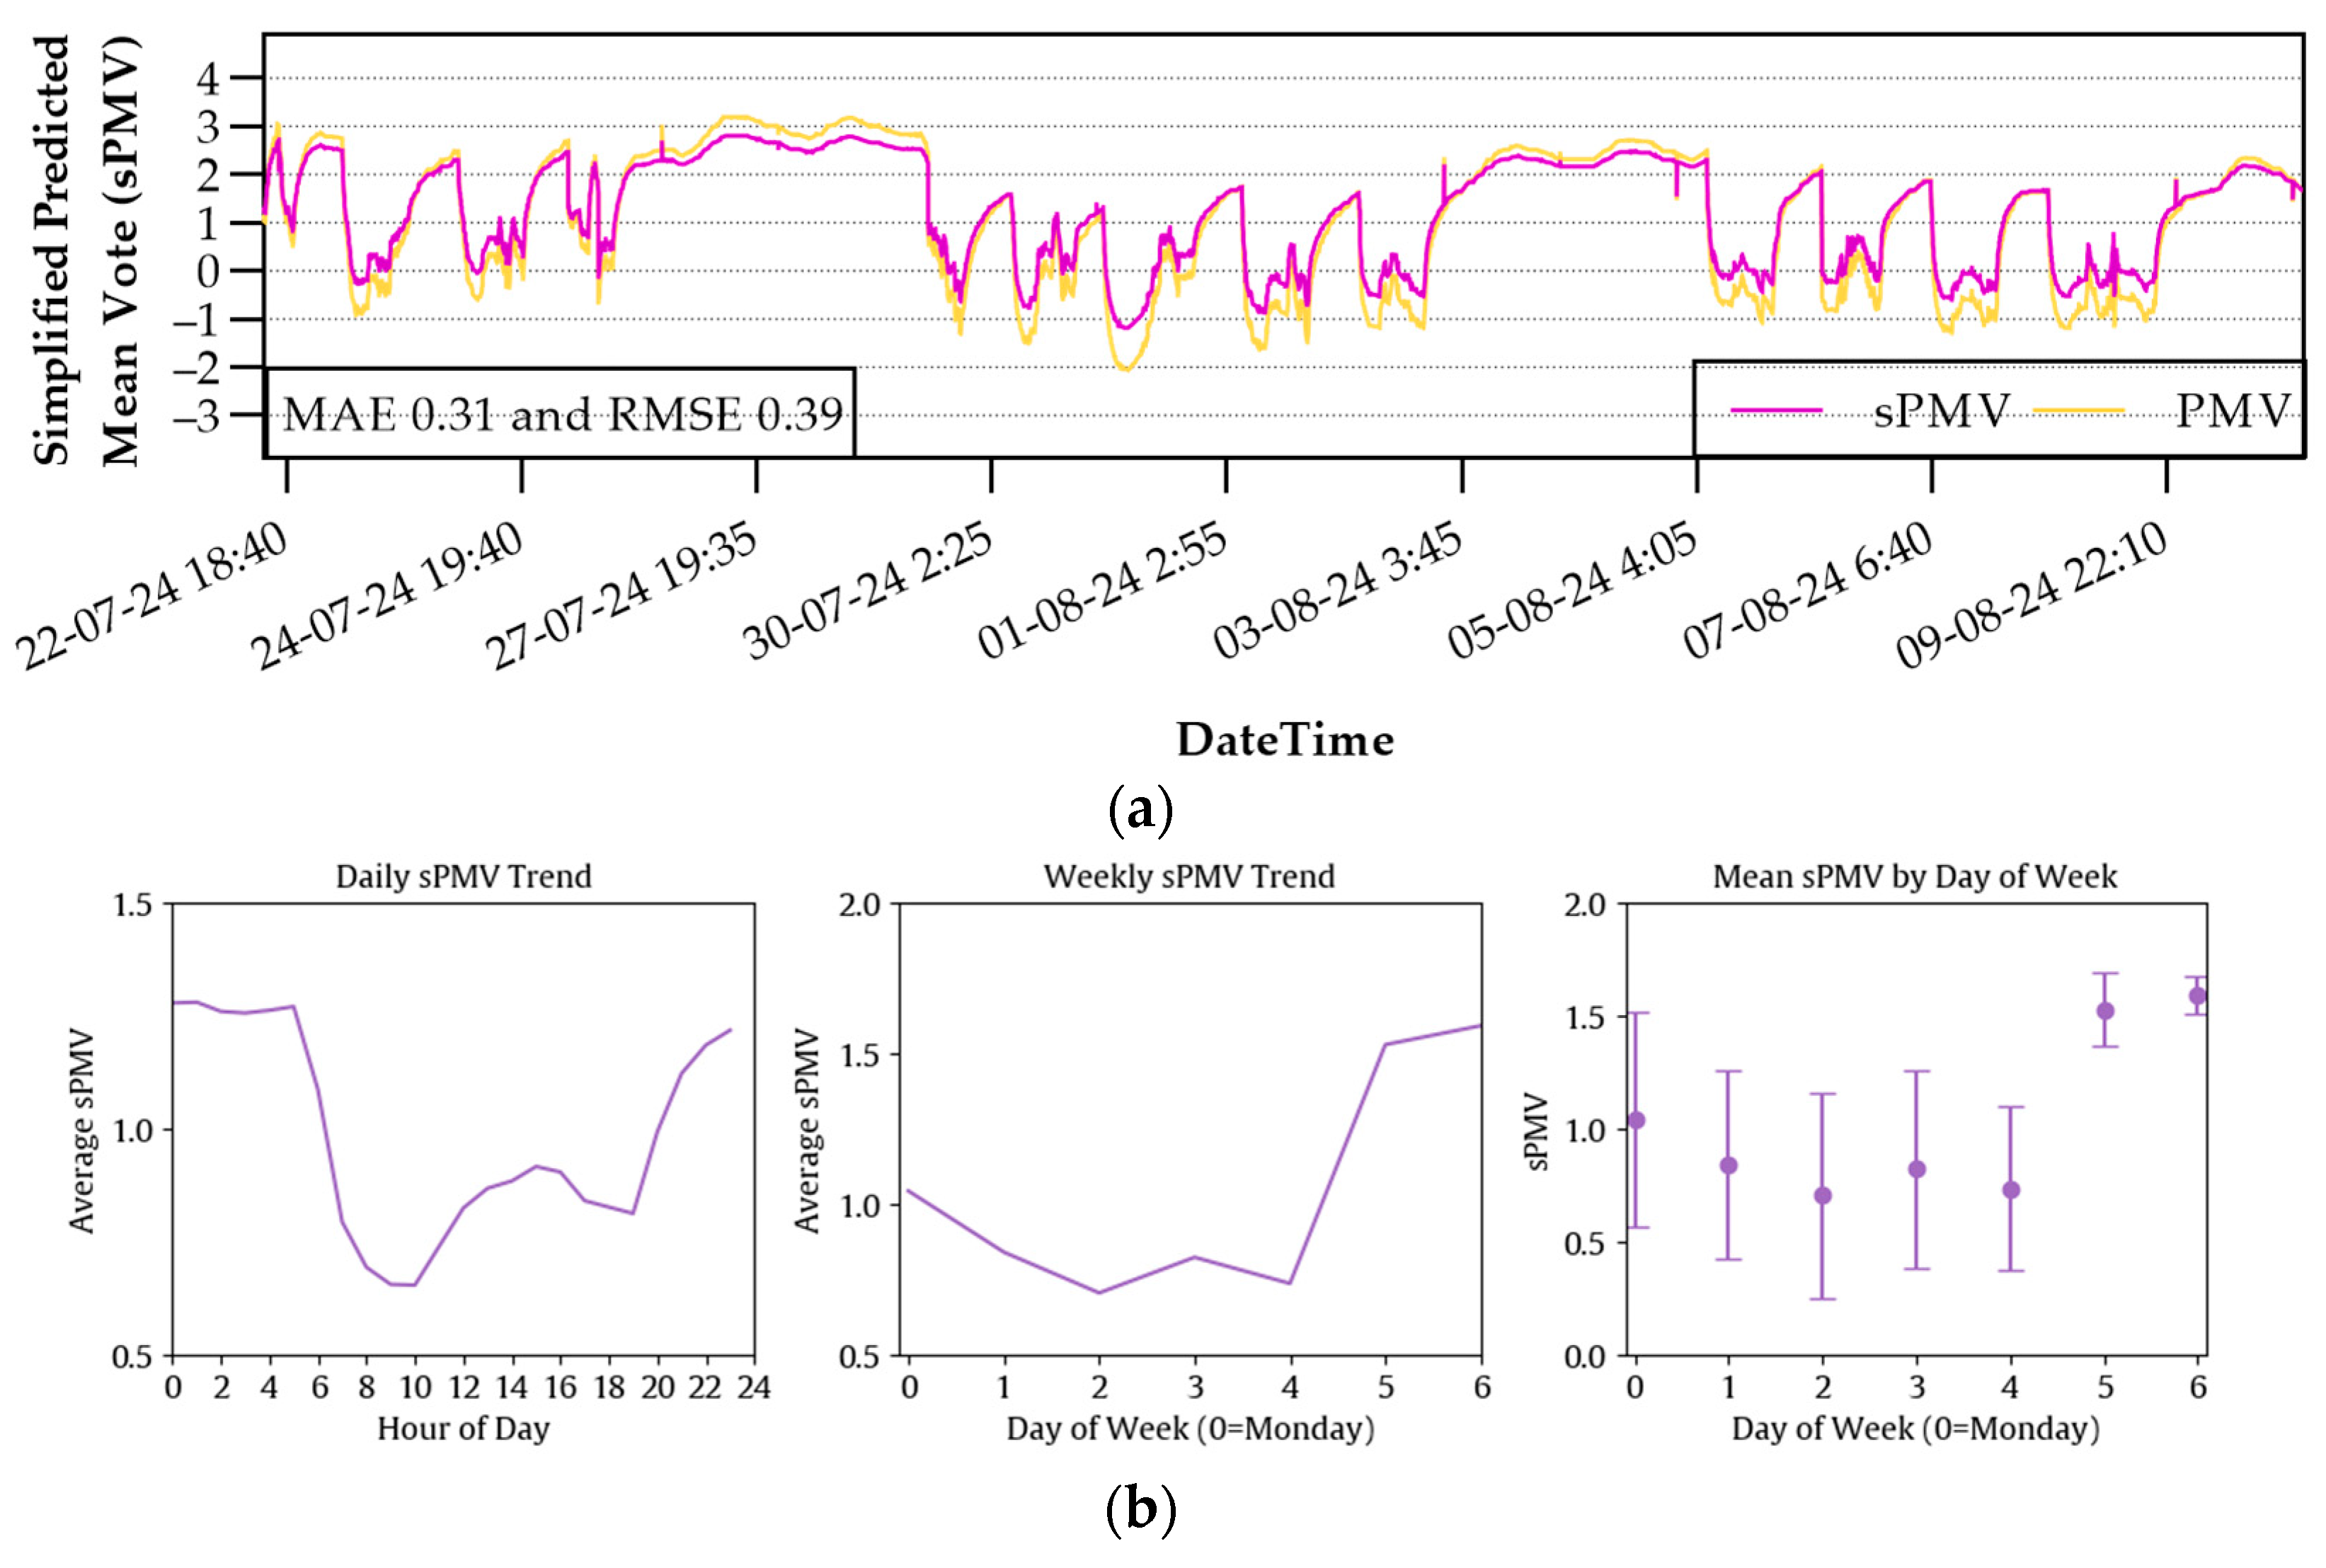
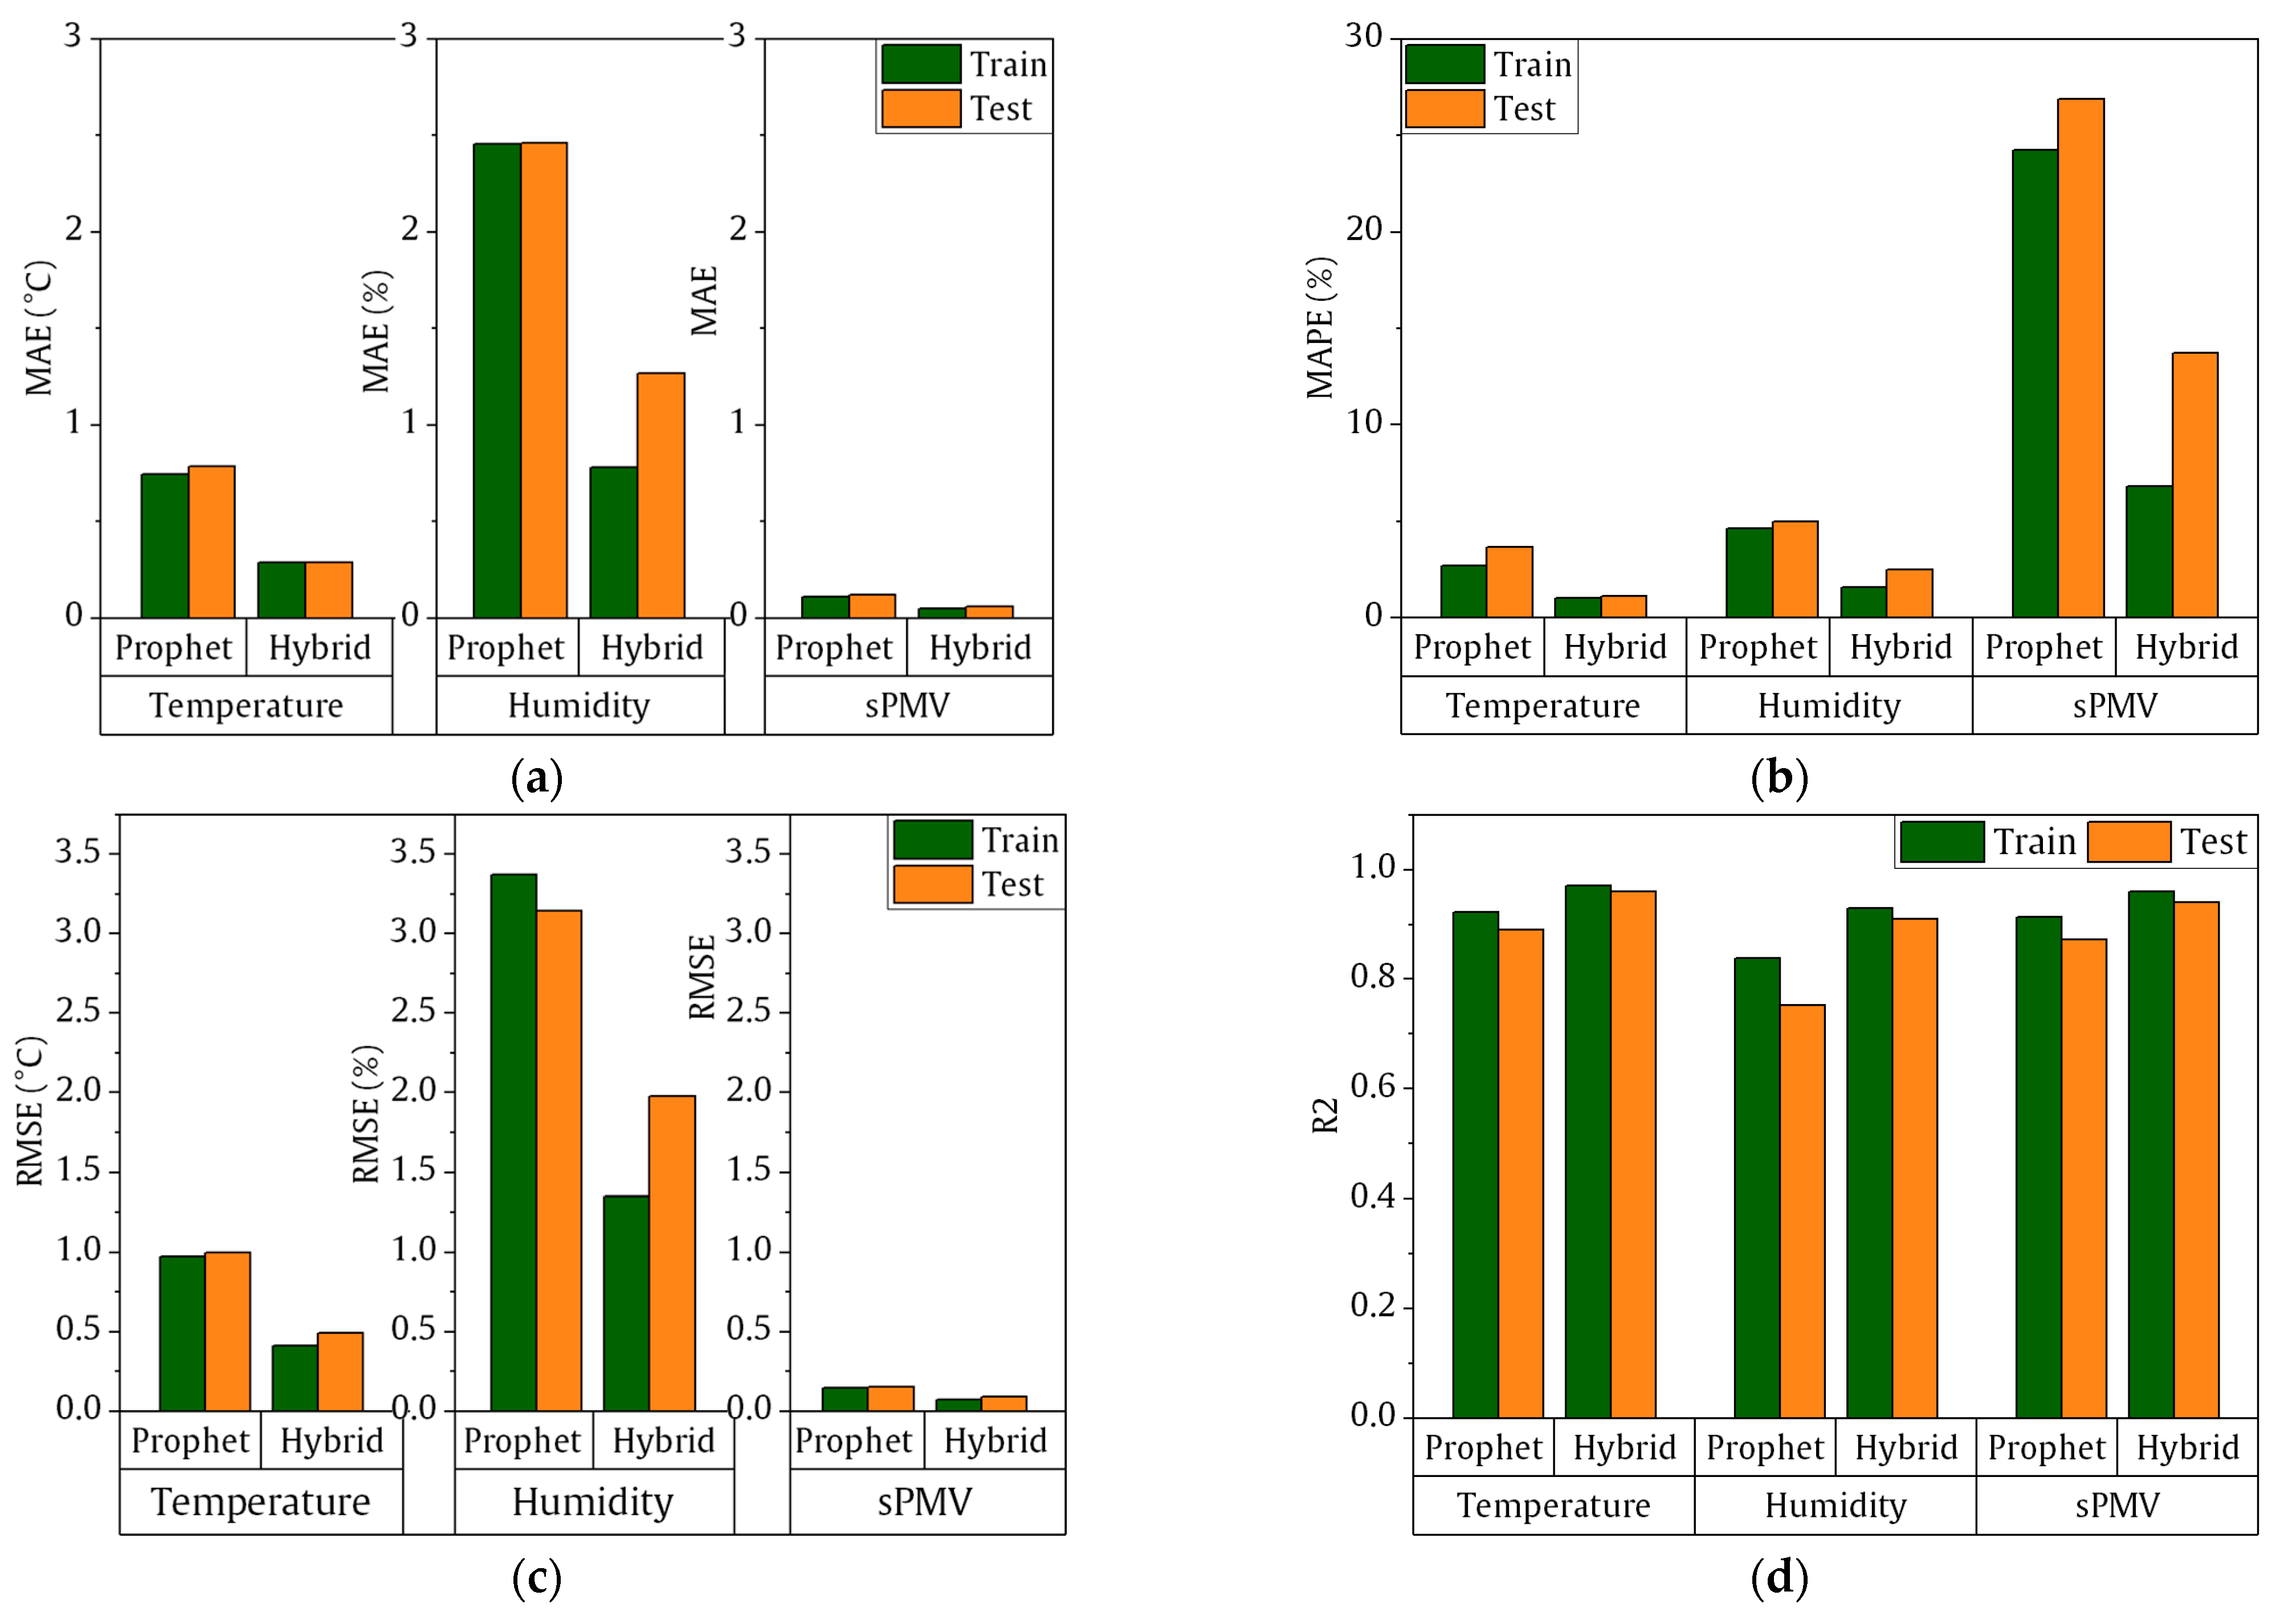
To evaluate the practicality and effectiveness of the developed DT, a case study was conducted in Rawalpindi, Pakistan. The experimental design of the study aimed to assess the system’s ability to accurately monitor and predict thermal comfort conditions, using a set of developed IoT devices. Two sets of devices were employed and located inside a shared office and outside the residential property nearby. The devices were set up to record both indoor and outdoor temperature and humidity values, providing a comprehensive view of environmental conditions. These devices were strategically placed to capture the minimum data for analysis, ensuring that both internal and external factors affecting thermal comfort were accounted for.
The placement of the IoT devices is shown in Figure 11a,b. The indoor office device was installed on the interior gypsum wall, approximately 1.2 m above the floor, as suggested by established guidelines for thermostat placement. ANSI recommends placing thermostats and other electronic devices within reach of a seated person as an ADA guide [57,58]. ASHRAE-55 recommends placing temperature and humidity sensors between 1.1 and 1.7 m [7]. Most manufacturers recommend placing thermostats within the human breathing zone and keeping sensors at least 50 cm away from heavy walls, such as concrete, to capture data most representative of occupant conditions [59] and to avoid interference with temperature and airflow readings. Gypsum walls have a minimal impact on airflow and temperature distribution. In this study, the developed sensors are positioned on a gypsum wall. Additionally, the airflow from fans directed towards them helps ensure accurate environmental data that reflect typical office conditions. The outdoor sensors are placed at a residential house nearby at a height of 8′ from the floor to monitor the outdoor environmental conditions. The collected indoor and outdoor measurements indicated the effectiveness of the data collection system, ensuring a more comprehensive assessment of environmental factors influencing thermal comfort. This approach highlights the system’s applicability in real-world scenarios, particularly in subtropical climates similar to those of Rawalpindi.
An LOD350 BIM model of the office was developed in Revit 2024 as a digital replica of the physical building. The office space is 36 × 18 × 12 ft. It includes two air terminals for a split HVAC system, accompanied by five ceiling-mounted air fans for improved ventilation. The space is occupied by a team of 24 individuals of mixed genders, working in two shifts: the first from 9 a.m. to 5 p.m. and the second from 3 p.m. to 11:45 p.m. Additionally, eight workstations dedicated to architectural rendering operate regularly, which also contributes to the office’s heating load. The space has one fixed glazing, which is not exposed to direct sunlight, as well as a single door for entry. The office roof, however, is directly exposed to sunlight, influencing indoor temperatures and increasing the demand for the HVAC system. For the sensor device placed in the model, separate Revit families were made and were then placed in the model to correctly reflect the placement and nature of the sensed data. Once the BIM model was completed, it was exported to an IFC 2 × 3 coordination format and saved locally. The IFC file was further loaded into the developed platform, where the developed model was visualized, and upon locating the sensor in the model and clicking on it, a popup displayed the data recorded by that particular device in the web tool. The developed Revit model for the study can be seen in Figure 12.

6. Results

6.1. Pre-Calibration

Before the field implementation of both devices, a preliminary calibration and testing phase was conducted. In this phase, the two devices were placed in the same place indoors, with data collected continuously for a period of seven days at five-minute intervals. During this period, temperature and humidity were recorded using both the newly developed device and an external thermistor (±0.1 °C) for comparison purposes. The results indicated no considerable discrepancies between the two devices in terms of temperature and humidity measurements, as can be seen due to low Root Mean Squared Error (RMSE) and Mean Absolute Error (MAE) values. As shown in Figure 13, temperature readings showed a minimal difference of 0.6 °C between the two devices, while humidity levels remained consistent, showing no noticeable variation between the two. A summary of the data collected from 9 July 2024 to 15 July 2024 and used for calibration is presented in Table 2.
Despite accurate data recordings, other operational issues were observed. This was primarily related to the disconnection and reconnection of the IoT devices during power outages or wireless network resets. These interruptions, though not affecting the sensor data themselves, were a potential risk for continuous data monitoring. To address these concerns, system adjustments were made to ensure automatic reconnection and stabilization following any network or power disruptions. These improvements were implemented prior to the experimental data collection for the study, ensuring that subsequent data would be both accurate and uninterrupted.

6.2. Results of Field Data

Once the preliminary testing of the IoT-based devices was completed and data were successfully recorded on the cloud server, the sensors were deployed in their designated locations. One device was placed inside an office, connected to the cloud via the office Wi-Fi network, while the other was installed at a nearby residential property. Data was continuously recorded throughout the month of August, as illustrated in Figure 14a,b. A summary of the data collected for the study from 15 July 2024 to 15 August 2024 can be seen in Table 3. During the data exploration and cleaning, some data points were missing due to missing timestamps, which resulted in the corresponding values being overwritten in the database with a “0” zero key. To resolve this, linear interpolation was applied to fill the missing values using the Python library pandas. Linear interpolation was chosen because it estimates missing values based on the trend of the surrounding data points, providing a simple yet effective way to maintain continuity in the dataset. Since the data are collected every 5 min, linear interpolation ensures that the imputed values align with the overall time series trend, minimizing distortions and preserving the integrity of the data.
Visual analysis of the recorded data reveals distinct daily and weekly patterns in temperature and humidity fluctuations. Notably, indoor temperatures and humidity levels surge around midnight, when the office is unoccupied, before decreasing in the mid-morning. A subsequent increase occurs in the late afternoon, coinciding with the overlap of both office shifts and excessive roof heat due to sun, followed by a moderate decline when one shift departs. After the HVAC system shuts down, temperatures and humidity begin to escalate. Similarly, weekly trends exhibit decreased temperature and humidity readings during weekdays, with elevated levels on weekends when the office is closed. The mean temperature and humidity graph, accompanied by error bars illustrating daily deviations, shows the overall average temperature and humidity levels observed throughout the week. These findings offer significant insights into daily and weekly variations in indoor temperature and humidity, as can be seen in Figure 15.
After cleaning the data and filling out the missing values using linear interpolation, the temperature and humidity readings were used as input for the sPMV equation. The PMV index was calculated using the enhanced sPMV equation proposed by Burrati. To benchmark sPMV against PMV, PMV was calculated using ASHRAE 55-2023, assuming mean radiant temperature is equal to dry bulb temperature, v = 0.1 m/s, met = 1.0, and clo = 0.5. The sPMV index was calculated using an enhanced Buratti model, with space-specific coefficients for clothing insulation defined in the BIM model (0.25–0.5 clo): a = 0.2803, b = 0.1717, and c = 7.1383. Figure 16a presents the PMV and sPMV indices over time; MAE 0.29 and RMSE 0.37 shows a strong correlation and validates the use of sPMV for preliminary thermal comfort assessments with minimal error. This graph highlights the variations in indoor thermal comfort.
The sPMV data reveal distinct hourly and daily trends in the office’s thermal comfort (see Figure 16b). In the early mornings, before occupancy but after the HVAC system starts, the space is likely comfortable, reflected in the low sPMV. As the workday begins and occupants arrive, sPMV gradually increases due to metabolic heat and equipment usage. A potential dip occurs around lunch, possibly due to reduced activity. The space remains relatively comfortable between shifts, but sPMV rises again as the second shift arrives and activity increases. While weekday sPMV values remain relatively consistent, a significant spike occurs on weekends, when the HVAC system is entirely off, demonstrating the impact of solar gain through the roof in the absence of mechanical cooling during the hottest summer month. This highlights the interplay between occupancy, equipment load, solar radiation, and the HVAC system’s operational schedule in determining the office’s thermal environment.
Machine Learning Models
The dataset used for the ML model in this study consists of indoor temperature and humidity data collected at 5 min intervals over a three-week period. Daily and weekly trends were observed in both temperature and humidity, with periodic fluctuations that align with building occupancy and HVAC use. The average indoor temperature across these data was 29.06 °C, and the mean humidity level was 52.14%. To ensure robust forecasting, the data were split into training and testing sets, with two weeks (4032 data points) used for training and the third week (2016 data points) for testing, beginning from 22-07-2024 at 00:00 and ending on 11-08-2024 at 00:00. This split provided a balanced dataset for assessing the performance of our hybrid model, combining the FB Prophet model and an LSTM network for time series forecasting.
The hybrid forecasting model combines Prophet to capture seasonal and trend components with LSTM to model residuals and temporal dependencies. Indoor temperature and humidity data were first used as inputs for the FB Prophet along with outdoor temp and humidity data as regressors; then, the FB Prophet’s initial prediction and actual values were used to train the LSTM model. Hyperparameter tuning for the hybrid model was performed using manual tuning, with the optimal settings for each model component determined through cross-validation. The hyperparameters related to the hybrid model are shown in Table 4.
The learning curve of the hybrid Prophet–LSTM model demonstrates consistent improvement in predicting temperature, humidity, and sPMV with additional training data. The model’s training error decreases steadily, indicating its capacity to capture both high-level trends and fine-grained temporal patterns. The validation error stabilizes as training progresses, suggesting that the model effectively balances accuracy and generalization, avoiding both overfitting and underfitting. The actual vs. predicted data comparison highlights the FB prophet model and hybrid Prophet-LSTM model’s accuracy in tracking temperature, humidity, and sPMV trends, with predicted values closely aligning with observed data, as shown in Figure 17.
This study further assessed the prediction accuracy for temperature, humidity, and sPMV using MAE, MAPE, R2, and RMSE. Prophet excelled at capturing seasonal and trend patterns, while LSTM outperformed it in dynamic environments, especially with sPMV, effectively learning from previous sequences. The hybrid model combined the strengths of both approaches, achieving consistently better accuracy with lower errors and higher R2 values across all parameters compared to Prophet, as can be seen in Figure 18. For temperature predictions, the hybrid model achieved a test MAE of 0.29 and an R2 of 0.96, outperforming Prophet’s MAE of 0.788 and R2 of 0.891. The complete error matrix for all the parameters is shown in Table 5. These results highlight the hybrid model’s robustness in minimizing prediction errors and improving reliability for dynamic and seasonal data patterns.
The combined use of Prophet and LSTM models offers a comprehensive predictive framework for indoor climate control, with each model’s strengths complementing the other’s limitations. Prophet effectively handles longer-term trends and seasonal fluctuations, making it well suited for applications where regular patterns exist, such as office buildings. In contrast, LSTM excels in handling dynamic, nonlinear changes in temperature, humidity, and sPMV, making it particularly useful for scenarios with irregular occupancy or unpredictable environmental changes. Comparison metrics and visualizations affirm the value of employing a dual-model approach, which could inform adaptive HVAC control systems to enhance thermal comfort. In the developed DT application, each time the user requests forecast data, it initiates a process where a command is sent to a Python server via an API. This server retrieves previously stored historical data of the environment. Upon retrieval, the historical data are used to train a forecasting model in real time. The resulting forecast information is then displayed within the Digital Twin interface, providing users with up-to-date predictive insights based on the latest available data.

7. Discussion

As global temperatures and population rise, the demand for HVAC systems is projected to increase, adding substantial strain on energy resources, given that HVAC systems are among the largest energy consumers in residential and commercial buildings. This study aimed to implement advanced technologies like BIM and IoT to enable the real-time monitoring and visualization of indoor thermal conditions with a focus on optimizing HVAC operations. The proposed systems feature an improved energy efficiency of the building by protecting the overuse of the HVAC system, resulting in lower power consumption and improved thermal comfort. This study concluded that with the sensing capabilities of IoT devices and the parametric modeling features of BIM, the building can be virtually represented with advanced real-time visualization of the indoor thermal conditions, which could also allow the facility manager to remotely control the HVAC system for better optimization of thermal comfort.
This study further monitored and predicted thermal comfort in terms of temperature, humidity, and sPMV using a hybrid ML approach that combined the FB Prophet and LSTM models. The ML model utilized FB Prophet to capture the seasonal and trend components of the time series data, followed by LSTM to model the residuals and additional patterns. The performance of this combined methodology was robust, with the model demonstrating a training R2 of 0.96 and a testing R2 of 0.94 for the sPMV test set. The results are consistent with the study conducted by ElArwady et al. [39], where NeuralProphet achieved training and testing R2 scores of 0.99 and 0.94, respectively. The LSTM models utilized for PMV predictions by Khan et al. [60] attained training and testing R2 scores of 0.94 and 0.83, respectively. While both models effectively captured the dynamics of indoor thermal conditions, LSTM’s integration provided an edge in refining the predictions. The system’s accuracy, evidenced by high R2 scores for both training and testing sets, allows for effective forecasting, contributing to real-time adjustments in indoor comfort levels. This hybrid approach enhances the usability of the framework for monitoring and optimizing thermal comfort in indoor environments.
This study highlights the potential of IoT-based monitoring and DT technology as a powerful, reliable tool for driving energy-saving actions with low-cost devices. This research aimed to address significant gaps in the existing literature on thermal comfort monitoring in the BE. Previous studies have highlighted several limitations, such as insufficient automation [61], poor data management infrastructure [62], underuse of open-source tools [63], and a lack of thorough validation for computational models [64]. To overcome these challenges, this study proposes a new, integrated framework that BIM alongside automation. This cutting-edge system merges advanced automation features, effective data retrieval, and advanced ML-based computational methods to improve the efficiency and accuracy of thermal comfort management in buildings. The framework’s use of open-source hardware and software ensures flexibility, scalability, and cost-effectiveness. This approach also allows for easy integration with existing BMSs, even in closed ecosystems, using standard protocols like MQTT and REST APIs, or middleware for systems using HVAC control protocols such as BACnet.
Future research should address challenges such as the reliance on continuous power supply and stable internet access, which could limit system implementation in areas with wireless constraints. Another focus should be on developing personalized thermal comfort systems that adapt to individual preferences over time. While this study demonstrates the viability of remote sensing for thermal comfort management, it is limited by the small scale of the monitored environment for a short duration; larger-scale implementations involving facility managers are necessary to assess reliability and scalability. Future efforts should improve predictive ML models using techniques like reinforcement learning and edge computing for real-time decision-making while integrating blockchain with DT platforms to boost data security. Ultimately, continued advancements in AI and ML, combined with user feedback, will lead to more adaptive and efficient thermal comfort systems for buildings of the future.

8. Conclusions

The integration of BIM, IoT sensors, and ML algorithms to develop DT represents a significant advancement in optimizing building performance and enhancing occupant comfort. By using real-time data from IoT sensors and utilizing advanced ML-based predictive models, this approach provides actionable insights for facility managers and building owners, enabling them to make informed decisions regarding indoor environmental conditions. The development of a BIM-IoT integrated platform offers a novel way to monitor, control, and predict thermal comfort in buildings, maintaining optimal comfort for occupants. Additionally, hybrid ML prediction models such as FB Prophet and LTSM provide insights for future building operation conditions, thereby enabling smarter control of HVAC systems. This technology promises to be a valuable tool for the future of sustainable BT, driving innovation in the real-time monitoring and predictive management of building environments.
As the construction industry and built environment continue to embrace digital transformation, challenges such as data security, system integration, and cloud reliability must be addressed. Despite these hurdles, the combination of BIM, IoT, and DT frameworks offers vast potential for revolutionizing the way buildings are managed throughout their life cycles. The use of ML techniques enhances predictive capabilities, allowing for more accurate thermal comfort forecasting and improved energy utilization. By refining these technologies and adopting open-source tools, the accessibility of such systems can be broadened, particularly in developing regions where proprietary solutions are often unaffordable. This approach promotes both sustainability and inclusiveness, offering a path toward more efficient and occupant-centric building environments.

Author Contributions

Conceptualization, F.I. and S.M.; methodology, F.I. and S.M.; software, F.I.; validation, F.I. and S.M.; formal analysis, F.I.; investigation, S.M.; resources, S.M.; data curation, F.I.; writing—original draft preparation, F.I. and S.M.; writing—review and editing, F.I.; visualization, F.I.; supervision, S.M.; project administration, S.M. All authors have read and agreed to the published version of the manuscript.

Funding

This research did not receive any specific grant from funding agencies in the public, commercial, or non-profit sectors.

Data Availability Statement

The data and code used in this study are available from the corresponding author and can be shared upon reasonable request.

Conflicts of Interest

The authors declare no conflicts of interest.

References

  1. Zahid, H.; Elmansoury, O.; Yaagoubi, R. Dynamic Predicted Mean Vote: An IoT-BIM Integrated Approach for Indoor Thermal Comfort Optimization. Autom. Constr. 2021, 129, 103805. [Google Scholar] [CrossRef]
  2. Ma, N.; Aviv, D.; Guo, H.; Braham, W.W. Measuring the Right Factors: A Review of Variables and Models for Thermal Comfort and Indoor Air Quality. Renew. Sustain. Energy Rev. 2021, 135, 110436. [Google Scholar] [CrossRef]
  3. Singh, D.; Akram, S.V.; Singh, R.; Gehlot, A.; Buddhi, D.; Priyadarshi, N.; Sharma, G.; Bokoro, P.N. Building Integrated Photovoltaics 4.0: Digitization of the Photovoltaic Integration in Buildings for a Resilient Infra at Large Scale. Electronics 2022, 11, 2700. [Google Scholar] [CrossRef]
  4. Eneyew, D.D.; Capretz, M.A.M.; Bitsuamlak, G.T. Toward Smart-Building Digital Twins: BIM and IoT Data Integration. IEEE Access 2022, 10, 130487–130506. [Google Scholar] [CrossRef]
  5. Chen, Y.; Wang, X.; Liu, Z.; Cui, J.; Osmani, M.; Demian, P. Exploring Building Information Modeling (BIM) and Internet of Things (IoT) Integration for Sustainable Building. Buildings 2023, 13, 288. [Google Scholar] [CrossRef]
  6. Fuller, A.; Fan, Z.; Day, C.; Barlow, C. Digital Twin: Enabling Technologies, Challenges and Open Research. IEEE Access 2020, 8, 108952–108971. [Google Scholar] [CrossRef]
  7. ANSI/ASHRAE Standard 55-2013; Thermal Environmental Conditions for Human Occupancy. ASHRAE: Atlanta, GA, USA, 2013.
  8. Mannan, M.; Al-Ghamdi, S.G. Indoor Air Quality in Buildings: A Comprehensive Review on the Factors Influencing Air Pollution in Residential and Commercial Structure. Int. J. Environ. Res. Public Health 2021, 18, 3276. [Google Scholar] [CrossRef]
  9. Saadatifar, S.; Sawyer, A.O.; Byrne, D.J.; Zhang, Y. Balancing Thermal Comfort with Energy Consumption in Buildings Using Digital Twins, IoT Sensors, and Real-Time Dashboards to Inform Occupant Decision Making. ASHRAE Trans. 2023, 129, 720. [Google Scholar]
  10. Sharma, V.; Mistry, V. Human-Centric HVAC Control: Balancing Comfort and Energy Efficiency. Eur. J. Adv. Eng. Technol. 2024, 10, 42–48. [Google Scholar]
  11. Buratti, C.; Ricciardi, P.; Vergoni, M. HVAC Systems Testing and Check: A Simplified Model to Predict Thermal Comfort Conditions in Moderate Environments. Appl. Energy 2013, 104, 117–127. [Google Scholar] [CrossRef]
  12. Bai, Y.; Liu, K.; Wang, Y. Comparative Analysis of Thermal Preference Prediction Performance in Different Conditions Using Ensemble Learning Models Based on ASHRAE Comfort Database II. Build. Environ. 2022, 223, 109462. [Google Scholar] [CrossRef]
  13. Villa, V.; Naticchia, B.; Bruno, G.; Aliev, K.; Piantanida, P.; Antonelli, D. Iot Open-Source Architecture for the Maintenance of Building Facilities. Appl. Sci. 2021, 11, 5374. [Google Scholar] [CrossRef]
  14. Desogus, G.; Frau, C.; Quaquero, E.; Rubiu, G. From Building Information Model to Digital Twin: A Framework for Building Thermal Comfort Monitoring, Visualizing, and Assessment. Buildings 2023, 13, 1971. [Google Scholar] [CrossRef]
  15. Gil, S.; Mikkelsen, P.H.; Gomes, C.; Larsen, P.G. Survey on Open-Source Digital Twin Frameworks–A Case Study Approach. Softw. Pract. Exp. 2024, 54, 929–960. [Google Scholar] [CrossRef]
  16. Silva, D.G.; Coutinho, C.; Costa, C.J. Factors Influencing Free and Open-Source Software Adoption in Developing Countries—An Empirical Study. J. Open Innov. Technol. Mark. Complex. 2023, 9, 100002. [Google Scholar] [CrossRef]
  17. Mansi, S.A.; Barone, G.; Forzano, C.; Pigliautile, I.; Ferrara, M.; Pisello, A.L.; Arnesano, M. Measuring Human Physiological Indices for Thermal Comfort Assessment through Wearable Devices: A Review. Measurement 2021, 183, 109872. [Google Scholar] [CrossRef]
  18. Ole Fanger, P. Thermal Comfort. Analysis and Applications in Environmental Engineering; Danish Technical Press: Copenhagen, Denmark, 1970; 244p. [Google Scholar]
  19. Orosa, J.A. Research on General Thermal Comfort Models. Eur. J. Sci. Res. 2009, 27, 217–227. [Google Scholar]
  20. Cheung, T.; Schiavon, S.; Parkinson, T.; Li, P.; Brager, G. Analysis of the Accuracy on PMV—PPD Model Using the ASHRAE Global Thermal Comfort Database II. Build. Environ. 2019, 153, 205–217. [Google Scholar] [CrossRef]
  21. Mirzabeigi, S.; Khalili Nasr, B.; Mainini, A.G.; Blanco Cadena, J.D.; Lobaccaro, G. Tailored WBGT as a Heat Stress Index to Assess the Direct Solar Radiation Effect on Indoor Thermal Comfort. Energy Build. 2021, 242, 110974. [Google Scholar] [CrossRef]
  22. Kim, J.; Schiavon, S.; Brager, G. Personal Comfort Models—A New Paradigm in Thermal Comfort for Occupant-Centric Environmental Control. Build. Environ. 2018, 132, 114–124. [Google Scholar] [CrossRef]
  23. Zhang, S.; Yao, R.; Toftum, J.; Essah, E.; Li, B. Machine Learning-Based Approach to Predict Thermal Comfort in Mixed-Mode Buildings: Incorporating Adaptive Behaviors. J. Build. Eng. 2024, 87, 108877. [Google Scholar] [CrossRef]
  24. Kocaman, E.; Kuru Erdem, M.; Calis, G. Machine Learning Thermal Comfort Prediction Models Based on Occupant Demographic Characteristics. J. Therm. Biol. 2024, 123, 103884. [Google Scholar] [CrossRef] [PubMed]
  25. Morresi, N.; Casaccia, S.; Sorcinelli, M.; Arnesano, M.; Uriarte, A.; Torrens-Galdiz, J.I.; Revel, G.M. Sensing Physiological and Environmental Quantities to Measure Human Thermal Comfort through Machine Learning Techniques. IEEE Sens. J. 2021, 21, 12322–12337. [Google Scholar] [CrossRef]
  26. Cipollone, V.; Morresi, N.; Casaccia, S.; Revel, G.M. Robot-Based Measurement of Comfort through Thermal Infrared Imaging and Wearable Sensors. In Proceedings of the 2023 IEEE International Instrumentation and Measurement Technology Conference (I2MTC), Kuala Lumpur, Malaysia, 22–25 May 2023. [Google Scholar]
  27. Zhang, H.; Lee, S.; Tzempelikos, A. Bayesian Meta-Learning for Personalized Thermal Comfort Modeling. Build. Environ. 2024, 249, 111129. [Google Scholar] [CrossRef]
  28. Zhang, H.; Yang, X.; Tu, R.; Huang, J.; Li, Y. Thermal Comfort Modeling of Office Buildings Based on Improved Random Forest Algorithm. In Proceedings of the 2022 IEEE 11th Data Driven Control and Learning Systems Conference (DDCLS), Chengdu, China, 3–5 August 2022. [Google Scholar]
  29. Chai, Q.; Wang, H.; Zhai, Y.; Yang, L. Using Machine Learning Algorithms to Predict Occupants’ Thermal Comfort in Naturally Ventilated Residential Buildings. Energy Build. 2020, 217, 109937. [Google Scholar] [CrossRef]
  30. Qavidel Fard, Z.; Zomorodian, Z.S.; Korsavi, S.S. Application of Machine Learning in Thermal Comfort Studies: A Review of Methods, Performance and Challenges. Energy Build. 2022, 256, 111771. [Google Scholar] [CrossRef]
  31. Fathi, S.; Srinivasan, R.; Fenner, A.; Fathi, S. Machine Learning Applications in Urban Building Energy Performance Forecasting: A Systematic Review. Renew. Sustain. Energy Rev. 2020, 133, 110287. [Google Scholar] [CrossRef]
  32. Chaturvedi, S.; Rajasekar, E.; Natarajan, S.; McCullen, N. A Comparative Assessment of SARIMA, LSTM RNN and Fb Prophet Models to Forecast Total and Peak Monthly Energy Demand for India. Energy Policy 2022, 168, 113097. [Google Scholar] [CrossRef]
  33. Shohan, M.J.A.; Faruque, M.O.; Foo, S.Y. Forecasting of Electric Load Using a Hybrid LSTM-Neural Prophet Model. Energies 2022, 15, 2158. [Google Scholar] [CrossRef]
  34. Rosen, R.; Von Wichert, G.; Lo, G.; Bettenhausen, K.D. About the Importance of Autonomy and Digital Twins for the Future of Manufacturing. IFAC-PapersOnLine 2015, 48, 567–572. [Google Scholar] [CrossRef]
  35. Opoku, D.G.J.; Perera, S.; Osei-Kyei, R.; Rashidi, M. Digital Twin Application in the Construction Industry: A Literature Review. J. Build. Eng. 2021, 40, 102726. [Google Scholar] [CrossRef]
  36. Zhan, H.; Hwang, B.G.; Zhu, H.; Ang, S.H.P. Towards a Sustainable Built Environment Industry in Singapore: Drivers, Barriers, and Strategies in the Adoption of Smart Facilities Management. J. Clean. Prod. 2023, 425, 138726. [Google Scholar] [CrossRef]
  37. Hosamo, H.; Hosamo, M.H.; Nielsen, H.K.; Svennevig, P.R.; Svidt, K. Digital Twin of HVAC System (HVACDT) for Multiobjective Optimization of Energy Consumption and Thermal Comfort Based on BIM Framework with ANN-MOGA. Adv. Build. Energy Res. 2023, 17, 125–171. [Google Scholar] [CrossRef]
  38. Lydon, G.P.; Caranovic, S.; Hischier, I.; Schlueter, A. Coupled Simulation of Thermally Active Building Systems to Support a Digital Twin. Energy Build. 2019, 202, 109298. [Google Scholar] [CrossRef]
  39. ElArwady, Z.; Kandil, A.; Afiffy, M.; Marzouk, M. Modeling Indoor Thermal Comfort in Buildings Using Digital Twin and Machine Learning. Dev. Built Environ. 2024, 19, 100480. [Google Scholar] [CrossRef]
  40. Shahinmoghadam, M.; Natephra, W.; Motamedi, A. BIM- and IoT-Based Virtual Reality Tool for Real-Time Thermal Comfort Assessment in Building Enclosures. Build. Environ. 2021, 199, 107905. [Google Scholar] [CrossRef]
  41. Sonta, A.; Dougherty, T.R.; Jain, R.K. Data-Driven Optimization of Building Layouts for Energy Efficiency. Energy Build. 2021, 238, 110815. [Google Scholar] [CrossRef]
  42. Shah, K.; Prabhakar, T.V.; Sarweshkumar, C.R.; Abhishek, S.V.; Vasanth Kumar, T. Construction of a Digital Twin Framework Using Free and Open-Source Software Programs. IEEE Internet Comput. 2022, 26, 50–59. [Google Scholar] [CrossRef]
  43. Parracho, D.F.R.; Poças Martins, J.; Barreira, E. A Workflow for Photogrammetric and Thermographic Surveys of Buildings with Drones. In New Advances in Building Information Modeling and Engineering Management; Digital Innovations in Architecture, Engineering and Construction; Springer: Cham, Switzerland, 2023. [Google Scholar]
  44. Arowoiya, V.A.; Moehler, R.C.; Fang, Y. Digital Twin Technology for Thermal Comfort and Energy Efficiency in Buildings: A State-of-the-Art and Future Directions. Energy Built Environ. 2024, 5, 641–656. [Google Scholar] [CrossRef]
  45. Maxwell, E. Open Standards, Open Source, and Open Innovation: Harnessing the Benefits of Openness. Innov. Technol. Gov. Glob. 2006, 1, 119–176. [Google Scholar] [CrossRef]
  46. AlBalkhy, W.; Karmaoui, D.; Ducoulombier, L.; Lafhaj, Z.; Linner, T. Digital Twins in the Built Environment: Definition, Applications, and Challenges. Autom Constr 2024, 162, 105368. [Google Scholar] [CrossRef]
  47. Maier, A.; Sharp, A.; Vagapov, Y. Comparative Analysis and Practical Implementation of the ESP32 Microcontroller Module for the Internet of Things. In Proceedings of the 2017 Internet Technologies and Applications (ITA), Wrexham, UK, 12–15 September 2017. [Google Scholar]
  48. Zhong, C.L.; Zhu, Z.; Huang, R.G. Study on the IOT Architecture and Gateway Technology. In Proceedings of the 2015 14th International Symposium on Distributed Computing and Applications for Business Engineering and Science (DCABES), Guiyang, China, 18–24 August 2015. [Google Scholar]
  49. Bello, O.; Zeadally, S. Toward Efficient Smartification of the Internet of Things (IoT) Services. Future Gener. Comput. Syst. 2019, 92, 663–673. [Google Scholar] [CrossRef]
  50. Wang, T.; Gan, V.J.L.; Hu, D.; Liu, H. Digital Twin-Enabled Built Environment Sensing and Monitoring through Semantic Enrichment of BIM with SensorML. Autom. Constr. 2022, 144, 104625. [Google Scholar] [CrossRef]
  51. Ohyver, M.; Moniaga, J.V.; Sungkawa, I.; Subagyo, B.E.; Chandra, I.A. The Comparison Firebase Realtime Database and MySQL Database Performance Using Wilcoxon Signed-Rank Test. Procedia Comput. Sci. 2019, 157, 396–405. [Google Scholar] [CrossRef]
  52. Deng, H.; Liu, Y.; Liu, Y.; Xu, L.; Wang, C. Web-Based Approach for Systematic Analysis and Interactive Visualization of the Industry Foundation Classes Data: A Case Study in Duct Design. J. Asian Archit. Build. Eng. 2023, 22, 1361–1372. [Google Scholar] [CrossRef]
  53. Cipollone, V.; Morresi, N.; Serroni, S.; Casaccia, S.; Giovanardi, M.; Pracucci, A.; Arnone, D.; Revel, G.M. AI-Based Methodology for Thermal Comfort Measurement: Application of a Simplified Comfort Model on a Real-Life Case Study. In Proceedings of the 2024 IEEE International Workshop on Metrology for Living Environment (MetroLivEnv), Chania, Greece, 12–14 June 2024; pp. 286–291. [Google Scholar]
  54. Rohles, F.H. Thermal Sensations of Sedentary Man in Moderate Temperatures. Hum. Factors J. Hum. Factors Ergon. Soc. 1971, 13, 553–560. [Google Scholar] [CrossRef]
  55. Taylor, S.J.; Letham, B. Forecasting at Scale. Am. Stat. 2018, 72, 37–45. [Google Scholar] [CrossRef]
  56. Hochreiter, S.; Schmidhuber, J. Long Short-Term Memory. Neural Comput. 1997, 9, 1735–1780. [Google Scholar] [CrossRef]
  57. Williams, R.; Kilaru, V.J.; Snyder, E.G.; Kaufman, A.; Dye, T.; Rutter, A.; Russell, A.; Hafner, H. Air Sensor Guidebook; US Environmental Protection Agency: Washington, DC, USA, 2014.
  58. ANSI ANSI A117.1-2017; Accessible and Usable Buildings. American National Standards Institute: Washington, DC, USA, 2017.
  59. Andivi Mounting Guidelines for Sensors & General Sensor Installation Recommendations. Available online: https://www.andivi.com/mounting-guidelines-for-sensors-recommendations-sensor-installation (accessed on 19 February 2025).
  60. Khan, A.N.; Rizwan, A.; Ahmad, R.; Kim, D.H. An OCF-IoTivity Enabled Smart-Home Optimal Indoor Environment Control System for Energy and Comfort Optimization. Internet Things 2023, 22, 100712. [Google Scholar] [CrossRef]
  61. Rahmani Asl, M.; Zarrinmehr, S.; Bergin, M.; Yan, W. BPOpt: A Framework for BIM-Based Performance Optimization. Energy Build. 2015, 108, 401–412. [Google Scholar] [CrossRef]
  62. Natephra, W.; Motamedi, A. BIM-Based Live Sensor Data Visualization Using Virtual Reality for Monitoring Indoor Conditions. In Proceedings of the 24th International Conference on Computer-Aided Architectural Design Research in Asia (CAADRIA), Wellington, New Zealand, 15–18 April 2019; Volume 2. [Google Scholar]
  63. Yeom, S.; Kim, J.; Kang, H.; Jung, S.; Hong, T. Digital Twin (DT) and Extended Reality (XR) for Building Energy Management. Energy Build. 2024, 323, 114746. [Google Scholar] [CrossRef]
  64. Dave, B.; Buda, A.; Nurminen, A.; Främling, K. A Framework for Integrating BIM and IoT through Open Standards. Autom. Constr. 2018, 95, 35–45. [Google Scholar] [CrossRef]
Figure 1. Relation between PPD and PMV.
Buildings 15 01584 g001
Figure 2. Framework architecture of the developed real-time monitoring system for thermal comfort.
Buildings 15 01584 g002
Figure 3. (a) Developed sensor device; (b) circuit diagram of the thermal comfort monitoring system.
Buildings 15 01584 g003
Figure 4. Layers of IoT architecture adopted in this study.
Buildings 15 01584 g004
Figure 5. Elements of Digital Twin.
Buildings 15 01584 g005
Figure 6. (a) Firebase data management portal; (b) JSON-based Data Storage Schema.
Buildings 15 01584 g006
Figure 7. Developed DT platform for monitoring and control.
Buildings 15 01584 g007
Figure 8. Data flow, predictive analytics, and user interaction in Digital Twin operations.
Buildings 15 01584 g008
Figure 9. Overview of steps in forecasting process using Facebook Prophet.
Buildings 15 01584 g009
Figure 10. Fundamental structure of LSTM process.
Buildings 15 01584 g010
Figure 11. Device placement locations: (a) indoor and (b) outdoor location.
Buildings 15 01584 g011
Figure 12. Developed Revit model of office case study for Digital Twin: (a) floor plan; (b) 3D representation.
Buildings 15 01584 g012
Figure 13. Pretesting and calibration results: (a) recorded temperature data; (b) humidity data recorded.
Buildings 15 01584 g013
Figure 14. Thermal comfort parameters: (a) temperature; (b) relative humidity.
Buildings 15 01584 g014
Figure 15. Trends and seasonality observed in indoor temperature and humidity data.
Buildings 15 01584 g015
Figure 16. (a) sPMV index calculated using Burrati’s equation; (b) statistical trends in sPMV: daily and weekly patterns.
Buildings 15 01584 g016
Figure 17. Actual vs. predicted values for both temperature, relative humidity, and sPMV: (a) Facebook Prophet; (b) hybrid FB-LSTM model.
Buildings 15 01584 g017
Figure 18. Comparison metrics across models for temperature, relative humidity, and sPMV: (a) MAE; (b) MAPE; (c) RMSE; (d) R2.
Buildings 15 01584 g018
Table 1. Description of sensors used in real-time thermal comfort parameter monitoring.
ComponentSupply VoltageCurrentMemory/Measuring Range
ESP32 Wroom2.2 V~3.6 V80 mAFlash Memory: 4 MB
KY0055 V30~60 mA-
DHT223.5 V~5.5 V0.3 mAHumidity: 0~100 ± 1%; temperature: −40~80 °C ± 0.5
Table 2. Summary of calibration data.
StatisticIndoor Humidity %Indoor Temperature °COutdoor Humidity %Outdoor Temperature °C
Count1645164516451645
Mean51.3732.9150.3633.76
Std6.690.507.801.64
Min32.1031.0623.1031.8
25%46.9832.5646.0033.27
50%51.0032.8050.5033.3
75%54.0033.2953.8033.8
Max71.0034.6971.0045.25
Table 3. Summary of experimental data.
StatisticIndoor Humidity %Indoor Temperature °COutdoor Humidity %Outdoor Temperature °C
Count8440844084408440
Mean52.1429.0657.1134.35
Std8.623.6510.663.34
Min33.9020.651526.81
25%45.1025.8050.832.21
50%50.9029.6159.133.8
75%59.1032.0765.935.6
Max76.9036.917551.3
Table 4. Hyperparameters for FB Prophet and LSTM for time series forecasting.
ModelParameterCurrent Value
FB ProphetSeasonality (weekly)Period = 7; Fourier Order = 14
RegressorsOutdoor Temperature and Humidity
Prediction Frequency1D
LSTMLook-back Window48 h (24 steps at 5 min intervals)
LSTM Layers and Neurons3 layers, 64 neurons each
Batch Size16
Epochs50
OptimizerAdam
Loss FunctionMSE
Table 5. Error metrics for ML models for temperature, humidity, and sPMV.
MAERMSEMAPER2
TrainTestTrainTestTrainTestTrainTest
TemperatureProphet0.7429 °C 0.788 °C0.97 °C0.9986 °C2.683.650.92250.891
Hybrid0.29 °C0.29 °C0.41 °C0.49 °C1.031.120.970.96
HumidityProphet2.4557%2.45933.3718%3.1411%4.664.990.83820.7518
Hybrid0.78%1.27%1.35%1.98%1.582.490.930.91
sPMVProphet0.11070.12150.14660.154224.2726.870.9140.8732
Hybrid0.050.060.070.096.8313.730.960.94
Disclaimer/Publisher’s Note: The statements, opinions and data contained in all publications are solely those of the individual author(s) and contributor(s) and not of MDPI and/or the editor(s). MDPI and/or the editor(s) disclaim responsibility for any injury to people or property resulting from any ideas, methods, instructions or products referred to in the content.

