
An Experiment in Wayfinding in a Subway Station Based on Eye Tracker Analytical Techniques for Universal and Age-Friendly Design


Abstract
:1. Introduction
2. Related Work
2.1. Wayfinding Decision Making
2.2. Spatial Environment Factor
2.3. Eye-Tracking Equipment
3. Methods
3.1. Participants
3.2. Apparatus
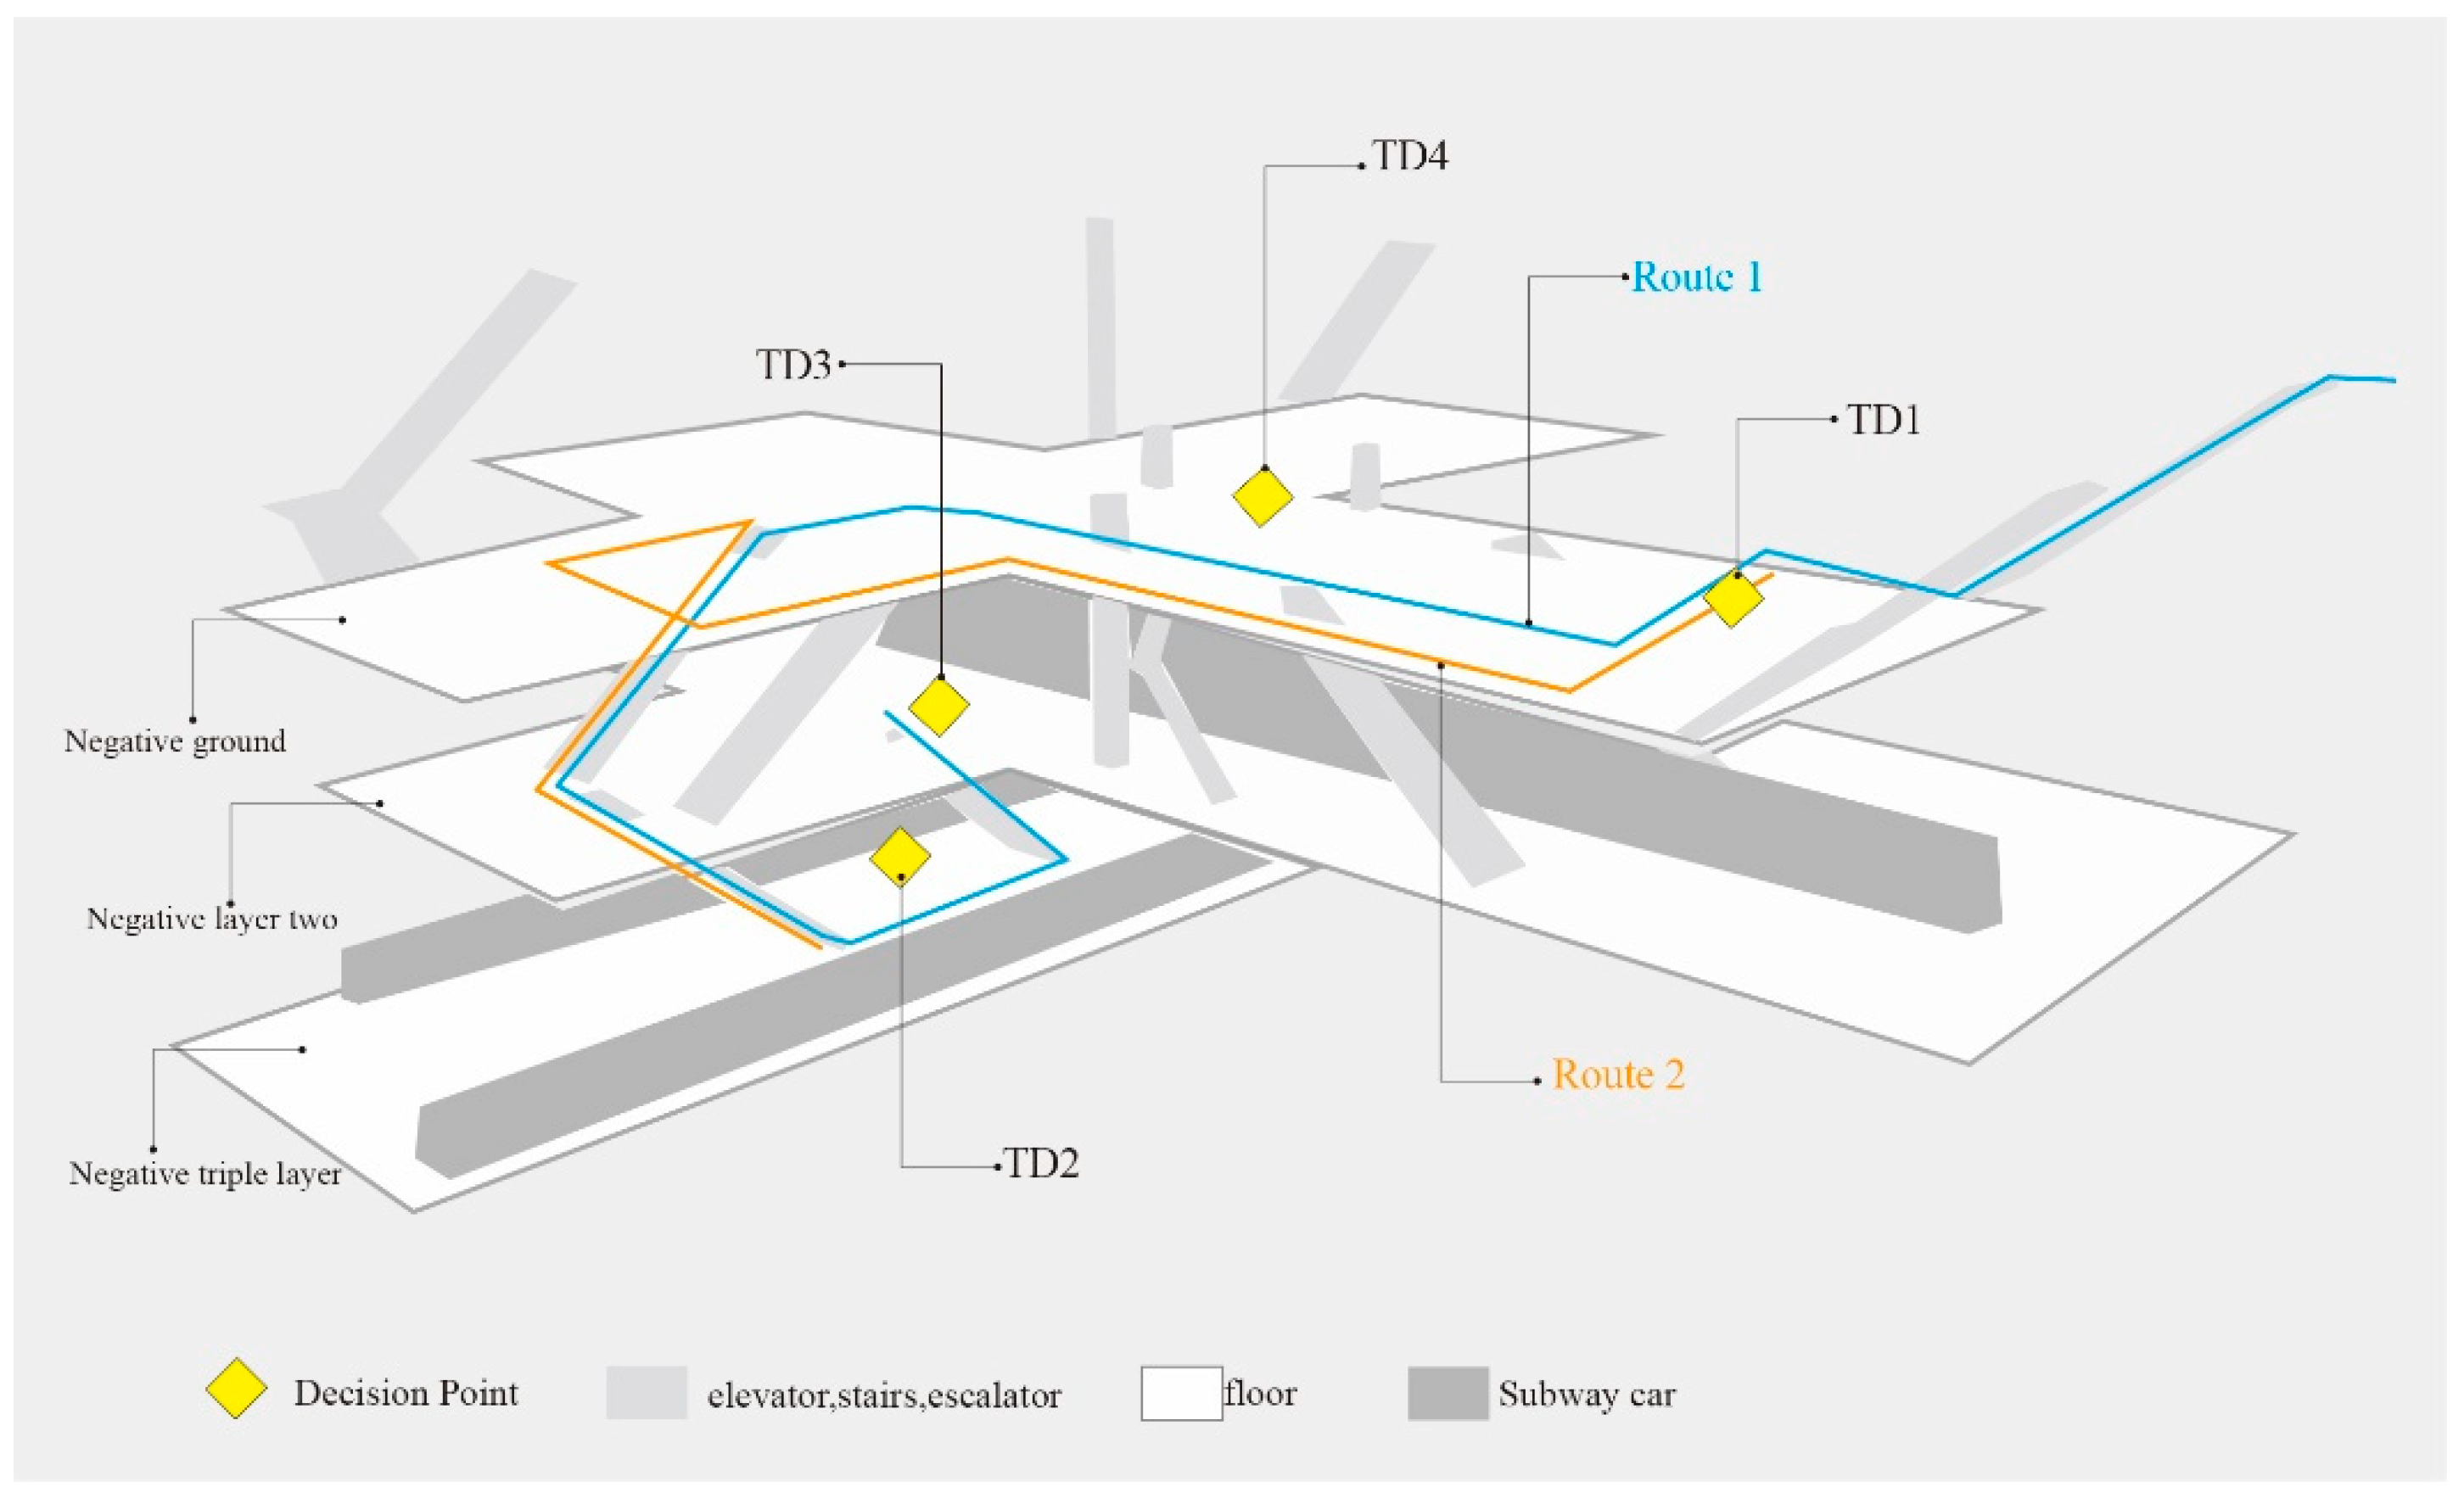
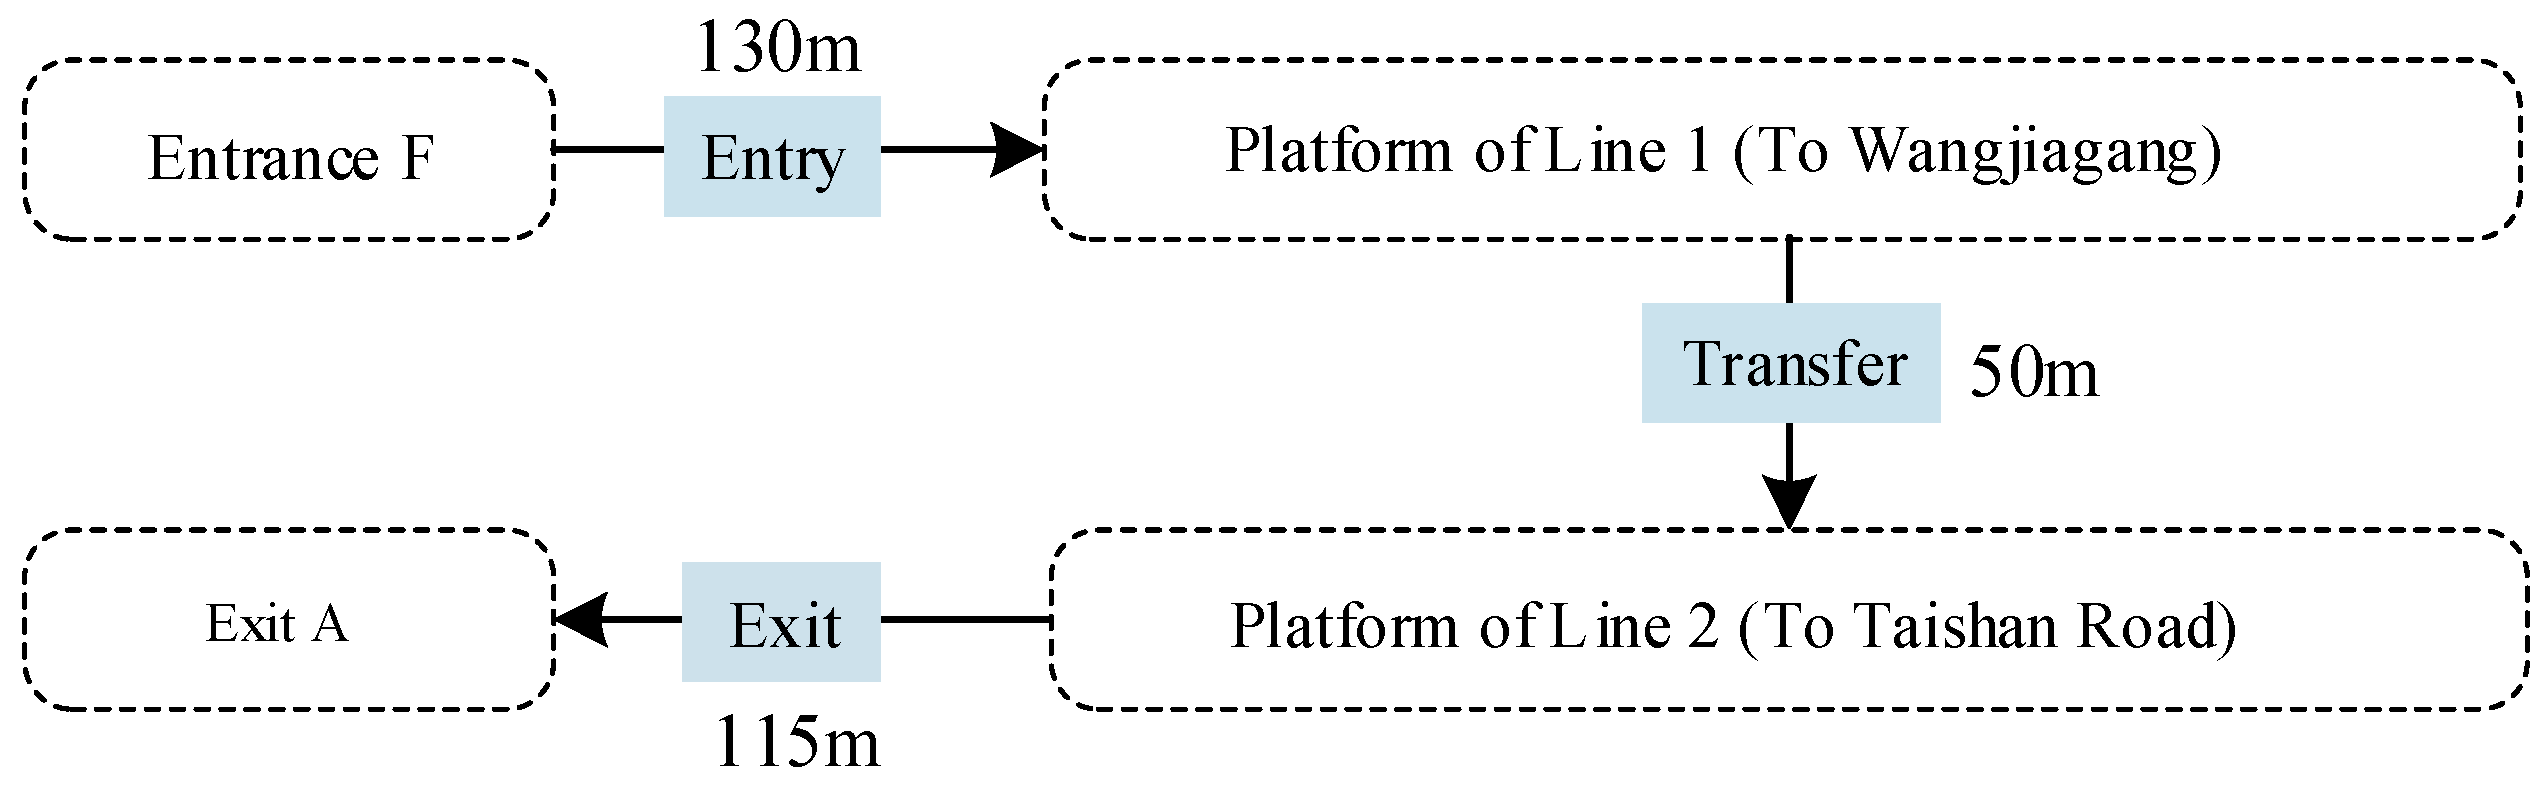
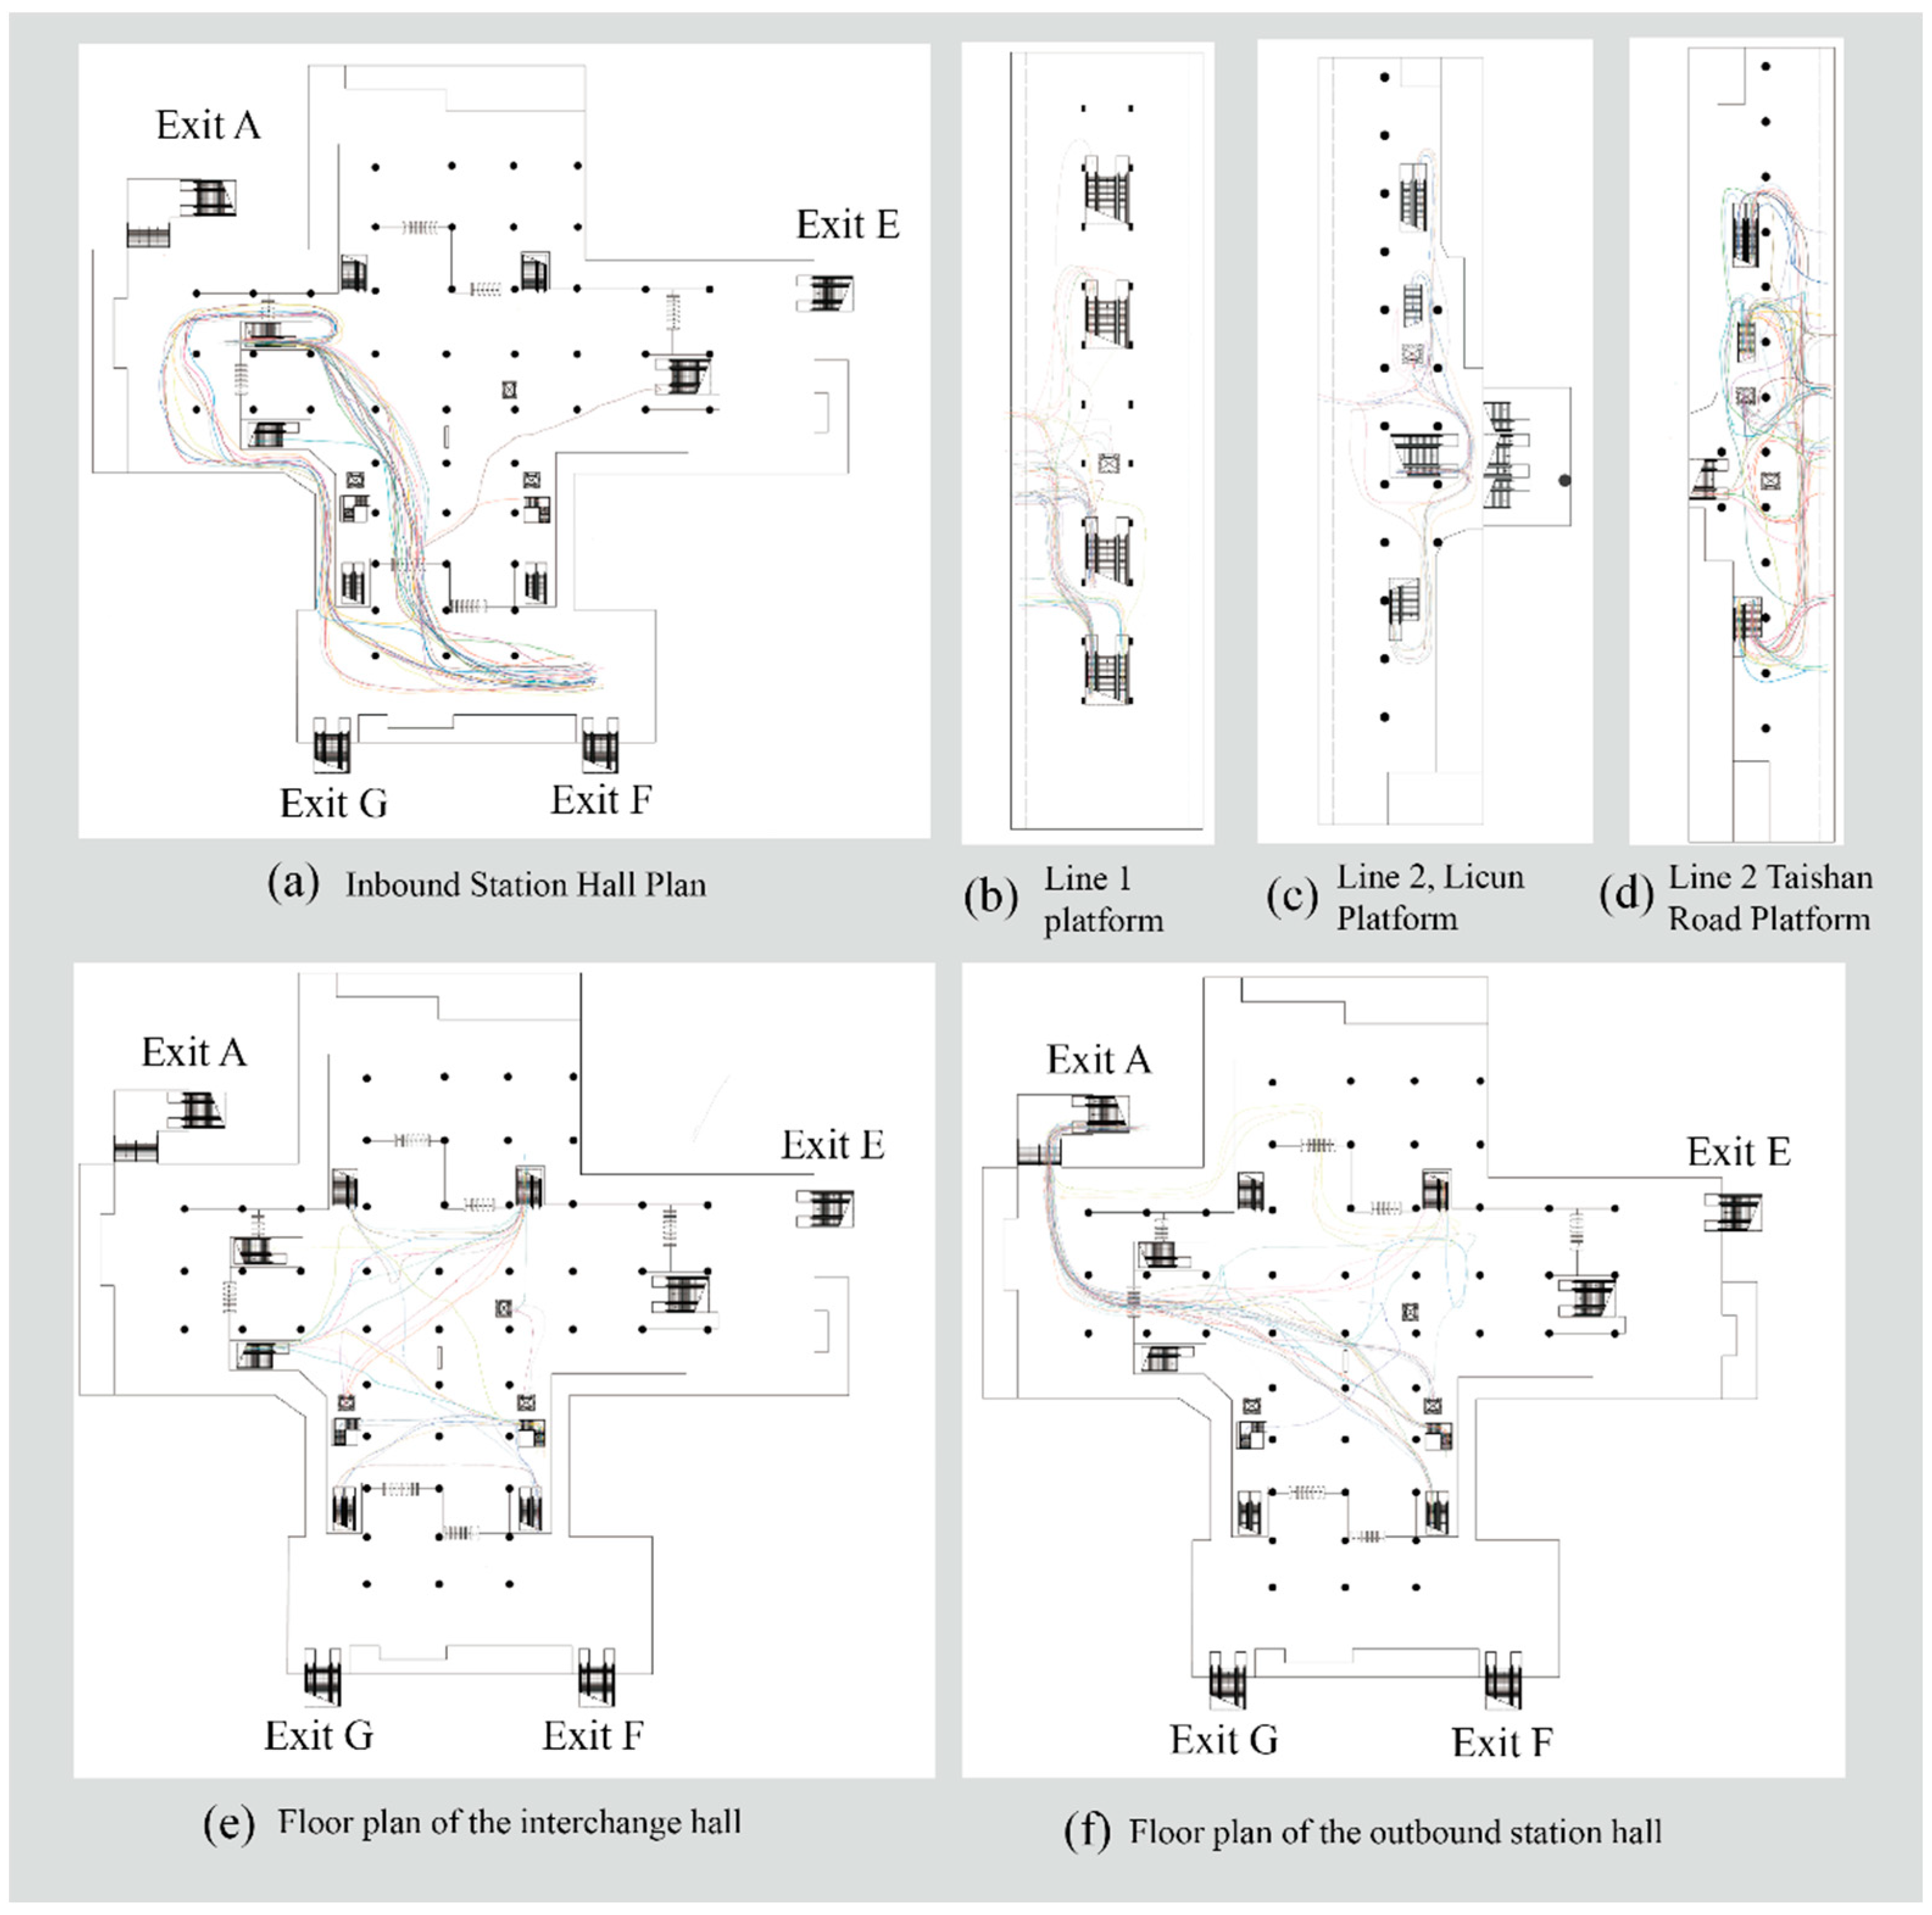
3.3. Experimental Area
3.4. Experiment Design
3.5. Procedure
3.6. Data Analysis
4. Results and Discussions
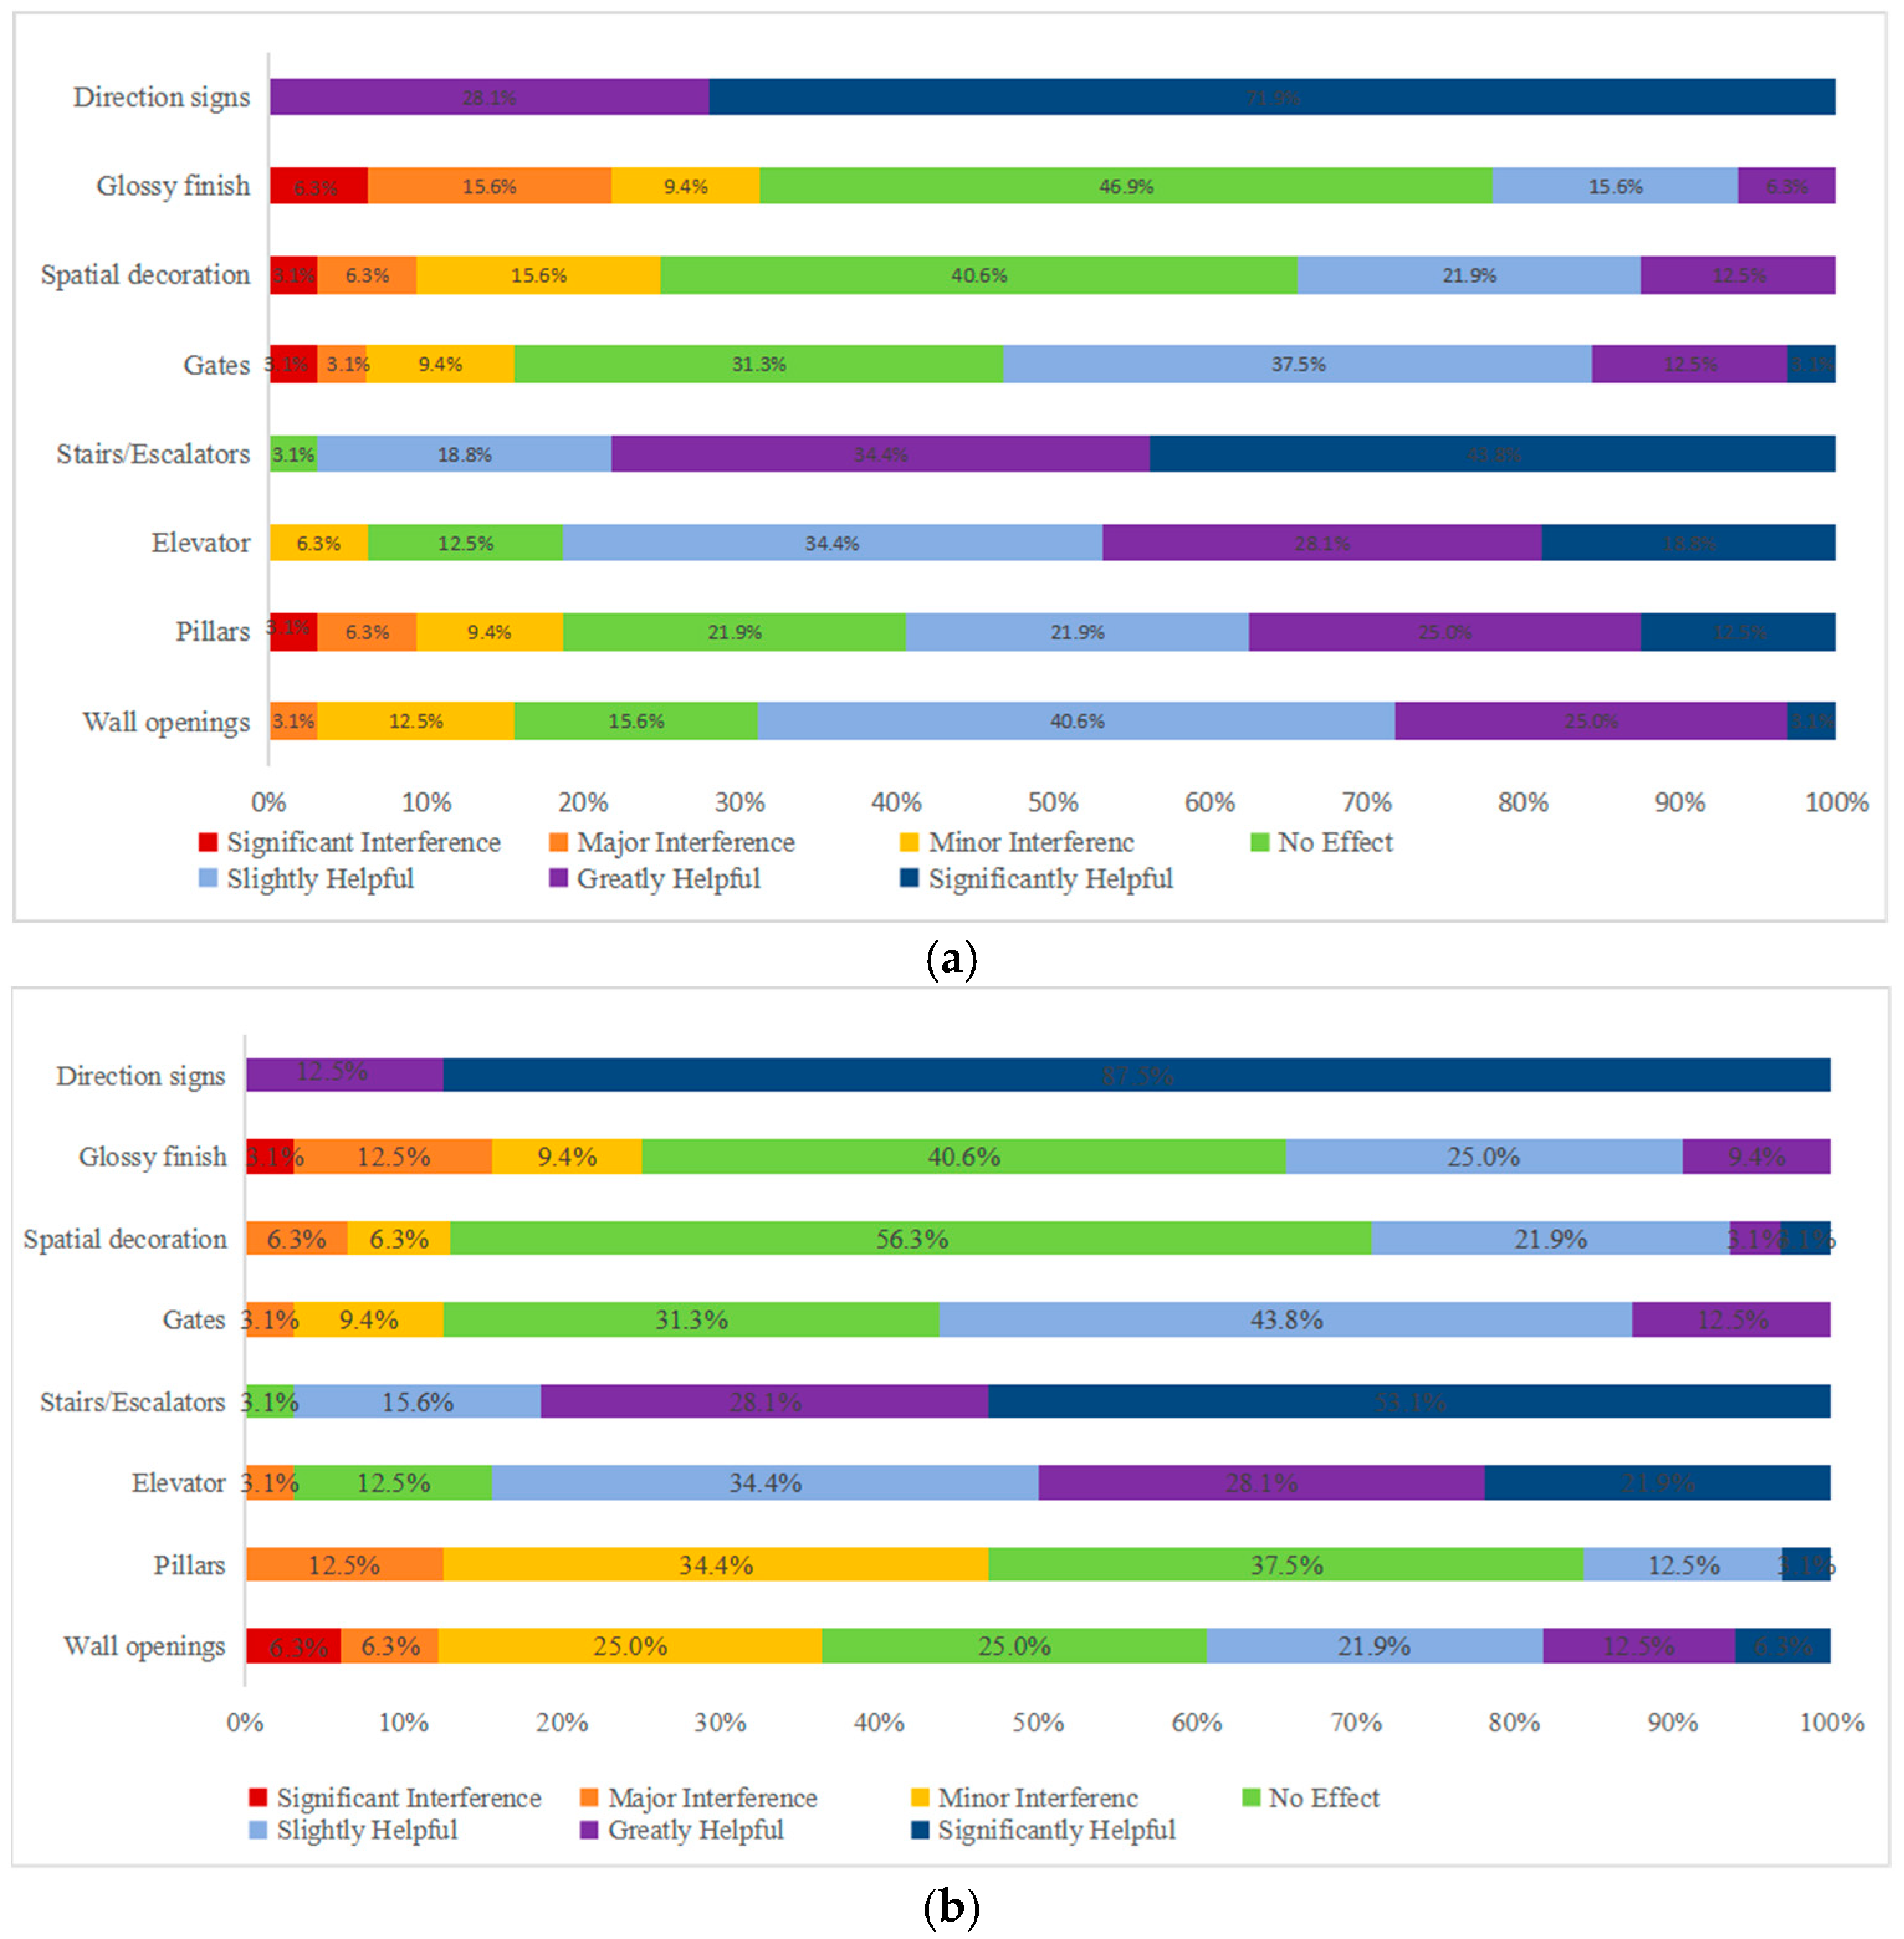
4.1. Wayfinding Assessment
4.2. Movement Path
4.3. Attention Distribution Under Different Behaviors

| Scene Node | Fixation Heat Map | Total Fixation Duration of Environment Factors |
|---|---|---|
| TD1 | 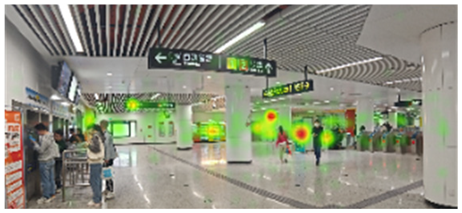 |  |
| TD2 |  |  |
| TD3 | 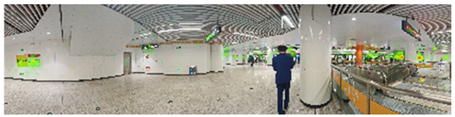 |  |
| TD4 | 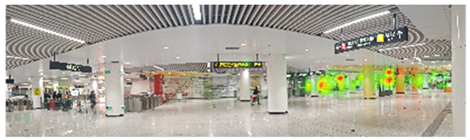 | 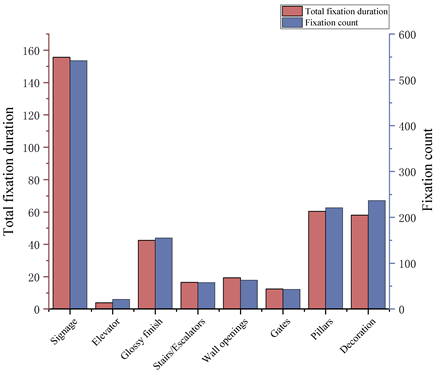 |
4.4. Visual Analysis by AOI
4.5. Nodal Scenario Optimization Recommendations
- (1)
- At the entrance of the subway station hall, it is necessary to avoid providing guidance with multi-directional signs for the same target platform. As shown in the TD1 hotspot map in Table 5 above, the presence of two directions directed towards the platform of Line 1 at the node of this scenario resulted in some participants choosing a longer path to the platform, delaying the efficiency of the passage. Therefore, for the guidance of the target point at the same spatial node, it should mainly indicate the fastest passage route. Even if both routes can lead to the destination, the signboard for the farther route should be placed later to prevent causing route interference to passengers. In addition, in order to cater to people of all age groups, signs in multiple forms should be adopted. For example, dynamic signs and signs with sound prompts should be added, which makes it easier for the elderly or children to obtain information.
- (2)
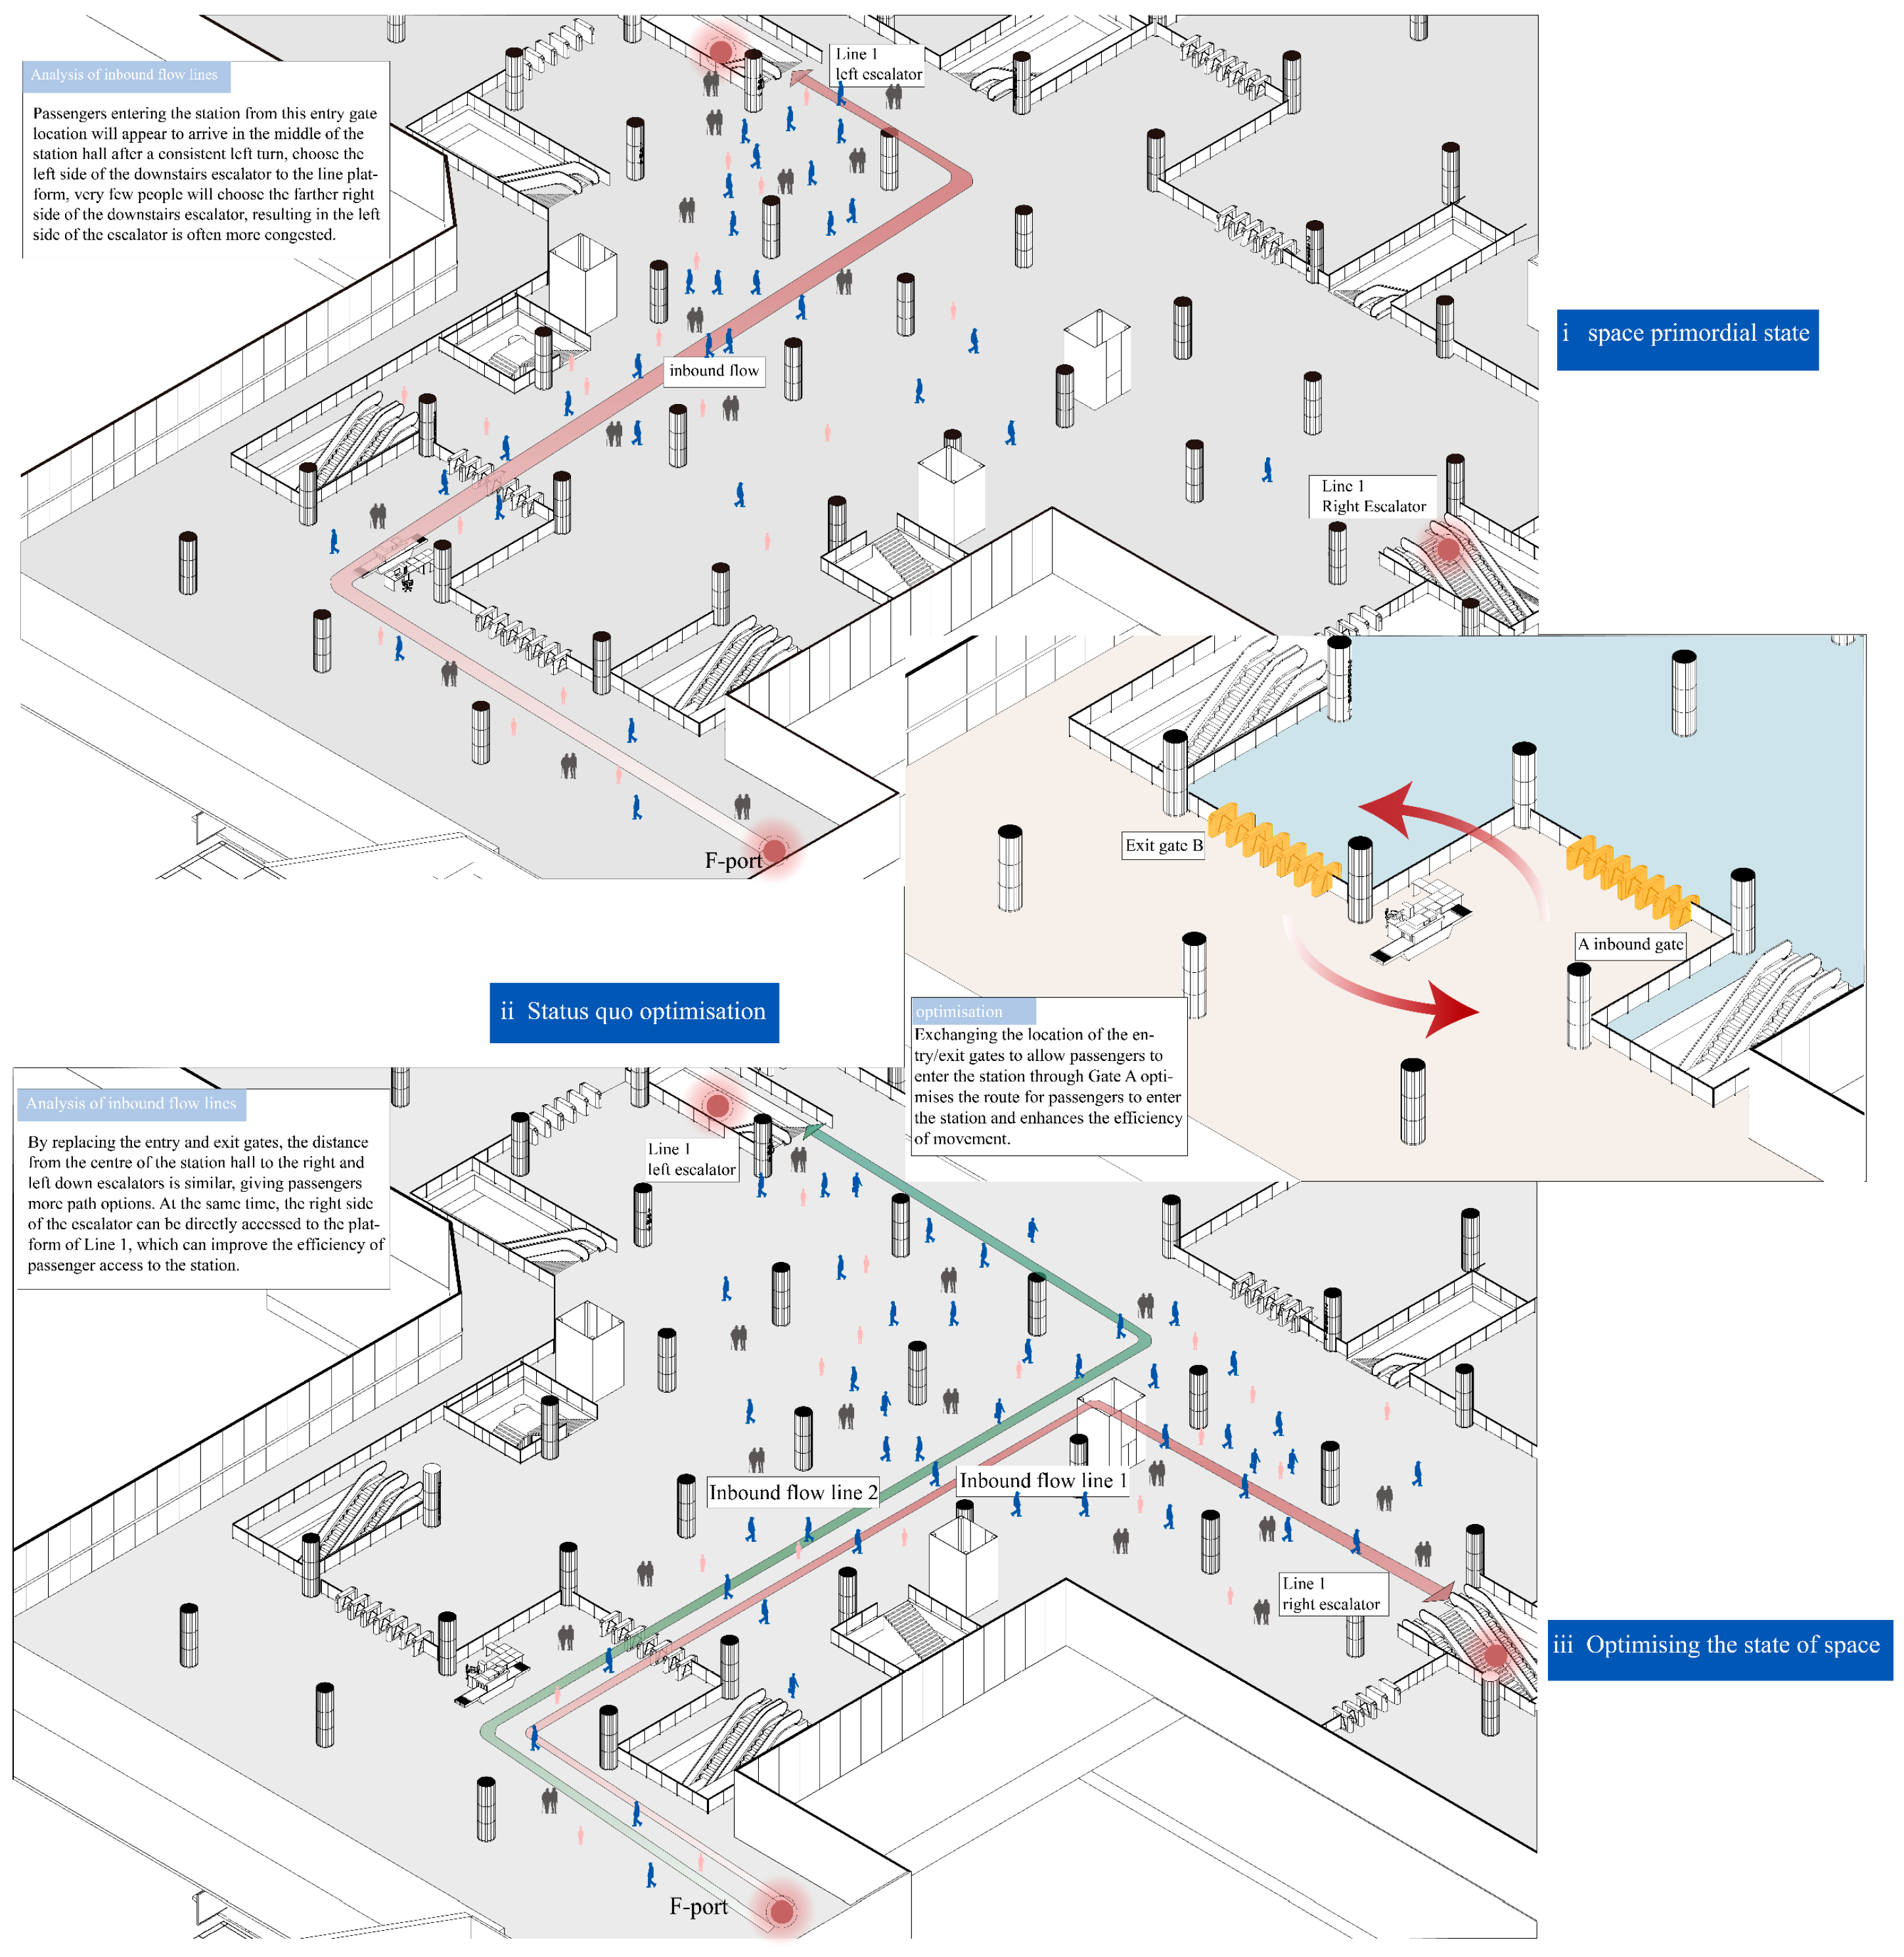
- It is necessary to increase the salience of the stairs/escalators and gate entrance of the station hall. In the TD1 scenario above, some participants increased their passage time precisely because of the inconspicuous location of the stairs/escalators and gate entrance, and the obscuring of the gate entrance by an advertising standing sign, which was not seen by the participants at first glance. This can be realized through the prominent design of the top surface shape or the surrounding interface in which stairs/escalators are located, so that the color of the top shape of each escalator or staircase is consistent, deepening the attention of passengers and their impression in the space, as shown in Figure 10. By contrasting the color with the surrounding environment, some interesting decorations can be added to the design to attract younger passengers for wayfinding. At the same time, it reduces the blocking of movable objects such as advertising billboards to the gate machine, and increases the “exposure” of the gate machine in the space.
- (3)
- Taidong Station, given its cross-shaped spatial layout, is more complicated for passengers who are unfamiliar with metro stations. In the design of the station, the spatial layout of the station should be optimized, making the layout of the upper and lower floors as consistent as possible, reducing the number of complex passages and corners, facilitating the rapid establishment of cognitive maps for passengers, reducing the possibility of passengers getting lost, and making it easier for elderly people and children with weak spatial cognitive ability to find their way around. In addition, one can set up a sufficient rest area in the space, which are also convenient for the elderly and children to rest in the process of finding their way; the location of the rest area should also be obvious and easy to reach.
- (4)
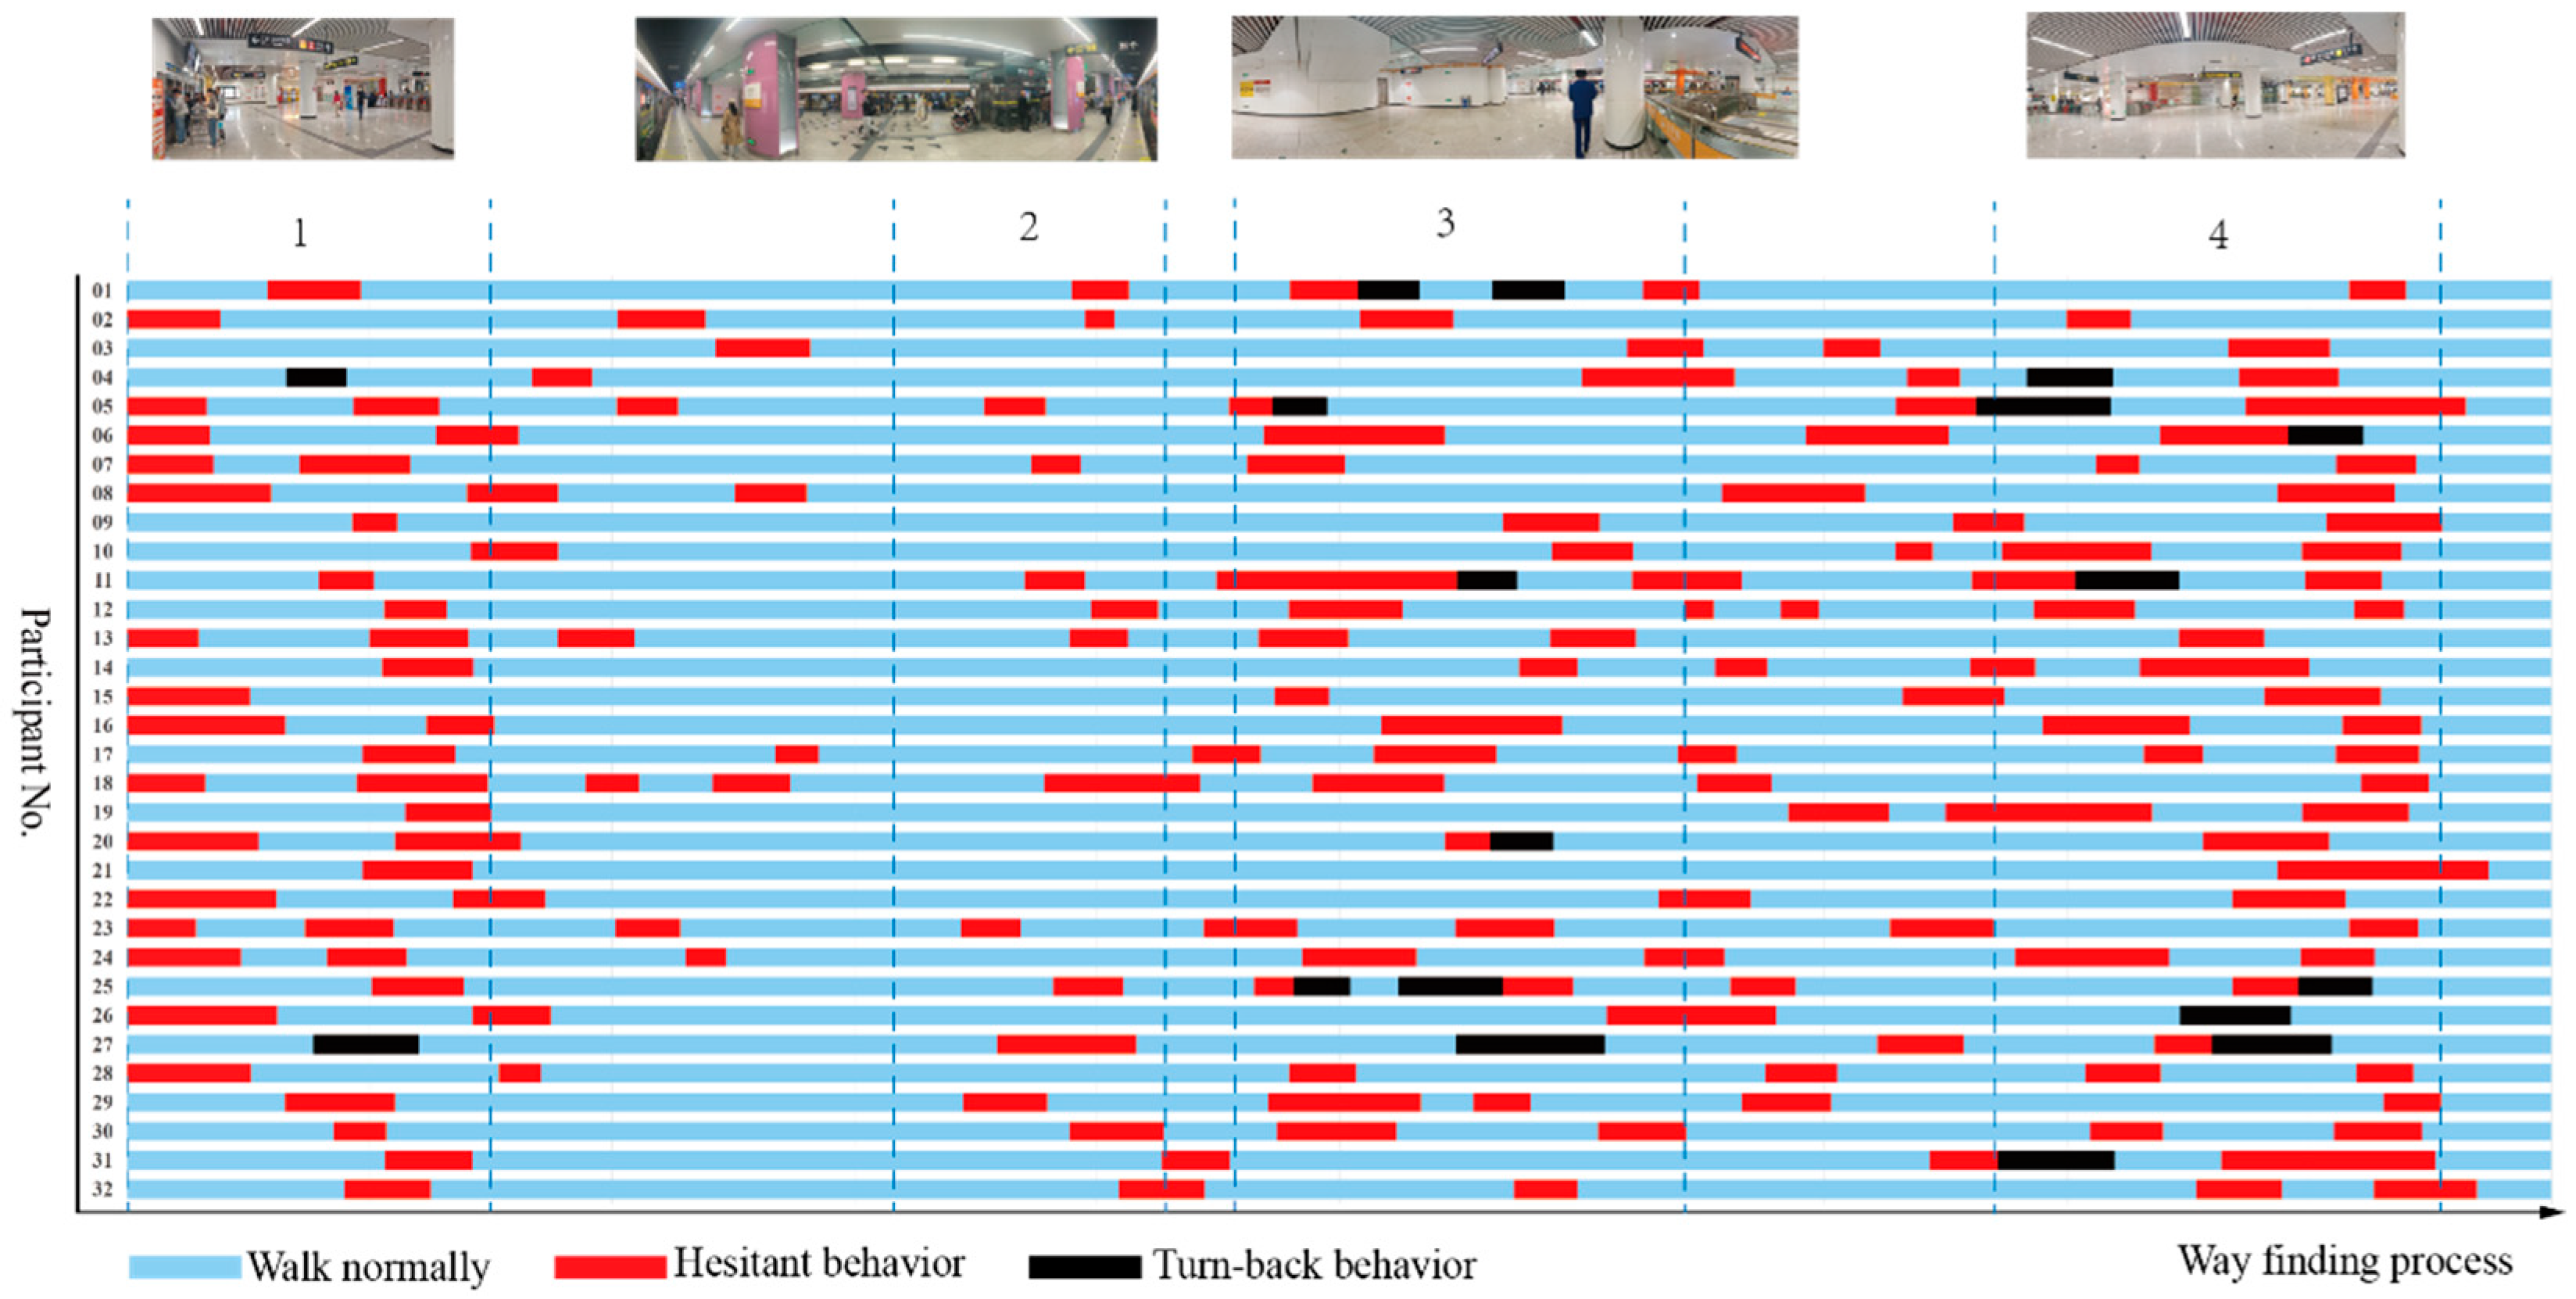
- Improved signage and enhanced spatial guidance. In Figure 7 above, it can be seen that participants showed more hesitation and folding behavior at the TD3 scenario, precisely because there was no continuous guidance to the signage of the Taishan Road platform at that scenario, which resulted in participants not being able to quickly find the target building escalator for wayfinding. The hotspot map in Table 5 also illustrates the problem. Therefore, in the design of metro stations, the legibility and coherence of signage should be enhanced to ensure that signs can be quickly recognized by passengers of all ages. For example, brightly colored signs with cartoon images should be designed for children to attract their attention, and larger, high-contrast signs should be provided for the elderly to make it easier for them to view, thus improving the efficiency of passengers’ wayfinding. In addition, the regional division of station space should be optimized, including the design of spatial guidance on the top surface or other interfaces, the station hall space can be combined with the flow of passengers into the station and out of the station for the guidance and division of interfaces, including by highlighting the main axis of the way, the main axis of the area using different shapes and colors and other spatial areas separate, forming a dynamic spatial guidance, to give passengers spatial psychological guidance hints.
5. Conclusions
Author Contributions
Funding
Data Availability Statement
Conflicts of Interest
References
- Lin, J.; Cao, L.; Li, N. How the completeness of spatial knowledge influences the evacuation behavior of passengers in metro stations: A VR-based experimental study. Autom. Constr. 2020, 113, 103136. [Google Scholar] [CrossRef]
- Shiwakoti, N.; Tay, R.; Stasinopoulos, P.; Woolley, P.J. Likely behaviours of passengers under emergency evacuation in train station. Saf. Sci. 2017, 91, 40–48. [Google Scholar] [CrossRef]
- Shang, T.; Lu, H.; Wu, P.; Wei, Y. Eye-Tracking Evaluation of Exit Advance Guide Signs in Highway Tunnels in Familiar and Unfamiliar Drivers. Int. J. Environ. Res. Public Health 2021, 18, 6820. [Google Scholar] [CrossRef] [PubMed]
- Zhang, Y.; Zhu, H.; Guo, Q.; Carvel, R.; Yan, Z. The effect of technical installations on evacuation performance in urban road tunnel fires. Tunnell. Undergr. Space Technol. 2021, 107, 103608. [Google Scholar] [CrossRef]
- Fu, M.; Liu, R.; Zhang, Y. Do people follow neighbors? An immersive virtual reality experimental study of social influence on individual risky decisions during evacuations. Autom. Construct. 2021, 126, 103644. [Google Scholar] [CrossRef]
- Lin, J.; Zhu, R.; Li, N.; Becerik-Gerber, B. Do people follow the crowd in building emergency evacuation? A cross-cultural immersive virtual reality-based study. Adv. Eng. Inform. 2020, 43, 101040. [Google Scholar] [CrossRef]
- Andresen, E.; Chraibi, M.; Seyfried, A. A representation of partial spatial knowledge: A cognitive map approach for evacuation simulations. Transp. A Transp. Sci. 2018, 14, 433–467. [Google Scholar] [CrossRef]
- Lin, J.; Li, N.; Fang, D. VR Based Assessment of Effects of Gender and Stress on Indoor Wayfinding During Building Emergencies. In Proceedings of the 18th International Conference on Construction Applications of Virtual Reality, Auckland, New Zealand, 22–23 November 2018; Available online: https://www.researchgate.net/profile/Jing-Lin-10/publication/334120525_VR_BASED_ASSESSMENT_OF_EFFECTS_OF_GENDER_AND_STRESS_ON_INDOOR_WAYFINDING_DURING_BUILDING_EMERGENCIES/links/5d18a4dc92851cf440576ee2/VR-BASED-ASSESSMENT-OF-EFFECTS-OF-GENDER-AND-STRESS-ON-INDOOR-WAYFINDING-DURING-BUILDING-EMERGENCIES.pdf (accessed on 1 November 2023).
- Livingstone-Lee, S.A.; Zeman, P.M.; Gillingham, S.T.; Skelton, R.W. Navigational strategy may be more a matter of environment and experience than gender. Learn. Motiv. 2014, 45, 30–43. [Google Scholar] [CrossRef]
- Vilar, E.; Rebelo, F.; Noriega, P.; Teles, J.; Mayhorn, C. The Influence of Environmental Features on Route Selection in an Emergency Situation. Appl. Ergon. 2013, 44, 618–627. [Google Scholar] [CrossRef]
- Feng, Y.; Duives, D.C.; Hoogendoorn, S.P. Development and evaluation of a VR research tool to study wayfinding behaviour in a multi-story building. Saf. Sci. 2022, 147, 105573. [Google Scholar] [CrossRef]
- Vilar, E.; Rebelo, F.; Noriega, P.; Duarte, E.; Mayhorn, C.B. Effects of competing environmental variables and signage on route-choices in simulated everyday and emergency wayfinding situations. Ergonomics 2014, 57, 511–524. [Google Scholar] [CrossRef] [PubMed]
- Cosma, G.; Ronchi, E.; Nilsson, D. Way-finding lighting systems for rail tunnel evacuation: A virtual reality experiment with Oculus Rift®. J. Transp. Saf. Secur. 2016, 8, 101–117. [Google Scholar] [CrossRef]
- Dong, W.; Qin, T.; Yang, T.; Liao, H.; Liu, B.; Meng, L.; Liu, Y. Wayfinding Behavior and Spatial Knowledge Acquisition: Are They the Same in Virtual Reality and in Real-World Environments? Ann. Am. Assoc. Geogr. 2022, 112, 226–246. [Google Scholar] [CrossRef]
- Lin, J.; Cao, L.; Li, N. Assessing the influence of repeated exposures and mental stress on human wayfinding performance in indoor environments using virtual reality technology. Adv. Eng. Inf. 2019, 39, 53–61. [Google Scholar] [CrossRef]
- Ding, N. The effectiveness of evacuation signs in buildings based on eye tracking experiment. Nat. Hazards 2020, 103, 1201–1218. [Google Scholar] [CrossRef]
- Wang, C.; Chen, Y.; Zheng, S. Gender and age differences in using indoor maps for wayfinding in real environments. ISPRS Int. J. Geo-Inf. 2018, 8, 11. [Google Scholar] [CrossRef]
- Farr, A.C.; Kleinschmidt, T.; Yarlagadda, P.; Mengersen, K. Wayfinding: A simple concept, a complex process. J. Transp. Rev. 2012, 32, 715–743. [Google Scholar] [CrossRef]
- Nilsson, D.; Johansson, A. Social influence during the initial phase of a fire evacuation—Analysis of evacuation experiments in a cinema theatre. Fire Saf. J. 2009, 44, 71–79. [Google Scholar] [CrossRef]
- Shi, Y.; Zhang, Y.; Wang, T.; Li, C.; Yuan, S. The effects of ambient illumination, color combination, sign height, and observation angle on the legibility of wayfinding signs in metro stations. Sustainability 2020, 12, 4133. [Google Scholar] [CrossRef]
- Cao, L.; Lin, J.; Li, N. A virtual reality based study of indoor fire evacuation after active or passive spatial exploration. Comput. Hum. Behav. 2019, 90, 37–45. [Google Scholar] [CrossRef]
- Lin, J.; Zhu, R.; Li, N.; Becerik-Gerber, B. How occupants respond to building emergencies: A systematic review of behavioral characteristics and behavioral theories. Saf. Sci. 2020, 122, 104540. [Google Scholar] [CrossRef]
- Yu, L.; Wang, Z.; Chen, F.; Li, Y.; Wang, W. Subway passengers’ wayfinding behaviors when exposed to signage: An experimental study in virtual reality with eye-tracker. Saf. Sci. 2023, 162, 106096. [Google Scholar] [CrossRef]
- Tahir, R.; Krogstie, J. Impact of navigation aid and spatial ability skills on wayfinding performance and workload in indoor–outdoor campus navigation: Challenges and design. Appl. Sci. 2023, 13, 9508. [Google Scholar] [CrossRef]
- Kinateder, M.; Comunale, B.; Warren, W.H. Exit choice in an emergency evacuation scenario is influenced by exit familiarity and neighbor behavior. Saf. Sci. 2018, 106, 170–175. [Google Scholar] [CrossRef]
- Arthur, P.; Passini, R. Wayfinding: People, signs, and architecture. Inf. Des. J. 1998, 9, 220–222. [Google Scholar]
- Hölscher, C.; Meilinger, T.; Vrachliotis, G.; Brösamle, M.; Knauff, M. Up and down staircase wayfinding strategies in multi-level buildings. J. Environ. Psychol. 2006, 26, 284–299. [Google Scholar] [CrossRef]
- Li, H.; Xu, J.; Zhang, X.; Ma, F. How Do Subway Signs Affect Pedestrians’ Wayfinding Behavior through Visual Short-Term Memory? Sustainability 2021, 13, 6866. [Google Scholar] [CrossRef]
- Wong, L.T.; Lo, K.C. Experimental study on visibility of exit signs in buildings. Build. Environ. 2007, 42, 1836–1842. [Google Scholar] [CrossRef]
- Motamedi, A.; Wang, Z.; Yabuki, N.; Fukuda, T.; Michikawa, T. Signage visibility analysis and optimization system using BIM-enabled virtual reality (VR) environments. Adv. Eng. Inform. 2017, 32, 248–262. [Google Scholar] [CrossRef]
- O’Neill, M.J. Effects of Signage and Floor Plan Configuration on Wayfinding Accuracy. Environ. Behav. 1991, 23, 553–574. [Google Scholar] [CrossRef]
- Arthur, P.; Passini, R. Wayfinding: People, Signs, and Architecture; McGrawHill Companies: New York, NY, USA, 2002. [Google Scholar]
- Chen, N.; Zhao, M.; Gao, K.; Zhao, J. The Physiological Experimental Study on the Effect of Different Color of Safety Signs on a Virtual Subway Fire Escape—An Exploratory Case Study of Zijing Mountain Subway Station. Int. J. Environ. Res. Public Health 2020, 17, 5903. [Google Scholar] [CrossRef]
- Tang, M.; Auffrey, C. Advanced Digital Toals for Updating Overcrowded Rail Stations: Using Eye Tracking, Virtual Reality, and Crowd Simulation to Support Design Decision-making. Urban Rail Transit 2018, 4, 249–256. [Google Scholar] [CrossRef]
- Wiener, J.M.; Hölscher, C.; Büchner, S.; Konieczny, L. Gaze Behaviour during Space Perceptionand Spatial Decision Making. Psychol. Res. 2012, 76, 713–729. [Google Scholar] [CrossRef]
- Schrom-Feiertag, H.; Settgast, V.; Seer, S. Evaluation of indoor guidance systems using eye tracking in an immersive virtual environment. Spat. Cogn. Comput. 2017, 17, 163–183. [Google Scholar] [CrossRef]
- Dong, W.H. Principles and Methods of Eye—Tracking Experiments in Cartographic Spatial Cognition; Science Press: Beijing, China, 2023; p. 6. [Google Scholar]
- Fu, L.; Cao, S.; Song, W.; Fang, J. The influence of emergency signage on building evacuation behavior: An experimental study. Fire Mater. 2019, 43, 22–33. [Google Scholar] [CrossRef]
- Afrooz, A.; White, D.; Parolin, B. Effects of active and passive exploration of the built environment on memory during wayfinding. Appl. Geogr. 2018, 101, 68–74. [Google Scholar] [CrossRef]
- Meng, F.; Zhang, W. Way-finding during a fire emergency: An experimental study in a virtual environment. Ergonomics 2014, 57, 816–827. [Google Scholar] [CrossRef]
- Kuligowski, E.D. Human Behavior in Fire. In SFPE Handbook of Fire Protection Engineering; Hurley, M.J., Gottuk, D., Hall, J.R., Harada, K., Kuligowski, E., Puchovsky, M., Torero, J., Watts, J.M., Wieczorek, C., Eds.; Springer: New York, NY, USA, 2016; pp. 2070–2114. [Google Scholar]
- Zhou, Y.; Cheng, X.; Zhu, L.; Qin, T.; Dong, W.; Liu, J. How does gender affect indoor wayfinding under time pressure? Cartogr. Geogr. Inf. Sci. 2020, 47, 367–380. [Google Scholar] [CrossRef]
- Jeon, G.; Na, W.; Hong, W.; Lee, J. Influence of design and installation of emergency exit signs on evacuation speed. J. Asian Arch. Build. Eng. 2019, 18, 104–111. [Google Scholar] [CrossRef]
- Dalmaso, M. Exploring the social environment with the eyes: A review of the impact of facial stimuli on saccadic trajectories. Int. J. Environ. Res. Public Health 2022, 19, 16615. [Google Scholar] [CrossRef]
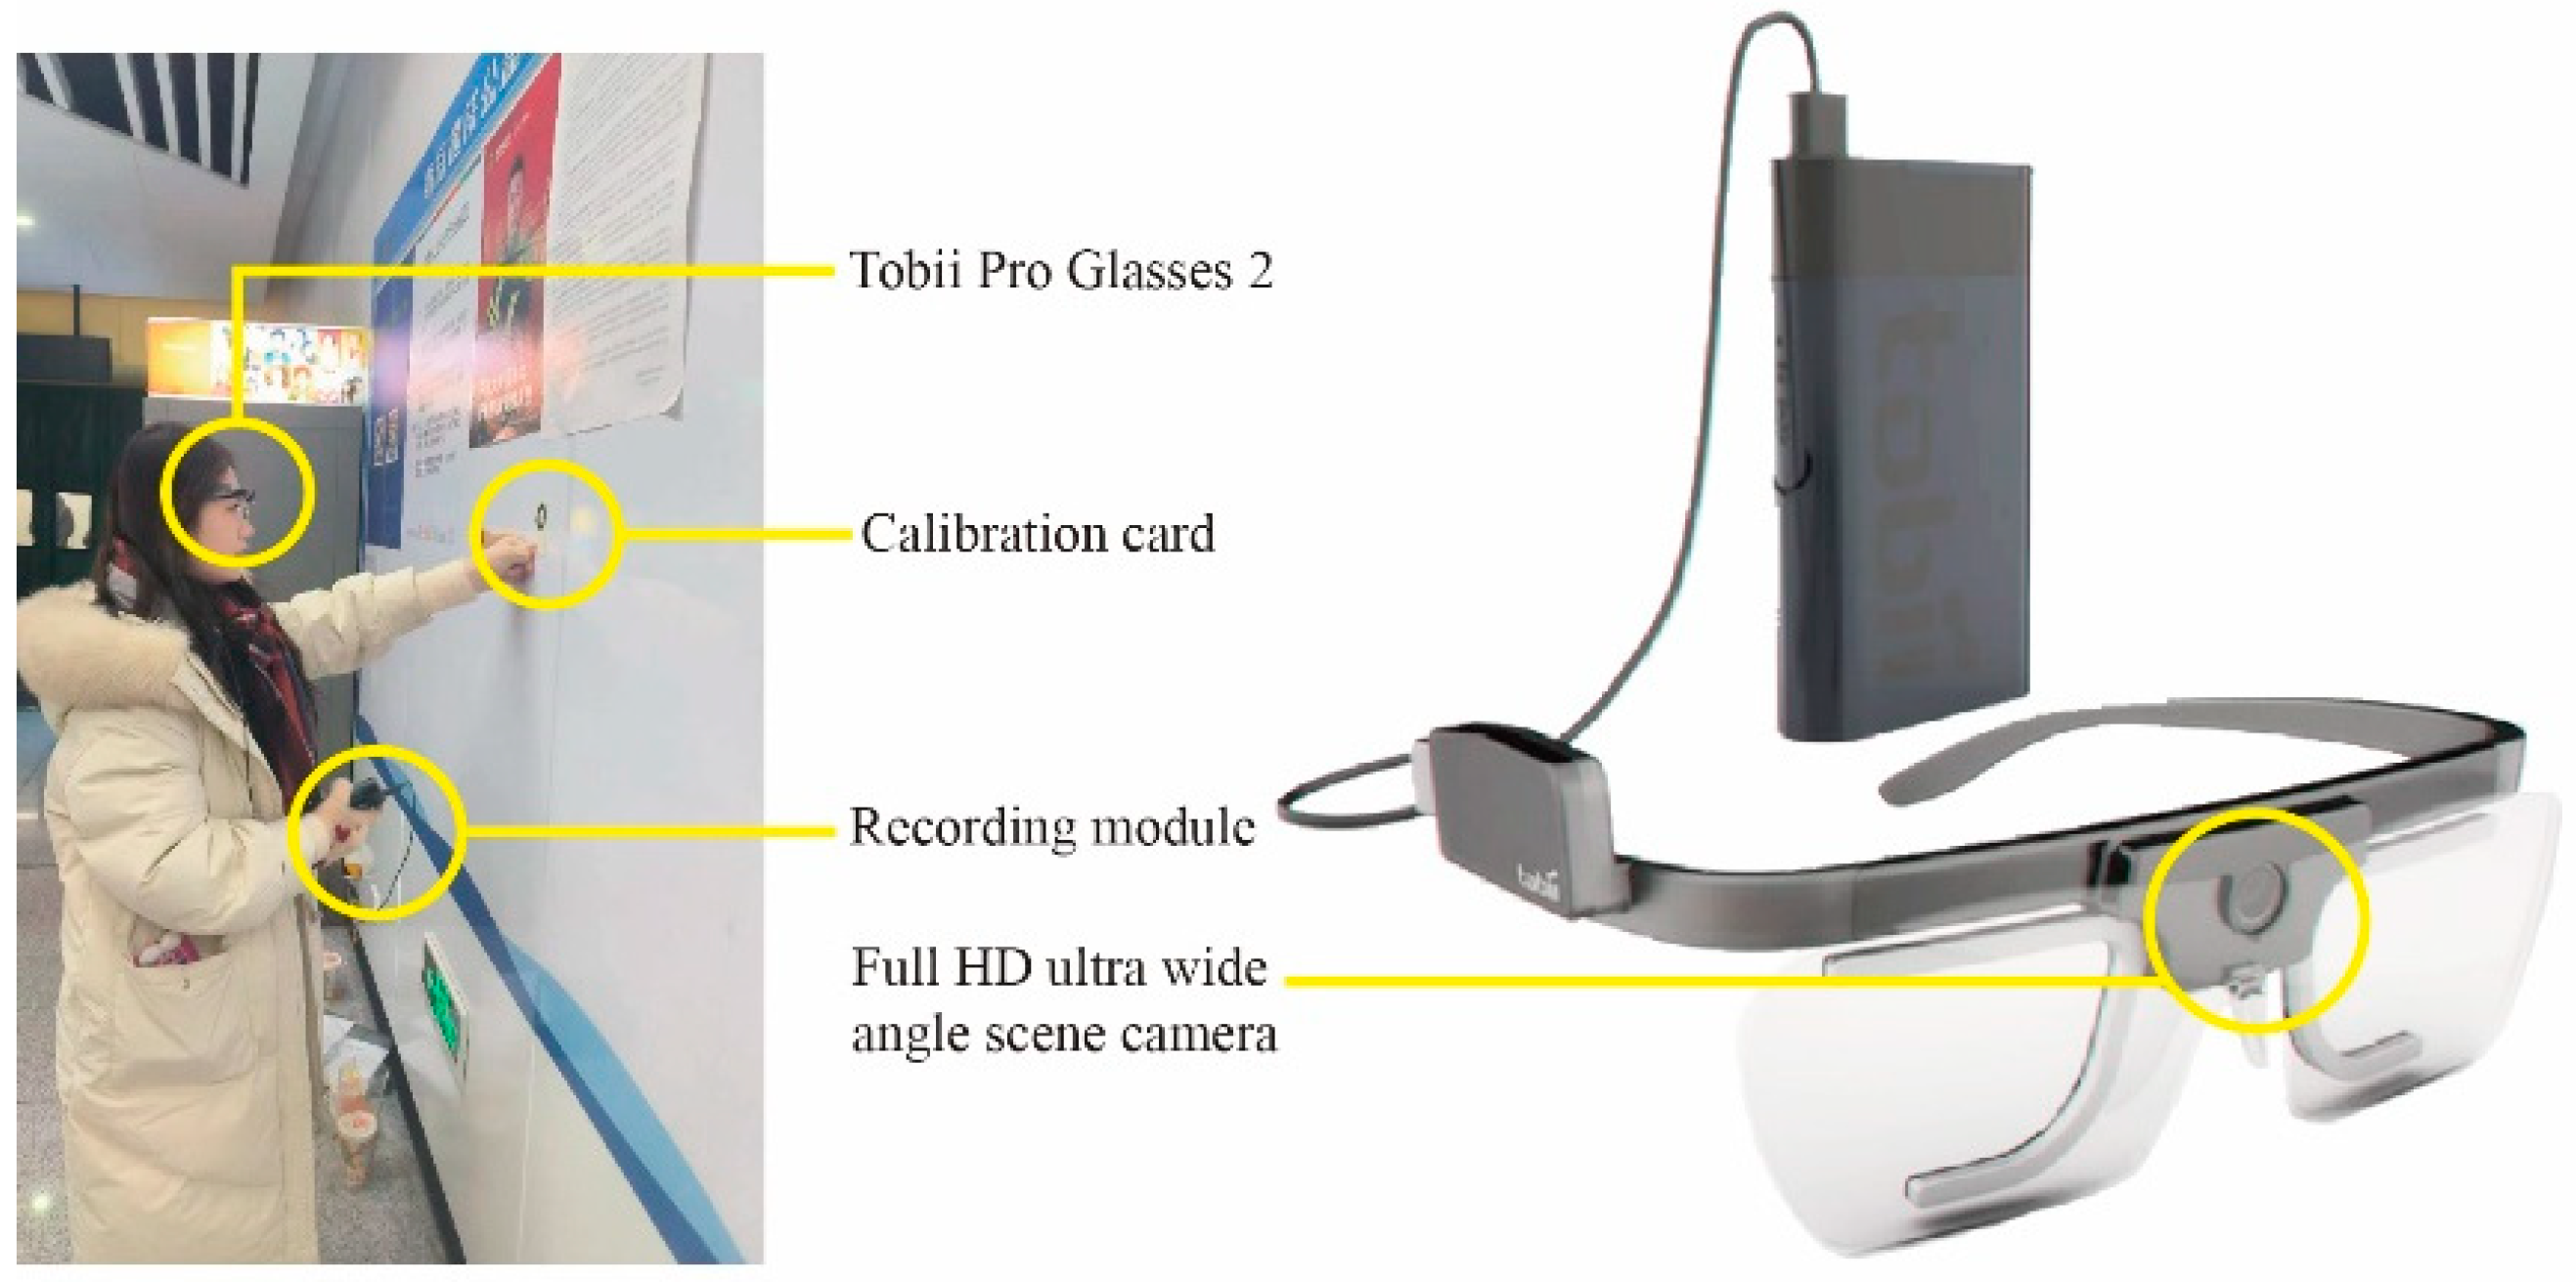


| Equipment | Frequency | Manufacturer | Composition |
|---|---|---|---|
| Tobii Pro Glasses 2 | 50–100 Hz | Swedish Tobii AB (Stockholm, Sweden) | Head-mounted module, recording module, Tobii Glasses Controller 2.4.3 software, Tobii Pro Lab software (version 24.21) |
| Variable | Abbreviation | Description | |
|---|---|---|---|
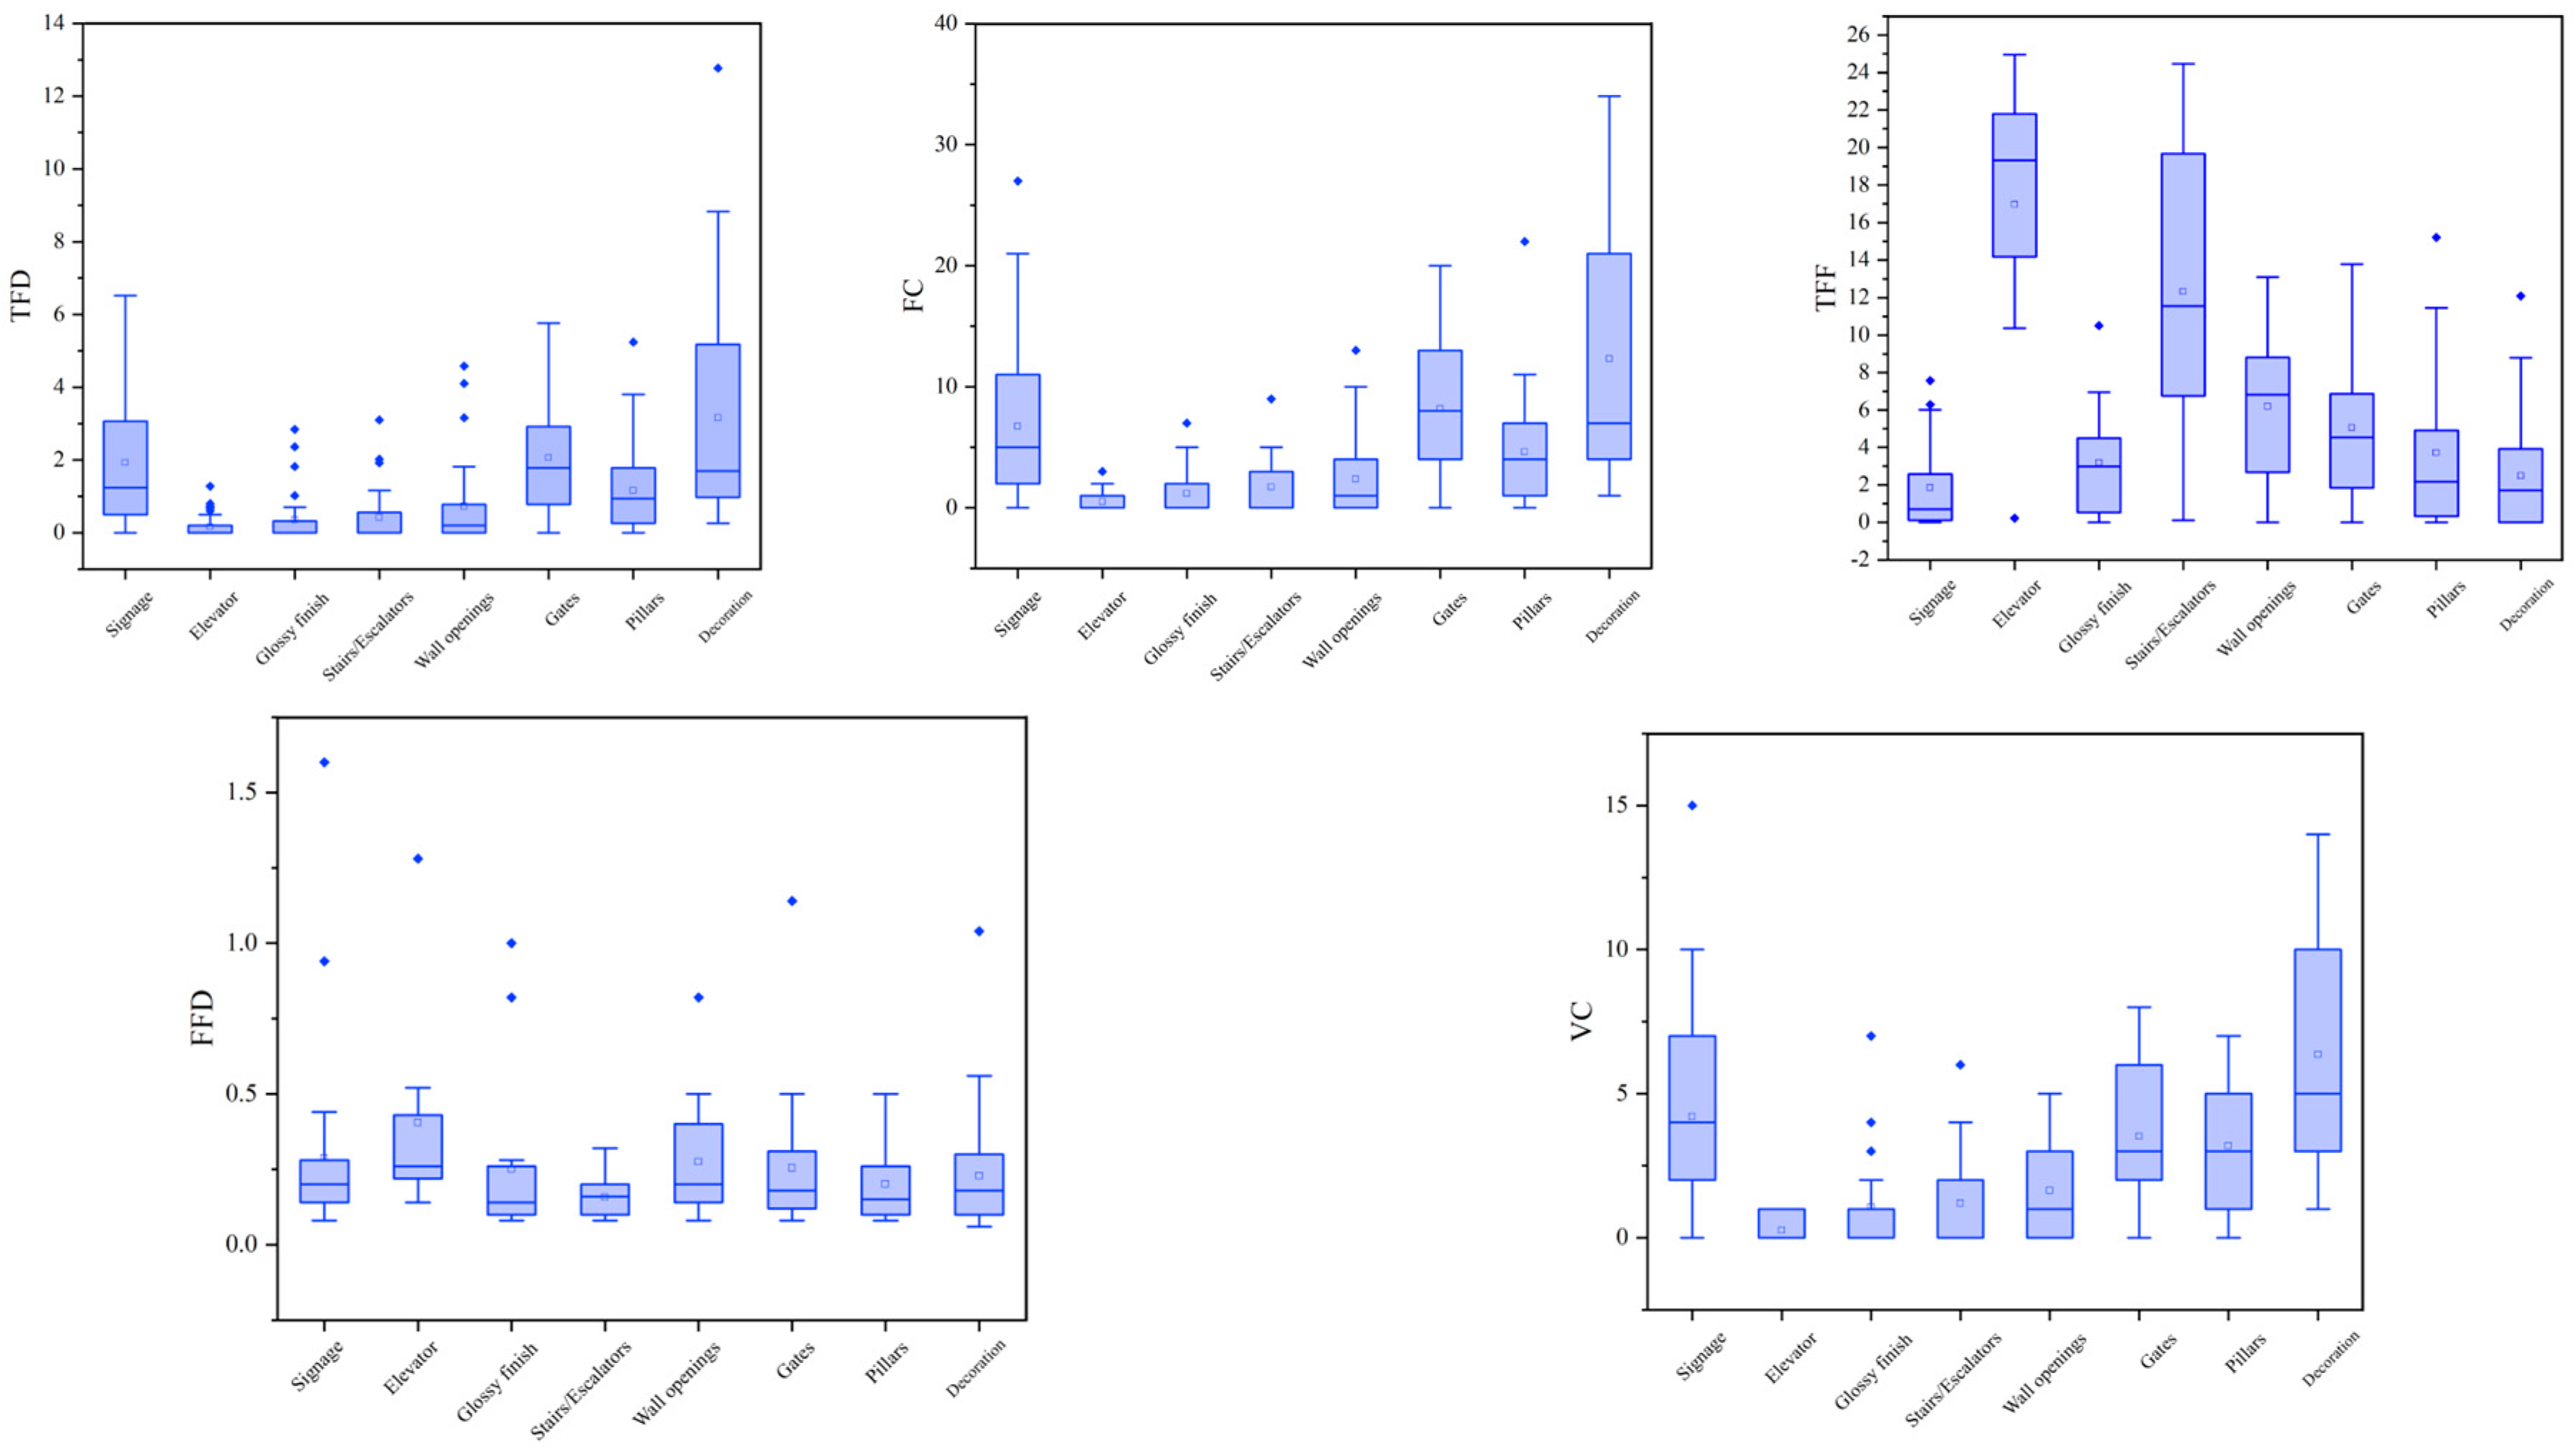
| Eye-tracking metrics | Total fixation duration | TFD | TFD refers to the total duration of fixations on a specific point within the area of interest (AOI) from the moment it appears until the participant moves out of the AOI. A longer TFD indicates that participants paid more attention to the area and found it more challenging to process the information. |
| Fixation count | FC | FC refers to participants’ ability to process the scene, the difficulty of the scene, and their interest in what they observe. Areas with a higher number of fixations are generally those that participants are more interested in. | |
| Time to first fixation | TFF | TFF refers to the duration it takes for a participant’s eye to perceive the content inside the area of interest (AOI). A shorter TFF indicates that an element is easier to notice. TFF is commonly used to measure visual saliency. | |
| First fixation duration | FFD | FFD refers to the time taken for a participant to process and form a preliminary cognition of the information in the area of interest (AOI). This metric reflects the participant’s attention to the stimulus target. Its value may be influenced by the attractiveness of the stimulus or the participant’s ability to process and comprehend the information. | |
| Visit count | VC | VC refers to the process of information processing and cognition of the participant, including memory retrieval, comparison, and judgment. It represents the results of comparing, inspecting, and confirming different areas of interest. |
| Investigation of Wayfinding Experiment in Subway Station | |
|---|---|
| Date | 19 December 2023 to 11 January 2024 |
| Location | Taidong Subway Station |
| Sample | 32 |
| Participant | Personnel participating in the wayfinding experiment |
| Investigation items | Evaluate the contribution of environment factors to the wayfinding process. Before the experiment (according to the experience in riding subway at ordinary times) and after the experiment (according to this experiment process). |
| Environment Factor | Significant Interference | Major Interference | Minor Interference | No Effect | Slightly Helpful | Greatly Helpful | Significantly Helpful |
|---|---|---|---|---|---|---|---|
| Direction signs | −3 | −2 | −1 | 0 | 1 | 2 | 3 |
| Glossy finish | −3 | −2 | −1 | 0 | 1 | 2 | 3 |
| Spatial decoration | −3 | −2 | −1 | 0 | 1 | 2 | 3 |
| Gates | −3 | −2 | −1 | 0 | 1 | 2 | 3 |
| Stairs/Escalators | −3 | −2 | −1 | 0 | 1 | 2 | 3 |
| Elevator | −3 | −2 | −1 | 0 | 1 | 2 | 3 |
| Pillars | −3 | −2 | −1 | 0 | 1 | 2 | 3 |
| Wall openings | −3 | −2 | −1 | 0 | 1 | 2 | 3 |
| Node | Degree of Freedom df | TFD | FC | TFF | FFD | VC | |||||
|---|---|---|---|---|---|---|---|---|---|---|---|
| KS Statistics | Sig. | KS Statistics | Sig. | KS Statistics | Sig. | KS Statistics | Sig. | KS Statistics | Sig. | ||
| TD1 | 169 | 0.771 | 0.000 | 0.793 | 0.000 | 0.817 | 0.000 | 0.663 | 0.000 | 0.856 | 0.000 |
| TD2 | 182 | 0.815 | 0.000 | 0.819 | 0.000 | 0.813 | 0.000 | 0.631 | 0.000 | 0.866 | 0.000 |
| TD3 | 145 | 0.752 | 0.000 | 0.886 | 0.000 | 0.894 | 0.000 | 0.740 | 0.000 | 0.850 | 0.000 |
| TD4 | 92 | 0.699 | 0.000 | 0.749 | 0.000 | 0.929 | 0.000 | 0.605 | 0.000 | 0.839 | 0.000 |
| Node | N | TFD | FC | TFF | FFD | VC | |||||
|---|---|---|---|---|---|---|---|---|---|---|---|
| X2 | Sig. | X2 | Sig. | X2 | Sig. | X2 | Sig. | X2 | Sig. | ||
| TD1 | 31 | 95.04 | 0.000 ** | 105.67 | 0.000 ** | 51.73 | 0.000 ** | 12.41 | 0.088 | 103.30 | 0.000 ** |
| TD2 | 30 | 45.92 | 0.000 ** | 48.35 | 0.000 ** | 58.07 | 0.000 ** | 8.97 | 0.356 | 66.13 | 0.000 ** |
| TD3 | 24 | 46.73 | 0.000 ** | 43.60 | 0.000 ** | 60.82 | 0.000 ** | 18.65 | 0.176 | 42.25 | 0.000 ** |
| TD4 | 14 | 139.13 | 0.000 ** | 141.53 | 0.000 ** | 86.80 | 0.000 ** | 7.75 | 0.005 ** | 144.46 | 0.000 ** |
| Node | Pairwise Comparison | Sig. | Pairwise Comparison | Sig. | Pairwise Comparison | Sig. | Pairwise Comparison | Sig. | Difference Between Groups |
|---|---|---|---|---|---|---|---|---|---|
| TD1 | H2–H7 H2–H1 H2–H6 H2–H8 | 0.000 ** 0.000 ** 0.000 ** 0.000 ** | H3–H7 H3–H1 H3–H6 H3–H8 | 0.015 * 0.001 ** 0.000 ** 0.000 ** | H4–H1 H4–H6 H4–H8 | 0.002 ** 0.000 ** 0.000 ** | H5–H6 H5–H8 | 0.004 ** 0.000 ** | H7 > H2, H3 H1 > H2, H3, H4 H6 > H2, H3, H4,H5 H8 > H2, H3, H4, H5 |
| TD2 | H5–H4 H5–H8 | 0.031 * 0.021 * | H5–H3 H5–H7 | 0.000 ** 0.000 ** | H5–H1 | 0.000 ** | H2H1 | 0.038 * | H1 > H2, H5 H3 > H5 H4 > H5 H7 > H5 H8 > H5 |
| TD3 | H7–H8 H7–H1 | 0.005 ** 0.000 ** | H3–H8 H3–H1 | 0.043 * 0.000 ** | H2–H1 | 0.000 ** | H5–H1 H4–H1 | 0.000 ** 0.007 ** | H1 > H2, H3, H4, H5, H7 H8 > H3, H7 |
| TD4 | H2H3 H2–H8 H2–H7 H2–H1 | 0.000 ** 0.000 ** 0.000 ** 0.000 ** | H6–H3 H6–H8 H6–H7 H6–H1 | 0.013 * 0.000 ** 0.000 ** 0.000 ** | H4–H8 H4–H7 H4–H1 H5–H8 H5–H7 | 0.002 ** 0.001 ** 0.000 ** 0.012 * 0.009 ** | H5–H1 H3–H1 H8–H1 H7–H1 | 0.000 ** 0.000 ** 0.030 * 0.040 * | H1 > H2, H3, H4, H5, H6, H7, H8 H3 > H2, H6, H7 > H2, H4, H5, H6 H8 > H2, H4, H5, H6 |
Disclaimer/Publisher’s Note: The statements, opinions and data contained in all publications are solely those of the individual author(s) and contributor(s) and not of MDPI and/or the editor(s). MDPI and/or the editor(s) disclaim responsibility for any injury to people or property resulting from any ideas, methods, instructions or products referred to in the content. |
© 2025 by the authors. Licensee MDPI, Basel, Switzerland. This article is an open access article distributed under the terms and conditions of the Creative Commons Attribution (CC BY) license (https://creativecommons.org/licenses/by/4.0/).
Share and Cite
Wei, S.; Xu, D.; Wu, J.; Shen, Q.; Nie, T. An Experiment in Wayfinding in a Subway Station Based on Eye Tracker Analytical Techniques for Universal and Age-Friendly Design. Buildings 2025, 15, 1583. https://doi.org/10.3390/buildings15101583
Wei S, Xu D, Wu J, Shen Q, Nie T. An Experiment in Wayfinding in a Subway Station Based on Eye Tracker Analytical Techniques for Universal and Age-Friendly Design. Buildings. 2025; 15(10):1583. https://doi.org/10.3390/buildings15101583
Chicago/Turabian StyleWei, Shuxiang, Dayu Xu, Jingze Wu, Qi Shen, and Tong Nie. 2025. "An Experiment in Wayfinding in a Subway Station Based on Eye Tracker Analytical Techniques for Universal and Age-Friendly Design" Buildings 15, no. 10: 1583. https://doi.org/10.3390/buildings15101583
APA StyleWei, S., Xu, D., Wu, J., Shen, Q., & Nie, T. (2025). An Experiment in Wayfinding in a Subway Station Based on Eye Tracker Analytical Techniques for Universal and Age-Friendly Design. Buildings, 15(10), 1583. https://doi.org/10.3390/buildings15101583