
Course Evaluation of Advanced Structural Dynamics Based on Improved SAPSO and FAHP


Abstract
1. Introduction
1.1. CIPP Model
1.2. Course Evaluation
1.3. Intelligent Algorithms
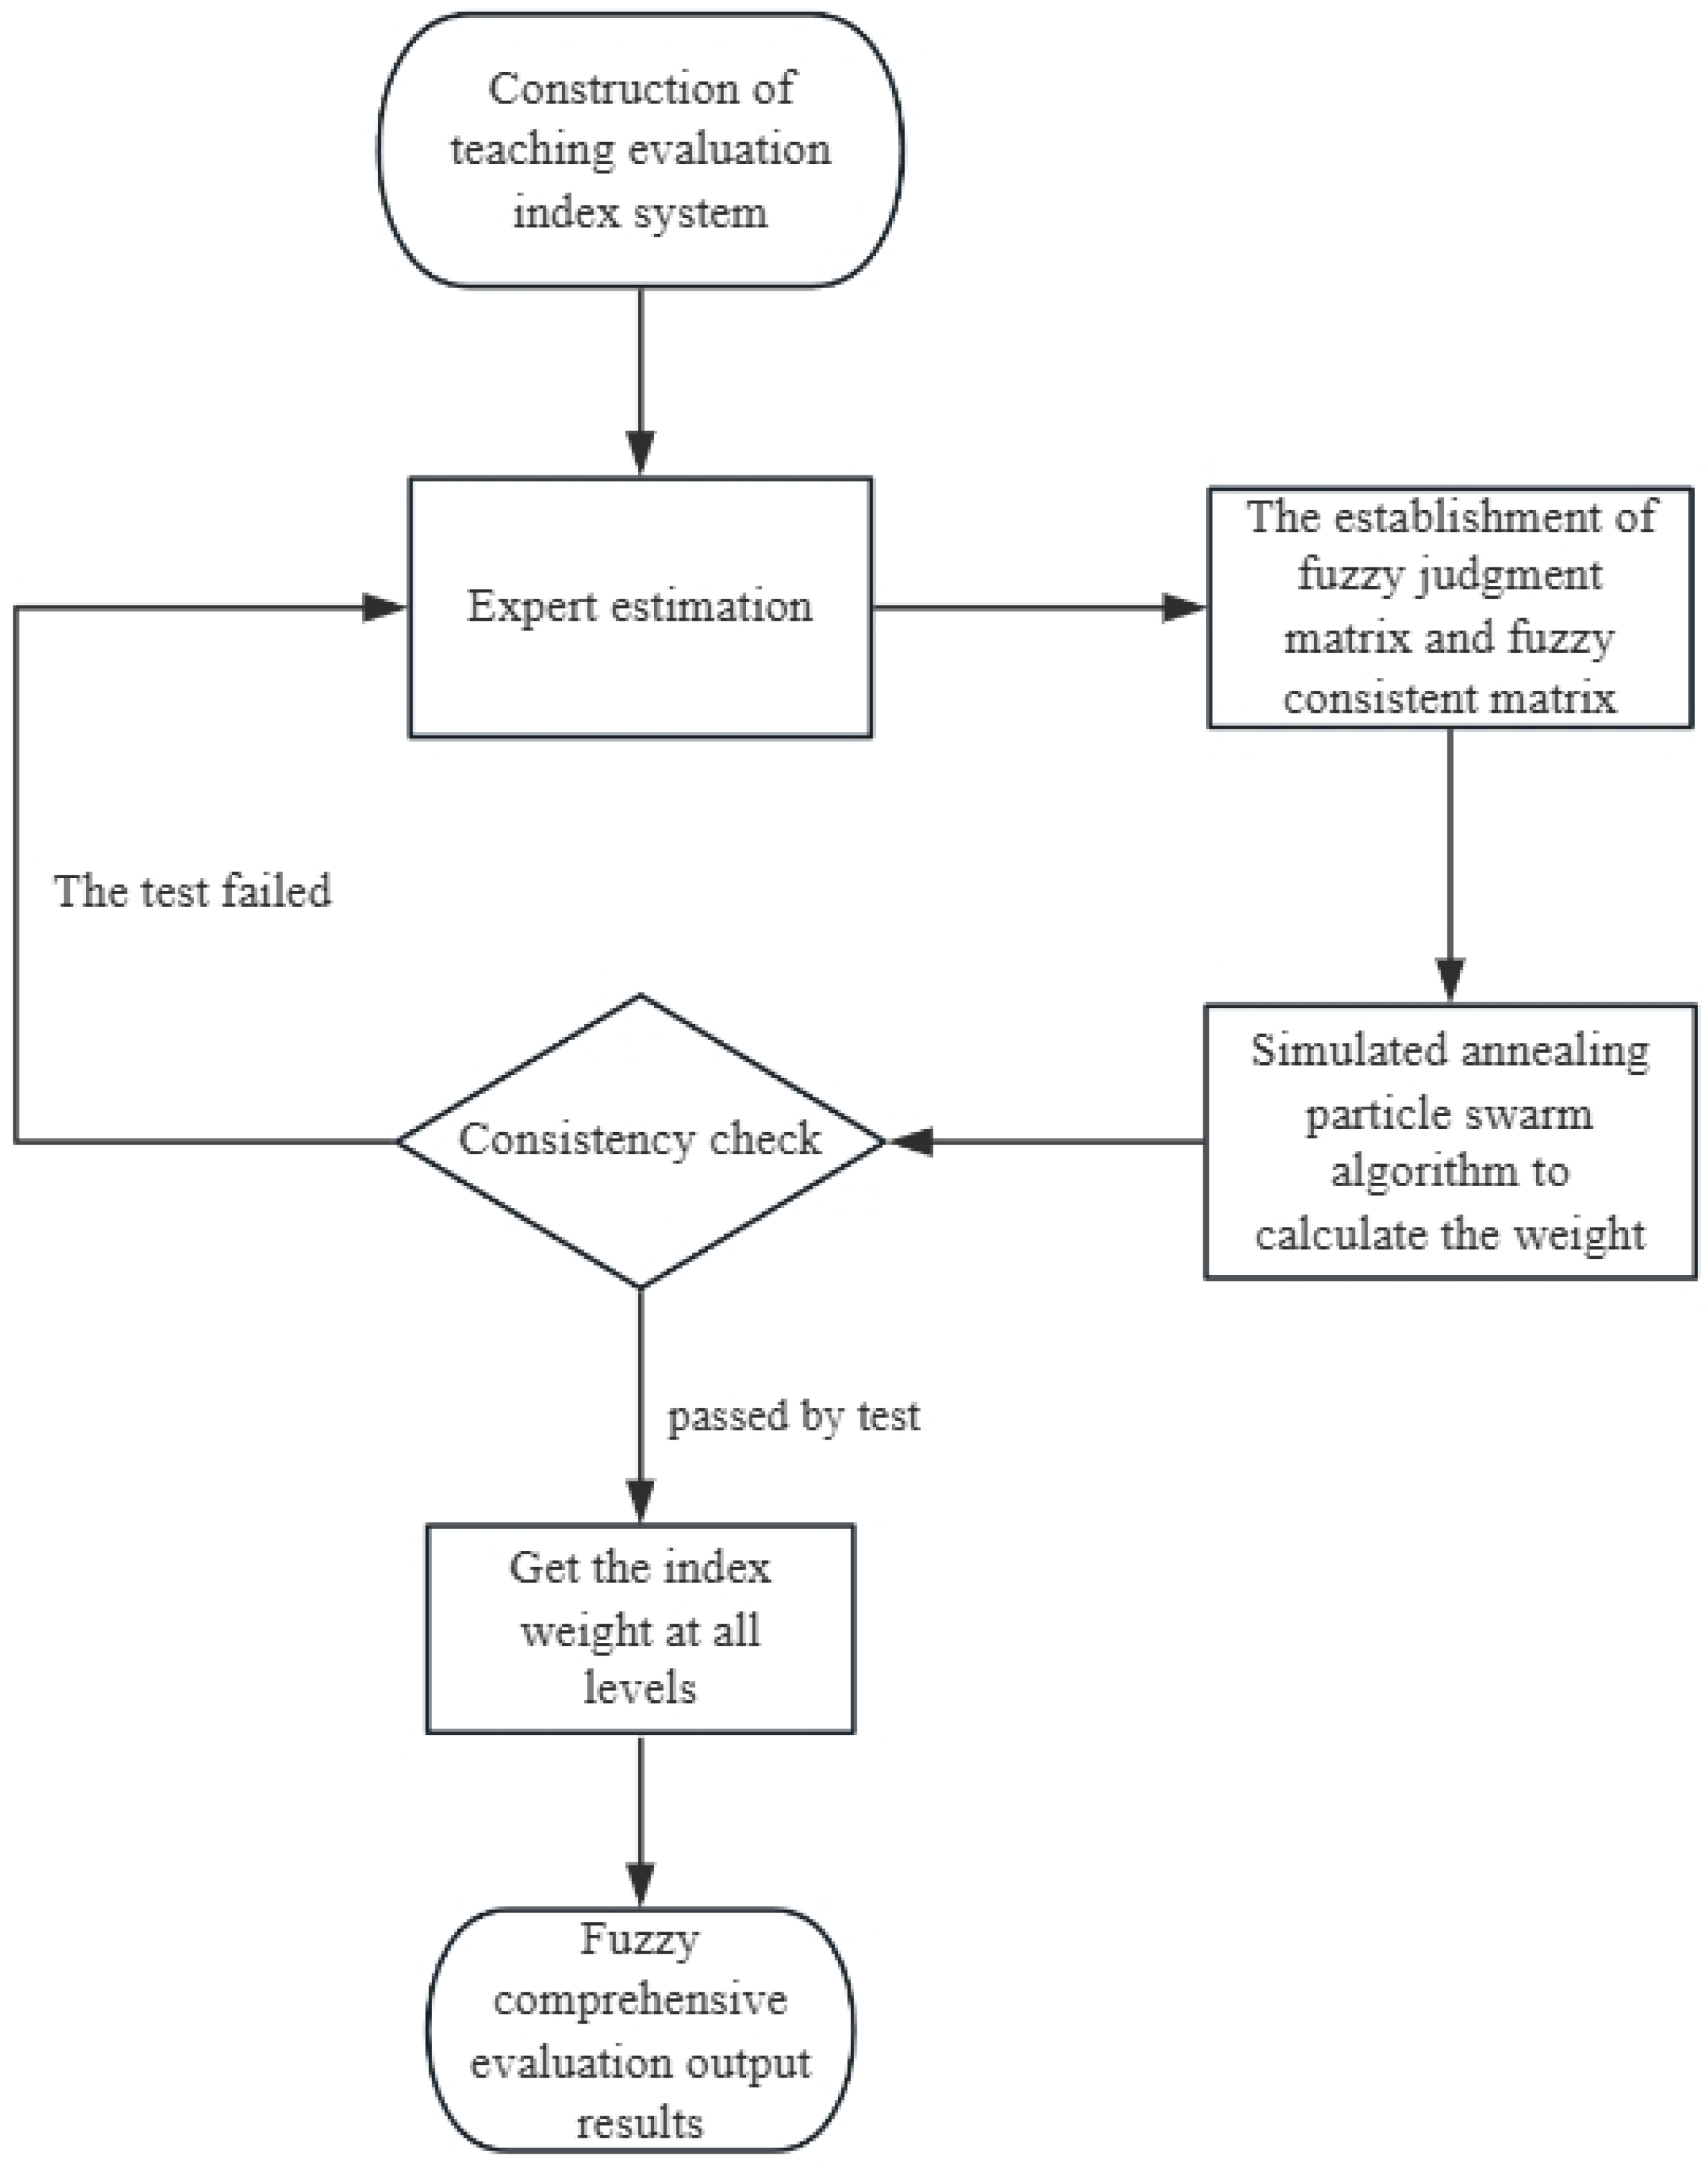
2. Construction of CIPP-Based Course Teaching Evaluation System
2.1. CIPP Model
- (1)
- Background evaluation: Determines the basic background of each curriculum plan and the implementation of the activities of the management organization, clarifies the objectives of the evaluated objects and their specific needs, clarifies the opportunities to meet the objectives, diagnoses some basic problems that need to be faced, and judges whether the target activities basically solve practical problems.
- (2)
- Input evaluation: A comprehensive evaluation of alternative curriculum planning options in order to further assist decision-makers in rationally selecting the best means of realizing activities that will meet the curriculum objectives.
- (3)
- Process evaluation: The main objective is to accurately describe the data of the actual design process of the course and to scientifically determine the scientific problems that will inevitably exist in analysis or scientific prediction in the course teaching design work itself or in the implementation process, so as to provide a scientific and effective evaluation information basis for decision-makers at all levels, all of which aims to correct current curriculum-planning problems.
- (4)
- Outcome evaluation: Objective measurement, interpretation and evaluation, and fair evaluation of various achievements in the implementation of the existing curriculum plan, which aims to explain the actual value basis and methodological advantages of the evaluation results.
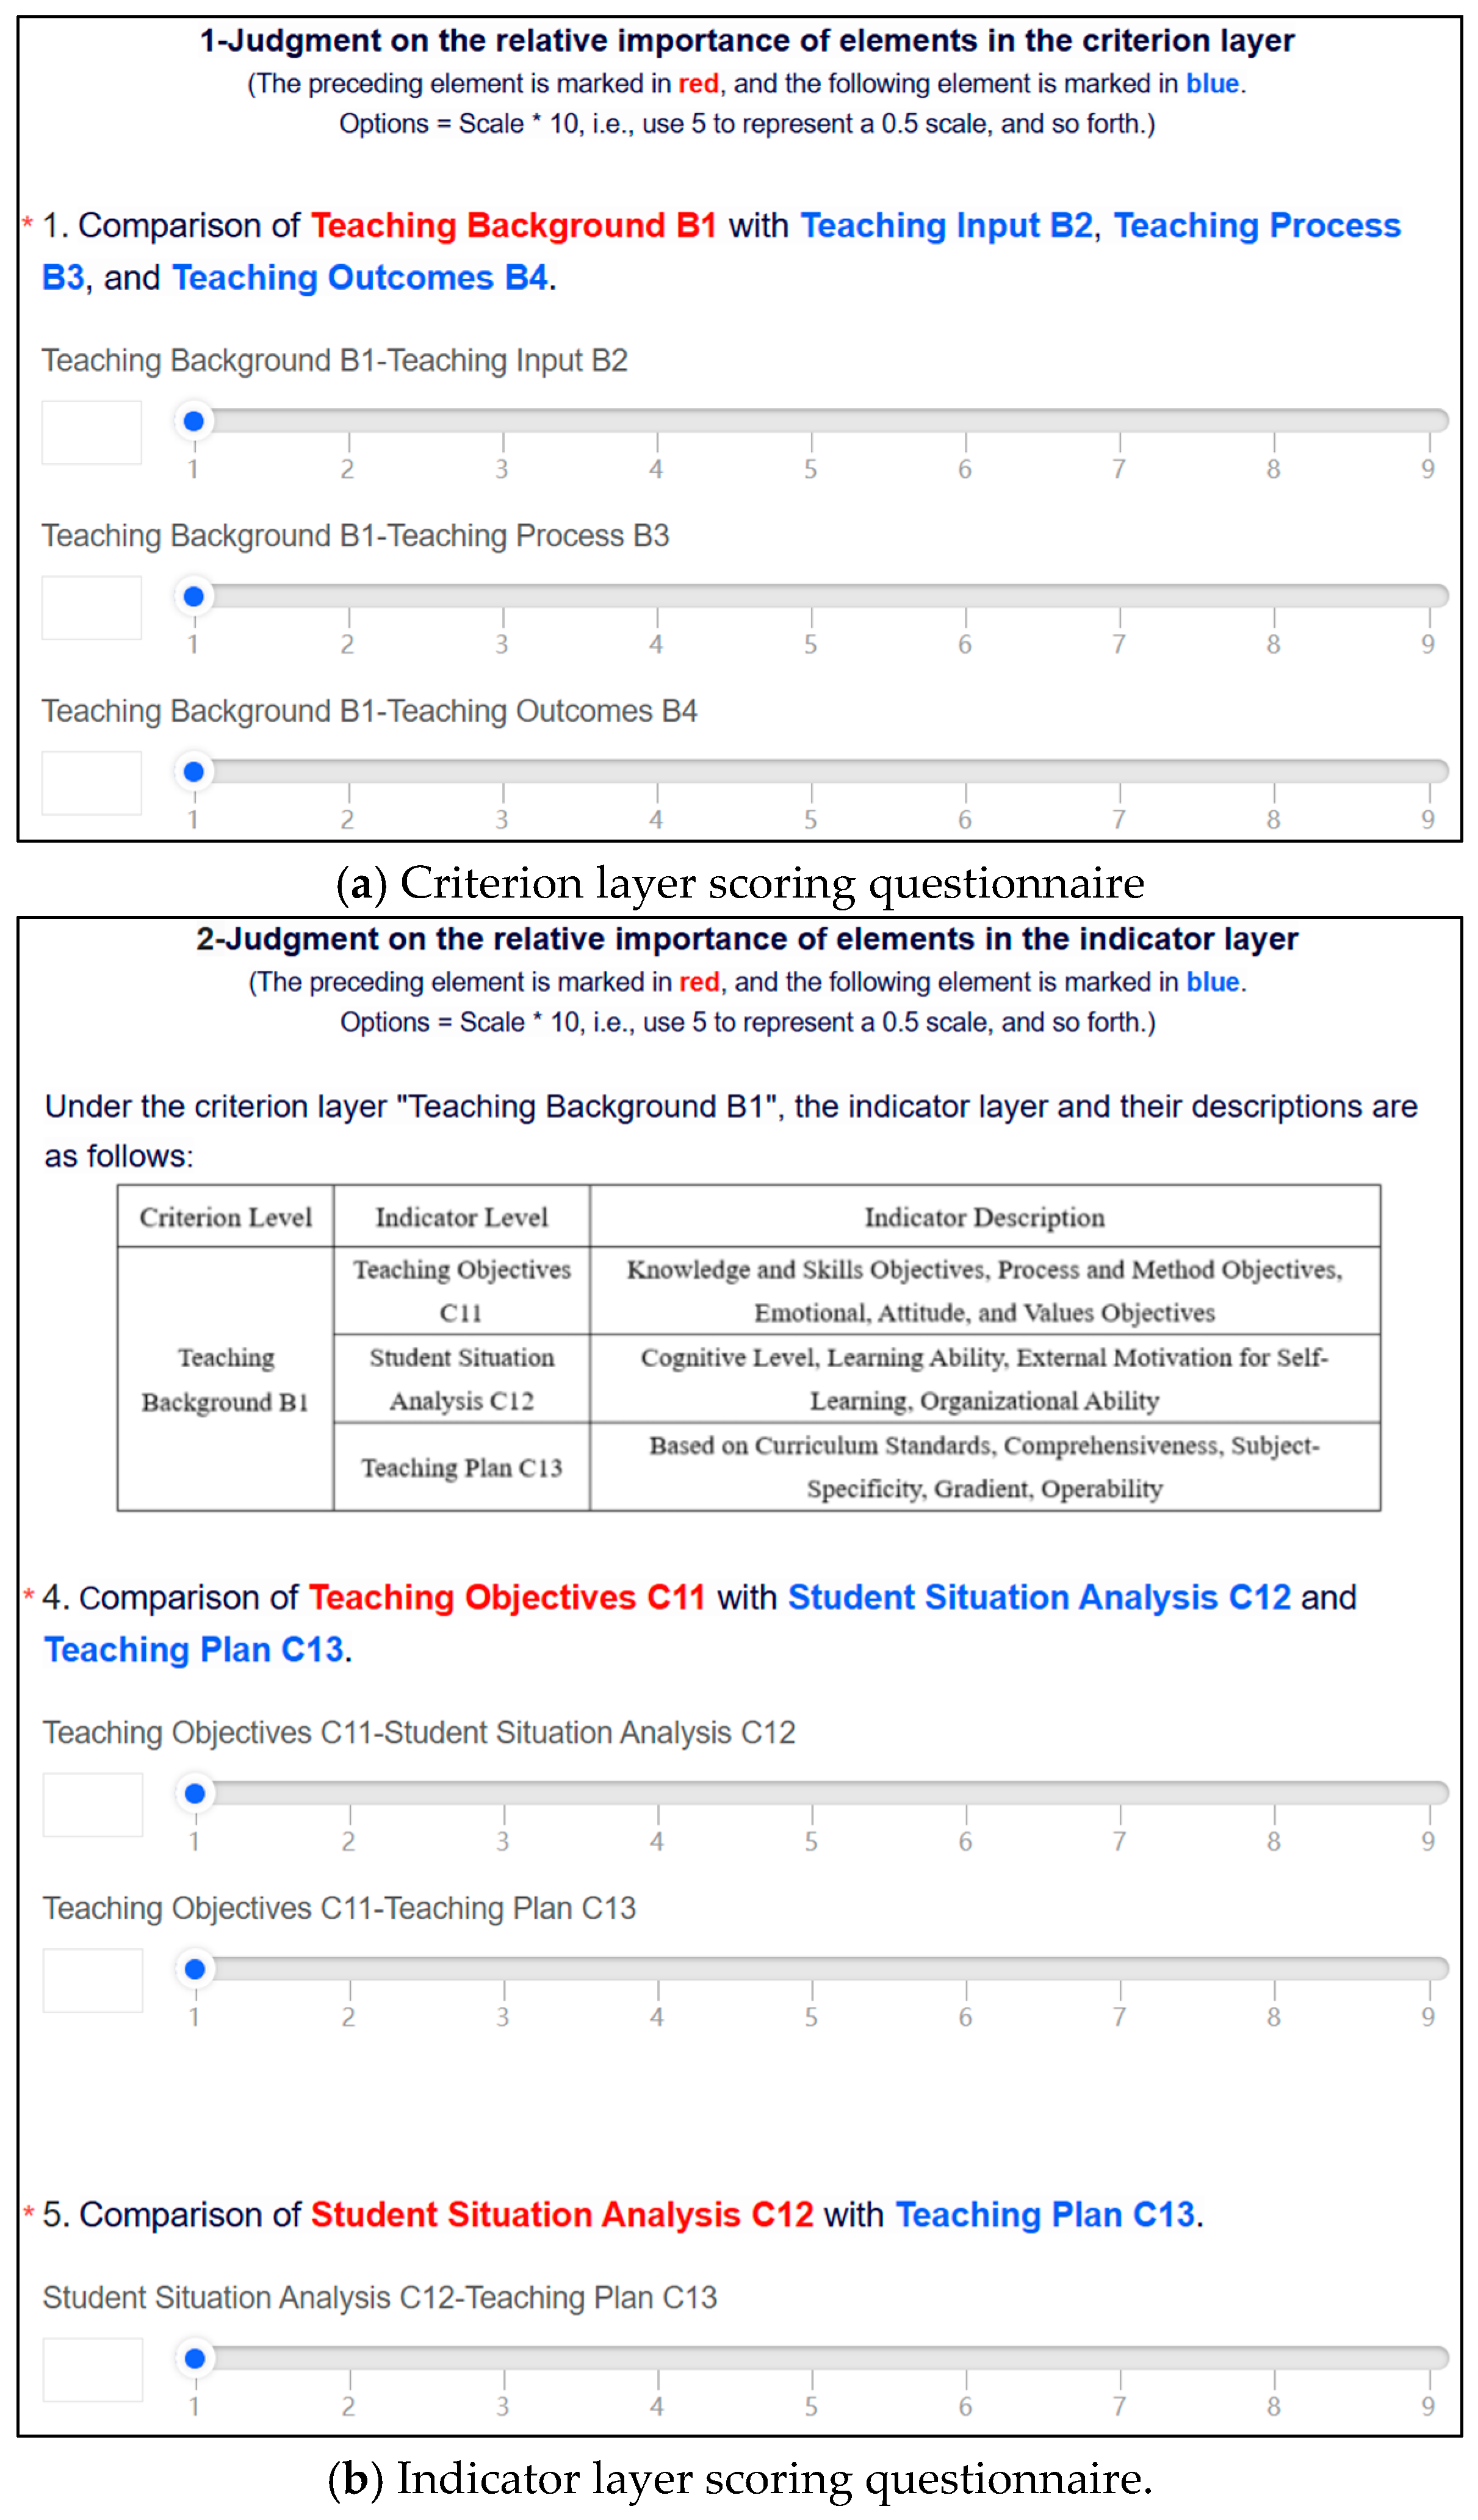
2.2. Construction of Teaching Evaluation System Based on Fuzzy Hierarchical Analysis Method
2.3. Establishment of Fuzzy Consistency Matrix
2.3.1. Definition of a Fuzzy Agreement Matrix
2.3.2. Properties of Fuzzy Consistent Matrices
2.3.3. Establishment of the Fuzzy Agreement Matrix
2.3.4. Consistency Test
3. Optimization of Weight Coefficients Based on Simulated Annealing Particle Swarm Hybrid Algorithm
3.1. Principles of the Hybrid Simulated Annealing Particle Swarm Algorithm
3.1.1. Simulated Annealing Algorithm
3.1.2. Particle Swarm Optimization
3.2. Hybrid Algorithms
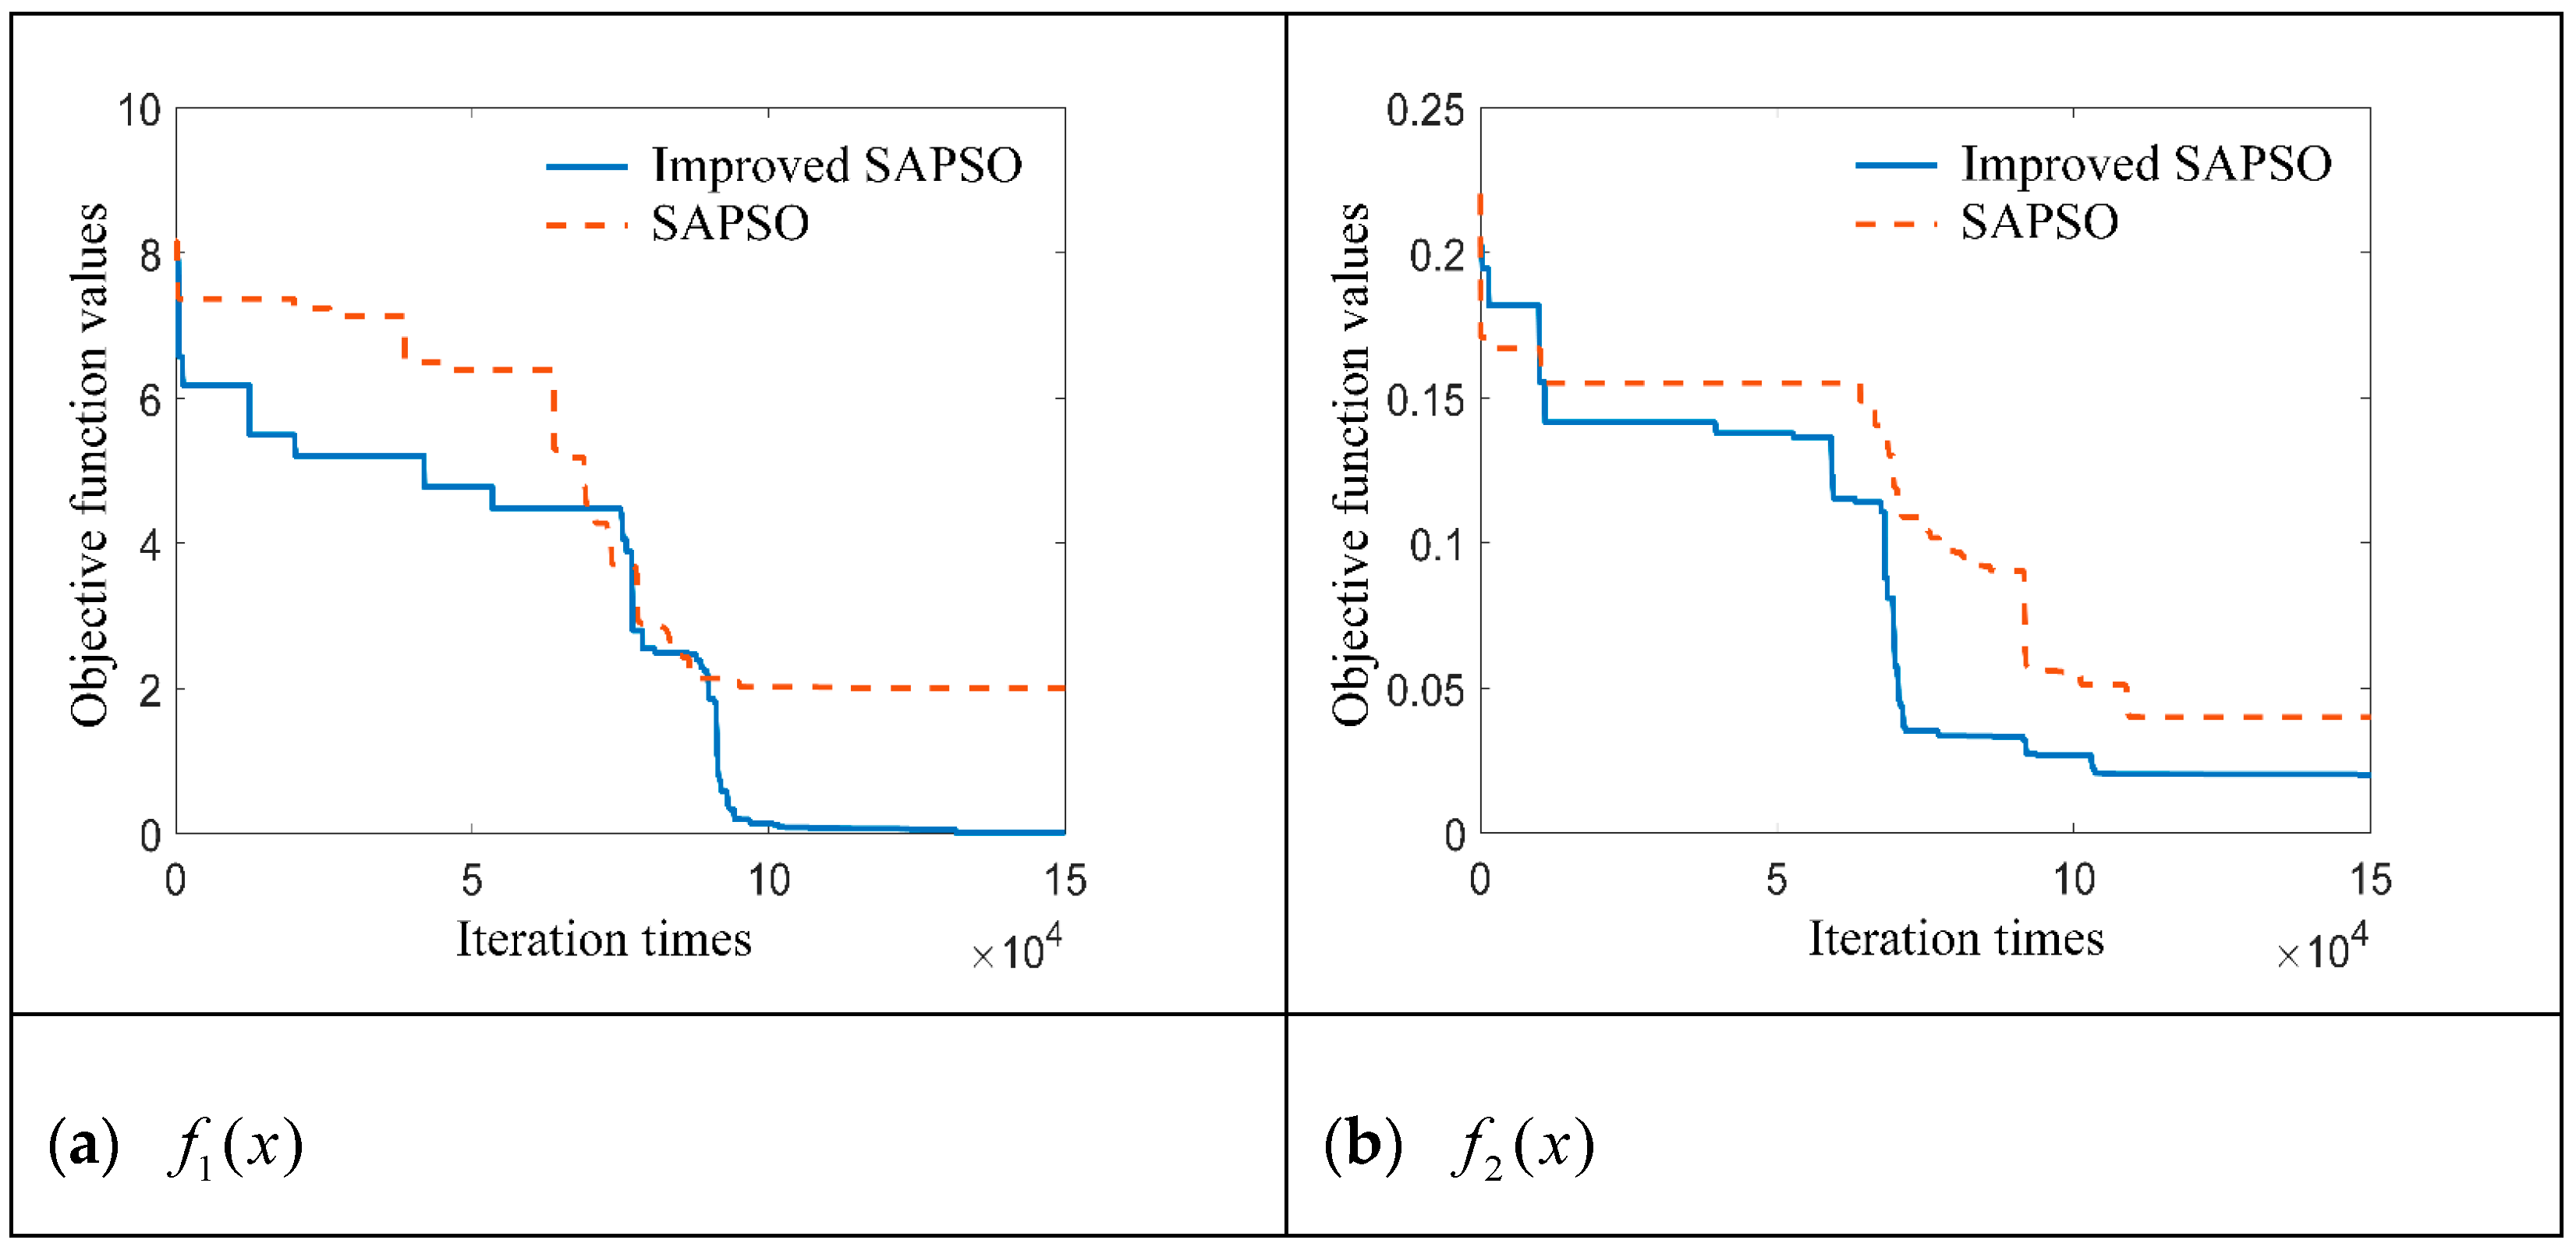
3.3. Validation of the Performance of the Hybrid Algorithm
3.4. Weight Calculation of SAPSO Algorithm
4. Teaching Questionnaire
4.1. Survey of the Importance of Weighting Factors
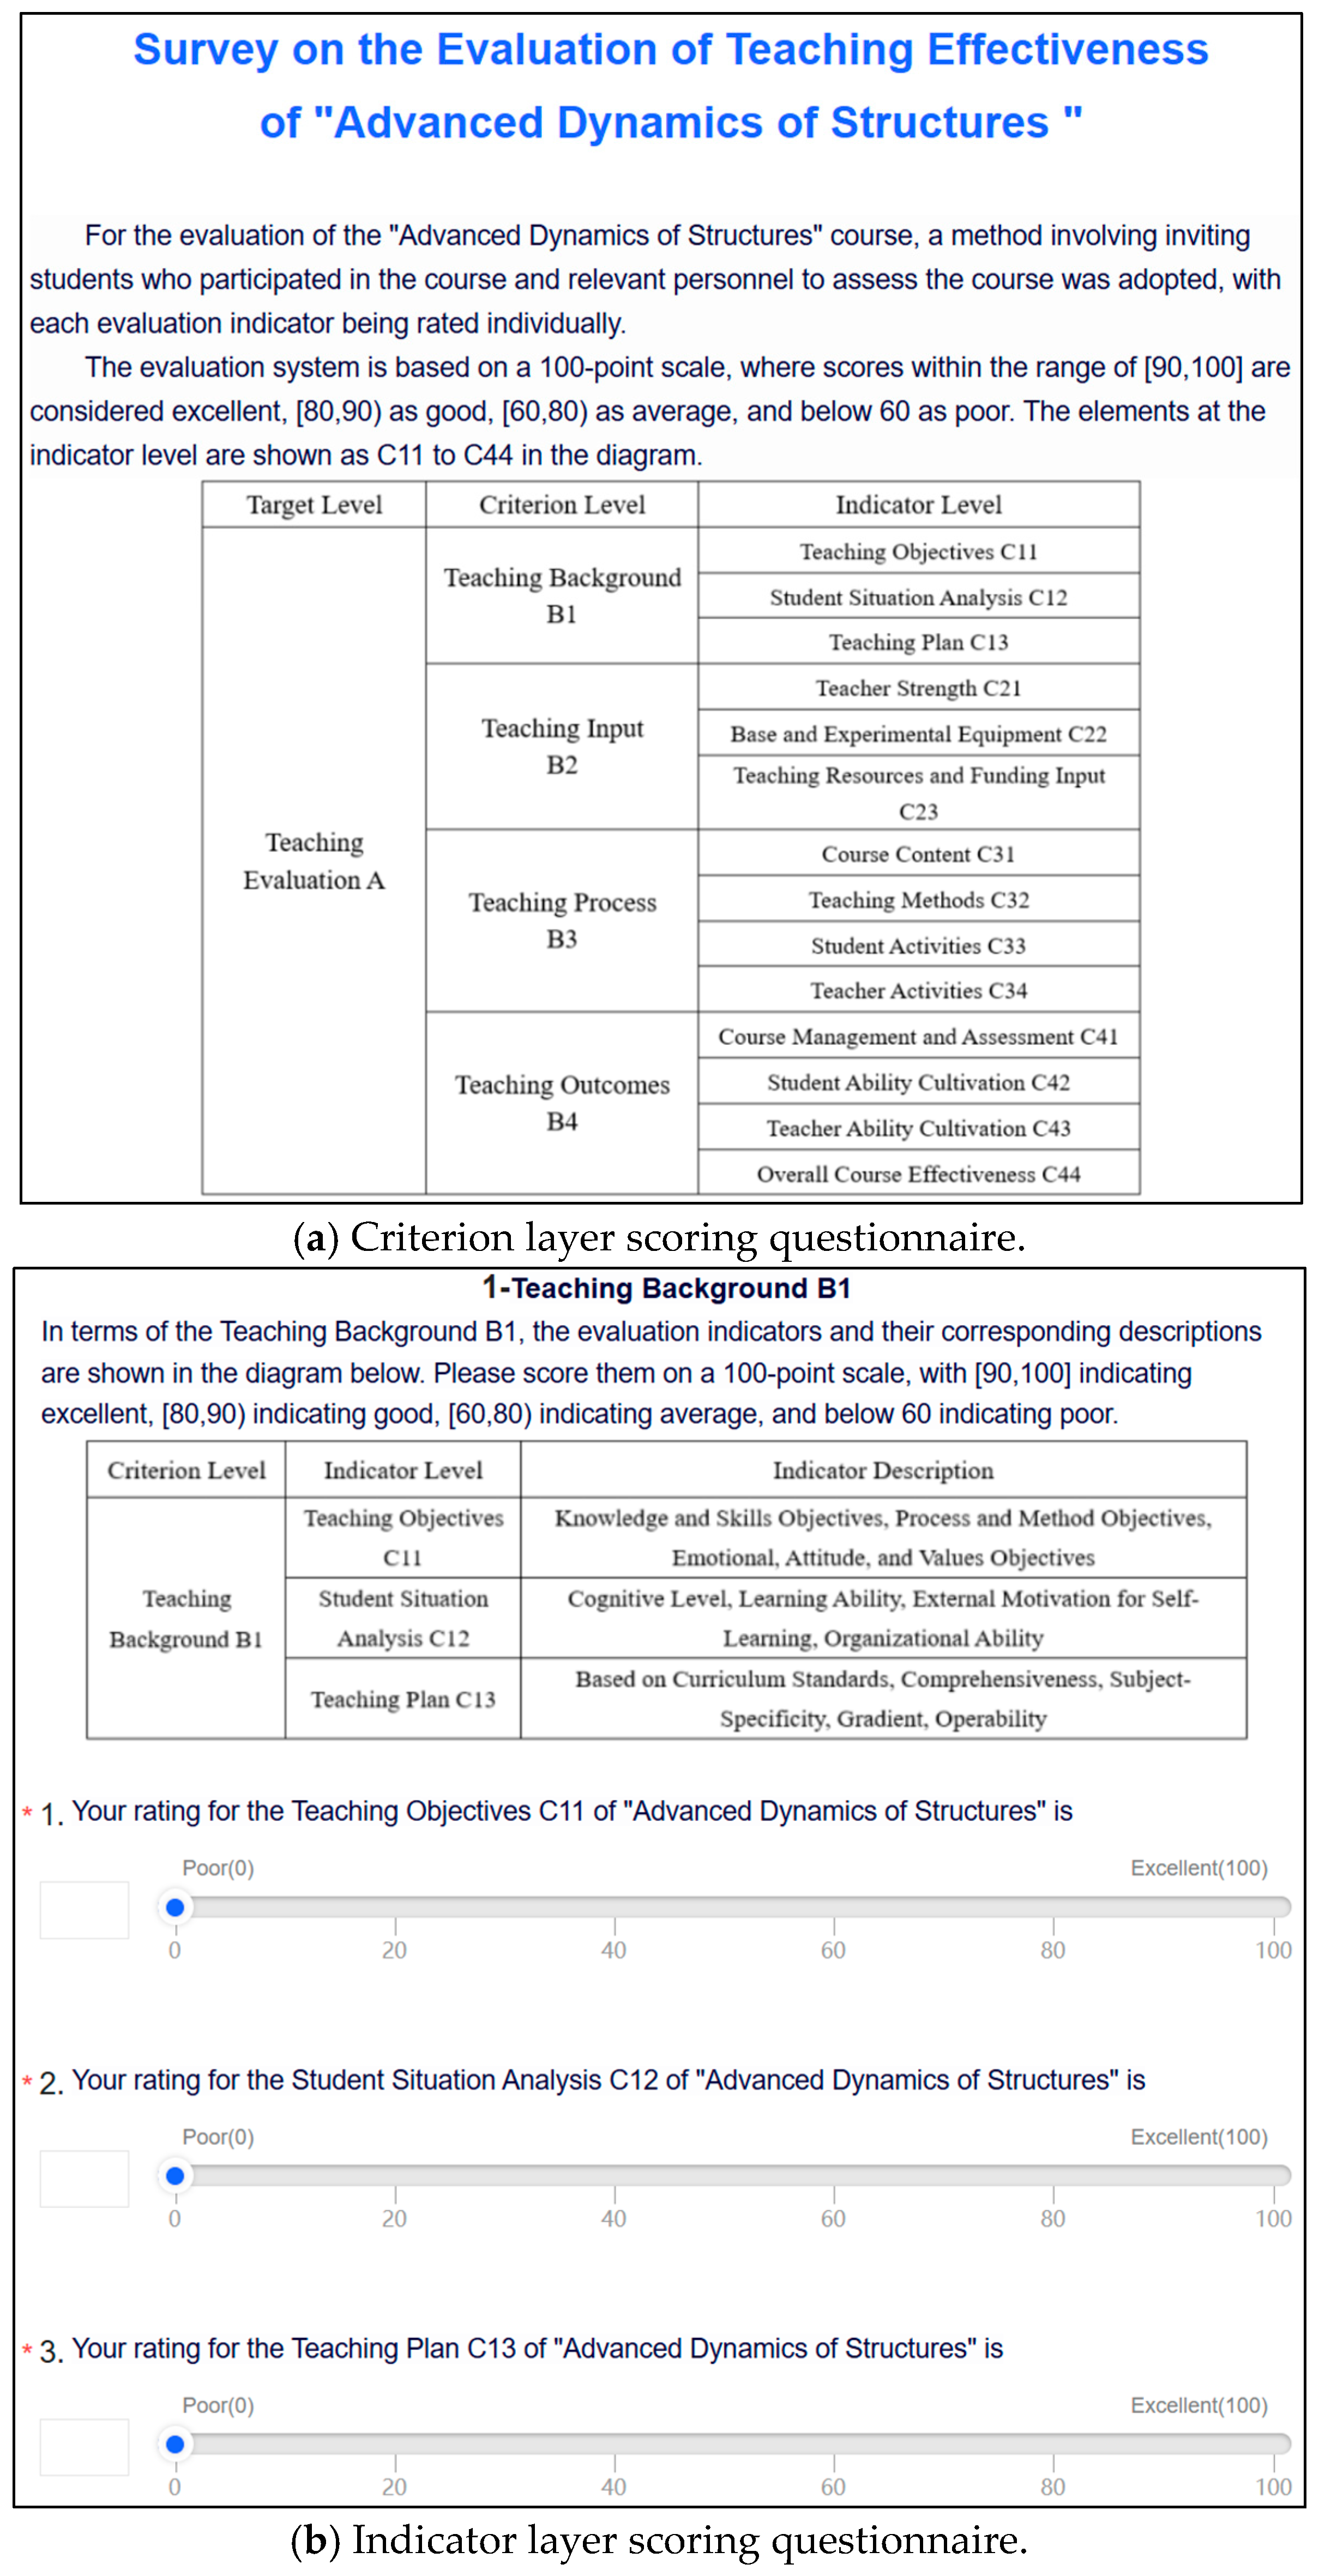
4.2. Teaching Effectiveness Evaluation Survey
5. Evaluation of Teaching Effectiveness
5.1. Determination of Evaluation Indicator Weights
5.2. Fuzzy Integrated Evaluation
5.2.1. Commentary Set Setting
5.2.2. Calculation of Integrated Evaluation Results
6. Conclusions
- (1)
- In indicator C33 (student activity), teamwork involves structural dynamics analysis tasks based on theoretical and numerical methods. Teachers require students to choose methods and write MATLAB programs to conduct structural dynamic analysis after understanding the theory of ASD. Homework statistics show that most students opt to use the finite element method, considering it a superior approach to solving dynamic problems due to its ability to handle complex issues and its high precision, efficiency, and flexibility.
- (2)
- Essentially, science is derived from experience and practice; yet, it transcends them, and intuitions, being a significant source of innovation, serve as an important bridge from experience and practice to science. In this study, the extension of students’ engineering intuition in structural vibration can be assessed through intuitive perception, logical analysis processes (indicator C42, student capacity building), and experimental operation skills (indicator C22, base and test equipment). Only when students have a deep understanding of the key points of the ASD course and possess engineering intuition can they draw inferences about other matters in subsequent professional courses and have an added advantage in future engineering practice.
- (1)
- Optimization of the teaching environment: Consider introducing more flexible and modern classroom layouts to promote teacher–student interaction and cooperative learning among students. At the same time, increase natural lighting and ventilation in classrooms to create a more comfortable learning atmosphere.
- (2)
- With the rapid development of civil engineering technology, it is necessary to update the hardware and software facilities required for teaching to ensure that students have access to the latest technical tools. For example, introduce advanced structural analysis software and virtual reality (VR) or augmented reality (AR) technologies to provide more intuitive and engaging learning experiences.
- (3)
- Establish a regular evaluation mechanism to collect feedback from students, teachers, and industry experts, and adjust course content, teaching methods, and facility configurations in a timely manner. Through continuous evaluation, ensure that the ASD course remains synchronized with industry demands, cultivating more civil engineering talents with practical abilities and innovative spirits.
- (4)
- To cultivate and enhance students’ engineering intuition, firstly, continuous practice and experience should be used to strengthen intuitive feelings, recognizing that the development of this intuition is a gradual process that requires constant sensation, insight, and reinforcement. Secondly, through experimental teaching, students should be encouraged to conduct structural dynamics experiments themselves to gain hands-on experience, which further clarifies and reinforces the basic theories and concepts taught in class. Lastly, engineering case teaching should be employed to foster students’ attention to relevant engineering cases, which complements the development of engineering intuition.
Author Contributions
Funding
Data Availability Statement
Acknowledgments
Conflicts of Interest
References
- Virgin, L. Enhancing the teaching of structural dynamics using additive manufacturing. Eng. Struct. 2017, 152, 750–757. [Google Scholar] [CrossRef]
- Brandt, A. The ABRAVIBE toolbox for teaching vibration analysis and structural dynamics. In Special Topics in Structural Dynamics, Volume 6: Proceedings of the 31st IMAC, A Conference on Structural Dynamics, 2013; Springer: New York, NY, USA, 2013; pp. 131–141. [Google Scholar]
- Panagiotopoulos, C.G.; Manolis, G.D. A web-based educational software for structural dynamics. Comput. Appl. Eng. Educ. 2016, 24, 599–614. [Google Scholar] [CrossRef]
- Kamiński, M. Symbolic computations in modern education of applied sciences and engineering. Comput. Assist. Methods Eng. Sci. 2022, 15, 143–163. [Google Scholar]
- Sopha, S.; Nanni, A. The cipp model: Applications in language program evaluation. J. Asia TEFL 2019, 16, 1360. [Google Scholar] [CrossRef]
- Ebtesam, E.; Foster, S. Implementation of CIPP model for quality evaluation at Zawia University. Int. J. Appl. Linguist. Engl. Lit. 2019, 8, 106. [Google Scholar]
- Darma, I.K. The effectiveness of teaching program of CIPP evaluation model. Int. Res. J. Eng. IT Sci. Res. 2019, 5, 1–13. [Google Scholar] [CrossRef]
- Agustina, N.Q.; Mukhtaruddin, F. The CIPP Model-Based Evaluation on Integrated English Learning (IEL) Program at Language Center. Engl. Lang. Teach. Educ. J. 2019, 2, 22–31. [Google Scholar] [CrossRef]
- Aziz, S.; Mahmood, M.; Rehman, Z. Implementation of CIPP Model for Quality Evaluation at School Level: A Case Study. J. Educ. Educ. Dev. 2018, 5, 189–206. [Google Scholar] [CrossRef]
- Umam, K.A.; Saripah, I. Using the Context, Input, Process and Product (CIPP) model in the evaluation of training programs. Int. J. Pedagog. Teach. Educ. 2018, 2, 183–194. [Google Scholar] [CrossRef]
- Rachmaniar, R.; Yahya, M.; Lamada, M. Evaluation of Learning through Work Practices Industry Program at University with the CIPP Model Approach. Int. J. Environ. Eng. Educ. 2021, 3, 59–68. [Google Scholar] [CrossRef]
- Haryono, H.; Florentinus, T.S. The evaluation of the CIPP model in the implementation of character education at junior high school. Innov. J. Curric. Educ. Technol. 2018, 7, 65–77. [Google Scholar]
- Eryanto, H.; Swaramarinda, D.R.; Nurmalasari, D. Effectiveness of entrepreneurship practice program: Using CIPP program evaluation. J. Entrep. Educ. 2019, 22, 1–10. [Google Scholar]
- Basaran, M.; Dursun, B.; Gur Dortok, H.D.; Yilmaz, G. Evaluation of Preschool Education Program According to CIPP Model. Pedagog. Res. 2021, 6, em0091. [Google Scholar] [CrossRef]
- Li, Y.; Hu, C. The Evaluation Index System of Teaching Quality in Colleges and Universities: Based on the CIPP Model. Math. Probl. Eng. 2022, 2022, 1–8. [Google Scholar] [CrossRef]
- Keskin, I. Evaluation of the Curriculum of High School Mathematics According to CIPP Model. Bull. Educ. Res. 2020, 42, 183–214. [Google Scholar]
- Rooholamini, A.; Amini, M.; Bazrafkan, L.; Dehghani, M.R.; Esmaeilzadeh, Z.; Nabeiei, P.; Rezaee, R.; Kojuri, J. Program evaluation of an integrated basic science medical curriculum in Shiraz Medical School, using CIPP evaluation model. J. Adv. Med. Educ. Prof. 2017, 5, 148. [Google Scholar] [PubMed]
- Mazloomy Mahmoudabad, S.S.; Moradi, L. Evaluation of Externship curriculum for public health Course in Yazd University of Medical Sciences using CIPP model. Educ. Strateg. Med. Sci. 2018, 11, 28–36. [Google Scholar]
- Al-Shanawani, H.M. Evaluation of Self-Learning Curriculum for Kindergarten Using Stufflebeam’s CIPP Model. Sage Open 2019, 9, 2158244018822380. [Google Scholar] [CrossRef]
- Zhang, J.; Zhao, C.; Wang, J.; Li, H.; Huijser, H. Evaluation framework for an interdisciplinary bim capstone course in highway engineering. Int. J. Eng. Educ. 2020, 36, 1889–1900. [Google Scholar]
- Atmacasoy, A.; Ok, A.; Şahin, G. An evaluation of introduction to industrial engineering course at Sabanci University using CIPP model. In Proceedings of the International Conference Engineering Education for Sustainable Development (EESD), Glassboro, NJ, USA, 3–6 June 2018. [Google Scholar]
- Bellio, R.; Ceschia, S.; Di Gaspero, L.; Schaerf, A.; Urli, T. Feature-based tuning of simulated annealing applied to the curriculum-based course timetabling problem. Comput. Oper. Res. 2016, 65, 83–92. [Google Scholar] [CrossRef]
- Leite, N.; Melício, F.; Rosa, A.C. A fast simulated annealing algorithm for the examination timetabling problem. Expert Syst. Appl. 2019, 122, 137–151. [Google Scholar] [CrossRef]
- Mafarja, M.M.; Mirjalili, S. Hybrid Whale Optimization Algorithm with simulated annealing for feature selection. Neurocomputing 2017, 260, 302–312. [Google Scholar] [CrossRef]
- Liu, T.; Yin, S. An improved particle swarm optimization algorithm used for BP neural network and multimedia course-ware evaluation. Multimed. Tools Appl. 2017, 76, 11961–11974. [Google Scholar] [CrossRef]
- Huang, M.; Zhang, J.; Li, J.; Deng, Z.; Luo, J. Damage identification of steel bridge based on data augmentation and adaptive optimization neural network. Struct. Health Monit.—Int. J. 2024. [Google Scholar] [CrossRef]
- Huang, M.; Cheng, S.; Zhang, H.; Gul, M.; Lu, H. Structural Damage Identification Under Temperature Variations Based on PSO-CS Hybrid Algorithm. Int. J. Struct. Stab. Dyn. 2019, 19, 1950139. [Google Scholar] [CrossRef]
- Lin, H.-F. An application of fuzzy AHP for evaluating course website quality. Comput. Educ. 2010, 54, 877–888. [Google Scholar] [CrossRef]
- Lucas, R.I.; Promentilla, M.A.; Ubando, A.; Tan, R.G.; Aviso, K.; Yu, K.D. An AHP-based evaluation method for teacher training workshop on information and communication technology. Eval. Program Plan. 2017, 63, 93–100. [Google Scholar] [CrossRef] [PubMed]
- Yu, D.; Kou, G.; Xu, Z.; Shi, S. Analysis of Collaboration Evolution in AHP Research: 1982–2018. Int. J. Inf. Technol. Decis. Mak. 2021, 20, 7–36. [Google Scholar] [CrossRef]
- Huang, M.; Gul, M.; Zhu, H. Vibration-Based Structural Damage Identification under Varying Temperature Effects. J. Aerosp. Eng. 2018, 31, 04018014. [Google Scholar] [CrossRef]
- Huang, M.; Ling, Z.; Sun, C.; Lei, Y.; Xiang, C.; Wan, Z.; Gu, J. Two-stage damage identification for bridge bearings based on sailfish optimization and element relative modal strain energy. Struct. Eng. Mech. 2023, 86, 715–730. [Google Scholar]
- Deng, Z.; Huang, M.; Wan, N.; Zhang, J. The Current Development of Structural Health Monitoring for Bridges: A Review. Buildings 2023, 13, 1360. [Google Scholar] [CrossRef]
- Huang, M.; Zhang, J.; Hu, J.; Ye, Z.; Deng, Z.; Wan, N. Nonlinear modeling of temperature-induced bearing displacement of long-span single-pier rigid frame bridge based on DCNN-LSTM. Case Stud. Therm. Eng. 2024, 53, 103897. [Google Scholar] [CrossRef]
- Zhang, J.; Huang, M.; Wan, N.; Deng, Z.; He, Z.; Luo, J. Missing measurement data recovery methods in structural health monitoring: The state, challenges and case study. Measurement 2024, 231, 114528. [Google Scholar] [CrossRef]
- Wan, N.; Huang, M.; Lei, Y. High-Efficiency Finite Element Model Updating of Bridge Structure Using a Novel Physics-Guided Neural Network. Int. J. Struct. Stab. Dyn. 2024, 2650006. [Google Scholar] [CrossRef]
- Huang, M.; Wan, N.; Zhu, H. Reconstruction of structural acceleration response based on CNN-BiGRU with squeeze-and-excitation under environmental temperature effects. J. Civ. Struct. Health Monit. 2024, 1–19. [Google Scholar] [CrossRef]
- Xu, W.; Ouyang, F. A systematic review of AI role in the educational system based on a proposed conceptual framework. Educ. Inf. Technol. 2022, 27, 4195–4223. [Google Scholar] [CrossRef]
- Sun, Z.; Anbarasan, M.; Praveen Kumar, D. Design of online intelligent English teaching platform based on artificial intelligence techniques. Comput. Intell. 2021, 37, 1166–1180. [Google Scholar] [CrossRef]
- Fang, C. Intelligent online English teaching system based on SVM algorithm and complex network. J. Intell. Fuzzy Syst. 2021, 40, 2709–2719. [Google Scholar] [CrossRef]
- Hamsa, H.; Indiradevi, S.; Kizhakkethottam, J.J. Student academic performance prediction model using decision tree and fuzzy genetic algorithm. Procedia Technol. 2016, 25, 326–332. [Google Scholar] [CrossRef]
- Chen, J.-F.; Hsieh, H.-N.; Do, Q.H. Evaluating teaching performance based on fuzzy AHP and comprehensive evaluation approach. Appl. Soft Comput. 2015, 28, 100–108. [Google Scholar] [CrossRef]
- Thanassoulis, E.; Dey, P.K.; Petridis, K.; Goniadis, I.; Georgiou, A.C. Evaluating higher education teaching performance using combined analytic hierarchy process and data envelopment analysis. J. Oper. Res. Soc. 2017, 68, 431–445. [Google Scholar] [CrossRef]

| Target Level | Standardized Layer | Indicator Layer | Description of Indicators |
|---|---|---|---|
| Teaching evaluation A | Teaching background B1 | Teaching objective C11 | To cultivate students’ ability to deeply understand and apply advanced concepts of ASD to solve practical engineering problems |
| Learning situation analysis C12 | To assess students’ understanding and application of ASD theories, providing feedback for teaching adjustments | ||
| Teaching program C13 | To comprehensively cover ASD topics, ensuring students receive systematic guidance and support | ||
| Teaching input B2 | Faculty C21 | To emphasize students’ abilities to analyze and solve complex ASD problems | |
| Base and test equipment C22 | To deepen students’ understanding of ASD through laboratory practice | ||
| Teaching resources and funding C23 | To ensure students have access to necessary experimental equipment, software, and computational resources | ||
| Teaching process B3 | Course instructional content C31 | To cover advanced concepts, theories, and applications of ASD, reflecting the latest developments | |
| Teaching methodology C32 | To combine theory with practice, enhancing learning outcomes through case analyses and experimental practices | ||
| Student activity C33 | To cultivate students’ practical abilities and team work through discussions, projects, and experimental reports | ||
| Teacher activity C34 | To influence teaching quality, including teaching methods, resource preparation, and assignment design | ||
| Teaching outcome B4 | Course management and assessment C41 | To evaluate the effectiveness of the course, ensure content updates, and improve teaching quality | |
| Student capacity building C42 | To assess students’ theoretical grasp and practical application abilities in the field of ASD | ||
| Teacher capacity building C43 | Teachers need to possess profound knowledge and teaching abilities in ASD | ||
| Overall effectiveness of the course C44 | To reflect students’ learning outcomes and capability enhancement, including knowledge mastery, practical abilities, and innovation capabilities |
| Scale | Definition | Clarification |
|---|---|---|
| 0.5 | Equal importance | The two elements are equally important when compared |
| 0.6 | Slightly important | Comparing two elements, the former element is slightly more important than the other element |
| 0.7 | Clearly important | Comparing two elements, the former element is significantly more important than the other element |
| 0.8 | High priority | Comparing two elements, the former element is more strongly important than the other element |
| 0.9 | Vital | Comparing two elements, the former element is extremely more important than the other element |
| 0.1~0.4 | Inverse comparison | The element is compared with the element to obtain the judgment , then the element is compared with the element to obtain the judgment |
| Teaching Evaluation A | Teaching Background B1 | Teaching Input B2 | Teaching Process B3 | Teaching Outcome B4 |
|---|---|---|---|---|
| Teaching background B1 | 0.5 | 0.4 | 0.3 | 0.4 |
| Teaching input B2 | 0.6 | 0.5 | 0.4 | 0.5 |
| Teaching process B3 | 0.7 | 0.6 | 0.5 | 0.4 |
| Teaching outcome B4 | 0.6 | 0.5 | 0.6 | 0.5 |
| Teaching Background B1 | Teaching Objective C11 | Learning Situation Analysis C12 | Teaching Program C13 |
|---|---|---|---|
| Teaching objective C11 | 0.5 | 0.5 | 0.4 |
| Learning situation analysis C12 | 0.5 | 0.5 | 0.3 |
| Teaching program C13 | 0.6 | 0.7 | 0.5 |
| Teaching Input B2 | Faculty C21 | Base and Test Equipment C22 | Teaching Resources and Funding C23 |
|---|---|---|---|
| Faculty C21 | 0.5 | 0.6 | 0.6 |
| Base and test equipment C22 | 0.4 | 0.5 | 0.4 |
| Teaching resources and funding C23 | 0.4 | 0.6 | 0.5 |
| Teaching Process B3 | Course Instructional Content C31 | Teaching Methodology C32 | Student Activity C33 | Teacher Activity C34 |
|---|---|---|---|---|
| Course instructional content C31 | 0.5 | 0.6 | 0.5 | 0.6 |
| Teaching methodology C32 | 0.4 | 0.5 | 0.6 | 0.6 |
| Student activity C33 | 0.3 | 0.4 | 0.5 | 0.5 |
| Teacher activity C34 | 0.4 | 0.4 | 0.5 | 0.5 |
| Teaching Outcome B4 | Course Management and Assessment C41 | Student Capacity Building C42 | Teacher Capacity Building C43 | Overall Effectiveness of the Course C44 |
|---|---|---|---|---|
| Course management and assessment C41 | 0.5 | 0.1 | 0.4 | 0.5 |
| Student capacity building C42 | 0.9 | 0.5 | 0.5 | 0.5 |
| Teacher capacity building C43 | 0.6 | 0.5 | 0.5 | 0.4 |
| Overall effectiveness of the course C44 | 0.5 | 0.5 | 0.6 | 0.5 |
| Teaching Evaluation A | Teaching Background B1 | Teaching Input B2 | Teaching Process B3 | Teaching Outcome B4 |
|---|---|---|---|---|
| Teaching background B1 | 0.5 | 0.43 | 0.4 | 0.4 |
| Teaching input B2 | 0.57 | 0.5 | 0.47 | 0.47 |
| Teaching process B3 | 0.6 | 0.53 | 0.5 | 0.5 |
| Teaching outcome B4 | 0.6 | 0.53 | 0.5 | 0.5 |
| Teaching Background B1 | Teaching Objective C11 | Learning Situation Analysis C12 | Teaching Program C13 |
|---|---|---|---|
| Teaching objective C11 | 0.5 | 0.53 | 0.4 |
| Learning situation analysis C12 | 0.48 | 0.5 | 0.37 |
| Teaching program C13 | 0.6 | 0.63 | 0.5 |
| Teaching Input B2 | Faculty C21 | Base and Test Equipment C22 | Teaching Resources and Funding C23 |
|---|---|---|---|
| Faculty C21 | 0.5 | 0.6 | 0.55 |
| Base and test preparation C22 | 0.4 | 0.5 | 0.45 |
| Teaching resources and funding C23 | 0.45 | 0.55 | 0.5 |
| Teaching Process B3 | Course Instructional Content C31 | Teaching Methodology C32 | Student Activity C33 | Teacher Activity C34 |
|---|---|---|---|---|
| Course instructional Content C31 | 0.5 | 0.51 | 0.58 | 0.57 |
| Teaching methodology C32 | 0.49 | 0.5 | 0.57 | 0.55 |
| Student activity C33 | 0.42 | 0.43 | 0.5 | 0.48 |
| Teacher activity C34 | 0.43 | 0.45 | 0.52 | 0.5 |
| Teaching Outcome B4 | Course Management and Assessment C41 | Student Capacity Building C42 | Teacher Capacity Building C43 | Overall Effectiveness of the Course C44 |
|---|---|---|---|---|
| Course management and assessment C41 | 0.5 | 0.32 | 0.38 | 0.35 |
| Student capacity building C42 | 0.68 | 0.5 | 0.57 | 0.53 |
| Teacher capacity building C43 | 0.62 | 0.43 | 0.5 | 0.47 |
| Overall effectiveness of the course C44 | 0.65 | 0.47 | 0.53 | 0.5 |
| Evaluation Indicators | Relative Weight | Compatibility Indicators |
|---|---|---|
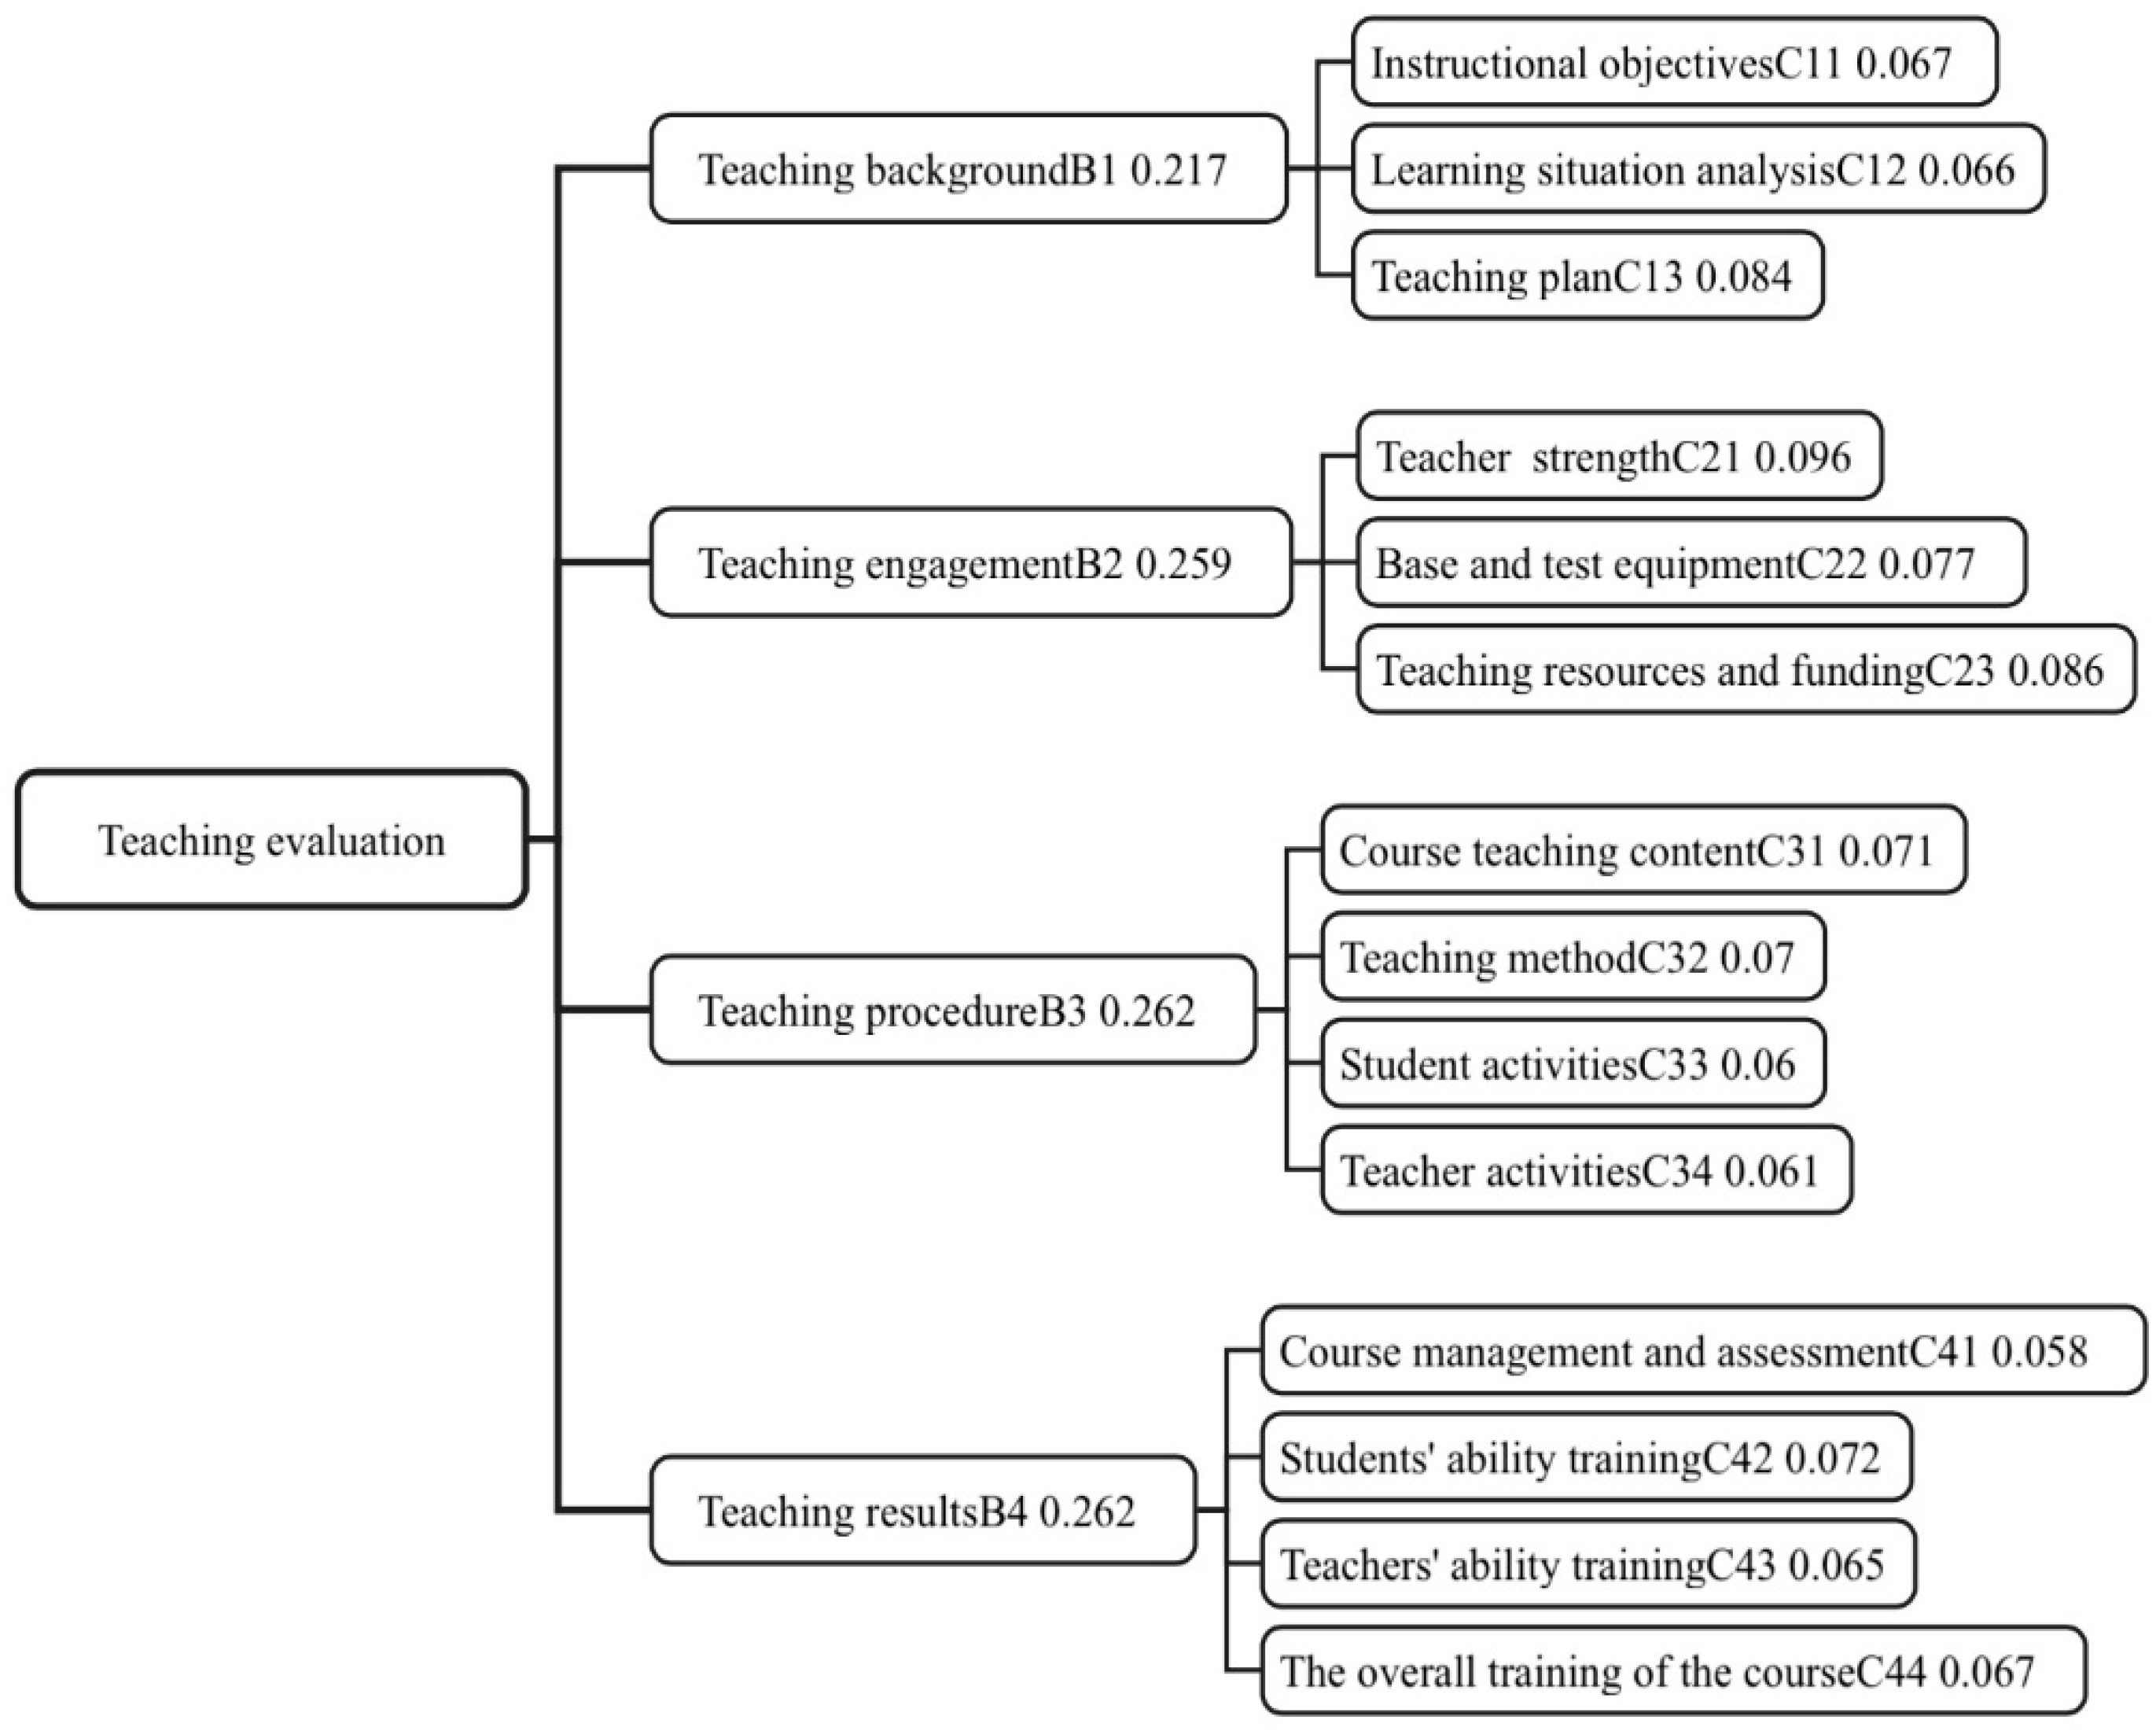
| Teaching background B1 | 0.217 | Consistency test passed |
| Teaching input B2 | 0.259 | |
| Teaching process B3 | 0.262 | |
| Teaching outcome B4 | 0.262 |
| Evaluation Indicators | Relative Weight | Compatibility Indicators |
|---|---|---|
| Teaching objective C11 | 0.310 | Consistency test passed |
| Learning situation analysis C12 | 0.304 | |
| Teaching program C13 | 0.386 |
| Evaluation Indicators | Relative Weight | Compatibility Indicators |
|---|---|---|
| Faculty C21 | 0.268 | Consistency test passed |
| Base and test preparation C22 | 0.385 | |
| Teaching resources and funding C23 | 0.347 |
| Evaluation Indicators | Relative Weight | Compatibility Indicators |
|---|---|---|
| Course instructional content C31 | 0.272 | Consistency test passed |
| Teaching methodology C32 | 0.266 | |
| Student activity C33 | 0.229 | |
| Teacher activity C34 | 0.233 |
| Evaluation Indicators | Relative Weight | Compatibility Indicators |
|---|---|---|
| Course management and assessment C41 | 0.22 | Consistency test passed |
| Student capacity building C42 | 0.276 | |
| Teacher capacity building C43 | 0.247 | |
| Overall effectiveness of the course C44 | 0.257 |
| Rating | Score Range/Points | Assign a Value to Something |
|---|---|---|
| Talented | 90~100 | 95 |
| Favorable | 80~90 | 85 |
| General | 60~80 | 70 |
| Mediocre | 0~60 | 30 |
| Level 1 Indicators | Secondary Indicators | Judging Set (Number of People as a Percentage) | |||
|---|---|---|---|---|---|
| Talented | Favorable | General | Mediocre | ||
| B1 | C11 | 0.78 | 0.22 | 0 | 0 |
| C12 | 0.79 | 0.18 | 0.03 | 0 | |
| C13 | 0.71 | 0.17 | 0.12 | 0 | |
| B2 | C21 | 0.89 | 0.11 | 0 | 0 |
| C22 | 0.78 | 0.18 | 0.04 | 0 | |
| C23 | 0.71 | 0.21 | 0.08 | 0 | |
| B3 | C31 | 0.65 | 0.29 | 0 | 0 |
| C32 | 0.78 | 0.18 | 0.04 | 0 | |
| C33 | 0.82 | 0.14 | 0.04 | 0 | |
| C34 | 0.79 | 0.18 | 0.03 | 0 | |
| B4 | C41 | 0.82 | 0.14 | 0.04 | 0 |
| C42 | 0.75 | 0.21 | 0.04 | 0 | |
| C43 | 0.79 | 0.18 | 0.03 | 0 | |
| C44 | 0.78 | 0.17 | 0.05 | 0 | |
Disclaimer/Publisher’s Note: The statements, opinions and data contained in all publications are solely those of the individual author(s) and contributor(s) and not of MDPI and/or the editor(s). MDPI and/or the editor(s) disclaim responsibility for any injury to people or property resulting from any ideas, methods, instructions or products referred to in the content. |
© 2024 by the authors. Licensee MDPI, Basel, Switzerland. This article is an open access article distributed under the terms and conditions of the Creative Commons Attribution (CC BY) license (https://creativecommons.org/licenses/by/4.0/).
Share and Cite
Huang, M.; He, Z.; Zhang, J.; Deng, Z.; Tang, D. Course Evaluation of Advanced Structural Dynamics Based on Improved SAPSO and FAHP. Buildings 2025, 15, 72. https://doi.org/10.3390/buildings15010072
Huang M, He Z, Zhang J, Deng Z, Tang D. Course Evaluation of Advanced Structural Dynamics Based on Improved SAPSO and FAHP. Buildings. 2025; 15(1):72. https://doi.org/10.3390/buildings15010072
Chicago/Turabian StyleHuang, Minshui, Zhongao He, Jianwei Zhang, Zhihang Deng, and Dina Tang. 2025. "Course Evaluation of Advanced Structural Dynamics Based on Improved SAPSO and FAHP" Buildings 15, no. 1: 72. https://doi.org/10.3390/buildings15010072
APA StyleHuang, M., He, Z., Zhang, J., Deng, Z., & Tang, D. (2025). Course Evaluation of Advanced Structural Dynamics Based on Improved SAPSO and FAHP. Buildings, 15(1), 72. https://doi.org/10.3390/buildings15010072