
Deterioration of Concrete Under Simulated Acid Rain Conditions: Microstructure, Appearance, and Compressive Properties


Abstract
1. Introduction
2. Experimental Program
2.1. Materials and Specimen Preparation
2.2. Techniques and Procedures
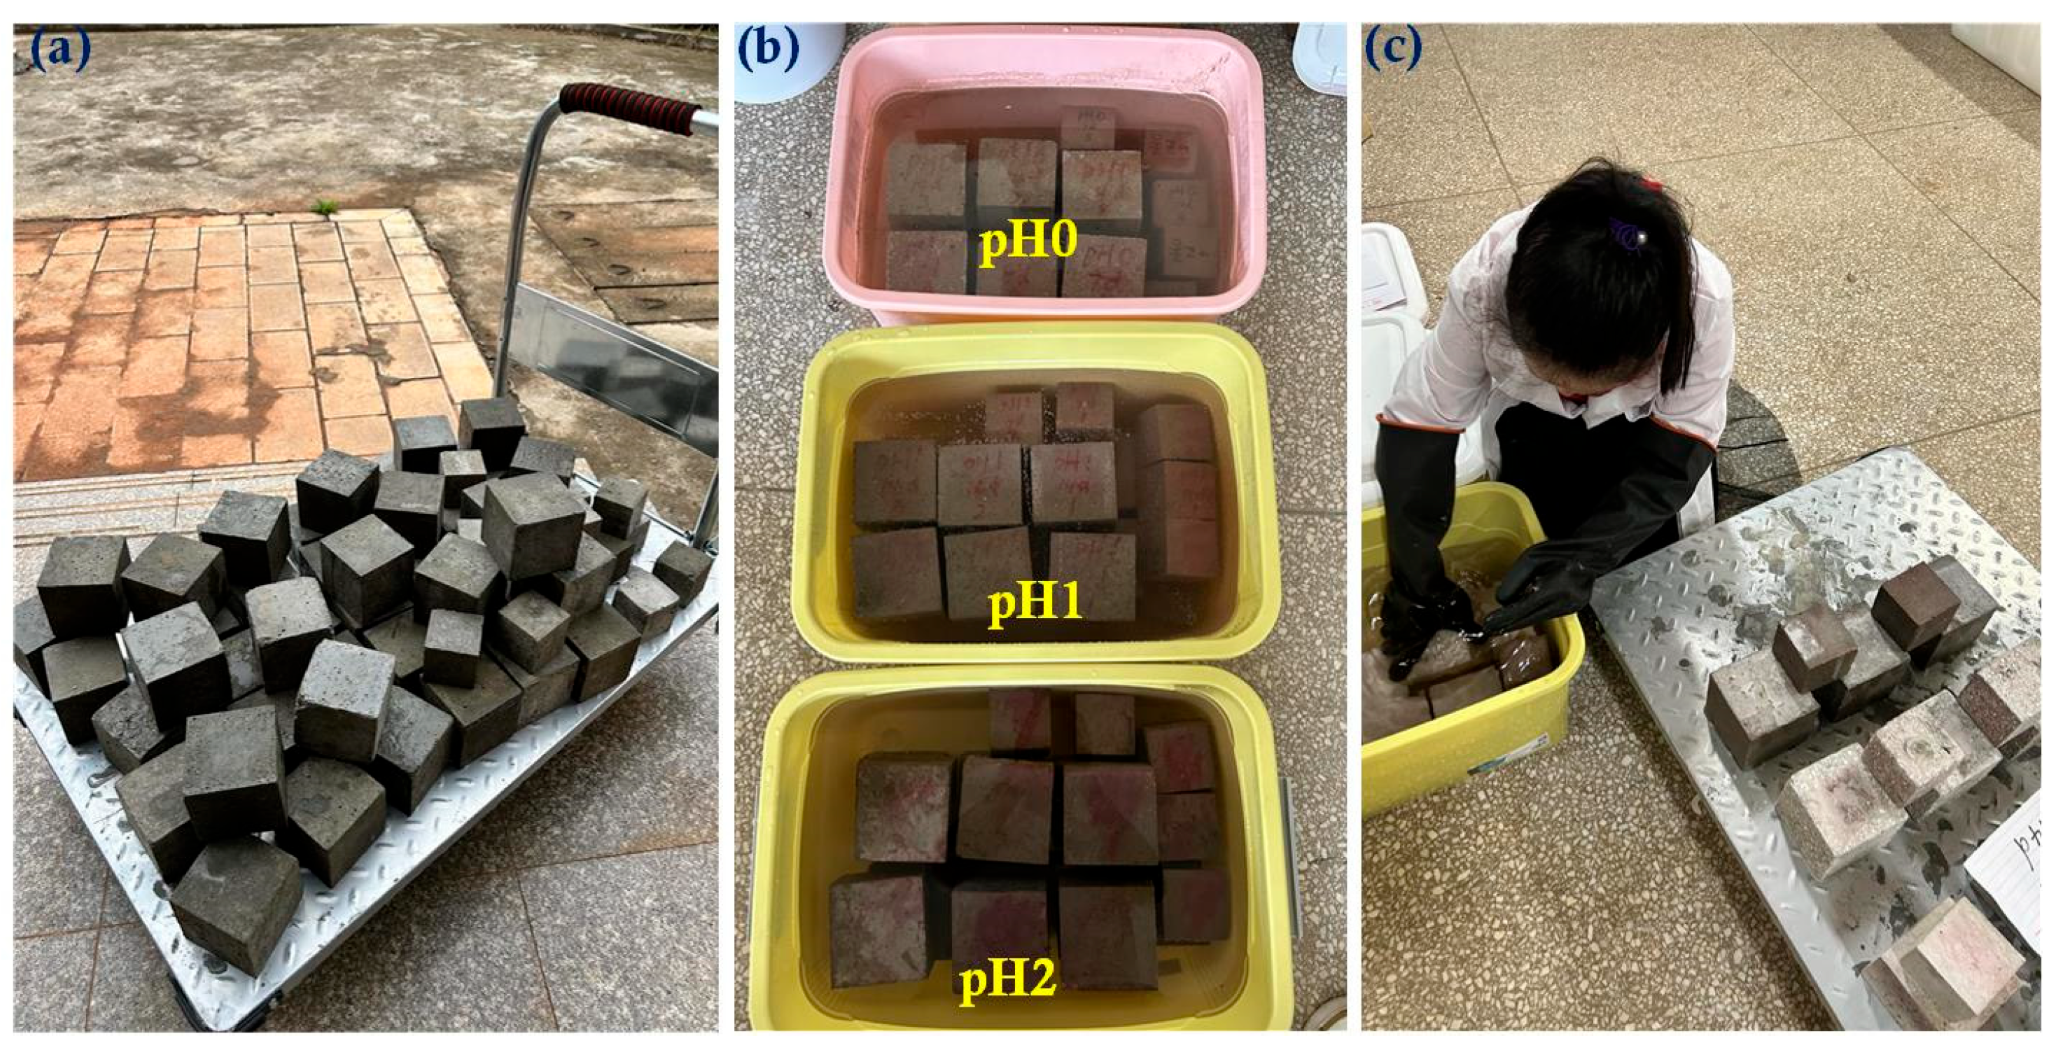
2.2.1. Simulated Acid Rain Environment
2.2.2. Test Procedure
3. Results and Discussion
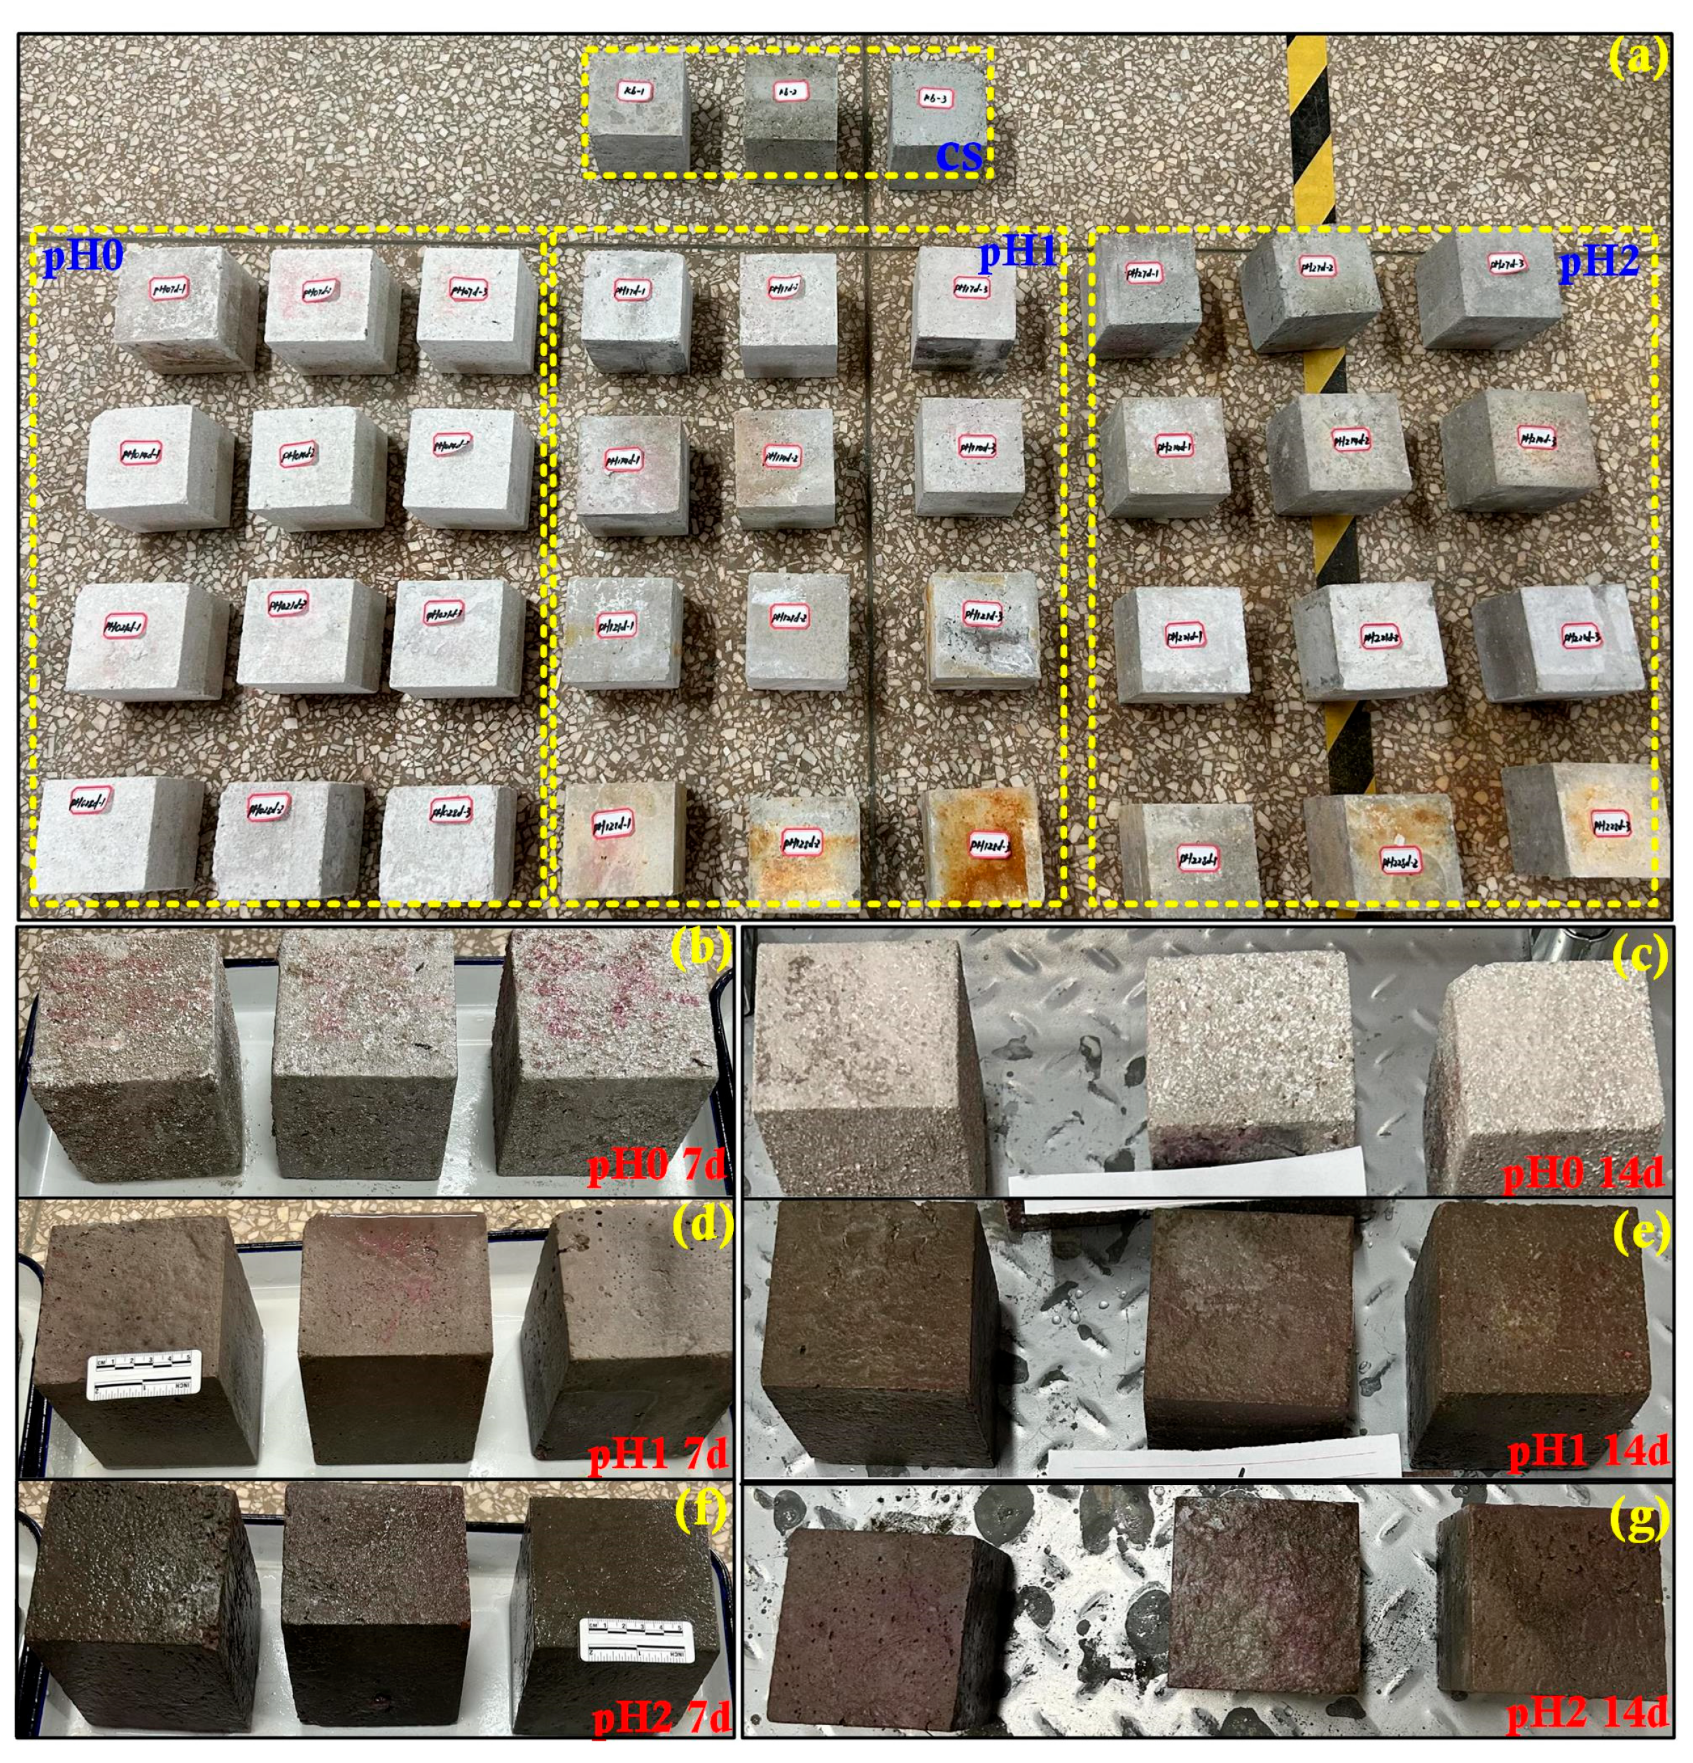
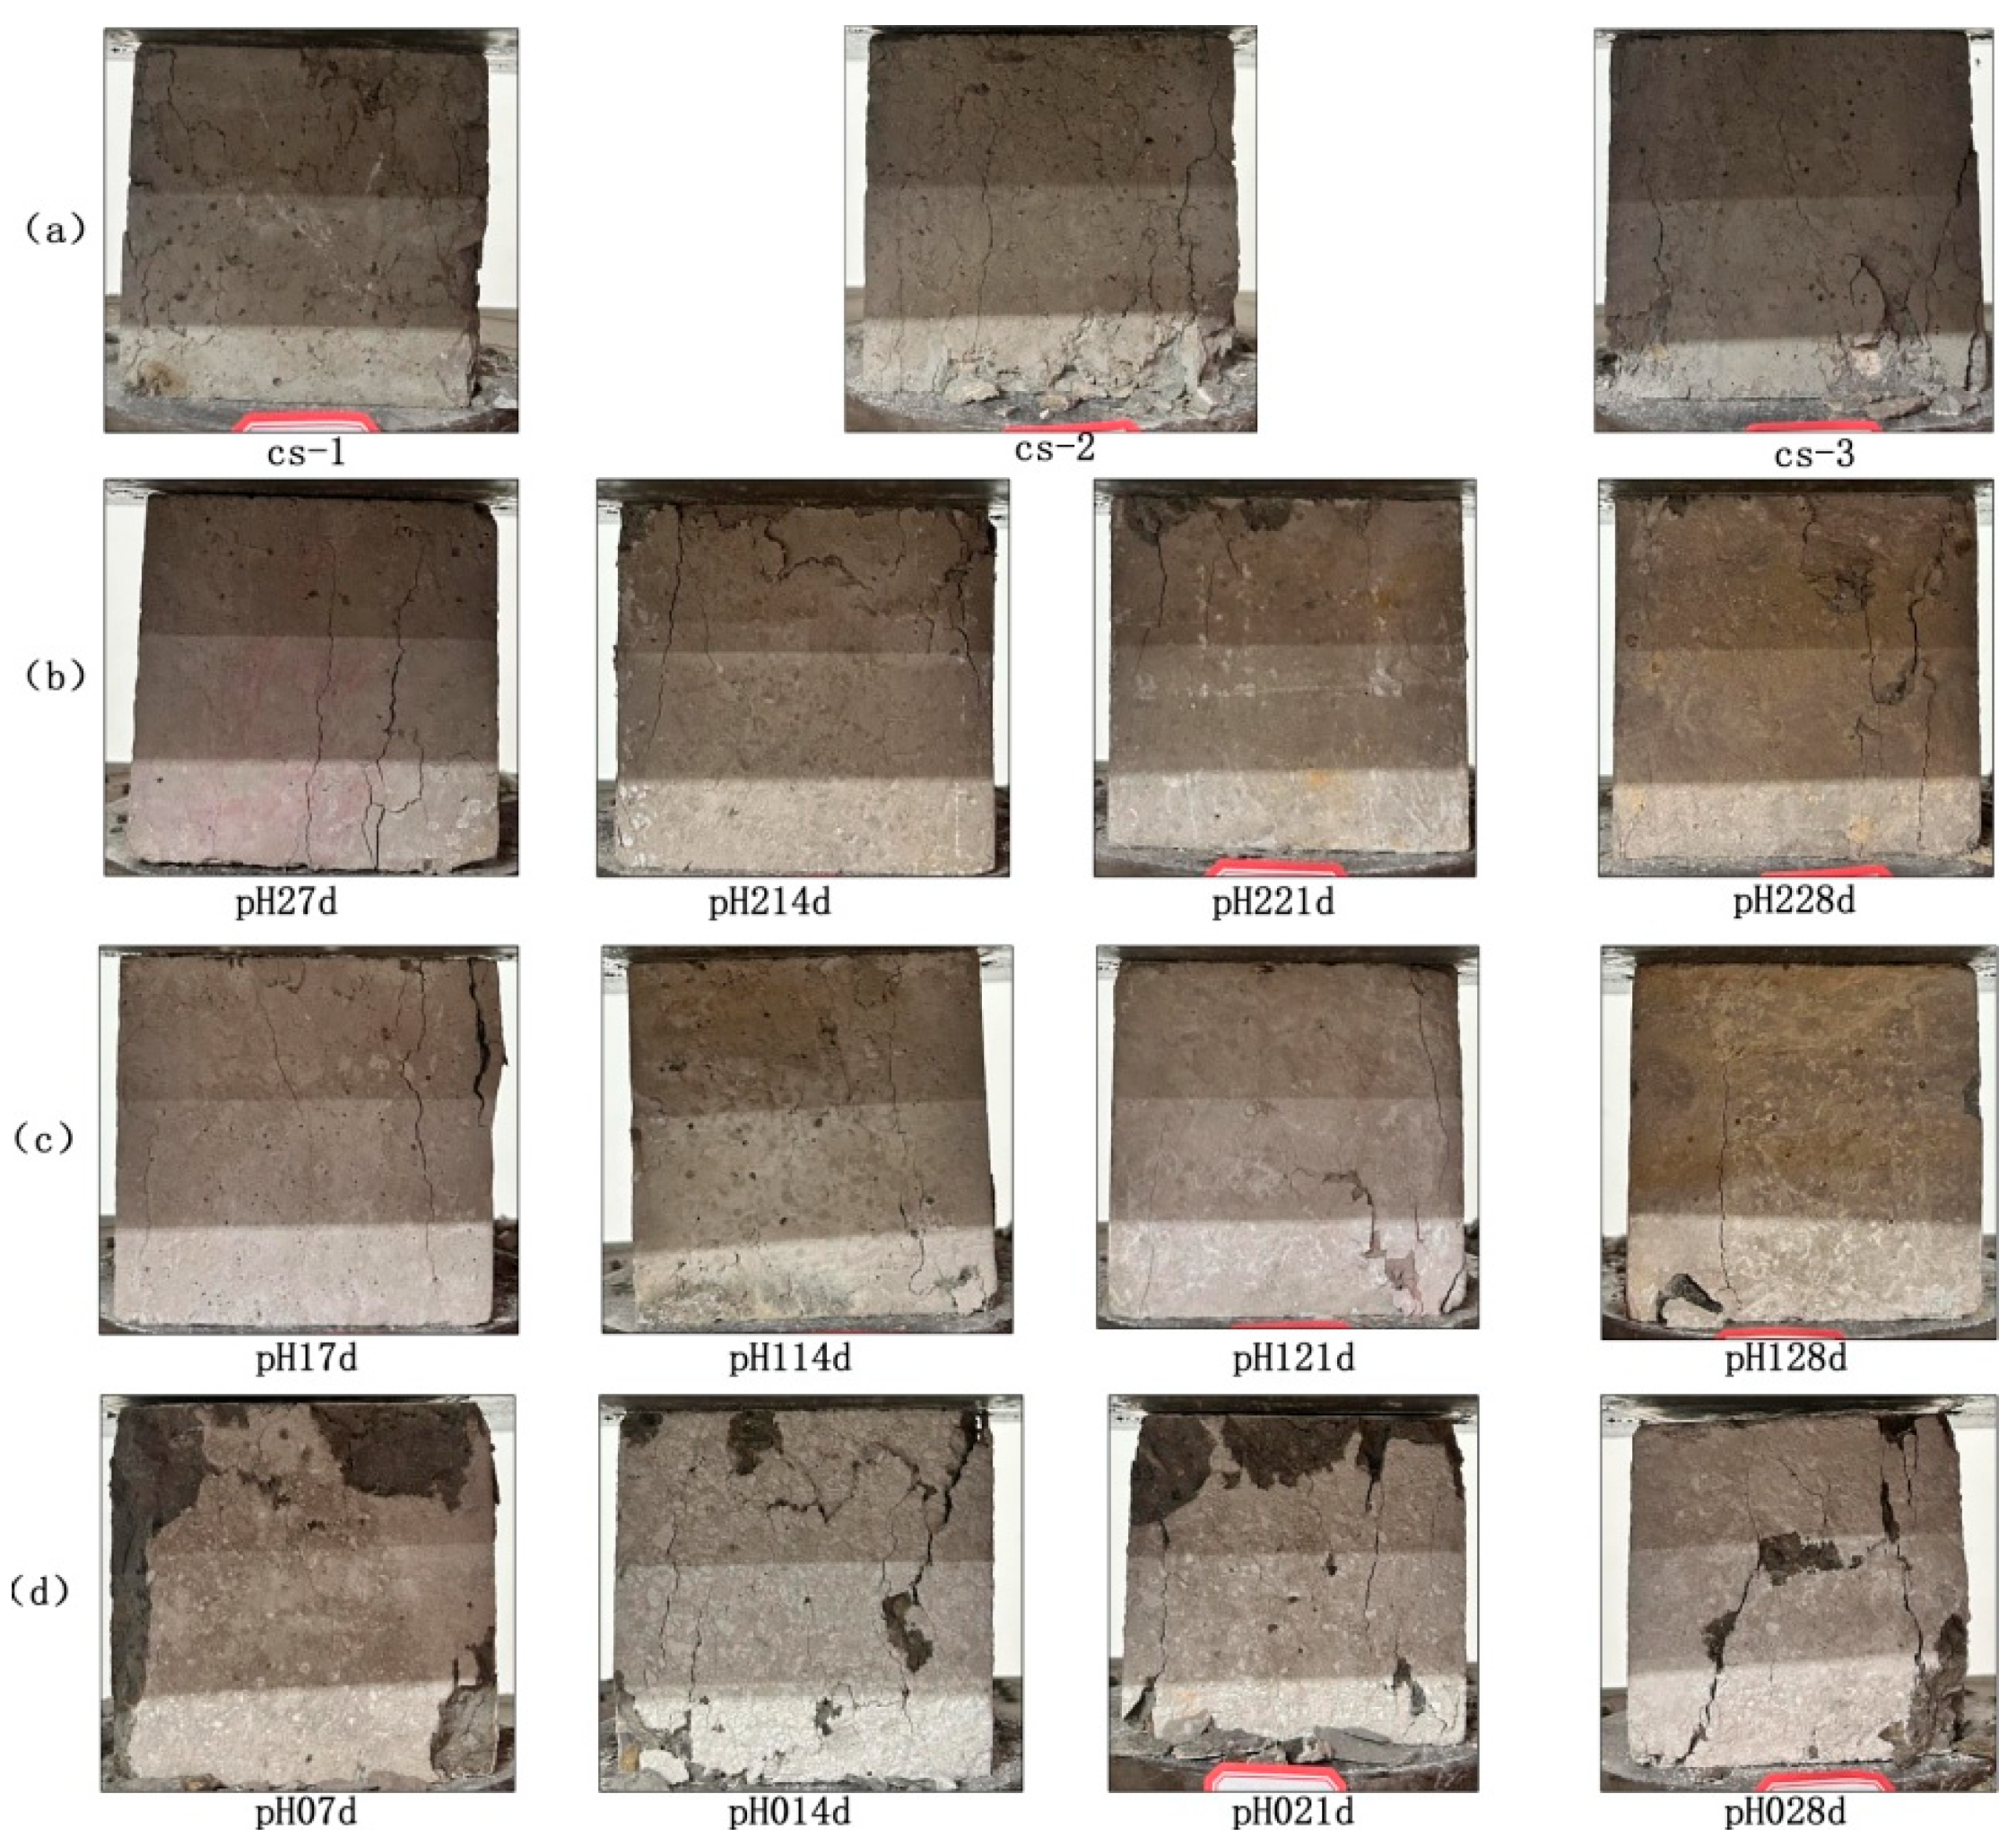
3.1. Visual Inspection of Corroded Concrete
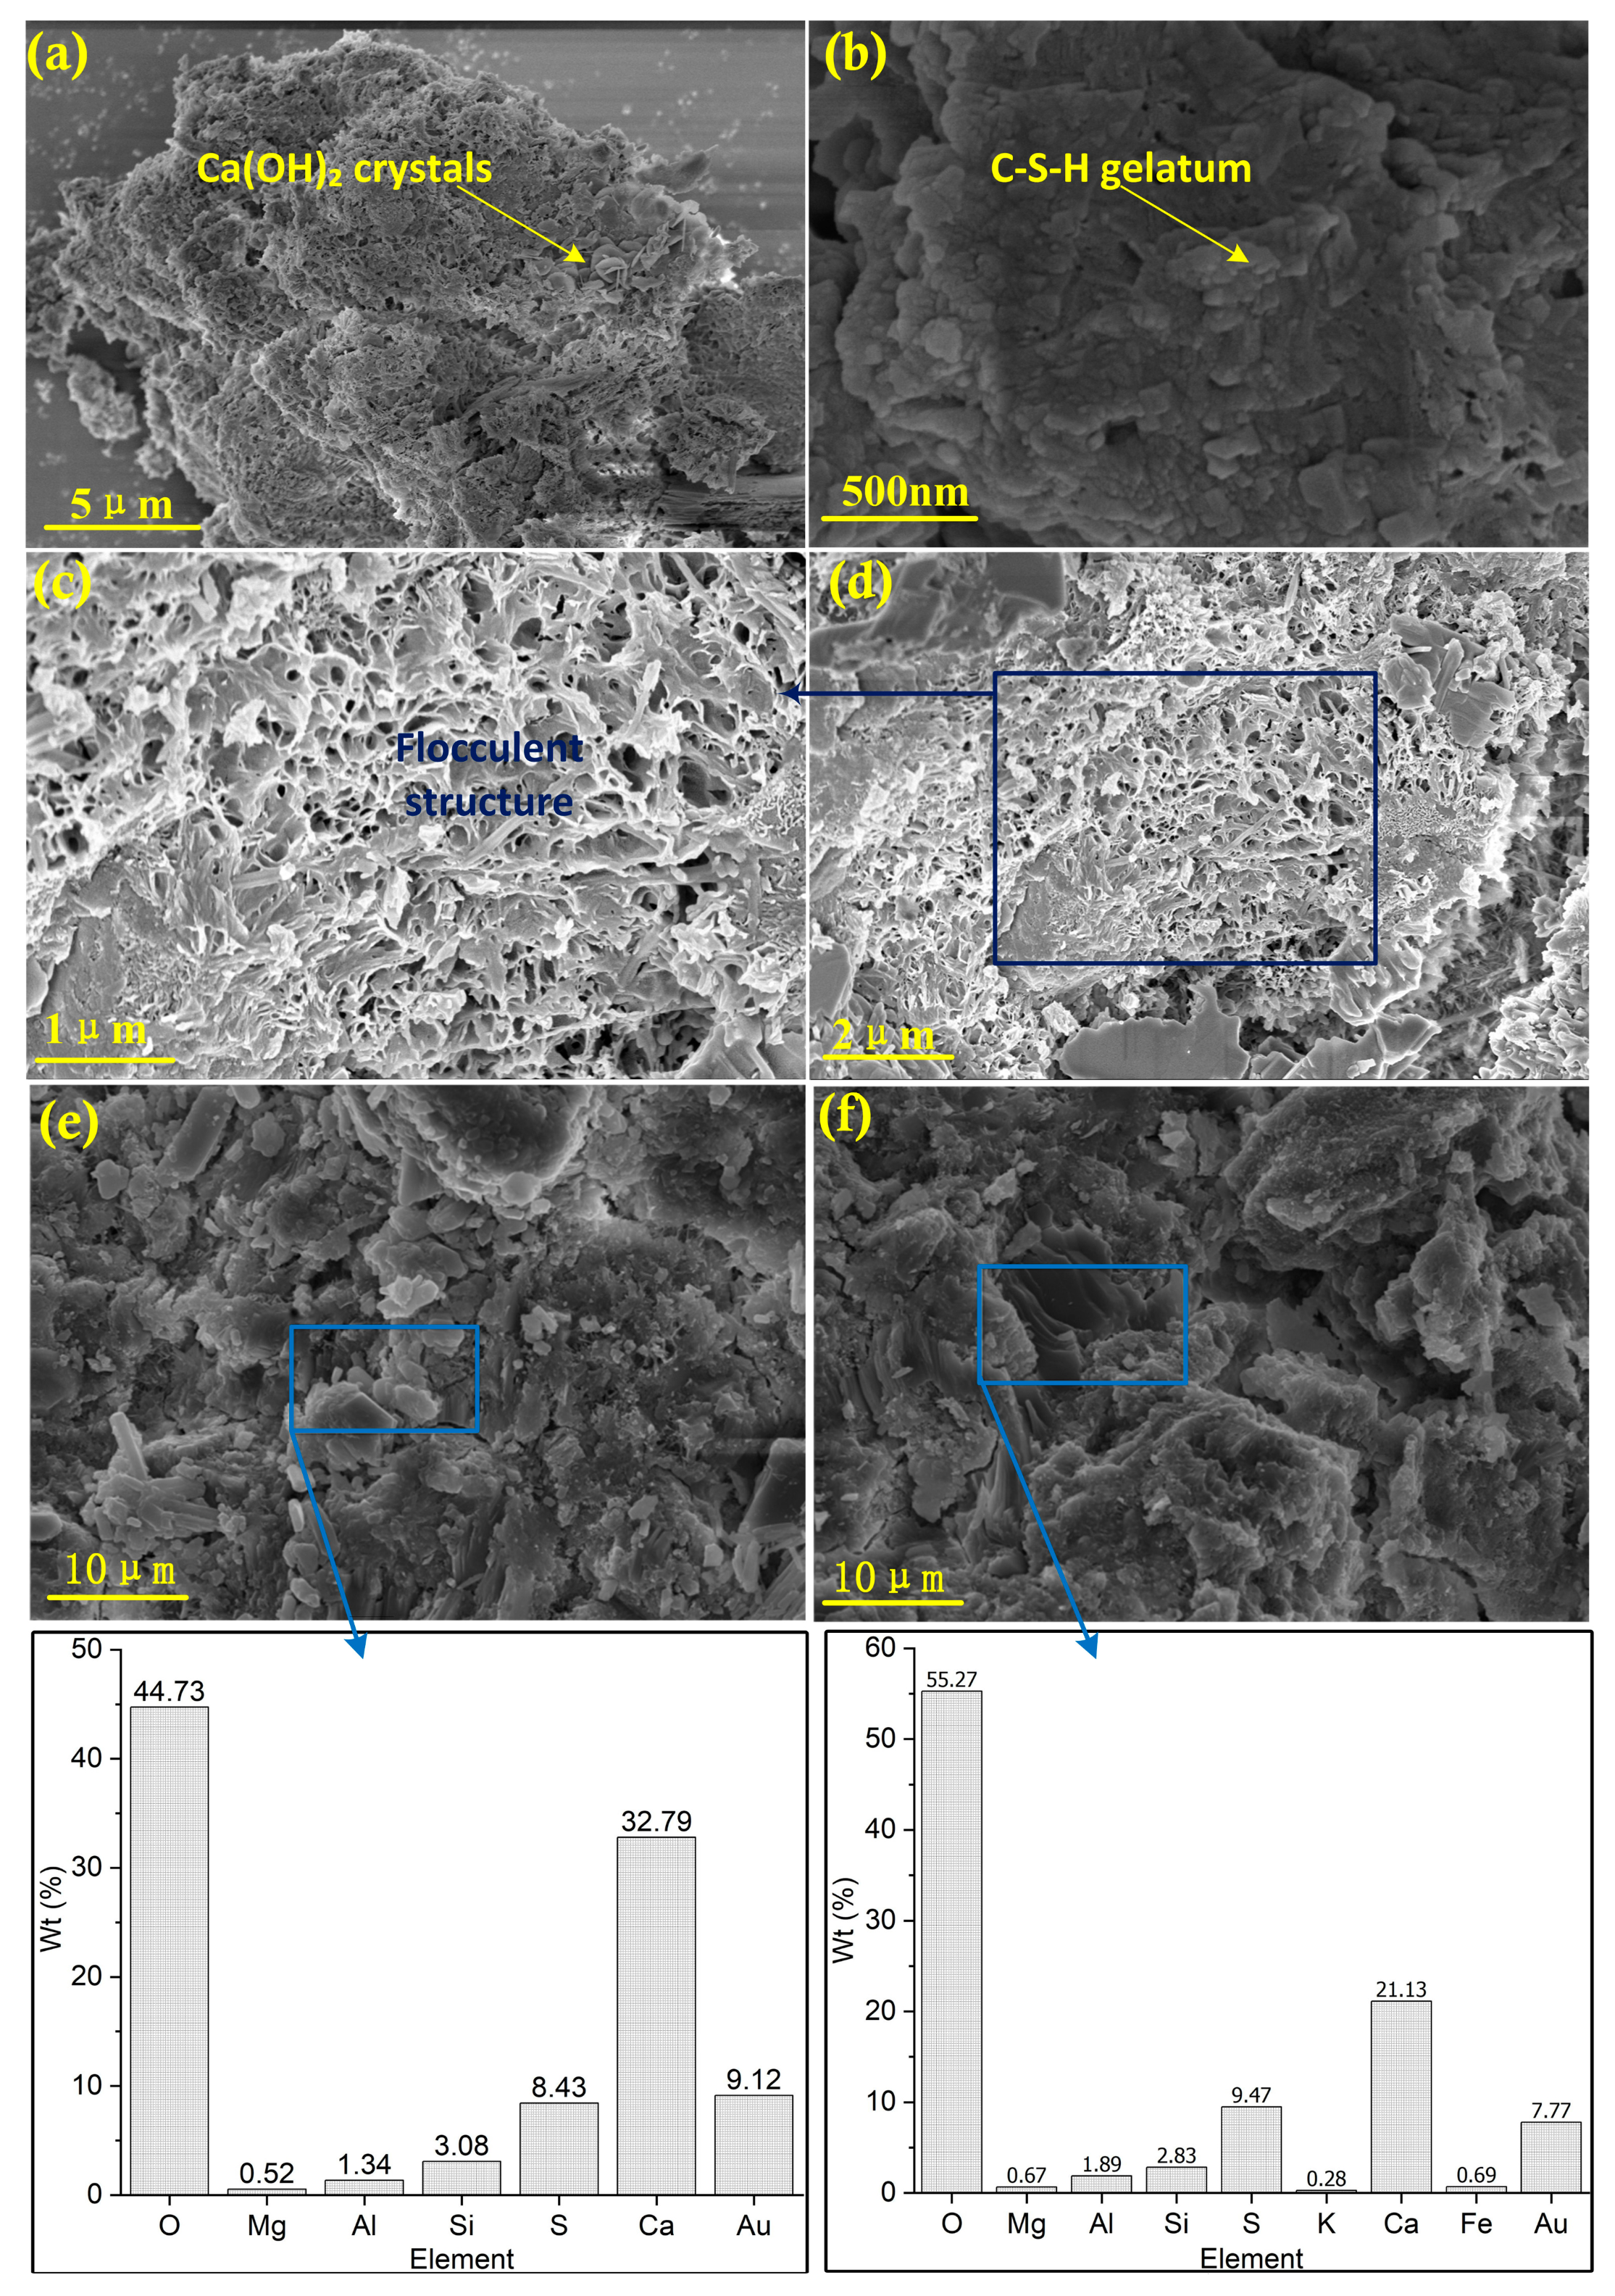
3.2. Microscopic Feature
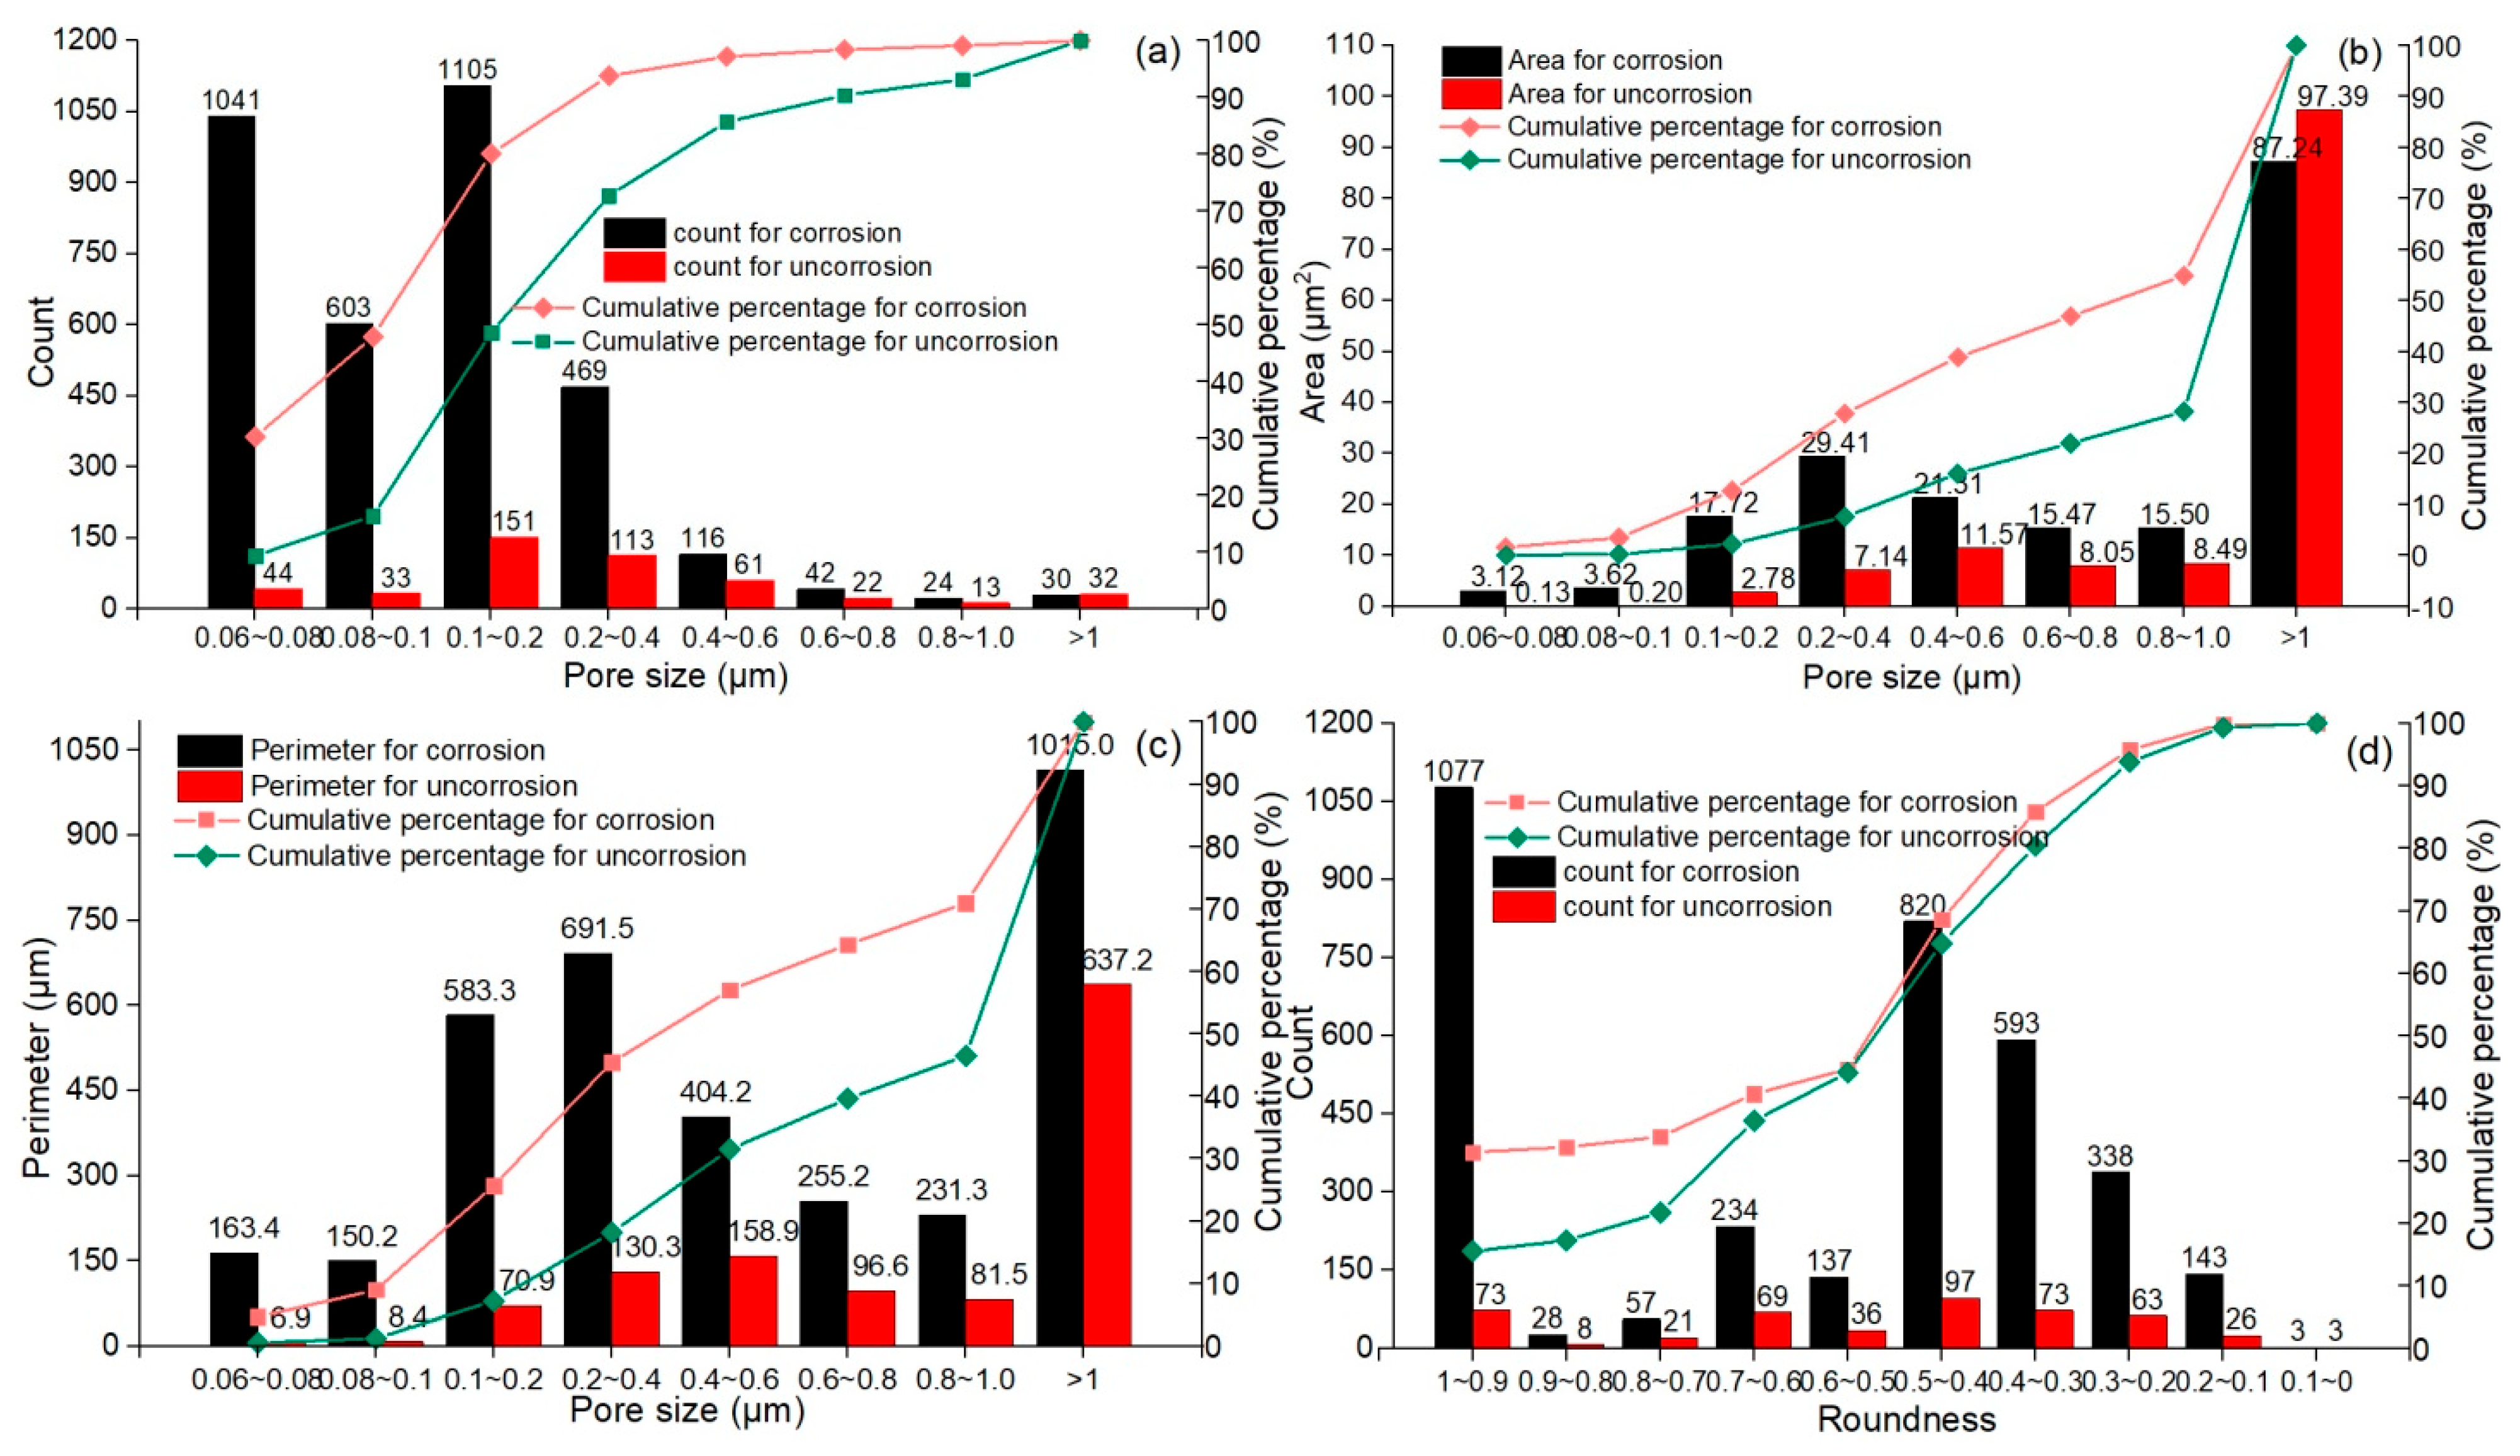
3.3. Quantitative Analysis of Pore Structure in Corroded Concrete
3.3.1. Parameter Quantization
3.3.2. Fractal Pore Structure
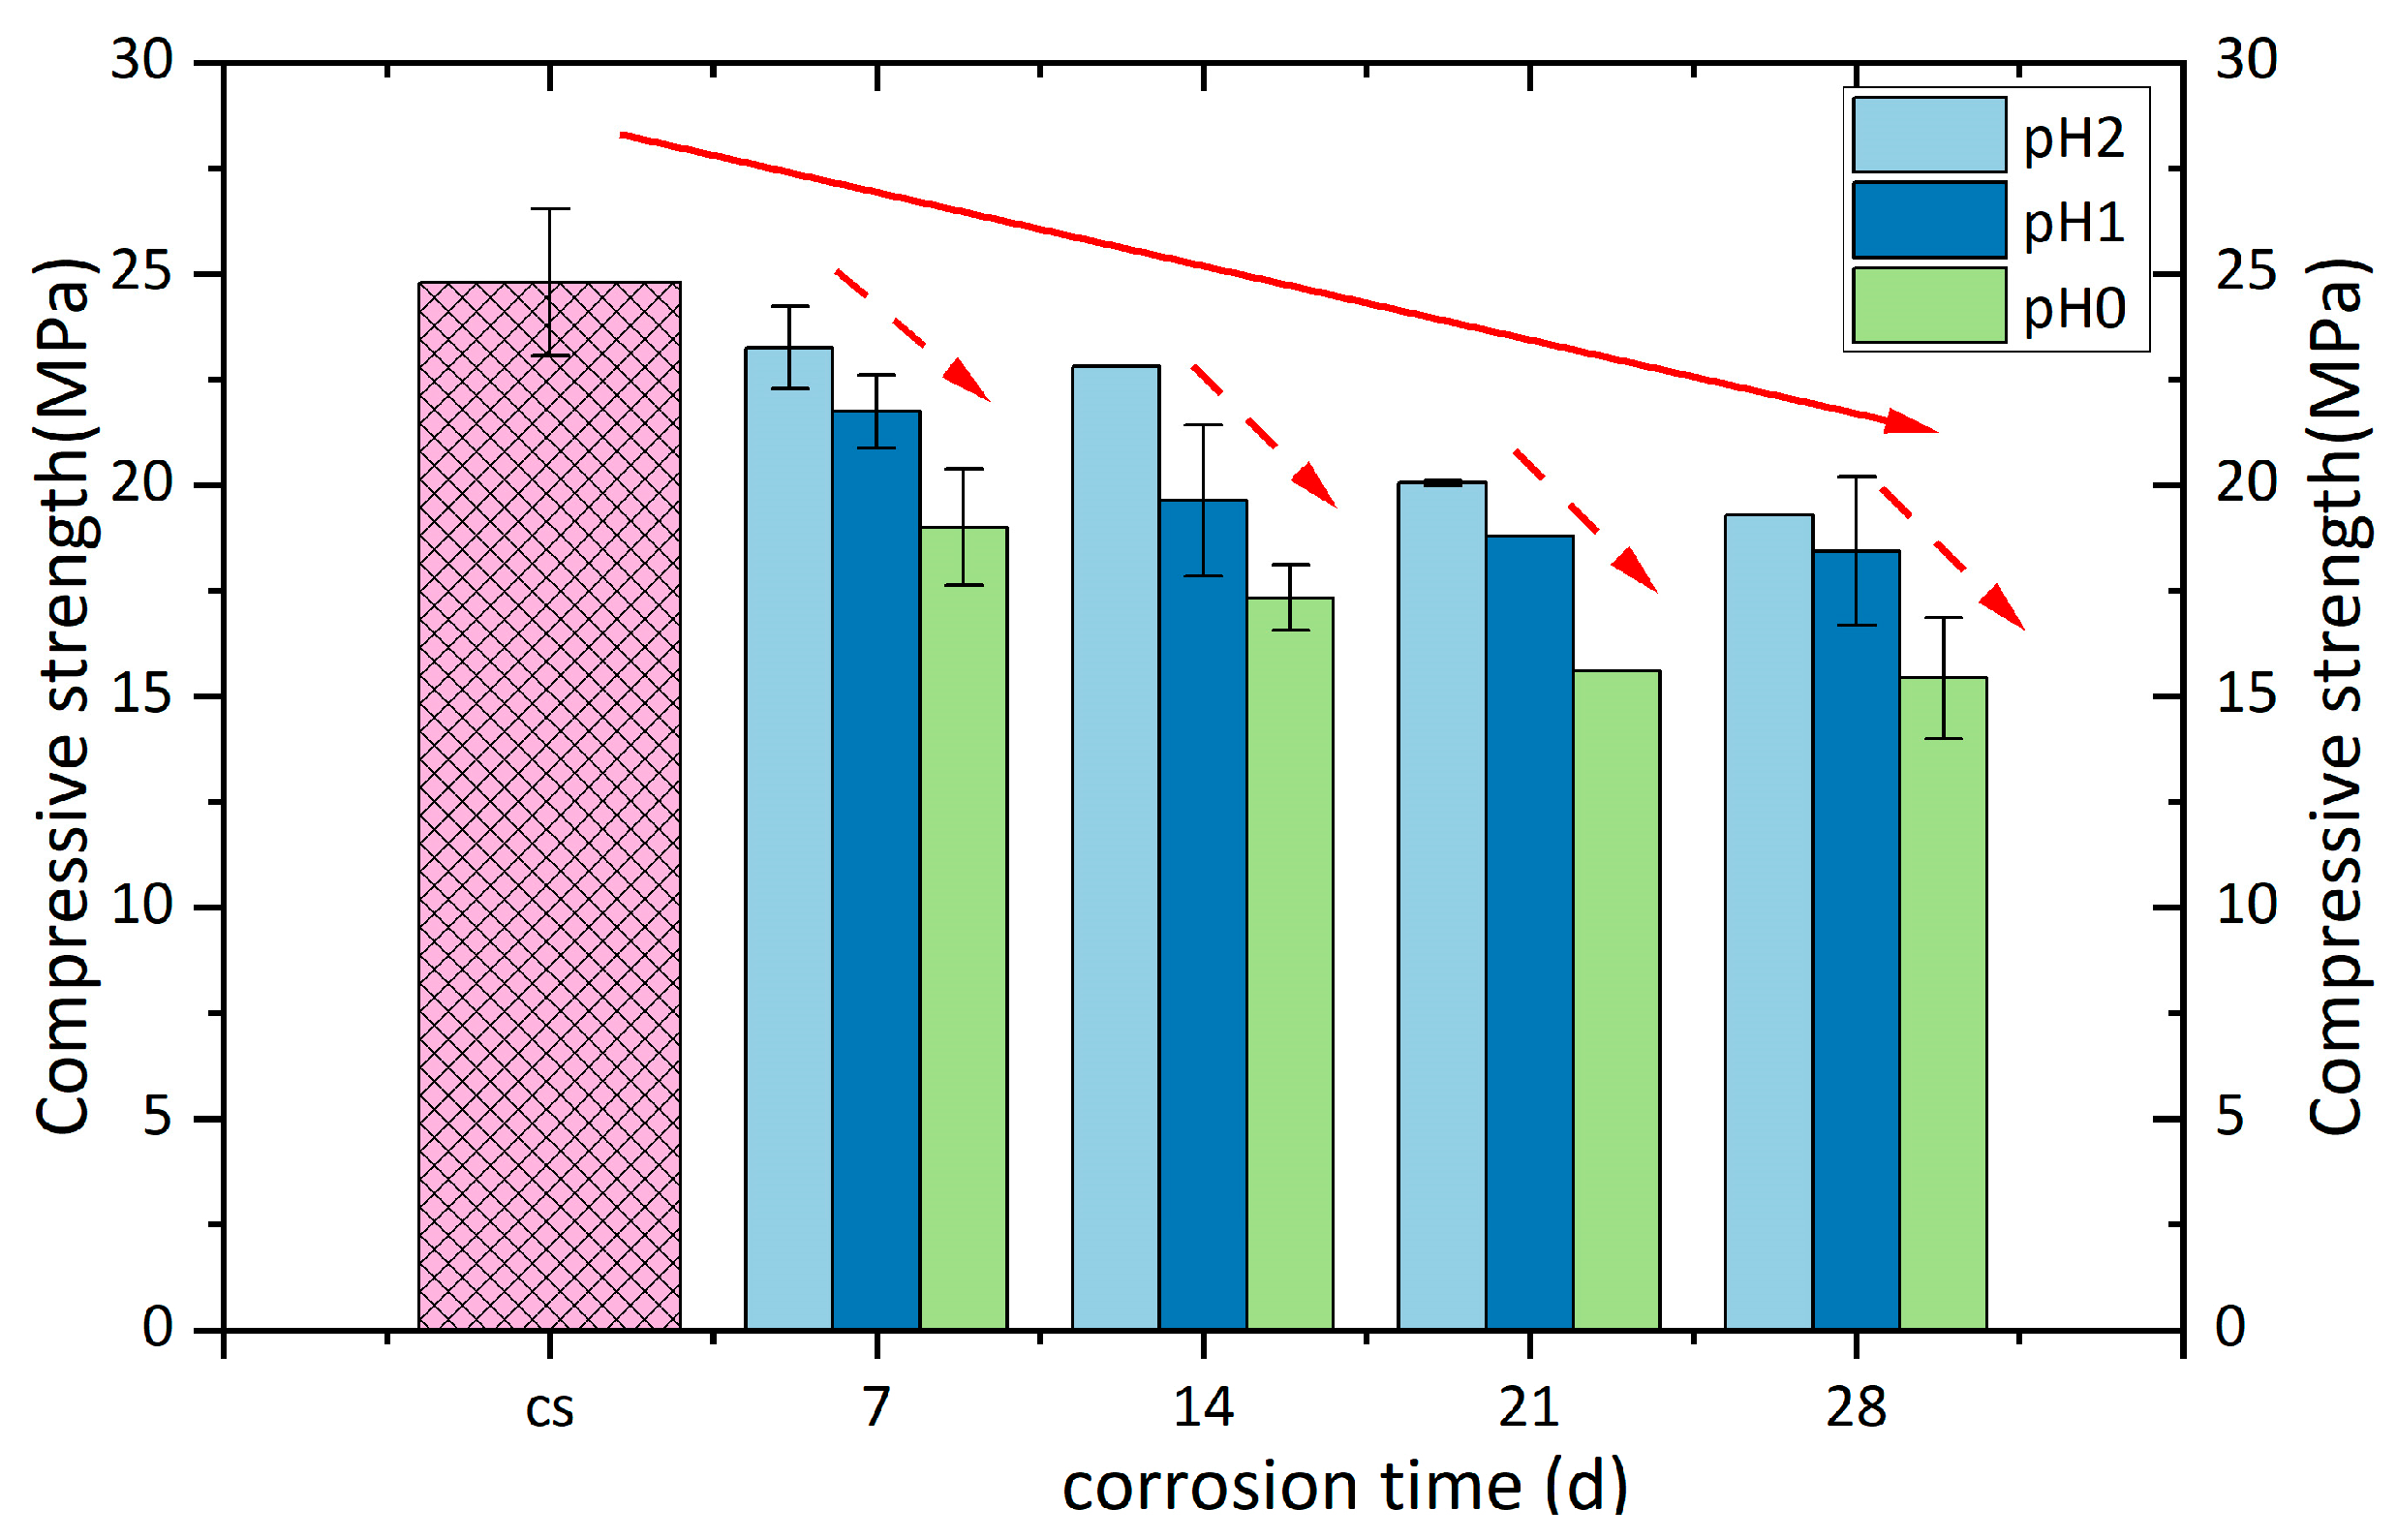
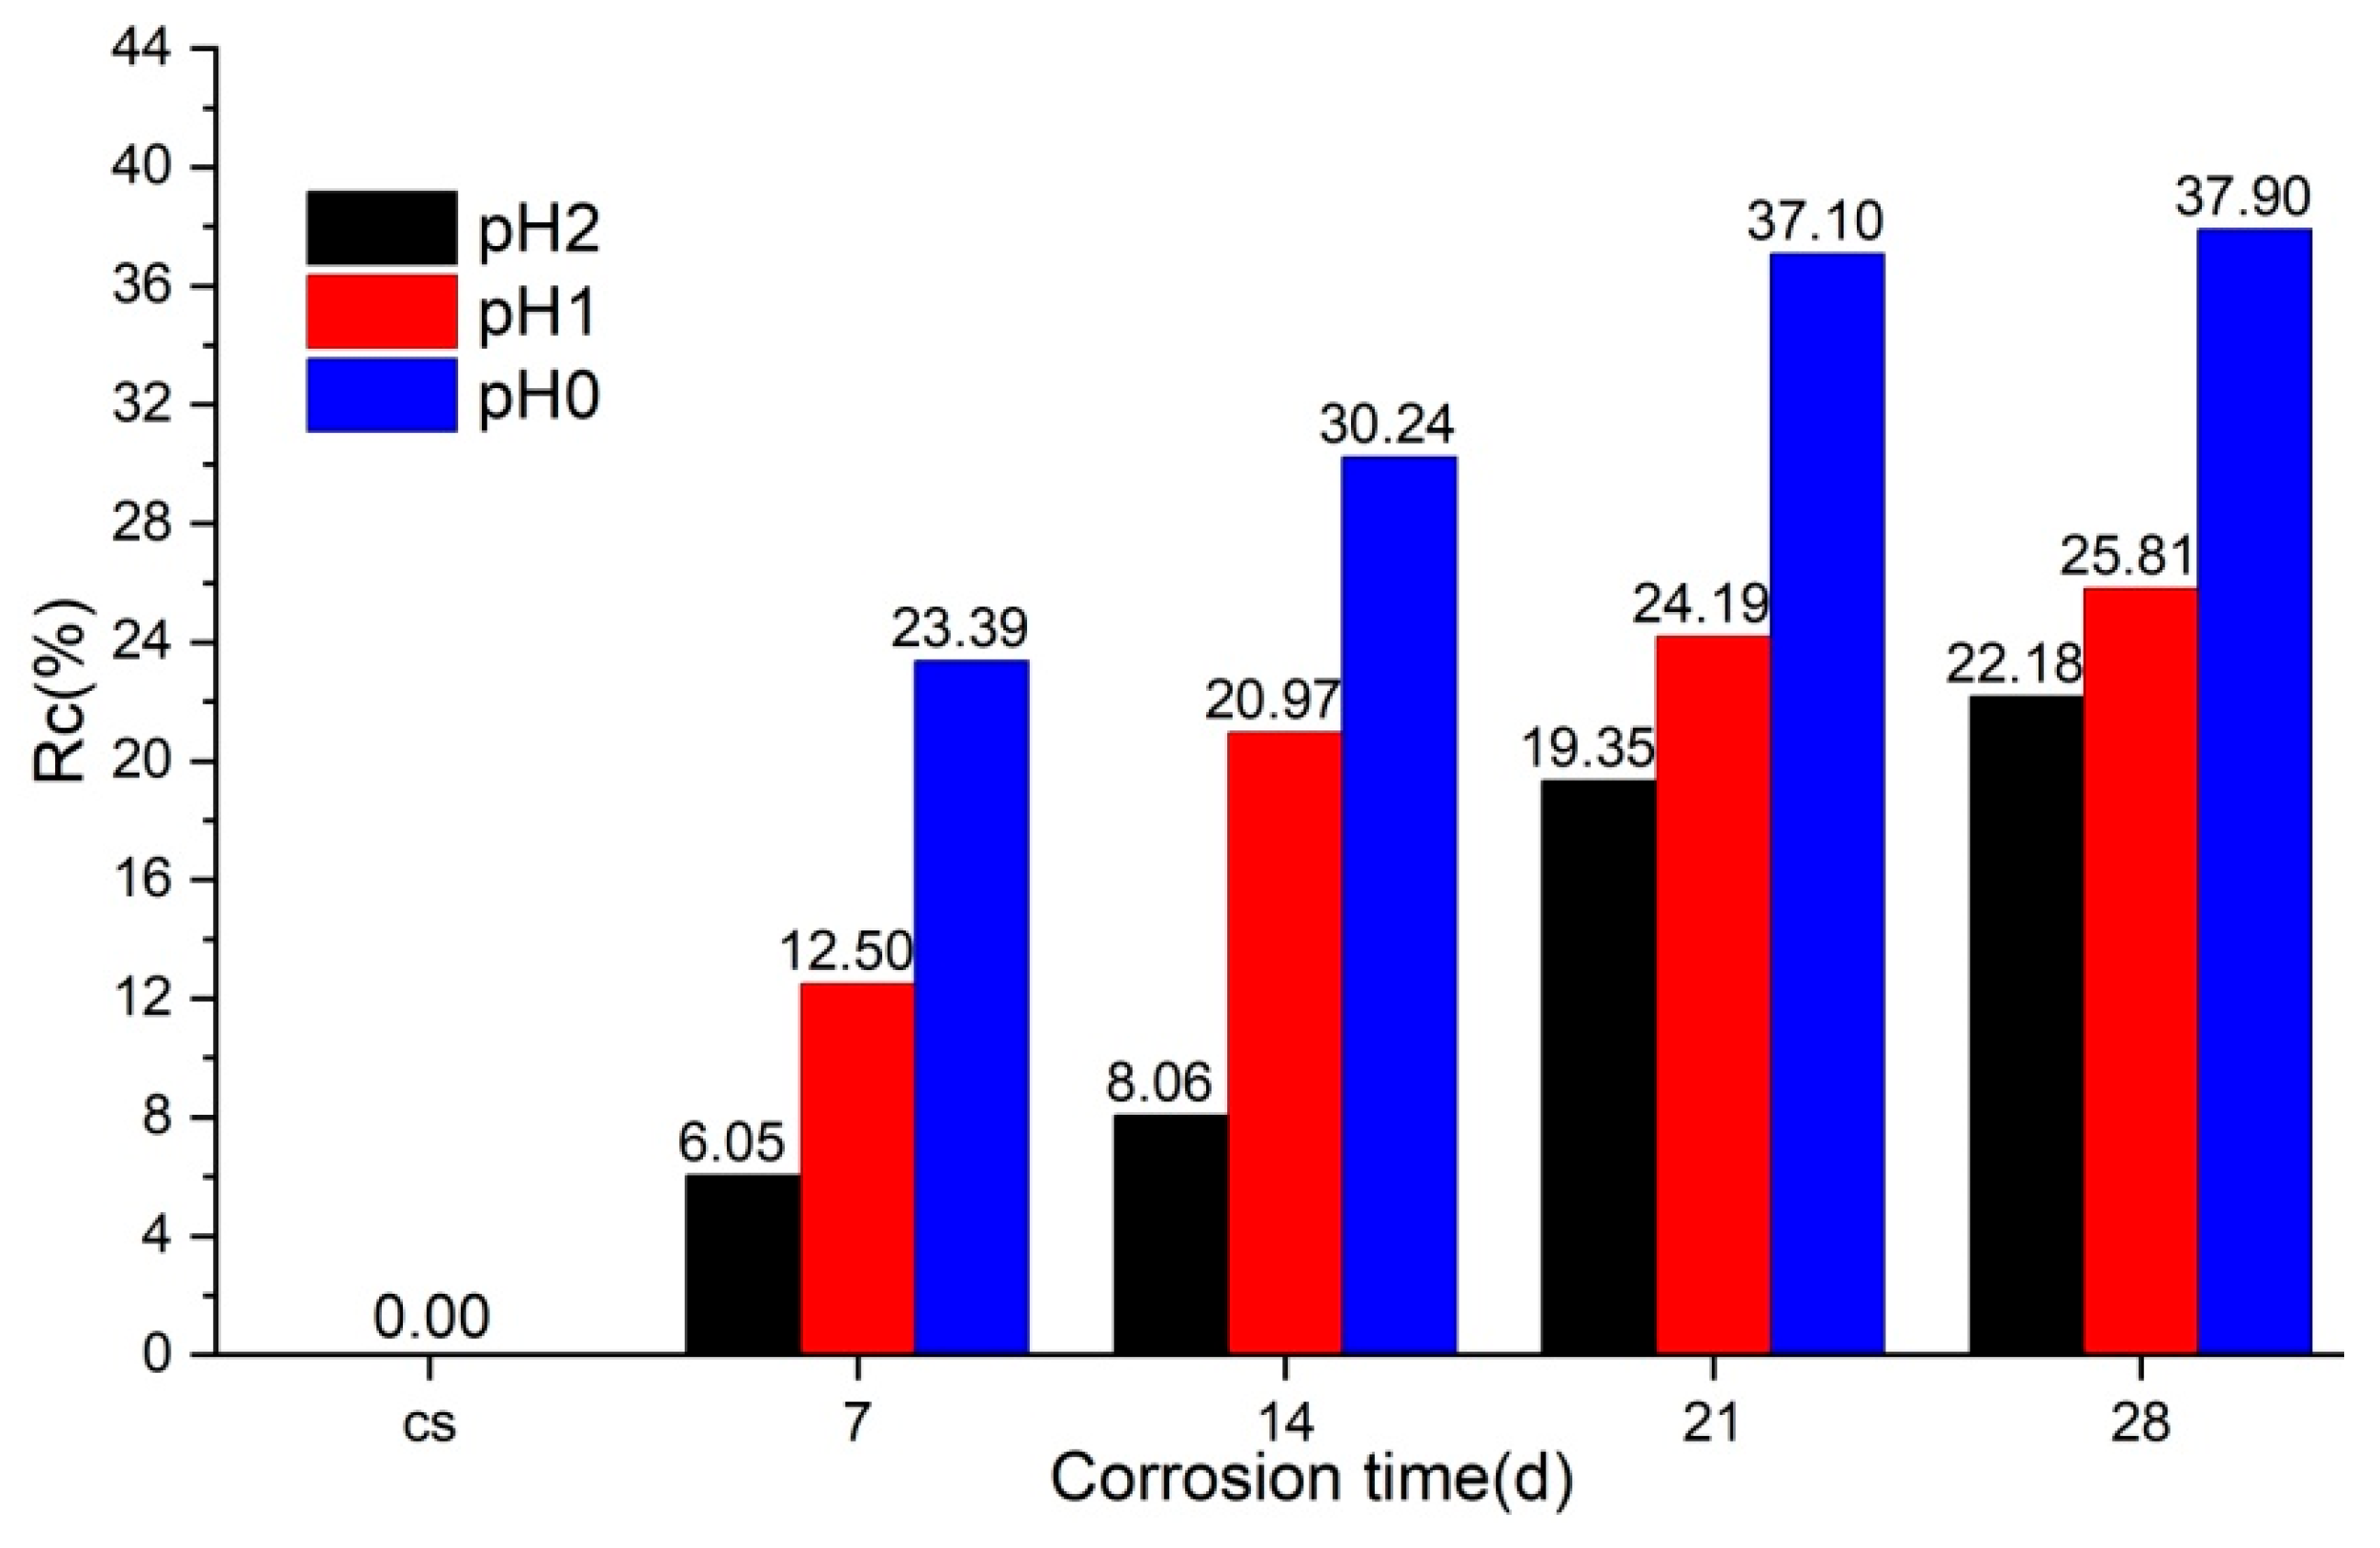
3.4. Effect of Corrosion on Concrete Strength
3.4.1. Failure Modes from Visual Perspective
3.4.2. Compressive Strength Test Results
4. Conclusions
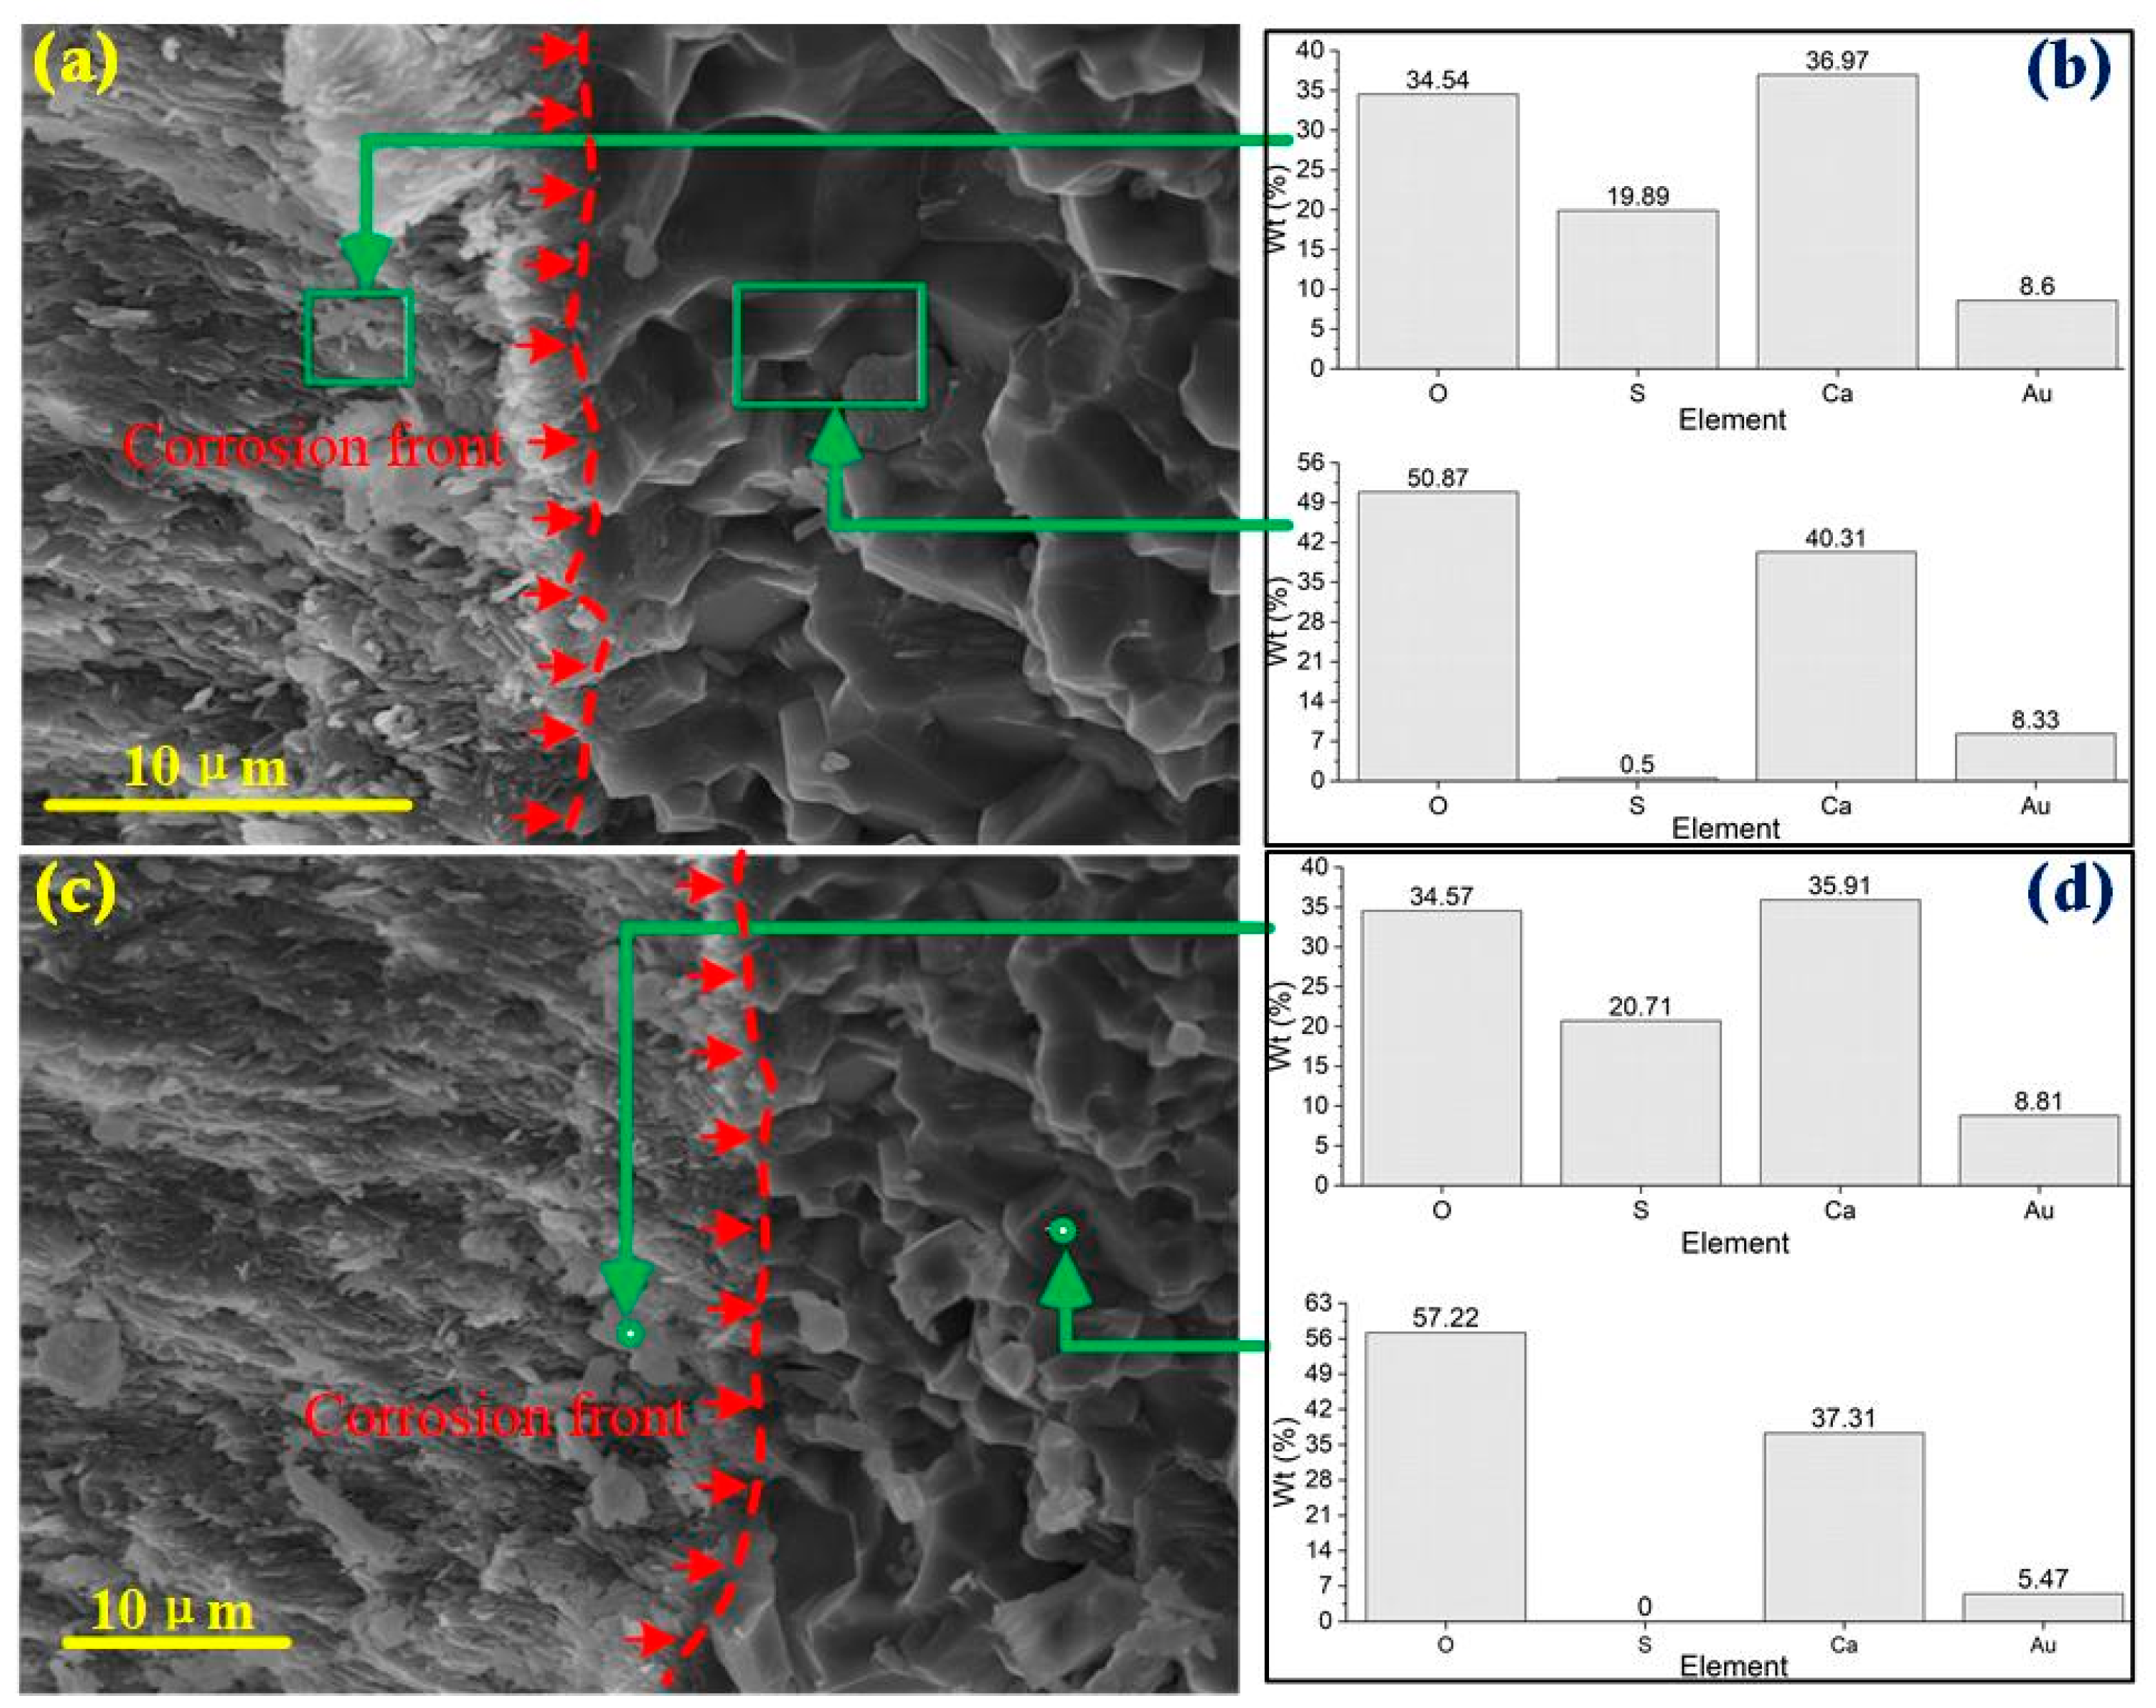
- (1)
- Simulated acid rain corrosion of concrete progresses gradually, creating a corrosion front within the material. As acid permeates deeper, it significantly alters the composition and structure of concrete. This advancing corrosion front deepens over time, driven by dissolution due to H+ ions and expansion due to SO42− ions, contributing to the concrete’s deterioration mechanism.
- (2)
- In the analysis of pore characteristic parameters, the corroded concrete structure exhibits distinct characteristics. The corrosion process generates numerous pores inside the concrete, particularly micro and medium pores smaller than 0.4 μm, which appear as thin strips, needles, and nearly round shapes. This substantially increases the internal porosity and looseness of the concrete structure, leading to a reduction in its strength.
- (3)
- The compressive strength of concrete decreases noticeably due to acid corrosion, with reductions increasing as corrosion time and acid concentration increase. However, as the corrosion front progresses, the penetration of acid into deeper areas becomes limited, resulting in a slowing down of the rate at which compressive strength decreases.
- (4)
- To enhance corrosion resistance, ensuring proper compaction reduces porosity and improves impermeability. Using low-tricalcium aluminate cement minimizes ettringite formation and sulfate expansion. Protective measures against surface corrosion layers are vital for maintaining concrete integrity.
Author Contributions
Funding
Data Availability Statement
Conflicts of Interest
References
- Elsener, B. Macrocell corrosion of steel in concrete—Implications for corrosion monitoring. Cem. Concr. Compos. 2002, 24, 65–72. [Google Scholar] [CrossRef]
- Menz, F.C.; Seip, H.M. Acid rain in Europe and the United States: An update. Environ. Sci. Policy 2004, 7, 253–265. [Google Scholar] [CrossRef]
- Jiang, L.P.; He, C.X.; Fu, J.J.; Xu, D.Z. Enhancement of wear and corrosion resistance of polyvinyl chloride/sorghum straw-based composites in cyclic sea water and acid rain conditions. Constr. Build. Mater. 2019, 223, 133–141. [Google Scholar] [CrossRef]
- Ruiz-López, M.F.; Martins-Costa, M.T.C.; Anglada, J.M.; Francisco, J.S. A new mechanism of acid rain generation from HOSO at the air–water interface. J. Am. Chem. Soc. 2019, 141, 16564–16568. [Google Scholar] [CrossRef]
- Hong, H.; Lu, Z.; Cheng, M.C.; Xu, C.G.; Yang, C. Experimental study of recycled concrete filled circular steel tube column subjected to eccentric compression after acid rain corrosion. J. Exp. Mech. 2018, 33, 290–298. (In Chinese) [Google Scholar]
- Ma, Y.; Che, Y.; Gong, J.X. Behavior of corrosion damaged circular reinforced concrete columns under cyclic loading. Constr. Build. Mater. 2012, 29, 548–556. [Google Scholar] [CrossRef]
- Liu, X.H.; Zheng, S.S.; Wang, W.; Liu, H.; Zheng, Y.; Zheng, H. Experimental study on the seismic behaviour of a corroded T-shaped RC shear wall. J. Build. Eng. 2023, 76, 107071. [Google Scholar] [CrossRef]
- Fan, Y.F.; Hu, Z.Q.; Zhang, Y.Z.; Liu, J.L. Deterioration of compressive property of concrete under simulated acid rain environment. Constr. Build. Mater. 2010, 24, 1975–1983. [Google Scholar] [CrossRef]
- Zhou, C.; Zhu, Z.; Wang, Z.; Qiu, H. Deterioration of concrete fracture toughness and elastic modulus under simulated acid-sulfate environment. Constr. Build. Mater. 2018, 176, 490–499. [Google Scholar] [CrossRef]
- Zhou, C.; Zhu, Z.; Zhu, A.; Zhou, L.; Fan, Y.; Lang, L. Deterioration of mode II fracture toughness, compressive strength and elastic modulus of concrete under the environment of acid rain and cyclic wetting-drying. Constr. Build. Mater. 2019, 228, 116809. [Google Scholar] [CrossRef]
- Xie, S.; Qi, L.; Zhou, D. Investigation of the effects of acid rain on the deterioration of cement concrete using accelerated tests established in laboratory. Atmos. Environ. 2004, 38, 4457–4466. [Google Scholar] [CrossRef]
- Cui, H.; Tang, W.; Liu, W.; Feng, X. Experimental study on effects of CO2 concentrations on concrete carbonation and diffusion mechanisms. Constr. Build. Mater. 2015, 93, 522–527. [Google Scholar] [CrossRef]
- Guo, J.J.; Liu, P.Q.; Wu, C.L.; Wang, K. Effect of Dry–Wet Cycle Periods on Properties of Concrete under Sulfate Attack. Appl. Sci. 2021, 11, 888. [Google Scholar] [CrossRef]
- Gao, L.X.; Lai, Y.; Mohammad, R.I.P.; Zhang, W. Deterioration of port1and cement pervious concrete in sponge cities subjected to acid rain. Materials 2021, 14, 2670. [Google Scholar] [CrossRef]
- Guo, J.J.; Li, X.M.; Xu, Y.Q.; Zhang, P.; Wang, K. Neutralization evolution of concrete under acid rain and carbonation corrosion: A review. J. Mater. Res. Technol. 2023, 25, 1376–1405. [Google Scholar] [CrossRef]
- Wang, X.L.; Guo, M.Z.; Ling, T.C. Review on CO2 curing of nonhydraulic calcium silicates cements: Mechanism, carbonation and performance. Cem. Cem. Compos. 2022, 133, 18. [Google Scholar]
- Yu, S.Y.; Zhang, J.; Zhang, G.H. Experimental study on reinforced concrete small-eccentricity compressive column after acid rain corrosion. Constr. Build. Mater. 2023, 364, 130002. [Google Scholar]
- Xu, K.; Huang, L.; Zhang, L.; Xu, H.; Zhu, D.; Li, P. Experimental study on the seismic performance of prestressed concrete beams under low-cycle reciprocating load and simulated acid rain corrosion environment. Constr. Build. Mater. 2023, 408, 133629. [Google Scholar] [CrossRef]
- Hua, Y.X.; Han, L.H.; Wang, Q.L.; Hou, C. Behaviour of square CFST beam-columns under combined sustained load and corrosion: Experiments. Thin-Walled Struct. 2019, 136, 353–366. [Google Scholar] [CrossRef]
- Zhang, T.; Lyu, X.; Liu, H.; Zhang, L.; Wang, J.; Gao, S. Axial performance degradation of squared CFST stubs in severe cold and acid rain area. Constr. Build. Mater. 2020, 262, 120262. [Google Scholar] [CrossRef]
- Mahdikhani, M.; Bamshad, O.; Shirvani, M.F. Mechanical properties and durability of concrete specimens containing nano silica in sulfuric acid rain condition. Constr. Build. Mater. 2018, 167, 929–935. [Google Scholar] [CrossRef]
- Liu, G.; Zhang, Y.; Ni, Z.; Huang, R. Corrosion behavior of steel submitted to chloride and sulphate ions in simulated concrete pore solution. Constr. Build. Mater. 2016, 115, 1–5. [Google Scholar] [CrossRef]
- Kanazu, T.; Matsumura, T.; Nishiuchi, T.; Yamamoto, T. Effect of Simulated Acid Rain on Deterioration of Concrete. Water Air Soil Pollut. 2001, 130, 1481–1486. [Google Scholar] [CrossRef]
- Zheng, S.S.; Zuo, H.S.; Liu, W.; Huang, Y.G.; Zhou, J.L.; Zheng, J. Experimental research on aseismic behaviors of RC frame beams of low shear span ration in general atmospheric environment. Eng. Mech. 2017, 34, 186–194. [Google Scholar]
- Lu, C.; Zhou, Q.; Wang, W.; Wei, S.; Wang, C. Freeze-thaw resistance of recycled aggregate concrete damaged by simulated acid rain. J. Clean. Prod. 2020, 280, 124396. [Google Scholar] [CrossRef]
- Gu, L.; Visintin, P.; Bennett, T. Evaluation of accelerated degradation test methods for cementitious composites subject to sulfuric acid attack; application to conventional and alkali-activated concretes. Cem. Concr. Compos. 2017, 87, 187–204. [Google Scholar] [CrossRef]
- Chen, J.J.; Ng, P.L.; Zhu, Y.; Wang, C.F.; Chu, S.H. Rheological design of fiber-reinforced calcium sulfoaluminate cementitious composite: A new approach. Constr. Build. Mater. 2024, 457, 139423. [Google Scholar] [CrossRef]
- Wang, Z.; Zhu, Z.; Sun, X.; Wang, X. Deterioration of fracture toughness of concrete under acid rain environment. Eng. Fail. Anal. 2017, 77, 76–84. [Google Scholar] [CrossRef]
- Zhou, J.K.; Chen, X.; Chen, S. Durability and service life prediction of GFRP bars embedded in concrete under acid environment. Nucl. Eng. Des. 2011, 241, 4095–4102. [Google Scholar] [CrossRef]
- Guan, Y.Y.; Zheng, S. Seismic Behaviors of RC Frame Beam-Column Joints under Acid Rain Circle: A Pilot Experimental Study. J. Earthq. Eng. 2017, 22, 1008–1026. [Google Scholar] [CrossRef]
- Li, H.F.; Yun, Y.W.; Jang, I.Y.; Kim, S.K. Property Research of Carbon Fiber Reinforced High Performance Concrete Containing Limestone Powder. Adv. Mater. Res. 2011, 163–167, 869–873. [Google Scholar] [CrossRef]
- Luan, H.Y.; Fan, Y.F.; Chen, A.; Zhang, S.Y. Exploratory experimental study on flexural behavior of CFRP-reinforced concrete beams subjected to acidic loading effect. Adv. Struct. Eng. 2018, 21, 2184–2197. [Google Scholar] [CrossRef]
- Zhou, Y.; Zheng, S.; Chen, L.; Long, L.; Wang, B. Experimental investigation into the seismic behavior of squat reinforced concrete walls subjected to acid rain corrosion. J. Build. Eng. 2021, 44, 102899. [Google Scholar] [CrossRef]
- Zhang, Y.Z.; Fan, Y.F.; Li, H.N. Influence of Simulated Acid Rain Corrosion on the Uniaxial Tensile Mechanical Properties of Concrete. Int. J. Corros. 2012, 2012, 1687–9325. [Google Scholar] [CrossRef]
- Xie, S.; Zhou, D.; Yue, Q. Exploration of the Corrosion Mechanism of Non-metallic Building Materials by Acid Deposition. Environ. Sci. Res. 1998, 11, 15–17. [Google Scholar]
- Niu, L.C. Numerical Simulation of the Diffusion Reaction of Sulfate Ions in Concrete Under the Coupling Action of Load and Sulfate Attack; Nanjing University of Science and Technology: Nanjing, China, 2012. (In Chinese) [Google Scholar]
- Jin, H.H.; Ren, Q.Y.; Xiao, S.Q.; Wang, F.F.; Chen, B. Research progress on corrosion mechanism and aging performance of ordinary concrete under simulated acid rain erosion. J. Nat. Disasters 2022, 31, 1–14. (In Chinese) [Google Scholar]
- Zhang, Y.Z.; Zhao, Y.H.; Fan, Y.F. A theoretical for assessing elastic modulus of concrete corroded by acid rain. Eng. Mech. 2011, 28, 175–180. (In Chinese) [Google Scholar]
- Luan, H.Y. Multi-Scale Study on Mechanical Properties of Concrete Exposed to Acidic Solution; Dalian Maritime University: Dalian, China, 2012. (In Chinese) [Google Scholar]
- Wang, H.N.; Xu, W.; Zhang, Y.Z.; Xu, J.X. Test on compressive properties of concrete corroded by acid rain under different strain rates. J. Shenyang Univ. Nat. Sci. Ed. 2023, 35, 348–355. (In Chinese) [Google Scholar]
- Huang, C.P. Stress Analysis of Outer Joints of Reinforced Concrete Frame; Huazhong University of Science and Technology: Wuhan, China, 2006. (In Chinese) [Google Scholar]
- Liu, J.; Yuan, W.; Zhi, H.E.; Ba, M.; Chen, J.B. Microstructural evolution of cement paste under combined effect of carbonation and chloride salt. Acta Mater. Compos. Sin. 2015, 32, 1536–1546. (In Chinese) [Google Scholar]
- Xie, L.; Meng, C.C.; Wei, S.; Yuan, F.; Huang, H. Behaviour of concrete-filled steel tubular members under pure bending and acid rain attack: Test simulation. Adv. Struct. Eng. 2019, 22, 240–253. [Google Scholar] [CrossRef]
- Feng, J.; Hao, Z. CT Scanning Determines the Distribution of Large Pores in Soil. Adv. Water Sci. 2002, 5, 611–617. [Google Scholar]
- Tao, G.L. Fractal Study on Pore Structure of Rock-Soil Porous Media and Its Application; Wuhan University of Technology: Wuhan, China, 2010. (In Chinese) [Google Scholar]
- Zhu, H.; Ji, C.C. Fractal Theory and Its Application; Beijing Science Press: Beijing, China, 2011. (In Chinese) [Google Scholar]
- Kabir, H.; Garg, N. Rapid prediction of cementitious initial sorptivity via surface wettability. NPJ Mater. Degrad. 2023, 7, 52. [Google Scholar] [CrossRef]


| Chemical Composition | Cao | SiO2 | Al2O3 | Fe2O3 | MgO | SO3 | Others |
|---|---|---|---|---|---|---|---|
| Percentage | 60.3 | 20.68 | 6.06 | 5.46 | 1.32 | 2.01 | 4.17 |
| Specimen ID | D × L × H (mm × mm × mm) | Corrosion Time (d) | pH Value | Count of Specimens |
|---|---|---|---|---|
| cs | 100 × 100 × 100 | 28 | Only pure water | 3 |
| pH07d | 100 × 100 × 100 | 7 | 0 | 3 |
| pH014d | 100 × 100 × 100 | 14 | 0 | 3 |
| pH021d | 100 × 100 × 100 | 21 | 0 | 3 |
| pH028d | 100 × 100 × 100 | 28 | 0 | 3 |
| pH17d | 100 × 100 × 100 | 7 | 1 | 3 |
| pH114d | 100 × 100 × 100 | 14 | 1 | 3 |
| pH121d | 100 × 100 × 100 | 21 | 1 | 3 |
| pH128d | 100 × 100 × 100 | 28 | 1 | 3 |
| pH27d | 100 × 100 × 100 | 7 | 2 | 3 |
| pH214d | 100 × 100 × 100 | 14 | 2 | 3 |
| pH221d | 100 × 100 × 100 | 21 | 2 | 3 |
| pH228d | 100 × 100 × 100 | 28 | 2 | 3 |
| Sequence | Study Objects | pH Value(s) | Author(s) of the Literature |
|---|---|---|---|
| 1 | 100 × 100 × 400 mm concrete beams | 1.5, 2.5, 3.5 | Wang et al. [28] |
| 2 | Three-point bending (TPB) concrete specimens | 1.5, 2.5, 3.5 | Zhou et al. [9] |
| 3 | Mode II fracture toughness, compressive strength, and elastic modulus of concrete | 1, 2, 3, 7 | Zhou et al. [10] |
| 4 | Glass fiber-reinforced polymer (GFRP) concrete | 2, 3, 4 | Zhou et al. [29] |
| 5 | Seismic behaviors of RC frame beam–column joints | 3 | Guan et al. [30] |
| 6 | Carbon fiber-reinforced high performance Concrete containing limestone powder | 0.5 | Li et al. [31] |
| 7 | Deterioration of cement concrete | 1, 3.5, 5.6 | Xie et al. [11] |
| 8 | CFRP-reinforced concrete beams | 1.5 | Luan et al. [32] |
| 9 | 700 × 100 × 700 mm squat reinforced concrete walls | 2, 3, 4 | Zhou et al. [33] |
| Analysis Area | Pore Count | Total Area (μm2) | Average Pore Size (μm) | Area Ratio (%) | Average Roundness |
|---|---|---|---|---|---|
| Corroded area | 3430 | 193.758 | 0.056 | 17.281 | 0.609 |
| Uncorroded area | 469 | 135.782 | 0.29 | 12.642 | 0.537 |
Disclaimer/Publisher’s Note: The statements, opinions and data contained in all publications are solely those of the individual author(s) and contributor(s) and not of MDPI and/or the editor(s). MDPI and/or the editor(s) disclaim responsibility for any injury to people or property resulting from any ideas, methods, instructions or products referred to in the content. |
© 2025 by the authors. Licensee MDPI, Basel, Switzerland. This article is an open access article distributed under the terms and conditions of the Creative Commons Attribution (CC BY) license (https://creativecommons.org/licenses/by/4.0/).
Share and Cite
Li, L.; Muhamad Bunnori, N.; Tan, C.G. Deterioration of Concrete Under Simulated Acid Rain Conditions: Microstructure, Appearance, and Compressive Properties. Buildings 2025, 15, 120. https://doi.org/10.3390/buildings15010120
Li L, Muhamad Bunnori N, Tan CG. Deterioration of Concrete Under Simulated Acid Rain Conditions: Microstructure, Appearance, and Compressive Properties. Buildings. 2025; 15(1):120. https://doi.org/10.3390/buildings15010120
Chicago/Turabian StyleLi, Lingxu, Norazura Muhamad Bunnori, and Chee Ghuan Tan. 2025. "Deterioration of Concrete Under Simulated Acid Rain Conditions: Microstructure, Appearance, and Compressive Properties" Buildings 15, no. 1: 120. https://doi.org/10.3390/buildings15010120
APA StyleLi, L., Muhamad Bunnori, N., & Tan, C. G. (2025). Deterioration of Concrete Under Simulated Acid Rain Conditions: Microstructure, Appearance, and Compressive Properties. Buildings, 15(1), 120. https://doi.org/10.3390/buildings15010120