Article

Fire Resistance Performance of Constrained H-Shaped Steel Columns with Uneven Vertical Temperature Distributions

1
School of Civil Engineering and Architecture, University of Jinan, Jinan 250024, China
2
School of Civil Engineering, Shandong Jianzhu University, Jinan 250101, China
*
Author to whom correspondence should be addressed.
Buildings 2024, 14(9), 2826; https://doi.org/10.3390/buildings14092826
Submission received: 31 July 2024 / Revised: 31 August 2024 / Accepted: 6 September 2024 / Published: 8 September 2024
(This article belongs to the Section Building Structures)

Abstract

Steel columns, which are widely used in building frameworks and spatial structures, are susceptible to capacity degradation during fires, potentially leading to the overall collapse of buildings. Existing research on the fire resistance of steel columns assumes that the temperature loads encountered by steel columns are evenly distributed vertically. However, real-world fire scenarios often feature significant vertical temperature differences. Therefore, this study comprehensively investigated these variations to derive a temperature curve that accurately represents real fire conditions. Subsequently, the fire resistance limits of steel columns were studied using this temperature curve, leading to a revised calculation formula for the critical fire resistance temperatures of steel columns. The following conclusions were drawn: (1) Nonuniform longitudinal temperature distributions are influenced by parameters such as the fire source distance, the heights of ventilation openings, and the distance between a vent and the temperature measurement point. Among them, the fire source distance has the greatest impact, with the maximum longitudinal temperature difference reaching over 500 °C. (2) Variations in the load ratio and longitudinal temperature differences alter the failure positions of steel columns, reducing their critical temperatures by up to 200 °C. (3) The revised critical fire resistance temperature formula is more accurate and safer compared with that outlined in the “Technical Code for Fire Protection of Steel Structures” (GB51249-2017). These findings offer valuable insights for the fire designs of steel columns.

1. Introduction

Steel is widely used in building frameworks and spatial structures owing to its low weight and high strength. When the temperature exceeds 200 °C, the yield strength and elastic modulus of steel begin to decline, and when the temperature exceeds 600 °C, steel loses most of its strength and stiffness. High-strength steel also exhibits similar behavior, with its mechanical properties, such as its yield strength and elastic modulus, rapidly decreasing after the temperature exceeds 400 °C [1]. Given the rapid deterioration of the mechanical properties of steel at high temperatures, steel columns, which are often used as primary load-bearing components, are prone to capacity degradation during fires, which can lead to the overall collapse of buildings [2]. Therefore, accurately predicting the performance of steel columns during actual fires and enhancing their fire resistance are crucial for designing structural fire protection.
Studies on the fire resistance of metal columns began in 1885 with Bauschinger’s [3] tests on horizontal columns. Significant progress has been made in research on the fire resistance performance of steel structures over the past few decades. Aasen [3] designed experiments on 20 I-shaped steel columns to study the displacement–temperature variation curves of steel columns under the effects of different parameters. Ali et al. [4] systematically investigated the effects of axial restraints on the fire resistance of steel columns. Labein [3] conducted fire resistance tests on 21 articulated steel columns with varying slenderness and load ratios, obtaining displacement curves for each condition. Through experiments and numerical analyses, Wang et al. [5] studied the effect of axial restraint on the fire resistance of steel columns and found that higher axial constraint stiffness leads to a lower yield temperature. In subsequent studies, the effects of the load and slenderness ratios on the critical temperature of steel columns were examined [5]. Jiang et al. [2] reported that previous studies on the effects of axial constraints on the fire resistance of steel columns were based on the results of quasi-static experiments or static analyses and did not consider the dynamic effects of steel columns in fires. Through theoretical research and Abaqus numerical simulations, the researchers found that increasing the rotational constraint stiffness ratio from 0.0001 to 10.0 led to three types of failure in steel columns: dynamic failure, a transition from dynamic failure to quasi-static failure, and static failure. Yang [6,7] and others systematically investigated the effects of the width-to-thickness ratio, the slenderness ratio, residual stress, and the effective column length on the fire performance of steel columns; they suggested that significant residual stress is released during a fire event, rendering its effect on the strength of a column negligible. These findings have also been widely validated by experiments [8]. Based on fire tests and numerical simulations of Q690 high-strength steel, Wang [5] proposed a fire-resistant design method that considers residual stress effects.
All the aforementioned studies assumed that the temperature distributions of steel column sections were uniform, but in a real-life fire situation, the temperature distributions of steel column sections are uneven. Therefore, Wang et al. [9] used finite element simulations to analyze nonuniform temperature distributions within material cross-sections and structural responses at high temperatures; they suggested that assuming a uniform cross-sectional temperature leads to overestimation of fire resistance performance. Cai et al. [10] studied the impacts of cross-sectional temperature gradients on the buckling loads of steel columns and found significant underestimations of buckling loads under nonuniform temperature distributions compared with uniform distributions. The increase in hot smoke during a fire causes a temperature difference between the top and bottom of the building, resulting in uneven vertical temperature distributions along steel columns.
Previous studies on the fire resistance performance of steel columns have not considered this longitudinal nonuniform temperature distribution [11,12,13,14]. However, in actual fires, the temperature difference between the bottom and top of a steel column can reach hundreds of degrees Celsius [15,16]. Therefore, simplifying the longitudinal temperature distributions of steel columns to uniform distributions does not align with engineering practice, potentially leading to conservative estimations of their fire resistance limits. Compared to the study of uneven temperature distributions in cross-sections, research on longitudinal temperature distributions in steel columns is lacking. This is because the uneven spatial temperature distribution during a fire is affected by numerous factors, such as the building size, fire location, vent size, and ventilation conditions, which are difficult to comprehensively consider and cannot be accurately replicated in furnace tests. With advancements in fire science and computer technology, theoretical models that describe how fire fields develop and change, such as two-zone and field models, can be realized through efficient calculation tools, such as the Fire Dynamics Simulator (FDS) [17,18,19] developed by the National Institute of Standards and Technology (NIST), to study real fire temperature fields. Simultaneously, such methods provide more accurate temperature field data for predicting the fire resistance values of components.
Hence, this study investigated the fire resistance performances of steel columns in real fire temperature fields by considering nonuniform longitudinal and cross-sectional temperature distributions. First, based on changes in the space temperature field of a real fire, the FDS was used to calculate the space temperature field of the fire. A temperature parameter was introduced into Abaqus to study the fire resistance of a steel column. Comparison and verification tasks were performed using test data. Simultaneously, the influences of the load ratio, slenderness ratio, and other parameters on the fire resistances of steel columns were studied while considering uneven vertical temperature distributions in the steel columns. The experimental data were compared with data that did not consider the uneven vertical temperature distributions. Finally, a revised calculation formula for the fire resistance limits of steel columns that considers a nonuniform vertical temperature distribution was proposed. Based on existing calculation tools, this study innovatively introduced a nonuniform distribution to the space temperature field of a fire, which rendered the proposed calculation formula more consistent with actual fire conditions. This formula has considerable referential value when designing fire-resistant steel columns.

2. Development Law of Temperature Fields under Different Fire Conditions

2.1. Uniform Fire Conditions

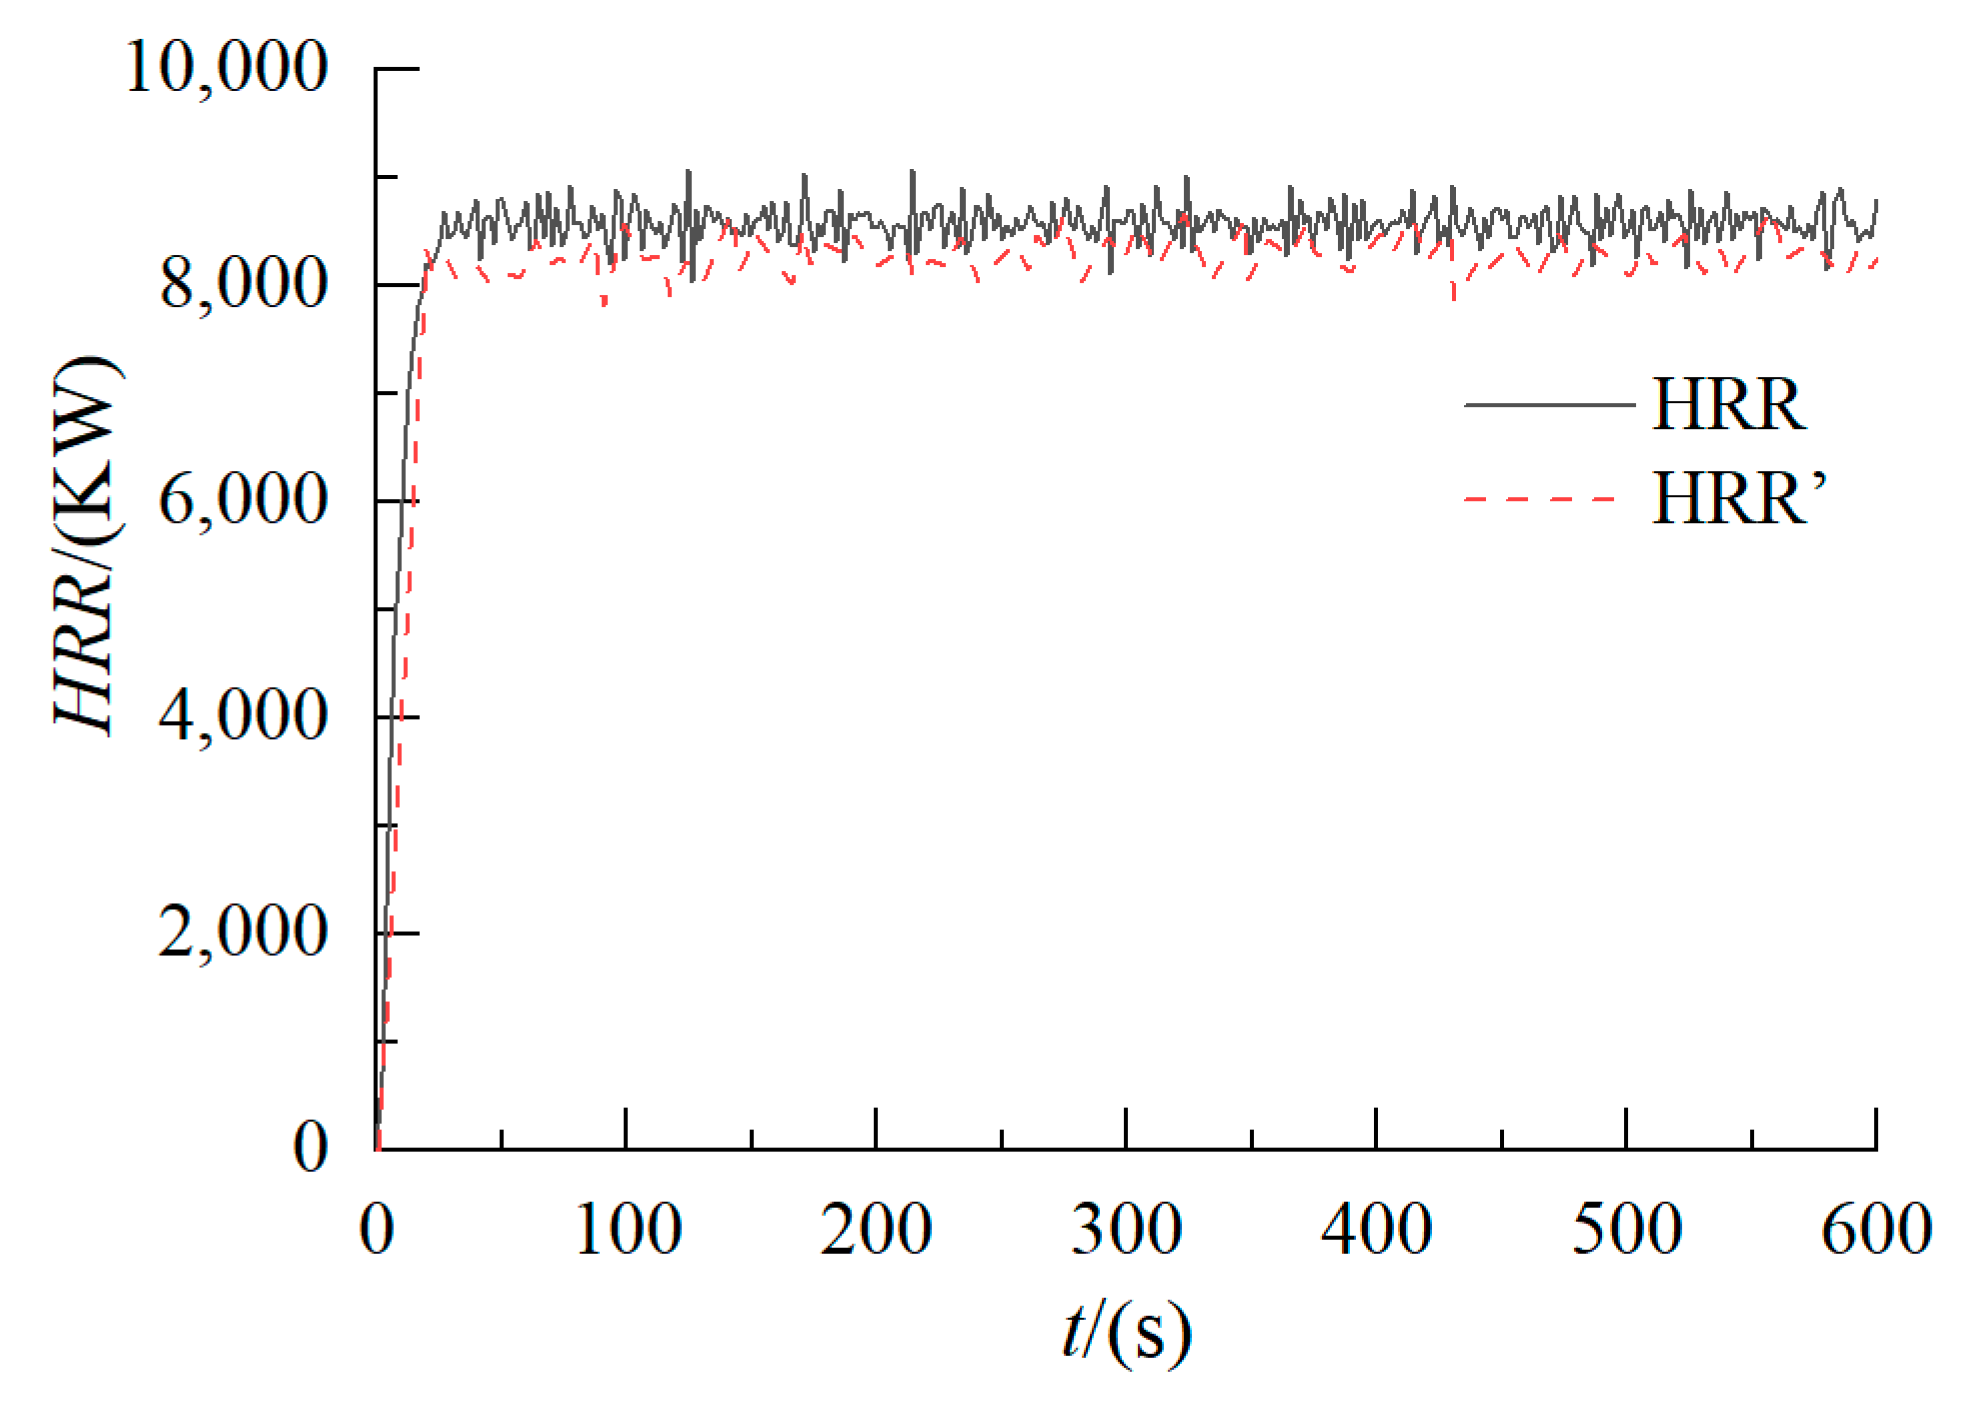
2.1.1. Uniform Fire Model Parameters

The temperature field changes in a confined space were studied in a scenario with a uniform fire. A closed room model measuring 5.84 × 6 × 2.55 m was established in the FDS according to the settings in the literature [20]. The grid comprised 189,000 hexahedral units (8 × 8 × 7.5 cm). The fire scenario was designed with open doors and windows to ensure complete combustion. The heat release rate per unit area (HRRPUA) was set to increase linearly from 0 kW/m2 to a certain value within 10 s and then remain constant, following European standards [21]. The floor and walls were modeled using obstruction (OBST) instructions. A steel beam was set as a thermally conductive obstacle with a specific heat capacity of 0.46 kJ/(kg·K), a density of 7850 kg/m³, and a thermal emissivity of 0.7 (Figure 1).
An HRRPUA of 250 kW/m2 was applied to an area of 34.4 m2 on the floor, resulting in a total heat release rate (HRR) of 8.6 MW for the room. The HRR of the model in this study was compared with that of a model used in a previous study [20] (Figure 2), where HRR’ represents the change curve of the model in the literature [20]. Throughout the fire development process, the HRR trend changed consistently, indicating that the model parameters were set reasonably and accurately.
To consider the influences of the heat release rate and ventilation opening height, various parameters were set (Table 1). This enabled the differentiation of the effects of fire size and ventilation openings. Simulations under uniformly distributed fire conditions with these parameters yielded different temperature field distributions.
The steel column was made of H-type Q690 steel with a cross-sectional area of 200 × 150 × 14 × 14. The length (L) was 2700 mm, and the slenderness ratio (λ) and dimensionless slenderness ratio ( λ ̅ ) were determined to be 96 and 1.89, respectively, via size calculations.

2.1.2. Early Temperature Rise Pattern under Uniform Fire Conditions

The distance from the vent affected the longitudinal temperature distribution in the fire scenario. The temperature measurement points in the model were arranged as shown in Figure 3, with T1–T8 near the vent wall column (500 mm from the vent) and T1’–T8’ further from the vent wall column (3000 mm from the vent).
Based on the temperature curves of two different measurement points at different positions under the same fire conditions (Figure 4), the following conclusions were drawn:
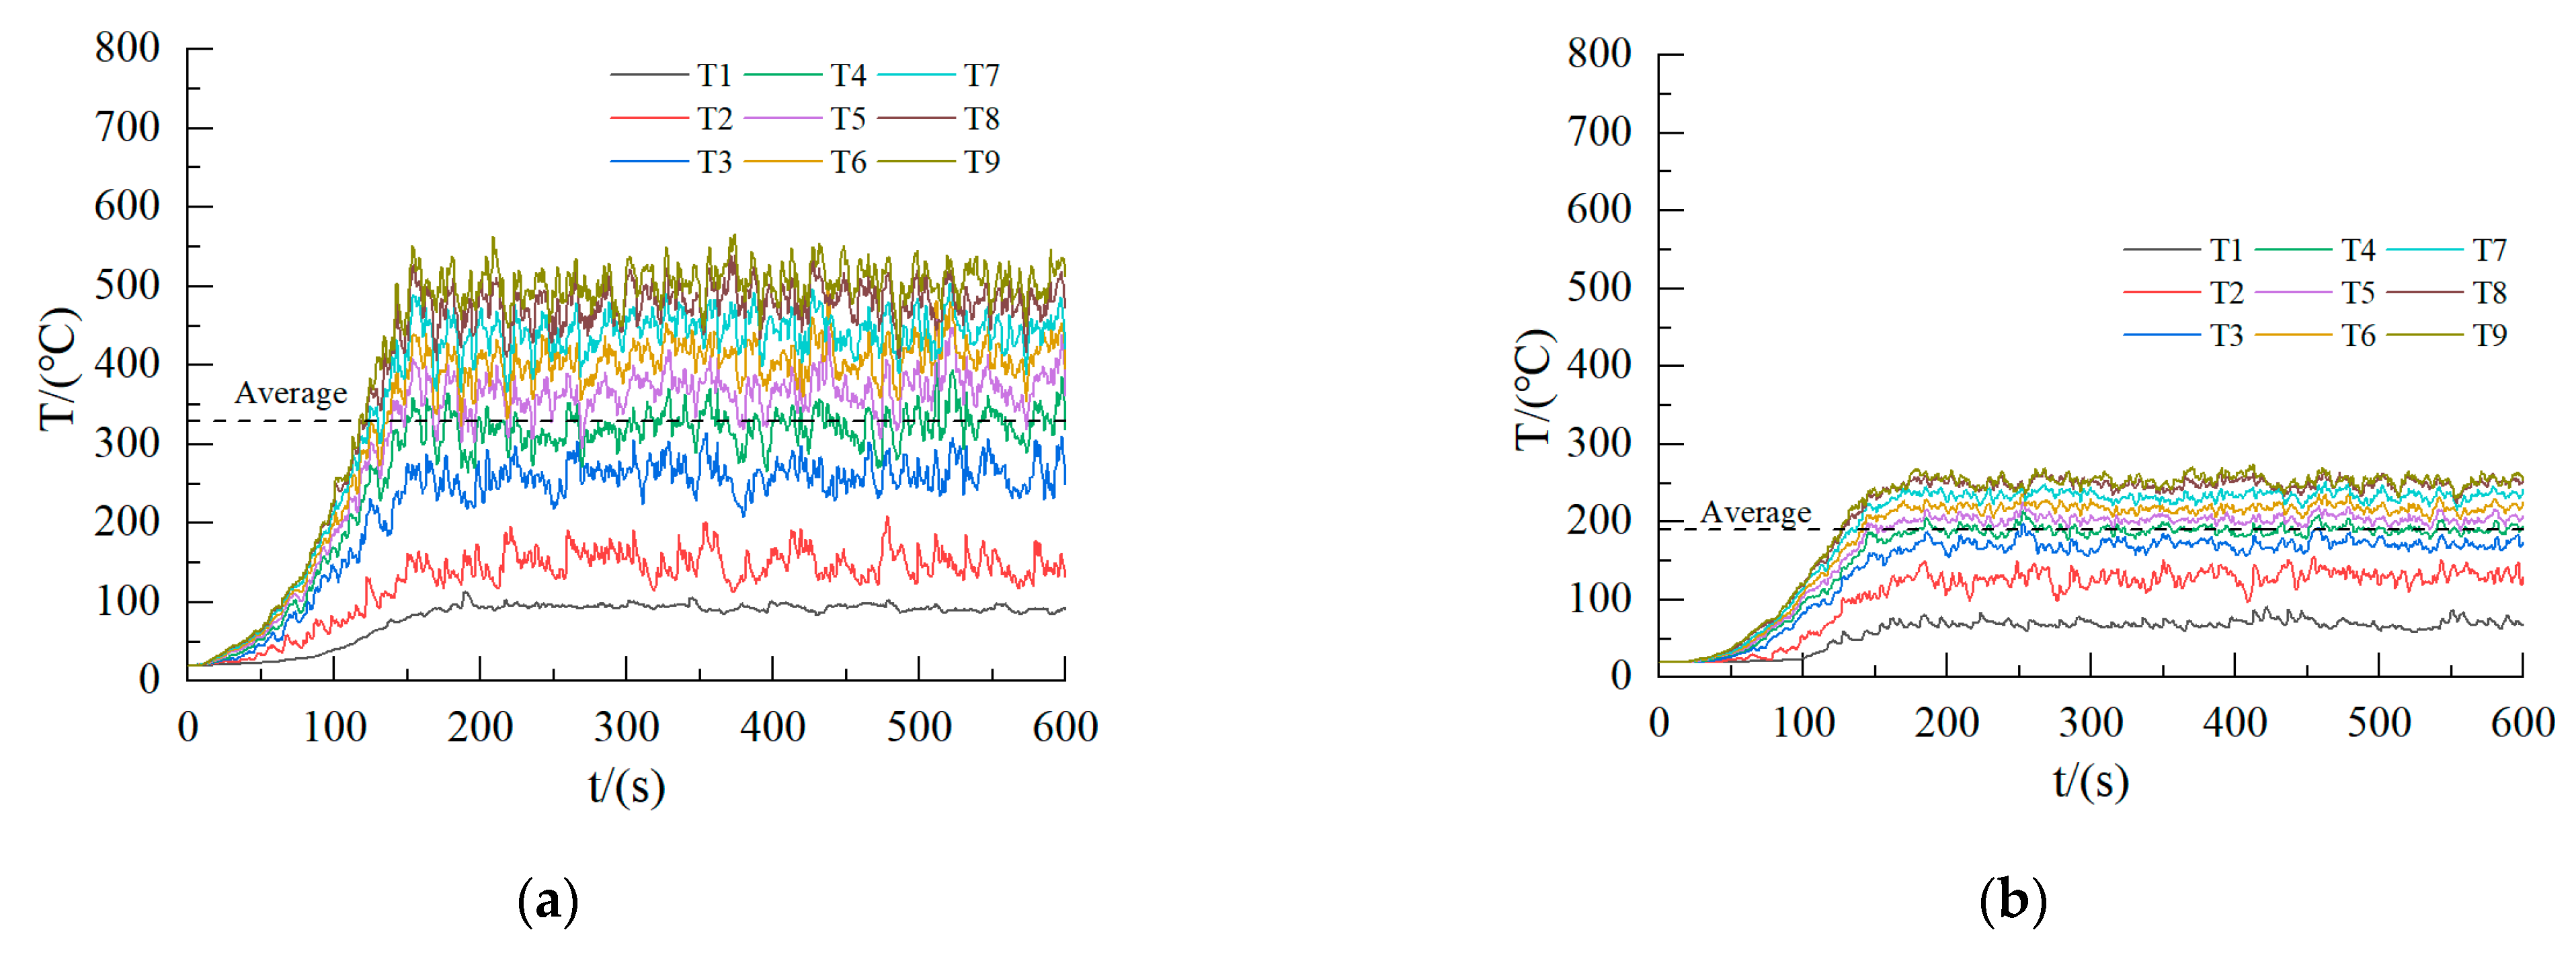
  • Changes in the ventilation conditions significantly affected the temperatures at the measuring points. The temperatures at the measuring points rapidly peaked in the early stages of combustion, sharply decreased, and eventually stabilized (Figure 4b). This was because the oxygen near the fire source was rapidly consumed and was not replenished, leading to incomplete combustion. The average temperature at the measuring points after stabilization was 250–300 °C lower compared with the temperatures at points closer to the ventilation opening (Figure 4a).
  • During the fire, the upward movement of hot smoke gases resulted in an uneven vertical temperature distribution, with the temperature increasing as the heights of the measuring points increased. Simultaneously, the uneven longitudinal temperature distribution was more pronounced at the measuring points far from the ventilation opening, where poor ventilation conditions led to incomplete combustion. Hence, the measuring points were less influenced by heat radiation from the fire source and more influenced by hot smoke gases.
The longitudinal temperature field distributions of each working condition of the uniformly distributed fire are shown in Figure 5. By analyzing the temperature–time curve, the following conclusions were drawn:
3.
Regardless of the magnitude of the fire’s HRR, the height of the ventilation opening, and the degree of combustion, an uneven vertical temperature field was consistently present along the steel column’s surface. This was because of the uneven vertical temperature distribution caused by the upward movement of hot smoke during the fire process. The steel column closer to the vent had a more obvious vertical temperature gradient, as part of the hot flue gas closer to the vent was discharged by the vent over time to prevent excessive hot flue gas accumulation. Hence, the vertical temperature stratification was more obvious.
4.
Different ventilation conditions significantly affected the temperatures at the measuring points. The temperature curves of the steel column far from the vent (Figure 5b,d,f) show that the temperatures of the measuring points rapidly reached their highest values in the early stage of combustion, then rapidly decreased and eventually became stable. This was because the rapid consumption of oxygen near the fire source could not be supplemented, which resulted in decreases in the temperatures at the measuring points with inadequate combustion.
The temperature rise curves under various working conditions indicate that in the early stage of a uniform fire, there are uneven vertical temperature distributions on the surfaces of steel columns, with vertical temperature differences of up to hundreds of degrees Celsius. Therefore, nonuniform vertical temperature fields have to be considered when analyzing the fire resistance of steel columns in uniformly distributed fires.

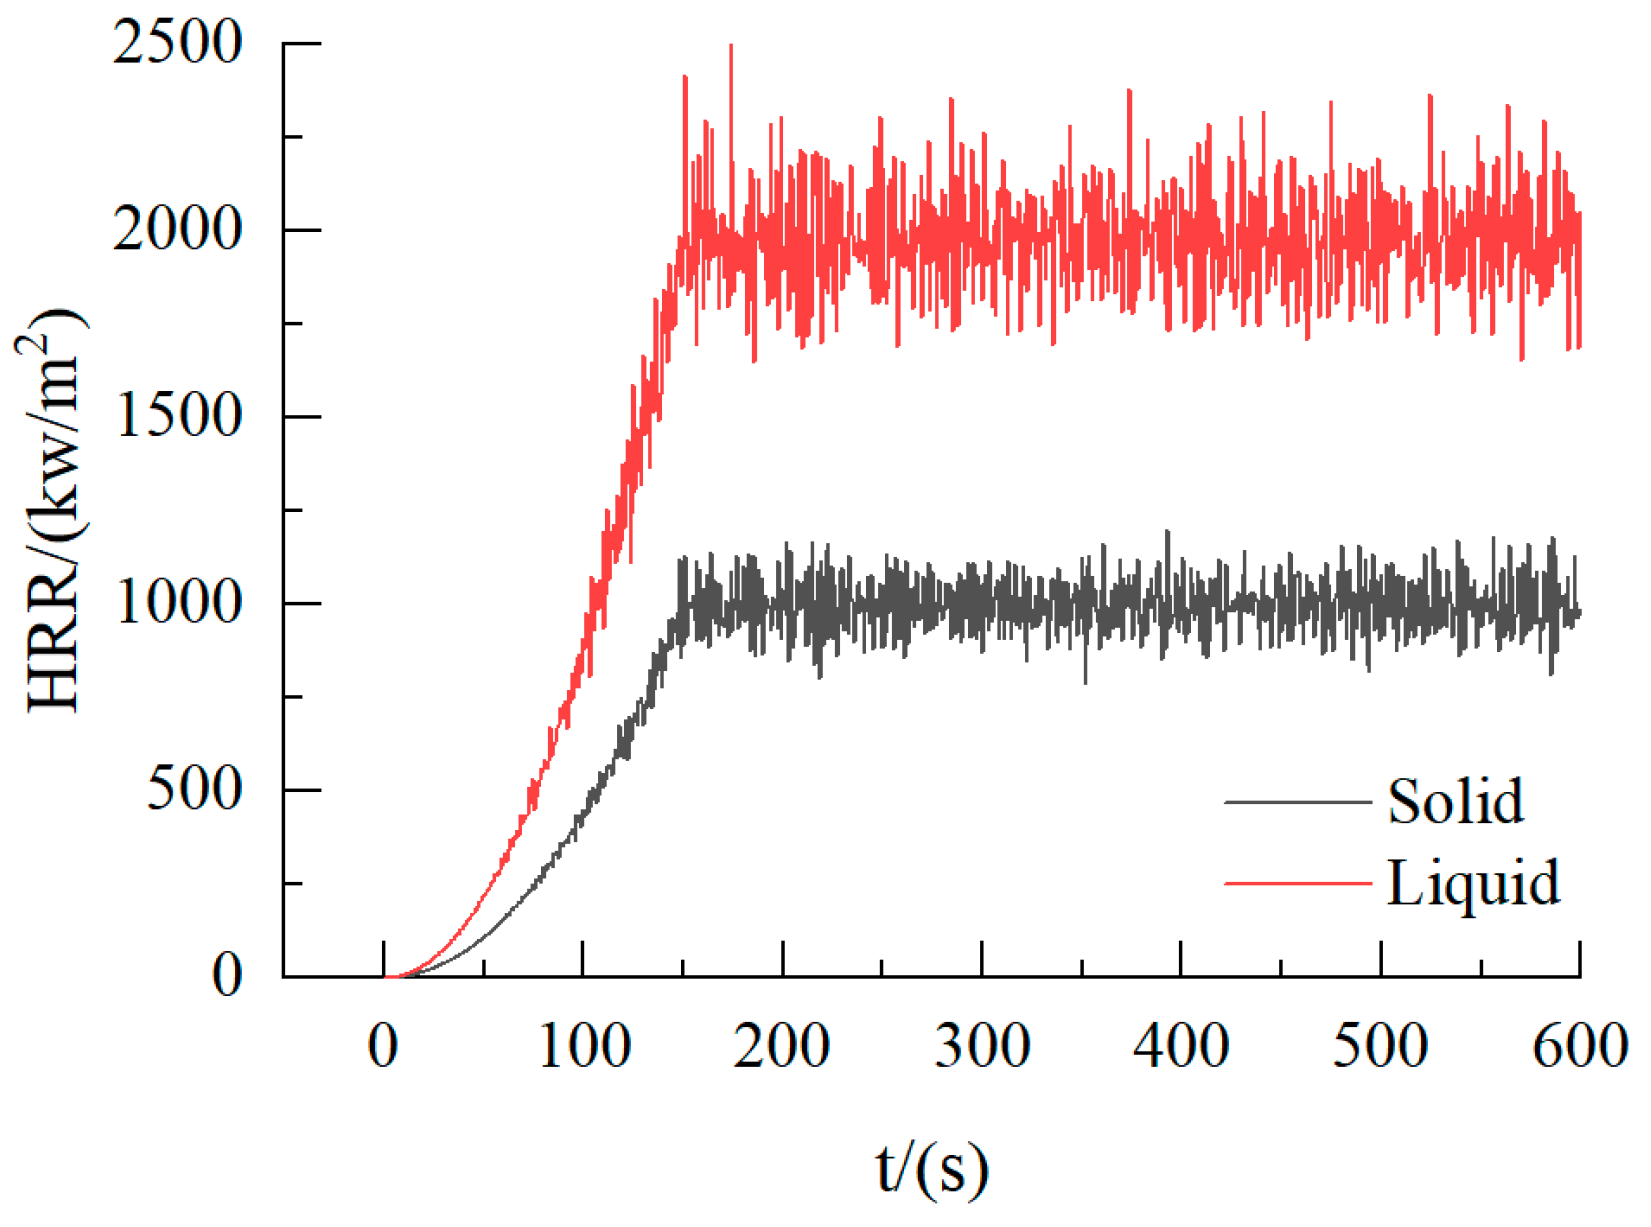
2.2. Local Fire Conditions

2.2.1. Model Parameters

The dimensions of the model room were 6 × 4 × 3 m, and the grid used a total of 187,500 hexahedral cells measuring 8 × 8 × 6 cm. A window was set as a vent, and a 1 × 1 m fire source with a peak HRRPUA of 1 MW/m2 was used to simulate a sofa fire in the room (Figure 6). A 1 × 1 m fire source with a peak HRRPUA of 2 MW/m2 was used to simulate ignition of a liquid fire source in the room. Figure 7 shows a comparison of the HRR changes with the two ignition sources.
Based on the local fire scenario, eight groups of simulated fire conditions were set up (Table 2) considering the influences of parameters such as the vent height and fire source heat release rate.
In order to investigate the mechanical properties of Q690 high-strength steel under fire conditions, an H-shaped steel column made of Q690 steel with a cross-sectional area of 200 × 150 × 14 × 14 mm was utilized. The length (L) was 2700 mm, and the slenderness ratio (λ) and dimensionless slenderness ratio ( λ ¯ ) were determined to be 96 and 1.89, respectively, via size calculations.

2.2.2. Early Temperature Rise Pattern under Local Fire Conditions

The calculated temperature rise curves for all working conditions are shown in Figure 8. Comparing Figure 8a,b,e,f, the overall temperature of the steel column near the fire source was higher, and the maximum temperature difference between the conditions shown in Figure 8a,b reached 270 °C. The maximum temperature difference between the conditions shown in Figure 8e,f reached 330 °C. This was because the temperatures at the measuring points were affected by the thermal radiation of the fire source. The closer a point was to the fire source, the more it was affected by the thermal radiation and the higher the temperature. Moreover, the temperatures at the measuring points were simultaneously affected by the hot flue gas. The measurement point near the ignition point was more affected by the hot flue gas. That is, when the heat loss of the flue gas was lower, the temperature at the measurement point was higher.
By comparing Figure 4a and Figure 8a, we observed that the vertical temperature gradient was more obvious under local fire conditions than under spread fire conditions; the maximum vertical temperature difference could reach more than 400 °C. This was sufficient to show that in the early stage of a local fire, there is a large temperature gradient along the height of the surface of a steel column and that an uneven vertical temperature distribution must be considered when analyzing the fire resistance of a steel column.

2.3. Quasi-Realistic Fire Heating Curves

The fire development process can be roughly divided into three phases: the fire growth phase, flashover and the fully developed phase, and the decay phase [22]. Most prior research has focused on the fully developed phase, which has a high temperature and high heat flux. Moreover, this is the phase in which a load-bearing structure is most prone to damage. For example, the study of structural fire resistance, including furnace tests and numerical calculations, adopts the ISO834 curve as the temperature curve. A standardized temperature curve, such as the ISO834 curve, is a summary of the space temperature changes after a fire flashover enters the fully developed phase. In this case, the overall temperature inside a room tends to be uniform; the standard curve does not consider a vertical temperature gradient.
The influence of the fire growth stage on structural performance has rarely been mentioned in existing fire resistance research. However, according to the above simulation results, the upper ends of some support columns were affected by the upward movement of hot smoke in the early stages of fires, and the high temperatures at the upper ends of some support columns were sufficient to cause the destruction of steel columns. Therefore, in this study, the flaring time of the compartment flashover was taken as the connecting point, and the L-1 MWE-1 fire condition was taken as an example. The pre-fire temperature rise curve simulated in the FDS was connected to the standard temperature rise curve of the fire, and the real temperature rise curve of the fire, considering the entire process of fire development and the vertical temperature gradient, was obtained (Figure 9). This was used for subsequent research on the fire resistance of the steel column.

3. Analysis of the Fire Resistance of Steel Columns Based on Quasi-Realistic Fire Heating Curves

The commercial software Abaqus2022 was used to simulate the fire resistance of constrained Q690 steel columns [23]. Real fire temperatures with an uneven vertical distribution were introduced into the finite element model for heat transfer analysis. The temperature change curve of the steel column cross-section was generated according to the vertical temperature field (T1–T9) in the fire scene, which was introduced into the structural analysis.

3.1. Heat Transfer Analysis

The model grid adopted the DS4 element type. The thermal parameters of the steel, such as the thermal conductivity, specific heat, and thermal expansion coefficient, were obtained from EN1993-1-2 [24]. A combination of convection and thermal radiation was used to apply the temperature rise curve of the early stage of a real fire to the surface of the model. The steel column was divided vertically into nine equal intervals, and temperatures were uniformly applied to the segments. Assuming that the temperature differences between the measuring points (e.g., T3–T4) were linearly distributed, the temperature of each segment of the steel column was calculated using a linear difference. In practical situations, the temperature distribution within a fire scene is often nonlinear, as it is influenced by various factors such as the location of the fire source, the types of burning materials and their distributions, ventilation conditions, and so on. Assuming a linear temperature distribution may overlook localized high-temperature zones or regions with sharply varying temperature gradients, thereby overestimating the extent that structures are exposed to heat. Consequently, the actual temperature at which steel columns fail may be slightly lower than the simulated value.
Considering that the steel column in the fireproof test was protected by fireproof blankets on both sides, the 100 mm sections at both ends of the model were set to 20 °C. Following the recommendations of EN 1993-1-2, the emissivity coefficient and heat transfer coefficient were set to 0.7 and 25 (W/m2·K), respectively; it was assumed that these coefficients do not change with increasing temperature. Changes in the emissivity and heat transfer coefficients occur constantly during the course of a fire. Simplifying the dynamic variations in these factors may result in simulated fire temperatures being slightly lower than actual fire temperatures.
Figure 10 shows the heat transfer analysis results for the L-1 MW-1 sample. Based on these results, the numerical simulation reproduced the uneven vertical temperature distribution of the steel column. The simulation results were in good agreement with the calculations obtained from the FDS (Figure 11), with a relative difference of less than 10%. Therefore, a heat transfer model was used to predict the sample temperature.

3.2. Mechanical Analysis

3.2.1. Material Properties

The mechanical properties of steel can change with an increase in temperature [25,26,27]. The mechanical analysis model employed S4R elements to simulate the mechanical properties of Q690 high-strength steel at different temperatures based on the stress–strain relationship proposed in the literature [28] (Figure 12). Poisson’s ratio was assumed to be 0.3.

3.2.2. Boundary Conditions

The two ends of the steel column were coupled at independent points, and six degrees of freedom were bound. The independent node was placed at the center of the cross-section, considering the thickness of the steel plate, and offset outward by 15 mm (Figure 13). The bottom of the steel column was hinged, enabling rotation only around the short axis. Conversely, at the top node of the steel column, all degrees of freedom were fixed except for the height constraint and rotation around the short axis (Figure 14). The “SPRING” element was used to simulate the constraint beam at the end points of the column. The “SPRING1” type was used as the ground spring, which connected the simulation node to the ground. The axial constraints were established by setting the stiffness ratios. As the actual axial constraint stiffness was nonlinear, the “INPUT” file was edited to assign nonlinear stiffness values to the springs.

3.3. Comparison of Fire Resistance Performances of Steel Columns under Different Temperature Rise Curves

Regarding the failure criteria for steel columns, both Chinese standards GB/T 9978 and ISO 834 [29] adopted the axial compression deformation ratio. However, considering the difficulty of monitoring the axial compression deformation ratio in experiments, the failure criterion used in a previous study [23] was adopted. This study assumed that the steel column was damaged when its lateral displacement reached L/20.

3.3.1. Comparison of Failure Positions of Steel Columns

In the numerical simulations, the failure locations of the steel columns that adopted quasi-realistic fire temperature curves were located in the middle to upper parts of the steel columns, which differed significantly from the failure locations of the steel columns that used the ISO 834 temperature curve (Figure 15). This was because of the uneven vertical temperature distribution, which resulted in higher temperatures in the upper parts of the steel columns during the early stages of the fire, which caused damage to the upper sections. Consequently, these parts reached the yield state earlier than the other parts during the fire.

3.3.2. Comparison of Fire Resistance Temperatures of Steel Columns

When applying an uneven vertical temperature field to the model in Abaqus to calculate the mechanical properties of steel columns under different load ratios, a comparison of the simulation results with those obtained using the ISO 834 temperature curve revealed the following: the failure temperatures that considered the uneven vertical temperature distribution in the steel column were higher than the failure temperatures that were obtained directly using the ISO 834 temperature curve, with temperature differences exceeding 100 ℃ under certain fire conditions.
Taking L-2 MW-1-0.5 and E-250-1-3000-0.5 as examples (Figure 16, where 0.5 represents the load ratio applied under these fire conditions), the difference in the failure temperature under local fire conditions was greater than that under uniform fire conditions. This was because in local fires, the vertical temperature differences along the steel column were larger than those in uniform fires. Thus, it had a greater impact on the ultimate failure temperature. This phenomenon was evident in all cases of uniform and local fire conditions.

4. Revision of the Formula for the Ultimate Fire Resistance Temperature of Steel Columns

4.1. Parameter Analysis

Through a parameter analysis, the effects of the load ratio, maximum and minimum vertical temperature differences, and maximum temperature during the early stage of a fire on the failure temperatures of steel columns were studied. Based on the results of this parameter analysis, the fire resistance formula for steel columns was revised according to different fire scenarios and was used to evaluate the critical temperature of Q690 restrained steel columns. Using a model with a cross-sectional size of H200 × 150 × 14 × 14, an uneven vertical temperature field was applied, and the axial restraint stiffness was assumed to remain unchanged with increasing temperature. It was further assumed that the amplitude of the initial global geometric defect was L/1000. The parameter ranges are listed in Table 3. These parameters were derived from the parameters of real buildings.
Figure 17 shows a comparison of the failure temperatures under various working conditions. Figure 17a shows the effect of the maximum vertical temperature difference during the early stage of a fire on the failure temperature. There was a certain linear relationship between the failure temperature and the maximum vertical temperature difference. As the vertical temperature difference during the early stage increased, the failure temperature of the steel column decreased slightly. However, this effect was not significant. Figure 17b illustrates the effect of the maximum temperature on the failure temperature of the steel column during the early stages of a fire. As the maximum temperature increased during the early stages of the fire, the failure temperature of the steel column decreased. This was because the higher the temperature during the early stages of the fire, the greater the initial damage to the steel column, which resulted in a lower overall failure temperature for the steel column.
Figure 17c compares the temperature–transverse displacement curves of the steel columns under various working conditions with a load ratio of 0.5. When considering the uneven vertical temperature distribution during the early stages of a fire, the failure temperatures of the steel columns under all working conditions were significantly higher than those observed when directly using the ISO834 temperature rise curve. This was because considering the uneven vertical temperature distribution along the steel column was equivalent to reducing the effective fire-exposed length of the steel column, which thereby increased its fire resistance. Moreover, this improvement was more pronounced under various working conditions of localized fires because the uneven vertical temperature distribution was more apparent in the localized fire scenarios.

4.2. Formula Modification

Wang et al. [30] proposed a simplified formula for calculating the failure temperatures of Q690 steel columns:
TCR = 614.7 + 11.5pN − 289pN2
After comparing the simulation results with those calculated using this formula, the failure temperature obtained using the actual fire–temperature increase curve was found to be slightly higher. In this context, ∆T is defined as the difference between the failure temperature obtained considering the uneven temperature distribution during the early stages of a fire under the same load ratio and the failure temperature calculated using Equation (2). Assuming that there is a certain relationship between the failure temperature difference (∆T) and the maximum temperature (Tmax) during the early stages of a fire, a relationship between ∆T and Tmax can be derived based on quadratic fractional regression analysis, as shown in the following equations:
∆T = −1.8395 × 10−4Tmax2 − 0.1979Tmax + 57.776, pN = 0.2
∆T = 2.5767 × 10−4Tmax2 − 0.2635Tmax + 71.019, pN = 0.3
∆T = 3.1406 × 10−4Tmax2 − 0.3234Tmax + 86.749, pN = 0.4
∆T = 3.6662 × 10−4Tmax2 − 0.3840Tmax + 111.69, pN = 0.5
∆T = 4.0132 × 10−4Tmax2 − 0.4312Tmax + 127.97, pN = 0.6
∆T = 4.0866 × 10−4Tmax2 − 0.3989Tmax + 101.13, pN = 0.7
∆T = 3.5307 × 10−4Tmax2 − 0.3644Tmax + 90.719, pN = 0.8
Finally, a formula can be determined to predict the critical temperature (Tpr), as shown in the following equations:
Tpr = TCR + (−1.8395 × 10−4Tmax2 − 0.1979Tmax + 57.776), pN = 0.2
Tpr = TCR + (2.5767 × 10−4Tmax2 − 0.2635Tmax + 71.019), pN = 0.3
Tpr = TCR + (3.1406 × 10−4Tmax2 − 0.3234Tmax + 86.749), pN = 0.4
Tpr = TCR + (3.6662 × 10−4Tmax2 − 0.3840Tmax + 111.69), pN = 0.5
Tpr = TCR + (4.0132 × 10−4Tmax2 − 0.4312Tmax + 127.97), pN = 0.6
Tpr = TCR + (4.0866 × 10−4Tmax2 − 0.3989Tmax + 101.13), pN = 0.7
Tpr = TCR + (3.5307 × 10−4Tmax2 − 0.3644Tmax + 90.719), pN = 0.8
A comparison between the simulated and calculated results is shown in Figure 18, indicating a relative difference of less than 5%.
Finally, a comparison between the method used to calculate the critical temperature in this study and the critical temperature values in the “Technical Code for Fire Protection of Steel Structures” (GB51249-2017) [31] is shown in Figure 19. Evidently, there are differences between the two. When the load ratio ranges from 0.2 to 0.5, the difference can be nearly 200 °C. When the load ratio reaches 0.8, the differences between the values in the “Technical Code for Fire Protection of Steel Structures” (GB51249-2017) and the values calculated in this study are minimal. Overall, for Q690 steel columns, the failure temperatures predicted in the “Technical Code for Fire Protection of Steel Structures” (GB51249-2017) are not safe, particularly when the load ratio is low. More attention should be paid to the influence of an uneven vertical temperature distribution along a steel column on the failure temperature during a fire.

4.3. Applications and Challenges

Steps to incorporate these findings into building codes and standards:
  • Evaluate the applicability of existing codes and standards: Conduct a comprehensive review of existing fire safety codes and standards. Identify which parts may overlook the uneven temperature distribution factors during a fire and assess whether new calculation formulas can be accommodated.
  • Develop a revision draft: Based on the revised calculation formulas, define the scope of applicability, calculation methods, parameter definitions, and specific implementation requirements of the new formulas. Ensure that the formulas are clear, accurate, and free of ambiguities and that they align with internationally accepted fire safety standards and practices.
  • Expert review and public consultation: Organize reviews of the revised formulas by industry experts and scholars to gather professional opinions and recommendations. Conduct public consultation activities to widely solicit feedback from fire departments and other relevant stakeholders to ensure the reasonableness and feasibility of the revised formulas.
Challenges that may be encountered during implementation: The fire resistance calculation formula proposed in this paper only considers pure steel structures. In practical engineering applications, there may be some deviations in fire resistance calculations for steel–concrete composite structures. Further research and adjustments will be needed in subsequent studies.

5. Conclusions

In this study, the uneven vertical temperature fields of steel columns in the early stages of a fire were determined via theoretical analysis and numerical simulation methods, and a steel column temperature rise curve that is more aligned with real fire conditions was proposed. Compared to previous studies on the fire resistance of steel columns, this paper considered the impacts of full-scale fires on steel columns, including the effects of unevenly distributed temperature fields. The influence of the uneven vertical temperature distribution on the fire resistance of restrained steel columns during a fire was analyzed. Finally, through parameter analysis, the formula for calculating the fire-resistant temperature of steel columns was revised. The revised formula for calculating the fire resistance temperature is safer and more accurate, offering valuable guidance for designing fire resistant steel columns.
The following conclusions were drawn:
  • Both local and uniform fires exhibit uneven vertical temperature distributions in the early stages of a fire, with the maximum vertical temperature difference reaching over 500 °C. Therefore, the uneven vertical temperature distribution in the early stages of a fire has to be considered and a simulated temperature rise curve has to be constructed.
  • The uneven vertical temperature distribution in the early stages of a fire significantly affects the failure temperatures and locations of steel columns. Additionally, the failure temperature is closely related to parameters such as the load ratio, the vertical temperature difference in the early stages of a fire, and the maximum temperature in the early stages of a fire, among which the load ratio has the most significant effect.
  • The revised formula for calculating the fire resistance temperature of steel columns is more accurate and safer compared with that presented in the “Technical Code for Fire Protection of Steel Structures” (GB51249-2017), particularly when the load ratio ranges from 0.2 to 0.5, where the difference can be nearly 200 °C.
  • This paper focused on a fire resistance simulation conducted specifically on H-shaped steel columns, which inherently have certain limitations. However, it is believed that similar fire resistance phenomena also occur in other types of steel columns and structural components. An uneven longitudinal temperature distribution shortens the effective fire exposure length of a steel column, thus improving its fire resistance temperature. It is believed that this rule is applicable to various types of steel columns, albeit with different temperature differences.

Author Contributions

Conceptualization, X.W.; methodology, X.W. and W.C.; software, T.Y.; validation, X.W.; formal analysis, X.W. and W.C.; investigation, X.W. and W.C.; resources, X.W.; data curation, X.W. and J.L.; writing—original draft preparation, X.W.; writing—review and editing, X.W.; visualization, X.W. and W.C.; supervision, X.W. and W.C.; project administration, W.C.; funding acquisition, W.C. All authors have read and agreed to the published version of the manuscript.

Funding

This study was supported by the National Natural Science Foundation of China (52308504).

Data Availability Statement

Regarding the research data for this article, there is currently no online database available. If any relevant data is required, please feel free to contact the author directly for provision.

Conflicts of Interest

The authors declare no conflict of interest.

References

  1. EN 1991-1-2; Actions on Structures–Part 1–2: General Actions–Actions on Structures Exposed to Fire. European Committee for Standardization: Brussels, Belgium, 2002.
  2. Aasen, B. An Experimental Study on Steel Column Behaviour at Elevated Temperatures; Institutt for Stålkonstruksjoner, Universitetet i Trondheim, Norges Tekniske: Trondheim, Norway, 1985. [Google Scholar]
  3. Ali, F.A.; Shepherd, P.; Randall, M.; Simms, I.; O’Connor, D.J.; Burgess, I. The effect of axial restraint on the fire resistance of steel columns. J. Constr. Steel Res. 1998, 46, 305–306. [Google Scholar] [CrossRef]
  4. Cai, J.; Feng, J.; Zhao, Y.; Xu, Y. Stability of axially restrained steel columns under temperature action. Sci. China Technol. Sci. 2010, 53, 3349–3355. [Google Scholar] [CrossRef]
  5. Chiew, S.P.; Zhao, M.S.; Lee, C.K. Mechanical properties of heat-treated high strength steel under fire/post-fire conditions. J. Constr. Steel Res. 2014, 98, 12–19. [Google Scholar] [CrossRef]
  6. Craveiro, H.D.; Rodrigues, J.P.C.; Laím, L. Cold-formed steel columns made with open cross-sections subjected to fire. Thin-Walled Struct. 2014, 85, 1–14. [Google Scholar] [CrossRef]
  7. Dellepiani, M.G.; Munoz, G.R.; Yanez, S.J.; Guzmán, C.F.; Flores, E.I.S.; Pina, J.C. Numerical study of the thermo-mechanical behavior of steel–timber structures exposed to fire. J. Build. Eng. 2023, 65, 105758. [Google Scholar] [CrossRef]
  8. I.S. EN 1993-1-2:2005; Eurocode 3 C. Design of Steel Structures–Part 1–2: General Rules–Structural Fire Design. European Committee for Standardization: Brussels, Belgium, 2005.
  9. Fan, S.; Zhang, L.; Sun, W.; Ding, X.; Liu, M. Numerical investigation on fire resistance of stainless steel columns with square hollow section under axial compression. Thin-Walled Struct. 2016, 98, 185–195. [Google Scholar] [CrossRef]
  10. GB 51249-2017; Code for Fire Safety of Steel Structures in Buildings. China Planning Press: Beijing, China, 2017.
  11. Jiang, B.; Yin, Z.; Zhang, J.; Fan, C.; Li, Y. Effect of rotational restraint conditions on performance of steel columns in fire. Eng. Struct. 2021, 238, 112237. [Google Scholar] [CrossRef]
  12. Li, G.-Q.; Song, L.-X. Mechanical properties of TMCP Q690 high strength structural steel at elevated temperatures. Fire Saf. J. 2020, 116, 103190. [Google Scholar] [CrossRef]
  13. Liu, G.; Meng, H.; Qu, G.; Wang, L.; Ren, L.; Lu, H. Real-time monitoring and prediction method of commercial building fire temperature field based on distributed optical fiber sensor temperature measurement system. J. Build. Eng. 2023, 70, 106403. [Google Scholar] [CrossRef]
  14. Lucherini, A.; Torero, J.L. Defining the fire decay and the cooling phase of post-flashover compartment fires. Fire Saf. J. 2023, 141, 103965. [Google Scholar] [CrossRef]
  15. Pires, T.A.; do Rêgo Silva, J.J.; dos Santos, M.M.; Costa, L.M. Fire resistance of built-up cold-formed steel columns. J. Constr. Steel Res. 2021, 177, 106456. [Google Scholar] [CrossRef]
  16. Qiang, X.; Bijlaard, F.; Kolstein, H. Dependence of mechanical properties of high strength steel S690 on elevated temperatures. Constr. Build. Mater. 2012, 30, 73–79. [Google Scholar] [CrossRef]
  17. Rakshith, B.; Kumar, S. Behaviour of steel columns with realistic boundary restraints under standard fire. Structures 2020, 28, 626–637. [Google Scholar]
  18. ISO 834-1:1999; Fire-resistance Tests: Elements of Building Construction. General Requirements. International Organization for Standardization: Geneva, Switzerland, 1999.
  19. Sun, X.; Wang, Q.; Lv, J.; Fang, X.; Han, Y.; Tang, F.; Hu, L. Temperature evolution, flame traveling transition structure inside a compartment of various fire source locations. Fuel 2024, 371, 131911. [Google Scholar] [CrossRef]
  20. Wang, W.; Li, G. Research progress of fire resistance design theory of high strength steel structures. Ind. Constr. 2016, 46, 61–67. [Google Scholar]
  21. Wang, W.; Ohmiya, Y.; Ma, G. Fire resistance study of axially loaded high strength steel columns. Procedia Eng. 2013, 62, 690–701. [Google Scholar] [CrossRef]
  22. Wang, Y.C. The effects of structural continuity on the fire resistance of concrete filled columns in non-sway frames. J. Constr. Steel Res. 1999, 50, 177–197. [Google Scholar] [CrossRef]
  23. Wang, W.; Zhang, L.; Li, G. Experimental study on fire resistance of high strength Q690 steel columns. J. Build. Struct. 2019, 40, 155–162. [Google Scholar]
  24. Wu, Y.; Fan, S.; He, B.; Li, C.; Zhou, H. Experimental study and numerical simulation analysis of the fire resistance of high-strength steel columns with rectangular sections under axial compression. Fire Saf. J. 2021, 121, 103266. [Google Scholar] [CrossRef]
  25. Wu, Y.; Fan, S.; He, B.; Liu, M.; Zhou, H. Research on the fire resistance design of high-strength steel hollow columns under axial compression. Eng. Struct. 2021, 234, 111943. [Google Scholar] [CrossRef]
  26. Yan, X.; Gernay, T. Numerical modeling of localized fire exposures on structures using FDS-FEM and simple models. Eng. Struct. 2021, 246, 112997. [Google Scholar] [CrossRef]
  27. Yang, D.; Hu, L.H.; Jiang, Y.Q.; Huo, R.; Zhu, S.; Zhao, X.Y. Comparison of FDS predictions by different combustion models with measured data for enclosure fires. Fire Saf. J. 2010, 45, 298–313. [Google Scholar] [CrossRef]
  28. Yang, J.; Shi, Y.; Wang, W.; Xu, L.; Al-azzani, H. Experimental and numerical studies on axially restrained cold-formed steel built-up box columns at elevated temperatures. J. Constr. Steel Res. 2020, 171, 106143. [Google Scholar] [CrossRef]
  29. Yang, J.; Xia, Y.; Wang, W.; Al-azzani, H. Fire resistance of axially restrained Q690 H-shaped welded steel columns: Test, simulation and design. J. Constr. Steel Res. 2021, 177, 106413. [Google Scholar] [CrossRef]
  30. Yang, K.-C.; Hsu, R. Structural behavior of centrally loaded steel columns at elevated temperature. J. Constr. Steel Res. 2009, 65, 2062–2068. [Google Scholar] [CrossRef]
  31. Zhao, G.; Beji, T.; Merci, B. Study of FDS simulations of buoyant fire-induced smoke movement in a high-rise building stairwell. Fire Saf. J. 2017, 91, 276–283. [Google Scholar] [CrossRef]
Figure 1. FDS model building. (a) Reference model. (b) Study model.
Buildings 14 02826 g001
Figure 2. Room HRR comparison.
Buildings 14 02826 g002
Figure 3. Layout of the room temperature measuring points.
Buildings 14 02826 g003
Figure 4. Temperature curves at different measuring points. (a) E-250-1-500. (b) E-250-1-3000.
Buildings 14 02826 g004
Figure 5. Temperature–time curves under uniform fire conditions. (a) E-250-2-500. (b) E-250-2-3000. (c) E-350-1-500. (d) E-350-1-3000. (e) E-350-2-500. (f) E-350-2-3000.
Buildings 14 02826 g005aBuildings 14 02826 g005b
Figure 6. Fire source arrangement under local fire conditions.
Buildings 14 02826 g006
Figure 7. HRR change curves under local fire conditions.
Buildings 14 02826 g007
Figure 8. Temperature–time curves under local fire conditions. (a) L-1MW-1. (b) L-1MW-2. (c) L-1MW-3. (d) L-1MW-4. (e) L-2MW-1. (f) L-2MW-2. (g) L-2MW-3. (h) L-2MW-4.
Buildings 14 02826 g008aBuildings 14 02826 g008b
Figure 9. Quasi-realistic temperature rise curves for L-1MW-1 fire.
Buildings 14 02826 g009
Figure 10. Cloud image of heat transfer result.
Buildings 14 02826 g010
Figure 11. Comparison of heat transfer and temperature rise curves for L-1MW-1 sample.
Buildings 14 02826 g011
Figure 12. Stress–strain curves of Q690 steel at high temperatures.
Buildings 14 02826 g012
Figure 13. Independent node coupling.
Buildings 14 02826 g013
Figure 14. Boundary conditions.
Buildings 14 02826 g014
Figure 15. Comparison of the failure positions of a steel column. (a) ISO834 temperature rise curve. (b) Quasi-realistic fire heating curve.
Buildings 14 02826 g015
Figure 16. Comparison of failure temperatures. (a) L-2MW-1-0.5. (b) E-250-1-3000-0.5.
Buildings 14 02826 g016
Figure 17. Comparison of failure temperatures under different working conditions. (a) Impact of the maximum vertical temperature difference on the failure temperature. (b) Impact of the maximum temperature on the failure temperature. (c) Comparison of failure temperatures under working conditions with pN = 0.5.
Buildings 14 02826 g017
Figure 18. Comparison between the calculated and simulated results.
Buildings 14 02826 g018
Figure 19. Comparison of the failure temperatures obtained from the calculation scheme and GB51249-2017.
Buildings 14 02826 g019
Table 1. Model parameter settings under uniformly distributed fire conditions.
Model NumberHRRPUA (kW/m2)H (mm)D (mm)
E-250-1-5002501500500
E-250-1-300025015003000
E-250-2-500250500500
E-250-2-30002505003000
E-350-1-5003501500500
E-350-1-300035015003000
E-350-2-500350500500
E-350-2-30003505003000
Note: the values of 250 and 350 represent HRRPUA values of 250 kW/m2 and 350 kW/m2 for a uniformly distributed fire, respectively; H represents the distance from the bottom of the vent to the ground; and D indicates the distance between the vent and the temperature measurement point.
Table 2. Model parameter settings under local fire conditions.
Model NumberHRRPUA (kW/m2)H (mm)D (mm)
L-1MW-110001000500
L-1MW-2100010005000
L-1MW-310001500500
L-1MW-41000500500
L-2MW-120001000500
L-2MW-2200010005000
L-2MW-320001500500
L-2MW-42000500500
Note: for the model numbers, 1 MW and 2 MW indicate that the peak HRRPUA values of the fire sources are 1 MW/m2 and 2 MW/m2, respectively; H indicates the distance between the bottom of the vent and the ground; and D represents the distance between the ignition point and temperature measurement point.
Table 3. Analysis parameters.
Cross-Section DimensionsSlenderness Ratio (λ) Nondimensional   Slenderness   ( λ ¯ ) Load Ratio (pN)Axial Restraint Ratio (α)
H200 × 150 × 14 × 14961.890.2–0.80–0.09
Disclaimer/Publisher’s Note: The statements, opinions and data contained in all publications are solely those of the individual author(s) and contributor(s) and not of MDPI and/or the editor(s). MDPI and/or the editor(s) disclaim responsibility for any injury to people or property resulting from any ideas, methods, instructions or products referred to in the content.

