1. Introduction
The origin of the science of acoustics is generally attributed to the Greek philosopher Pythagoras of Samos (c. 570–495 B.C.). Sauveur J. laid the foundations of “The Modern Science of Acoustics” at the end of the 17th century. He was the first to apply the term acoustics to the science of sound in 1701. The word “acoustic” is derived from the Greek word ἀκουστικός (akoustikós), meaning “ready to hear” and that from ἀκουστός (akoustós), “audible”, which in turn derives from the verb ἀκούω (akoúo), “I hear” [
1]. Cool E.F.F., in 1802, published a book entitled Die Akustik [
2,
3], which can be considered the first comprehensive work on acoustics. Tyndall J. was the author of the book Sound [
4], which influenced the teaching of acoustics in universities. In 1913, Fabyan G., initiated the construction of the “Riverbank Acoustical Laboratories”, which in 1918 became the first independent, globally recognized laboratory researching building acoustics [
5].
Nowadays, the acoustic properties of materials play an increasing role in the design and solution of unwanted noise control in several industries. Determining acoustic properties is therefore extremely important. Designing and improving an environment that would be acceptable from the point of view of acoustics is directly related to the selection of suitable building materials and the techniques for their use.
The issue of the acoustic properties of dividing building partitions with different compositions was examined by Butkus D. et al. [
6], who concluded that the deterioration of the acoustic properties of the examined building structures is mainly due to the lack of surface treatment of the walls, and also the absence of an air gap. On the contrary, they obtained the best results when they filled the space between the partitions with a layer of mineral wool 50 mm thick, while the remaining 50 mm formed an air gap. Kosała K. [
7] presented the results of research on the acoustic properties of sound-absorbing materials. The team of authors [
8] focused on the development of new sustainable alternatives to conventional plasterboard partitions in combination with mineral wool. They analyzed six different configurations combining conventional materials with bio-based materials. They concluded that bio-composite materials in combination with bio-based materials reduce the environmental impact the most, but have worse acoustic properties (
R’
w difference of 10 dB), compared to conventional material/bio-based material. The main aim of the authors’ work [
9] was to develop a comparative study of the acoustic requirements of current building regulations worldwide. The analysis of the documents concluded that the difference between the requirements imposed on new and existing buildings is 5 dB, both for insulation of airborne sound and insulation of impact sound. Garg N. et al. [
10], in reverberation chambers, tested the airborne sound insulation of sandwich partition panels and masonry constructions. Yu C.J. and Kang J. [
11], similarly to Kosała K., investigated the environmental impact of acoustic materials in residential buildings.
According to Fayyad U., et al. [
12,
13], knowledge mining from databases can be defined as the non-trivial extraction of implicit, unknown, and potentially useful information from data. To put it simply, we can understand data mining as a method that extracts hidden but useful information from a huge amount of data. The methods used include classical statistical techniques such as regression analysis, analysis of variance, decision tree, cluster analysis, neural network, etc. The authors [
14] used the analysis of variance (ANOVA) and Taguchi method to optimize sound attenuation through sandwich plasterboard structures and structures consisting of masonry concrete blocks/plasterboard in order to investigate the relative influence of different parameters affecting sound transmission attenuation. Yang M. [
15] stated that a wide range of statistical methods such as, e.g., regression and correlation analysis, variance analysis, factor analysis, and cluster analysis are commonly used for soundscape research. For his research in the field of soundscape, he used regression analysis. Kurra S. [
16] used in-depth data analysis to calculate sound transmission losses over multilayer structures. He evaluated three existing models in order to identify the differences between them, and at the same time find the one that best corresponds to reality. To determine the relationship between variables (measured and calculated values), he used regression analysis. He used the ANOVA test to determine whether the differences between the models were statistically significant or not.
The authors of the article presented similar results from their work in publications [
17,
18,
19,
20,
21,
22]. One of the important steps in the assessment of noise is the proposal of measures to reduce it [
23,
24,
25,
26,
27].
This article is focused on the analysis of acoustic properties of dividing building partitions with different compositions. The aim of the article is to assess the suitability of individual types of building structures for specific application purposes, taking into account the achieved acoustic properties and their financial demands.
The first step of these experimental measurements was the construction of a special test environment that ensures constant measurement conditions when measuring the acoustic properties of dividing building structures. Subsequently, the acoustic parameters of several types of partition structures were determined by measurements in accordance with technical standards. In the paper, the acoustic properties of partitions were analyzed using different materials, thicknesses of these materials and a combination of their layering. Regression models and variance analysis were used to analyze and search for dependencies. The data were processed in the STATISTICA program (version 13.0).
2. Materials and Methods
2.1. Subjects of Measurement
The subjects of measurement, in order to determine the acoustic properties, were 9 different partition structures with different compositions. Nine different dividing structures were designed after consultation with professional builders. These partition structures can be applied in buildings as walls with different purposes.
The basis of each structure was construction aerated concrete blocks based on silica sand. The blocks were fitted using standard masonry methods and were joined with thin-layer cement glue. Other layers were made up of plasterboard acoustic boards, which were mounted using steel profiles. The acoustic membrane was glued directly to the plasterboard. In most cases, the core of the building partition structure consisted of acoustic mineral wool fixed in a substructure made of profiles. If the blocks were installed on the outside of the structure, they were plastered with lime-cement plaster or cement glue. Some structures also included an air gap.
In
Table 1, the composition of the individual dividing structures is listed.
2.2. Testing Environment
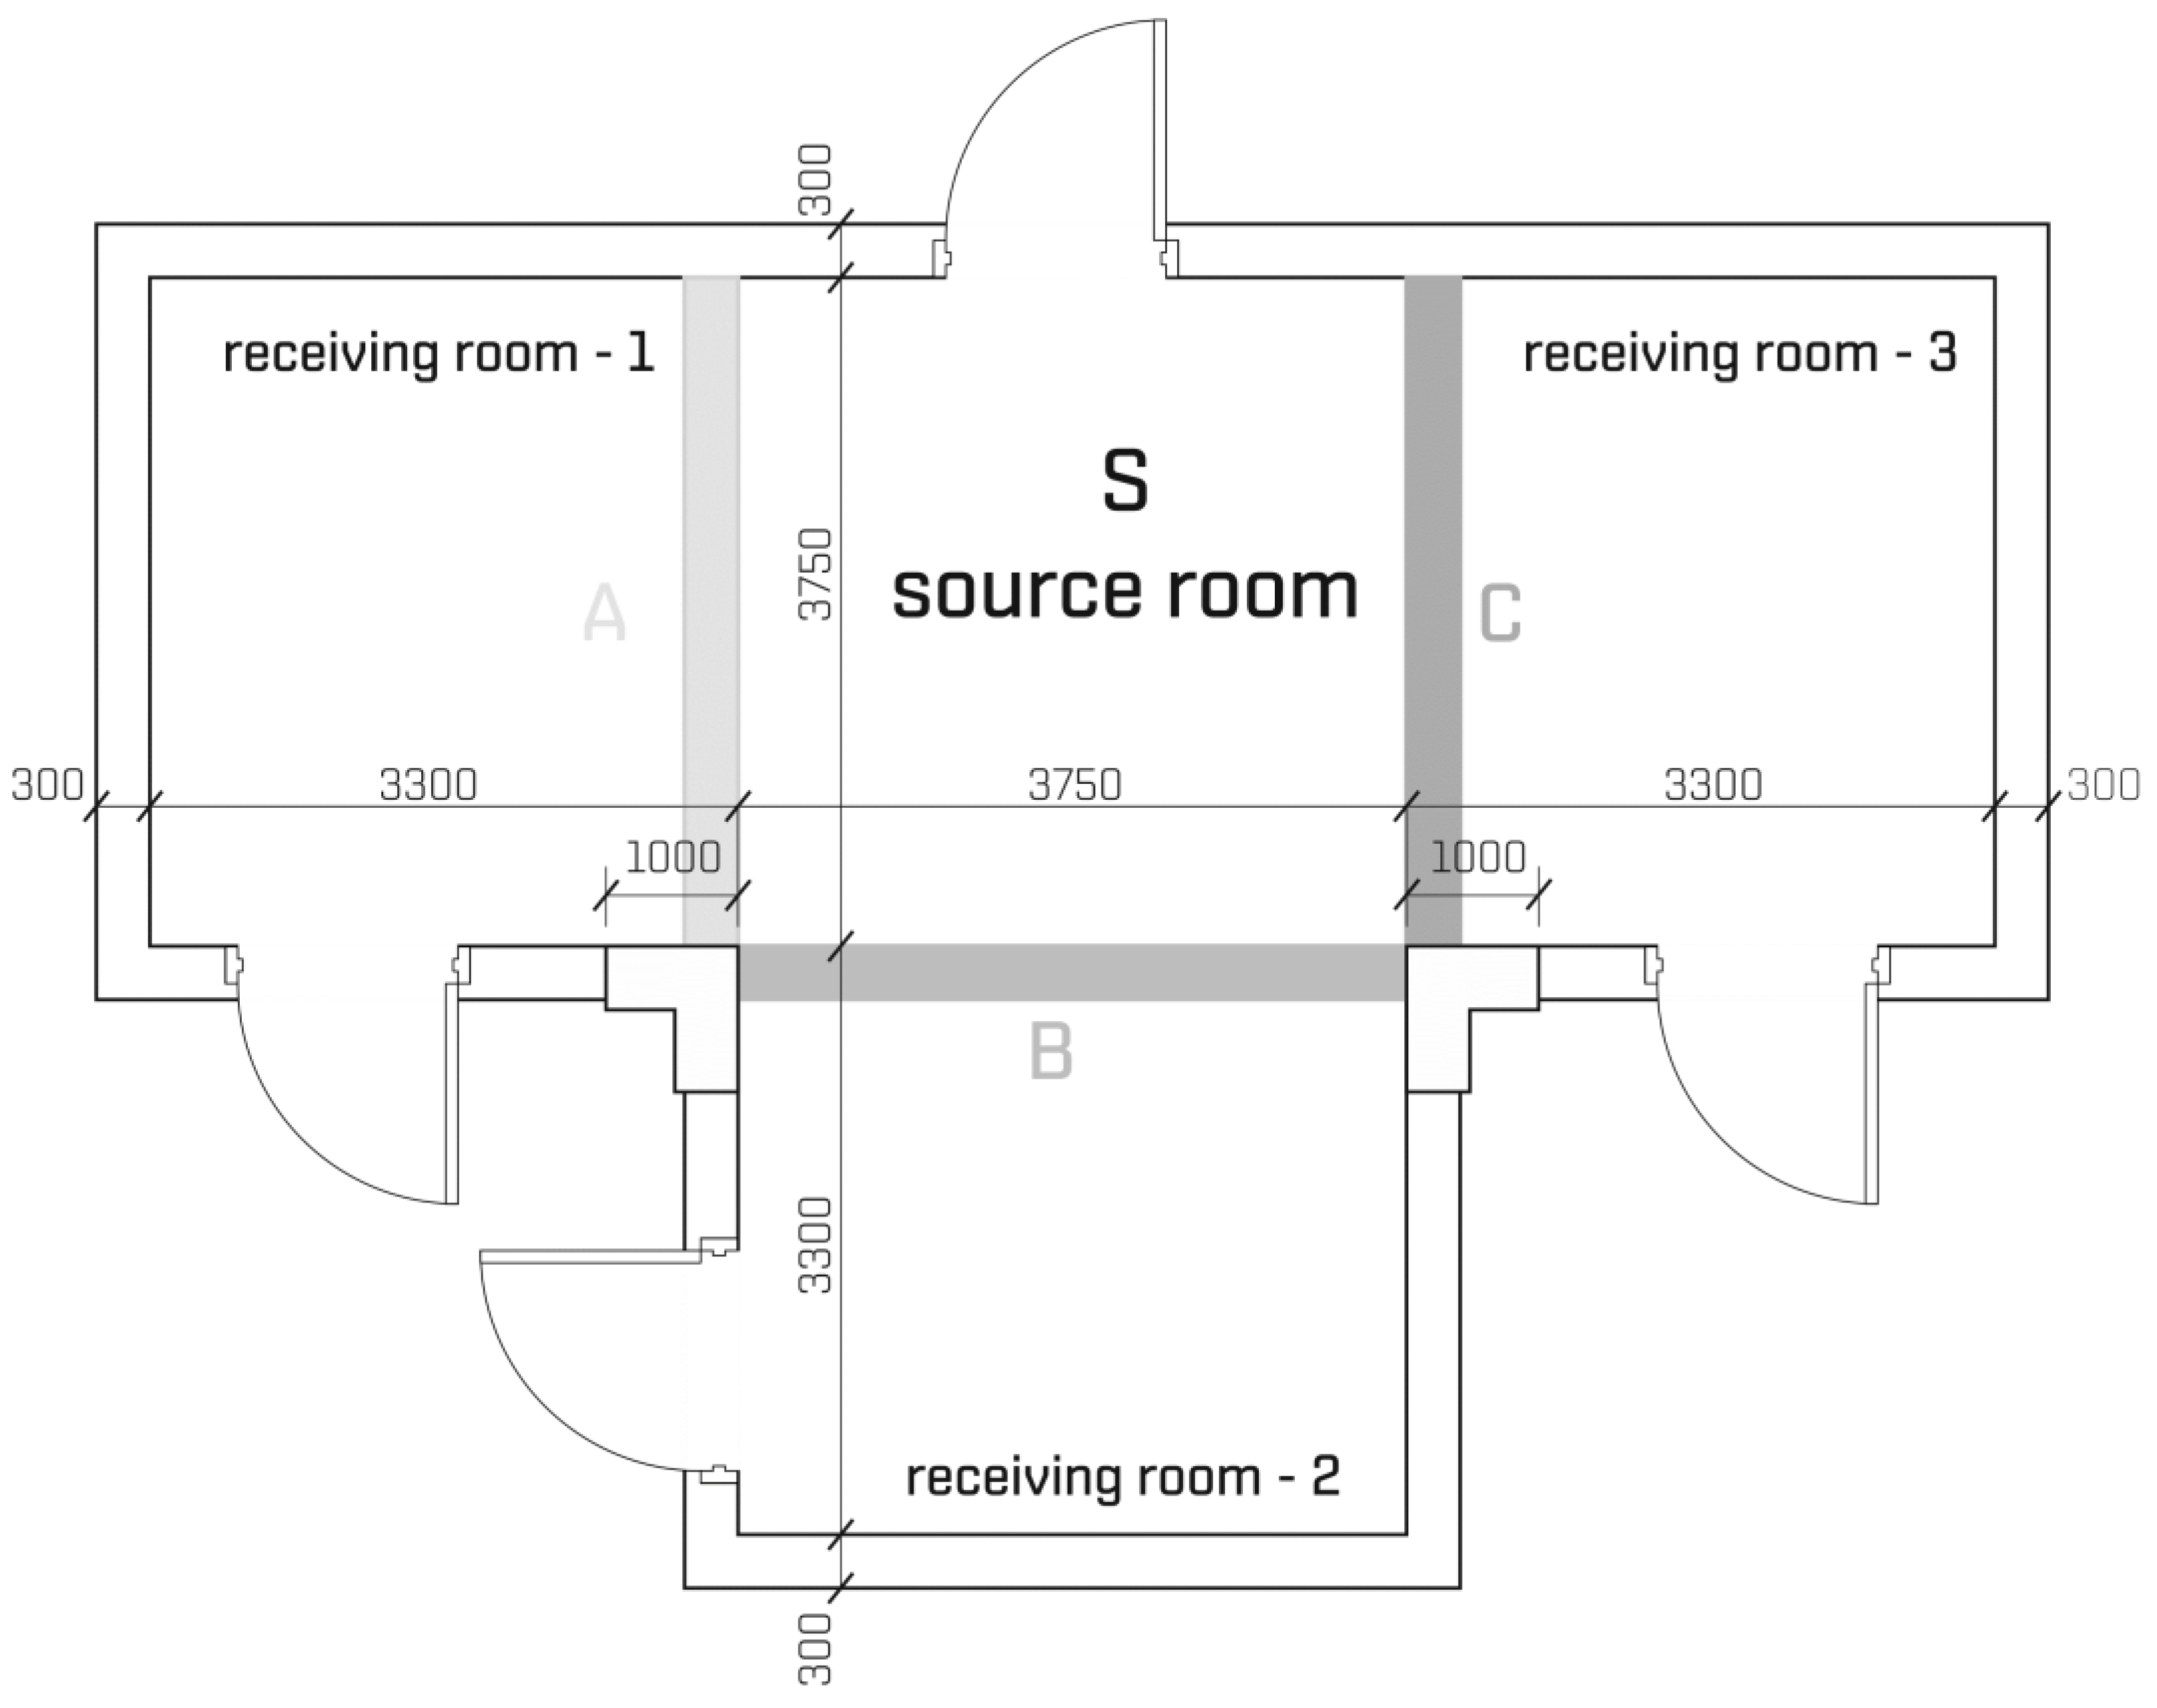
For the purpose of measuring and determining the acoustic properties of individual partition structures, a test environment was built in the industrial hall with dimensions of 15 × 30 m, where individual partition structures were installed.
Figure 1 shows the floor plan of the test environment and
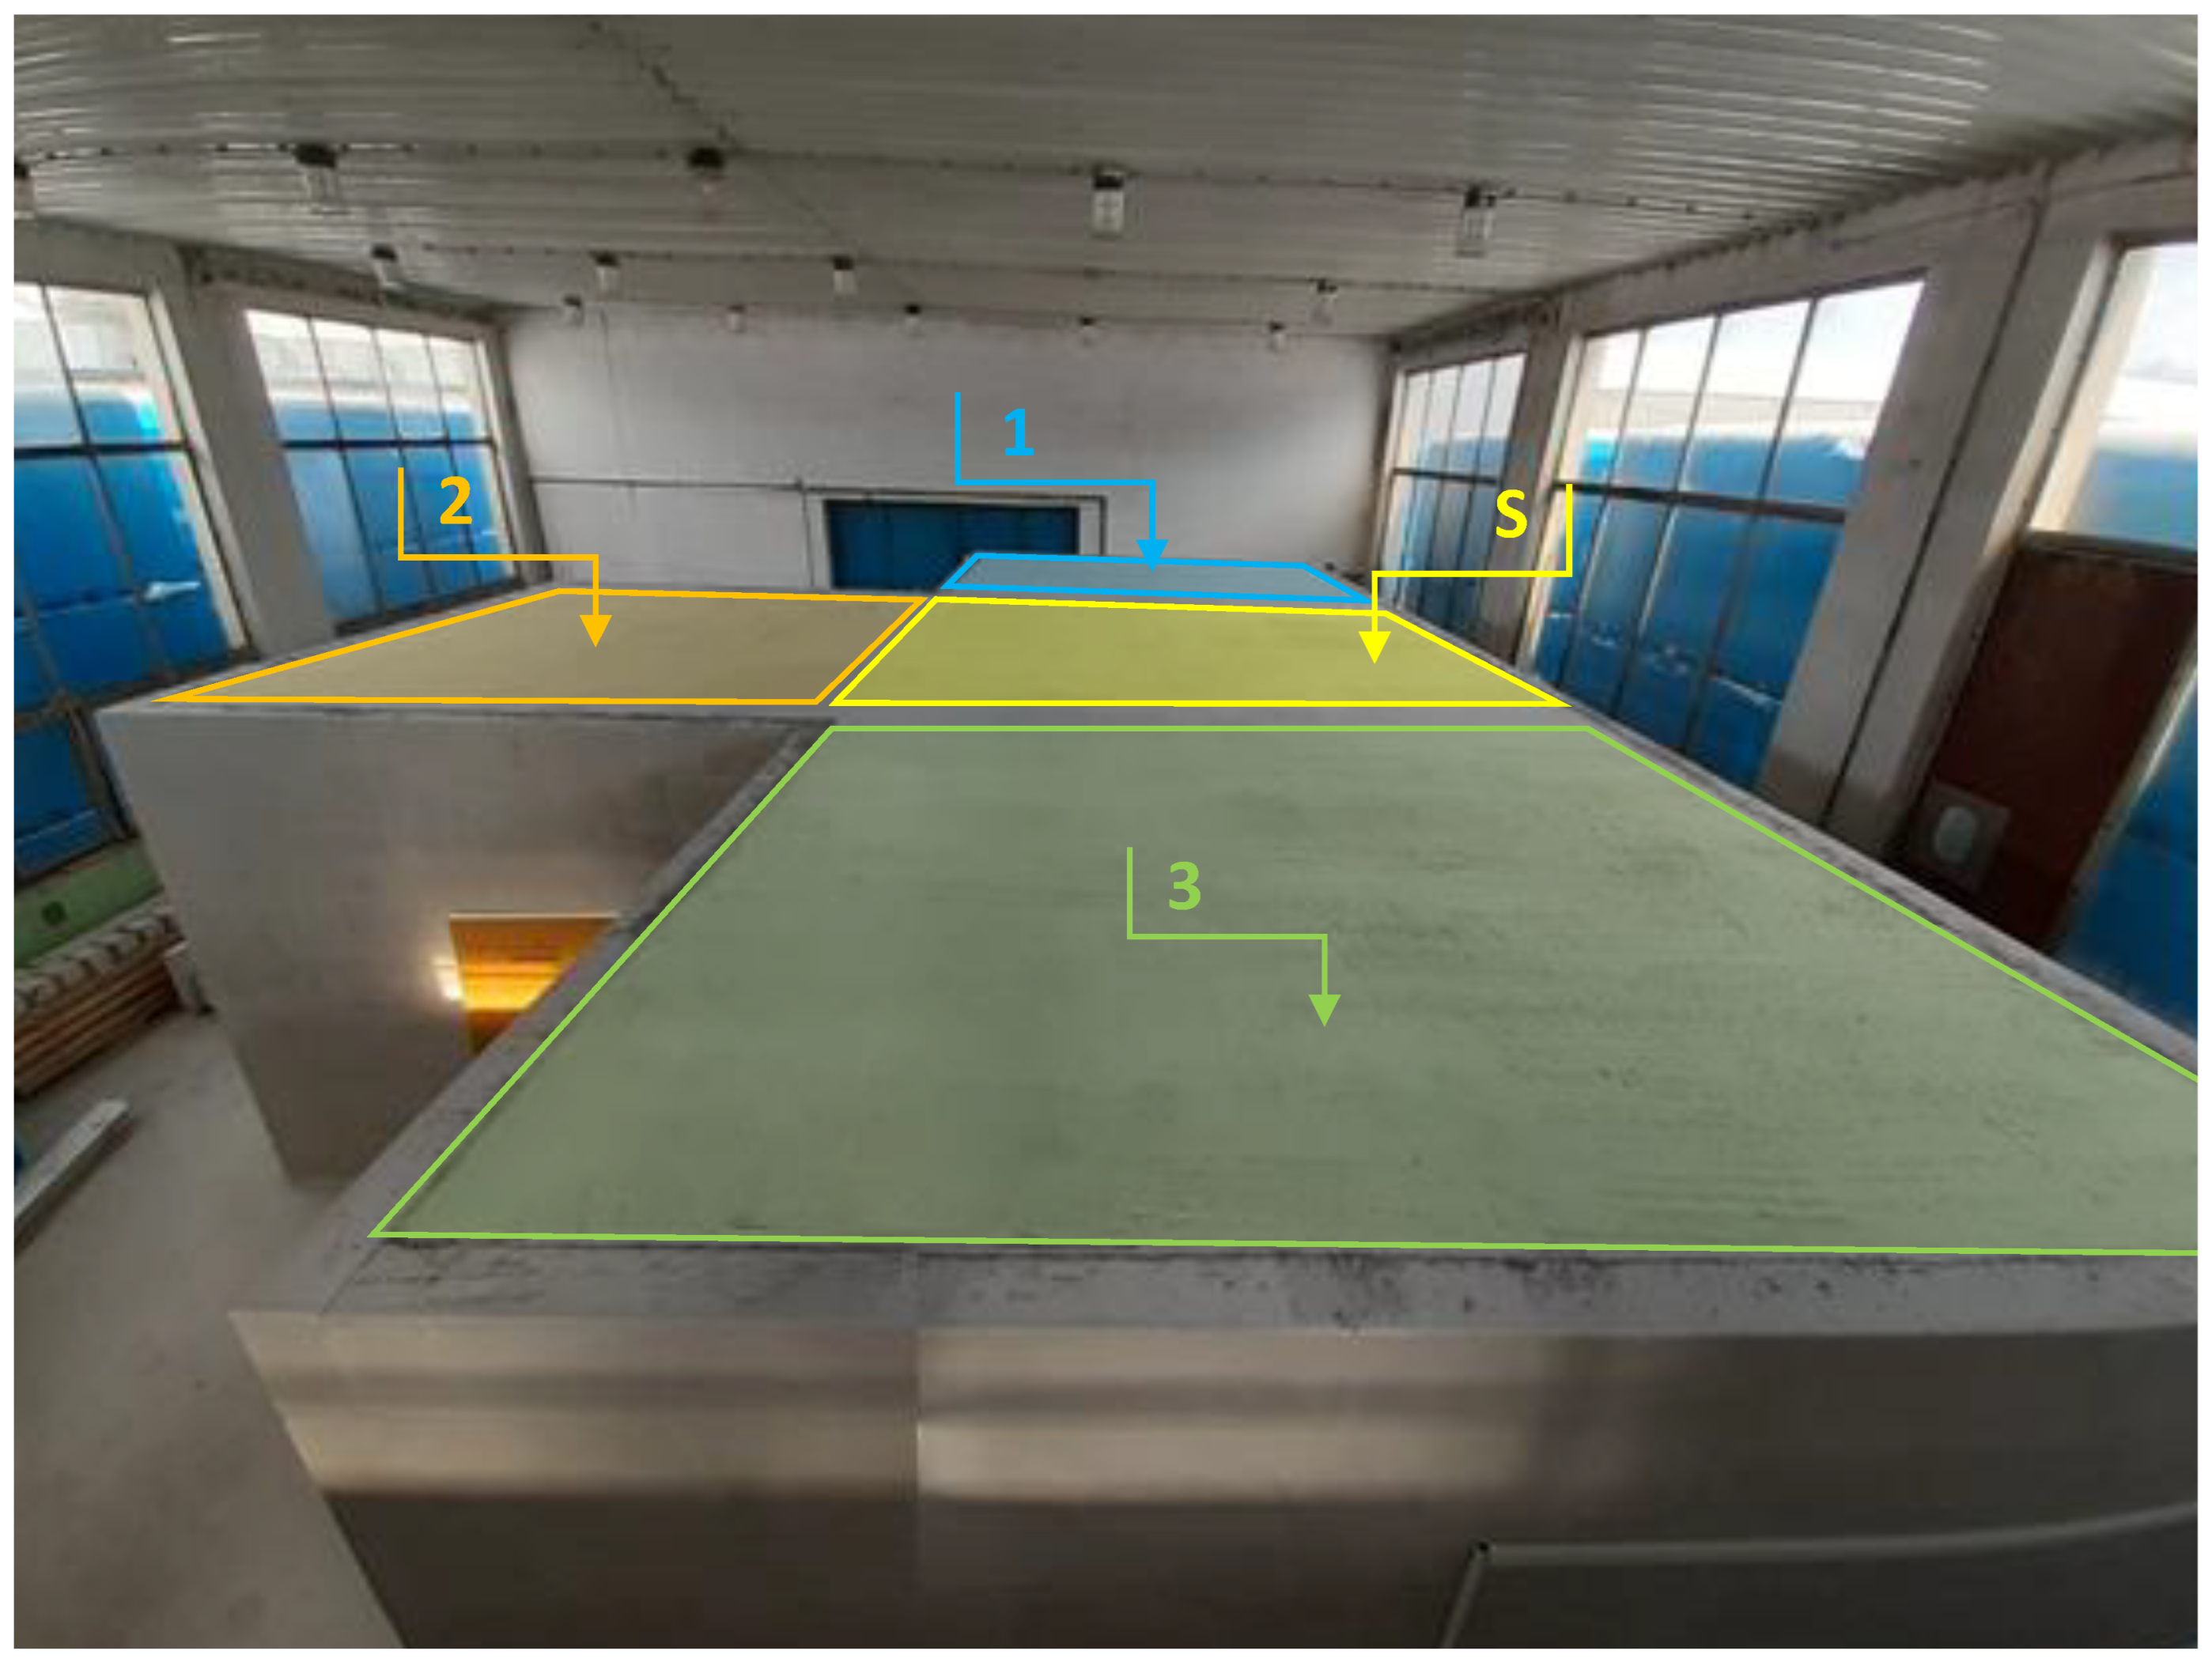
Figure 2 shows a view of the test environment.
The test environment consisted of four rooms. The constructed test building has a T-shaped floor plan. In the middle there was a source room, where there was an omnidirectional loudspeaker. The source room is the largest in terms of area with dimensions 3750 × 3750 mm. Three receiving rooms of identical dimensions (3300 × 3750 mm) were built around the source room. These rooms were separated from the source room by the tested partition structures. The partitions between the individual rooms are marked with the letters A, B, and C. Each room has a separate entrance. The entrance doors to all rooms are soundproof. The wiring does not interfere with the construction of the partitions and is routed on the outside of the perimeter walls of the test building. The perimeter walls, partitions and ceiling structure were built in accordance with recommended technological and construction procedures.
Measurements of the acoustic properties of individual dividing structures were carried out in three series. In each series of measurements, three different compositions of dividing structures were evaluated. Subsequently, these dividing structures were dismantled and other dividing structures were installed. A total of nine different structures were tested. During the measurement, microclimate conditions were stable. Temperature was in the range of 18–20.5 °C and relative humidity was 41–46%.
2.3. Measuring Equipment and Devices
A type 140 Norsonic sound analyzer and a type 1225 Norsonic microphone were used for measurement of sound pressure levels. All equipment and devices meet the requirements for class 1 instruments according to IEC 61672-1 [
28].
The loudspeaker used as the source of noise was a type 276 Norsonic dodecahedron speaker. The type 276 is a high-power loudspeaker with omnidirectional characteristics. The Loudspeaker meets the requirements of STN EN ISO 16283-1 (730514) [
29].
2.4. Measurement Procedure
The level of airborne sound insulation was determined using the ISO 16283-1:2014 standard [
29], which describes field measurements of sound insulation in buildings. One room is chosen as the source room, which contains the loudspeaker, and another room is chosen as the receiving room. The measurements that are required include the sound pressure levels in both rooms with the operating source and background noise in the receiving room when all sources are switched off. In the receiving room, reverberation time measurement using the engineering method with interrupted noise was also performed as described in ISO 3382-2 [
30].
A fixed microphone position was used for the sound pressure level and the background noise. These measurements were taken in the central zone of the room at positions away from room boundaries. There are a minimum of five microphone positions in each room for each loudspeaker position in the source room. The sound was generated in the source room using a single loudspeaker moved into two positions. All quantities were measured using one third octave band filters for the frequencies from 100 to 3150 Hz.
The NorBuild version 4.2 software package was used for calculation of the weighted apparent sound reduction index R’w on the basis of the measured values of the sound pressure level and the reverberation time.
2.5. Acoustic Metric
The basic indicator for evaluating the acoustic properties of the dividing structures is the apparent sound reduction index
R’ (1). It is ten times the common logarithm of the ratio of the sound power,
W1, which is incidental on a test element to the total sound power radiated into the receiving room if, in addition to the sound power,
W2, radiated by the element, the sound power,
W3, radiated by flanking elements or by other components, is significant:
and the apparent sound reduction index is evaluated using Formula (2):
where
S is the area of the common partition, in square meters;
A is the equivalent absorption area of the receiving room, in square meters.
The weighted apparent sound reduction index
R’
w is a single number rating of airborne sound insulation between rooms, over a range of frequencies–field measurements [
29].
3. Results
The aim of the experimental measurements was to compare the weighted airborne sound insulation R’w of the designed vertical partition structures in conditions that are as similar as possible to real conditions commonly occurring on construction sites. The real conditions were chosen deliberately so that the values obtained by measurements are values that can be realistically expected on construction sites. The values obtained by calculation or measurement in laboratory conditions subsequently differ in most cases from the values measured directly on the construction site. These differences are caused by a number of factors, such as lateral transmission paths, jammed wiring, etc.
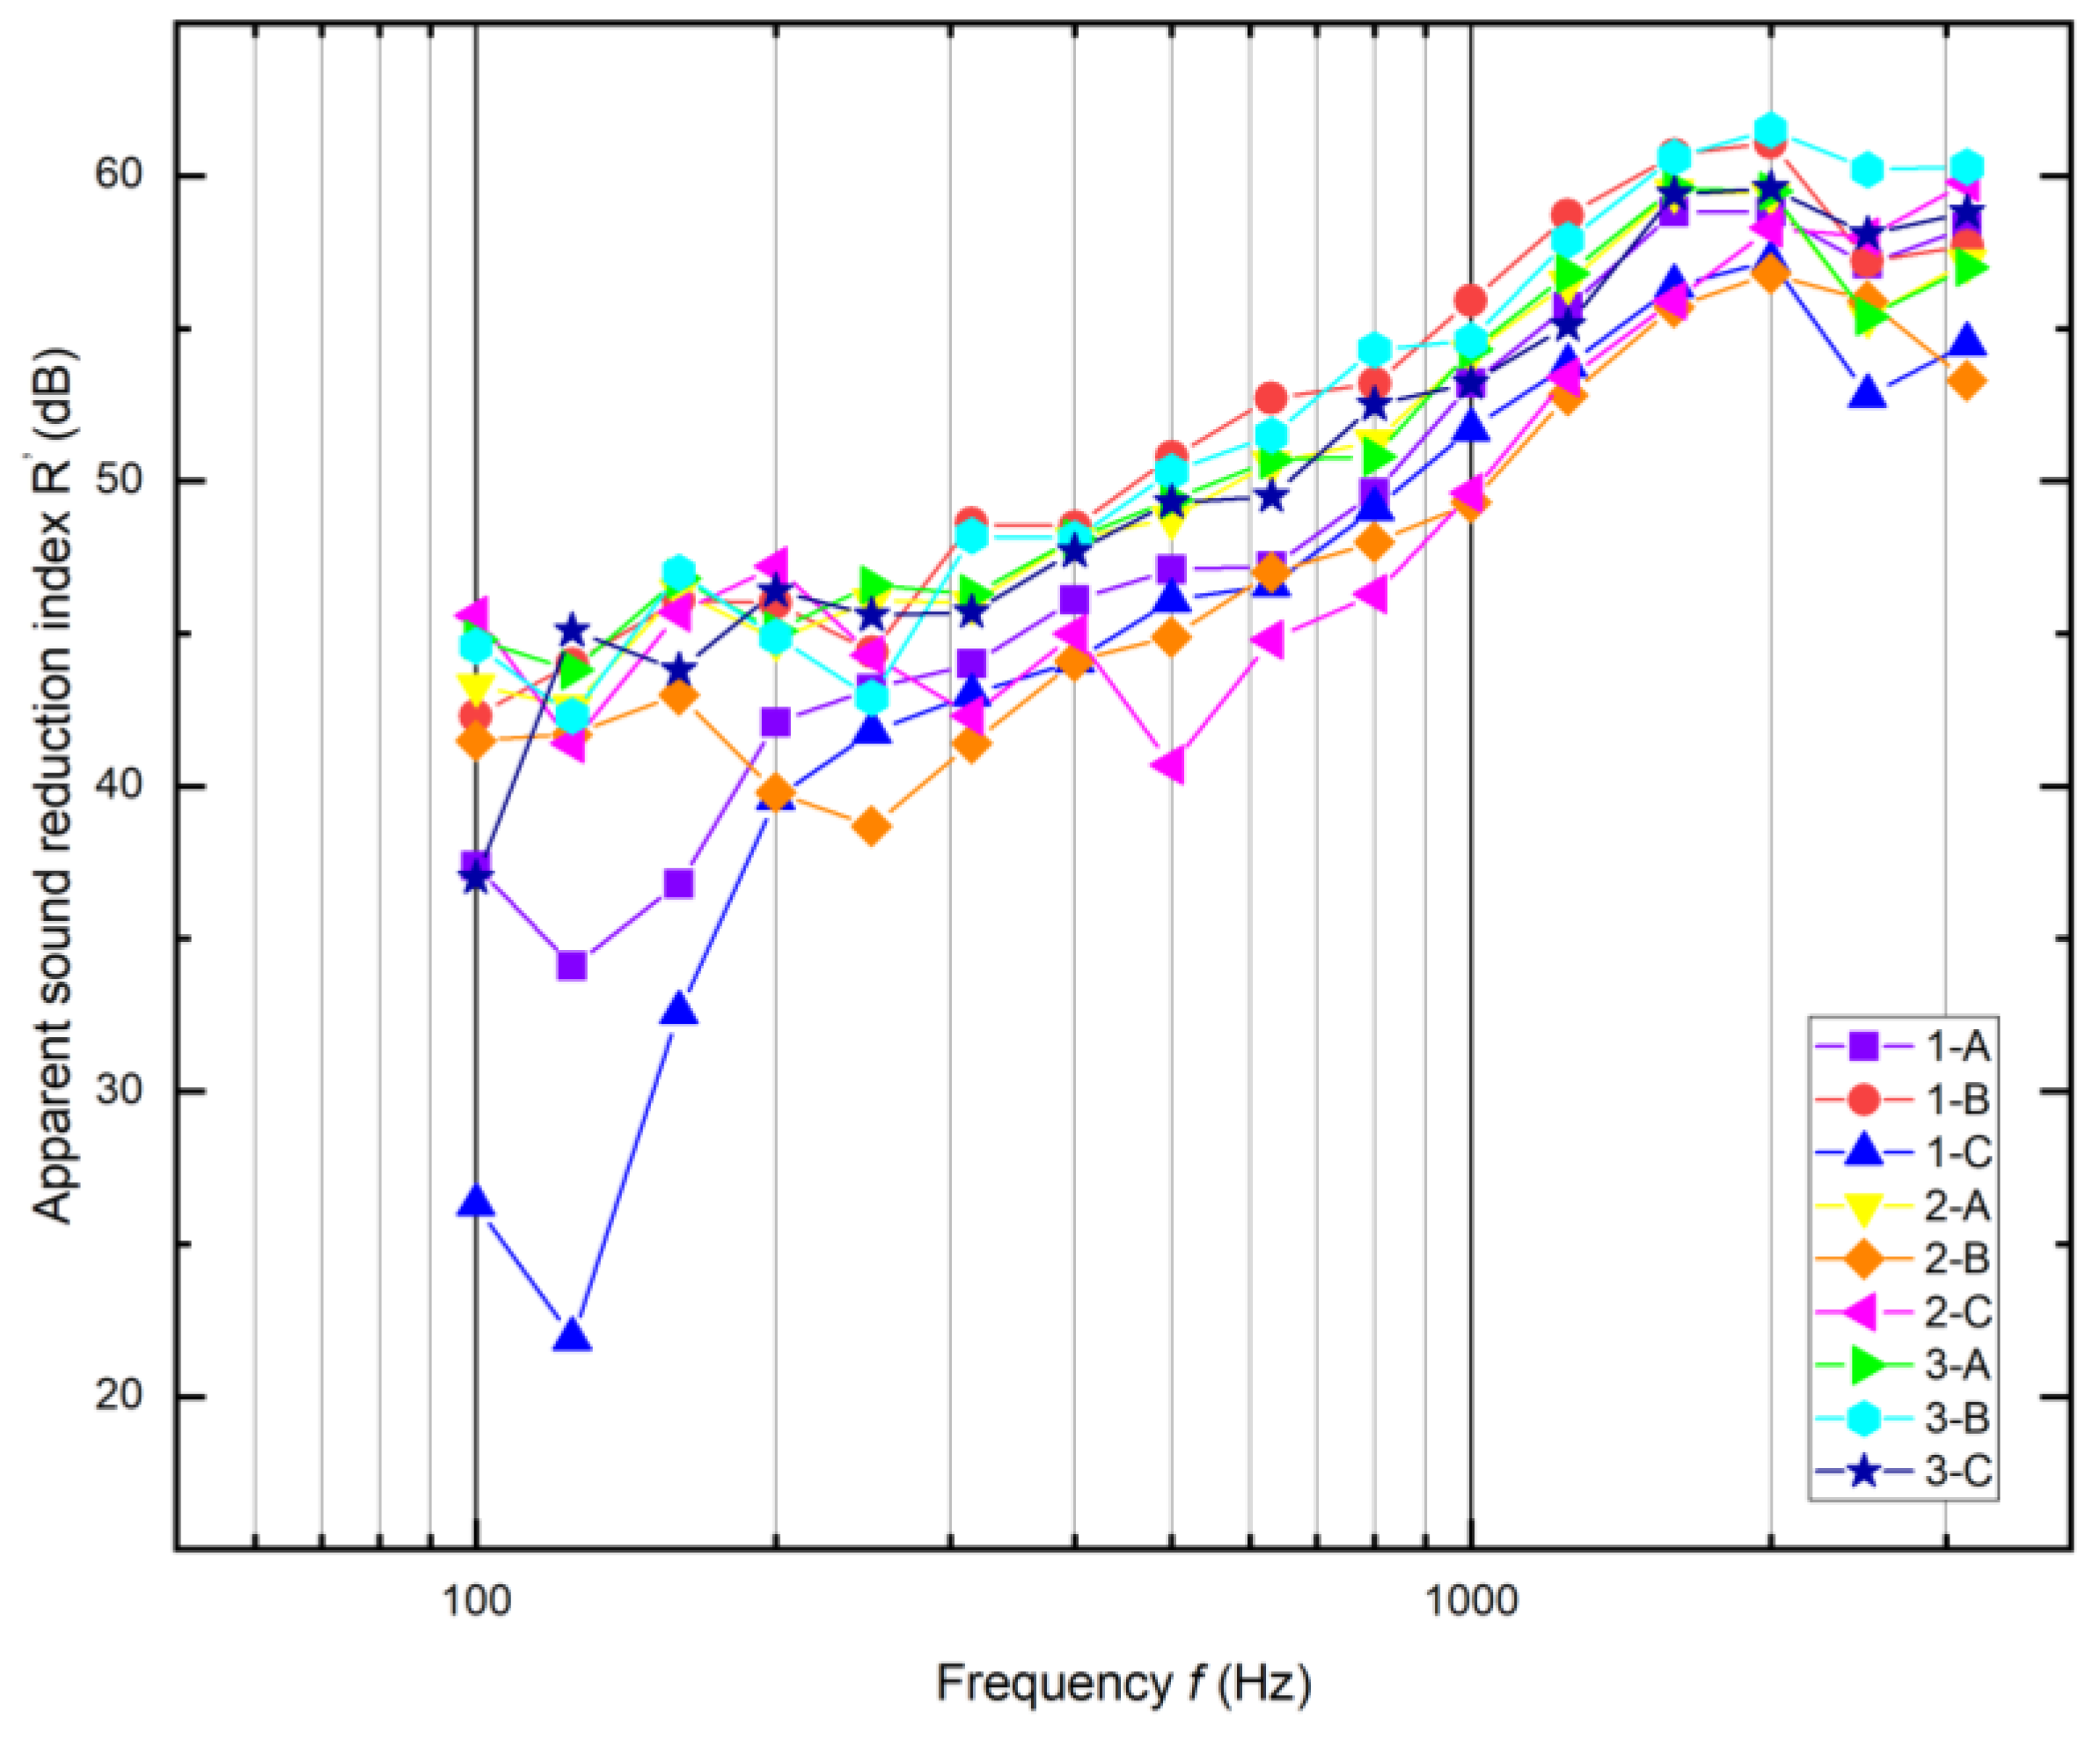
The results of the apparent sound reduction index measurement for nine different partition structures are shown in the following
Figure 3 and
Table 2. During the measurement, the background noise level was in the range from 23.6 up to 27.1 dB (A), and reverberation time was measured and calculated as
T30 in the range from 0.76 up to 0.86 s.
From the results presented in the graph, the values of the apparent sound reduction index R’ at individual frequencies in the range of 100–3150 Hz were compared. The table also shows a single number rating—weighted apparent sound reduction index for each dividing partition. Based on these data, the acoustic quality of the assessed dividing structures was also assessed.
In the standard STN 73 0532 [
31], the requirements for individual types of partition structures that are applied in buildings are listed. This standard specifies the required
R’w values of partition structures for individual types of adjacent spaces.
Based on the results of measurements and the determination of the R’w value, and based on the requirements of the standard, a specific evaluated partition structure for the given application was designed.
Based on the above facts, the application of selected partition structures for the following purposes are presented:
partition structure 1–C is suitable as a partition in apartments between individual rooms (
Figure 4);
the dividing structure 1–B is suitable as a partition between apartments (
Figure 5);
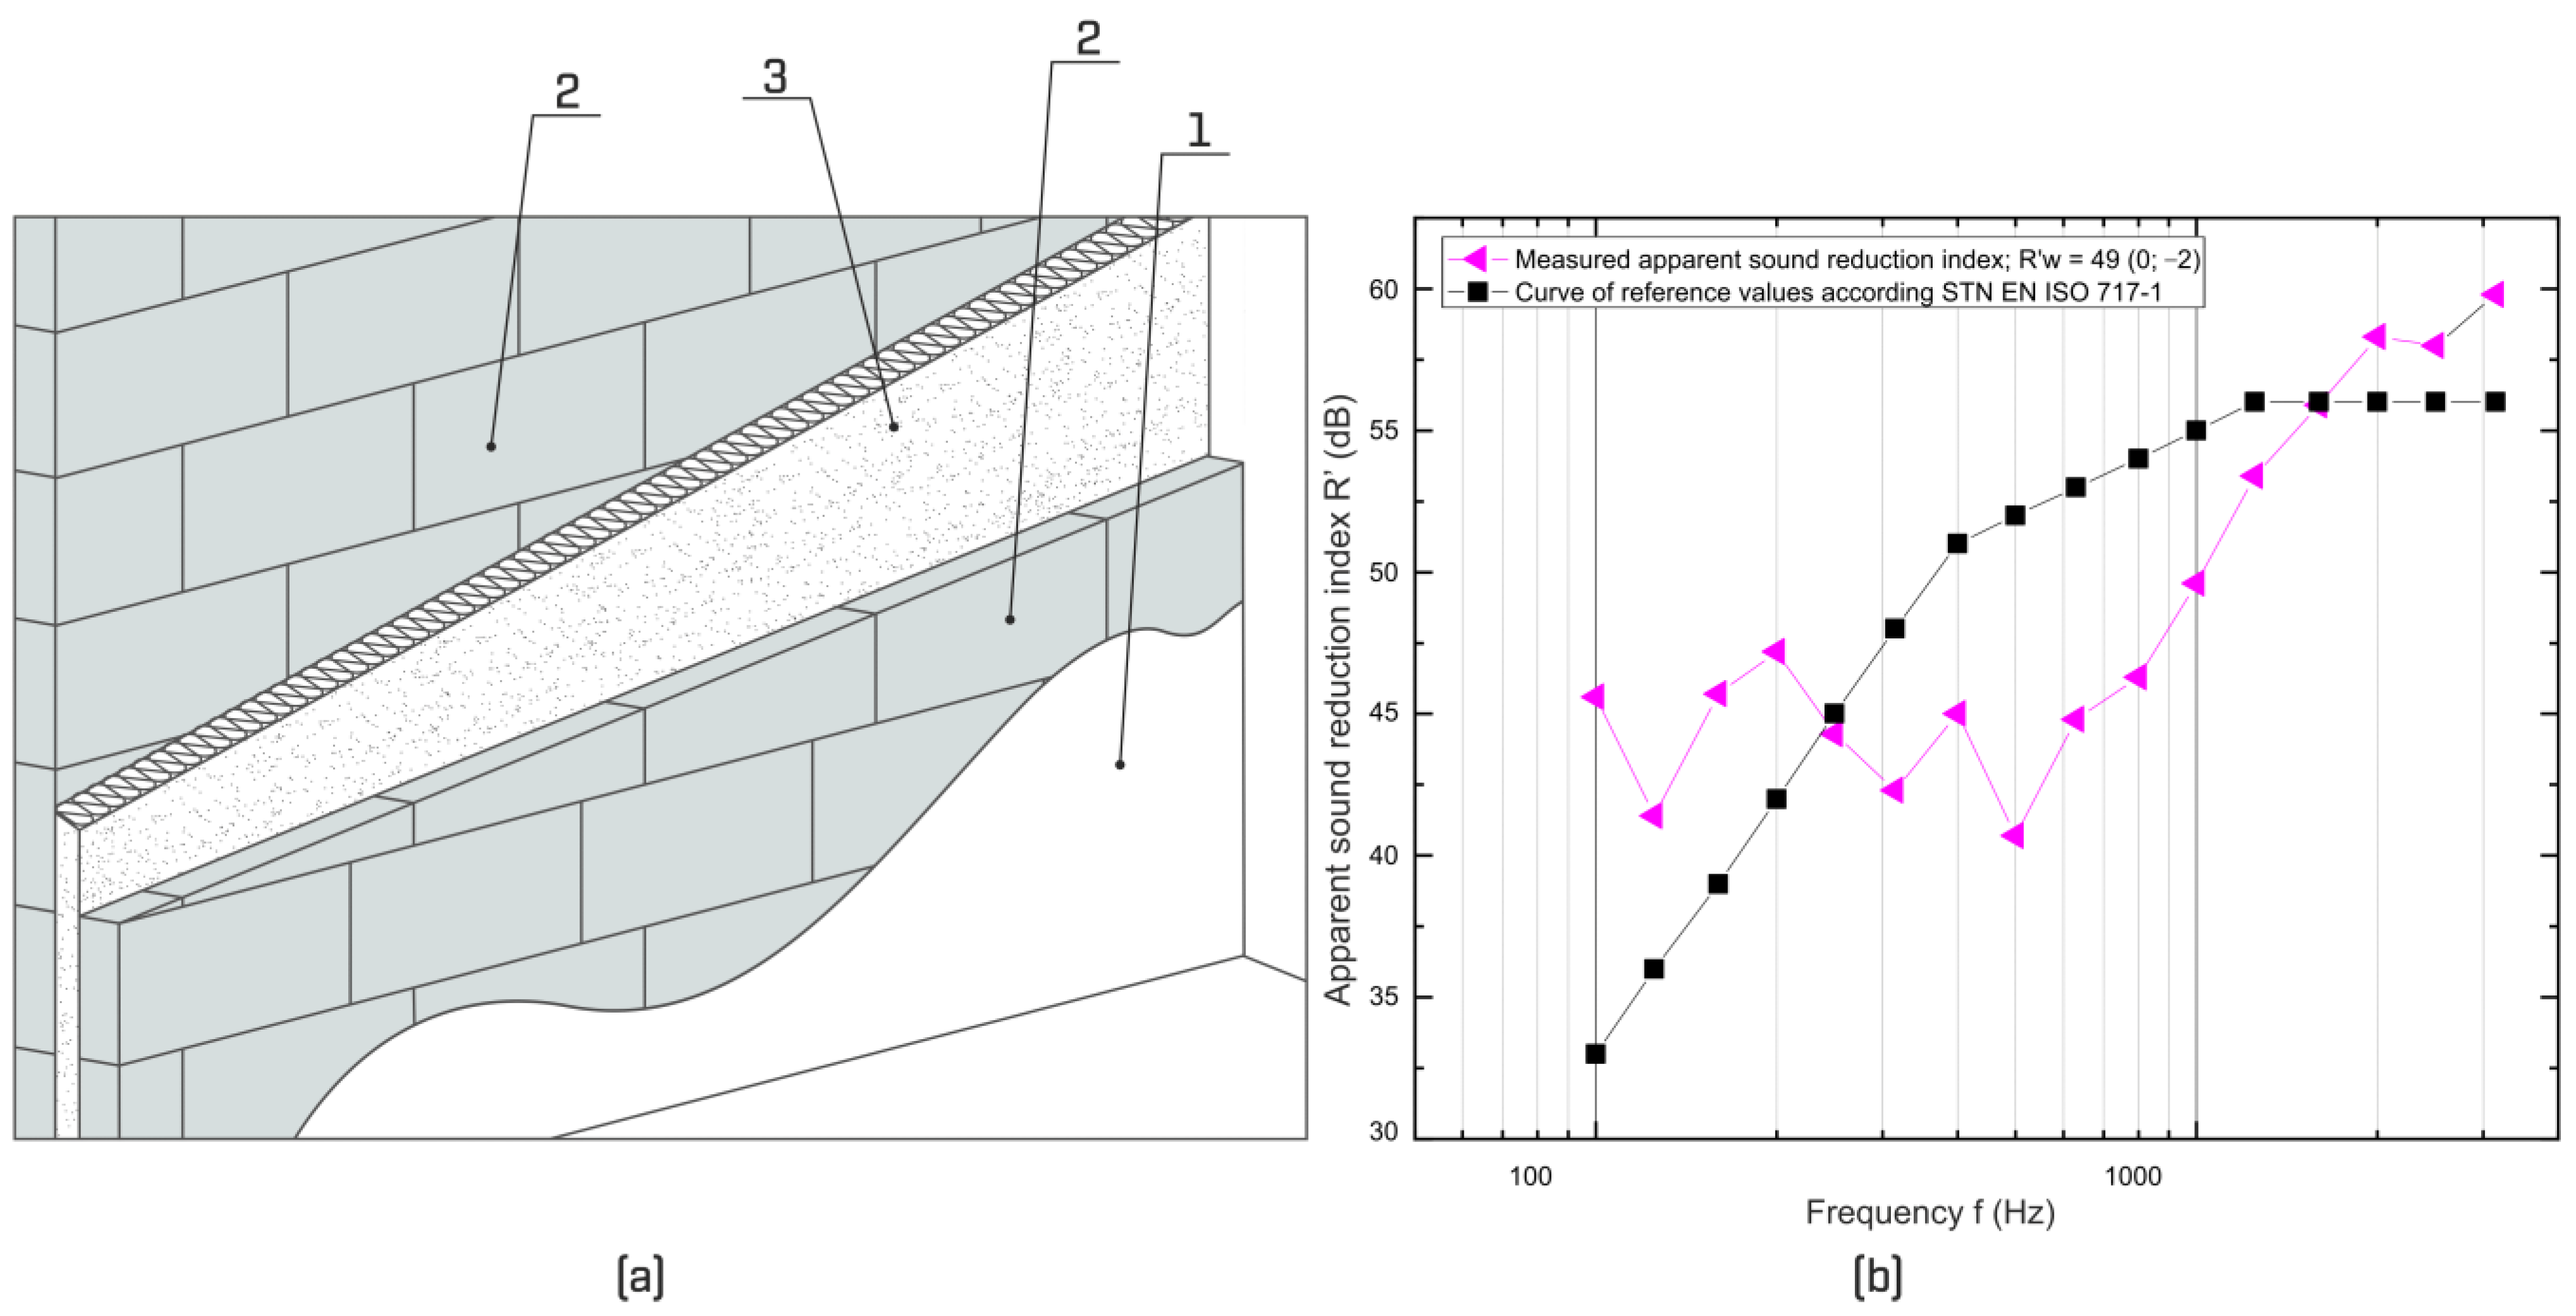
the 2-C partition structure is suitable as a partition in hotels or offices (
Figure 6).
The 1–C dividing structure achieves a value of
R’w = 48 dB (
Figure 4;
Table 2). This type of partition structure can be applied in residential buildings as a partition between rooms of the same apartment. The total thickness of the dividing structure was 162.5 mm. The standard requires a value of
R’w = 42 dB. Based on the results obtained, it can be clearly stated that the best results were achieved with the vertical partition structure 1–B with a total thickness of 335.0 mm (
Figure 5;
Table 2). The dividing structure 1–B achieves a value of
R’w = 55 dB. This type of partition structure can be applied as a partition between apartments in residential buildings. The standard requires a value of
R’w = 53 dB. Dividing structure 2–C (270.0 mm) achieves
R’w = 49 dB (
Figure 6;
Table 2). This type of partition structure can be applied as a partition in hotels between rooms or in administrative buildings between offices. The standard requires a value of
R’w = 47 dB. In
Table 3 are listed required values of sound insulation between rooms in buildings in accordance with STN 73 0532.
Figure 4,
Figure 5 and
Figure 6 present the composition of these dividing structures and also the results of the apparent sound reduction index measurement.
When choosing a suitable partition structure, price is a very important and often decisive parameter. The 1–B dividing structure, which achieved the best values for airborne sound insulation, is the most financially demanding in terms of implementation costs (108.11 EUR/m2), including labor costs. Construction 1–C comes to 75.33 EUR/m2, including labor costs. The best in terms of construction costs is the 2–C partition structure (68.96 EUR/m2), including labor costs, but the disadvantage is the relatively long construction time and complicated implementation of the partition structure, as it is necessary to mortar two separate walls.
The results of the measurements are valid only if the correct technological procedures are followed in the construction of individual parts of the partition structures (i.e., the construction of the masonry part, the installation of a pre-wall, or the installation of an acoustic membrane) and also without any interventions in any part of the partition structure that could disturb the integrity, such as water distribution, electrical wiring, etc. It is also important to connect the partition wall to the perimeter or adjacent structures, by using flexible elements at the points of contact of the structures around the entire perimeter of the dividing structure.
In the selection of our proposed structures for individual applications, in addition to acoustic properties, economic factors were also taken into account (material price EUR/m2 incl. VAT and labor price EUR incl. VAT) and also the surface weight (kg/m2) of individual types of construction.
4. Statistical Analysis
The apparent sound reduction index
R’ values measured for different profile types for frequencies from 100 to 3150 Hz are compared using Variance Analysis (ANOVA). The assumptions for the use of the test are verified both graphically and by tests—the normality condition is verified by the Shapiro–Wilk test and the normal probability p-graph,
Figure 7 (
p > 0.05 for all groups, i.e., at the significance level of 0.05, the null hypothesis of the normality of the distribution is not rejected). The Leven test of equality of variances,
Table 4, was used to verify the homogeneity condition; since the
p-value is greater than the significance level of 0.05, the hypothesis of equality of variances cannot be rejected at this level.
The results of ANOVA are in
Table 5,
p = 0.0839 > 0.05; i.e., at the significance level of 0.05, the null hypothesis of equality of mean values cannot be rejected. There is no statistically significant difference between the mean values of the apparent sound reduction index
R’ for different types of profiles.
When comparing individual types of profiles, statistical analysis was used to determine which parameter has a significant impact on the resulting value of the weighted apparent sound reduction index (
Y =
R’
w). The statistically significant parameters are the total thickness of the dividing structure (
X1) and the number of layers (
X2). When examining the dependence, the thicknesses of other layers of individual structural partitions (load-bearing and partition blocks, plasterboard acoustic board, acoustic mineral wool) were examined, but these were not proven to be statistically significant parameters. The statistical analysis also included price/m
2 and area weight kg/m
2, which have no impact on the value of the
R’
w parameter for the structures which were monitored. The relationship between the dependent variable Y and the independent explanatory variables
X1 and
X2 can be modelled as a linear combination of independent variables and an absolute term. The equation of the proposed regression model for the variable
R’
w =
Y (3) is:
For the dependence of
R’
w on the total profile thickness and the number of layers, the absolute term is stated as
α0 = 43.5929, the index
R’
w for the total profile thickness is stated as
α1 = 0.0160 and for the number of layers
α2 = 0.6050 (4) is estimated as:
The results of the regression analysis are presented in
Table 6.
The value of the regression coefficient of 0.0160 means that if the total thickness of the partition structure is increased by 1 mm (the number of layers does not change), then the value of R’w will increase by an average of 0.0160 dB. Similarly, if the number of layers is increased by one, the R’w increases by an average of 0.6050 dB. For both coefficients (α1,α2), the p-value is less than 0.05, which means that both variables (X1,X2) contribute significantly to the change in R’w. The value of the regression coefficient α2 is greater than the value of the coefficient α1, but it does not mean that the number of layers has a greater effect on the weighted apparent sound reduction index.
The variables are measured in different units, so standardization of the variables is necessary for comparison. The values of the standardized coefficients,
β* and
β, are shown in
Table 6. These values indicate that if the total thickness of the profile is increased by one standard deviation (by 116.33 mm), the
R’
w will increase by an average of 0.6601 standard deviations, i.e., by 1.8615 dB. If the number of layers is increased by one standard deviation,
R’
w increases by an average of 0.5986 standard deviations, i.e., by 1.6881 dB. Estimates of standardized regression coefficients are positive, and based on this, it can be argued that both variables have a positive relationship with the weighted apparent sound reduction index. The coefficient of determination is 0.6845, which means that this model explains 68.45% of the changes in the dependent variable
R’
w.
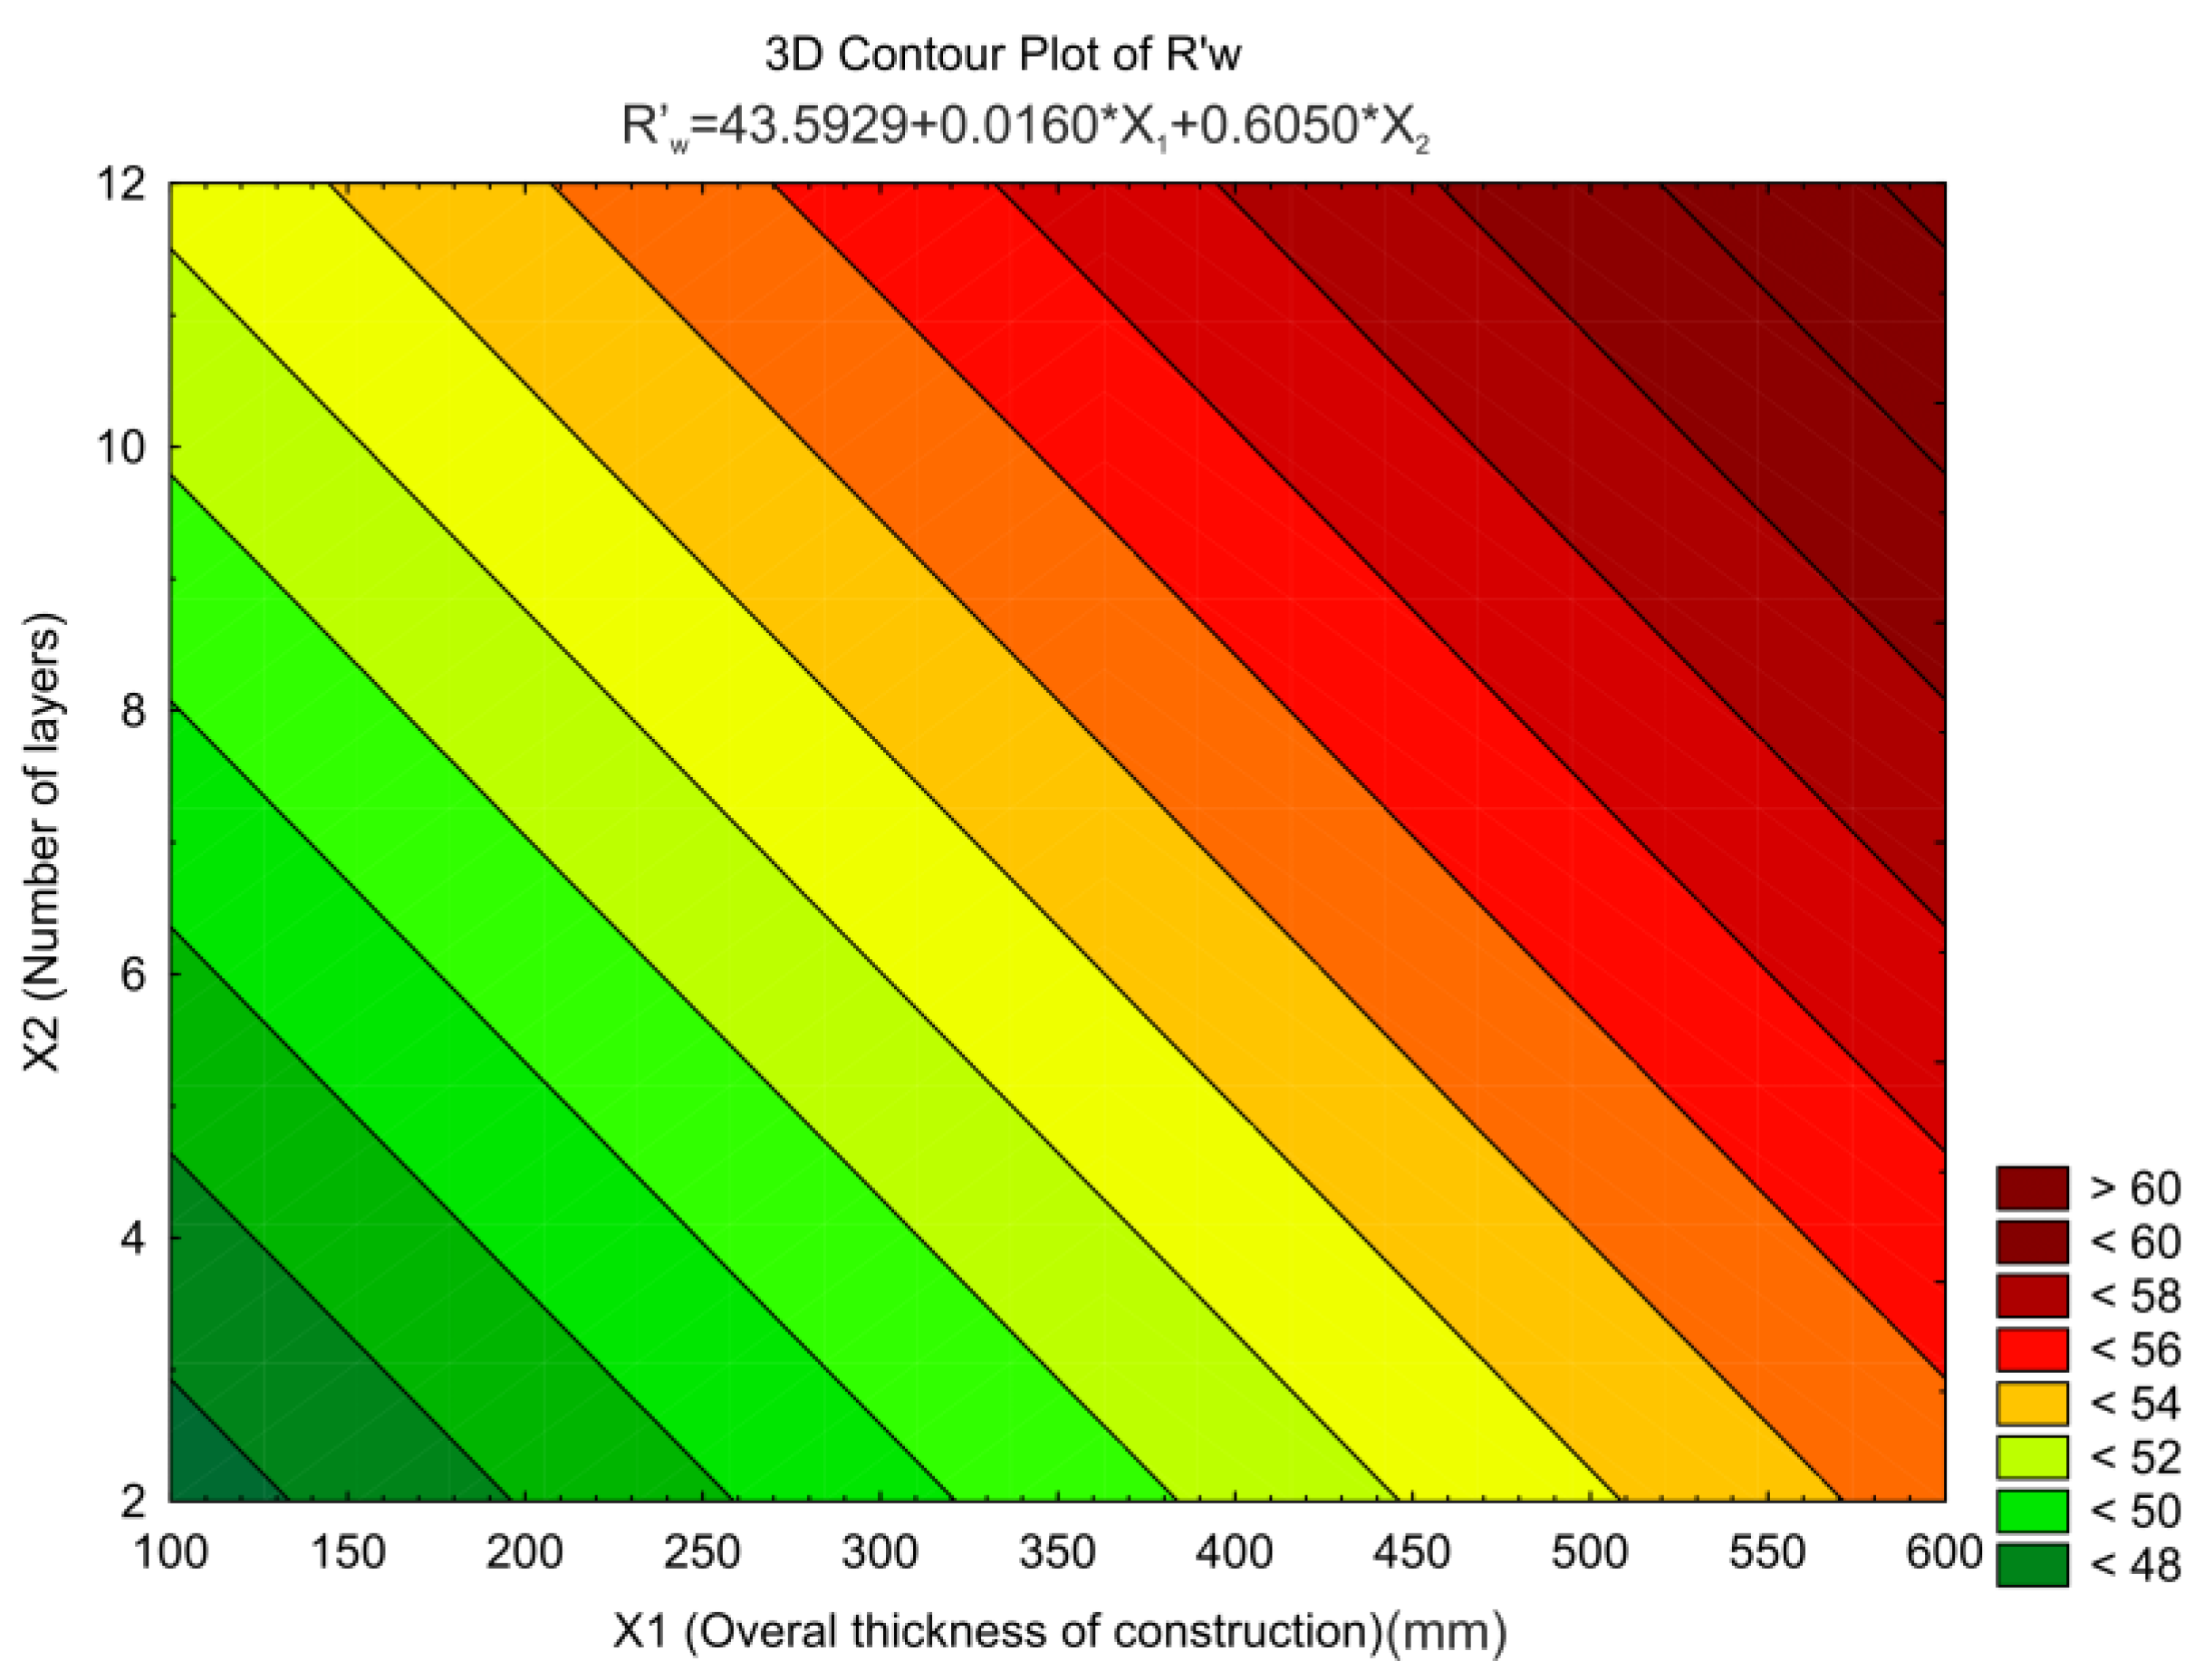
The contour plot visualizes the functional dependence of the variables—the dependent variable
Y (
R’
w) on the independent variables
X1 and X
2,
Figure 8. The graph shows values of the
Y variable for combinations of the
X1 and X
2 variables. The X
1 and X
2 values are displayed along the
X- and
Y-axes, while contour lines and bands represent the
Y value.
5. Discussion
Measurements of nine different compositions of dividing structures were carried out. These measurements were subsequently evaluated and statistically processed. Based on the results of the weighted apparent sound reduction index measurement, the acoustic quality of individual partition structures was determined. The lowest R’w values of 48 dB are achieved by the 1–C dividing structure. This partition was the thinnest and consisted of five layers. The highest R’w values, of 55 dB, are achieved by the 1–B and 3–B partition structures. These structures were 335 mm or 570 mm thick with five or six layers.
Relatively low R’w values of 49 dB are achieved by the 2–B and 2–C designs, despite their total thicknesses of 270 mm. These partition structures have three or five layers. In these partition structures, the layering of several types of materials is absent.
Designs 2–A, 3–A, and 3–C achieve an R’w of 54 dB. All three structures have similar thicknesses of 263–285 mm. Structures 2–A and 3–A consist of 10 or 12 layers, while the 3–C structure consists of only 6 layers. In the 3–C design, a 200 mm block is used, while in the 2–A and 3–A design, 100 mm blocks are used.
This analysis shows that the overall thickness of the structure has an impact on the increase in the R’w value. The impact of the overall thickness of the structure on the improvement of R’w was expected.
Based on the measurements and analyses carried out, it was concluded that the increase in the apparent sound reduction index (R’) of the dividing structures can be achieved by two basic approaches:
Method 1—a significant increase in the surface weight of the solid materials used. The disadvantage of this method is the greater load on the structures, an increase in the thickness of the dividing structure, and therefore a decrease in the area of space. Another problem is that the increase in surface weight cannot continue indefinitely in order to achieve the required soundproofing parameters. At the same time, with an increase in the surface weight of rigid building materials, the thermal insulation properties of building elements deteriorate, so that the two key properties are mutually exclusive.
Method 2—creating a composite or acoustically multiple structure, i.e., a structure made of two or more structures that are separated from each other around the perimeter and in the area. The sound insulation is enhanced by the combination of soft and rigid materials with different material densities and air gaps. The author [
32] states that air space for a single layer of wallboard attached to a concrete block wall for countering the low-frequency mass-air-mass resonances, induction of absorbent material in the cavity plays a prominent important role in enhancing the sound insulation properties. Appropriate combinations incorporating structural breaks and added mass can significantly enhance the sound insulation characteristics, as Bradley, J.S. and Birta, J.A.’s [
33] investigations for wood studded exterior walls revealed. At each interface of materials, sound loses some of its energy, and thereby there is an increase in sound insulation. The result is a partition structure with significantly better sound insulation parameters than an acoustically simple structure. The validated theoretical models [
16,
34] on the prediction of sound transmission characteristics of multilayered walls using their material physical properties can help devise the optimum configurations, having very high sound insulation characteristics while keeping in view the economic, structural and practical constraints. The second method using a combined structure (rigid wall + light pre-wall) is an effective solution. The main advantages are the relatively simple implementation and the possibility of implementation later, i.e., even after the building has been handed over for use. This method enables the achievement of higher values of air sound insulation without interfering with the basic structure, and at the same time without significantly occupying the area of the space or additional significant static load.
6. Conclusions
At present, in the construction of apartment buildings and multipurpose buildings, increasing emphasis is being placed on structural acoustics, with airborne sound insulation being the decisive parameter, which was the reason for carrying out experimental measurements of vertical partition structures with various compositions.
The airborne sound insulation of multiple dividing structures is influenced by:
surface weight of the materials used (the higher the surface weight, the better sound insulation),
number of layers of cladding (flaps),
the method of connecting individual structures (light metal profiles are suitable, partial connection with glue or a similar mass is inappropriate),
air gap (the larger the gap, the better the sound insulation—valid up to a width of 200 mm),
air gap filling (the lower the dynamic stiffness of the material, the better it dampens sound),
the method of stripping the structure from adjacent dividing structures (elimination of sound transmitted by side paths).
The proposed sound insulation structure will help meet the requirements set by the standards. Thus, it is imperative to design the best sandwich material configurations, having high sound insulation to achieve the targets. It is also important that clarity in the description of requirements for the minimum insulation required and for acoustic comforts [
32]. The conducted research on sound insulation of multi-layer partition structures has shown that a suitable combination of materials used can positively affect the elimination of noise, or specifically the frequency of noise propagating in buildings. Such a solution will contribute to the psychoacoustic well-being of a person in a space.
Available data on sound insulation characteristics of building materials can be very beneficial for engineers and architects in the selection of suitable building materials.
The results of experimental measurements show that it is very difficult to design a partition structure that would have high airborne sound insulation, minimal thickness so as not to reduce the area of space and at the same time low implementation costs. Based on the above, it would be appropriate to continue this method of measurements and propose other compositions of partition structures. Combining different types of materials with different thicknesses within the composition of one partition structure could bring interesting results.
Author Contributions
Conceptualization, M.M., M.P. and G.I.; methodology, M.M., M.P., G.I. and M.B. (Miroslav Badida); software, G.I.; validation, M.M., M.P. and G.I.; formal analysis, M.P., and M.B. (Miroslava Badidova); investigation, M.M., M.P. and G.I.; resources, M.M. and G.I.; data curation, M.M. and M.P.; writing—original draft preparation, M.M., M.P. and G.I.; writing—review and editing, M.M., M.P., M.B. (Miroslava Badidova) and G.I.; visualization, M.P.; supervision, M.M. and M.B. (Miroslav Badida); project administration, M.B. (Miroslav Badida); funding acquisition, M.B (Miroslav Badida). All authors have read and agreed to the published version of the manuscript.
Funding
This research received no external funding.
Data Availability Statement
The original contributions presented in the study are included in the article, further inquiries can be directed to the corresponding authors.
Acknowledgments
This work was supported by the projects of the Scientific Grant Agency of the Ministry of Education, Science, Research and Sport of the Slovak Republic project UNIVNET No. 0201/0004/20 and with the support from the project titled KEGA No. 013TUKE-4/2022: Implementation of the results of scientific research into the elaboration of a modern university textbook “Psychoacoustics—sound quality and acoustic design of products” and VEGA 1/0485/22: Development of methods for increasing the acoustic quality of product sound by visualization and psychoacoustic methods and KEGA No. 020TUKE-4/2023: Systematic development of the competence profile of students of industrial and digital engineering in the process of higher education.
Conflicts of Interest
The authors declare no conflicts of interest.
References
- Maxham, R.E. The Contributions of Joseph Sauveur (1653–1716) to Acoustics; University of Rochester: Rochester, NY, USA, 1976. [Google Scholar]
- Chladni, E.F.F. Die Akustik, 1st ed.; Breitkopf & Härtel: Leipzig, Germany, 1802. [Google Scholar]
- Chladni, E.F.F. Treatise on Acoustics; Springer: Cham, Switzerland, 2015. [Google Scholar]
- Tyndall, J. Sound; Cambridge University Press: Cambridge, UK, 2014. [Google Scholar]
- Moyer, D.L. Riverbank Acoustical Laboratories. J. Acoust. Soc. Am. 2001, 109, 2328. [Google Scholar] [CrossRef]
- Butkus, D.; Janusevicius, T.; Grubliauskas, R. Experimental test of acoustic properties of internal wall construction elements. In Proceedings of the 7th International Conference on Environmental Engineering, Vilnius, Lithuania, 22–23 May 2008; pp. 78–84. [Google Scholar]
- Kosala, W.V.R.; Vilasini, P.P.G.N.; Gamage, J.R. Comfort study of work environment of apparel industry. In Proceedings of the IEEE International Conference on Industrial Engineering and Engineering Management, Singapore, 6–9 December 2011; pp. 789–793. [Google Scholar]
- Quintana-Gallardo, A.; Alba, J.; Del Rey, R.; Crespo-Amorós, J.E.; Guillén-Guillamón, I. Life-cycle assessment and acoustic simulation of drywall building partitions with bio-based materials. Polymers 2020, 12, 1965. [Google Scholar] [CrossRef] [PubMed]
- Alonso, A.; Patricio, J.; Suárez, R.; Escandón, R. Acoustical retrofit of existing residential buildings: Requirements and recommendations for sound insulation between dwellings in Europe and other countries worldwide. Build. Environ. 2020, 174, 106771. [Google Scholar] [CrossRef]
- Garg, N.; Gautam, C.; Devi, A. Airborne Sound Insulation of Sandwich Partition Panels and Masonry Constructions for Noise Control. Mapan J. Metrol. Soc. India 2023, 38, 729–743. [Google Scholar] [CrossRef]
- Yu, C.J.; Kang, J. Environmental impact of acoustic materials in residential buildings. Build. Environ. 2009, 44, 2166–2175. [Google Scholar] [CrossRef]
- Fayyad, U.; Uthurusamy, R. Data Mining and Knowledge Discovery in Databases. Commun. ACM 1996, 39, 24–26. [Google Scholar] [CrossRef]
- Fayyad, U.; Piatetsky-Shapiro, G.; Smyth, P. From data mining to knowledge discovery in databases. AI Mag. 1996, 17, 37–54. [Google Scholar]
- Garg, N.; Kumar, A.; Maji, S. Parametric sensitivity analysis of factors affecting sound transmission loss of multi-layered building elements using Taguchi method. Arch. Acoust. 2014, 39, 165–176. [Google Scholar] [CrossRef]
- Yang, M. A review of regression analysis methods: Establishing the quantitative relationships between subjective soundscape assessment and multiple factors. In Proceedings of the International Congress on Acoustics, Aachen, Germany, 9–13 September 2019; pp. 6122–6128. [Google Scholar]
- Kurra, S. Comparison of the models predicting sound insulation values of multilayered building elements. Appl. Acoust. 2012, 73, 575–589. [Google Scholar] [CrossRef]
- Moravec, M.; Liptai, P.; Dzuro, T.; Badida, M. Design and Effectiveness Verification of Sound Reduction Measures in Production Hall. Adv. Sci. Technol. Res. J. 2017, 11, 220–224. [Google Scholar]
- Gumanova, V.; Sobotova, L.; Dzuro, T.; Badida, M.; Moravec, M. Experimental Survey of the Sound Absorption Performance of Natural Fibres in Comparison with Conventional Insulating Materials. Sustainability 2022, 14, 4258. [Google Scholar] [CrossRef]
- Moravec, M.; Badida, M.; Mikusova, N.; Sobotova, L.; Svajlenka, J.; Dzuro, T. Proposed Options for Noise Reduction from a Wastewater Treatment Plant: Case Study. Sustainability 2021, 13, 2409. [Google Scholar] [CrossRef]
- Badida, M.; Moravec, M.; Pinosova, M.; Andrejiova, M.; Pástor, K.; Nováková, A.; Dzuro, T. Analysis and Research on the Use of Bulk Recycled Materials for Sound Insulation Applications. Sustainability 2022, 14, 11539. [Google Scholar] [CrossRef]
- Švajlenka, J.; Kozlovská, M.; Badida, M.; Moravec, M.; Dzuro, T.; Vranay, F. Analysis of the characteristics of external walls of wooden prefab cross laminated timber. Energies 2020, 13, 5974. [Google Scholar] [CrossRef]
- Badida, M.; Sobotova, L.; Badidova, A.; Moravec, M.; Mikulova, A. Research of chosen acoustics descriptors of developed materials from old automobile recycled materials. Recycling 2018, 3, 29. [Google Scholar] [CrossRef]
- Žuľová, L.; Grega, R.; Krajňák, J.; Fedorko, G.; Molnár, V. Optimization of noisiness of mechanical system by using a pneumatic tuner during a failure of piston machine. Eng. Fail. Anal. 2017, 79, 845–851. [Google Scholar] [CrossRef]
- Neri, M. Thermal and Acoustic Characterization of Innovative and Unconventional Panels Made of Reused Materials. Atmosphere 2022, 13, 1825. [Google Scholar] [CrossRef]
- Cottone, R.; Shtrepi, L.; Serra, V.; Pagliolico, S.L. The Recycling and Reuse of Natural Materials: Sound Absorbing Box Patterns That Use Waste from Olive Tree Pruning. Acoustics 2023, 5, 177–192. [Google Scholar] [CrossRef]
- Paul, P.; Ahirwar, M.; Behera, B.K. Acoustic behaviour of needle punched nonwoven structures produced from various natural and synthetic fibers. Appl. Acoust. 2022, 199, 109043. [Google Scholar] [CrossRef]
- Krajňák, J.; Homišin, J.; Grega, R.; Urbanský, M. The analysis of the impact of vibrations on noisiness of the mechanical system. Diagnostyka 2016, 17, 21–26. [Google Scholar]
- IEC 61672-1:2013; Electroacoustics—Sound level meters—Part 1: Specifications. International Electrotechnical Commission: Geneva, Switzerland, 2013.
- STN EN ISO 16283-1 (730514); Acoustics—Field Measurement of Sound Insulation in Buildings and of Building Elements—Part 1: Airborne Sound Insulation. International Organization for Standardization: Geneva, Switzerland, 2014.
- STN EN ISO 3382-2: 2009 (730534); Acoustics—Measurement of Room Acoustic Parameters—Part 2: Reverberation Time in Ordinary Rooms (ISO 3382-2: 2008). International Organization for Standardization: Geneva, Switzerland, 2008.
- STN 73 0532; Acoustics—Acoustics. Rating of Sound Insulation in Buildings and of Building Elements. Requirements. Slovak Institute of Technical Standardization: Bratislava, Slovakia, 2013.
- Garg, N.; Kumar, A.; Maji, S. Significance and implications of airborne sound insulation criteria in building elements for traffic noise abatement. Appl. Acoust. 2013, 74, 1429–1435. [Google Scholar] [CrossRef]
- Bradley, J.S.; Birta, J.A. On the sound insulation of wood stud exterior walls. J. Acoust. Soc. Am. 2001, 110, 3086–3096. [Google Scholar] [CrossRef]
- Ballagh, K.O. Accuracy of prediction methods for sound transmission loss. In Proceedings of the 33rd International Congress and Exposition on Noise Control Engineering, Prague, Czech Republic, 22–25 August 2004; pp. 1–8. [Google Scholar]
Figure 1.
Test environment floor plan. Dimensions are in millimeters.
Figure 1.
Test environment floor plan. Dimensions are in millimeters.
Figure 2.
Test environment.
Figure 2.
Test environment.
Figure 3.
Comparison of measurement results.
Figure 3.
Comparison of measurement results.
Figure 4.
Dividing structure 1–C. (a) The composition of the partition structure in the section: 1—acoustic plasterboard, 2—acoustic mineral wool in the substructure, 3—air gap, 4—lime-cement plasters, 5—aerated concrete block; (b) results of weighted structural sound insulation under real conditions.
Figure 5.
Dividing structure 1–B. (a) The composition of the partition structure in the section: 1—acoustic plasterboard, 2—acoustic membrane, 3—acoustic mineral wool in the substructure, 4—air gap, 5—lime-cement plasters, 6—aerated concrete block; (b) results of weighted structural sound insulation under real conditions.
Figure 6.
Dividing structure 2–C. (a) The composition of the partition structure in the section: 1—lime-cement plasters (frontside/backside), 2—acoustic mineral wool, 3—aerated concrete block; (b) Results of weighted structural sound insulation under real conditions.
Figure 6.
Dividing structure 2–C. (a) The composition of the partition structure in the section: 1—lime-cement plasters (frontside/backside), 2—acoustic mineral wool, 3—aerated concrete block; (b) Results of weighted structural sound insulation under real conditions.
Figure 7.
Verification of the condition of normality of the data layout. 1,2,3—series of measurements, A,B,C—designation of the structure, SW–W—test characteristic of the Shapiro–Wilk test, p—p-value.
Figure 7.
Verification of the condition of normality of the data layout. 1,2,3—series of measurements, A,B,C—designation of the structure, SW–W—test characteristic of the Shapiro–Wilk test, p—p-value.
Figure 8.
Contour plot of the combined effects of the total thickness of the dividing structure (X1) and the number of layers (X2) on R’w.
Figure 8.
Contour plot of the combined effects of the total thickness of the dividing structure (X1) and the number of layers (X2) on R’w.
Table 1.
Composition of dividing structures.
Table 1.
Composition of dividing structures.
| Designation of the Structure | Composition of the Partition Structure
(Order of Layering of the Partition in the
Direction from Source Room to Receiving Room 1,2,3) | Area Weight (kg/m2) | Layer Thickness (mm) | Material Price (EUR/m2 Incl. VAT) | Number of Layers |
|---|
| 1–A | drywall acoustic board | 12.0 | 12.50 | 6.22 | 7 |
| drywall acoustic board | 12.0 | 12.50 | 6.22 |
| acoustic membrane | 5.0 | 2.50 | 23.96 |
| acoustic mineral wool | 0.80 | 50.0 | 2.68 |
| air gap | 0.012 | 10.0 | – |
| smooth aerated concrete block | 54.4 | 100.0 | 16.96 |
| cement glue | 1.20 | 3.0 | 1.41 |
| | | 85.41 | 190.50 | 57.45 | |
| 1–B | drywall acoustic board | 12.0 | 12.50 | 6.22 | 6 |
| acoustic membrane | 5.0 | 2.50 | 23.96 |
| acoustic mineral wool | 0.80 | 50.0 | 2.68 |
| air gap | 0.012 | 10.0 | – |
| lime-cement plaster | 162.40 | 10.0 | 38.56 |
| aerated concrete supporting block | 14.0 | 250.0 | 2.24 |
| | | 194.21 | 335.0 | 73.66 | |
| 1–C | drywall acoustic board | 12.0 | 12.50 | 6.22 | 5 |
| acoustic mineral wool | 1.20 | 30.0 | 5.82 |
| air gap | 0.012 | 10.0 | – |
| lime-cement plaster | 54.40 | 10.0 | 16.96 |
| smooth aerated concrete block | 14.0 | 100.0 | 2.24 |
| | | 81.61 | 162.5 | 31.24 | |
| 2–A | drywall acoustic board | 12.0 | 12.50 | 6.22 | 10 |
| drywall acoustic board | 12.0 | 12.50 | 6.22 |
| acoustic membrane | 5.0 | 2.50 | 23.96 |
| acoustic mineral wool | 0.80 | 50.0 | 2.68 |
| air gap | 0.012 | 10.0 | – |
| smooth aerated concrete block | 54.4 | 100.0 | 16.96 |
| cement glue | 1.20 | 3.0 | 1.41 |
| air gap | 0.012 | 10.0 | – |
| acoustic mineral wool | 0.80 | 50.0 | 2.68 |
| drywall acoustic board | 12.0 | 12.50 | 6.22 |
| | | 98.22 | 263.0 | 66.35 | |
| 2–B | lime-cement plaster | 14.0 | 10.0 | 2.24 | 3 |
| aerated concrete supporting block | 162.40 | 250.0 | 38.56 |
| lime-cement plaster | 14.0 | 10.0 | 2.24 |
| | | 190.40 | 270.0 | 43.04 | |
| 2–C | lime-cement plaster | 54.40 | 10.0 | 16.96 | 5 |
| smooth aerated concrete block | 14.0 | 100.0 | 2.24 |
| acoustic mineral wool | 0.80 | 50.0 | 2.68 |
| smooth aerated concrete block | 54.4 | 100.0 | 16.96 |
| lime-cement plaster | 14.0 | 10.0 | 2.24 |
| | | 137.60 | 270.0 | 41.08 | |
| 3–A | drywall acoustic board | 12.0 | 12.50 | 6.22 | 12 |
| drywall acoustic board | 12.0 | 12.50 | 6.22 |
| acoustic membrane | 5.0 | 2.50 | 23.96 |
| acoustic mineral wool | 0.80 | 50.0 | 2.68 |
| air gap | 0.012 | 10.0 | – |
| smooth aerated concrete block | 54.4 | 100.0 | 16.96 |
| cement glue | 1.20 | 3.0 | 1.41 |
| air gap | 0.012 | 10.0 | – |
| acoustic mineral wool | 0.80 | 50.0 | 2.68 |
| drywall acoustic board | 12.0 | 12.50 | 6.22 |
| acoustic membrane | 5.0 | 2.50 | 23.96 |
| drywall acoustic board | 12.0 | 12.50 | 6.22 |
| | | 115.22 | 278.0 | 96.53 | |
| 3–B | lime-cement plaster | 14.0 | 10.0 | 2.24 | 5 |
| aerated concrete supporting block | 162.40 | 250.0 | 38.56 |
| acoustic mineral wool | 0.80 | 50.0 | 2.68 |
| aerated concrete supporting block | 162.40 | 250.0 | 38.56 |
| lime-cement plaster | 14.0 | 10.0 | 2.24 |
| | | 353.6 | 570.0 | 84.28 | |
| 3–C | drywall acoustic board | 12.0 | 12.50 | 6.22 | 6 |
| acoustic membrane | 5.0 | 2.50 | 23.96 |
| acoustic mineral wool | 0.80 | 50.0 | 2.68 |
| air gap | 0.012 | 10.0 | – |
| smooth aerated concrete block | 138.40 | 200.0 | 3.64 |
| lime-cement plaster | 14.0 | 10.0 | 2.24 |
| | | 170.21 | 285.0 | 38.74 | |
Table 2.
Measurement results of the apparent sound reduction index.
Table 2.
Measurement results of the apparent sound reduction index.
| Construction | 1–A | 1–B | 1–C | 2–A | 2–B | 2–C | 3–A | 3–B | 3–C |
|---|
| R’w (dB) | 52 (−2; −5) | 55 (−1; −3) | 48 (−3; −9) | 54 (−1; −3) | 49 (0; −3) | 49 (0; −2) | 54 (−1; −3) | 55 (−1; −4) | 54 (−1; −4) |
|---|
| Frequency (Hz) | R’ in ⅓ Octave Bands (dB) |
|---|
| 100 | 37.4 | 42.3 | 26.3 | 43.3 | 41.5 | 45.6 | 44.8 | 44.6 | 37.0 |
| 125 | 34.1 | 44.0 | 21.9 | 42.6 | 41.7 | 41.4 | 43.8 | 42.3 | 45.1 |
| 160 | 36.8 | 46.1 | 32.6 | 46.4 | 43.0 | 45.7 | 46.8 | 47.0 | 43.8 |
| 200 | 42.1 | 46.0 | 39.6 | 44.8 | 39.8 | 47.2 | 45.1 | 44.9 | 46.4 |
| 250 | 43.2 | 44.4 | 41.8 | 46.1 | 38.7 | 44.3 | 46.6 | 42.9 | 45.6 |
| 315 | 44.0 | 48.6 | 43.0 | 46.0 | 41.4 | 42.3 | 46.3 | 48.2 | 45.7 |
| 400 | 46.1 | 48.5 | 44.1 | 48.1 | 44.1 | 45.0 | 48.1 | 48.1 | 47.7 |
| 500 | 47.1 | 50.8 | 46.1 | 48.8 | 44.9 | 40.7 | 49.4 | 50.3 | 49.3 |
| 630 | 47.2 | 52.7 | 46.6 | 50.6 | 47.0 | 44.8 | 50.7 | 51.5 | 49.5 |
| 800 | 49.6 | 53.2 | 49.1 | 51.3 | 48.0 | 46.3 | 50.8 | 54.3 | 52.5 |
| 1000 | 53.2 | 55.9 | 51.7 | 54.2 | 49.3 | 49.6 | 54.3 | 54.6 | 53.2 |
| 1250 | 55.7 | 58.7 | 53.8 | 56.5 | 52.8 | 53.4 | 56.8 | 57.9 | 55.1 |
| 1600 | 58.8 | 60.7 | 56.4 | 59.5 | 55.7 | 55.9 | 59.6 | 60.6 | 59.4 |
| 2000 | 58.8 | 61.1 | 57.2 | 59.4 | 56.8 | 58.3 | 59.5 | 61.5 | 59.6 |
| 2500 | 57.1 | 57.2 | 52.8 | 55.4 | 55.9 | 58.0 | 55.4 | 60.2 | 58.1 |
| 3150 | 58.3 | 57.7 | 54.5 | 57.2 | 53.3 | 59.8 | 57.0 | 60.3 | 58.8 |
Table 3.
Required values of sound insulation between rooms in buildings in accordance with STN 73 0532.
Table 3.
Required values of sound insulation between rooms in buildings in accordance with STN 73 0532.
| Designation of the Structure | R’w (C, Ctr) dB | Requirement in Accordance with STN 73 0532 R’w, DnT,w (dB) | Assessment in Accordance with STN 73 0532 |
|---|
| 1–A | 52 (−2; −5) | 42A 53B 47C | passes for A C; fails for B |
| 1–B | 55 (−1; −3) | suitable for A B C |
| 1–C | 48 (−3; −9) | passes for A C; fails for B |
| 2–A | 54 (−1; −3) | Suitable for A B C |
| 2–B | 49 (0; −3) | passes for A C; fails for B |
| 2–C | 49 (0; −2) | passes for A C; fails for B |
| 3–A | 54 (−1; −3) | suitable for A B C |
| 3–B | 55 (−1; −4) | suitable for A B C |
| 3–C | 54 (−1; −4) | suitable for A B C |
Table 4.
Verification of the condition of homogeneity of variances.
Table 4.
Verification of the condition of homogeneity of variances.
| Variable | Levene Test of Homogeneity of Variances
Marked Effects Are Significant at p < 0.0500 |
|---|
SS
Effect | df
Effect | MS
Effect | SS
Error | df
Error | MS
Error | F | p |
|---|
| R’ | 147.9755 | 8 | 18.4969 | 1802.1690 | 135 | 13.3494 | 1.3856 | 0.2082 |
Table 5.
ANOVA—apparent sound reduction index R’.
Table 5.
ANOVA—apparent sound reduction index R’.
| Variable | Analysis of Variances
Marked Effects Are Significant at p < 0.0500 |
|---|
SS
Effect | df
Effect | MS
Effect | SS
Error | df
Error | MS
Error | F | p |
|---|
| R’ | 712.7881 | 8 | 89.0985 | 6715.0270 | 135 | 49.7409 | 1.7913 | 0.0839 |
Table 6.
Regression summary.
Table 6.
Regression summary.
| N = 9 | Regression Summary for Dependent Variable R′w
R = 0.8275, R2 = 0.6847, Adjusted R2 = 0.5796 |
|---|
| β* | Standard Error of β* | β | Standard Error of β | t(6) | p-Value |
|---|
| Intercept | | 0.2162 | 43.5929 | 2.4688 | 17.6572 | 0.0000 |
| X1 | 0.6601 | 0.2315 | 0.0160 | 0.0056 | 2.8511 | 0.0291 |
| X2 | 0.5986 | 0.2315 | 0.6050 | 0.2340 | 2.5854 | 0.0415 |
| Disclaimer/Publisher’s Note: The statements, opinions and data contained in all publications are solely those of the individual author(s) and contributor(s) and not of MDPI and/or the editor(s). MDPI and/or the editor(s) disclaim responsibility for any injury to people or property resulting from any ideas, methods, instructions or products referred to in the content. |
© 2024 by the authors. Licensee MDPI, Basel, Switzerland. This article is an open access article distributed under the terms and conditions of the Creative Commons Attribution (CC BY) license (https://creativecommons.org/licenses/by/4.0/).


 ,
, 


