1. Introduction
In 2020, the building energy consumption in China accounted for 45.5% of the total energy usage, with the total life cycle of carbon emissions contributing 50.9% of the nation’s energy-related carbon emissions [
1]. By 2021, rural residential energy consumption represented 21% of the country’s total building energy usage, witnessing a shift towards increased electricity consumption over biomass [
2]. Despite rising economic standards, inadequate application of energy-saving techniques in rural self-built homes persists, resulting in a dilemma of high energy usage and subpar comfort.
This paper takes rural folk dwellings in Hanzhong as the research object. Hanzhong City of Shaanxi Province, situated in the zone of hot summers and cold winters, predominantly relies on decentralized heating, leading to a notably higher energy consumption compared to centralized systems [
3]. Hence, prioritizing building energy efficiency is crucial. Liu J. et al. [
4,
5] proposed an eco-adaptive design method tailored for the climate of southern Shaanxi, following qualitative and quantitative analyses of typical rural dwellings. Addressing the challenges of high energy consumption and low resource efficiency, Liu Z. [
6] outlined a research framework for constructing nearly zero-energy green residences in traditional villages.
2. Building Energy Consumption and Low-Carbon Architecture
Utilizing computer simulations and building energy modeling, researchers investigated the intricate relationship between building energy consumption, architectural form, and thermal comfort.
Smith J. et al. [
7] reported on the application of digital design strategies in sustainable rural residential construction, providing practical experience of digital design methods in low-carbon residential building spaces. White M. et al’s. [
8] comprehensive assessment of energy efficiency issues in rural residential buildings provided comprehensive energy efficiency design strategies, covering the application of digital design in reducing building energy consumption. Taylor L. et al. [
9] analyzed the trends and challenges of low-carbon residential construction in rural environments, focusing on the role of digital design technology in achieving low-carbon residential goals. Based on building energy models, Lin B. et al. [
10] optimized the window-to-wall ratio and the thermal performance of the exterior walls of office buildings using genetic algorithms. Si B. et al. [
11] achieved an 11% reduction in building loads and an 8.3% decrease in the Predicted Percentage of Dissatisfied (PPD) by optimizing the envelope structure of a tourist center. Sun C. and Han Y. [
12] proposed an energy-saving design method for office buildings based on neural network predictions and building information modeling.
Through the meta-analysis method, Brown E. et al. [
13] optimized the energy efficiency of building envelope parameters in low-carbon buildings. Wilson D. et al. [
14] optimized the design of sustainable building envelopes using artificial intelligence-driven optimization methods. By leveraging advanced simulation technology, Garcia M. et al. [
15] optimized the performance of energy-efficient building envelopes. Lee H. et al. [
16] used genetic algorithms and big data analysis to optimize the design of low-carbon building envelopes. Cheng, S. et al. [
17] explored the integrated application of building information modeling and machine learning in energy-efficient building design. Bai Y. and Pan Y. [
18] focused on the minimum energy consumption requirements for buildings, using parametric platforms and genetic algorithms to identify the pattern of value variation of window-to-wall ratios and performance parameters for building envelopes. Zhang J. et al. [
19,
20] optimized cooling and heating loads for Beijing residences, proposing a performance-driven approach for generating energy-efficient designs by optimizing 27 parameters related to building envelope structure and spatial form.
By utilizing digital methods guided by low-carbon building performance, and with the aim of reducing energy consumption and improving thermal comfort, as well as optimizing architectural spatial configurations, the pursuit of generative design for low-carbon buildings has emerged as a pivotal research domain. Investigating residential buildings in Hanzhong, of the Shaanxi Province, serves as a valuable exploration within this research paradigm.
3. Characteristics of Folk Dwellings in Hanzhong
Hanzhong, which is situated in a subtropical monsoon climate, maintains an average annual temperature of 14.0 °C. The relative humidity is lower during the winter and spring but escalates in the summer. During the period of 1951 to 2015, the mean temperatures for January, which is the coldest month, and July, which is the hottest month, were recorded at 2.5 °C and 25.7 °C, respectively [
21]. It is classified as a region experiencing hot summers and cold winters by primary-level zoning and designated as Zone A (3A) using secondary zoning. Consequently, architectural designs necessitate insulation and thermal insulation while emphasizing natural ventilation and solar shading.
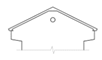
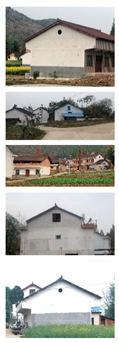
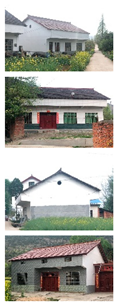
Traditional folk dwellings in Hanzhong have undergone the vicissitudes of time, amalgamating various construction insights to evolve distinctive climate adaptability mechanisms and architectural traits within the local ecological context (
Table 1). The prevalent architectural form, which is characterized by larger upper floors juxtaposed with smaller lower ones, combined with pitched roofs and adobe walls, exemplifies adaptations to climatic exigencies. This design ethos optimally harnesses passive energy-saving methodologies to cultivate a relatively congenial indoor thermal ambience and habitation experience [
22].
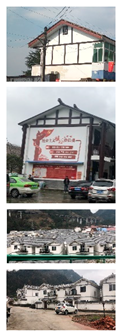
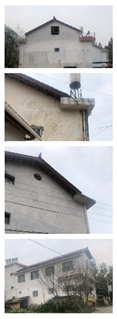
However, extant folk dwellings in Hanzhong contend with issues including haphazard construction practices, convoluted functional circulation, attenuated seasonal climatic adaptability, feeble energy conservation awareness, and an over-reliance on singular heating and cooling modalities during winter and summer. These challenges engender heightened energy consumption and impede the advancement of low-carbon building initiatives.
4. Digital Design Strategies for Low-Carbon Folk Dwellings
Wang Z. et al. [
23] optimized EnergyPlus to assess the energy performance and thermal comfort of folk dwellings in Hanzhong, providing detailed data on temperature variations and energy consumption. Li J. et al. [
24] utilized DesignBuilder software (V6.0) to explore retrofitting strategies for traditional Hanzhong dwellings, presenting comprehensive data on energy saving and enhanced thermal comfort. Liu Y. et al. [
25] employed TRNSYS simulation software (v18) to analyze passive design strategies in Hanzhong’s traditional dwellings, including detailed metrics on energy consumption reduction and improved indoor climate conditions. Zhang X. et al. [
26] focused on ANSYS Fluent and field measurement data to evaluate the thermal performance of traditional residences in Hanzhong, offering precise data on temperature regulation and energy efficiency.
This paper is oriented towards the low-carbon performance of folk dwellings through digitization, parametric modeling of the variable indicators affecting the building energy load, screening and simulation verification of the indicators affecting the building energy load and comfort, and summarizing the corresponding low-carbon design methods and energy-saving strategies under the premise of complying with the technical specifications for low-carbon buildings.
Relying on the Rhino-Grasshopper platform, this paper uses plug-ins such as Ladybug for climate data analysis, and Honeybee for the building environment simulation and analysis, the genetic optimization component Galapagos for computing, and Open Studio for energy simulation. By using the index PMV-PPD, which is a highly generalized index for evaluating the indoor thermal environment, this paper explores the strategies of designing low-carbon folk dwellings based on forms, planes, and buffer spaces through a series of computational and analytical processes such as modeling, simulation, and optimization.
The PMV (Predicted Mean Vote) index in the PMV-PPD model proposed by Fanger [
27] and ISO 7730 [
28] are often used to evaluate the thermal sensation of the human body to the environment in the indoor steady-state environment. The PMV-PPD model couples the interaction between humans and the environment, and also uses the PPD (Predicted Percentage of Dissatisfied) index to predict thermal discomfort, in order to solve the time delay between the human body’s thermal response and the environmental changes, so as to make the PMV-PPD model more accurate, and the most comprehensive consideration of relevant influencing factors, which is also a more generalized model at present. It is also the indoor thermal environment evaluation index with a high degree of generalization, and the grading of the PMV evaluation index is shown in
Table 2.
4.1. Simulation Model and Process Overview
This paper takes the simulation optimization process of the window-to-wall ratio as an example to demonstrate the simulation optimization process. The simulation process of building orientation, solar PV panel placement angle, eaves distance, etc., is similar to this method and will not be discussed in detail.
4.1.1. Simulation Model
From the Hanzhong folk dwelling survey, it is known that the general height of the building envelope is 3.6 m, the width of a room is 3.6 m, and the depth of the main body of the building is 9 m. The wall height of the exterior wall under the eaves of the attic level of a single-floor building is generally 0.9 m high, and the vertical height of the sloped roof is 1.8 m. Taking the model of a single-story, double-sloped-roofed, typical residential building as the simulation object, the information of the initial model is set up as shown in
Table 3, to seek the optimal window-to-wall area ratio.
4.1.2. Process Overview
For this simulation of the optimal window-to-wall ratio solution, the total cumulative sum of the building’s cooling and heating energy loads throughout the year is set as the optimization objective, and the window-to-wall ratios of the building’s four orientations are set as the independent variables, where the same values are used for the east and west orientations.
The simulation experiment was run using Galapagos, which is a genetic optimization component in Grasshopper. The value interval of the window-to-wall ratio for the south direction of the control building is 0.00~0.45, for the north direction is 0.00~0.45, for the east and west direction is 0.00~0.35, and the simulation time period is 8760 h of a typical meteorological year. The simulation’s initial parameter settings are shown in
Table 4.
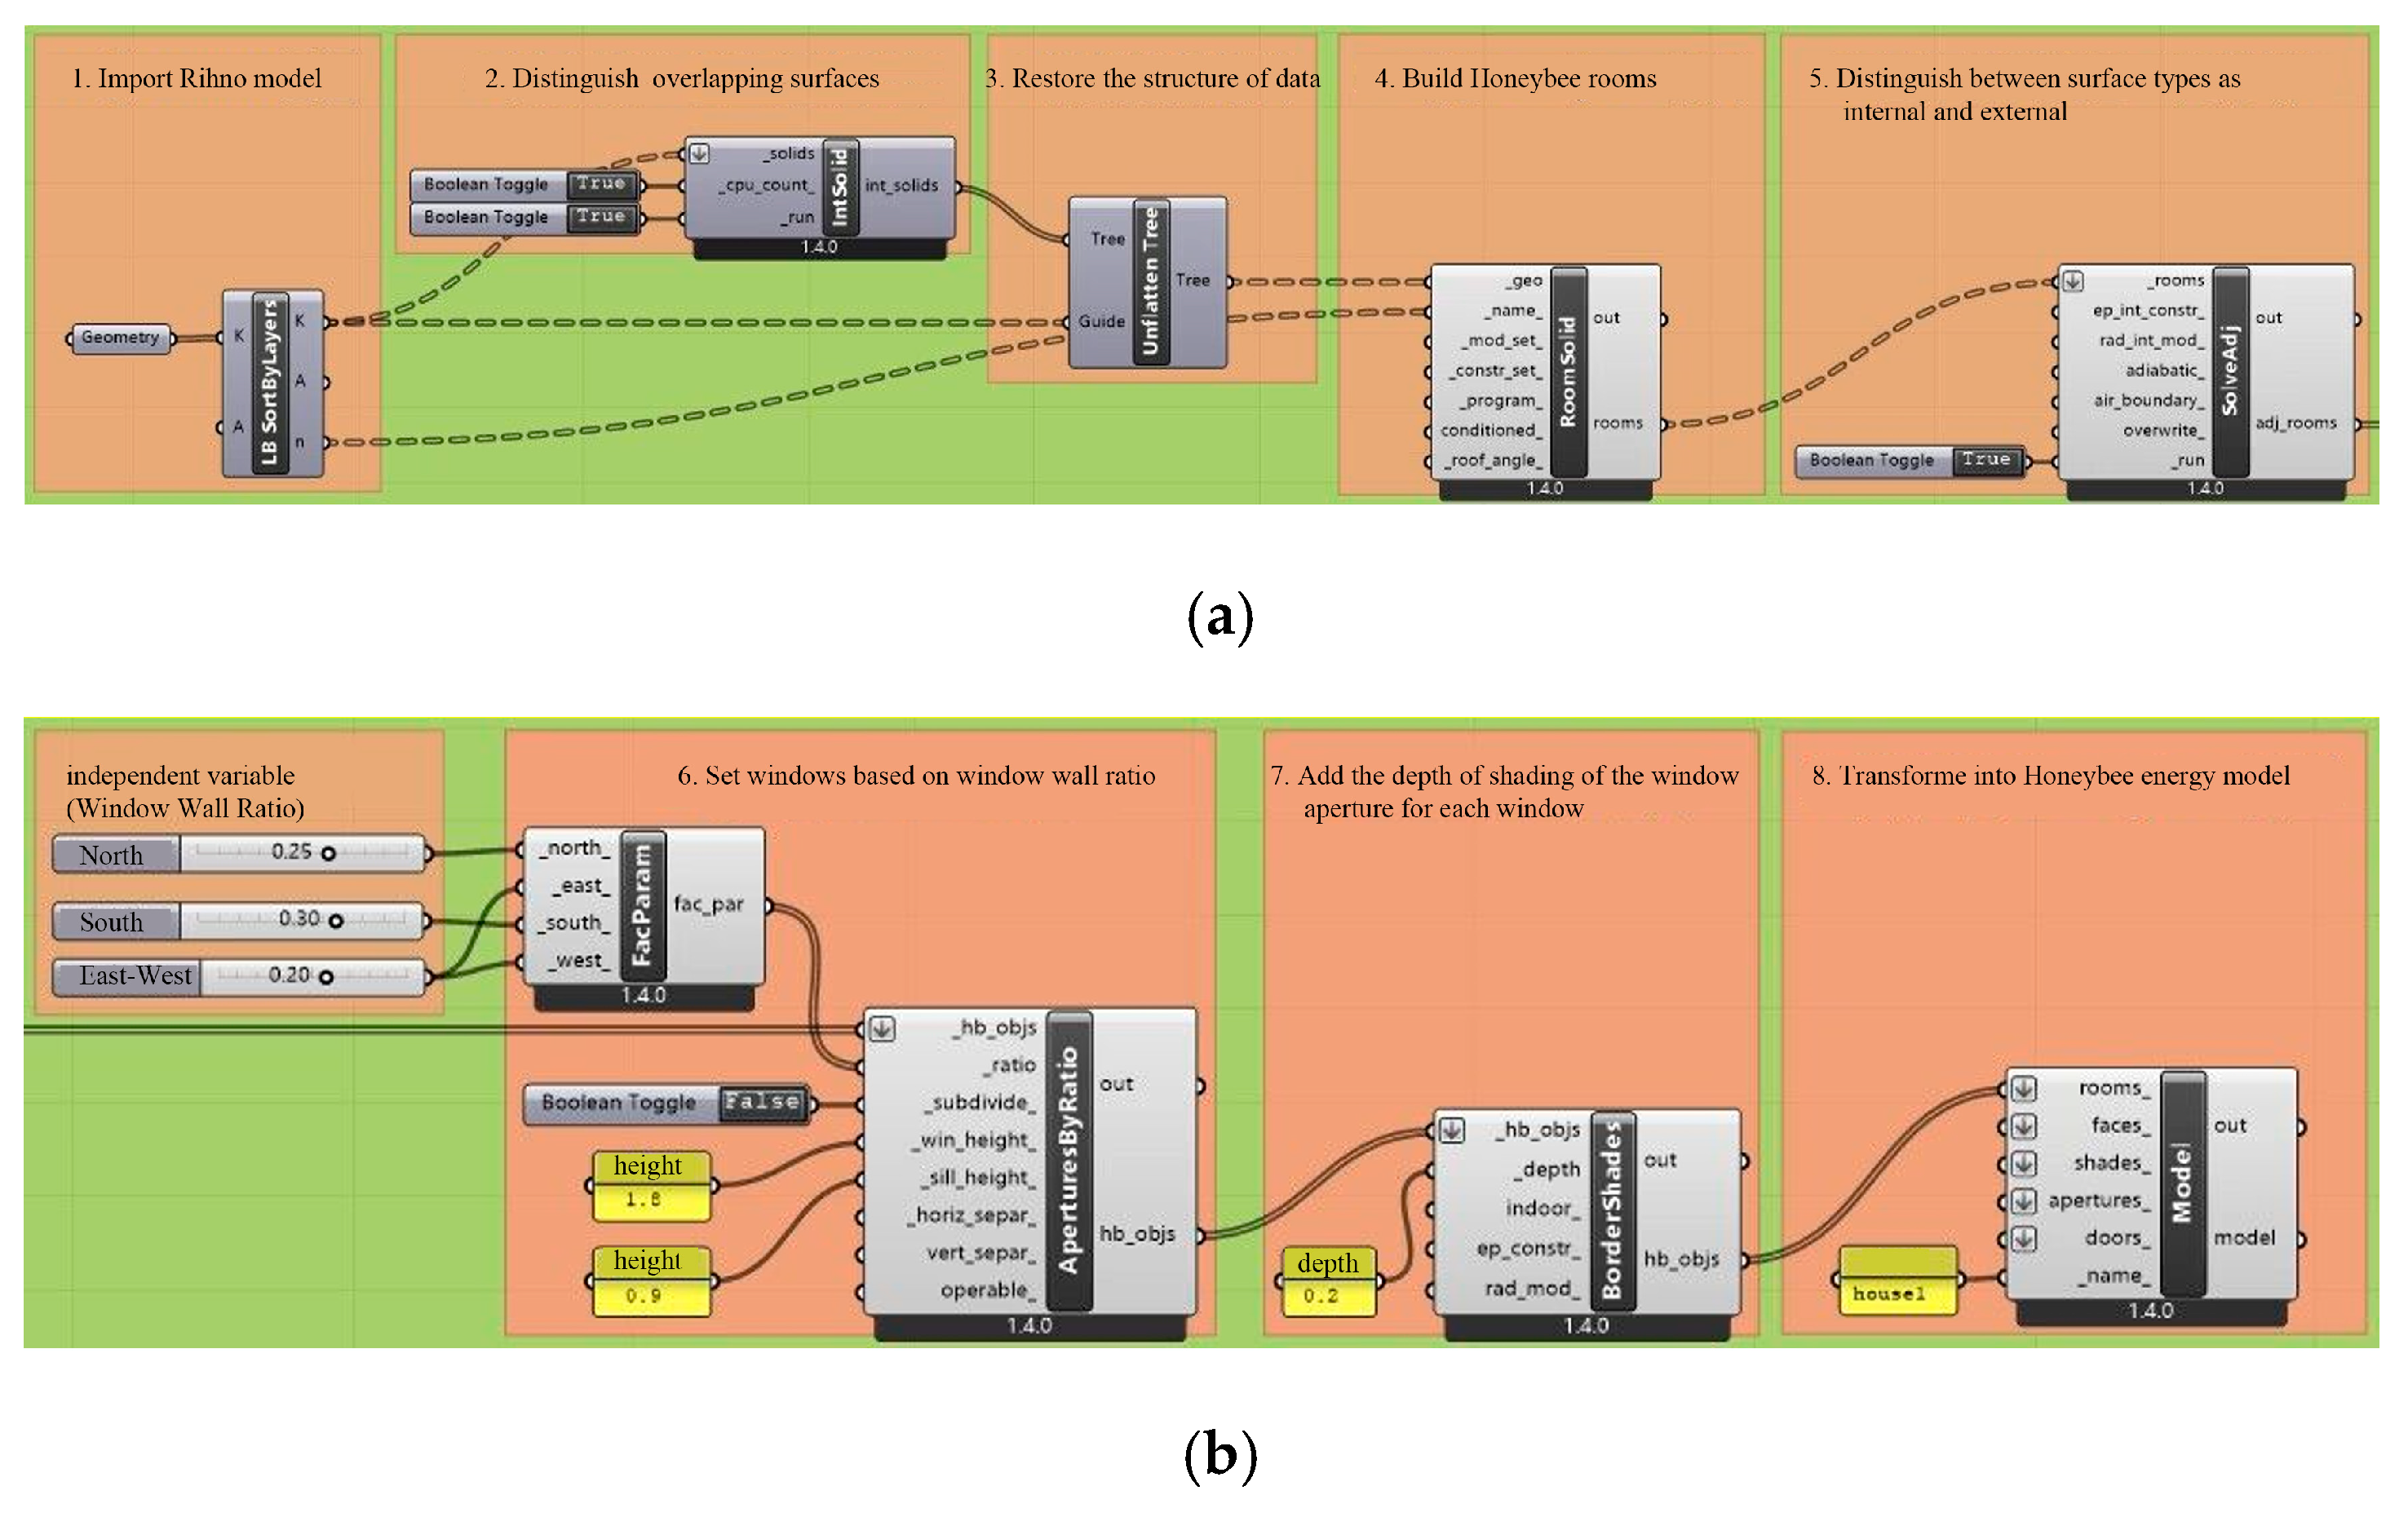
When establishing the energy consumption simulation model, the model first needs to be established in Rhino according to the function of different rooms and then imported into Grasshopper, using Ladybug to establish the HB room. Then the HB Solve Adjacency is accessed to distinguish between the surfaces of the model, and identify the overlapping surfaces as the inner envelope, and the rest of the surfaces as the outer envelope surfaces, as in
Figure 1a. After the model is processed and imported into the window parameter setting component HB aperture by ratio, windows are added to the energy analysis model, and the height of the sill is set as 0.9 m and the height of the window as 1.8 m. Then, the HB Façade Parameter component is used to input the coefficients of the window-to-wall ratio of the four oriented surfaces. Next, the depth of shading of the window aperture for each window is added, and the HB mode is accessed. The model is transformed into the Honeybee energy model, as shown in
Figure 1b. The completed energy analysis model is shown in
Figure 2.
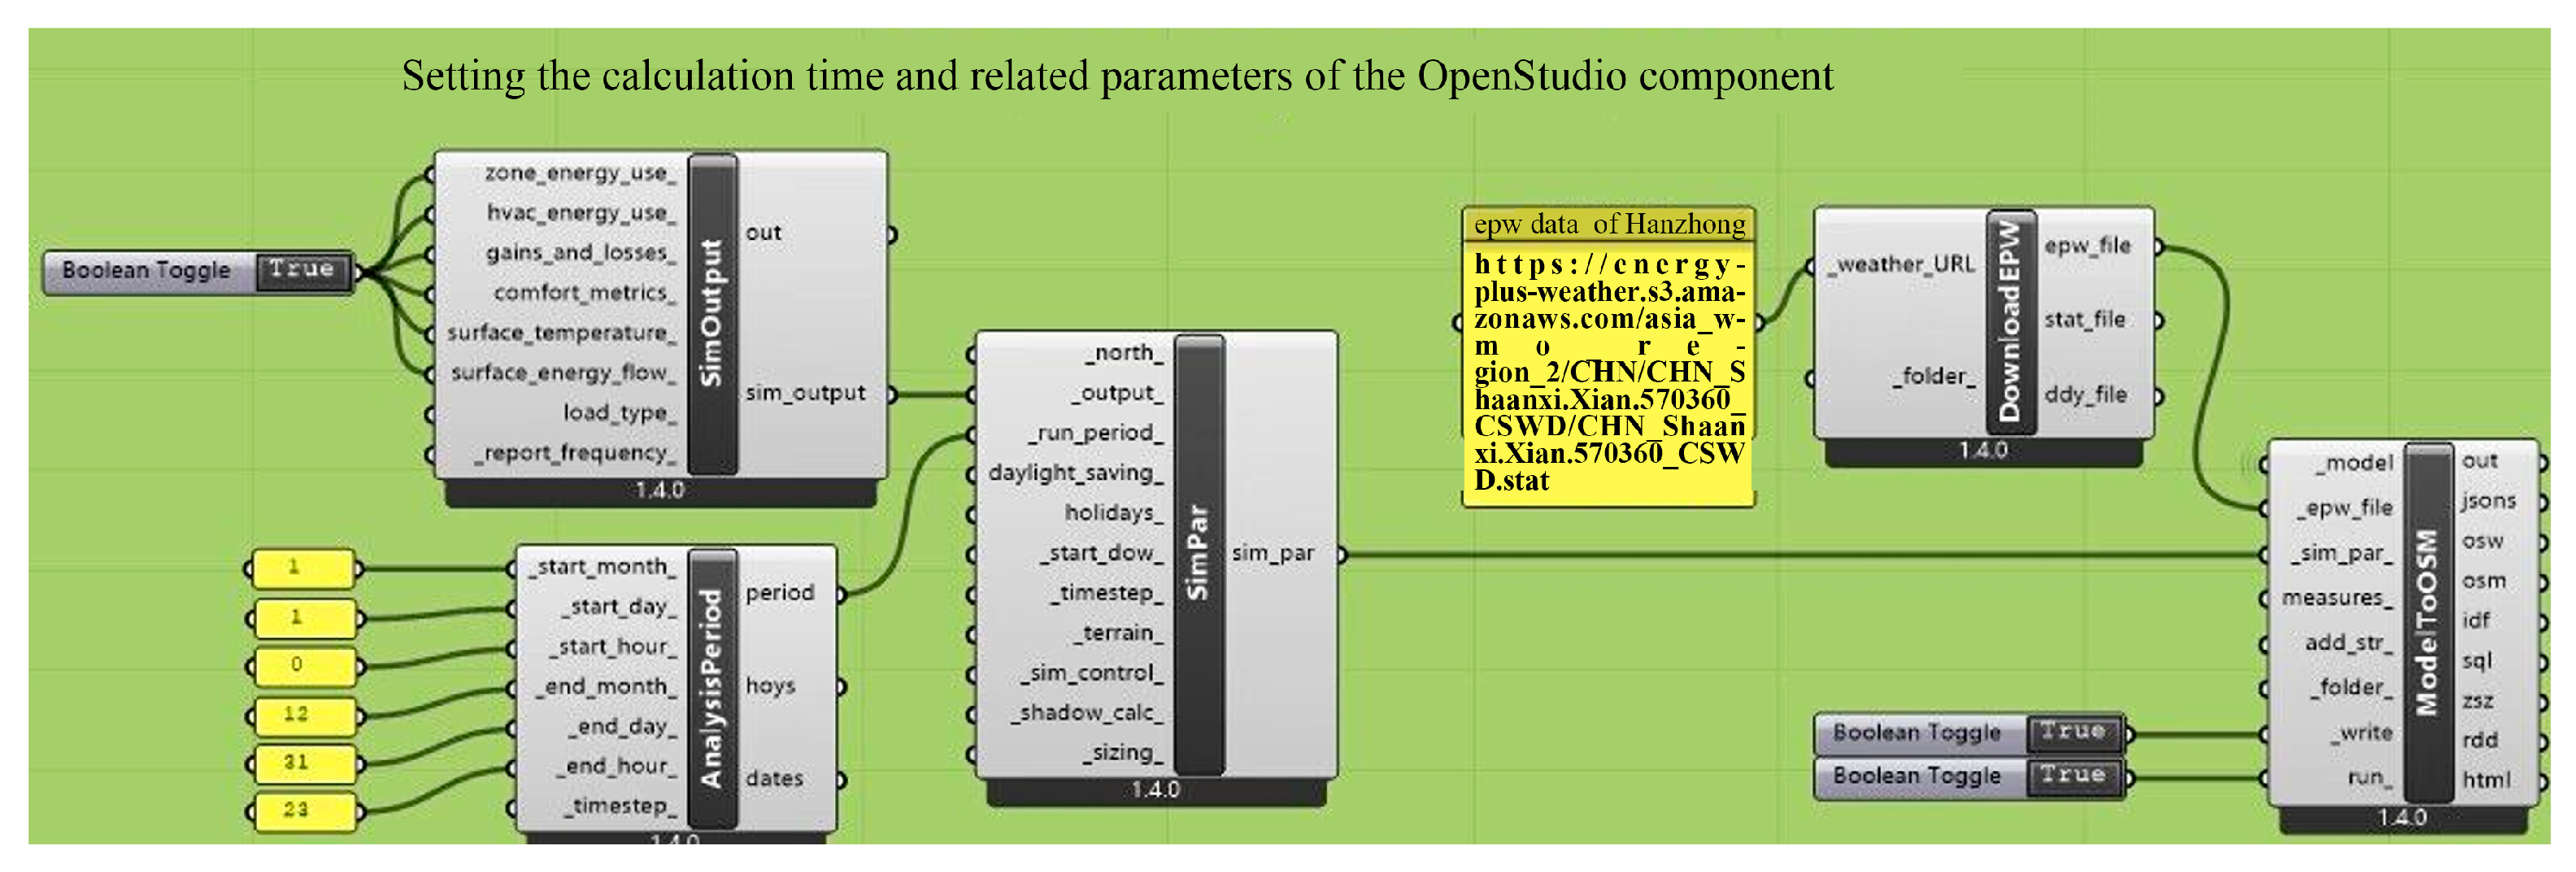
After completing the energy model, it is necessary to use Open Studio to simulate the energy consumption, and then import the energy model into the energy simulation component HB Model to OSM in the HB-Energy engine, setting the weather data and simulation parameters for it. Firstly, the weather data in epw format is downloaded from the professional weather analysis data website (
https://www.ladybug.tools/epwmap/, accessed on 1 October 2023) which was developed by the US Department of Energy. This is connected to LB Download Weather and opened. This is then filtered to activate the conditions that need to be simulated and prepared in HB Simulation Output, which is then entered into the HB Simulation Parameter. The simulation time is then set from 0:00 on 1 January to 23:00 on 31 December using the LB Analysis Period. Finally, Boolean for Ture is selected in the HB model to OSM to start the energy simulation (
Figure 3).
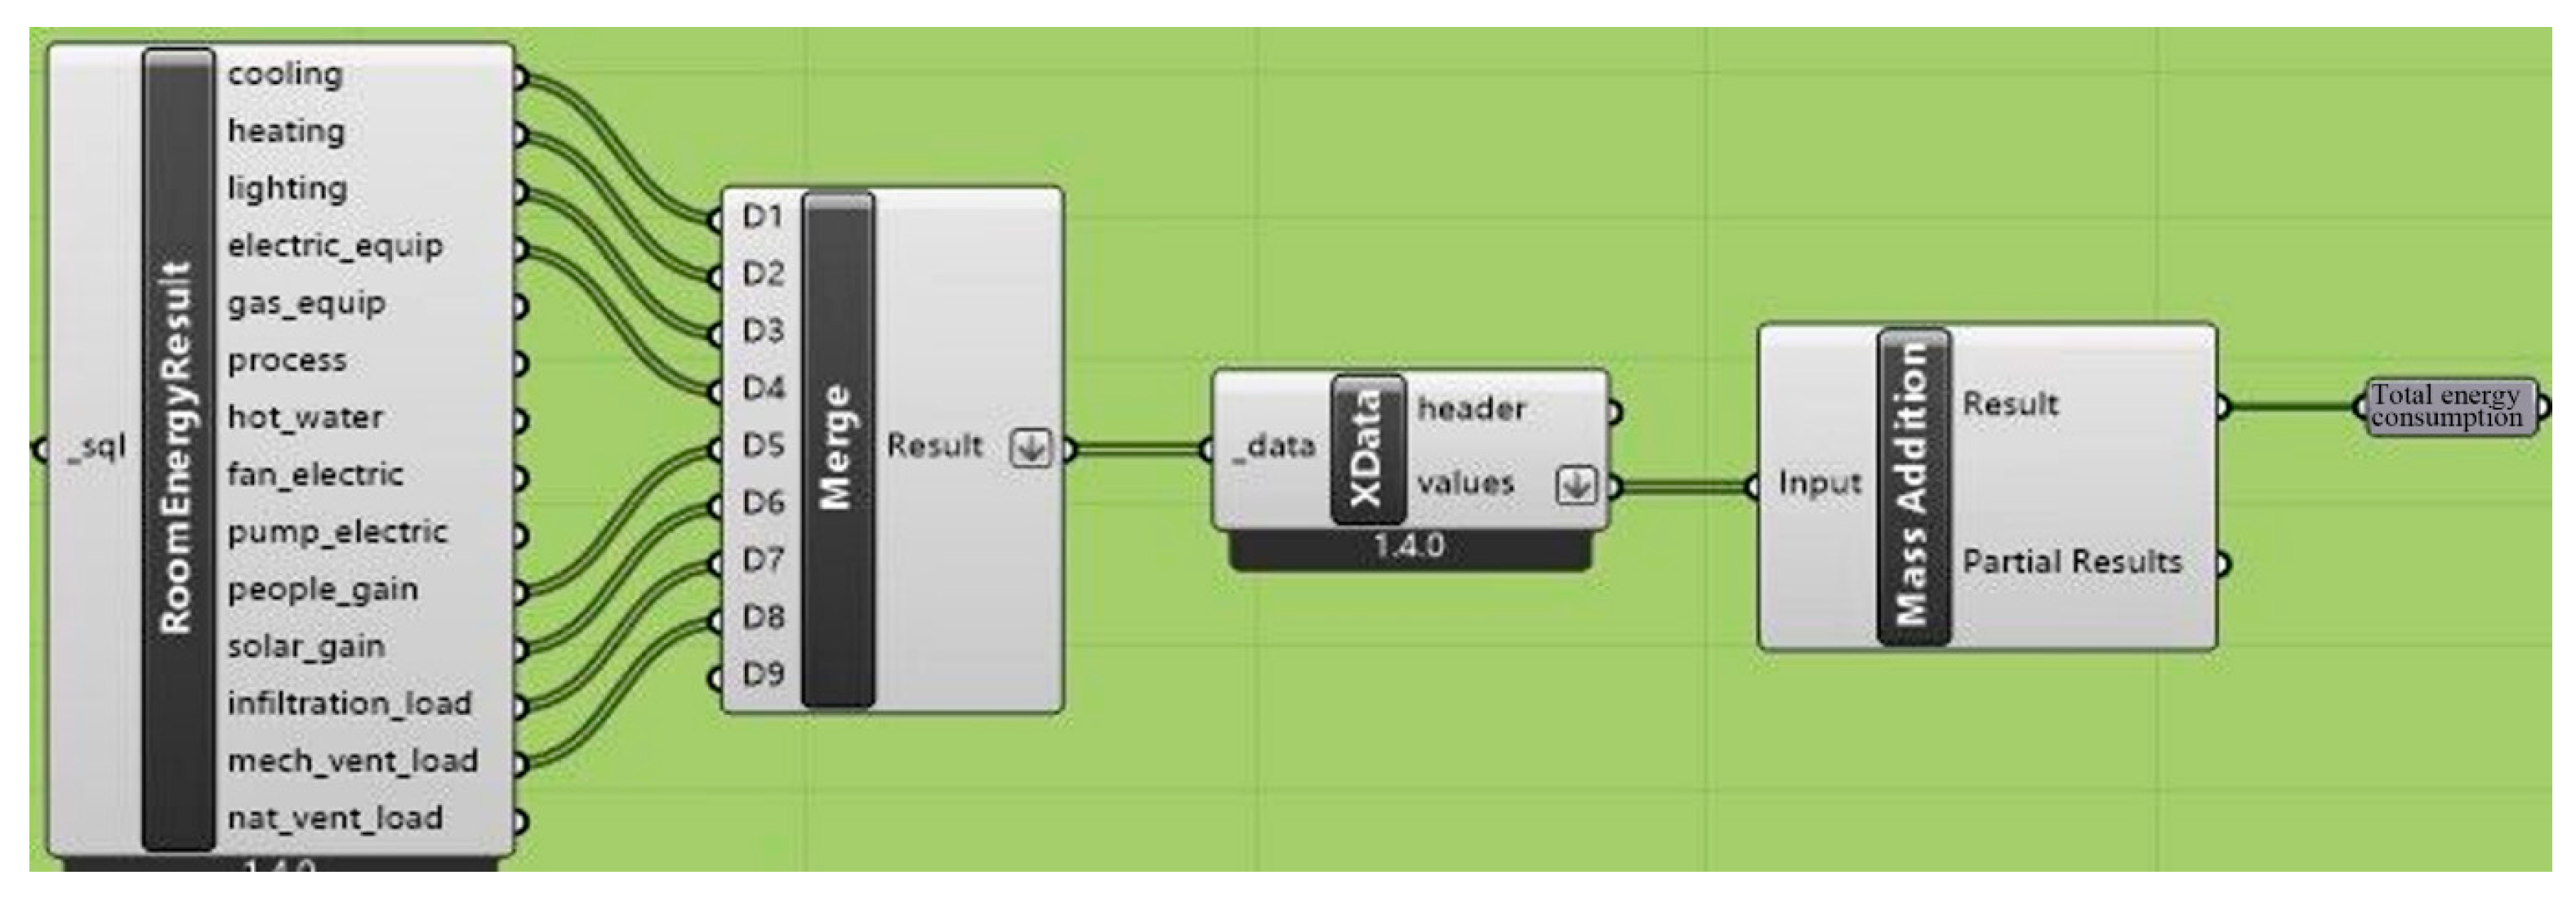
Finally, the S port of the HB model to OSM is entered into the HB read room energy results to calculate the total heating and cooling energy loads of the building during the test time interval (
Figure 4).
The genetic optimization program Galapagos (
Figure 5) gradually converges on the solution’s set values after 73 generations of calculations. To derive the minimum total annual heating and cooling energy loads, the building’s window-to-wall area ratios are 0.34 for the southward direction, 0.27 for the northward direction, and 0.18 for the eastward and westward directions.
4.2. Building Form Optimization
4.2.1. Building Form Index
The building’s form analysis focuses on the selection of form indexes, which are mainly divided into three categories: building envelope, building shape, and building orientation. The window-to-wall ratio is selected as a parameter index, and the optimal window-to-wall ratio is 0.34 for the south direction, 0.27 for the north direction, and 0.18 for the east-west direction (
Table 5). The building shape index selects the number of rooms and the number of floors. The height of the building envelope is set to a fixed value of 3.6 m, the size of the width of a room is set to 3.6 m × 9 m, the number of rooms ranges from 3 to 6, and the number of floors takes the value of the interval from 1 to 3 (
Table 6). In order to obtain more heat energy indoors in winter, the parameters of the building orientation were set in the interval of 30° southwest to 30° southeast.
4.2.2. Roof Design
The roofs of folk dwellings which were set up with photovoltaic (PV) equipment were arranged according to the southwest 34.87° orientation and a 29.06° roof slope to obtain the maximum solar radiation (
Table 7). After calculating the maximum value of shading gained when the distance of the eaves is 0.3 m, the difference between the increase in shading distance and the increase in radiation gain gradually increases, and the yield decreases after the shading depth exceeds 0.3 m. Additionally, the yield decreases significantly when the shading depth exceeds 0.5 m. Therefore, when laying PV equipment on the roof of a building, the distance of the eaves should be in the interval of 0.3 to 0.5 m as much as possible.
In addition, when the depth of shading is 1.365 m, the amount of direct solar radiation on the building envelope elevation is 0, and the source of radiation at this time is mainly scattered radiation. Therefore, the first-floor plane’s sunshade design should try to control the distance of the eaves to achieve 1.365 m or so, taking into account the common modulus of the building, and the actual construction should be controlled within the range of 1.2 to 1.5 m intervals to 1.3 m and 1.4 m mainly.
4.3. Building Plan Optimization
4.3.1. Utilization of Heat Gain Zones
According to The Green Building Evaluation Standard (GB/T50378) [
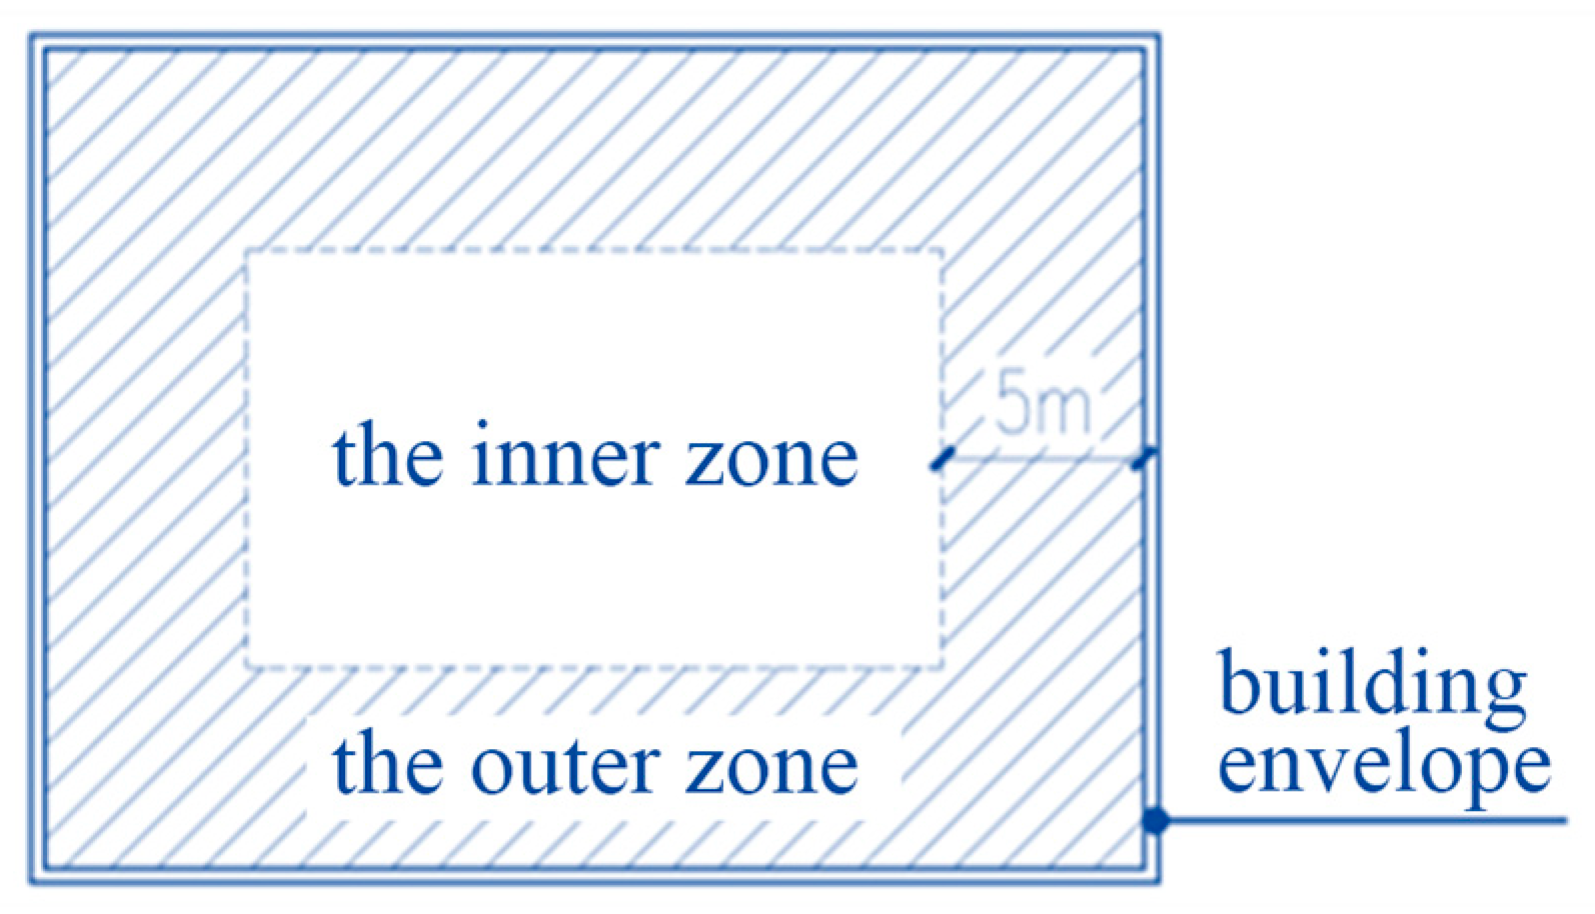
29], the outer zone of a building is the area within 5 m of the outer envelope (
Figure 6), and the inner zone of a building is the area where the main use space is located. The thermal environment in the inner zone is characterized by relative stability and is not easily affected by the outside world, while the outer zone is a relatively unstable region of the indoor thermal environment, which can be regarded as a thermal buffer zone.
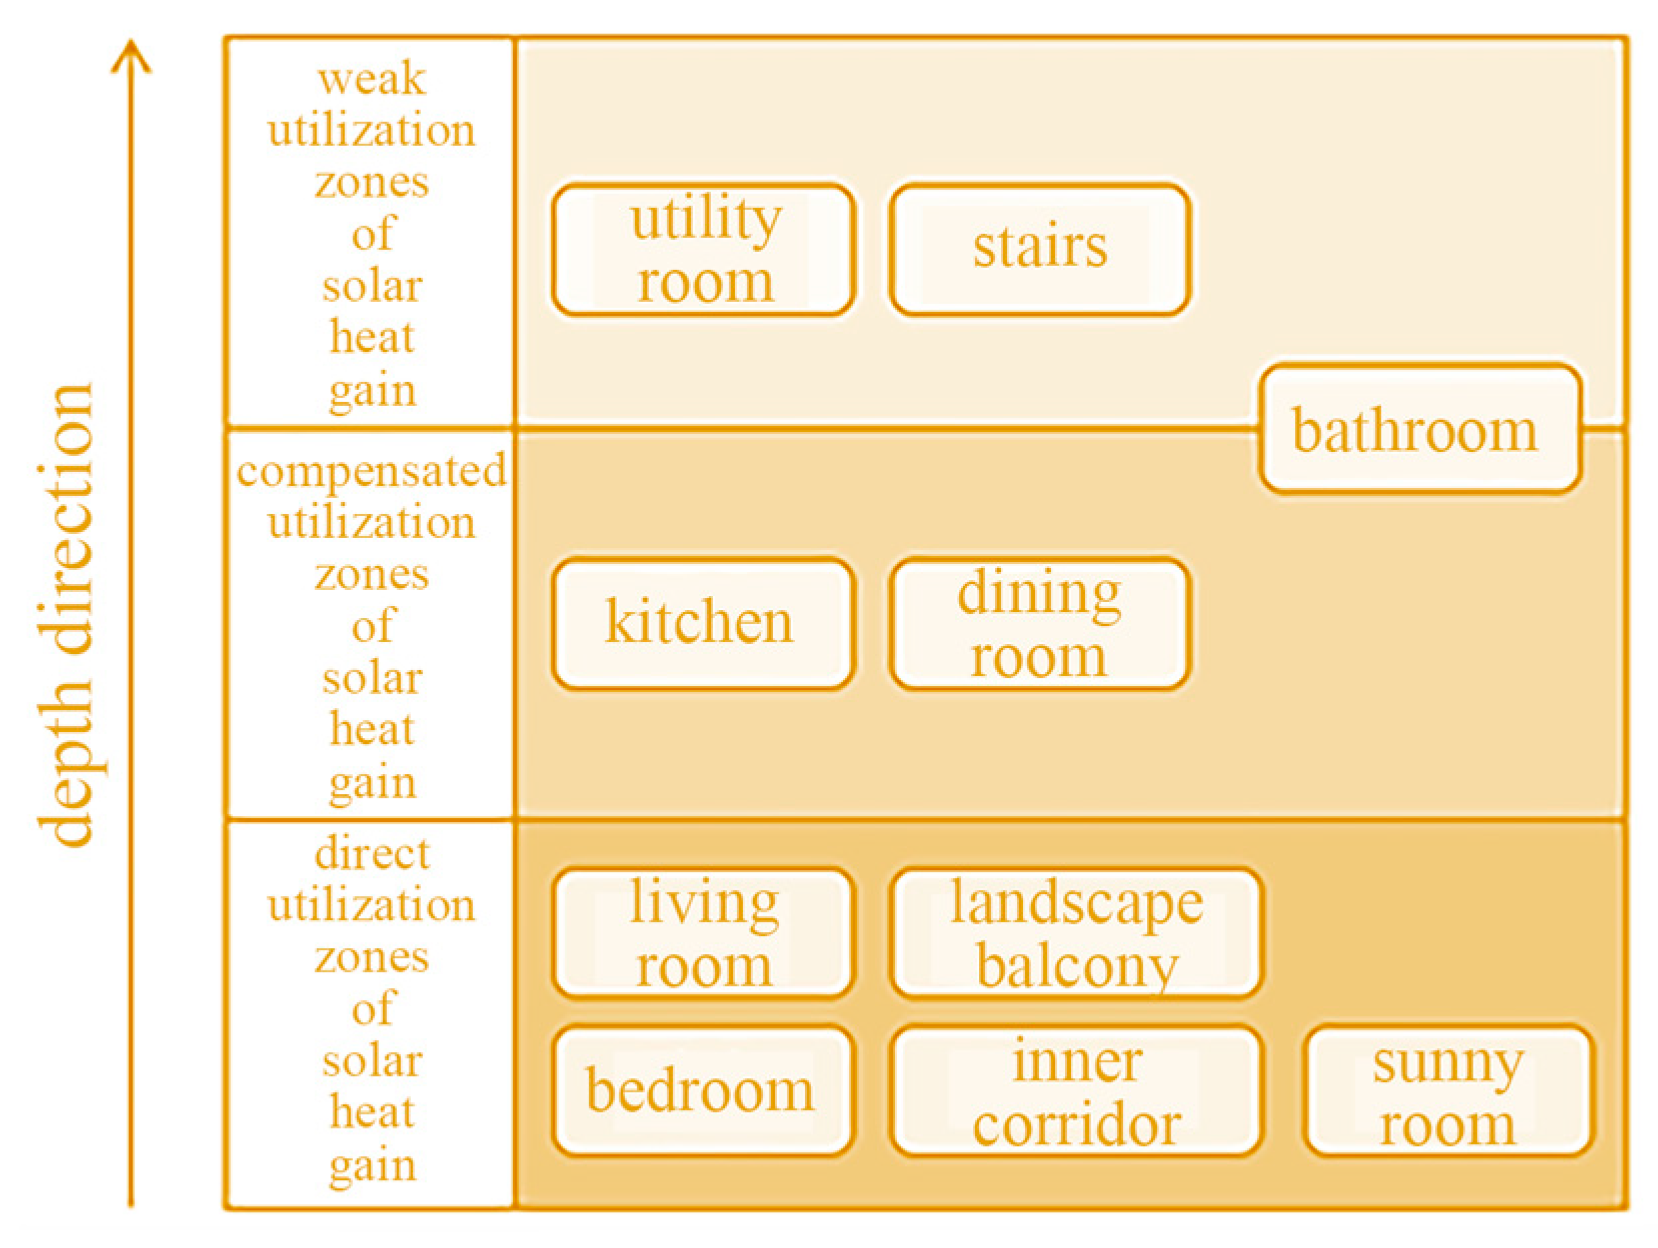
Relevant studies have divided the space into direct, compensated, and weak utilization zones of solar heat gain, with reference to indoor solar heat utilization [
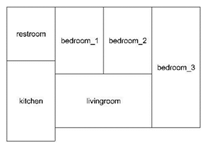
30]. The design of folk dwellings should consider the use of radiation heat gain zoning, and arrange the bedroom, living room, sunny room, and landscape balcony in the direct utilization zone; the kitchen, dining room, bathroom, and other rooms with a low utilization rate are arranged in the compensated utilization zone, and the traffic space and utility room are arranged in the weak utilization zone (
Figure 7).
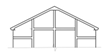
4.3.2. Household Design
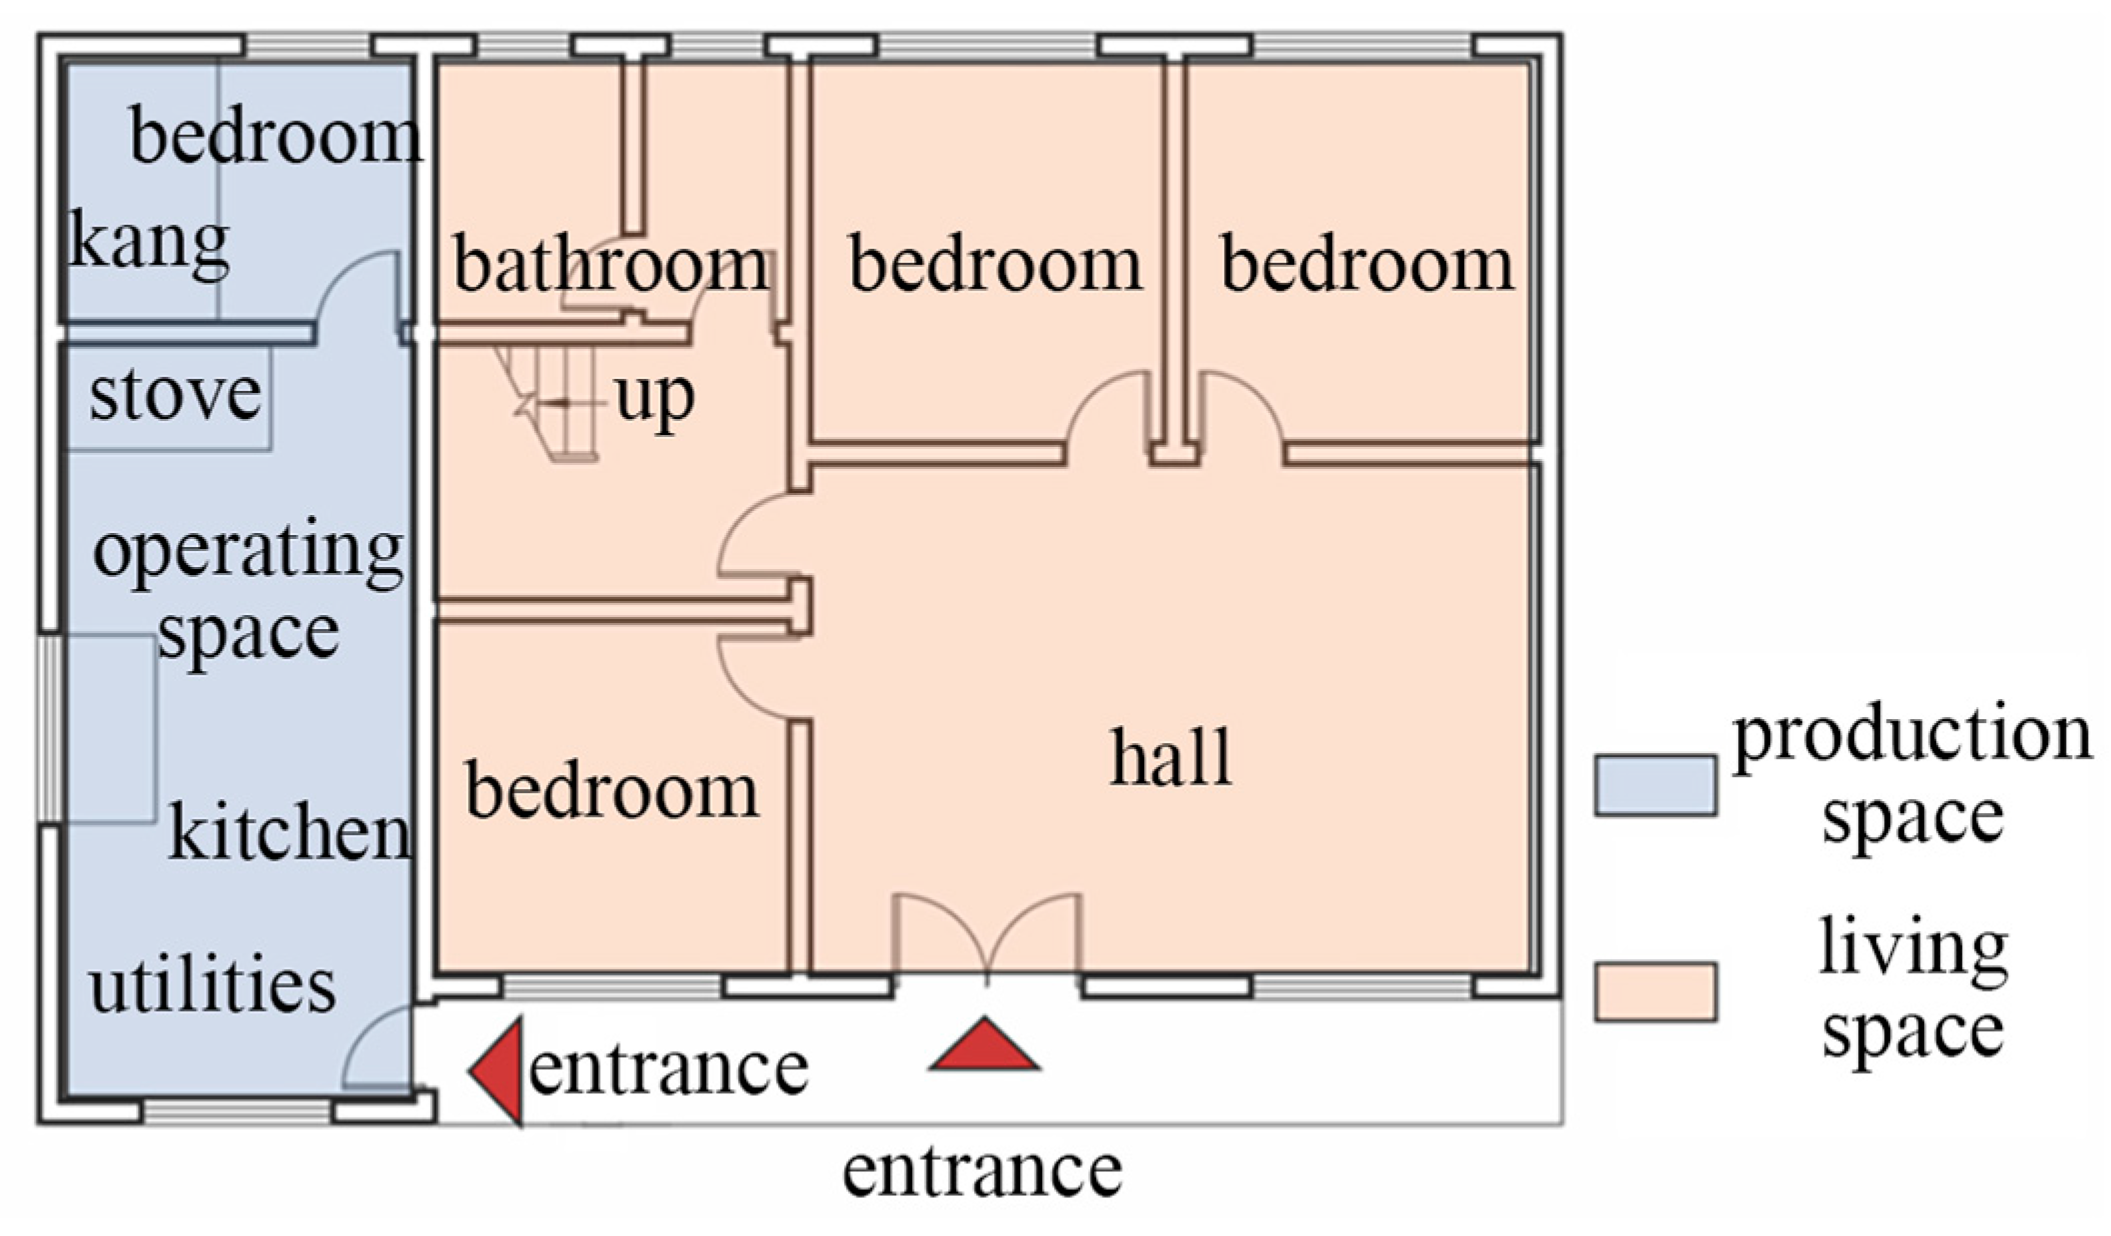
The plan of Hanzhong folk dwellings is divided into two parts, one of which is the production space centered on the kitchen, and the other is the living space centered on the hall. These two major spaces are significantly different from the highly integrated urban dwellings. The production area has a separate external entrance due to the large footprint of the earthen stove in the kitchen in rural areas and the need to leave an area in the operating space for stacking firewood fuel, which itself causes dust, and the large amount of grease and fumes that can’t be discharged for a short period of time during cooking. Some stoves would also be connected to the earthen kang for winter use. The functional layout of the living area is relatively simple, with the parlor functioning as both an entrance and a living room, the bedrooms arranged around the hall (
Figure 8), and the shower usually designed in conjunction with a vertical transportation core.
4.4. Buffer Space Design
Buffer space, also known as the thermal buffer space [
31], is located between the main use space of a building and the outdoor environment, often in the form of cornices, porches, offshoots, and patios, which play their characteristic climate buffering role. The buffer space is divided into indoor buffer space and outdoor buffer space. The indoor buffer space mainly includes the foyer, transportation core, and attic space under the roof, etc.; the outdoor buffer space includes building eaves, courtyard, and vegetation enclosure space, etc.
4.4.1. Indoor Buffer Space
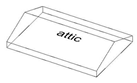
First, there is the optimized design of the attic (
Figure 9). During the day, the front gable windows close to block the inflow of hot air and the rear gable windows open to promote attic air circulation. The optimal operating temperature of photovoltaic power generation facilities is about 25 °C, and the output power decreases by about 0.35% for every 1 °C increase in air temperature. Utilizing photovoltaic equipment to form a slit cavity with the roof can both enhance the photovoltaic conversion efficiency and cool down the room in summer.
Secondly, secondary functional spaces such as the kitchen, dining room, entrance foyer, bathroom and utility room are placed in direct contact with the outdoor environment. The functional layout is arranged in the unfavorable direction as much as possible to resist the intrusion of hot and humid air in summer and dry and cold air in winter.
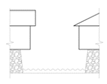
4.4.2. Outdoor Buffer Space
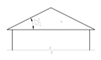
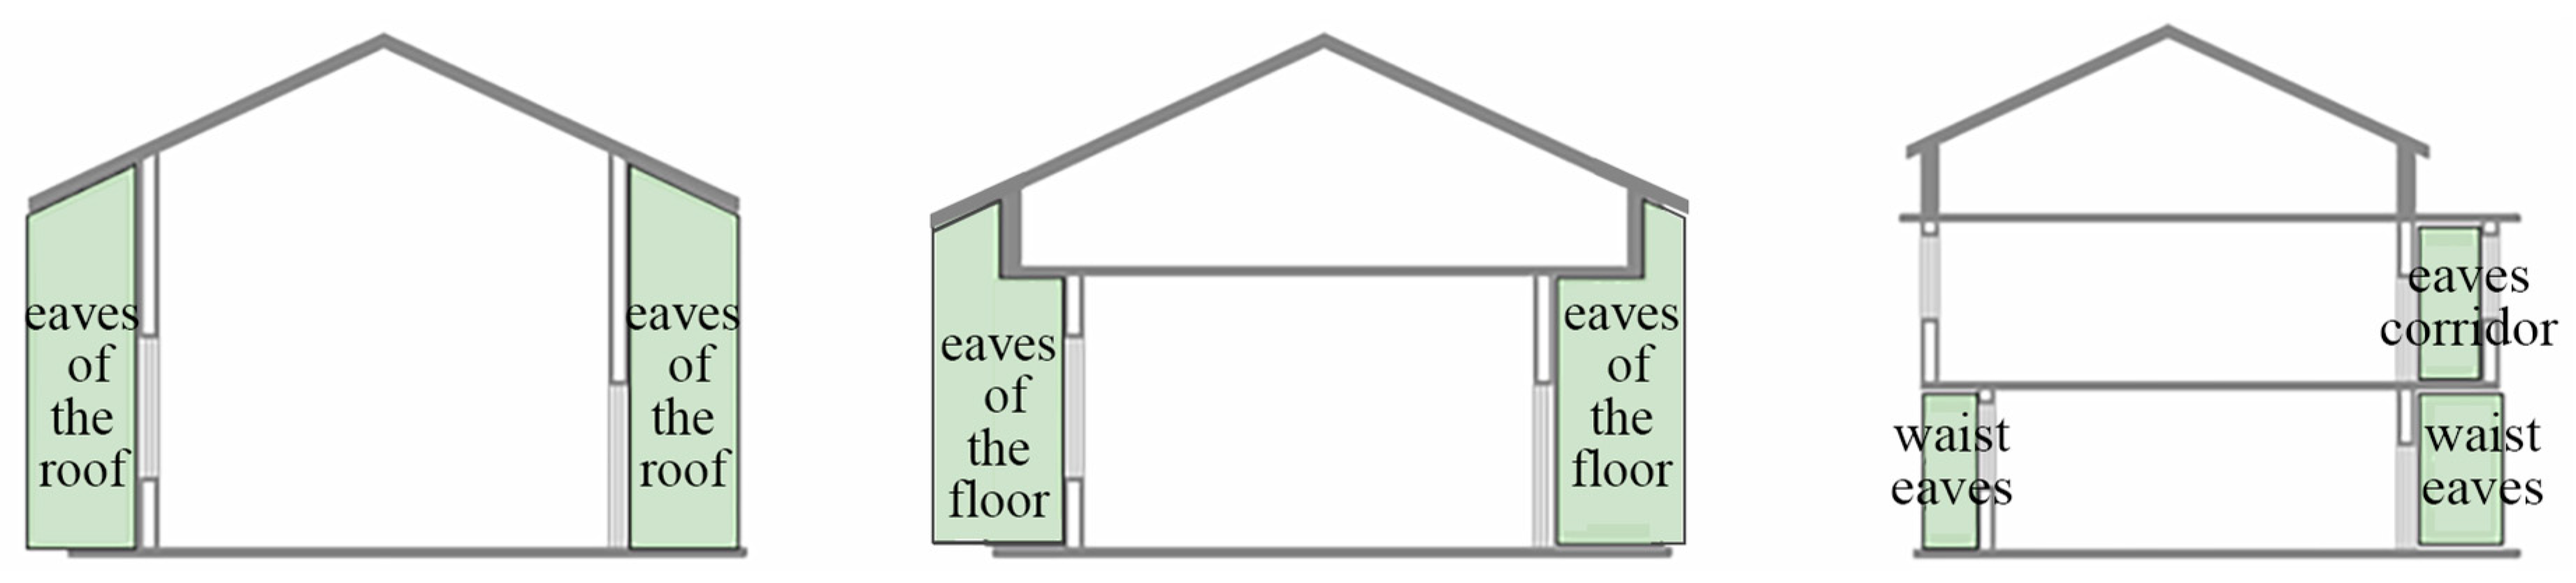
It is important to make full use of the space under the eaves. Building eaves can shade the sun, resisting the direct radiation of sunlight, and the depth of the eaves of the shade directly affects the building envelope of the radiant heat gain. The thermal buffer plays a role in thermal energy storage, and its heat gain can directly affect the indoor thermal environment changes. The Hanzhong region commonly uses the following types of eaves spaces (
Figure 10), which is a regional expression of outdoor buffer spaces.
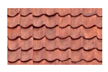
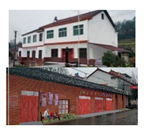
4.5. Regional Material Selection
Local wood is chosen for the roof frame, the red gables that are characteristic of the region are retained, traditional elements are used for the roof ridge and traditional symbols such as floral decorations are added, such as the overhanging mountain roofs with red gables and triangular mountain wall overhanging fishes, as well as through-doored decorations. The elevation highlights the regional characteristics of “red tiles and white walls” and plays a better buffer role through the wall’s thermal insulation structure. Door and window components that use wood materials, which have a specific heat capacity, display better thermal performance than most metals, but the disadvantages are that wood is flammable, easy to deform, and airtightness is poor. Windows and doors should be made from a combination of wood and metal to maintain good airtightness while preserving thermal properties (
Table 8).
5. Result and Discussion
Digital design of low-carbon folk dwellings in Hanzhong, Shaanxi Province, based on the climatic characteristics and regional cultural features of the Hanzhong region, starting from the building space, with the goal of low-carbon building performance enhancement. This process relies on using the Rhino-Grasshopper platform to conduct quantitative analysis, exploring the building form, plan optimization, buffer space design, selection of regional materials, and other strategies of the digital design of low-carbon building space in hot-summer and cold-winter regions.
The building form design rationalizes the optimal window-to-wall ratio (south 0.34, north 0.27, east and west 0.18), the optimal range of orientations, the optimal PV orientation (southwest 34.87°) and angle (29.06°), the distance of the eaves (0.3 m), and the range of shading depths (1.2–1.5 m).
The layout of the building divides the space into direct utilization of solar heat gain, compensated utilization, and weak utilization areas. The direct utilization area is the main living room, the compensated utilization area is the auxiliary rooms such as the dining room, kitchen, bathroom, etc., and the weak utilization area is located in the area of traffic and utility spaces. The kitchen is used as the main production space, the living space is used as the main living space, which is the core of the plan layout optimization design.
In regard to indoor and outdoor thermal buffer space, indoor is mainly achieved through the attic optimization design, as well as the dining room, kitchen, sundries, entrance foyer and other secondary functional spaces. Outdoor is achieved mainly through gable space, which is the regional expression of Hanzhong folk dwellings.
The selection of regional materials, through the retention of local characteristics such as the red gable and red tile sloping roof, the use of traditional elements in the roof ridge, and white painted brick walls and raw earth walls, ensures the regeneration of regional materials, reflecting the regional characteristics of the “red tiles and white walls”.
6. Conclusions
Through energy consumption simulation and the validation of the thermal comfort evaluation index PMV-PPD, design strategies such as building scale, layout organization, indoor and outdoor buffer space design, and building material selection are proposed to effectively improve indoor thermal comfort during the winter and summer seasons. This research provides insights into and references for the low-carbon design and optimization of residential buildings. The regional low-carbon exploration of folk dwellings, using digital tools to achieve quantitative design strategies, is useful for the renewal and optimization of folk dwellings in Hanzhong.


