1. Introduction
Hazardous chemical leaks stemming from industrial and chemical processes pose significant safety concerns, and the prompt detection of such leaks and accurate prediction of their magnitude are critical for the prevention of accidents and the development of effective response strategies. Rapid industrialization in South Korea, coupled with the deterioration of infrastructure in dense industrial complexes, has resulted in an increase in gas-related incidents involving tubes, valves, and flanges. These incidents range from leaks to fires, explosions, and the emission of noxious odors. Between 2014 and 2022, there were approximately 740 reported chemical incidents, with a discernible upward trend [
1]. Leakages constituted most of these cases, numbering 590. Notably, chemical accidents occurring within confined spaces have a particularly high fatality rate, reaching 50%—a figure 44 times greater than the fatality rate for other types of accidents or disasters, which stands at 1.1% [
2].
Substantial research has been conducted on hazardous chemical leaks in both indoor and outdoor environments to discern patterns and forecast variables, including seasonal, climatic, and pollutant factors [
3]. For outdoor leak scenarios, the “Areal Locations of Hazardous Atmospheres” (ALOHA) program has been instrumental in assessing diurnal and nocturnal effects, as well as the seasonal impact, on gas leaks [
4,
5]. Consequently, a variety of simulation tools, such as Phast and ALOHA, have been utilized for these analyses, and computational fluid dynamics (CFD) plays a key role in predicting temporal shifts in concentration or dispersion states [
6,
7].
For indoor chemical leaks, CFD remains the principal simulation technique. This method enables the investigation of changes with respect to the number and type of sensors deployed to monitor hazardous substances during leak events [
8,
9]. Within the realm of CFD research, studies focusing on the factors affecting gas dispersion during gas leak modeling in structures such as buildings, hospitals, and ships with ventilation systems have made use of the “Fire Dynamics Simulator” (FDS) [
10,
11,
12]. The efficacy of the FDS in studying hazardous chemical leaks has been validated through comparative analysis with other CFD tools and empirical experiments [
13].
Recent advancements in CFD applications for gas leak detection highlight several significant studies. Zhou et al. modeled the diffusion of hazardous gases under various atmospheric stability conditions using a WRF-CFD coupled model, emphasizing the importance of atmospheric stability in gas dispersion [
14]. Wang et al. analyzed the leakage and hazardous boundaries of buried gas pipelines, considering underground confined spaces and employing numerical simulations to predict the gas concentrations and distributions [
15]. Kim et al. used CFD simulations to model gas explosions in semiconductor facilities, demonstrating the effectiveness of CFD in predicting explosion risks and guiding safety measures [
16].
By being able to anticipate the scale of hazardous chemical leaks in advance, it becomes possible to select response methods according to the scale of the leak, enabling flexible responses. Therefore, in this study, we simulated a hazardous chemical leak (of CO) within a building using different room and corridor geometries and hypothesized the time to criticality (TTC), which is the time at which the leaked gas concentration reaches a hazardous level, based on the leak size, storage temperature, and spatial factors that could affect dispersion.
2. Methods
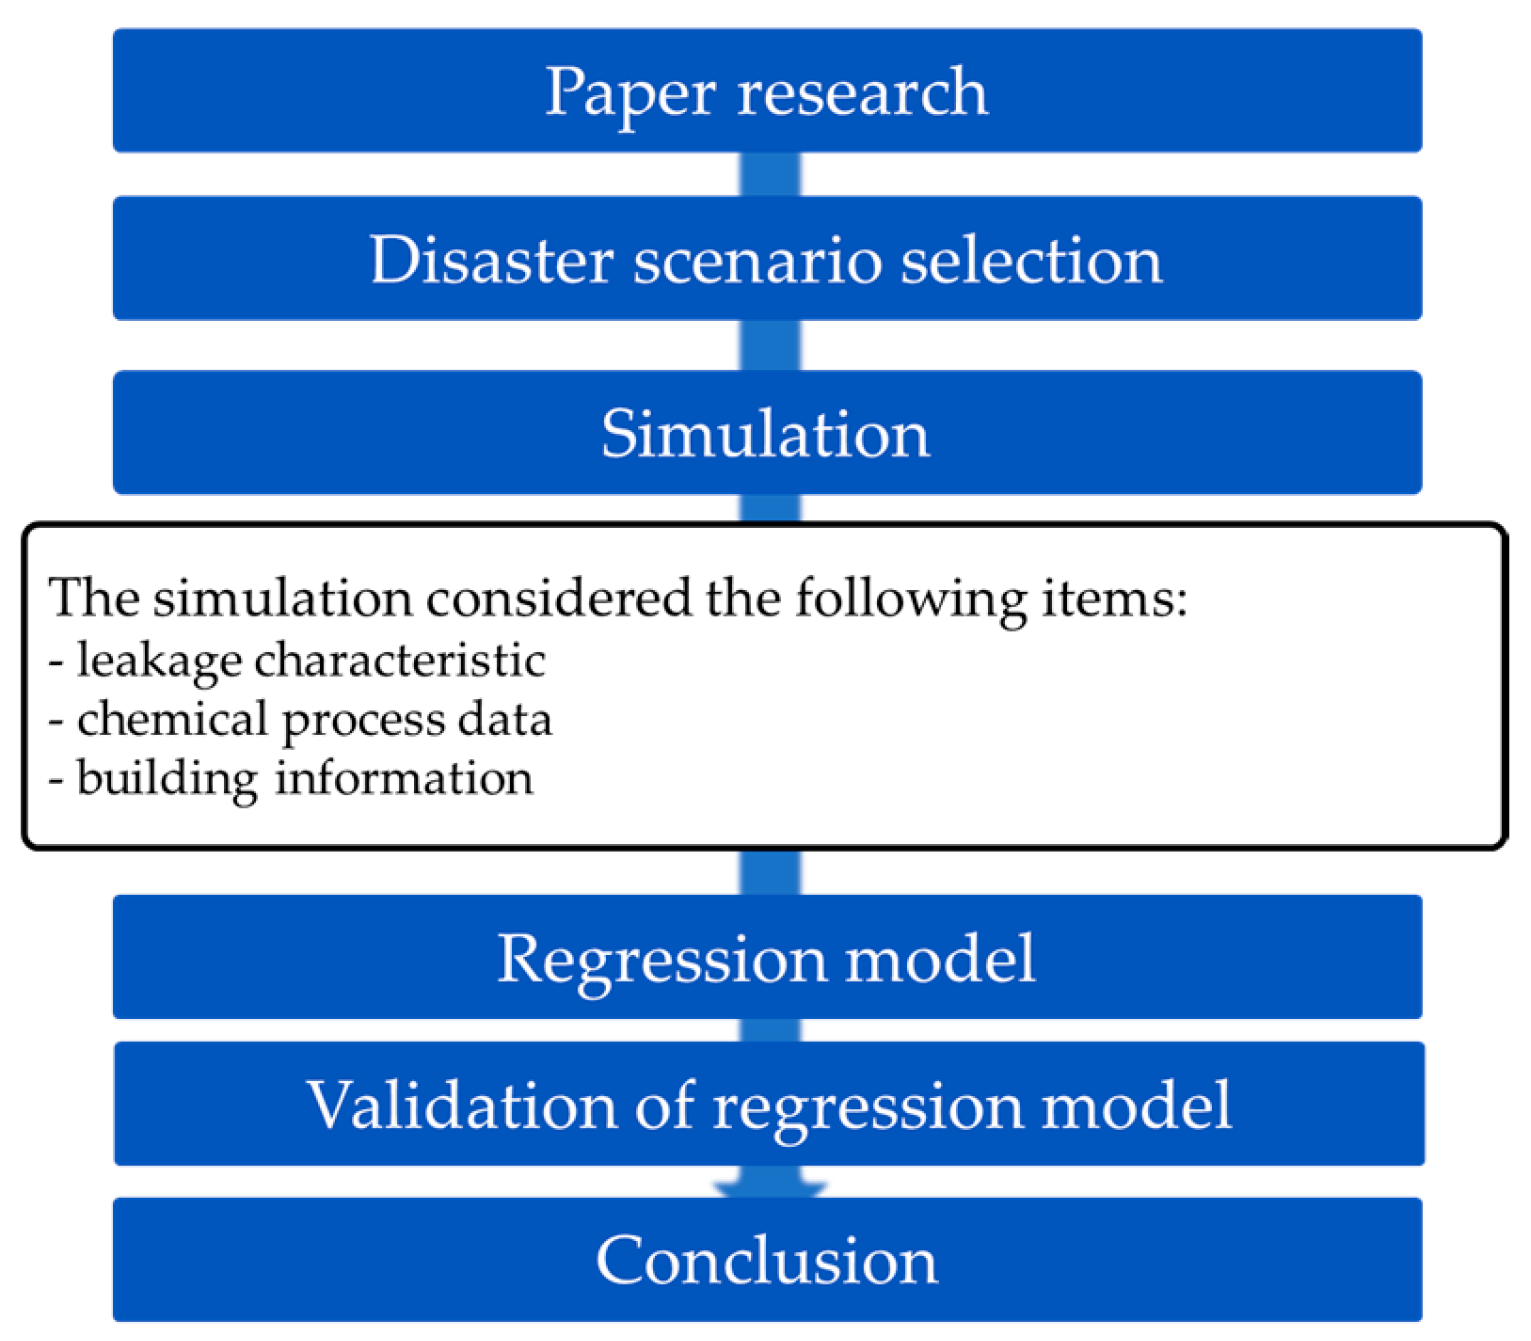
The methods of this study are as shown in
Figure 1. A scenario was derived using process information, leakage accident characteristics, and building information. The chemical leak simulation was run accordingly. The simulation software used was FDS Ver 6.7.9, developed by NIST. Regression analysis was performed on the simulation results for each scenario using the time-weighted average (TWA) exceedance time as the dependent variable.
Within Fire Dynamics Simulator (FDS), a robust framework is anchored upon sophisticated fluid dynamics models, which play a crucial role in elucidating the intricate dispersion patterns of gases within confined spaces. By resolving the Navier–Stokes equations and accounting for thermal buoyancy effects, FDS meticulously characterizes airflow phenomena, including turbulent eddies and vortices induced by fire-induced thermal gradients. Moreover, FDS integrates a comprehensive gas diffusion model, enabling the precise simulation of smoke and toxic gas transport. This model intricately considers factors such as ventilation configurations and natural airflow pathways, elucidating the spatial distribution and concentration gradients of airborne contaminants [
12,
13].
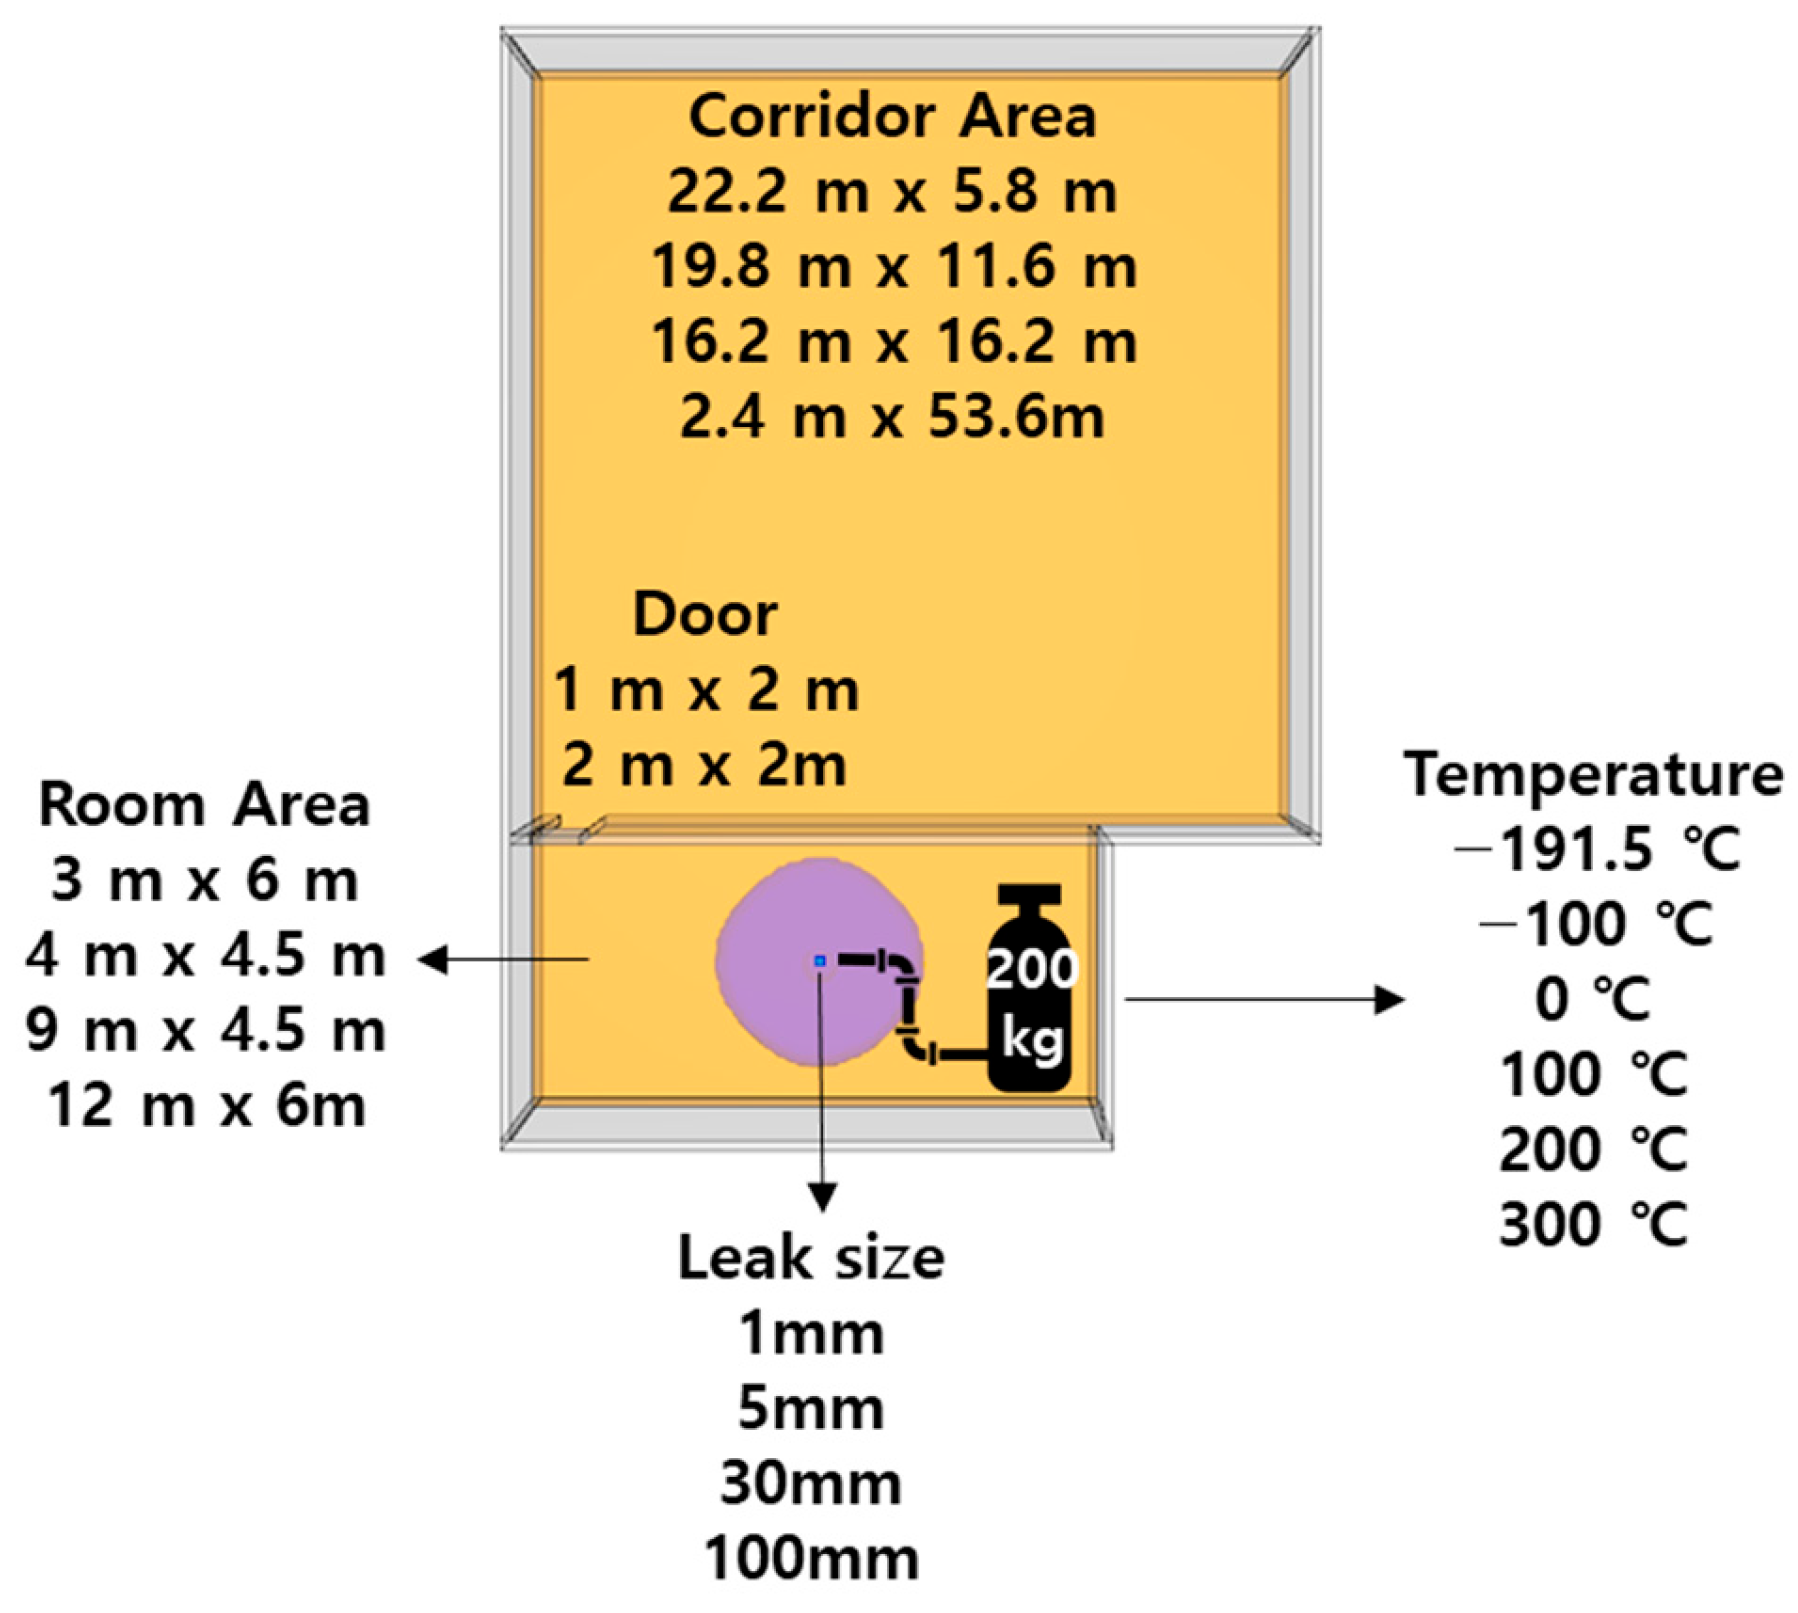
The variables affecting the dispersion of hazardous chemicals during a leakage event include material data, such as the molecular mass of the substance; process data, including the temperature and pressure utilized during operation; and spatial data, which accounts for the building area and geometry. Consequently, variables expected to exert a significant effect on the material, process, and spatial data were selected to prepare different simulation scenarios. As shown in
Figure 2, six temperatures, four distinct leak diameters, four room sizes, four corridor dimensions, and two door sizes were used for simulation, yielding 768 simulation scenarios.
2.1. Hazardous Chemical Types and Leak Characteristics
In this study, we focused solely on the leakage of a gas-phase hazardous chemical. Gases characteristically undergo changes in their dispersion with respect to temperature. CO has similar properties to air, having a molecular mass of 28, and as the temperature rises, its density falls, resulting in buoyancy, and vice versa. CO was selected in this study because it was predicted that differences in dispersion type could be examined based on temperature-dependent changes in density.
In the simulations, six temperatures were set, from an initial −191.5 °C, which is the storage temperature of CO in a 200 kg storage tank, to a final 300 °C in increments of approximately 100 °C, and these were used to identify the trends based on the CO temperature. In the preliminary simulations, the leak diameters were set at 0.3, 0.5, 1, 5, 10, 30, 50, and 100 mm; however, the leak diameters of 0.3 and 0.5 mm were excluded because the time-weighted average (TWA) concentration did not reach criticality (see
Section 2.2) even after ≥2 h of leakage. Diameters of 10 and 50 mm were used for validation. Therefore, the training data included leak diameters of 1, 5, 30, and 100 mm.
2.2. Spatial Data
The spatial variables were selected based on the criteria of high-risk workplaces stated in the National Fire Protection Association (NFPA) 101 as follows, room area, corridor area, and door area [
17], as shown in
Figure 3. Based on the NFPA 101 criteria, the room area should be less than 200 ft
2 (approximately 18.58 m
2), and there should be a walking distance of less than 7.6 m. Hence, two areas, 3 m × 6 m and 4 m × 4.5 m, were applied to the simulation, and two more areas, 9 m × 4.5 m and 12 m × 6 m, were used to compare differences with regard to room area. The room height was constant at 3 m.
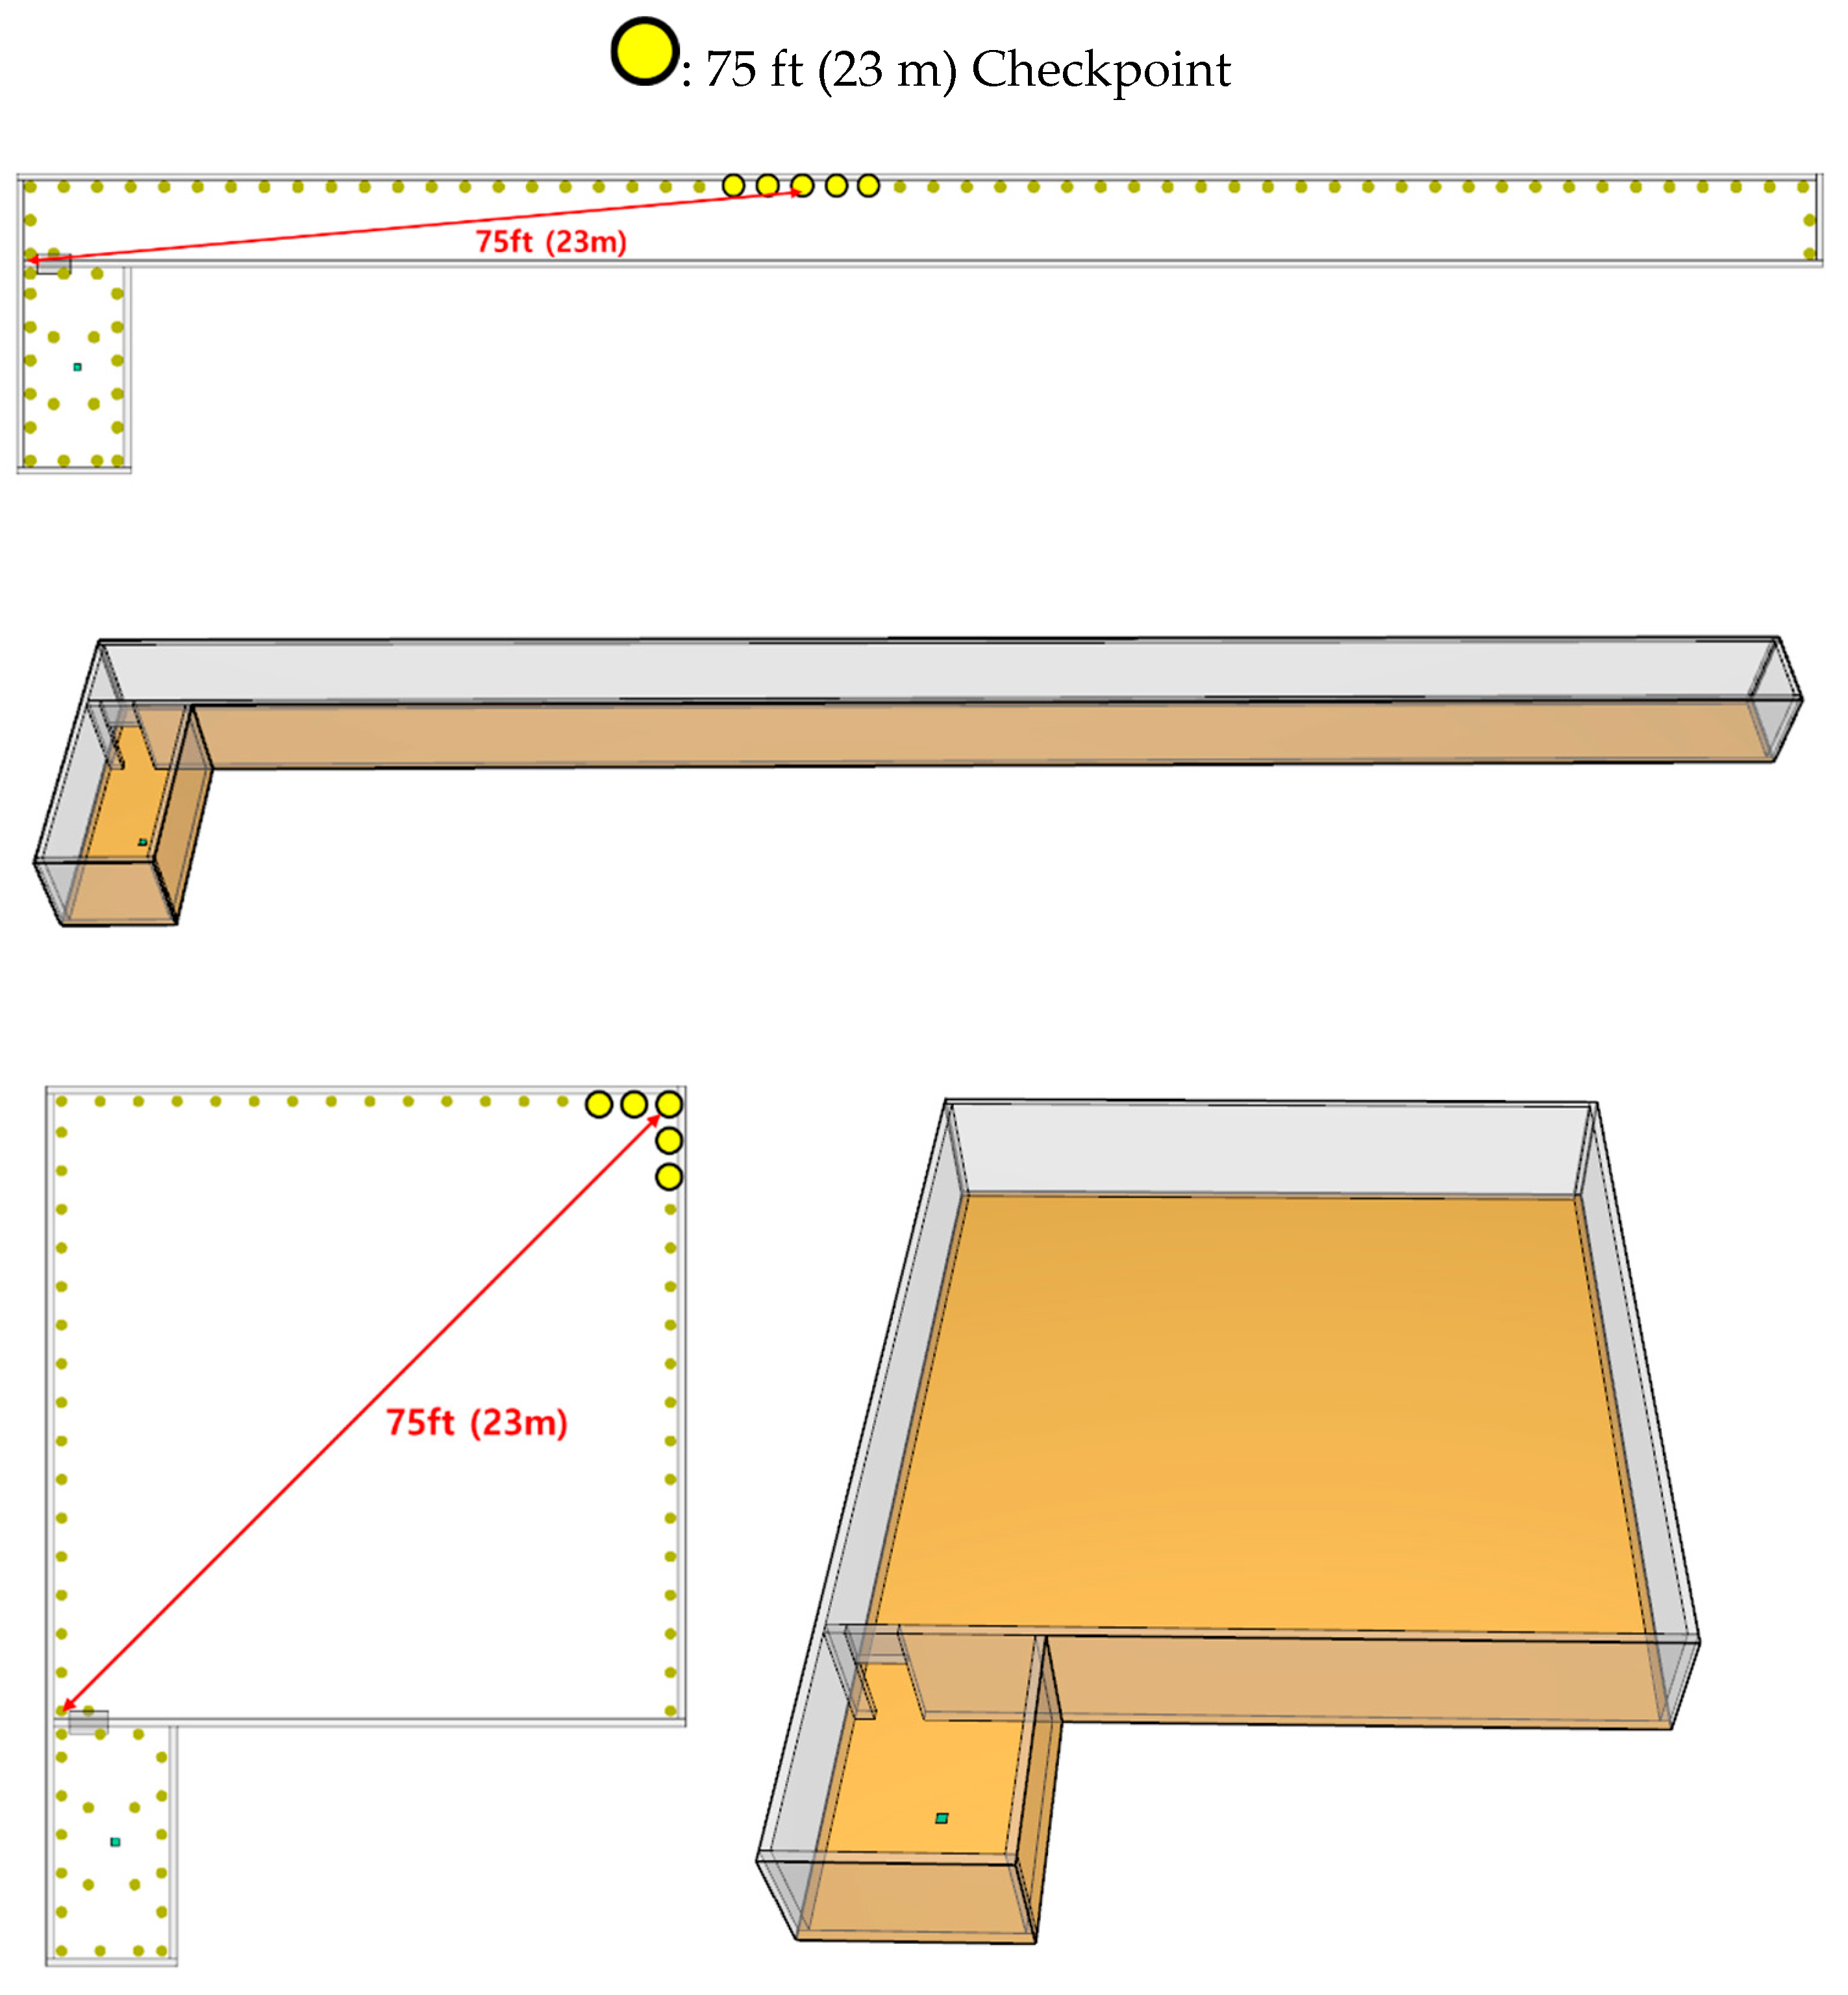
Four distinct corridor configurations were simulated: a 22.2 m × 5.8 m area; a 19.8 m × 11.6 m area; a 16.2 m × 16.2 m area, with the longest diagonal measuring less than 23 m; and another 22.2 m × 5.8 m area to evaluate the impact of the corridor shape when the total area remained constant (
Figure 4). Additionally, two standard door sizes were incorporated into the models, measuring 1 and 2 m, to assess their influence on the dispersion of hazardous chemicals.
The concentration of CO was measured with the breathing limit set at 1.8 m. The criteria for the TTC was 30 ppm, which is subsequently denoted as the TWA concentration. The measured concentrations showed irregularity because of turbulence. Therefore, five concentration checkpoints were set at 1 m intervals over a 75 ft (23 m) distance from the door of the room where the leak occurred. The average time at which a CO concentration of 30 ppm was exceeded for the first time at the five measurement points was defined as the TWA exceedance time.
In this study, all doors except the one connecting the room to the corridor were presumed to be closed at the time of the CO leak, and as the mesh, a 0.1 m grid in the room and a 0.2 m grid in the corridor were set to allow for rapid simulation [
10] (
Table 1). The hazardous chemical was set to be released from a vent of a 0.2 m × 0.2 m size in the center of the room.
2.3. Calculation of Leakage
The degree of leakage with respect to the leak diameter and storage temperature was estimated using the DISC/TVDI discharge model [
18], and the leak was presumed to originate from a vent of a 0.2 m × 0.2 m size at the center of the room.
Table 2 presents the degree of leakage with respect to the leak diameter and storage temperature.
3. Results and Discussion
3.1. Leak Dispersion Type with Respect to Temperature
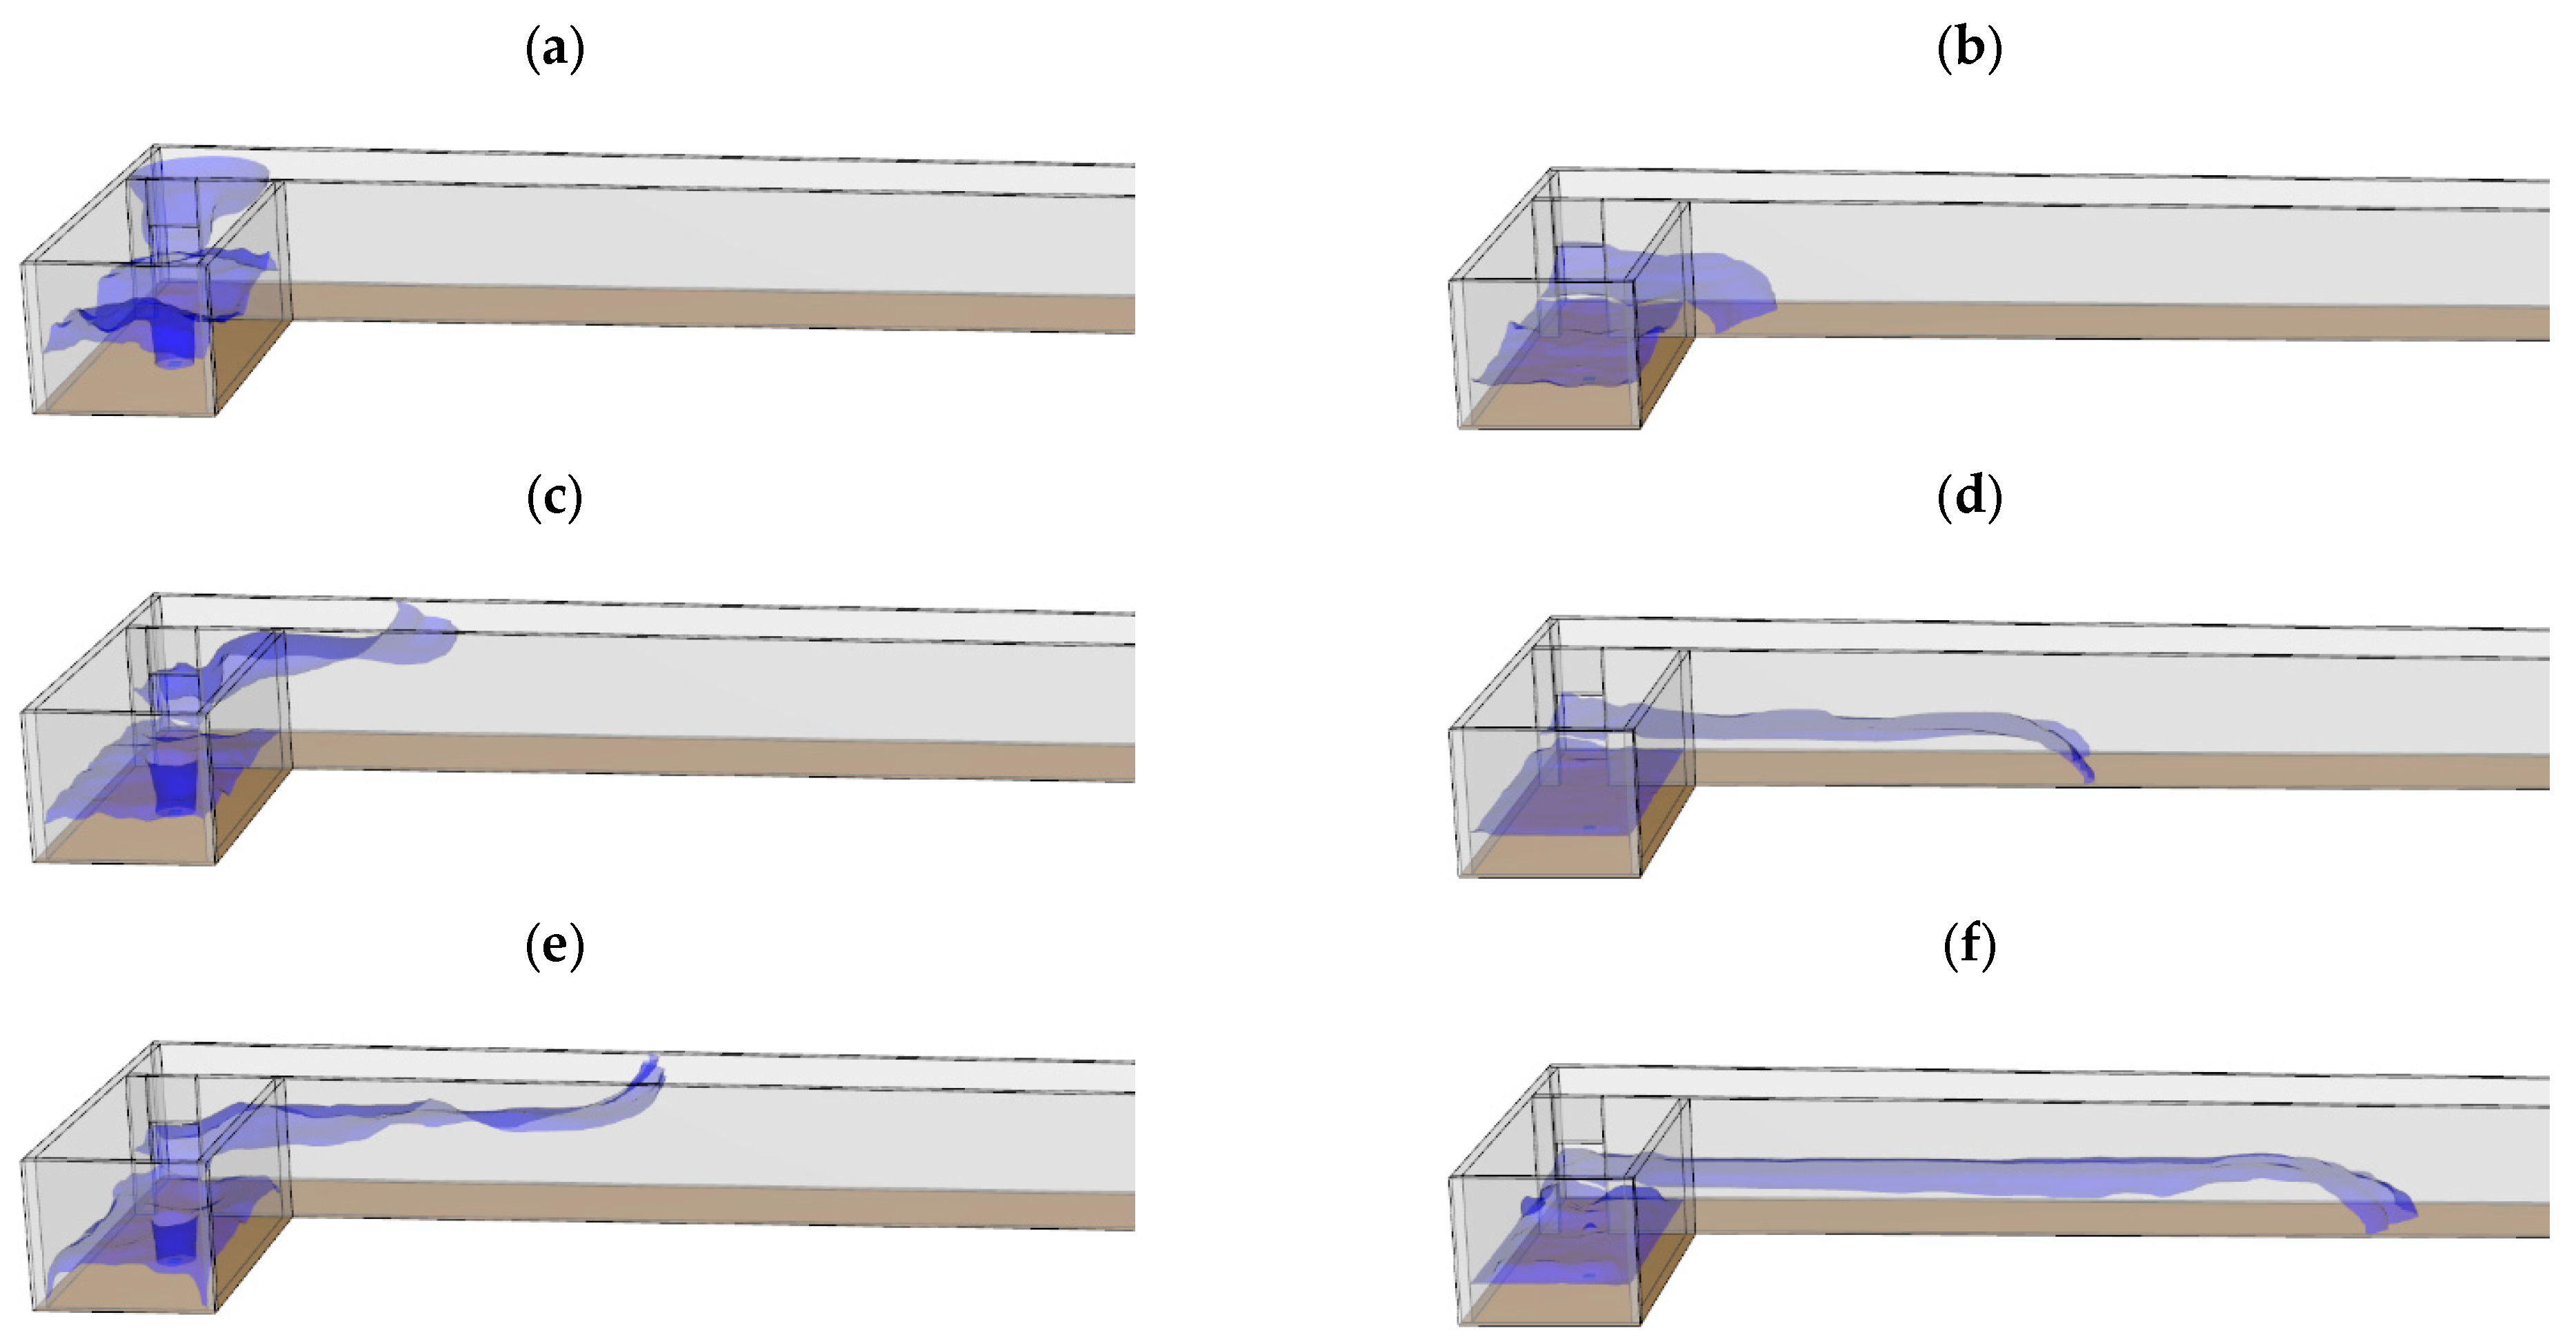
To assess the differences in the dispersion type caused by the differences in the temperature-dependent density, CO gas leakage simulations at 300 and −191.5 °C were compared.
Figure 5a and
Figure 5b show CO leakages at 300 and −191.5 °C, respectively, with which the gas fills the ceiling and floor areas first in the former and latter cases, respectively, and the results obtained at different times are shown in
Figure 6. Thus, the dispersion varied according to the temperature-dependent density. Consequently, analysis of densities above and below that of air is required.
3.2. Correlation Analysis of TWA and Independent Variables
Using the CO leakage simulation results and based on the NFPA 101 criteria, the TWA exceedance time was calculated for the device located 75 ft (23 m) along the diagonal line of the corridor set to satisfy ≤75 ft (≤23 m) between the door and the exit.
3.3. Trend Analysis Using Scatter Plots
The TWA exceedance time was analyzed for a walking distance of 75 ft (23 m) based on the spatial data and leakage data. In
Figure 7, the scatter plots display the average TWA exceedance time for the checkpoints for different room and corridor areas. As shown in
Figure 6b and
Figure 7a, the average TWA increases linearly with an increase in area.
Similarly, as shown in
Figure 7c, at temperatures ≤0 °C, the higher density of CO causes the gas to accumulate from the floor area upwards, resulting in an increasing trend in the TWA exceedance time with an increase in temperature. In contrast,
Figure 6d shows that at temperatures >0 °C, the lower density of CO compared to air leads to the gas filling the ceiling area first, which may result in quicker detection, and thus a decrease in the TWA exceedance time with an increase in temperature.
Figure 6f and
Figure 7e show the effect of the leak diameter and inverse leak diameter. As shown in the latter figure, there is a linear increasing trend in the TWA.
3.4. Leakage Regression Equation for Gas with a Density Lower Than That of Air (above 20 °C)
Multiple regression analysis was performed using the TWA exceedance time as the dependent variable and the leak diameter, room area, leak temperature, and corridor area as the independent variables. The fit to the regression equation was increased after the log conversion of the independent variables, and thus non-log and log-converted models were produced [
19].
The coefficient of determination (
R2) was assessed to evaluate the accuracy of the regression equations. For a multiple regression analysis, an overfitted model can be obtained if a greater number of independent variables are used because this increases
R2. Thus, to prevent overfitting, the accuracy of the regression equation was evaluated based on the adjusted
R2 (
R2adj) [
20].
Additionally, the model significance outcome was tested by assessing the regression coefficient using the p-value at the 95% confidence interval. That is, statistical significance was set as p < 0.05.
As shown in
Table 3, all the regression coefficients had
p < 0.05, demonstrating significance at the 5% level. Although
R2adj did not vary markedly from
R2 for either regression equation, a higher accuracy was achieved using the log model (
R2adj = 0.951 and 0.725). Furthermore, because the leak diameter exhibited the largest standardized regression coefficient (the so-called beta coefficient,
β) for the two equations, it is believed to have a stronger effect on the TWA exceedance time than the other independent variables.
The regression equations to express the TWA exceedance time based on multiple regression analysis for the leakage of gas with a density lower than that of air are shown in Equations (1) and (2).
Here, ttwa is the TWA exceedance time at 75 ft (23 m) in seconds, Dleak_rev is the inverse of the leak diameter in millimeters, Tleak_K is the leak temperature in kelvins, Aroom is the area of the room with hazardous chemical leakage in square meters, and Acorridor is the area of the corridor connected to the room in square meters.
3.5. Leakage Regression Equation for Gas with a Density Higher Than That of Air (Below 20 °C)
As shown in
Table 4, regression analysis conducted on gas leaks with a density higher that of air revealed a statistically significant result (
p < 0.05) when logarithmic transformation was applied to all the variables. However, for the corridor area, the model was not statistically significant (
p ≥ 0.05) without logarithmic transformation. The
R2adj remained consistent with the
R2 for both models, although the log-transformed equation demonstrated enhanced precision, having
R2adj values of 0.982 and 0.604, respectively. As before, the leak diameter, which presented the highest β in both models, should have a greater effect on the TWA exceedance time than the other independent variables.
The regression equations for characterizing the TWA exceedance time for gas leaks denser than air are shown in Equations (3) and (4). The variables incorporated into this equation are analogous to those in Equations (1) and (2).
3.6. Validation of the Regression Equations
To validate Equations (1)–(4), 245 random scenarios for the variables shown in
Table 5 were used to obtain calculated values for the simulation and the estimated values of the regression equations. To compare the differences between the calculated and estimated values, the absolute percentage error (APE), as given by Equation (5), was used.
The APEs for the regression equations for CO at a temperature-dependent density lower than air (Equations (1) and (2), respectively) were 17.2% and 28%, and for CO at a temperature-dependent density higher than air (Equations (3) and (4), respectively), they were 19.3% and 173.6%. Therefore, a higher fit was shown by the regression equation with log conversion (Equations (1) and (3)) based on the lower APE.
4. Conclusions
In this study, CO leakage from a storage tank was simulated, and a regression model to predict the time-weighted average (TWA) exceedance time at a distance of 75 ft (23 m) from the room experiencing a leak was developed. The study’s findings offer significant insights for developing emergency response plans tailored to specific leak sizes at sites involving hazardous material handling. The results are particularly useful in determining the size of the leak based on real-time data from hazardous chemical leak monitoring sensors deployed at industrial sites.
The study emphasizes that the type of gas leak greatly impacts the regression model due to the gas’s buoyancy, which is influenced by its density. Moreover, this study primarily focused on simulating the leakage of gas-phase hazardous chemicals. Future research should extend to investigating the leakage of liquid-phase chemicals to provide a comprehensive understanding of leak dynamics. Liquid-phase leaks may behave differently from gas-phase leaks due to factors such as viscosity, evaporation rates, and interaction with surfaces, necessitating distinct modeling and response strategies.
Future research directions include further refinement of the regression model to account for different types of hazardous gases, as each gas has unique properties affecting its dispersion and detection. Additionally, studies should explore the integration of advanced sensor technologies and machine learning algorithms to enhance the prediction accuracy and response efficiency. Investigating initial response procedures associated with varying leak sizes will also be crucial for improving on-site safety protocols.
Furthermore, future studies could benefit from exploring the influence of environmental factors such as temperature, humidity, and air currents on gas dispersion patterns. Understanding these factors can lead to more accurate predictions and better preparedness to handle hazardous chemical leaks. Collaborative research involving multidisciplinary teams, including chemical engineers, safety experts, and data scientists, will be essential in advancing this field and ensuring the development of robust, comprehensive safety measures.
Overall, this research sets the foundation for ongoing advancements in the field of hazardous chemical leak detection and response. By leveraging CFD simulations and empirical validations, the findings can significantly contribute to enhancing industrial safety and mitigating the risks associated with hazardous material handling.
Author Contributions
Conceptualization, K.K. and D.S.; Methodology, K.K. and D.S.; Software, K.K.; Investigation, K.K.; Data curation, K.K.; Writing—original draft, K.K.; Writing—review & editing, K.K. and D.S.; Supervision, D.S.; Project administration, D.S. All authors have read and agreed to the published version of the manuscript.
Funding
This research was supported by a grant (RS-2022-00155595) from the Research and Development program to advance convergence technology of disaster safety, funded by the Ministry of Interior and Safety (MOIS, Korea).
Data Availability Statement
The original contributions presented in the study are included in the article, further inquiries can be directed to the corresponding author.
Conflicts of Interest
Author Kisung Kim was employed by the company Korea Fire & Explosion Solutions Corporation. The remaining author declares that the research was conducted in the absence of any commercial or financial relationships that could be construed as a potential conflict of interest.
References
- National Chemicals Information System. Current Status and Cases of Chemical Accidents. Available online: https://icis.me.go.kr/pageLink.do (accessed on 12 January 2023).
- Ryoo, H.-C.; Kim, S.-H.; Cho, G.-S. A Study on the Necessity of Manhole Management System for the Prevention of Asphyxiation Disaster. J. Korea Acad. Coop. Soc. 2023, 24, 80–89. [Google Scholar] [CrossRef]
- Ruan, H.L.; Deng, W.S.; Wang, Y.; Chen, J.B.; Hong, W.L.; Ye, S.S.; Hu, Z.J. Carbon Monoxide Poisoning: A Prediction Model Using Meteorological Factors and Air Pollutant. BMC Proc. 2021, 15, 1. [Google Scholar] [CrossRef] [PubMed]
- Law, W.P.; Gimbun, J. Modeling the Effect of Hypothetical Chlorine Leakage from Malay-Sino Chemical Industries Using ALOHA Software and Development of an Emergency Evacuation Route around Teluk Kalong Industrial Area. IOP Conf. Ser. Mater. Sci. Eng. 2020, 736, 72015. [Google Scholar] [CrossRef]
- Dadkani, P.; Noorzai, E.; Ghanbari, A.H.; Gharib, A. Risk Analysis of Gas Leakage in Gas Pressure Reduction Station and Its Consequences: A Case Study for Zahedan. Heliyon 2021, 7, e06911. [Google Scholar] [CrossRef] [PubMed]
- Pouyakian, M.; Ashouri, M.; Eidani, S.; Madvari, R.F.; Laal, F. A Systematic Review of Consequence Modeling Studies of the Process Accidents in Iran from 2006 to 2022. Heliyon 2023, 9, e13550. [Google Scholar] [CrossRef] [PubMed]
- Ko, M.W.; Oh, C.B.; Han, Y.S.; Choi, B.I.; Do, K.H.; Kim, M.B.; Kim, T.H. Numerical Simulation of Hazardous Chemical Dispersion in the Industrial Area. Proc. Int. Conf. Comput. Inf. Syst. Ind. Appl. 2015, 18, 905–906. [Google Scholar]
- Dong, J.; Du, W.; Wang, B.; Cao, C.; Chen, S.; Xu, Q. Impact Analysis of Multi-Sensor Layout on the Source Term Estimation of Hazardous Gas Leakage. J. Loss Prev. Process. Ind. 2021, 73, 104579. [Google Scholar] [CrossRef]
- Dong, J.; Wang, B.; Wang, X.; Cao, C.; Chen, S.; Du, W. Optimization of Sensor Deployment Sequences for Hazardous Gas Leakage Monitoring and Source Term Estimation. Chin. J. Chem. Eng. 2023, 56, 169–179. [Google Scholar] [CrossRef]
- Truchot, B.; Duplantier, S. Dispersion in Confined Building: A Coupled Approach. In International Symposium on Safety Science and Technology 2010 (ISSST 2010); Science Press: Beijing, China, 2010; pp. 1239–1250. [Google Scholar]
- Gu, D.; Zheng, Z.; Zhao, P.; Xie, L.; Xu, Z.; Lu, X. High-Efficiency Simulation Framework to Analyze the Impact of Exhaust Air from Covid-19 Temporary Hospitals and Its Typical Applications. Appl. Sci. 2020, 10, 3949. [Google Scholar] [CrossRef]
- Yadav, A.; Jeong, B. Safety Evaluation of Using Ammonia as Marine Fuel by Analysing Gas Dispersion in a Ship Engine Room Using CFD. J. Int. Marit. Saf. Environ. Aff. Shipp. 2022, 6, 99–116. [Google Scholar] [CrossRef]
- Mouilleau, Y.; Champassith, A. CFD Simulations of Atmospheric Gas Dispersion Using the Fire Dynamics Simulator (FDS). J. Loss Prev. Process. Ind. 2009, 22, 316–323. [Google Scholar] [CrossRef]
- Zhou, H.; Song, W.; Xiao, K. Simulating Flow and Hazardous Gas Dispersion by Using WRF–CFD Coupled Model under Different Atmospheric Stability Conditions. Atmosphere 2022, 13, 1072. [Google Scholar] [CrossRef]
- Wang, Z.; Liu, Y.; Liang, H.; Xu, Z.; Bu, F.; Zhang, J.; Du, H.; Wang, Y.; Chen, S. Leakage Analysis and Hazardous Boundary Determination of Buried Gas Pipeline Considering Underground Adjacent Confined Space. Energies 2022, 15, 6859. [Google Scholar] [CrossRef]
- Kim, S.-e.; Lee, K.; Kang, C.; Jung, S. Tracer Gas Test and CFD Analysis of Semiconductor Gas Box for Flammable Gas Leakage. Energies 2022, 15, 8166. [Google Scholar] [CrossRef]
- NFPA. NFPA 101 Life Safety Code 2018, 7.11 Special Provisions for Occupancies with High Hazard Contents, 2018 ed.; National Fire Protection Association: Quincy, MA, USA, 2018; pp. 7-11–7-16. [Google Scholar]
- Witlox, H.W.M.; Harper, M.; Oke, A.; Stene, J. Phast Validation of Discharge and Atmospheric Dispersion for Pressurised Carbon Dioxide Releases. J. Loss Prev. Process. Ind. 2014, 30, 243–255. [Google Scholar] [CrossRef]
- Kwak, H.-C.; Song, J.Y.; Lee, I.M.; Lee, J. Macro-Level Accident Prediction Model Using Mobile Phone Data. J. Korean Soc. Saf. 2018, 33, 98–104. [Google Scholar]
- Jung, Y.J.; Lee, C.J. A Study on the Estimation Model of Liquid Evaporation Rate for Classification of Flammable Liquid Explosion Hazardous Area. J. Korean Soc. Saf. 2018, 33, 21–29. [Google Scholar]
| Disclaimer/Publisher’s Note: The statements, opinions and data contained in all publications are solely those of the individual author(s) and contributor(s) and not of MDPI and/or the editor(s). MDPI and/or the editor(s) disclaim responsibility for any injury to people or property resulting from any ideas, methods, instructions or products referred to in the content. |
© 2024 by the authors. Licensee MDPI, Basel, Switzerland. This article is an open access article distributed under the terms and conditions of the Creative Commons Attribution (CC BY) license (https://creativecommons.org/licenses/by/4.0/).


