1. Introduction
The evolution of remote sensing technology has seen it become an indispensable tool in the acquisition of geographic information, thanks to its expansive reach and wealth of detail. The extraction and segmentation of buildings from remote sensing images have significant application value in practice [
1]. Building segmentation facilitates the precise extraction of key data points, including the exact location and spatial boundaries of the structures. This capability is crucial for understanding the built environment. The data obtained from this process lays the groundwork for subsequent analytical work and practical application of the information, which is vital for making informed decisions and executing strategic plans across various fields [
2]. These applications encompass urban planning, the development of smart cities, the management of land resources, and the assessment of disaster risks, all of which rely on accurate and detailed insights derived from building segmentation [
3].
Over the years, a multitude of approaches have been developed for the segmentation of buildings in remote sensing images. Predominantly, these traditional approaches hinge on the extraction of various features such as texture, geometric properties, spectral information, and shadows to distinguish buildings. For example, Partovi et al. [
4] utilized parametric and tracking algorithms to pinpoint the building boundary points, which were then assembled into polygons outlining building contours. Ghaffarian [
5] applied a dual-threshold shadow detection technique, leveraging the shadow shapes and solar illumination directions for building detection. Dikmen et al. [
6] combined shadow detection with spectral characteristics for the segmentation of buildings. Yuan et al. [
7] incorporated both spectral and textural data in their segmentation methodology, focusing on the extraction of building structures. Abdullah et al. [
8] employed LIDAR data grouped with a digital elevation model (DEM) for automated segmentation, while Noyel et al. [
9] introduced a general morphological segmentation approach for hyperspectral images using the watershed transformation. Yamashita et al. [
10] applied the discriminant theory to classify LIDAR-derived polygons as either buildings or non-buildings. Despite their contributions, these methods are constrained by the need for multi-source data and exhibit a high degree of complexity, which can limit their broader application.
The traditional methods for building segmentation, as previously discussed, are heavily dependent on manual feature engineering and selection processes. This reliance may inadvertently overlook the critical information or intrinsic correlations within the dataset, which can diminish the models’ generalization capabilities. Consequently, these models may produce subpar segmentation outcomes when confronted with the intricacies of complex remote sensing images. In recent years, the advent of deep learning has revolutionized the domain of image processing. Convolutional neural networks (CNNs), in particular, have demonstrated remarkable advancements in a spectrum of computer vision tasks, including semantic segmentation [
11]. This holistic learning approach significantly streamlines the classification process, transcending the limitations of traditional feature engineering that relies on human expertise. Notable CNN architectures such as UNet [
12], DeepLabV3 [
13], and EncNet [
14] have garnered substantial acclaim for their achievements in semantic segmentation across diverse domains, encompassing natural images, medical imaging, and remote sensing imagery. Given that convolutional operations are inherently focused on local receptive fields, the aforementioned CNN-based methods have innovated by incorporating large kernel convolutions, dilated convolutions, and the stacking of convolutional and pooling layers. These enhancements are designed to expand the receptive field, thereby capturing a broader context and facilitating the extraction of more comprehensive and nuanced features from the data.
In contrast to traditional convolutional operations, non-local neural networks [
15] extend the concept of non-local mean operations in computer vision. They introduce a mechanism that captures the relationships between pixels over long distances, irrespective of their spatial separation. DNLNet (Disentangled Non-Local Neural Networks) [
16] builds upon this non-local mechanism by introducing the DNL block, which is designed to replace the conventional non-local block. This innovation further enhances the precision of semantic segmentation tasks. Fu et al. [
17] proposed the Dual Attention Network (DaNet), which integrates channel and spatial attention mechanisms based on self-attention. Following the success of the Transformer model [
18] in natural language processing, where it employs a multi-head self-attention mechanism to supplant the convolutional modules, there has been a surge in research adapting this model to the visual domain. Notably, Dosovitskiy et al. [
19] pioneered the application of the Vision Transformer (ViT) architecture to image recognition tasks, substantiating its efficacy. This was followed by Strudel et al. [
20], who innovatively adapted the ViT-based Segmenter network for image segmentation tasks. However, the computational expense of self-attention within the Transformer framework can be exceedingly high [
21], and certain operations may prove to be redundant [
22]. Additionally, while self-attention-based transformer-structured networks excel on extensive datasets, they can encounter difficulties when trained on smaller, more limited datasets [
23]. These challenges necessitate further research and innovation to optimize the application of transformer models within the visual domain.
The task of semantic segmentation for buildings in remote sensing images presents unique and heightened challenges when juxtaposed with the segmentation of natural images. Beyond the multi-scale features that are prevalent in the natural images, the remote sensing imagery is characterized by intricate backgrounds filled with a multitude of objects that are unrelated to buildings. This complexity can lead to interference from the background with the segmentation of the targets [
24]. Furthermore, there are instances where the buildings and non-building elements may bear a resemblance in appearance, such as the scenarios where the roofs of certain buildings blend in with the roads, making them indistinguishable [
25]. Current models for building segmentation in remote sensing images have predominantly drawn upon the architectures that have demonstrated efficacy in the segmentation of natural images. For example, Qian et al. [
26] harnessed the capabilities of DeepLabV3 for semantic segmentation of buildings. Benchabana et al. [
27] employed the superpixels to aggregate image pixels and subsequently utilized a variational autoencoder coupled with a CNN for building identification and detection. Wang et al. [
28] introduced a dual-path Vision Transformer (ViT) network tailored for building segmentation. Cui et al. [
29] proposed an enhanced Transformer model to segment densely packed urban buildings from remote sensing images with intricate backgrounds. Despite these advancements, existing methods have not fully considered the distinctive attributes of buildings, such as their relatively regular boundaries. These features represent crucial prior information and constitute a significant distinction between buildings and other non-building elements, including land, vegetation, and roadways. Incorporating such characteristics could potentially enhance the accuracy and reliability of building segmentation in remote sensing images.
Recently, researchers including Liu et al. [
30], Li et al. [
31], and Ding et al. [
32] have redesigned and refined convolutional operations and the underlying structures of CNN networks. These efforts have significantly bolstered the representational capacity of CNNs. Motivated by such progress, we have re-examined the CNN-based UNet network model [
12], which was originally crafted as an end-to-end solution for medical image segmentation on modestly scaled cellular datasets. The UNet model’s outstanding segmentation capabilities have inspired a plethora of scholars to extend its framework, giving rise to a variety of enhanced iterations. Notable among these are nnU-Net with a self-configuring approach [
33], dynamic U-Net [
34] and AgileFormer [
35]. These adaptations integrate dynamic convolutions or dynamic deformable attention mechanisms into the UNet’s original design, yielding remarkable outcomes in the domain of medical image segmentation. Beyond the medical sector, as research has progressed, the UNet model has been progressively adapted for the segmentation of buildings in remote sensing images, with equally remarkable results. For instance, Daranagama, S. et al. [
36] proposed a UNet architecture based on image enhancement and polygon regularization for building detection. Pan et al. [
37] introduced a deep learning architecture based on UNet for the segmentation and classification of urban village buildings. Su et al. [
38] refined the UNet-based building segmentation technique by integrating DenseNet, UNet, dilated convolutions, and DecovNet. Lei et al. [
39] presented an attention-based dual hybrid attention UNet tailored for pixel-level building segmentation. Ahmadi, S.A. et al. [
40] designed a two-stage UNet architecture for building damage detection. These are all improvements made to the UNet architecture. In this paper, we have taken a step further by not only refining and optimizing the architecture of UNet but also integrating crucial prior knowledge into our network design. Specifically, we propose a prior-guided dual-branched multi-feature fusion network that has infused regional aggregation information derived from superpixels and the boundary details of buildings to obtain more accurate segmentation results.
The specific contributions of this paper are as follows:
Novel Network Architecture: We design a novel building segmentation network termed the prior-guided dual branch multi-feature fusion network (PDBMFN). This framework encompasses a prior-guided branch network (PBN) in the encoding process, a parallel dilated convolution module (PDCM) designed to assimilate prior information, and a multi-feature aggregation module (MAM) in the decoding process. The integration and encoding of PBN’s prior information within the PDCM are further augmented by the MAM during the decoding phase, refining the feature representation.
Prior-guided Branch Network: We propose the prior-guided branch network (PBN), which integrates prior knowledge to enhance segmentation accuracy. PBN capitalizes on the regional aggregation properties of superpixels and the boundary cues from edge images, improving the accuracy of the building boundaries in the segmentation output.
Parallel Dilated Convolution Module: We present the parallel dilated convolution module (PDCM), which initially consolidates encoded prior feature information from dual branches. Subsequently, it employs parallel dilated convolution kernels with varying dilation rates to apprehend multi-scale contextual information. This strategy enables the network to adapt to targets of varying dimensions, enhancing its scene comprehension. We also incorporate the convolutional block attention module (CBAM) to integrate and refine features derived from different dilated convolutions.
Multi-feature Aggregation Module: We construct the multi-feature aggregation module (MAM), which progressively aggregates feature information from assorted layers during the network’s decoding stage. By integrating aggregated skip connections, the MAM deeply merges shallow, fine-grained features with profound semantic information, capitalizing on their synergistic interplay to construct an enriched and holistic feature representation, thereby optimizing the network’s segmentation efficacy.
The subsequent sections of this paper are structured as follows:
Section 2 delineates the structure of the proposed network model.
Section 3 demonstrates the model’s merits through empirical analyses and comparative studies.
Section 4 concludes the paper with a summarizing overview.
2. Proposed Method
In this section, we first present the overall structure of PDBMFN. Subsequently, we introduce the image superpixel segmentation and edge detection methods used in the PDBMFN network, along with the PBN, PDCM, and MAM modules. Finally, we discuss the loss function employed by the network.
2.1. The Architecture of PDBMFN
The PDBMFN is a deep convolutional neural network, employing an encoder-decoder architecture akin to the UNet. The foundational operations of this architecture include downsampling, convolution, upsampling, and feature concatenation. However, the inherently limited receptive field of standard convolutions restricts the network’s capacity to capture expansive global features. Moreover, the max pooling operation, while reducing dimensionality, can inadvertently discard critical feature information. Additionally, the upsampling and downsampling primarily consider local features within individual channels. The feature fusion facilitated by skip connections is also somewhat limited, as it only concatenates features along the channel dimension, without actively exploring the interrelationships between features across different channels.
In response to the aforementioned challenges, we have engineered the PDBMFN network model, which extends the capabilities of traditional convolutional networks and refines the precision of global feature extraction and segmentation outcomes. The PDBMFN network primarily comprises three essential components: the PBN, the PDCM, and the MAM. The architecture of this network model is visually represented in
Figure 1, which illustrates the data flow within the network and delineates the interrelationships among its various components.
Enhancing Segmentation Accuracy with PBN. Firstly, we introduce the PBN structure (Regional Prior-guided Branch and Edge Prior-guided Branch in
Figure 1), which takes advantage of the region aggregation properties of superpixels and the boundary prior information from images. This enhances the accuracy of building detection during the encoding process.
Expanding Receptive Field with PDCM. Then, we incorporate the PDCM to counteract the small receptive field problem associated with convolutions. The PDCM is designed to expand the receptive field, allowing for a more comprehensive capture of contextual information. We then utilize the convolutional block attention module (CBAM) to refine features by enriching channel and spatial feature representations. We derive attention-enhanced features that retain essential building information while filtering out noise and irrelevant details.
Feature Aggregation with MAM. Lastly, the MAM module is designed to aggregate feature information progressively from different decoding levels during the decoding stage. By incorporating comprehensive skip connections, the MAM effectively intertwines superficial, fine-grained features with deeper semantic insights. As a result, the network’s segmentation performance is significantly enhanced.
The operational mechanisms of each module in the PDBMFN are to be thoroughly elucidated in the ensuing sections. It is important to note that, apart from the PDCM and MAM integral to the PDBMFN, the network’s upsampling, downsampling, and convolutional structures are preserved in accordance with the original UNet.
2.2. Deriving Prior Information from Remote Sensing Images
In PDBMFN, we initiate the process by conducting superpixel segmentation on the original image to extract regional prior information. Concurrently, we perform edge detection on the original image to procure an accurate edge prior information image. Consequently, the input to the PDBMFN network model encompasses not only the original image but also its corresponding superpixel and edge detection images. The prior-guided network is conducive to feature extraction, enhancing the segmentation accuracy of building structures in remote sensing images.
2.2.1. Deriving Prior Information of Regions through Superpixel Segmentation
A superpixel is an image segmentation technique that groups adjacent pixels with similar textures, colors, brightness, and other characteristics into a single superpixel, which is then filled with a uniform color. Superpixels efficiently represent image features using fewer pixels, greatly reducing the complexity of post-processing. They are widely used in the field of computer vision. The SLIC [
41] algorithm (Simple Linear Iterative Clustering), as its name suggests, is a simple iterative clustering superpixel segmentation algorithm with linear complexity. Due to its excellent performance in both computational speed and segmentation effect, this paper adopts SLIC as the superpixel segmentation algorithm.
The SLIC algorithm generates superpixels based on the k-means clustering algorithm. Given an image with pixels, the algorithm divides it into superpixels of approximately the same size, with each superpixel containing approximately pixels. During the initial clustering, the adjacent distance between the centers of two neighboring superpixels is approximately . The overall process of the SLIC algorithm is similar to k-means. During clustering, it iteratively calculates the cluster with the minimum distance, updates the center point of the superpixel, and reassigns the membership of other pixels.
In the traditional k-means algorithm, the distance from each cluster center to every pixel in the image needs to be calculated. In stark contrast, the SLIC algorithm limits the search area by only searching for similar pixels within a region around the superpixel center. This significantly reduces the number of distance calculations required, resulting in a clear speed advantage compared to conventional k-means clustering.
Figure 2 illustrates the outcomes of SLIC superpixel segmentation with varying initializations of the control parameter
. The original image is sourced from the Inria Aerial Dataset. As
increases, the size of the superpixels decreases, and the segmentation results become closer to the original image with faster algorithmic computation. Conversely, when
decreases, the superpixels become larger, resulting in greater loss of regional and boundary information, greater deviation from the original image, and slower computation speed. Therefore, it is necessary to strike a balance in selecting the value of
in experiments.
We set the number of SLIC superpixels to be one percent of the number of pixels in the original image, i.e.,
. Consequently, for images from the Inria Aerial Dataset and the Massachusetts Buildings Dataset, the number of superpixels in their superpixel images is 2500. Similarly, for images from the WHU dataset, the number of superpixels in their superpixel images is 2621. We will provide a detailed introduction to the configuration of the databases in
Section 3.1.
2.2.2. Deriving Edge Prior Information through Edge Detection
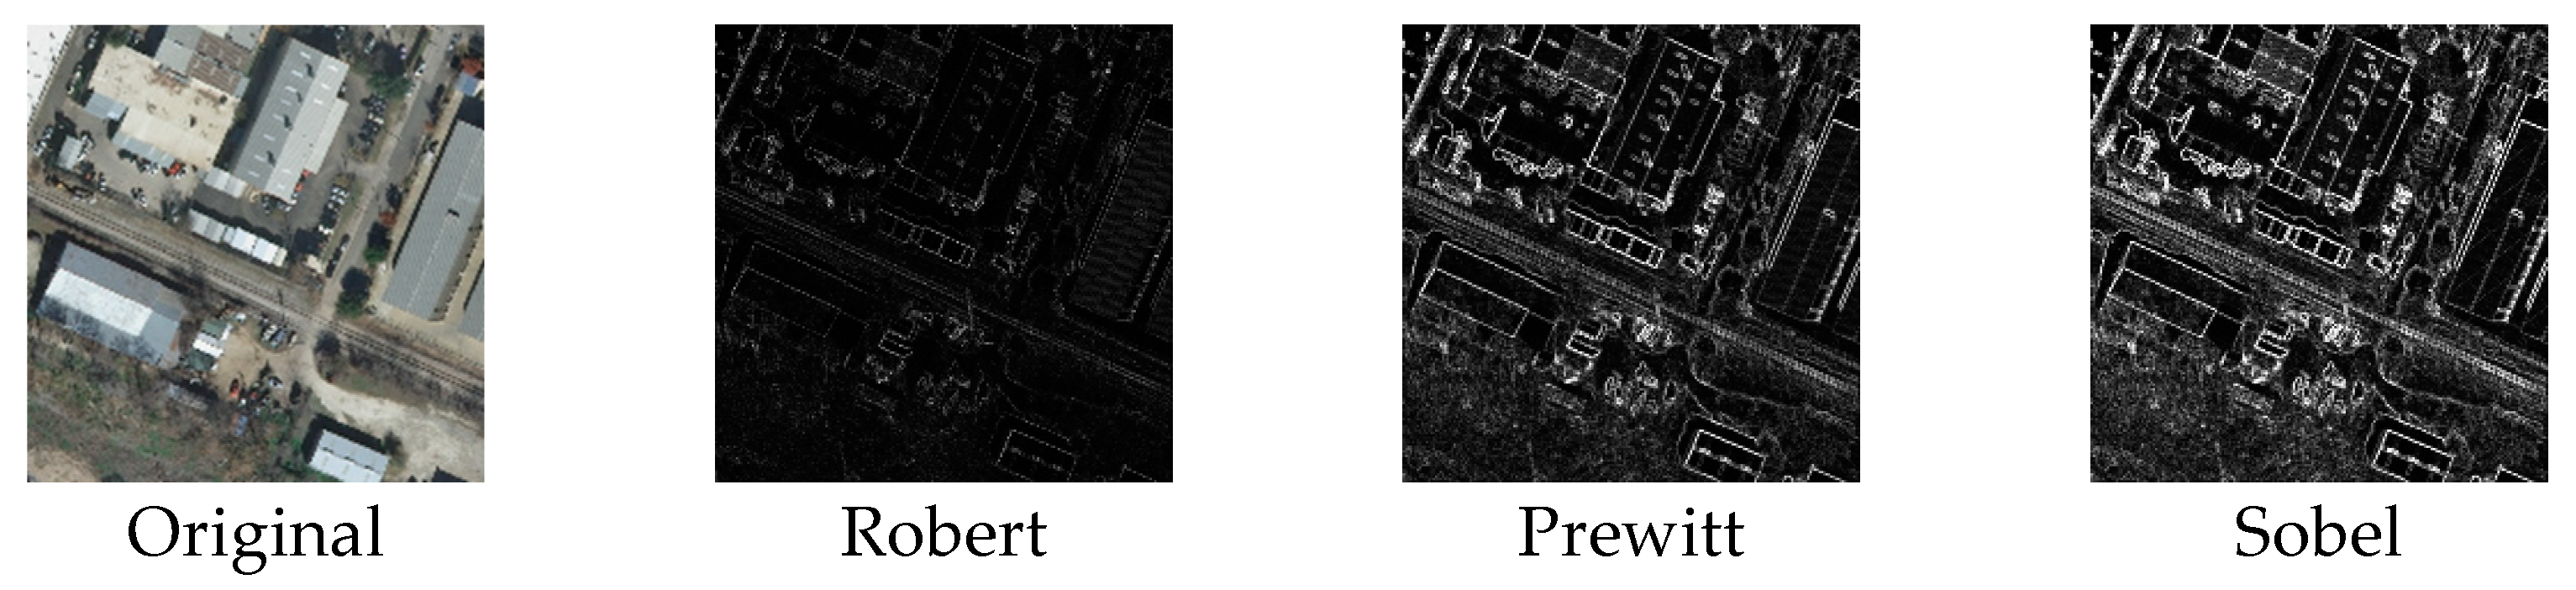
Edge detection is a fundamental technique within the domain of computer vision, designed to pinpoint regions of abrupt brightness variation—regions that define the edges within an image. Given the inherent discontinuities in pixel brightness, conventional edge detection algorithms, including the Robert, Prewitt, and Sobel operators (refer to [
42] for a detailed exposition of these methods), apply differential operators to identify edges. Among these, the Sobel operator stands out for its enhanced precision in edge localization and its superior noise suppression capabilities. Leveraging these benefits, we have chosen to employ the Sobel edge detection algorithm to generate an image that captures prior edge information. As illustrated in
Figure 3, the Sobel operator offers a clearer delineation of edge features and a reduced presence of noise when juxtaposed with the Robert and Prewitt operators, thereby providing a more refined edge detection outcome.
2.3. The Design of PBN Network Architecture
The PBN, depicted in
Figure 1, is a network with a dual-branch encoding architecture, comprising two distinct pathways: one guided by regional priors and the other by edge priors. This dual-branch structure is predominantly located in the encoding part of the PDBMFN, where the region prior-guided branch uses the prior information derived from superpixel segmentation to guide the segmentation of building areas, and the edge information from the edge prior-guided branch is further utilized to enhance the building edge features extracted by the edge prior-guided branch.
2.3.1. The Region Prior-guided Branch
The region prior-guided branch, as illustrated in
Figure 1, undertakes the encoding of the concatenated original image and its superpixel representation. This process involves a series of convolutional and downsampling operations that progressively refine the feature representation. Furthermore, this branch is designed to integrate edge features from the edge prior-guided branch via the Parallel Dilated Convolution Module (PDCM). This continuous feature fusion allows the region prior-guided branch to capture a richer semantic context, thereby achieving a more nuanced understanding of the building structures within the imagery.
Let
represent the feature map obtained after the
ith downsampling operation followed by a convolution in the region prior-guided branch. The definition of
is as follows:
In this context,
represents two consecutive
convolutions,
denotes the downsampling operations,
stands for concatenate,
and
refer to the original image and its corresponding superpixel image, respectively, and
is the number of downsampling operations. PDCM will be introduced in detail in
Section 2.4, and we will delve into the details of how the edge features from the edge prior-guided branch are incorporated into the features of the region prior-guided branch, enhancing the edge characteristics.
These dual branch networks facilitate a gradual compression of the input data, distilling all essential information into a condensed abstract form. Throughout the encoding phase, the dimensionality of the feature maps is effectively reduced by half via downsampling, while the richness of feature representation is enhanced by doubling the number of channels through consecutive convolution operations.
2.3.2. The Edge Prior-Guided Branch
The edge prior-guided branch involves encoding the edge map from the original image through multiple convolutions and downsampling operations to derive deeper semantic edge information from the input image, as shown in
Figure 1. Let
represent the feature map obtained after the
ith downsampling operation followed by a convolution in the edge prior-guided branch. The definition of
is as follows:
In this context, represents two consecutive convolutions, denotes the downsampling operations, refers to the original edge image, and is the number of downsampling operations.
2.3.3. Decoding Process
The decoding process aims to gradually transform the encoded abstract representation into meaningful outputs, namely the final network predictions of building or non-building information. Each step of the decoding process may rely on the output of its previous step as well as contextual information passed from the encoder. In the original UNet decoding process, the size of the feature map is doubled through upsampling, concatenated with the corresponding feature map from the encoding layer, and then the number of channels is halved through a double convolution operation. Building upon this approach, we employ the multi-feature aggregation module (MAM) to concurrently assimilate feature information from adjacent decoding layers. These neighboring feature maps encapsulate semantic insights extracted at varying depths by the network, each with distinct spatial dimensions. The MAM adeptly intertwines the superficial, fine-grained features from the preceding level with the profound semantic attributes of the subsequent level, culminating in an enriched aggregation of features. The MAM will be described in detail in
Section 2.5.
In summary, the PBN effectively merges the superpixel image, enriched with regional information, with the original image during the encoding phase, subsequently channeling this composite input into the encoding network. Concurrently, an edge image, derived from an edge detection algorithm, is directed into a separate encoding network. Post downsampling within the region prior-guided branch, the downsampled data from the edge prior-guided branch is seamlessly integrated via the PDCM, thereby refining the building edges. Expanding upon the UNet’s decoding paradigm, we incorporate the MAM to deeply amalgamate semantic information across various decoding strata. This aggregation of multi-level features significantly bolsters the network’s segmentation capabilities, yielding enhanced predictive accuracy in discerning building structures within remote sensing imagery.
2.4. The Design of PDCM Module
With a fixed kernel size, dilated convolution can increase the receptive field of output units without increasing computational complexity. PDCM utilizes parallel convolutions with different dilation rates to capture multi-scale contextual information under different receptive fields, adapting to targets of various sizes and enhancing the network’s understanding of the scene.
As illustrated in
Figure 4, the two inputs,
(from the region prior-guided branch) and
(from the edge prior-guided branch) are the downsampled feature maps obtained through double convolution from different branches. These two inputs are added together and then concatenated with the outputs of four convolutions with different dilation rates. Subsequently, batch normalization and ReLU activation are applied, followed by the introduction of the CBAM attention mechanism module. The specific calculation is as follows:
In the equations,
denotes a dilated convolution operation with a dilation rate of
and a kernel size of
. In this paper, we choose four parallel convolutions with dilation rates of 1, 2, 3, and 4, respectively.
denotes the concatenation operation along the tensor’s channel dimension.
stands for batch normalization,
is the activation function ReLU, and
is the attention module. In the CBAM, each channel of the features represents a specialized feature detector; therefore, the channel attention focuses on what kind of features are meaningful. Following the channel attention mechanism, the Convolutional Block Attention Module (CBAM) further incorporates a spatial attention module designed to hone in on salient spatial features. This dual-attention approach allows CBAM to synergize channel-wise and spatial information, thereby enriching the network’s capacity to integrate and refine features across various layers. For an in-depth examination of the CBAM’s architectural intricacies, one may refer to [
43].
2.5. The Design of the MAM
Expanding upon UNet’s original decoding process, the MAM is meticulously crafted to systematically and iteratively consolidate feature information between contiguous layers, denoted as
and
. Here,
is the shallow-level feature map in the decoding process, while
is the deep-level feature map. As illustrated in
Figure 5, the deeper-level features
are first deconvolved to derive
, which is then added to the shallower-level features
from the previous layer. Upon the application of the activation function Sigmoid, a set of weight coefficients are obtained and multiplied with
. The calculation is as follows:
In the equations, denotes the deconvolution operation, denotes element-wise multiplication, denotes element-wise addition, and is the output feature of MAM.
The integration of this aggregated skip connection facilitates a profound fusion of the superficial, fine-grained features from the preceding layer with the profound semantic insights from the subsequent layer. This integration leverages the symbiotic nature of these features, capitalizing on their complementary attributes to forge a more enriched and holistic feature representation. As a result, the network’s segmentation outcomes are further refined and optimized.
2.6. Loss Function
Given that our segmentation outcomes are confined to two distinct classes—namely, buildings and non-buildings, we adopt the commonly used Binary Cross Entropy Loss (BCELoss) as the loss function for our model. The BCEloss is utilized to assess the discrepancy between the model’s output and the actual labels in binary classification tasks, specifically distinguishing between buildings and non-buildings in this study. For each individual sample, the BCELoss computes the cross-entropy loss by comparing the probability distribution generated by the model with the ground truth labels. Subsequently, the losses across all samples are averaged to obtain the overall loss value. The calculation is as follows:
In Equation (8), is the model’s predicted label, is the actual label, and denotes a specific pixel in the image. When there are sample pixels during the training process, Equation (8) calculates the average loss.
3. Experimental Results and Analyses
This section delineates the deployment of the PDBMFN across three representative datasets for building segmentation: the Inria Aerial, WHU, and Massachusetts datasets. We proceed by juxtaposing the performance of PDBMFN with several seminal network models that have garnered acclaim in the realm of semantic segmentation in recent years. This includes models such as UNet [
12], DeepLabV3 [
13], EncNet [
14], DaNet [
17], DnlNet [
16], and Segmenter [
20]. Through these comparative experiments, we aim to substantiate the efficacy of our proposed network model. At the end of this section, we conduct an array of ablation studies. These studies are designed to affirm the individual contributions of the PBN, PDCM, and MAM to the overall performance of the network. By systematically evaluating the impact of each component, we demonstrate their integral roles in enhancing the segmentation accuracy and robustness of PDBMFN.
All experiments in this paper were conducted on a Windows workstation with the following main configurations: CPU: Intel Core i5-2.50 GHz, Main Memory: 32 GB, GPU: NVIDIA GeForce RTX 4080S. The primary software environment consists of Python 3.9 and PyTorch 2.1. In our experimental training phase, we selected the RMSprop optimizer, known for its effectiveness in gradient descent optimization. We commenced with an initial learning rate of 0.0001. The training was conducted with a batch size of eight samples. Additionally, we executed 80 epochs for each training session.
3.1. Datasets
- (1)
Inria Aerial Dataset [
44]. This is an urban building segmentation dataset that only labels buildings and the background. The images are 0.3 m-resolution orthorectified RGB images, encompassing both densely populated areas (such as the financial district of San Francisco) and mountainous towns (like Lienz in Austrian Tyrol). The original image size is 5000 × 5000, but due to experimental computational limitations, we cropped them into ten images of 500 × 500 each, resulting in a total of 18,000 images. Following the protocol established in [
45], we randomly split the dataset into a training set of 12,600 images, a validation set of 2700 images, and a test set of 2700 images.
- (2)
WHU Dataset [
46]. The original aerial photography data comes from the Land Information Service website of New Zealand. The authors manually downsampled the images to a ground resolution of 0.3 m, with each image measuring 512 × 512 pixels. Adhering to the original dataset partitioning, we discarded images with significant blank regions, resulting in a training set of 9366 images, a validation set of 1537 images, and a test set of 3770 images.
- (3)
Massachusetts Buildings Dataset [
47]. This dataset consists of 151 aerial images of Boston, each measuring 1500 × 1500 pixels. Similarly, we cropped the original images into 500 × 500 sizes and discarded images with significant blank areas. Following the protocol established in [
44], we randomly reassigned the images into training, validation, and test sets, with 810, 170, and 170 images in each set, respectively.
3.2. Model Accuracy Metrics
In the semantic segmentation of buildings, it is necessary to determine whether each pixel in each image belongs to a building or the background. We employ commonly used metrics such as precision, recall, F1-score and mean intersection over union (mIoU) to evaluate the accuracy of the model in segmenting buildings.
Precision refers to the proportion of samples predicted to belong to the building category that actually belong to the building category in the segmentation results. The calculation is formally presented in Equation (9). In this equation,
represents the number of true buildings,
represents the number of samples where the background is incorrectly identified as a building, and
represents the total number of samples predicted by the model as belonging to the building category.
Recall represents the proportion of samples that truly belong to the building category and are correctly classified as such. The calculation is formally presented in Equation (10), in which, the
is the number of false negatives where the buildings are misclassified as background.
F1-Score is the harmonic mean of precision and recall. The calculation is formally presented in Equation (11).
The mIoU is one of the most commonly used evaluation metrics in image semantic segmentation. It assesses the degree of overlap between the predicted label area and the actual label area by calculating the ratio of their intersection to their union. The value of mIoU ranges from 0 to 1, with a higher value indicating a higher degree of overlap between the prediction and the true annotation. The calculation is formally presented in Equation (12), which takes into account both the building and nonbuilding categories.
represents the number of samples where the background is correctly identified as a background in Equation (12).
3.3. Experiments and Result Analyses on the Inria Aerial Dataset
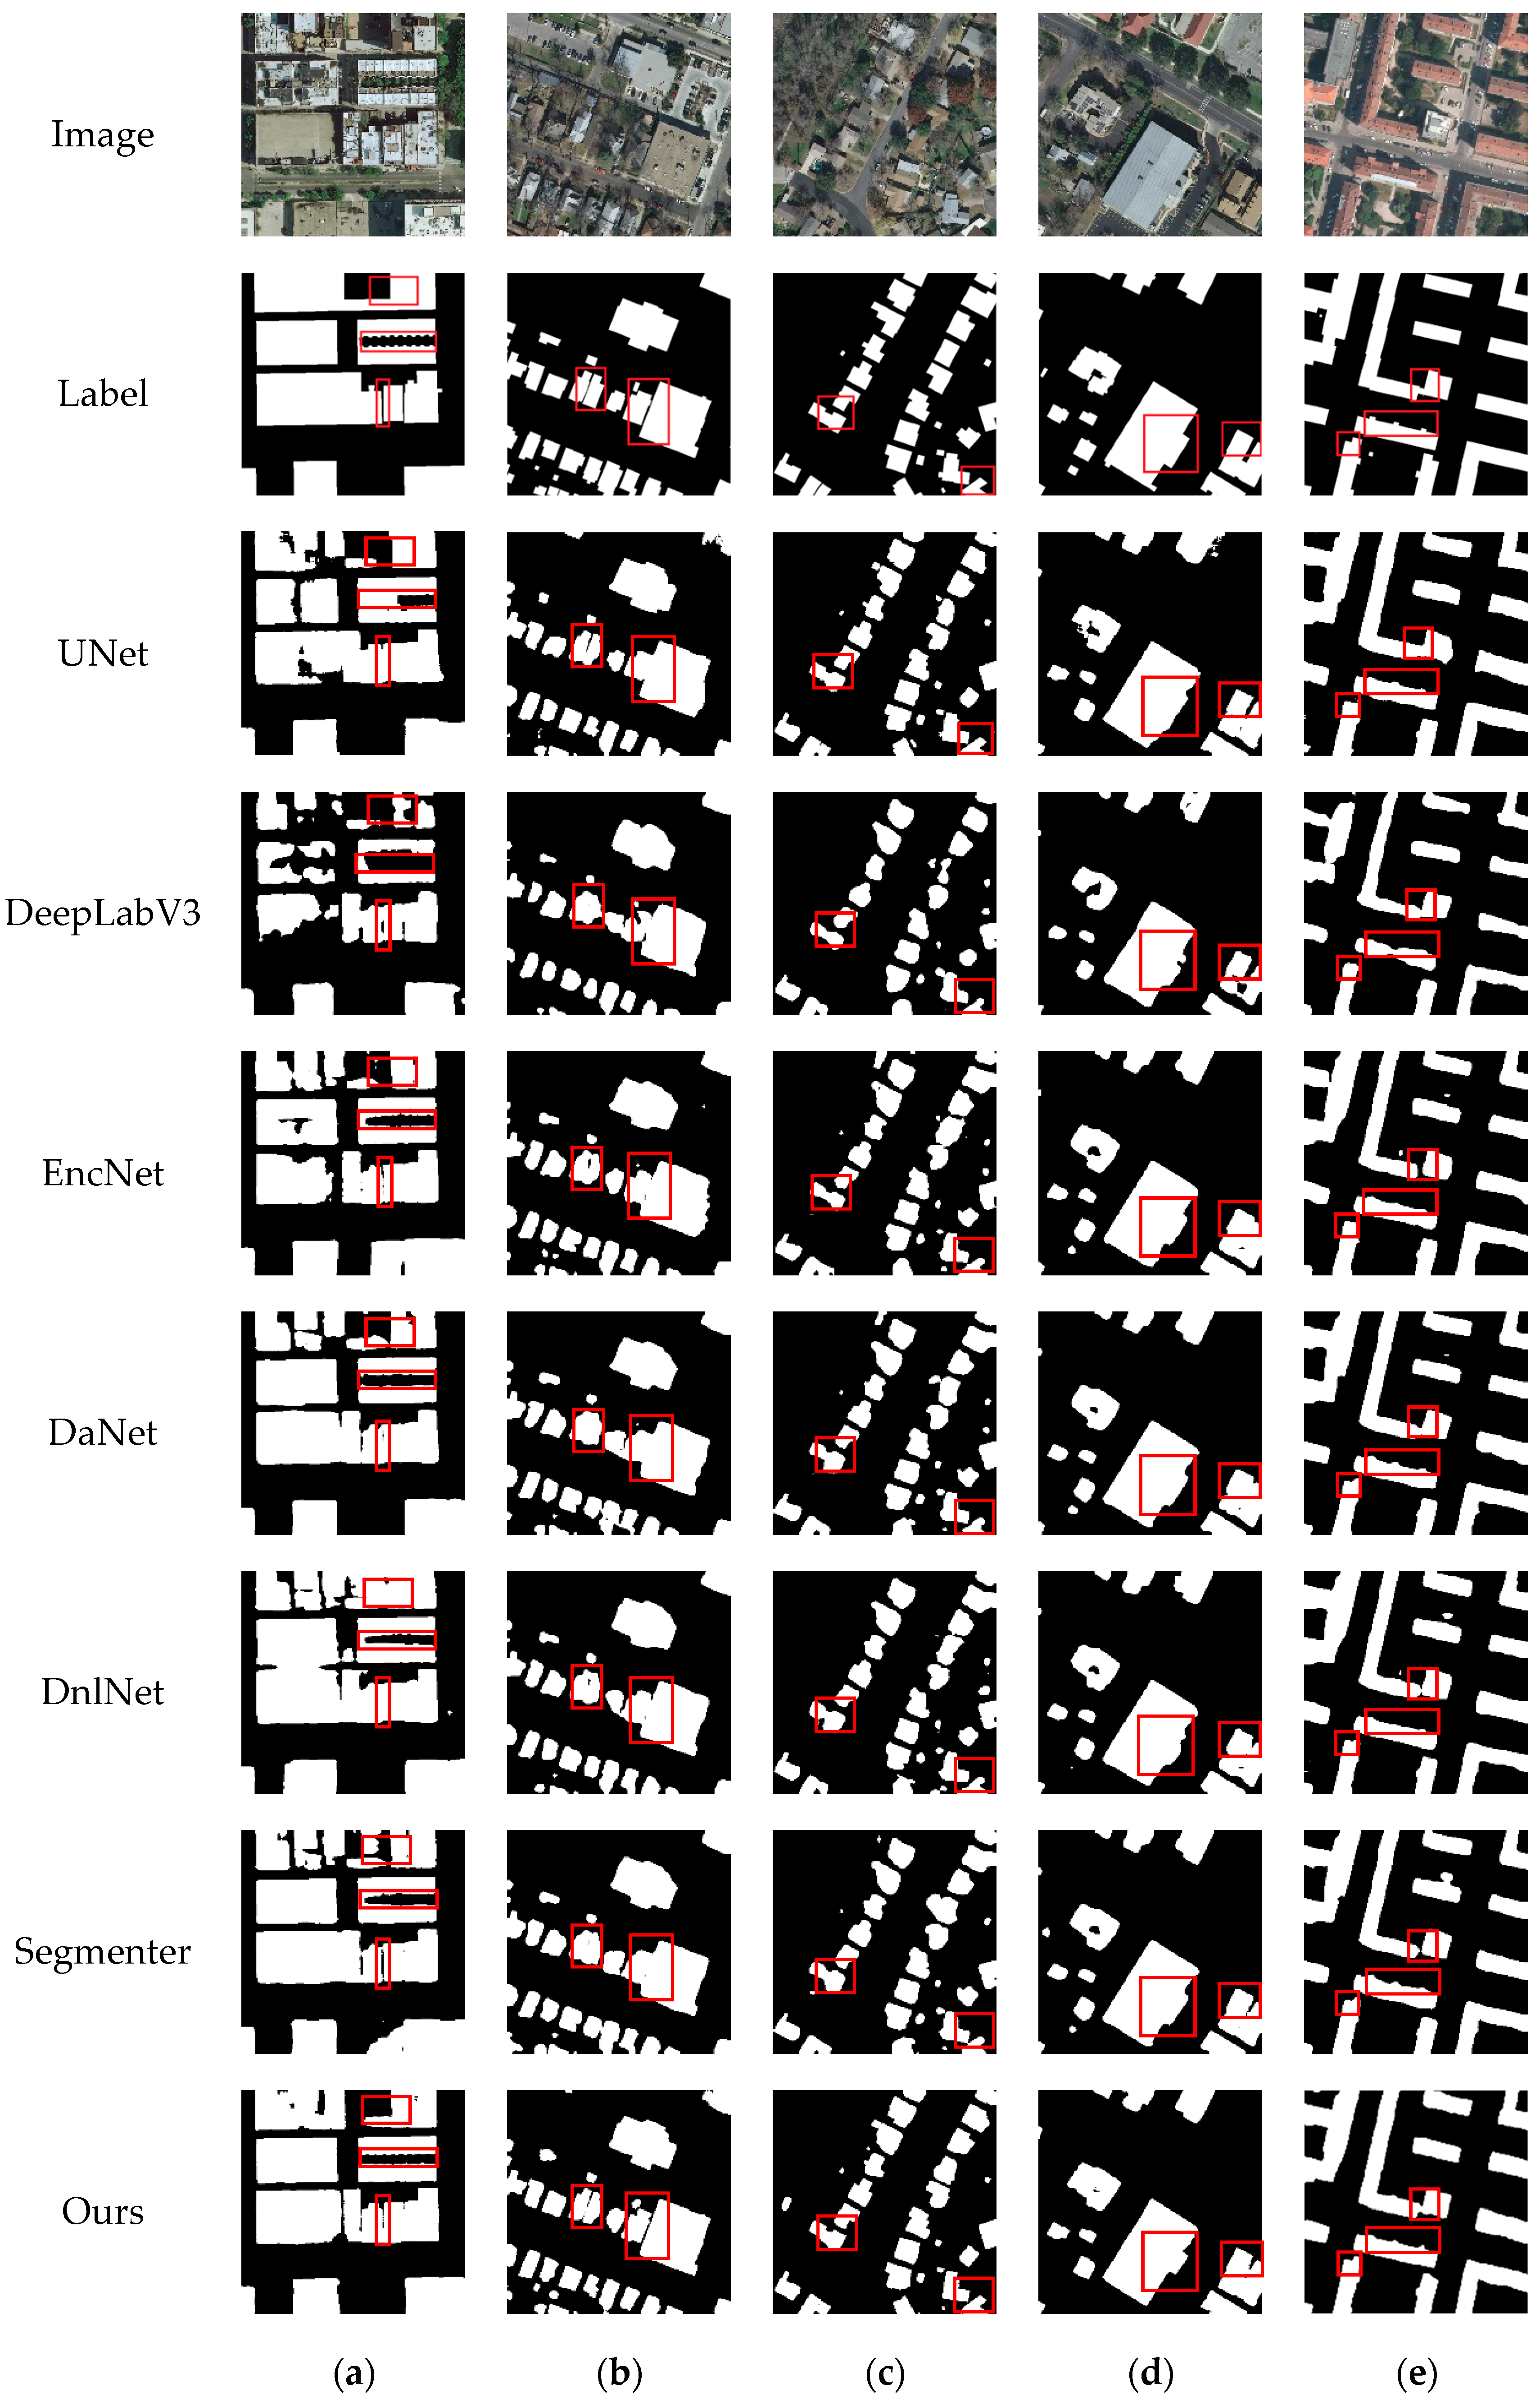
To substantiate the efficacy of the PDBMFN, we deployed it on the Inria Aerial dataset. In parallel, we conducted experiments with other state-of-the-art network architectures, including UNet, DeepLabV3, EncNet, DaNet, DNLNet, and Segmenter. The visual results of these segmentation experiments are presented in
Figure 6.
Figure 6 presents a comparative analysis of the segmentation results on representative images from the Inria Aerial dataset. Column (a) shows images with large building targets, columns (b) and (d) contain images with both large and small targets; column (c) exclusively features small target images; and column (e) displays images with regularly shaped and elongated building boundaries. This well-designed presentation allows for a comprehensive visual assessment of each model’s segmentation performance across varying complexities and target sizes.
In column (a), where the distinction between building bodies and background roads is challenging, models such as UNet and DeepLabV3 result in fragmented buildings with incomplete structures. DaNet and EncNet also struggle with incomplete building delineation, while DNLNet faces difficulties in discerning boundaries between buildings and roads. Segmenter shows a tendency to leave holes within building interiors. In stark contrast, our PDBMFN method adeptly differentiates between buildings and the background, yielding clearer and more regular boundaries. In column (b), most methods demonstrate issues with merging adjacent buildings and occasionally overlook small targets. However, our approach excels by detecting all building targets and effectively separating adjacent structures. In column (c), our method’s superiority is evident in its superior boundary regularity. In column (d), other methods exhibit internal hollowness and irregular boundaries, often missing subtle protrusions or edges. Our method, in contrast, effectively captures these details. Finally, in column (e), UNet and DeepLabV3 produce irregular edges, while EncNet, DNLNet, and DaNet introduce false detections. Segmenter not only suffers from false positives but also misidentifies connected regions as separate. Our method, however, significantly outperforms these issues, demonstrating exceptional performance in detecting subtle building features.
As illustrated in
Table 1, our method achieves the highest scores in terms of the mIoU metric, surpassing UNet, DeepLabV3, EncNet, DaNet, DNLNet, and Segmenter by margins of 3.09%, 3.54%, 1.58%, 0.96%, 1.15%, and 0.89%, respectively. In the recall metric, our method also leads, with improvements of 3.21%, 5%, 3.34%, 1.74%, 1.7%, and 1.65% over the compared models. Similarly, in the F1-Score metric, our method shows the best performance, outperforming UNet, DeepLabV3, EncNet, DaNet, DNLNet, and Segmenter by 5.2%, 5.4%, 1.82%, 0.09%, 0.5%, and 0.43%, respectively. The results in
Table 1 clearly demonstrate that our method surpasses the other six network models in mIoU, recall, and F1-score metrics, thereby corroborating the effectiveness of our approach.
3.4. Experiments and Result Analyses on the WHU Dataset
We further applied the network models, including PDBMFN, UNet, DeepLabV3, EncNet, DaNet, DnlNet, and Segmenter, to the WHU dataset. The visual results of the segmentation experiments are presented in
Figure 7. As depicted, columns (a) and (b) present images characterized by large building targets, while columns (c) and (d) are dedicated to images with small targets. Column (e) showcases a diverse set of images, encompassing a spectrum of building sizes ranging from large to medium, small, and even minute targets. It is noteworthy that the images in column (b) not only include two instances of small target buildings but also a large target building with unique features, such as multiple small protrusions along its edges.
In column (a), which features buildings with circular boundaries, only DNLNet, Segmenter, and our PDBMFN method demonstrate accurate segmentation capabilities. While DNLNet and Segmenter are successful, they have their limitations; DNLNet does not match our method in terms of edge neatness and detection precision, and Segmenter shows gaps in the detection of buildings on the right side, as indicated by the red-marked areas. For the image presented in column (b), UNet and EncNet do not fully segment the large target building, and other methods such as DeepLabV3, DaNet, DNLNet, and Segmenter introduce false detections and noises. In stark contrast, our method achieves complete segmentation for both large and small targets, is devoid of noise, and presents well-defined segmentation of protruding edges for the large targets. In column (c), our method provides the closest match to the true label in the red-marked area, where other methods fall short and deliver incomplete results. For the scenario depicted in column (d), our method once again aligns most accurately with the true label, distinguishing two separate targets in the red-marked area, whereas other methods often misidentify them as a single entity. Finally, in column (e), the complexity of the image, with a mix of large, medium, small, and even tiny targets, leads to false positives across all methods, erroneously tagging non-buildings as buildings. However, in the red-marked area with multiple distinct targets, our method offers the most accurate approximation of the true label compared to the other methods. The competing methods either yield incomplete results, display unclear boundaries, or are plagued by a combination of these issues.
Table 2 presents a comparative analysis of the performance metrics, highlighting the superior results achieved by our method. In the mIoU metric, our method surpasses UNet, DeepLabV3, EncNet, DaNet, DNLNet, and Segmenter by margins of 2.59%, 0.96%, 0.48%, 0.20%, 0.33%, and 0.53%, respectively. When examining the precision metric, our method is narrowly surpassed only by DaNet. In the recall metric, our method secures the top position, outperforming the aforementioned models by 2.8%, 0.35%, 0.92%, 0.32%, 0.7%, and 0.4%, respectively. Furthermore, our method achieves the highest F1-Score, outperforming the others by 3.54%, 1.78%, 0.51%, 0.14%, 1.20%, and 0.54%, respectively. It can be observed from
Table 2 that our method outperforms the other six network models in mIoU, recall, and F1-Score metrics, further validating the effectiveness of our approach.
3.5. Experiments and Result Analyses on the Massachusetts Dataset
Compared to the Inria Aerial dataset and the WHU dataset, the Massachusetts dataset is characterized by a smaller scale and introduces a unique set of challenges. These include a higher degree of noise, reduced image clarity, and the presence of smaller targets, which collectively contribute to a more demanding segmentation task. As a result, the performance of all evaluated models on the Massachusetts dataset tends to be lower than their performance on the other two datasets. The visual results of the segmentation experiments are displayed in
Figure 8.
In
Figure 8a, which highlights a typical building with distinct boundaries marked by the red box, our method uniquely achieves precise segmentation. While UNet successfully segments two buildings, it leaves incomplete fragments within the interiors, and other methods fall short of fully separating the two distinct parts. In column (b), our method yields results that more closely align with the true label, particularly regarding the edges of the large target building. Within the red box, our method also more accurately captures the size and boundaries of the small target building compared to other methods. In column (c), for the large target image enclosed by the red box, our method, along with DaNet, DNLNet, and Segmenter, effectively identifies its protruding edge portions. In contrast, other methods either fail to detect these details or incorrectly fragment the building. However, for several small targets, DaNet, DNLNet, and Segmenter demonstrate over-segmentation or adhesion issues. In column (d), for the large target image marked by the red box, our method and UNet provide results that more closely approximate the true label, whereas other methods exhibit noticeable divergences from the actual outcomes. Nonetheless, for a few small targets, the edges detected by UNet are less refined than those identified by our method. Finally, in column (e), for the multiple target buildings within the red box, our method offers a representation that is more faithful to the true situation in terms of both boundaries and regions. In contrast, other methods either overlook some targets or present incomplete results. The comparative analysis underscores the robustness and accuracy of our method in handling segmentation tasks, even in the presence of challenging factors such as noise, unclear imagery, and small targets.
As detailed in
Table 3, our method secured the top position in terms of the mIoU metric, with improvements of 3.34%, 4.13%, 2.68%, 4.03%, 0.38%, and 2.05% over UNet, DeepLabV3, EncNet, DaNet, DNLNet, and Segmenter, respectively. Our method also demonstrated the best performance in the precision metric, outperforming UNet, DeepLabV3, EncNet, DaNet, DnlNet, and Segmenter by 4.39%, 0.84%, 1.68%, 3.28%, 0.02%, and 1.49%, respectively. Additionally, our method also demonstrated the best performance in the recall metric, outperforming UNet, DeepLabV3, EncNet, DaNet, DnlNet, and Segmenter by 1.61%, 1.73%, 0.80%, 0.74%, 0.27%, and 1.41%, respectively. Furthermore, our method achieved the highest F1-Score, exceeding UNet, DeepLabV3, EncNet, DaNet, DnlNet, and Segmenter by 2.96%, 1.31%, 1.23%, 1.97%, 0.15%, and 1.45%, respectively. As evident from
Table 3, our method excelled in mIoU, precision, recall, and F1-score metrics compared to the other six network models, validating the effectiveness of our approach in the context of building segmentation.
3.6. Ablation Experiments
The proposed PDBMFN is primarily composed of three crucial modules: a branch structure that incorporates prior information, including superpixels and edge information; a PDCM module; and a MAM module. In this section, the ablation experiments are conducted to substantiate the individual contributions of these modules to the PDBMFN network model.
The experimental results are presented in
Table 4. An analysis of the data reveals that the introduction of superpixel images into the original UNet, leveraging its regional prior information, led to an increase in mIoU by 0.59%, 0.66%, and 2.53% in the Inria Aerial, WHU, and Massachusetts datasets, respectively. Further integration of the PDCM module, which facilitates multi-scale parallel convolutions, yielded additional improvements in mIoU, with increments of 0.91%, 0.31%, and 0.06% across the same datasets. Building upon this foundation, the incorporation of the edge prior-guided branch encoding network, which seamlessly merges edge information derived from edge detection with the encoding information from the region prior-guided branch, followed by the PDCM module, led to further refinement of the mIoU, with increases of 0.27%, 0.94%, and 0.31% in the respective datasets. Ultimately, the introduction of the MAM module during the decoding phase, which orchestrates multiple rounds of feature aggregation at each layer, served to augment the network’s performance even more. The experimental results across the three datasets demonstrated that the incorporation of MAM led to an improvement in mIoU of 1.32%, 0.8%, and 0.44%, respectively, compared to the model without MAM. When compared to the baseline UNet model, our PDBMFN achieved a cumulative improvement of 3.09%, 2.59%, and 3.34% in the mIoU metric for the Inria Aerial, WHU, and Massachusetts datasets, respectively. These results underscore the synergistic impact of the PDBMFN’s modular design on the overall performance of the network in the task of building segmentation.
In summary, the introduction of prior information enhances the accuracy of the network’s segmentation edge results, while the PDCM and MAM modules further improve the network’s performance during encoding and decoding, effectively capturing building features.
4. Discussions and Conclusions
We propose the prior-guided dual branch multi-feature fusion network (PDBMFN), a novel approach to building segmentation in remote sensing images. This network is designed to overcome the limitations of traditional CNNs, which often underutilize critical prior information related to building regions and boundaries. Our solution integrates regional and edge-prior information into the encoding phase. Specifically, the original image and its superpixel segmentation image are fed into the region prior-guided branch of the PBN, which then merges with the features from the edge prior-guided branch of the PBN that takes the edge image as input during the downsampling phase of the encoding process. To address the shortcomings of traditional convolution and pooling operations, which may fail to accurately capture global pixel relationships and thus result in semantic information loss, we propose the Parallel Dilated Convolution Module (PDCM). This module leverages dilated convolutions across various scales, enabling the network to capture a broader semantic context within larger image regions. Furthermore, in response to the conventional decoding stage’s suboptimal feature fusion techniques, we introduce the multi-feature aggregation module (MAM). This module aggregates shallow and deep semantic information in a staged and iterative manner, enriching the feature representation and yielding more precise building features.
Our experiments on the WHU, Inria Aerial, and Massachusetts datasets confirm the effectiveness of PDBMFN, showcasing superior performance over other state-of-the-art semantic segmentation models, particularly in terms of the mIoU metric and other quantitative measures. Through meticulously designed ablation experiments on the three classical datasets, we have substantiated the enhancements in network segmentation performance conferred by the introduction of branch structures and the incorporation of prior information, as well as the PDCM and MAM modules. These experiments have not only validated the improvements but also provided the individual contributions of the network’s components.
Our PDBMFN addresses the limitations of CNNs in feature acquisition by introducing PBN with prior information, as well as PDCM and MAM, to enhance the network’s feature representation capabilities. This approach has achieved promising segmentation results. Recently, Wang et al. [
48] and Ruan et al. [
49] have proposed using visual state space (VSS) as an alternative to convolutions in CNNs and have constructed novel, efficient encoder-decoder segmentation networks, achieving excellent results. These works have provided us with new inspiration, and utilizing VSS to further enhance the feature representation capabilities and improve segmentation performance in the PDBMFN network structure will be an important direction for our future work. Furthermore, our validation of the method’s effectiveness has, to this point, been confined to three representative datasets. The generalizability of our approach to remote sensing image data that exhibits varying resolutions and building scene distributions necessitates additional empirical validation. Another future project will be directed towards assessing the adaptability and robustness of our method across a broader spectrum of datasets, ensuring its applicability to diverse real-world scenarios in remote sensing image analysis.


 ,
, 


