Article

Investigation of the Long-Term Performance of Waste Backfill Materials of High Thermal Conductivity in Vertical Ground Heat Exchangers

1
Hongyuan Electric Power Design Institute Co., Ltd., Taizhou 318000, China
2
Jiangsu Key Laboratory of Urban Underground Engineering & Environmental Safety, Southeast University, Nanjing 211189, China
*
Author to whom correspondence should be addressed.
Buildings 2024, 14(6), 1699; https://doi.org/10.3390/buildings14061699
Submission received: 7 May 2024 / Revised: 31 May 2024 / Accepted: 4 June 2024 / Published: 7 June 2024
(This article belongs to the Special Issue Research on Green and Low-Carbon Buildings)

Abstract

Backfill material used as a heat-transfer medium in boreholes of ground heat exchangers (GHEs) has a great influence on heat-transfer efficiency. Abandoned waste material causing environmental pollution has become a key issue around the world. To make full use of solid waste, backfill material made of waste fly ash in combination with graphite of high thermal conductivity was proposed. First, the thermal properties of cement/fly ash blended with different mass ratio of graphite were tested through laboratory tests. Then, a numerical model was established, in which the accuracy was validated based on a field test. Finally, an investigation of the long-term performance (over a period of 90 days) for four boreholes backfilled with natural sand, cement/fly ash, and cement/fly ash combined with different proportions of graphite was conducted through this numerical model, and the heat-transfer rates under constant inlet temperature in four boreholes decreased from 13.31, 44.97, 45.95, and 46.73 W/m to 14.18, 14.96, 15.66, and 16.19 W/m after the 90-day operation. Considering the influence of groundwater seepage, the horizontal groundwater flow had a positive impact, improving the long-term heat-transfer performance. The heat-transfer rates of four testing boreholes decreased from 44.46, 46.38, 47.22, and 47.68 W/m to 21.18, 21.93, 22.62, and 23.13 W/m. However, long-term groundwater seepage in a vertical direction caused a sharp decrease in the heat-transfer rate, and the values after 90 days were 10.44, 10.62, 10.78, and 10.81 W/m, which were the lowest of all the working conditions. The feasibility of using fly ash blended with graphite as backfill material was further validated through a comprehensive perspective, including indoor laboratory, field testing, and numerical simulation, which has rarely been conducted in previous research.

1. Introduction

With the rapid development in urbanization and industrialization, geothermal energy has become widely used as a renewable energy source for cooling or heating in multiple fields, in which the ground source heat pumps (GSHPs) system has been widely developed due to its advantages of energy saving, free environmental pollution, and low operational cost [1,2,3]. As an important heat-exchange device for GSHPs, the heat-transfer performance of buried ground heat exchangers (GHEs) directly affects their efficiency. Vertical GHEs buried in boreholes with long depths are widely adopted, and single U, double U, W, and spiral shapes are common types that are used to fully extract hot or cold energy from the ground [4,5,6]. Many researchers have attempted to improve the performance of GSHPs by different methods, such as increasing the length of the borehole [7], enlarging the space for GHEs [8], optimizing the geometric dimensions of buried pipes [9], or using backfill materials of high thermal conductivity [10,11]. Among all these methods, choosing or designing a suitable backfill material is the method most frequently used to increase the utilization efficiency of geothermal energy.
Backfill material was used as a heat-transfer medium between the GHEs and surrounding soil, and this has a great impact on geothermal energy utilization. Backfill material is directly related to the heat-transfer efficiency of GHEs. As the GSHPs continue to operate, an increase or decrease in the initial temperature of the surrounding soil or rock would significantly reduce the operational efficiency. The inherent geological conditions are difficult to change, but the performance of the backfill material can be controlled. Usually, backfill material with a higher thermal conductivity achieves a greater heat-transfer performance in GHEs system. Some commonly used backfill materials include soil, sand, bentonite, cement, etc., which have lower thermal conductivity [12,13,14]. Some additives of high thermal conductivity added to backfill materials to improve the heat-transfer efficiency include graphite, silicon carbide, metal powder, etc. Many researchers have attempted to improve the thermal performance of backfill material by the methods listed in Table 1, in which a higher heat-transfer rate between GHEs and the surrounding soil could be achieved through thermally enhanced backfill material in boreholes.
On the other hand, the large amount of stacked fly ash wasted by thermal power plants has become a troubling issue in recent years, and has caused the pollution of soil or water resources. Research has shown more than 827 million tons of fly ash were generated in China as of 2021 [15], causing serious occupation of land resources. Despite this, fly ash with gelling property could replace cementitious material, and could be used as alternative construction or building materials. Making full use of waste material not only protects the environment, but also has a great economical benefits, like cost saving.
Table 1. Typical backfill material and additives used for thermal improvement in the GHEs system.
AuthorsBackfill MaterialAdditiveMethodAchieving Results
Liang B, et al. [16]Natural sandKaolinModel testConvective heat-transfer coefficient was improved to 678 W/m2 K.
Kim D, et al. [17]Cement groutingSteel-making slagLaboratory test/numerical simulation.Thermal conductivity exceeds 10%.
Erol S, et al. [18]Silica sandGraphiteSand box testing.Thermal resistance of GHE was reduced and the heat-transfer rate was improved.
Blázquez, et al. [19]Cement groutingAluminum shavingsLaboratory test.Aluminum shavings contribute to increase the thermal conductivity.
Treviño, et al. [20]Cement groutingLimestone/silica sand, electric arc furnace slagLaboratory test.Contact thermal resistance was greatly reduced.
Alrtimi, et al. [21]Mortar of fuel ashGlass/fluorsparLaboratory test.The highest thermal conductivity value could reach 2.88 W/m K.
Delaleux, et al. [22]BentoniteGraphiteLaboratory test.High thermal conductivity intensifications were obtained.
Muñoz, et al. [23]Cement mortarFlake/expanded graphite.Laboratory test.Thermal conductivity was improved a lot by the addition of graphite.
Lee C, et al. [24]Cement/bentoniteSilica sand/graphiteField test.Thermal performance was improved and thermal interference was reduced.
As for the waste fly ash used as backfill material in GHEs, it could partially replace cement as a backfill material owing to its excellent cementitious properties. Castán-Fern ández [13] performed laboratory tests to investigate the properties of different industrial wastes used as backfill materials in GHEs, including fly ash, which exhibited great thermal, mechanical, physical, and environmental properties. In their work, Do, T.M. [25] compared the conventional geothermal backfill material with different mixtures of cement and fly ash both in laboratory and field tests, and these authors achieved great workability and heat-transfer efficiency through using fly ash. However, most of these materials’ performances have rarely been verified through field testing or applied in real engineering, and their feasibility should be further verified through long-term numerical simulations.
In this study, to make full use of solid waste, fly ash wasted from a thermopower plant was used as backfill material that partially replaced cement to grout the boreholes in GHEs. Graphite powder of high thermal conductivity was added to improve the thermal properties of the backfill material. Major properties of thermally enhanced backfill material were measured through a laboratory test, then the performance of long-term continuous operation was investigated through numerical simulations, in which the influence of groundwater seepage was taken into consideration. The novelty is that the feasibility of using fly ash blended with graphite as a backfill material was further validated through field tests, and the long-term performance was explored by numerical simulations, which have rarely been conducted by previous researchers from a comprehensive perspective. The research results in this paper have great significance for guiding the recovery of solid waste materials and application in backfilling in the boreholes of buried heat-exchange pipes. A positive contribution is that the stacked waste material of fly ash was fully used, lowing its potential to pollute the environment.

2. Methodology

Both laboratory and field tests were conducted to investigate the thermal performance of backfill material made from fly ash blended with graphite, then a 3D finite element model simulating the operation of GHE system was established based on COMSOL Multiphysics 5.6 software developed by COMSOL Inc., Stockholm, Sweden to investigate the long-term heat-transfer performance. The influence of adding graphite to backfill materials on the improvement of thermal performance was investigated through laboratory tests, while field testing could not only verify the feasibility of proposed backfill material in real GHEs system, but also further validated the accuracy and precision of the established model. So, the long-term performance of thermally enhanced backfill material used in GHEs could be further studied based on these tests.

3. Description of Vertical GHEs System

As illustrated in Figure 1, the GHE system includes a single U-shape buried piped, backfill material, surrounding soil, and circulating fluid within the pipe. The heat transfer between the vertical buried pipe and the ground occurs through the backfill material. Based on this model, the influence of different thermally enhanced backfill materials of waste fly ash on the heat-transfer performance could be further studied.

4. Laboratory and Field Test

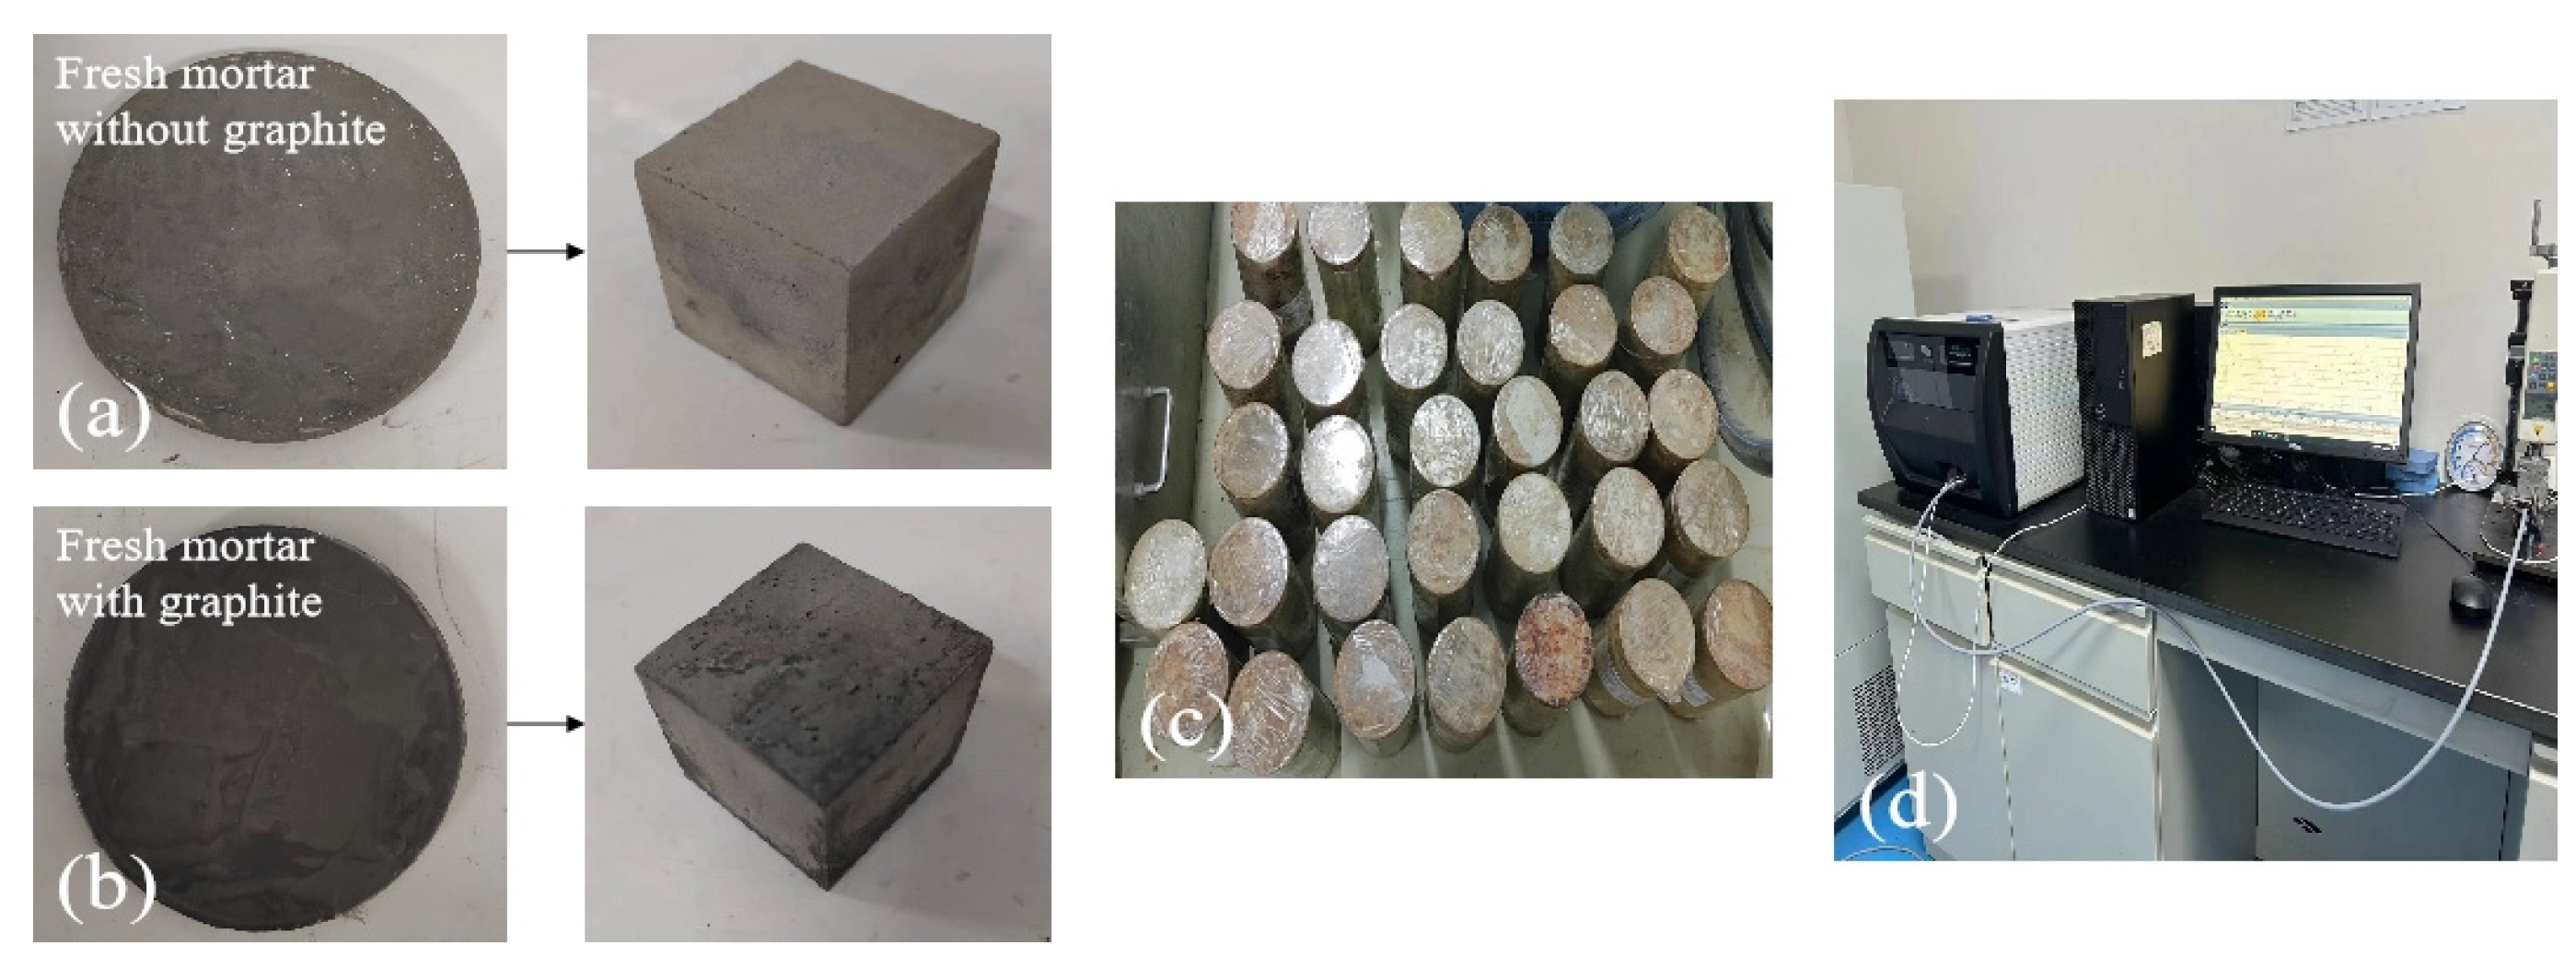
4.1. Laboratory Test

4.1.1. Methodology

Cement partially replaced with fly ash was adopted to design the backfill material, in which graphite powder was blended in to enhance the thermal property. As 4 boreholes of 30 m depth were drilled in the testing field, the thermal properties of 4 kinds of backfill material for borehole grouting in the field were tested by the thermal constant analyzer shown in Figure 2, through laboratory tests. The specific mixing ratio is shown in Table 2, where the backfill material in 1# borehole commonly used natural sand as a reference. The cement and fly ash grouted in 2# borehole exhibited a mass ratio of 1:6 without graphite. Meanwhile, partial replacements of fly ash with 5% and 10% graphite in mass ratios were proposed to fabricate the backfill material of high thermal conductivity. The mass ratios of cement/fly ash/natural sand/graphite were 5:30:48:0, 5:25:48:5, and 5:20:48:10 in 2#, 3#, and 4#, respectively.

4.1.2. Results and Discussion

The test results of the thermal properties of backfill material are shown in Table 3. It can be seen that graphite could improve the thermal property to a relatively high level, which could be used to improve the heat-transfer performance in real GHEs systems. The thermal conductivity of cement/fly ash could reach 2.317 and 2.391 W/(m K) when the mass ratios of graphite were 5% and 10%, respectively. Adding graphite could further improve the thermal performance of the backfill material. All the testing results were used as parameters in the numerical model for long-term performance evaluation.

4.2. Field Test

4.2.1. Methodology

Field tests of the soil thermal response were conducted in Wuxi, Jiangsu Province, China, where four boreholes with a depth of 30 m and a diameter of 110 mm were drilled for GHEs. The heat exchanger was a single U-shaped pipe with external and internal diameters of 26 mm and 32 mm, respectively. A constant inlet temperature of 35 °C was adopted for thermal response testing and the outlet temperature could be obtained. The entire operation time lasted for more than 48 h continuously.
Pictures of the field tests are presented in Figure 3. The soil thermal property and ground temperature at the testing site for 4 boreholes are shown in Table 4 and Table 5, respectively.

4.2.2. Results of Field Test

A continuous outlet temperature of the soil thermal response was obtained. As the accuracy of the model investigating the long-term performance could be further validated through field tests, the test results of the constant inlet temperature are illustrated in the next section for a comparison with the numerical ones.

5. Numerical Model Implementation
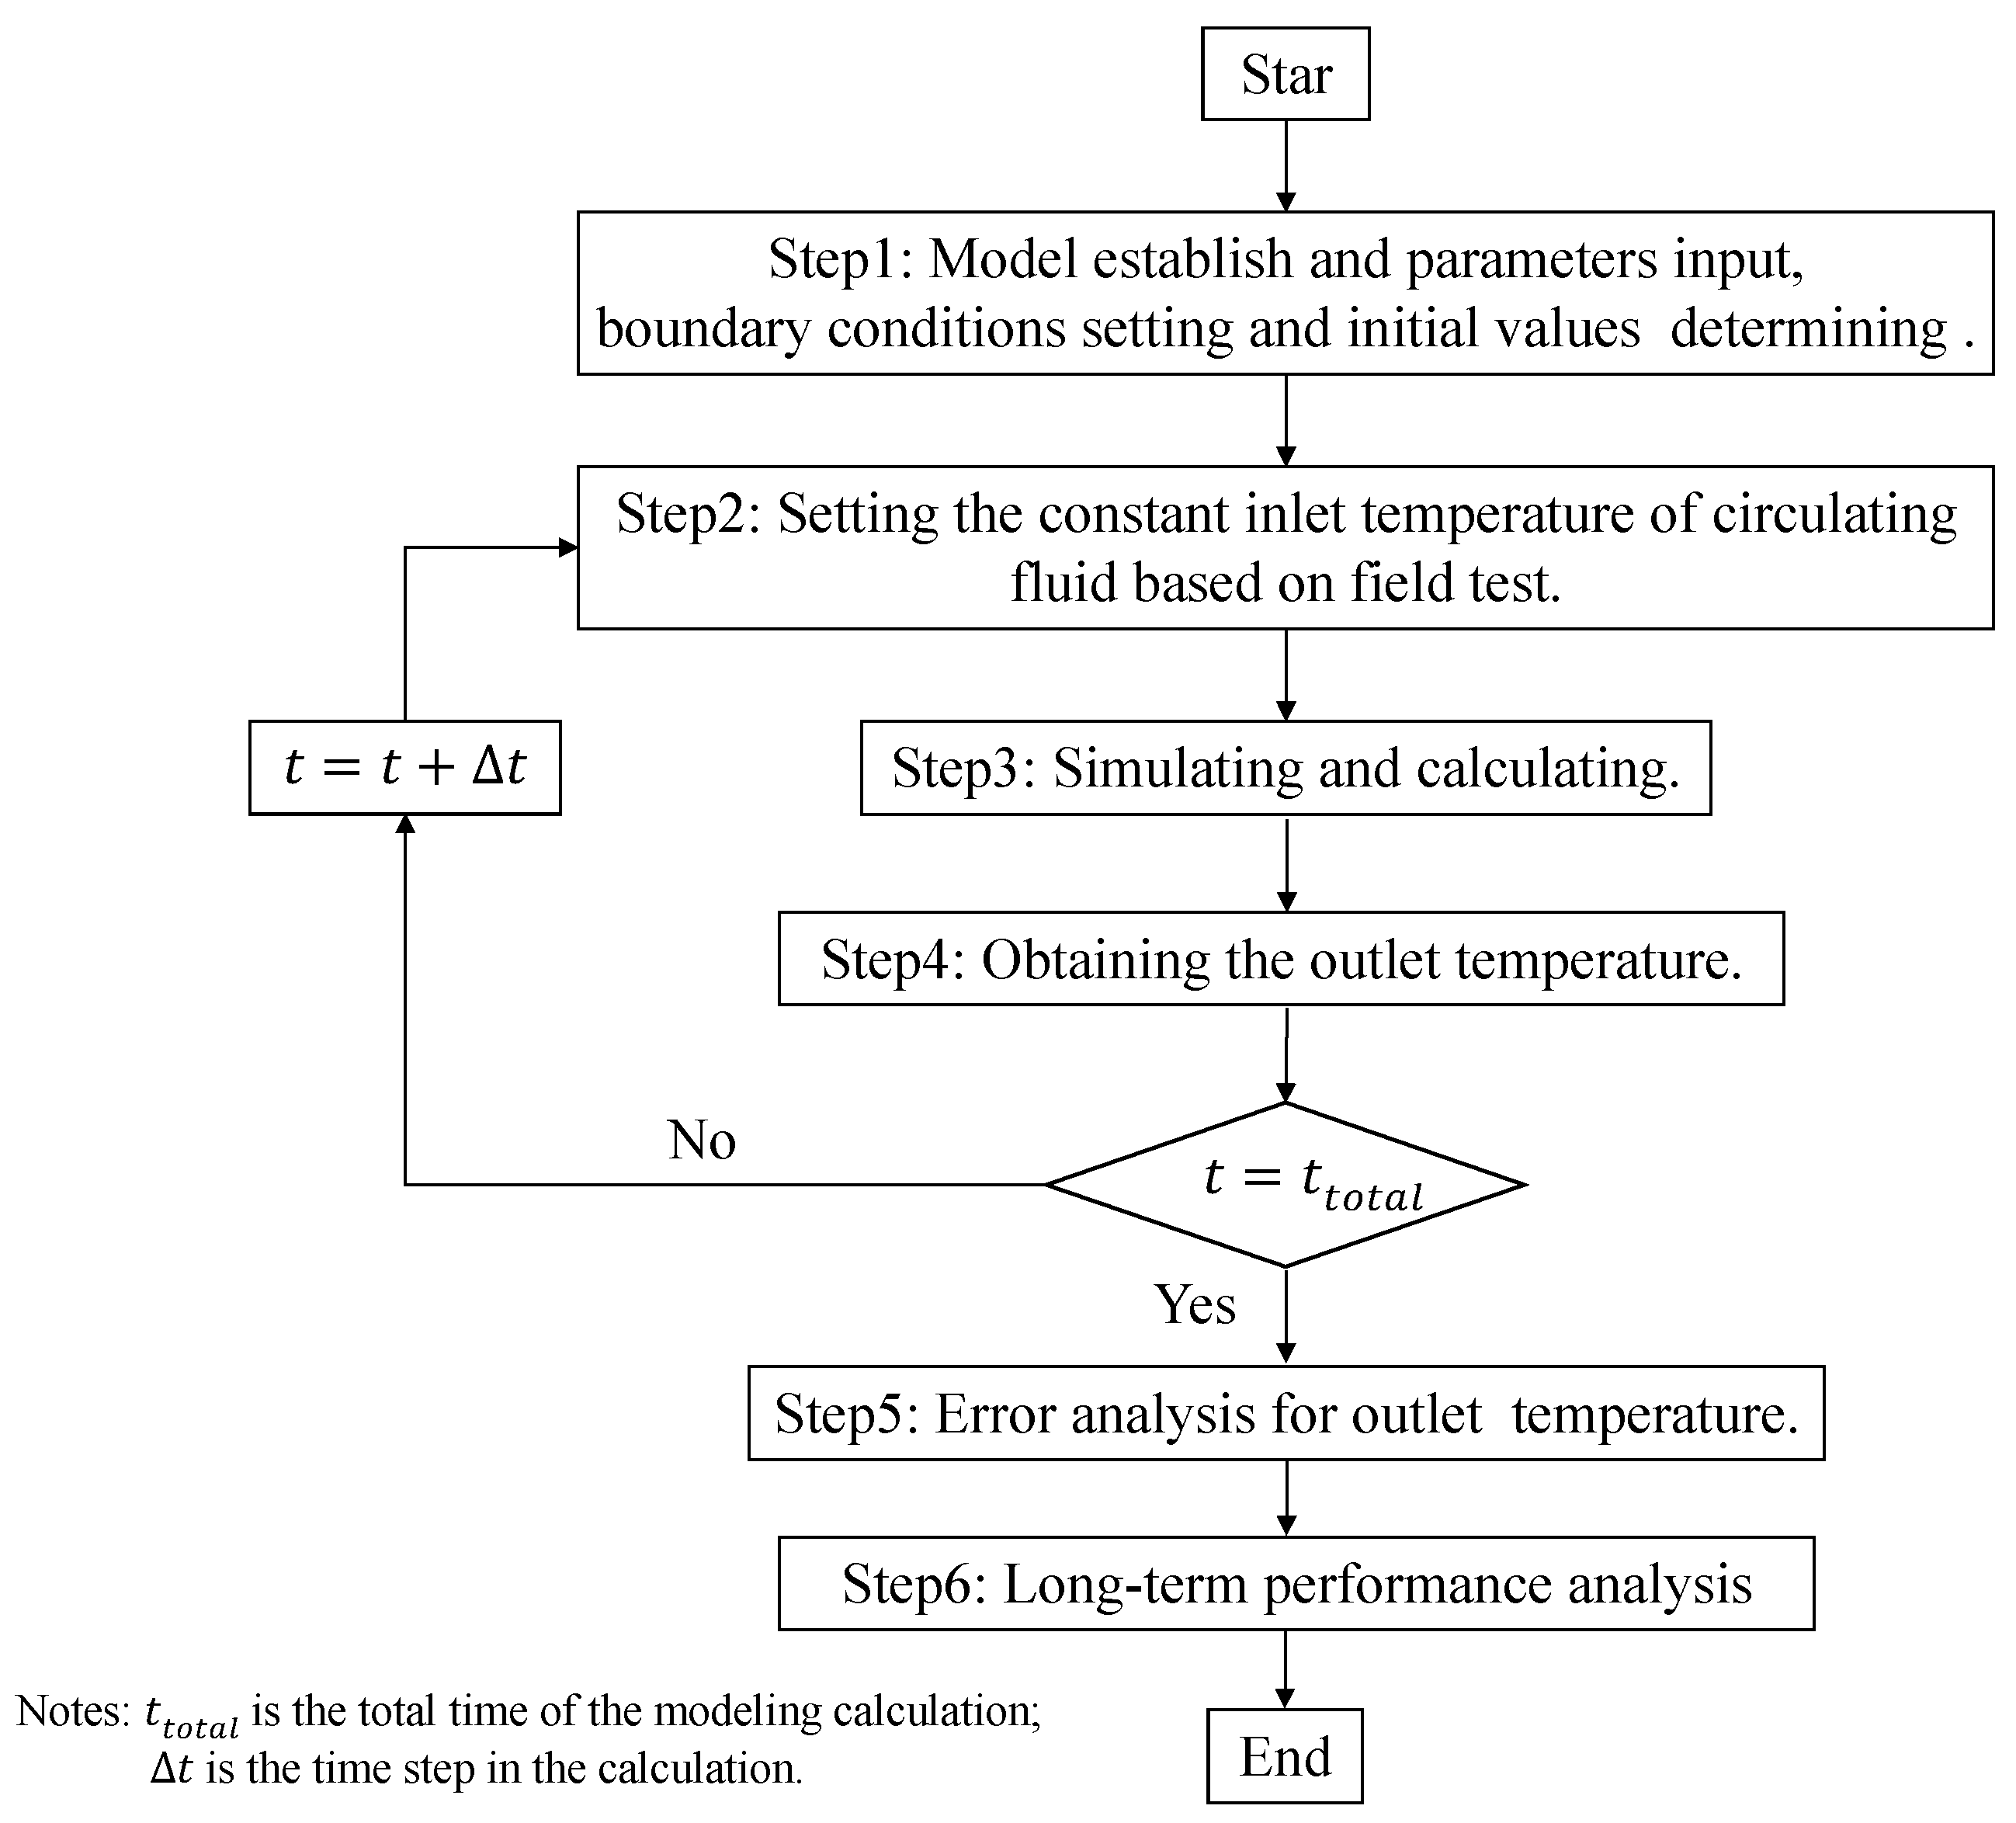
5.1. Methodology

Heat conduction in solid materials and heat convection of the circulating fluid were adopted in the model, as these are the main heat-transfer processes in the GHEs system. Considering that heat transfer between the buried pipe and the ground is a complex, unsteady process, some hypotheses are needed: (1) Backfill material and the surrounding soil are considered to be homogenous and isotropic [26,27]; (2) the backfill material in the borehole has been fully backfilled [26]; (3) All the contacting boundaries satisfy the continuity condition, in which the thermal resistance is ignored [27]. As the influences of groundwater seepage and a lack of groundwater seepage on heat transfer are considered separately in this paper, more hypotheses are proposed as the groundwater seepage is taken into consideration: (1) The flow state of groundwater in porous media conforms to Darcy’s law; (2) The entire soil around the borehole is assumed to be a porous medium composed of three phases: solid, liquid, and gas; (3) The initial groundwater temperature in the model is set to be the same as the stratum temperature; (4) The velocity of the groundwater seepage is constant.

5.1.1. Governing Equations

The heat-transfer process of solid mass in the GHEs system is controlled by the following equation [26,28]:
ρ s C p , s T s t = · λ s T s + Q s
where the circulating fluid within the buried pipe is considered to be incompressible and the turbulent flow is based on the Reynolds number. The equation of continuity, momentum, and energy could be expressed as follows [25,26]:
u f t + · p f u f = 0
ρ f u f t = p f 1 2 f D ρ f d h u f u f
ρ f A p C p , f T f t + ρ f A p C p , f u f T f = · A p λ f T f + 1 2 f D ρ f A p d h u f 3 + q w a l l  
In Equation (2)–(4), f D represents the Darcy friction factor of circulating fluid based on Churchill’s friction model [29,30]. Meanwhile, q w a l l denotes the source term defined as follows [26,28,31]:
q w a l l = h Z p e f f T e x t T f
In which h Z p e f f is the effective value of heat-transfer coefficient ( h ) and pipe wall perimeter ( Z p ), and it could be determined by the following equation:
h Z p e f f = 2 π 1 d p , i n h i n t + 1 λ p ln d p , o u t d p , i n
In Equation (6), h i n t denotes the internal film heat-transfer coefficient of the pipe. Other parameters in Equation (6) could be acquired based on Equation (7)–(10):
h i n t = N u λ f d h
N u = f D R e 1000 P r 8 + 101.6 f D 8 1 / 2 P r 2 / 3 1
P r = C p , f μ λ f
R e = ρ f u f d h μ
The transient heat-transfer in porous soil is illustrated as follows when the groundwater seepage is taken into consideration [32,33]:
ρ s o i l C p , s o i l e f f T s o i l t + ρ w C p , w v w · T s o i l = λ s o i l e f f · T s o i l + Q s o i l
where v w is the seepage velocity of groundwater in soil, which is the volume flow per unit section. ρ s o i l C p , s o i l e f f is the effective value of soil density ρ s o i l and the specific heat capacity of soil C p , s o i l . λ s o i l e f f is the effective value of the thermal conductivity λ s o i l of soil. Both of them could be expressed as follows:
ρ s o i l C p , s o i l e f f = i = 1 3 χ i ρ s o i l , i C p , s o i l , i
λ s o i l e f f = i = 1 3 χ i λ s o i l , i
The flow equation of groundwater is illustrated as follows based on the Darcy’s law.
ρ w η t + · ρ w v w = Q m Q s o i l
The influence of gravity on seepage is also considered in this paper. Darcy’s law can be expressed as follows:
v w = κ μ w p + ρ w g
In Equation (15), p is the fluid pressure of groundwater, μ w is the dynamic viscosity of groundwater, and g is the acceleration of gravity.

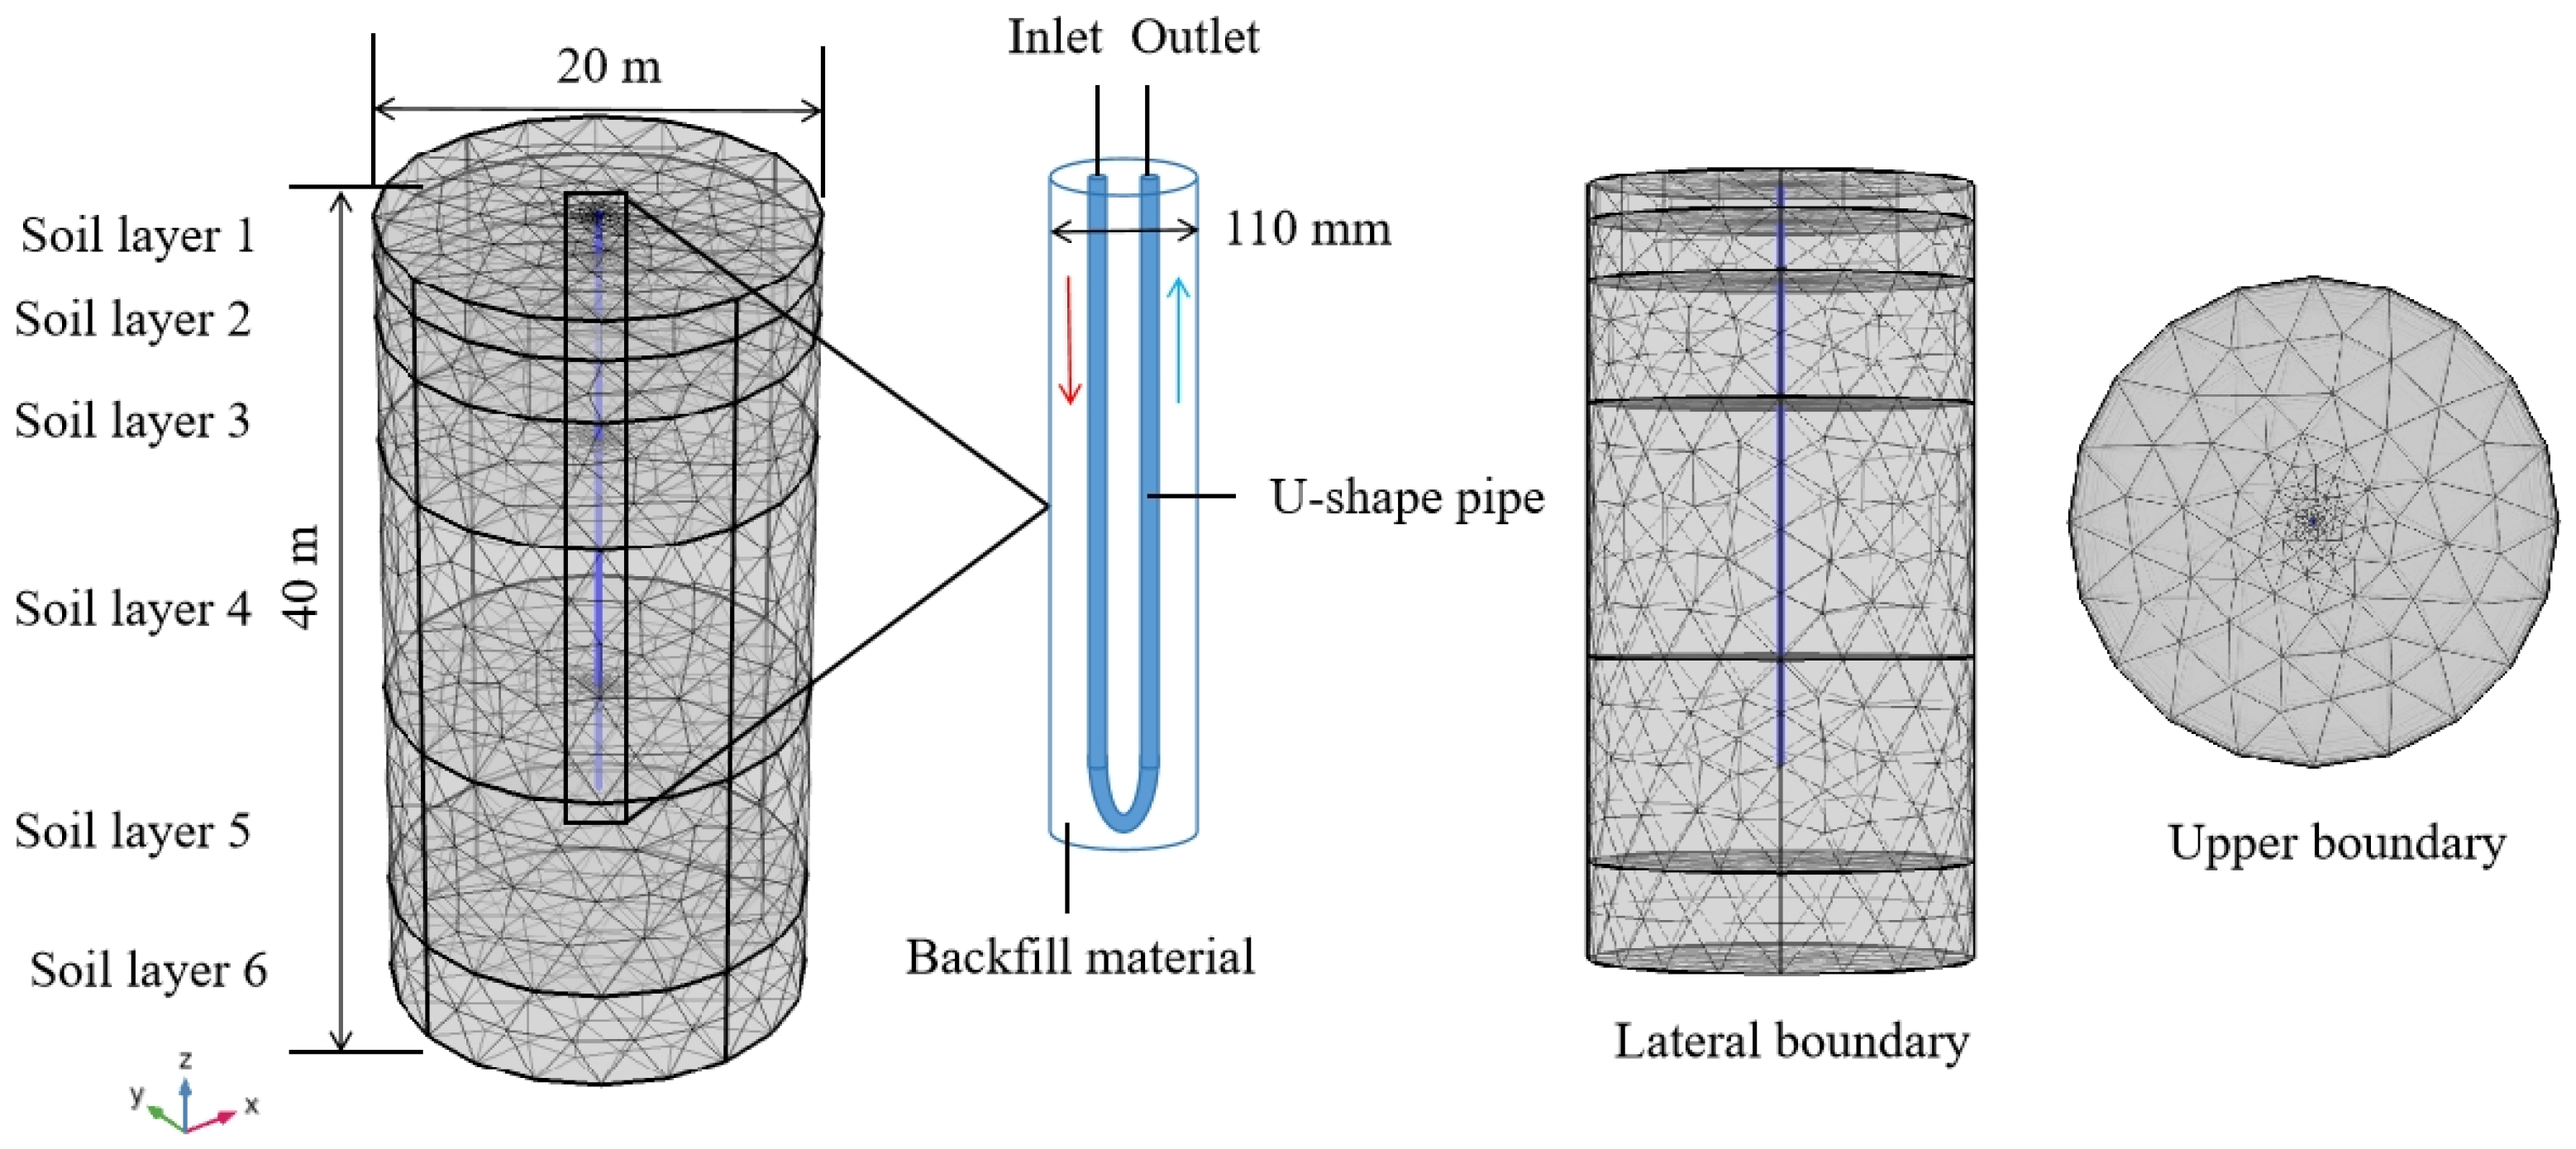
5.1.2. Geometric Size, Boundary, and Initial Conditions

According to research about the thermal response of soil [34], the range of temperature influence of GHEs is mainly determined by the types of soil, in which the radius range is 4 m, 5 m, and 6 m for clay, soil, and sandy soil, respectively. For the setting of the boundary, both the lateral and bottom part are assumed to be adiabatic, and convective heat-transfer is used in the upper boundary between the air and ground. The geometric size, mesh density, and boundary conditions of the model are shown in Figure 4, in which a ground radius of 10m and depth of 40 m were adopted to avoid the boundaries influencing the heat transfer. A vertical single U-shaped GHE with a radius of 110 mm and a depth of 30 m is set at the central position [35,36]. The clearance distance from the bottom side to the GHE should be larger than 10 m to avoid the influence of bottom boundaries [37].
For the setting of the initial conditions, heat-transfer flux was adopted at the upper boundary between the ground surface and air, which is expressed as follows:
q u p p e r θ , r , z , t z = 0 = h c ( T s o i l T a i r )
The lateral and bottom boundaries are adiabatic, and the equation is illustrated in Equations (17) and (18):
T s o i l ( θ , r , z , t ) r r = 10 = 0
T s o i l ( θ , r , z , t ) z z = 40 = 0
The initial temperature in the model is consistent with the initial ground temperature, which is shown in Equation (19).
T s o i l θ , r , z , t t = 0 = T i n i t i a l z , t t = 0
The heat-transfer rate of vertical GHEs is adopted in this study to evaluate the long-term heat-transfer performance, which can be defined as follows [38]:
q G H E t = m f C p , f T f , i n T f , o u t

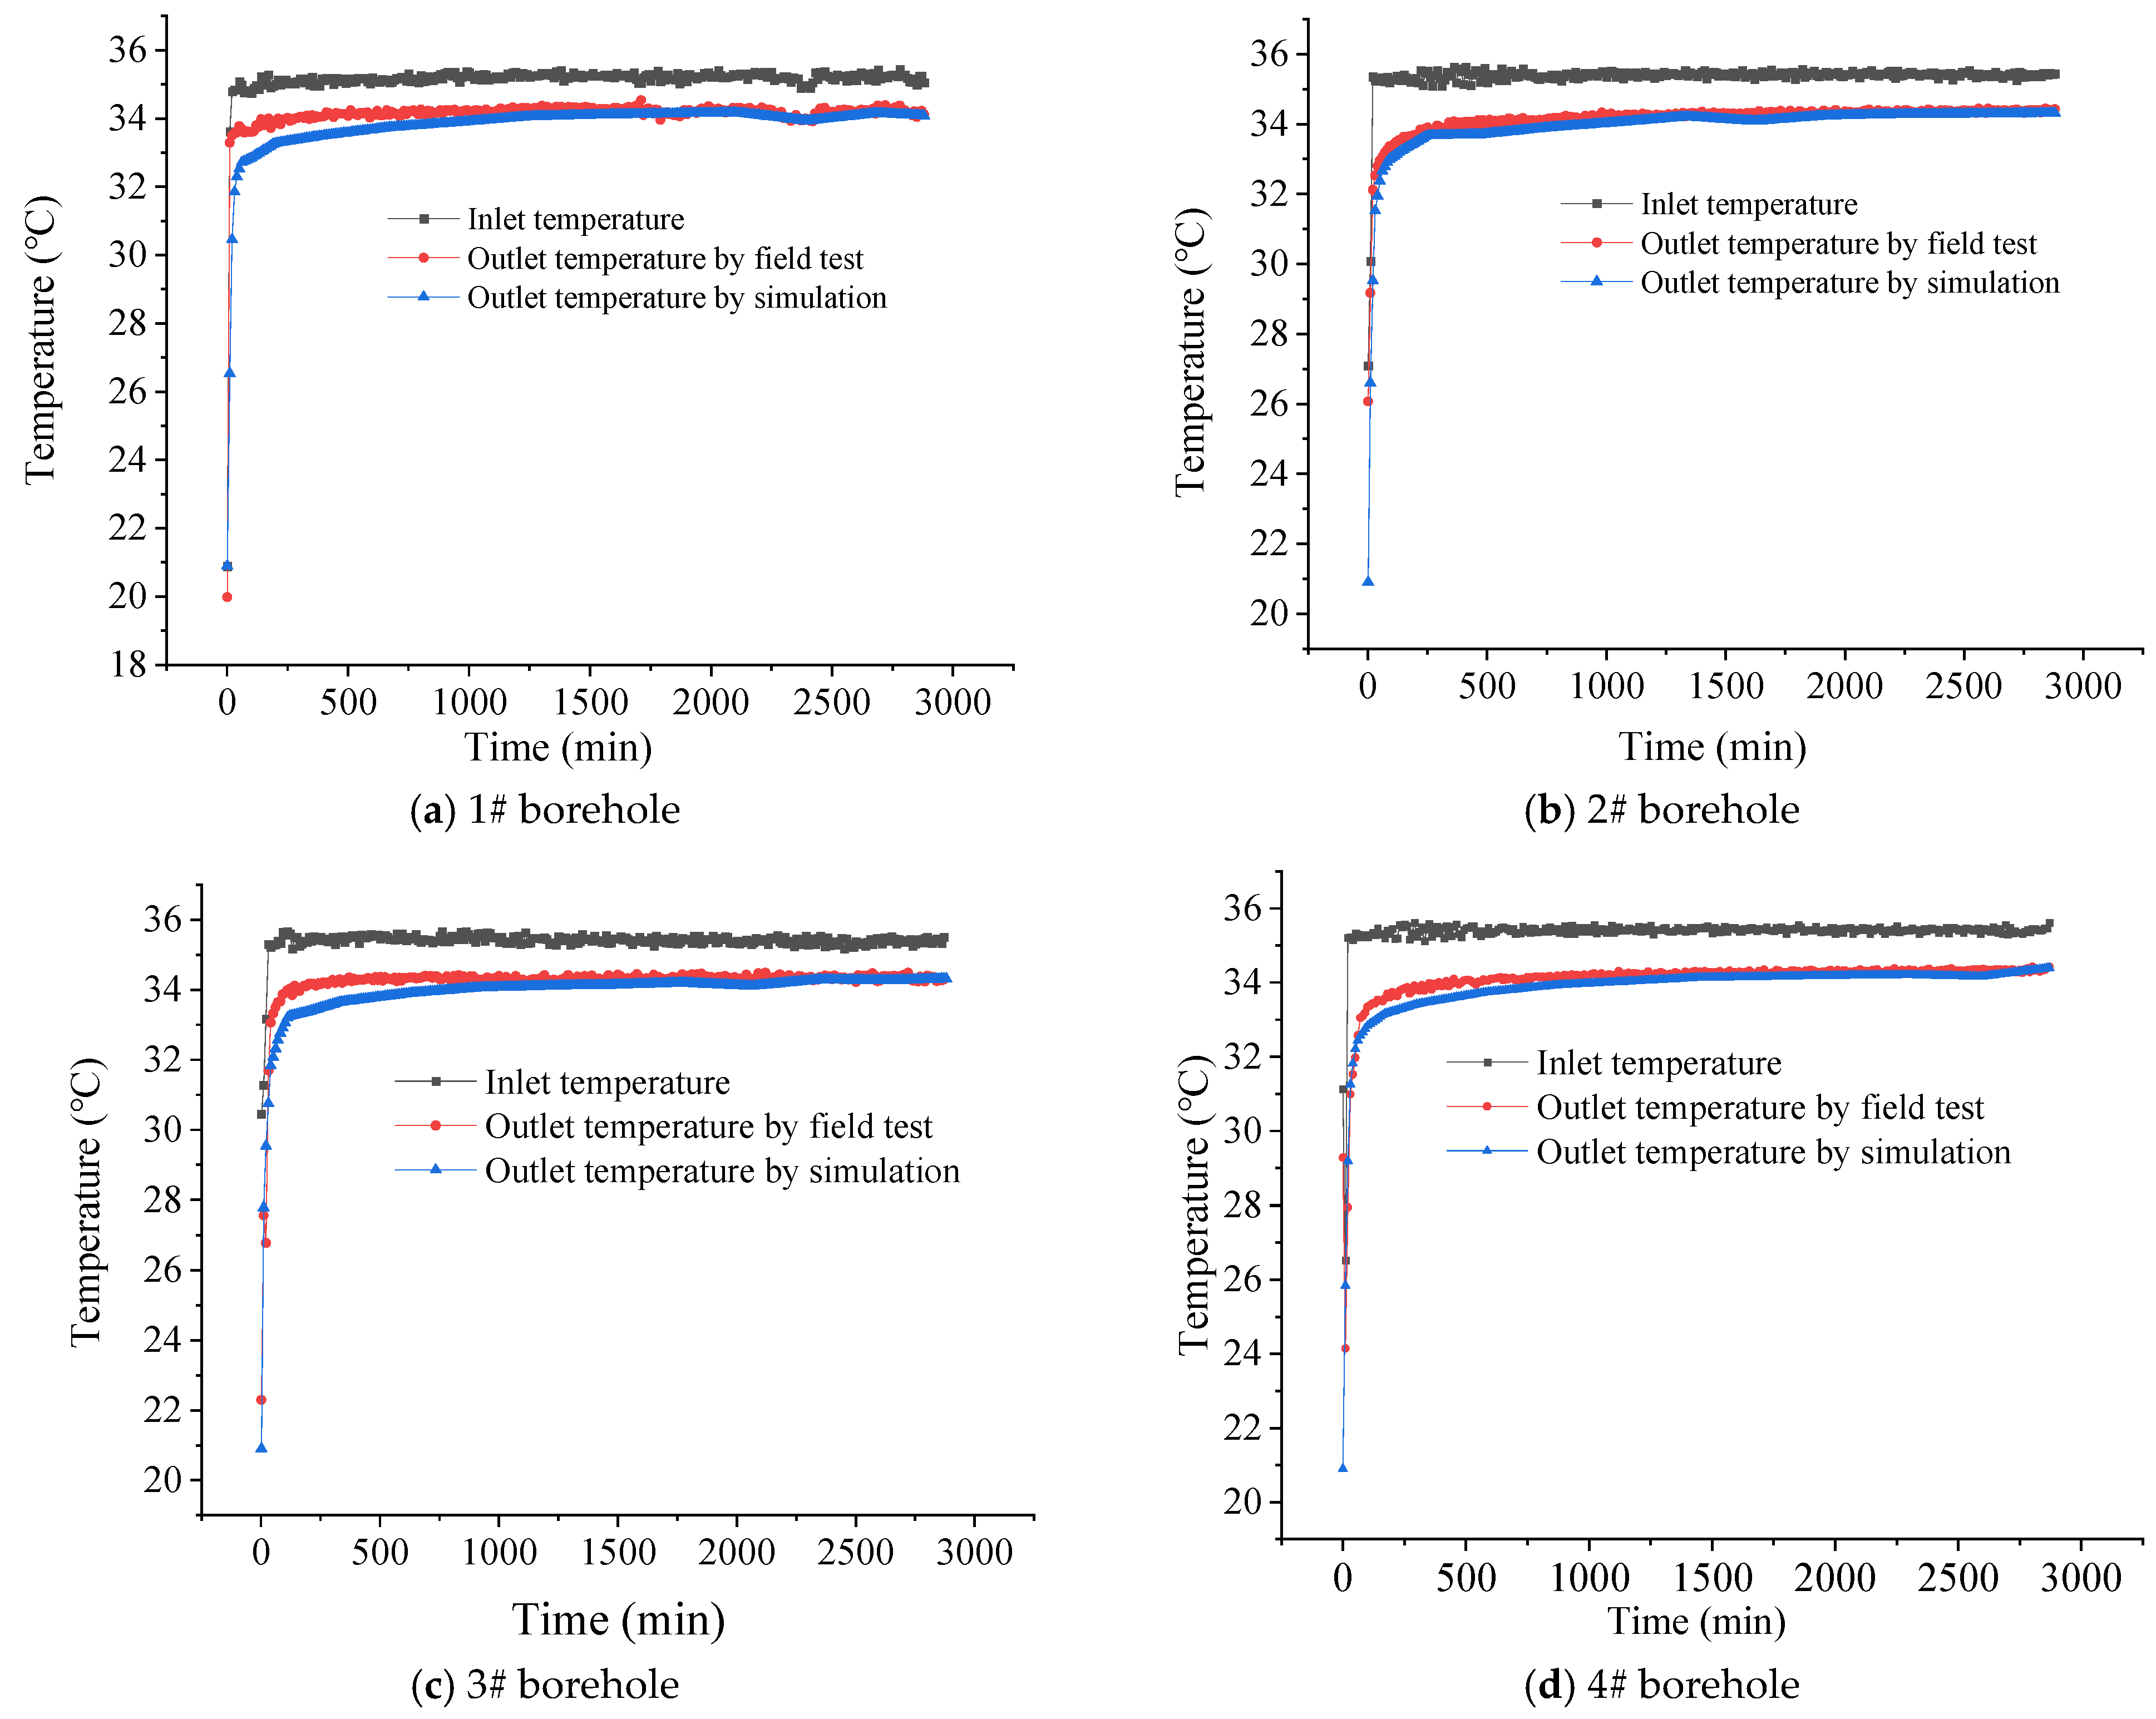
5.2. Results of Numerical Validation

Thermal response tests on four boreholes with a constant inlet temperature of 35 °C were conducted. The tester ran continuously for 48 h to obtain the variation in the outlet temperature, and the testing results were compared with numerical ones as shown in Figure 5.
The average error and root mean square error analytical methods were adopted to analyze the error of the outlet temperature obtained from testing and modeling. The expressions of the two error analysis methods are shown in Equations (21) and (22). Table 6 shows the calculation results of the error between the two samples.
M E = 1 n i = 1 n T f , o u t , i T f , o u t , i
S = i = 1 n T f , o u t , i T f , o u t , i 2 n 2
where, M E is the average error of the sample, S is the root mean square error of the sample, T f , o u t is the outlet temperature of the testing sample, T f , o u t is the outlet temperature of the modeling sample, n is the sample size, and i is the sample number.
It can be seen that the error results obtained from the root mean square error calculation are slightly larger than those of the average error calculation method. The former has an error range of 0.21~0.45 °C, while the latter has an error result of 0.31~0.47 °C. The difference in error analysis between the two methods is not significant, and the error is in a relatively reasonable range. Therefore, it can be concluded that the established calculation model is relatively consistent with the conditions at the testing site.
The COMSOL Multiphysics software program is operated to calculate the numerical model based on the flowchart shown in Figure 6 when the setting of all parameters is completed.

6. Discussion of Numerical Results

6.1. Long-Term Performance Analysis

6.1.1. Methodology

The heat-transfer rate is adopted to investigate the long-term performance of the thermal response of the vertical GHEs. The changes in the outlet temperature could be obtained by the numerical simulation. The equation of the heat-transfer rate per meter of the GHE could be defined as follows:
q G H E , p e r = m f C p , f T f , i n T f , o u t H
where q G H E , p e r is the heat-transfer rate per meter (i.e., per unit depth).

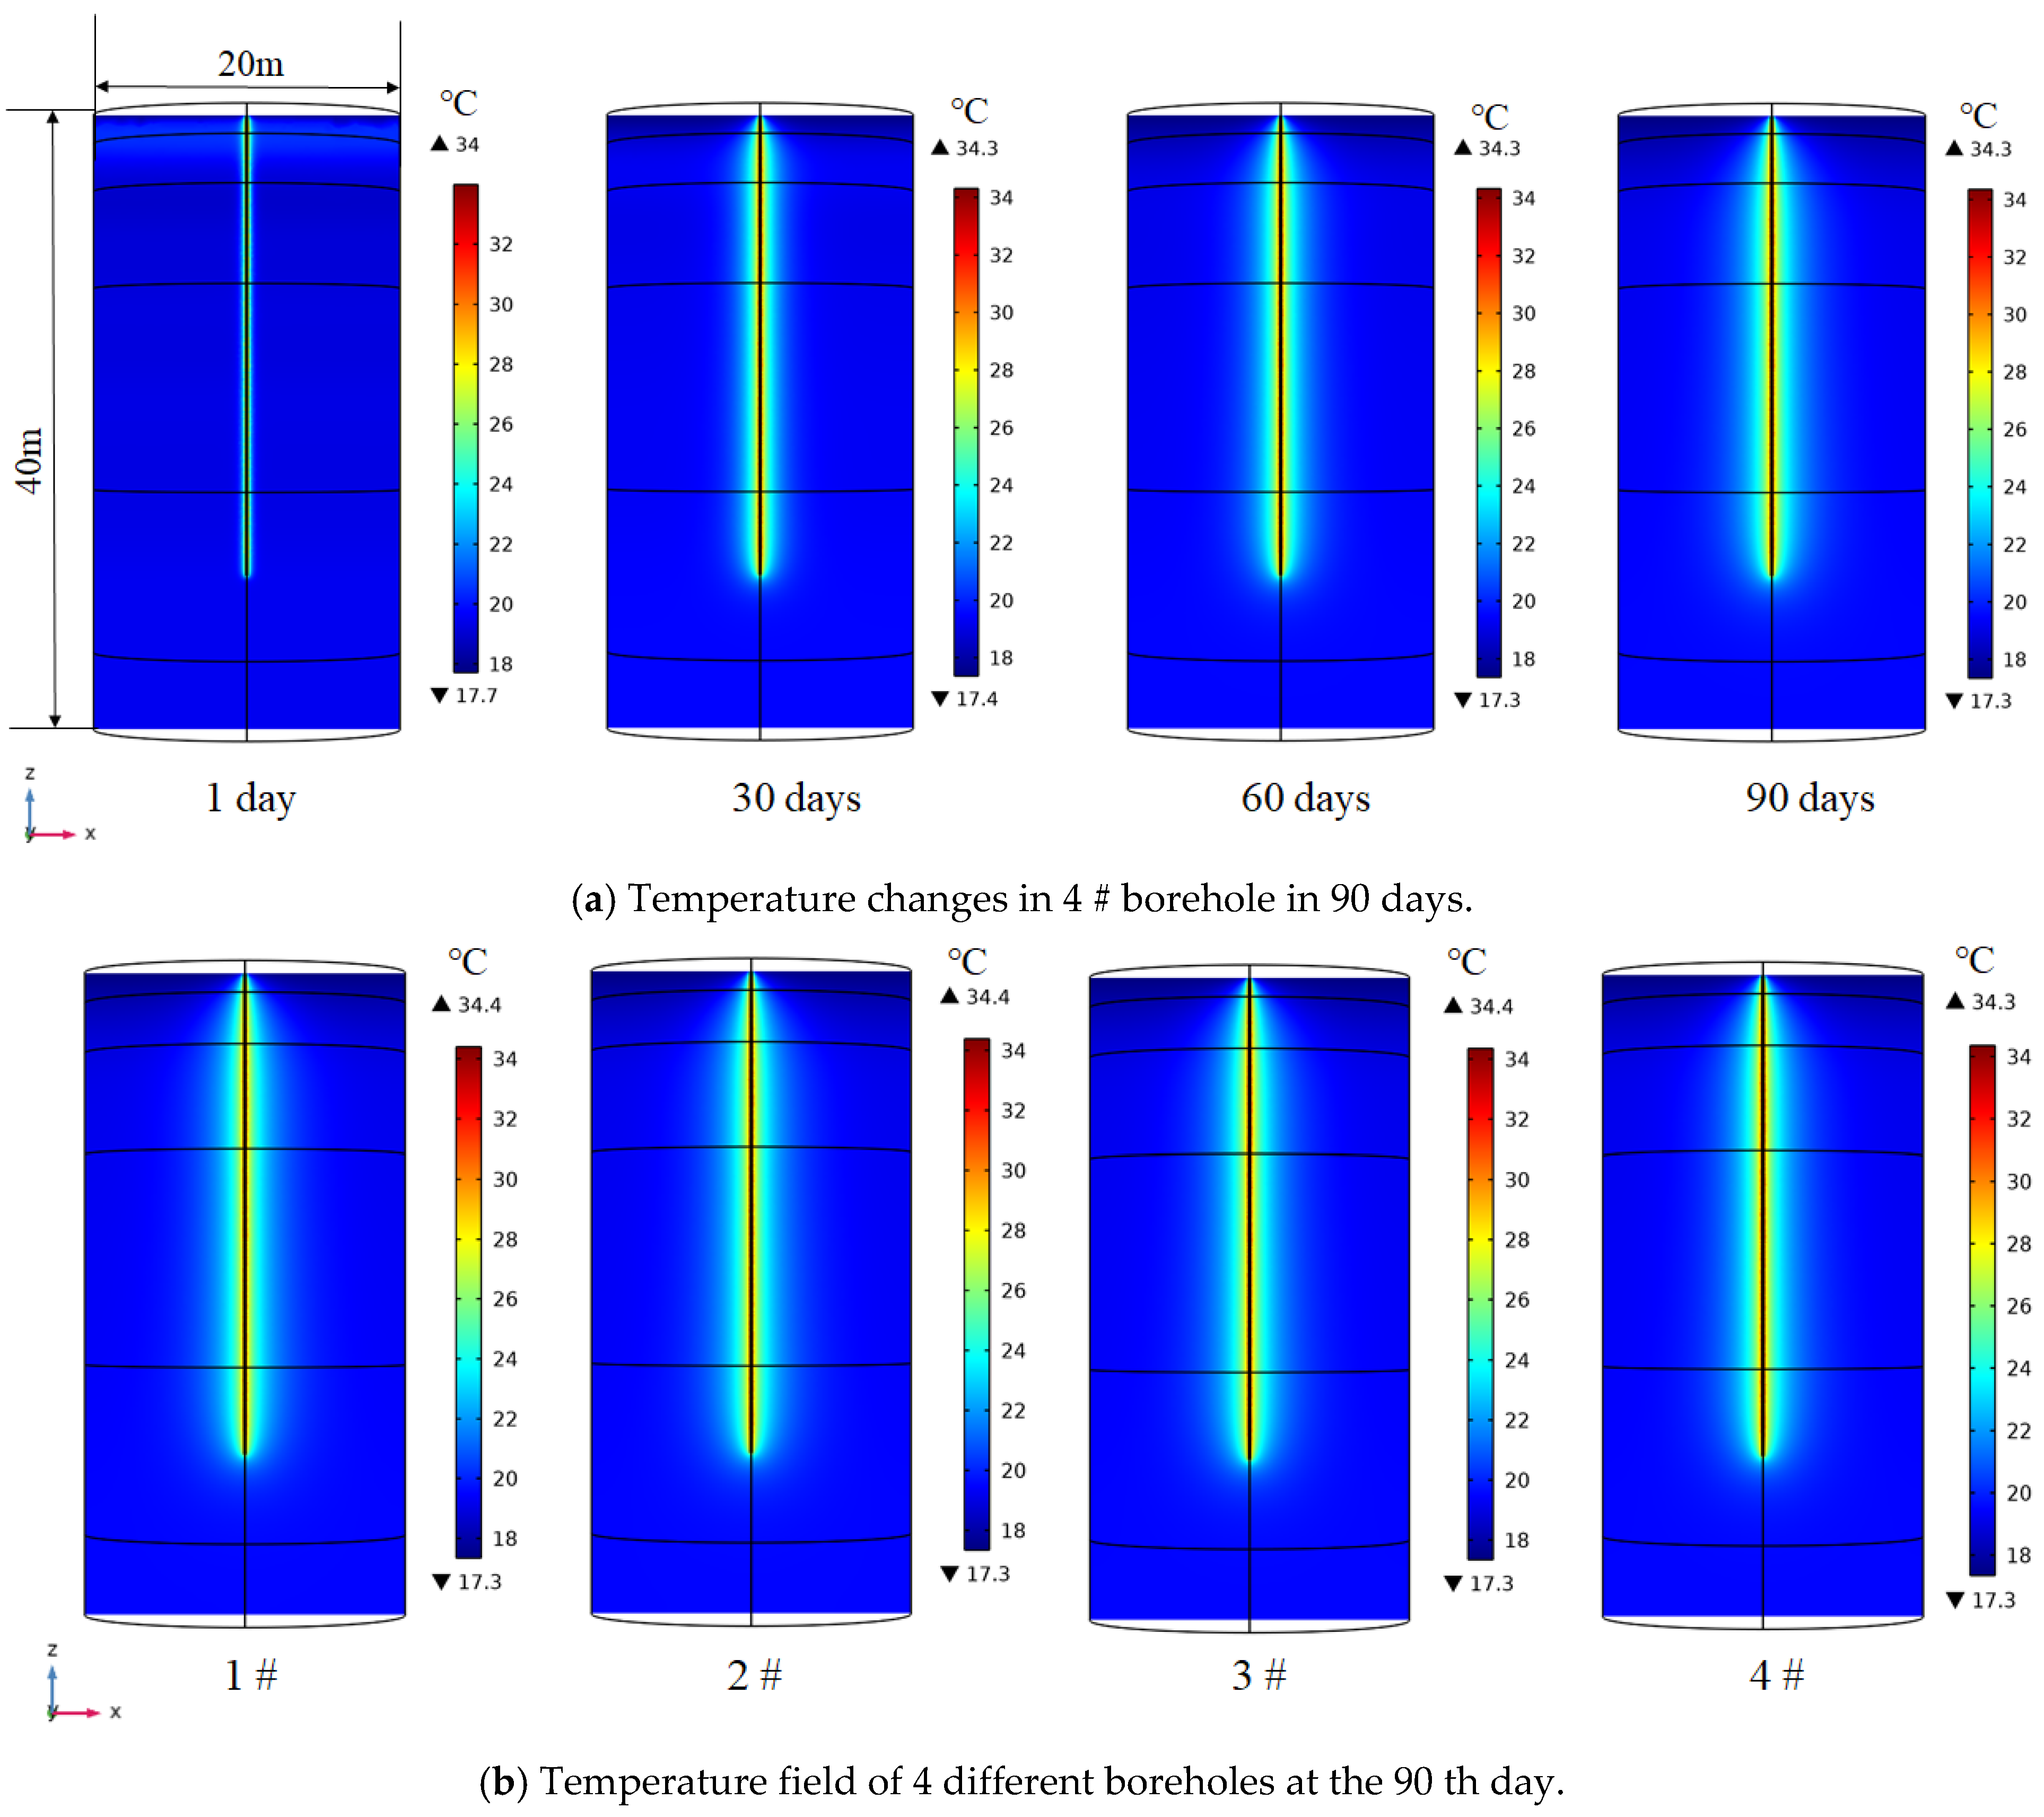
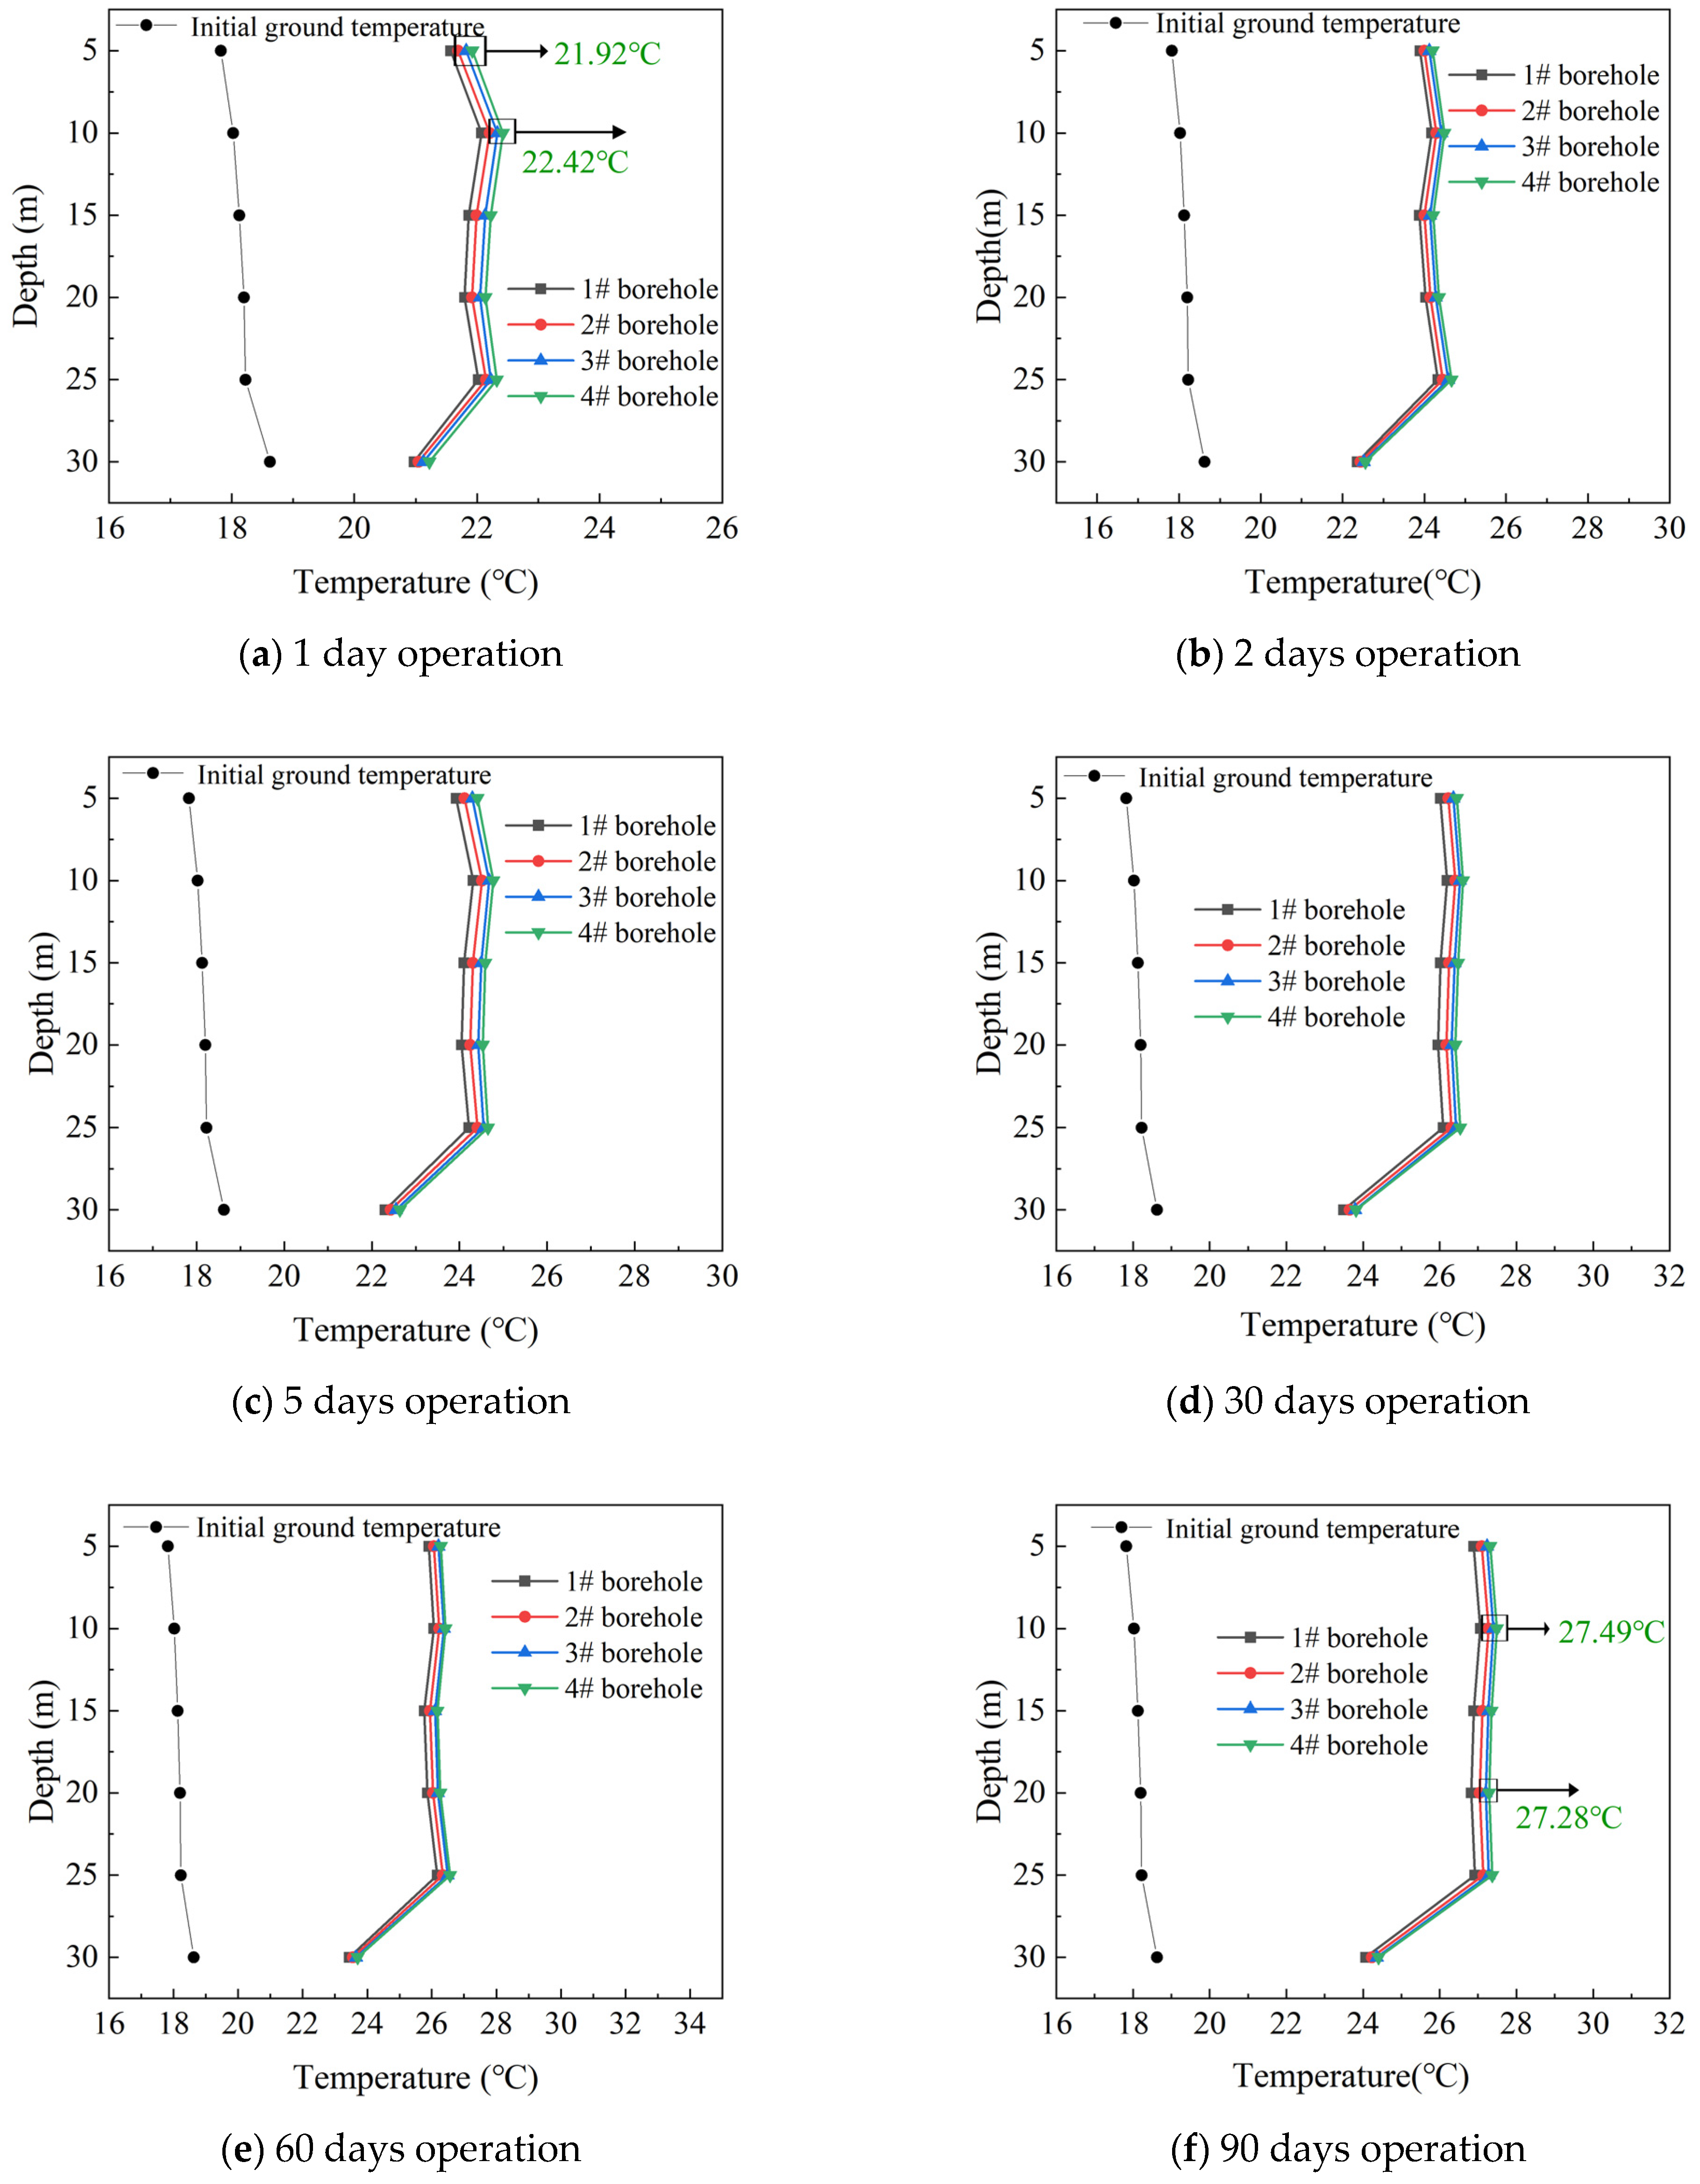
6.1.2. Results and discussion

Variations in the heat-transfer rate and temperature distribution field of the four tested boreholes over a long-term (90-day) period of operation are investigated, with a constant inlet temperature of 35 °C simulating the cooling condition of GHEs in summer. Figure 7a presents the variation in the temperature field of 4# borehole over 90 days. The range of the higher temperature field in the central position becomes wider as time elapses, with heat diffusing homogeneously around the buried pipe. Figure 7b is the temperature field of four different boreholes on the 90th day, in which the differences are not significant, so it is necessary to study the specific changes in soil temperature at different depths. The influence of backfill materials with different thermal conductivity on temperature distribution at different depths is shown in Figure 8.
The figure clearly illustrates the variations in soil temperature at 0.3 m away from the central position of GHE at different depths (i.e., 5, 10, 15, 20, 25, and 30 m under ground level) during the 90 days of continuous operation. The greater the thermal conductivity of backfill material at the same level, the higher the temperature that can be obtained. This is because backfill material of high thermal conductivity could contribute to faster heat diffusion around the soil. The temperature difference in the depth of 0 to 25 m is relatively large in the initial stage, but gradually decreases as time elapses. However, there is a sudden temperature change between 25 and 30 m during the entire operation time, which is mainly because the heat-transfer efficiency decreases as the depth of ground heat exchanger extends to the downward part, in which the heat-transfer process is mainly concentrated in the middle part of the buried pipe. So a lower temperature could be achieved at the end of the U-shaped pipe.
Variations in the heat-transfer rates per unit depth over 90 days of operation are shown in Figure 9a. As the temperature of the surrounding soil increased, the temperature difference between the buried pipe and the surrounding soil decreased, decreasing the overall heat-transfer rate as time elapsed. In the early stage of the heat-transfer process, there was a great temperature difference between the heat exchanger and the surrounding soil, resulting in a higher heat-transfer rate. The heat-transfer rate dropped sharply within ten days, which was mainly due to the sharp decrease in temperature difference. In the middle and later stage, the narrowing temperature difference tends to be stabilized, and the heat-transfer rate remains within a relatively low level. Backfill material of higher thermal conductivity has a greater thermal performance. The heat-transfer rates of per unit depth are 42.31, 44.97, 45.95, and 46.73 W/m on the first day, and then they decrease significantly within 10 days, to 21.27, 22.56, 24.25, and 25.74 W/m, with a decreasing rate of nearly or more than 40%. The heat-transfer rates continue to decrease in a relatively gentle trend after 10 days, and the differences among four testing boreholes become narrow. The values on the 90th day are 14.18, 14.96, 15.66, and 16.19 W/m. Figure 9b presents the improvement of the heat-transfer rate compared to that of the 1# borehole. The overall improvement rate increases with the rise in the thermal conductivity, which improves by 15.74% for 2#, 22.78% for 3#, and 27.46% for 4# on the day compared to the 1# borehole. Backfill material of a higher thermal conductivity has a greater improvement rate in the early stage, and it gradually decreases as time elapses, tending to become stable. The improvement rate decreases to 5.47% of 2#, 10.40% of 3#, and 14.30% of 4# after 90 days.

6.2. Influence of Groundwater

6.2.1. Methodology

The influence of groundwater seepage on the heat-transfer process of vertical GHEs is shown in Figure 10. The long-term heat-transfer performance over a period of 90 days is studied separately under the influence of groundwater from three directions. Considering the fact that it is difficult to obtain analytical solutions for groundwater in non-uniform flow processes, all flows are treated as steady.
Parameter setting for groundwater seepage is of great importance. The velocity of groundwater seepage is usually concentrated between 10−7 and 10−5 m/s [39,40,41,42], which covers a wide range of different conditions. An average value of 5 × 10⁻⁶ m/s is adopted to investigate the influence of groundwater seepage of a horizontal direction, a 45° angle to horizontal direction, and a vertical direction, respectively. The effect of gravity on groundwater seepage is also taken into consideration.

6.2.2. Results and Discussion

Figure 11 presents the variation in the temperature field around vertical GHEs under the influence of groundwater seepage of different directions in the 4# borehole. Heat accumulation caused by the heat-transfer process further diffuses with the direction of groundwater flow, but the impact of different directions on temperature distribution varies greatly.
Figure 12 depicts the influence of horizontal groundwater seepage on the soil temperature variation at different depths, in which the distance is in the downstream direction of groundwater, 0.3 m away from the central position. Horizontal groundwater seepage diffuses the heat accumulation generated during the heat-transfer process to the downstream end of the flow, resulting in an increase in temperature at different depths. Similarly, the temperature fluctuation at different depths gradually decreases as time elapses, which is consistent with the temperature variation that occurs without the influence of groundwater.
Figure 13 shows the changing curves of the heat-transfer rate and improvement rate in 90 days under the influence of horizontal groundwater seepage. It can be seen that groundwater traveling in a horizontal direction diffused the heat accumulation in the soil to the side far away from the heat-exchange surface; therefore, the heat-transfer rate on the 90th day is higher than that that occurs without the influence of groundwater, with a maximum heat-transfer rate of 23.13 W/m for the 4# borehole. In addition, during the heat-transfer process, heat accumulation in the soil could be promptly carried away by groundwater, so the long-term heat transfer-rate curve is a relatively stable straight line. It is obvious that the influence of horizontal groundwater could achieve a full heat-exchange effect. Improving the thermal conductivity of backfill materials could still achieve a higher heat-transfer efficiency under long-term operation with the influence of horizontal groundwater seepage. As shown in Figure 13b, the improvement rate of heat transfer tends to be consistent after 5 days. The long-term heat-transfer rate remains within a stable range under the influence of horizontal groundwater, in which the long-term heat transfer improvement rate of 4# remains at 10.14%.
Under the influence of vertical groundwater flow, heat accumulation generated during the heat-exchange process at the upper side of the vertical buried pipe diffuses to the lower part, resulting in a decrease in the temperature difference between the heat exchanger and the surrounding soil at the lower end of the pipe. An ineffective diffusion of heat accumulation causes a decrease in the heat-transfer rate, in which the changing curves of backfill materials with different thermal conductivity coefficients tend to overlap, as shown in Figure 14a. The heat-transfer rates in the 90th day range from 10.44 to 10.81 W/m, with the difference reducing to 0.37 W/m. The heat-transfer rate curves show a decreasing trend all the time. It is obvious that under the influence of vertical groundwater flow, improving the thermal conductivity of the backfill material is not so significant for long-term operation. Similarly, Figure 14b illustrates the improvement rate of heat transfer in different periods. It can be seen that the improvement rates gradually decrease as the operation time rises. The increase in the heat-transfer rate is not outstanding; it is lower than those observed without the influence of groundwater seepage or under the influence of horizontal groundwater.
When the direction of the groundwater flow is at a 45° angle to the horizontal direction, the long-term heat-transfer rates are between those of the horizontal direction and the vertical one, with a maximum heat-transfer rate of 19.76 W/m for 4# and a minimum value of 18.29 W/m for 1# at the 90th day, in which the difference is 1.47 W/m. The curve trend shows a steady decrease over time. Improving the thermal conductivity of backfill materials still has a positive influence on the long-term heat-transfer performance under the influence of groundwater seepage with a direction of 45°to horizontal level. As shown in Figure 15b, the improvement rate in each borehole shows no significant difference during the 90 days of operation, although the improvement rate in 4# borehole decreases from 8.74% on the 1st day to 8.00% on the 90th day. Due to the simultaneous influence of groundwater seepage of both vertical and horizontal directions, the heat-transfer rates and improvement rate for long-term operation are between the two conditions under the influence of groundwater mentioned above (i.e., horizontal and vertical groundwater seepage).

7. Conclusions

A 3D finite element model based on COMSOL Multiphysics was established to investigate the long-term continuous (i.e., 90 days) performance of vertical GHEs backfilled with waste material of high thermal conductivity. The heat-transfer rate of four boreholes under long-term operation was evaluated considering the effect of the groundwater seepage. Compared to previous research, this study is not only limited to laboratory and field testing, but also further investigates the long-term heat-transfer performance by numerical simulation. The authors provide a comprehensive analysis and verification of the feasibility of reusing thermally enhanced solid waste material of fly ash. The research results have a significant value, offering both environmental protection and economic benefit.
Laboratory tests have shown that adding graphite powder to waste fly ash could effectively improve the thermal conductivity when it was used as backfill material, and field testing has fully verified this, as it was used in a real GHEs system. Finally, long-term numerical simulation and analysis were carried out based on these considerations. Some major conclusions are illustrated as follows:
  • The results of the laboratory tests have shown that graphite could improve the thermal property of cement/fly ash mortar to a relatively high level, in which the thermal conductivity reached 2.317 and 2.391 W/(m K) when the mass ratios of graphite were 5% and 10%, respectively. Then, the numerical model’s accuracy was verified through field tests, with an average outlet temperature of 0.21~0.45 °C and root mean square error of 0.31~0.47 °C, which could be used for long-term performance analysis.
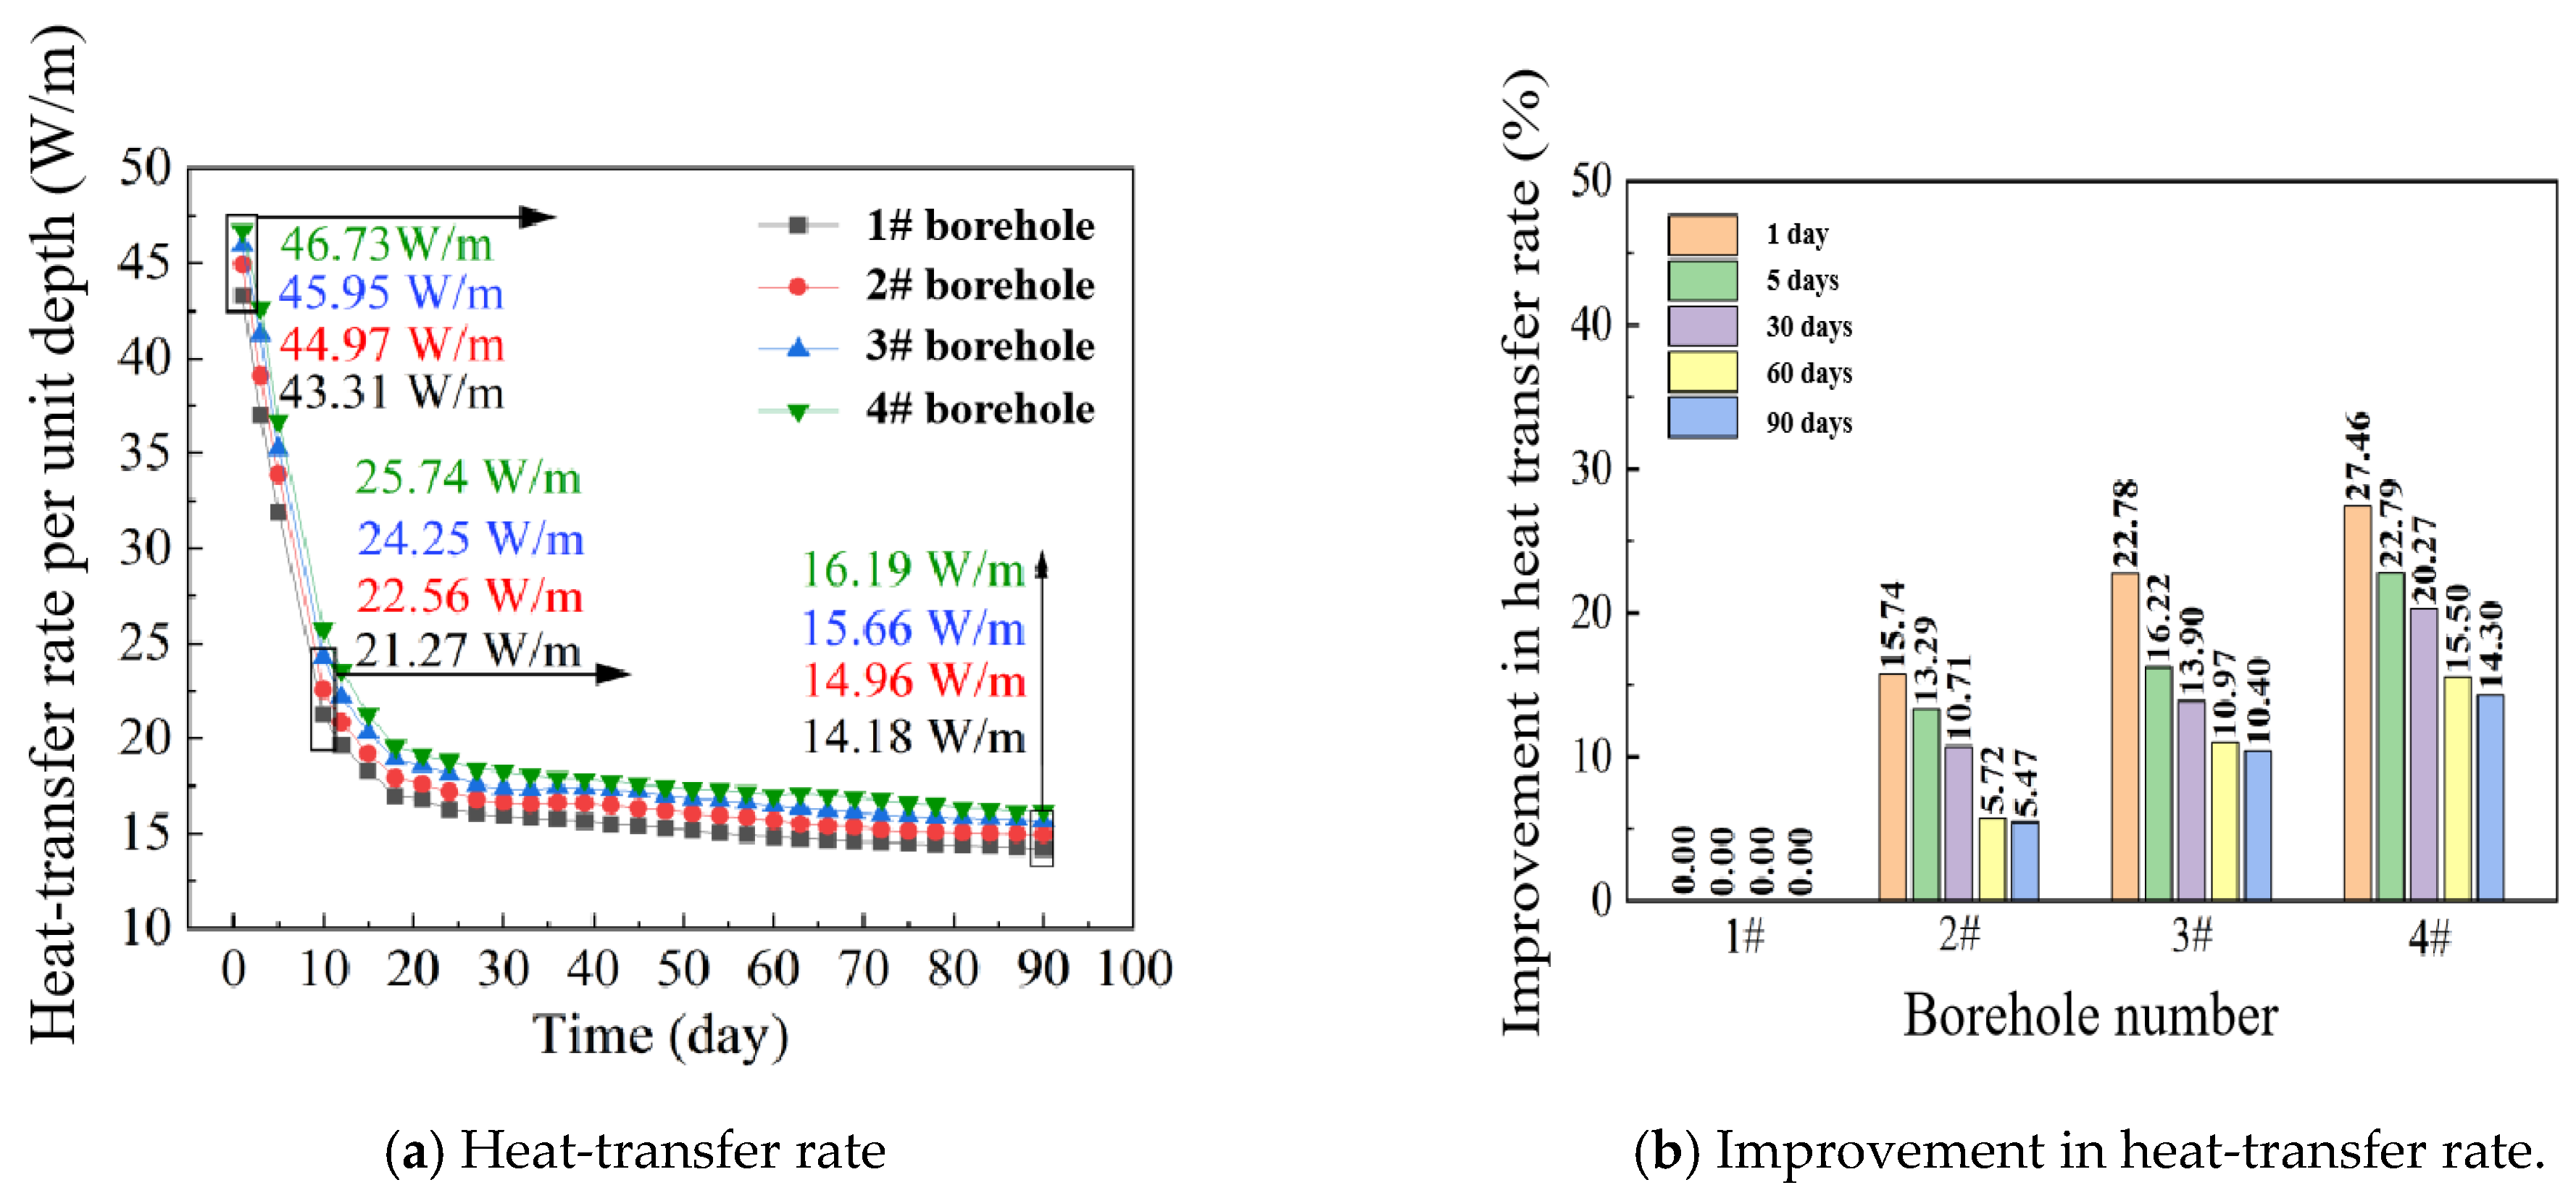
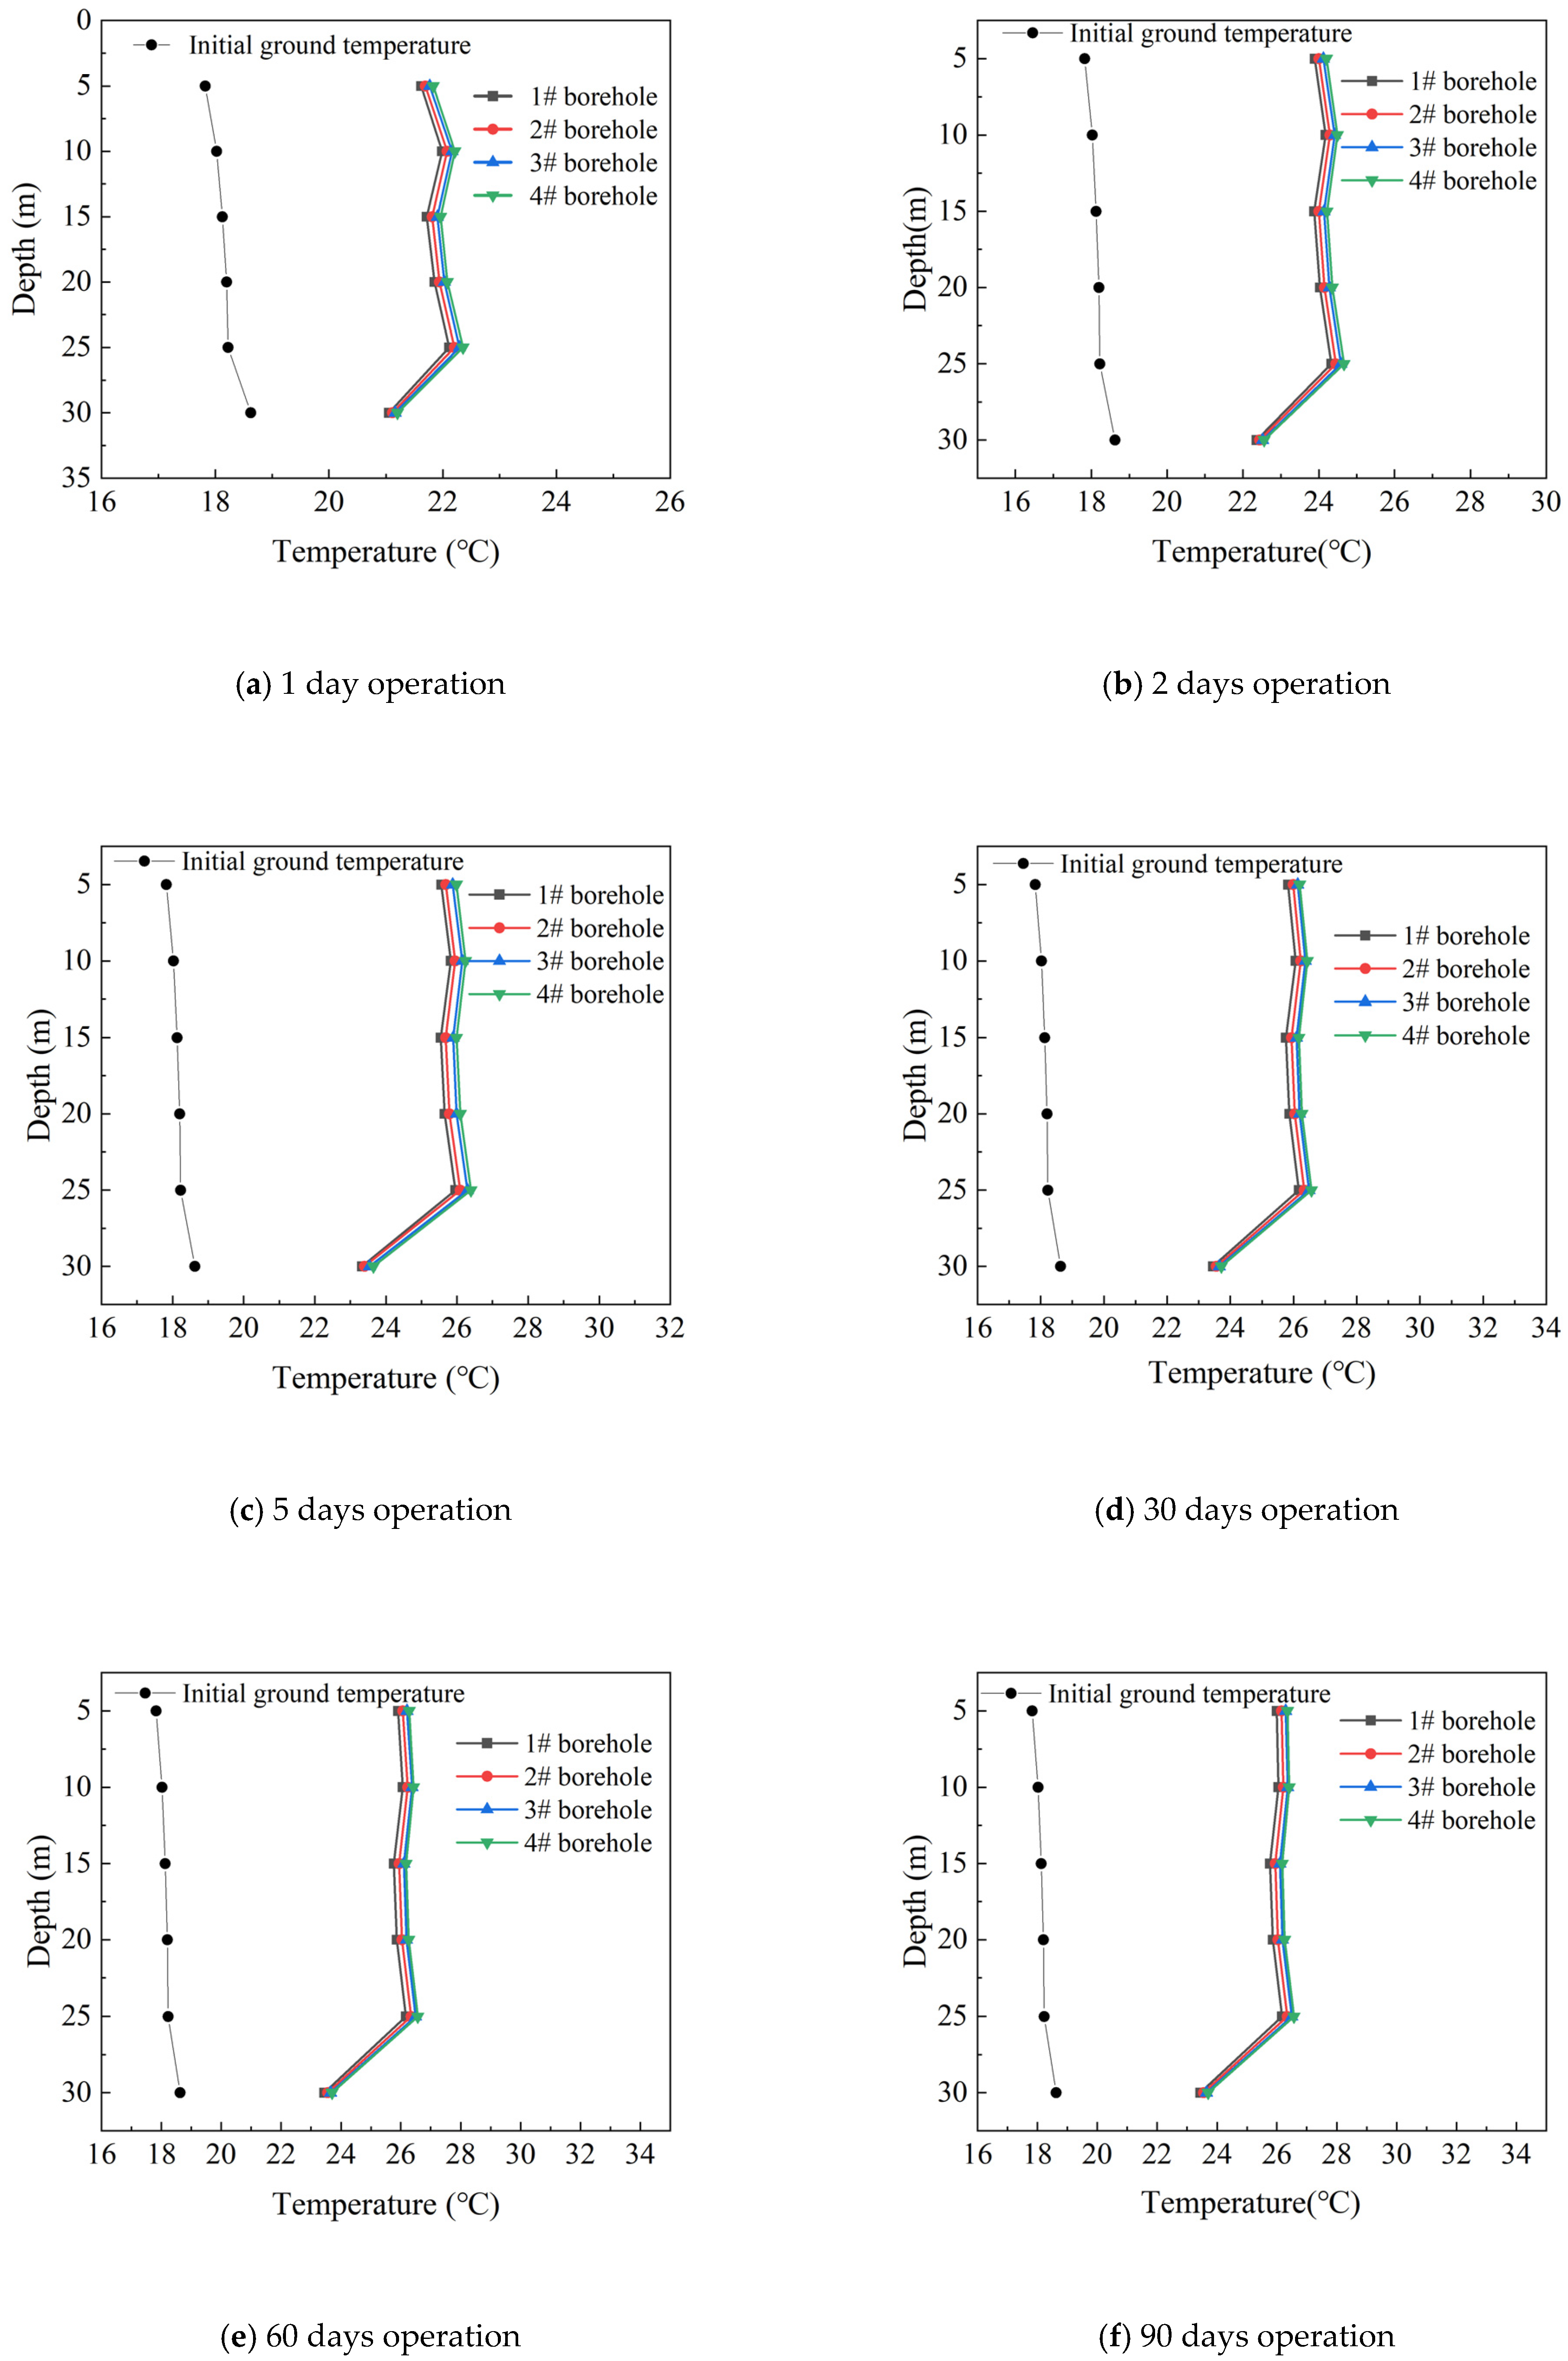
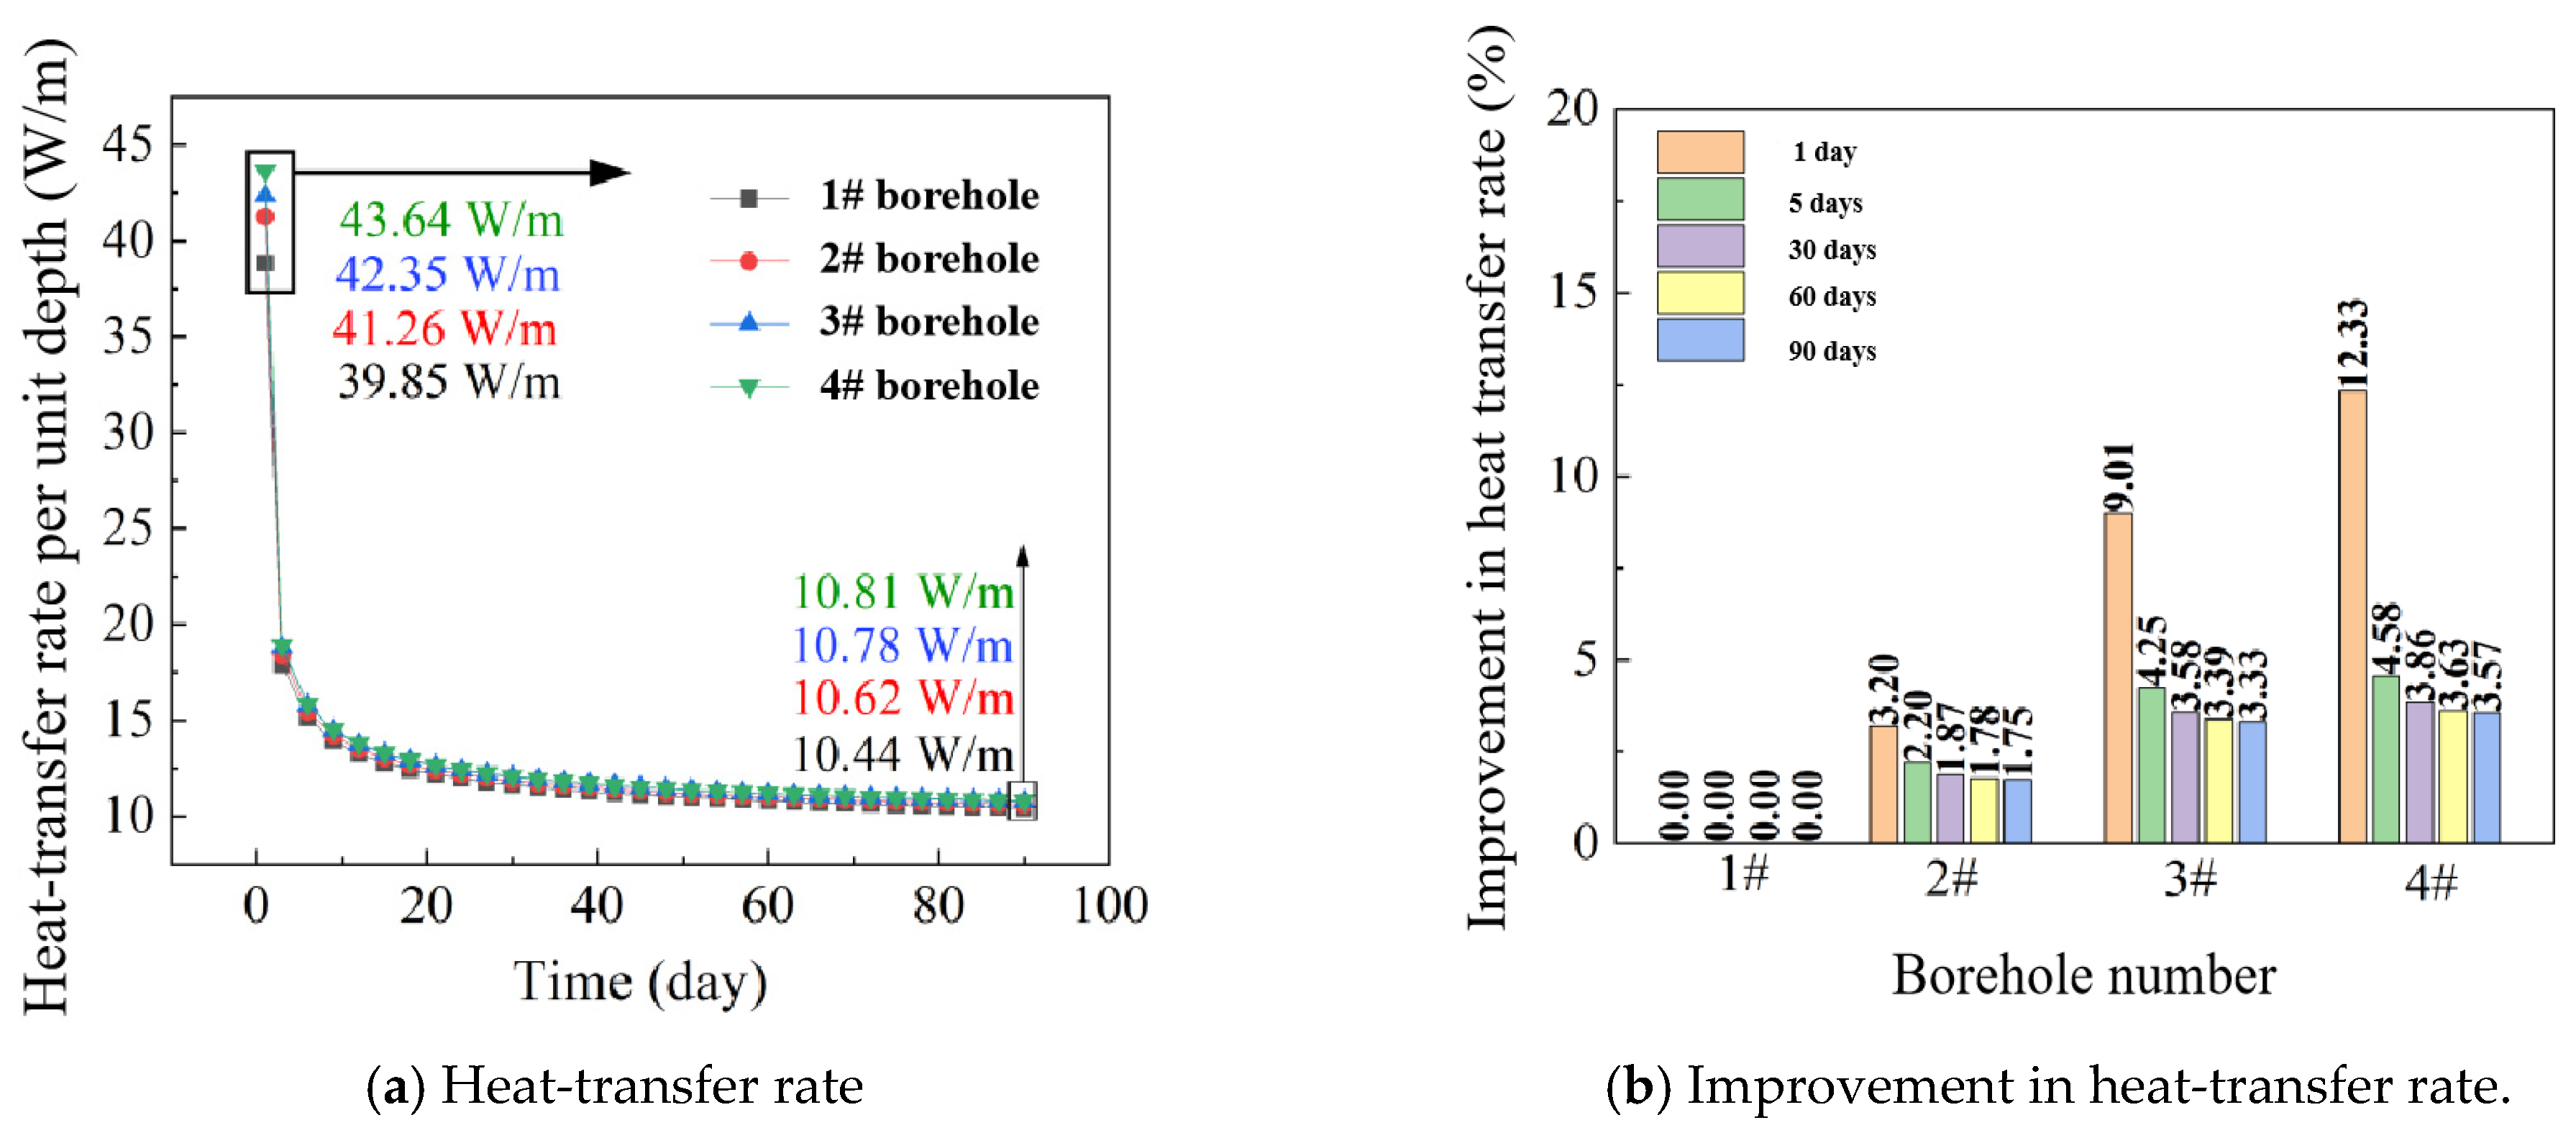
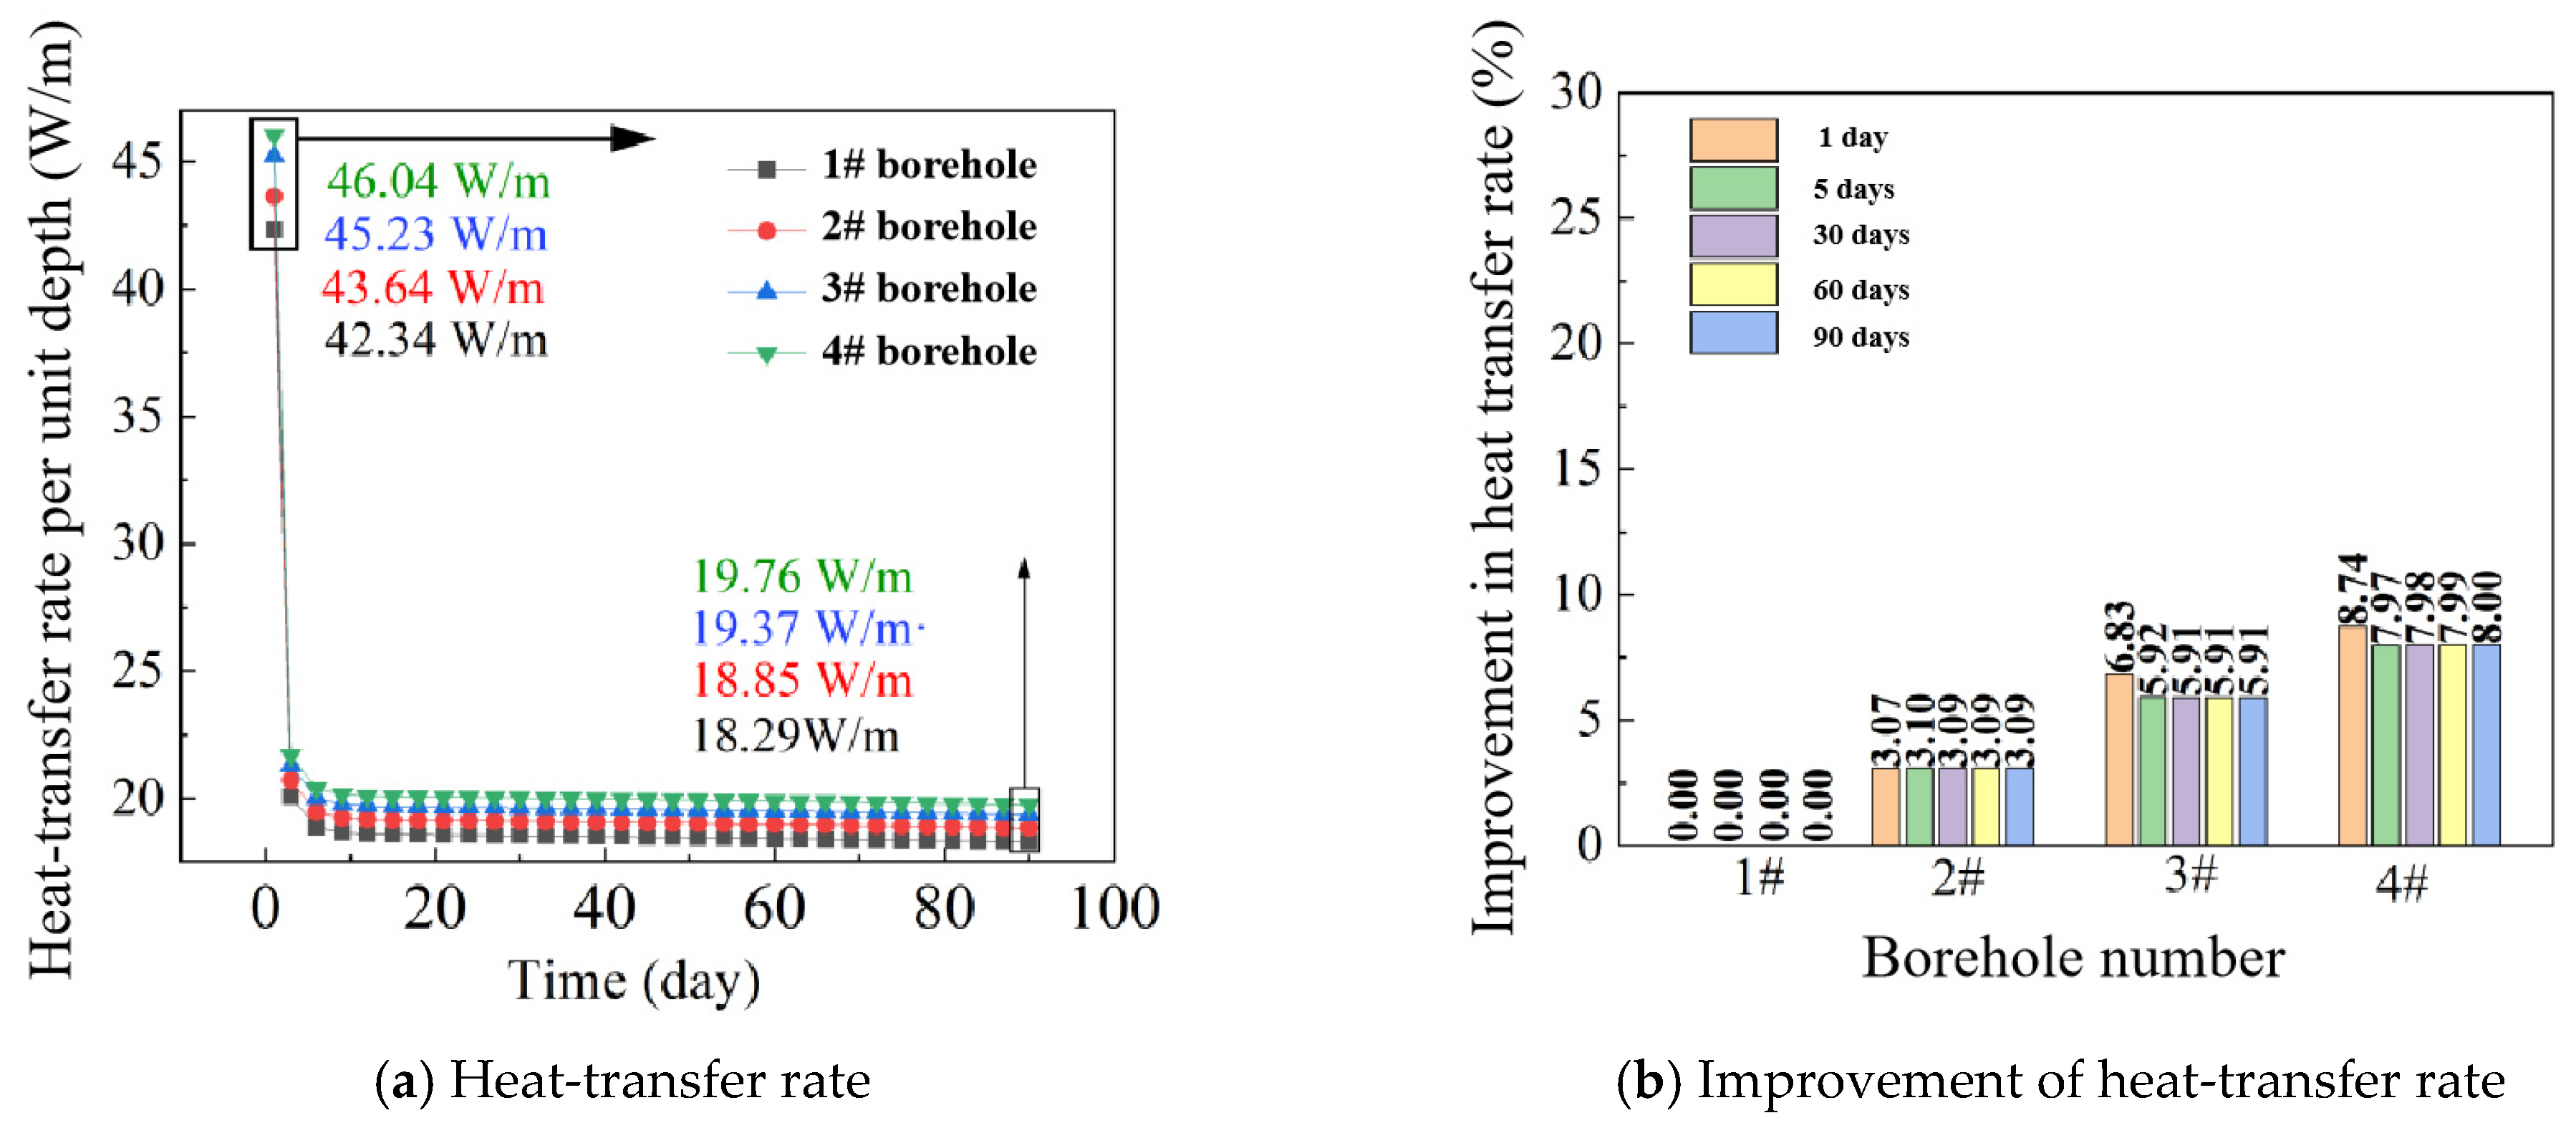
  • The long-term heat-transfer rates of four boreholes were evaluated, in which the values of the four boreholes initially decreased from 43.31 for 1#, 44.97 for 2#, 45.95 for 3#, and 46.73 W/m for 4# and then again to 14.18 W/m, 14.96 W/m, 15.66 W/m, and 16.19 W/m, respectively after 90 days operation. A relatively large decline was observed during the first 10 days, then the declines in heat transfer tended to stabilize, and the differences in heat transfer between boreholes gradually reduced.
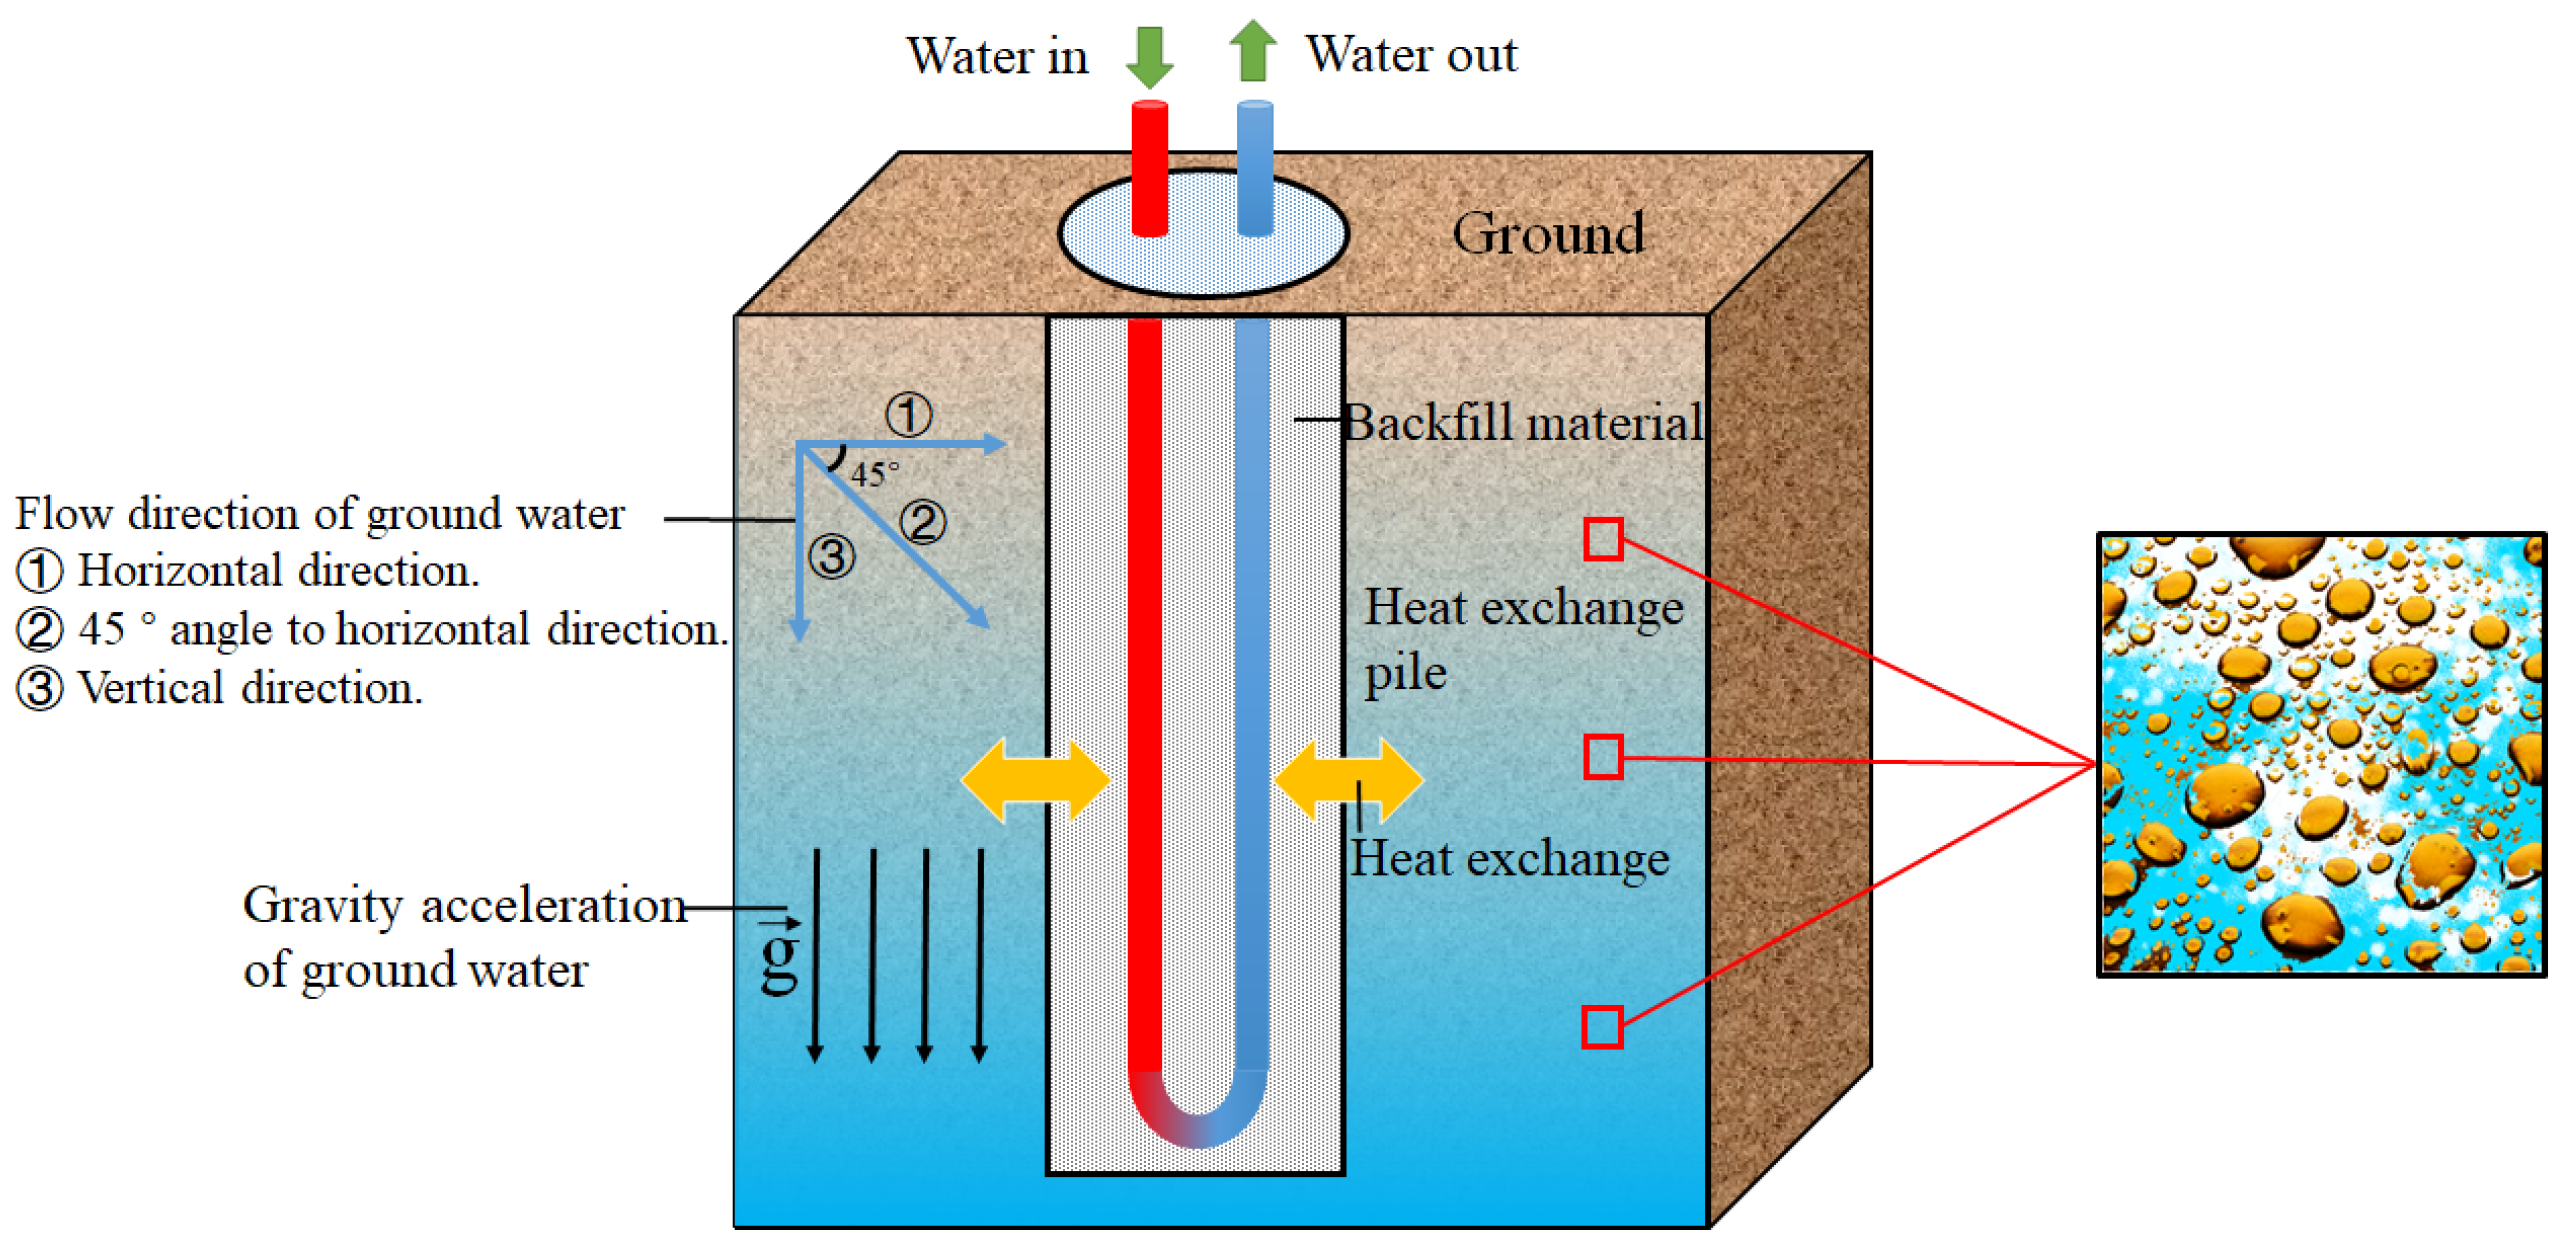
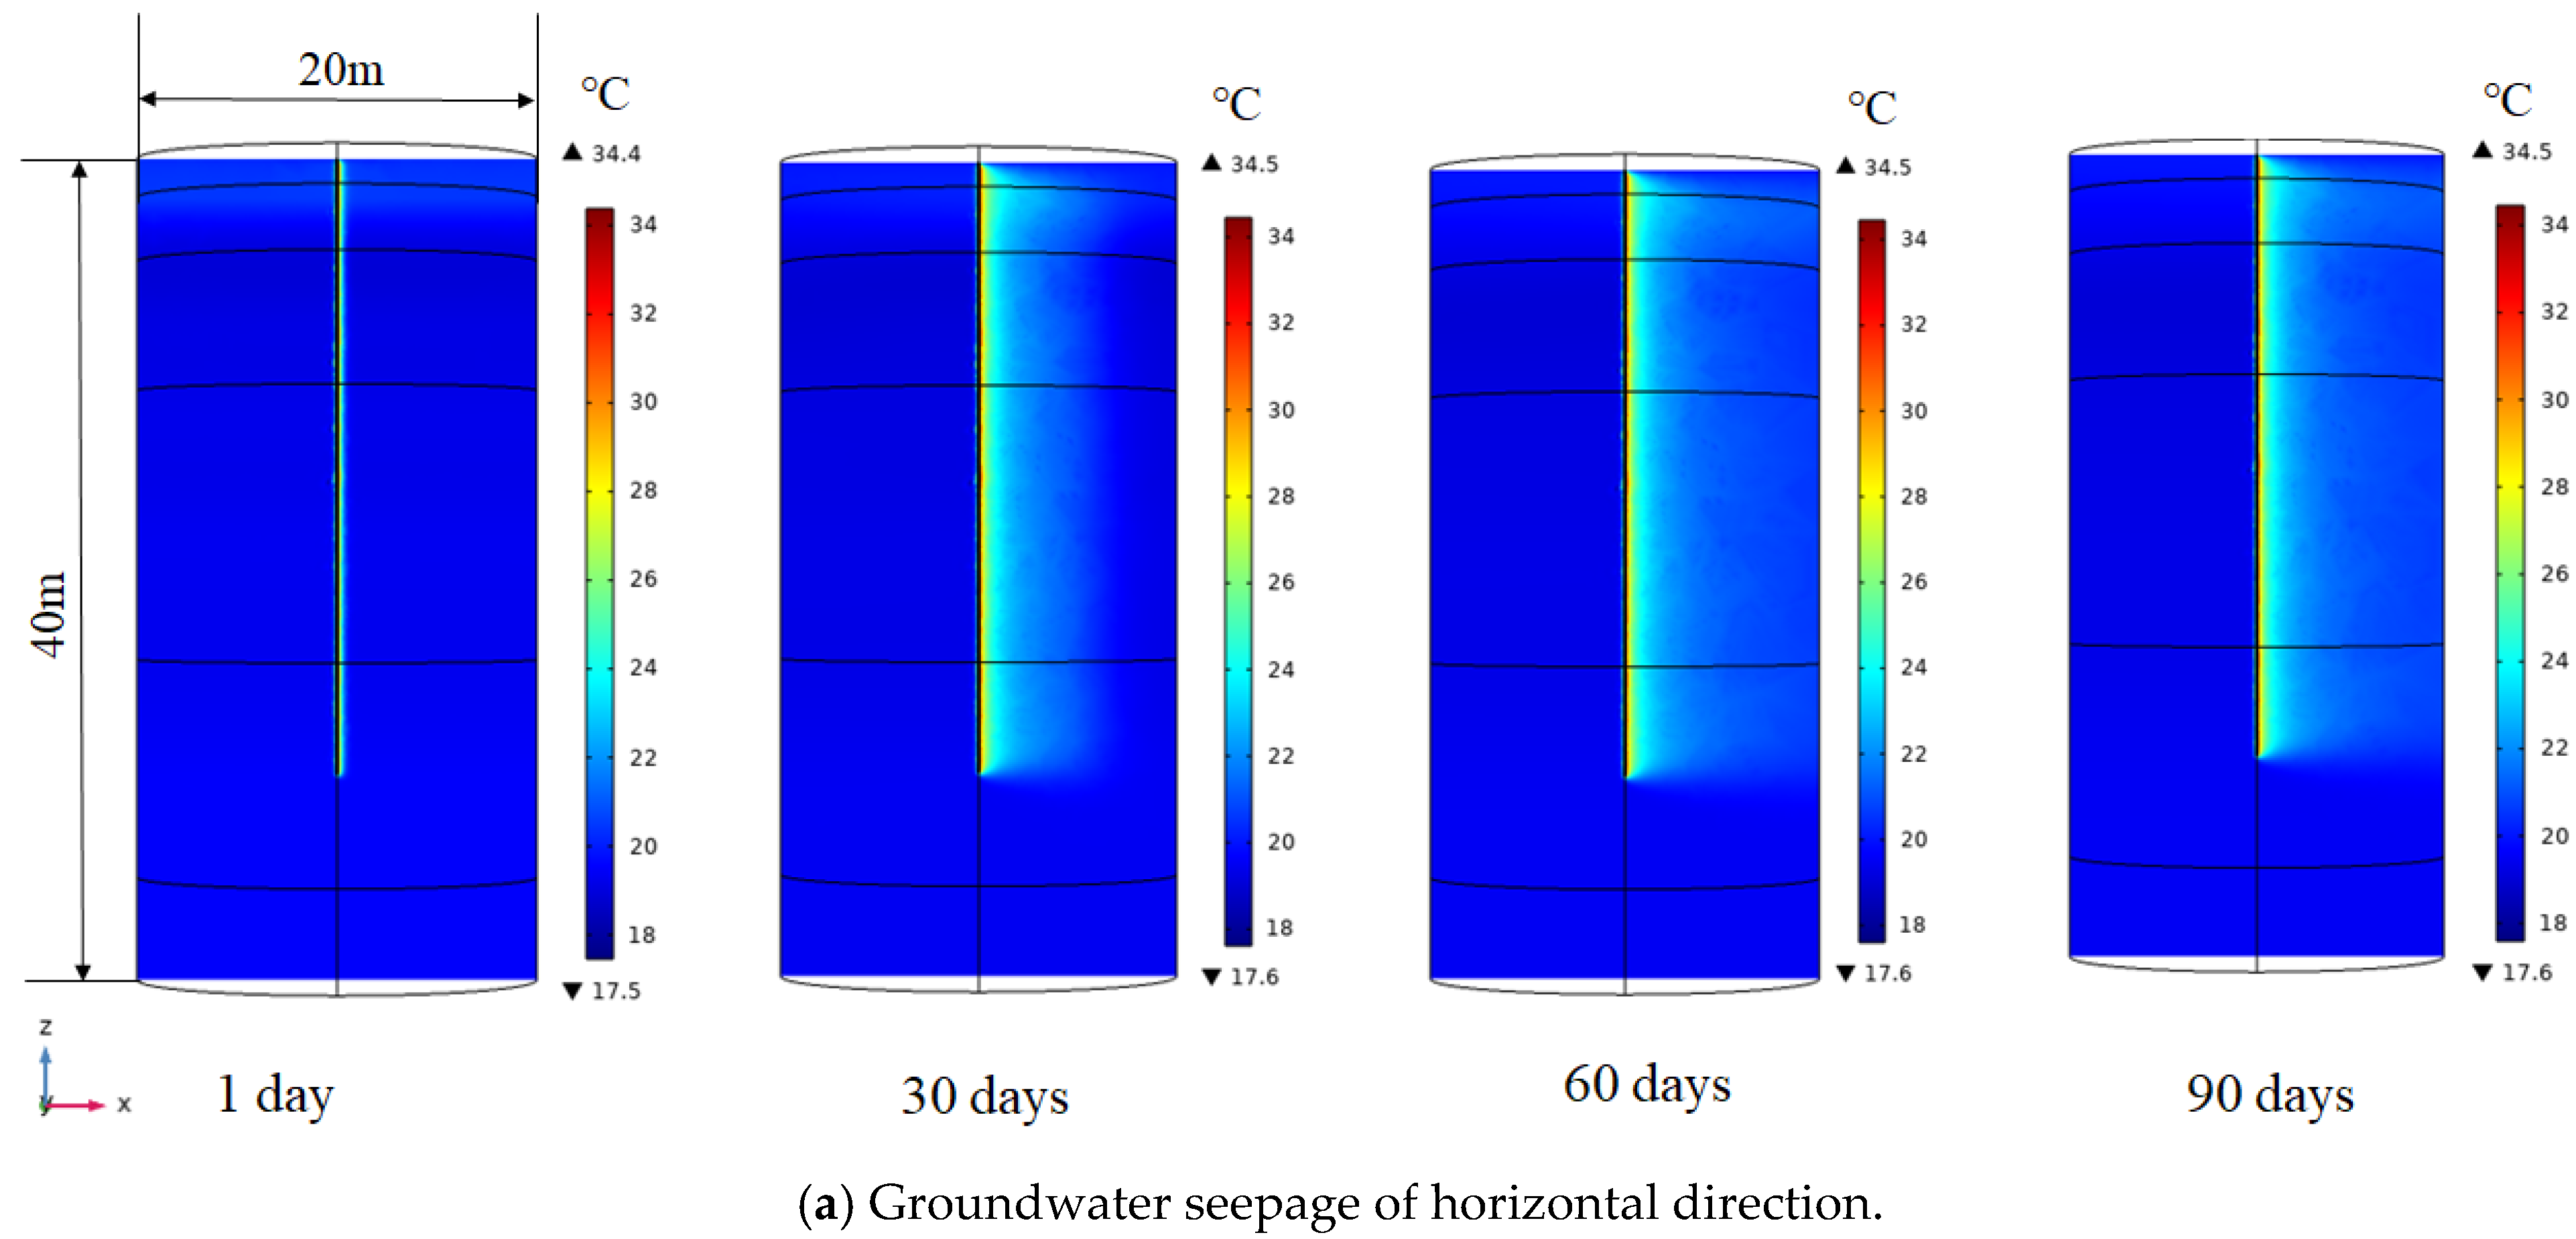
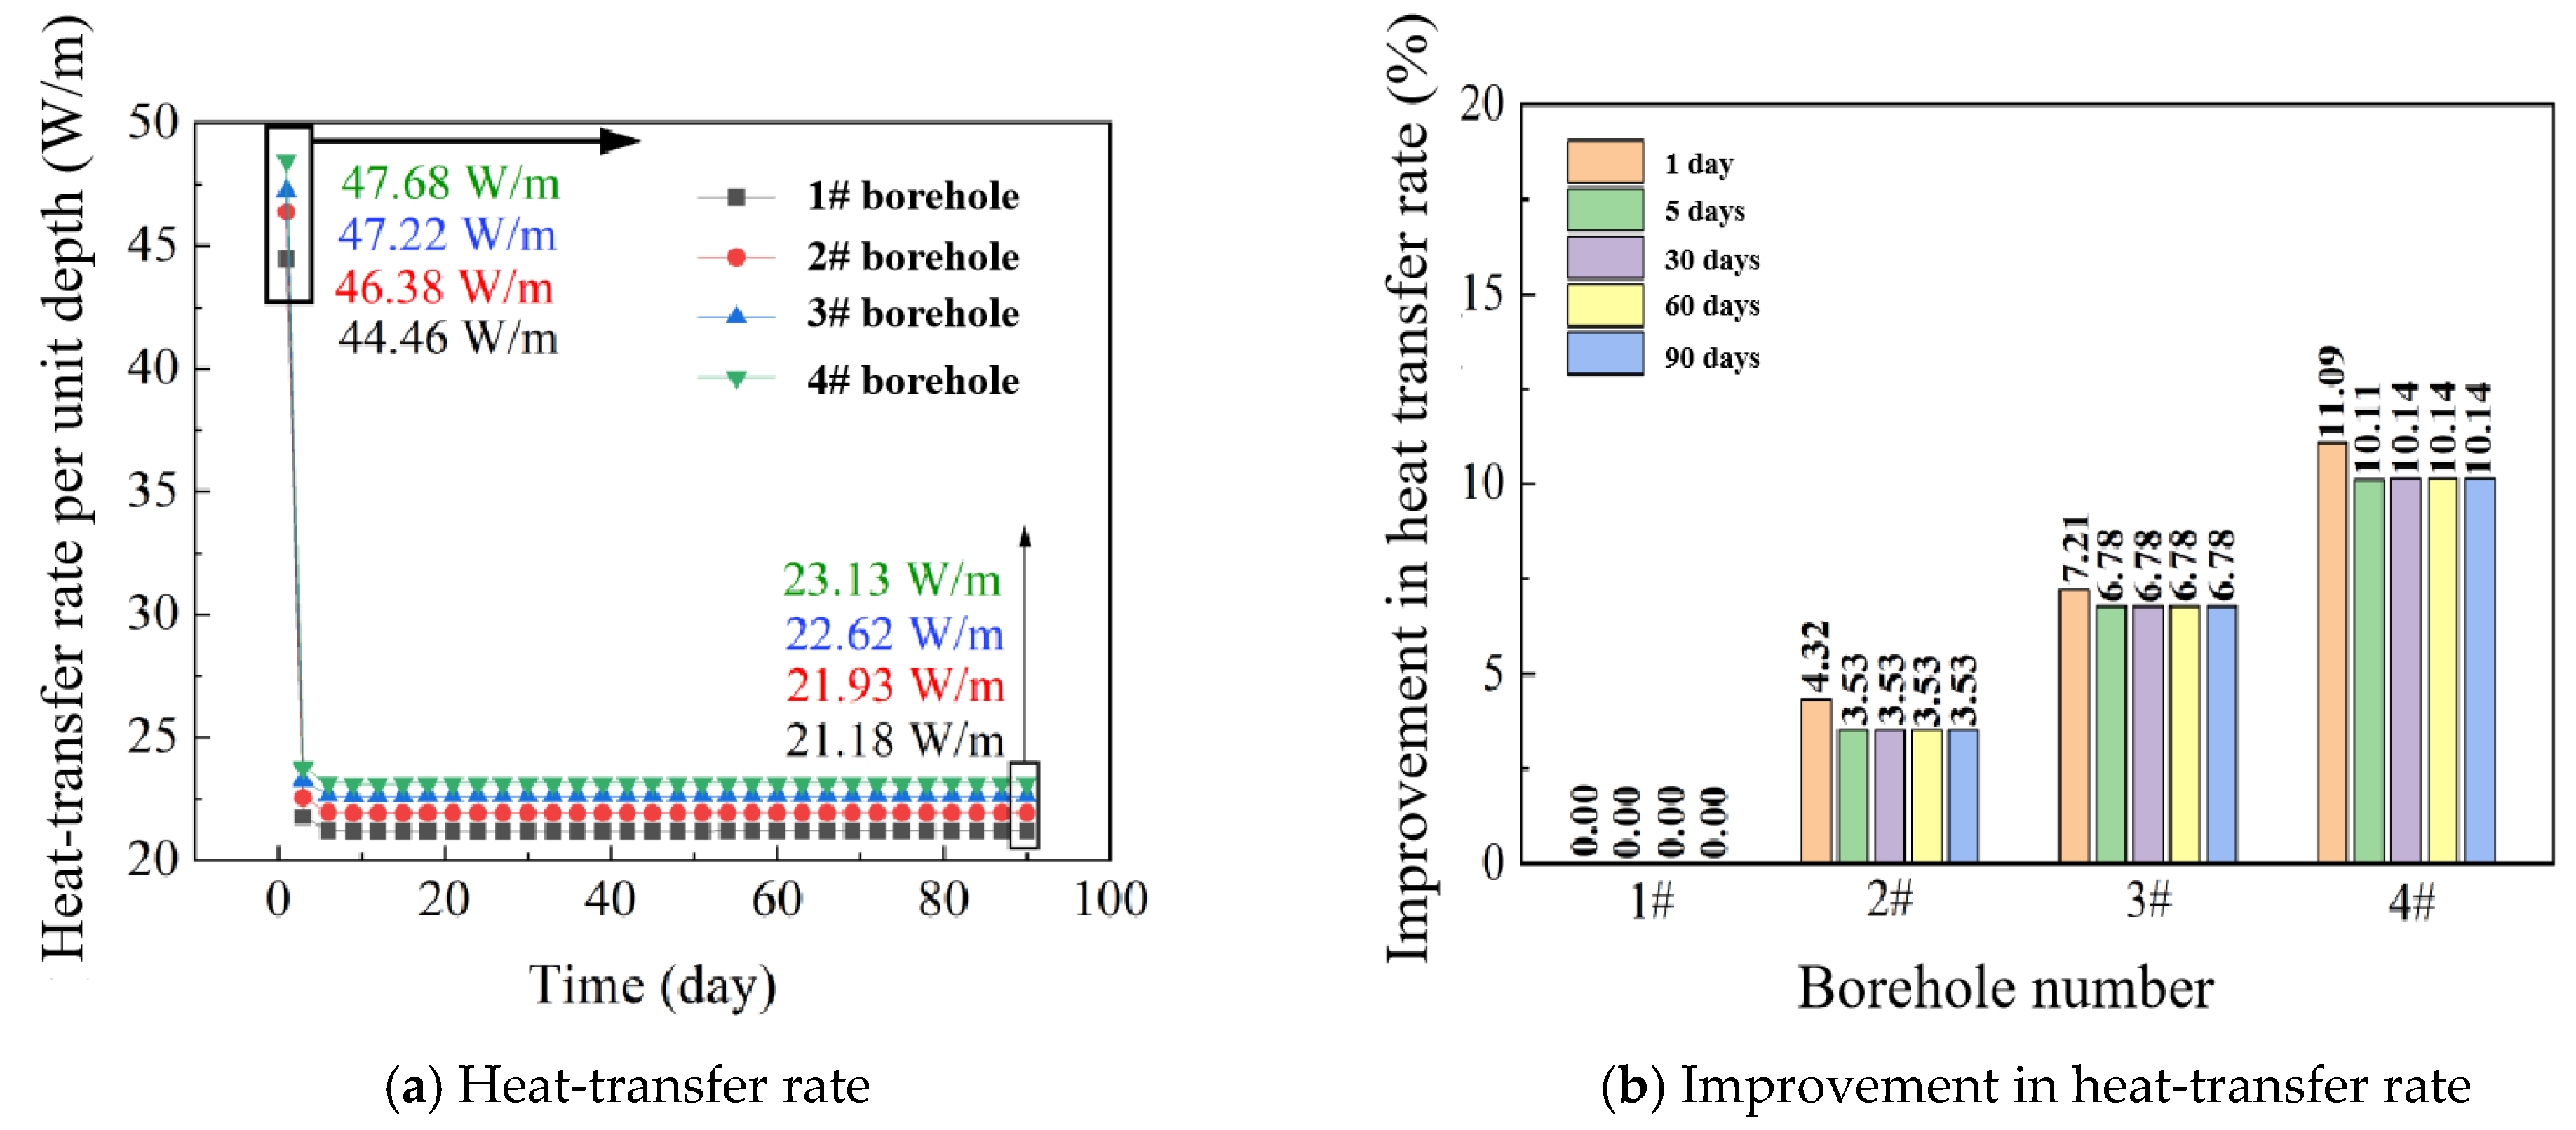
  • Different seepage directions have significant influences on the long-term heat-transfer performance. Horizontal groundwater seepage could take away the heat accumulation generated in the heat-transfer process over time, maintaining a high heat-transfer efficiency during the long-term operation period. The heat-transfer rate in 4# borehole was 23.13 W/m after 90 days of operation, which was still higher than that of 21.18 W/m in the 1# borehole. Vertical groundwater seepage could reduce the overall heat-transfer rates.
Future work recommendations are proposed:
4.
The energy-saving potential of ground source heat pumps should be analyzed by reusing high-thermal-conductivity waste materials as backfill materials.
5.
Further assessment of the environmental impact is needed.
6.
Evaluation of the economic benefits is necessary.

Author Contributions

Conceptualization, G.Z. and R.W.; methodology, X.L. and P.C.; software, X.L.; validation, G.Z.; formal analysis, X.L. and R.W.; investigation, P.C. and X.L.; resources, R.W.; data curation, X.L. and H.X.; writing—original draft preparation, R.W., X.L. and A.C.; writing—review and editing, G.Z. and X.L.; supervision, G.Z. and X.L.; project administration, R.W. All authors have read and agreed to the published version of the manuscript.

Funding

This research received no external funding.

Data Availability Statement

The data presented in this study are available on request from the corresponding author. The data are not publicly available due to privacy issues.

Conflicts of Interest

Authors Ruichun Wu, Panpan Chen, Haiqiang Xu and Ankang Chen were employed by the company Hongyuan Electric Power Design Institute Co., Ltd. The remaining authors declare that the research was conducted in the absence of any commercial or financial relationships that could be construed as a potential conflict of interest.

Nomenclature

A p Cross-sectional area of pipe, m2.
C p , f Specific heat capacity of fluid within the pipe, J/(kg K).
C p , w Specific heat capacity of groundwater, J/(kg K).
C p , s Specific heat capacity of solid material, J/(kg K).
C p , s o i l Specific heat capacity of soil, J/(kg K).
d h Mean hydraulic diameter, m.
d p , o u t Outer diameter of pipe, m.
d p , i n Inner diameter of pipe, m.
f D Darcy friction factor of fluid.
g Acceleration of gravity, m/s2.
h Heat-transfer coefficient, W/(m2 K).
h c Convective heat-transfer coefficient, W/(m2 K).
h i n t Internal film heat-transfer coefficient of pipe, W/(m2 K).
H Depth of borehole, m.
M E Average error of sample.
p Fluid pressure of groundwater, Pa.
p f Pressure of fluid, Pa.
P r Prandtl number.
q G H E Heat-transfer rate of GHE, W.
q G H E , p e r Heat-transfer rate of GHE per meter, W/m.
q w a l l Source term due to heat transfer with the surroundings through the pipe wall, W/m.
q u p p e r Heat-transfer flux at the upper boundary, W/m2.
m f Mass flow rate of fluid within the pipe, kg/s.
nSample size.
N u Nusselt number.
Q m General heat source term of mass (mass source), W/m3.
Q s General heat source term of solid material, W/m3.
Q s o i l General heat source term of soil, W/m3.
R e Reynolds number.
S Root mean square error.
T f Temperature of fluid within the pipe, °C.
T f , i n Inlet temperature of fluid, °C.
T f , o u t Outlet temperature of fluid, °C.
T s Temperature of solid material, °C.
T a i r Air temperature around the ground surface, °C.
T e x t Exterior temperature outside the pipe, °C.
T i n i t i a l Initial ground temperature, °C.
T s o i l Soil temperature, °C.
t Time, s.
u f Velocity of fluid within the pipe, m/s.
v w Groundwater velocity, m/s.
Z p Pipe wall perimeter, m.
Greek Letters
η Soil porosity.
χ Volume fraction of different phase.
λ f Thermal conductivity of fluid within the pipe, W/(m K).
λ p Thermal conductivity of pipe, W/(m K).
λ s Thermal conductivity of solid material, W/(m K).
λ s o i l Thermal conductivity of soil, W/(m K).
ρ f Density of fluid within the pipe, kg/m3.
ρ s Density of solid material, kg/m3.
ρ w Density of groundwater, kg/m3.
ρ s o i l Density of soil, kg/m3.
κ Penetration of soil.
μ Fluid dynamic viscosity, Pa s.
μ w Dynamic viscosity of groundwater, Pa s.

References

  1. Ouerghi, F.H.; Omri, M.; Nisar, K.S.; El-Aziz, R.M.A.; Taloba, A.I. Investigating the potential of geothermal energy as a sustainable replacement for fossil fuels in commercial buildings. Alex. Eng. J. 2024, 97, 215–229. [Google Scholar] [CrossRef]
  2. Verma, V.; Meena, C.S.; Thangavel, S.; Kumar, A.; Choudhary, T.; Dwivedi, G. Ground and solar assisted heat pump systems for space heating and cooling applications in the northern region of India-A study on energy and CO2 saving potential. Sustain. Energy Technol. Assess. 2023, 59, 103405. [Google Scholar] [CrossRef]
  3. Ashrafi, N.; Ahmadi, R.; Zahedi, A. Technical, economical, and environmental scenario based modeling of the building equipped with ground source heat pump (GSHP) and solar system. Energy Build. 2023, 289, 113048. [Google Scholar] [CrossRef]
  4. Rashid, L.F.; Dhaidan, N.S.; Hussein, A.K.; Al-Mousawi, F.N.; Younis, O. Ground heat exchanger in different configuration: Review of recent advances and development. Geoenergy Sci. Eng. 2023, 227, 211872. [Google Scholar] [CrossRef]
  5. Saeidi, R.; Karimi, A.; Noorollahi, Y. The novel designs for increasing heat transfer in ground heat exchangers to improve geothermal heat pump efficiency. Geothermics 2024, 116, 102844. [Google Scholar] [CrossRef]
  6. Maghrabie, H.M.; Abdeltwab, M.M.; Tawfik, M.H.M. Ground-source heat pumps (GSHPs): Materials, models, applications, and sustainability. Energy Build. 2023, 299, 113560. [Google Scholar] [CrossRef]
  7. Dai, Y.; Lu, Y.; Sun, Y.; Shi, N. Analysis of heat transfer performance and study of optimum design on geothermal exchanger of ground-source heat pump. Appl. Energy Technol. 2011, 1, 1–5. [Google Scholar]
  8. Zhang, H.; Han, Z.; Lim, X.; Ji, M.; Zhang, X.; Li, G.; Yang, L. Study on the influence of borehole spacing considering groundwater flow and freezing factors on the annual performance of the ground source heat pump. Appl. Therm. Eng. 2021, 182, 116042. [Google Scholar] [CrossRef]
  9. Law, Y.L.E.; Dworkin, S.B. Characterization of the effects of borehole configuration and interference with long term ground temperature modelling of ground source heat pumps. Appl. Energy 2016, 179, 1032–1047. [Google Scholar] [CrossRef]
  10. Bu, X.; Jiang, K.; Li, H.; Wang, L. Performance analysis of deep borehole heat exchanger through filling leakage formation using high thermal conductivity material. Acta Geol. Sin. 2020, 94, 2139–2146. [Google Scholar]
  11. Liao, L. Numerical study on heat transfer performance of the backfill material of vertical U-tube. Protect. Eng. 2018, 40, 16–21. (In Chinese) [Google Scholar]
  12. Li, Q.; Yin, Y.; Kong, L.; Qiao, L. Enhancing heat transfer in the heat exchange medium of energy piles. J. Build. Eng. 2021, 40, 102375. [Google Scholar] [CrossRef]
  13. Castán-Fernández, C.; Marcos-Robredoa, G.; Castro-García, M.P.; Rey-Ronco, M.A.; Alonso-Sanchez, T. Development of a dry mortar with nanosilica and different types of industrial waste for the application in borehole heat exchangers. Constr. Build. Mater. 2022, 359, 129511. [Google Scholar] [CrossRef]
  14. Lee, C.; Park, M.; Min, S.; Kang, S.-H.; Sohn, B.; Choia, H. Comparison of effective thermal conductivity in closed-loop vertical ground heat exchangers. Appl. Therm. Eng. 2011, 31, 3669–3676. [Google Scholar] [CrossRef]
  15. Hou, H.; Zhang, S.; Guo, D.; Su, L.; Xu, H. Synergetic benefits of pollution and carbon reduction from fly ash resource utilization-Based on the life cycle perspective. Sci. Total Environ. 2023, 903, 166197. [Google Scholar] [CrossRef] [PubMed]
  16. Liang, B.; Chen, M.; Orooji, Y. Effective parameters on the performance of ground heat exchangers: A review of latest advances. Geothermics 2022, 98, 102283. [Google Scholar] [CrossRef]
  17. Kim, D.; Kim, G.; Kim, D.; Baek, H. Experimental and numerical investigation of thermal properties of cement-based grouts used for vertical ground heat exchanger. Renew. Energy 2017, 112, 260–267. [Google Scholar] [CrossRef]
  18. Erol, S.; François, B. Efficiency of various grouting materials for borehole heat exchangers. Appl. Therm. Eng. 2014, 70, 788–799. [Google Scholar] [CrossRef]
  19. Blázquez, C.S.; Martín, A.F.; Nieto, I.M.; García, P.C.; Pérez, L.S.S.; Aguilera, D.G. Analysis and study of different grouting materials in vertical geothermal closed-loop systems. Renew. Energy 2017, 114, 1189–1200. [Google Scholar] [CrossRef]
  20. Treviño, R.B.; Muñoz, P.P.; Pérez, M.Á.C.; Fresno, D.C. Freeze thaw durability of cement-based geothermal grouting materials. Constr. Build. Mater. 2014, 55, 390–397. [Google Scholar] [CrossRef]
  21. Alrtimi, A.A.; Rouainia, M.; Manning, D.A.C. Thermal enhancement of PFA-based grout for geothermal heat exchangers. Appl. Therm. Eng. 2013, 54, 559–564. [Google Scholar] [CrossRef]
  22. Delaleux, F.; Py, X.; Olives, R.; Dominguez, A. Enhancement of geothermal borehole heat exchangers performances by improvement of bentonite grouts conductivity. Appl. Therm. Eng. 2012, 33, 92–99. [Google Scholar] [CrossRef]
  23. Muoñz, P.P.; Vega, I.I.; Barraza, D.Z.; Fresno, D.C. Experimental analysis of enhanced cement-sand-based geothermal grouting materials. Constr. Build. Mater. 2018, 185, 481–488. [Google Scholar]
  24. Lee, C.; Park, M.; Nguyen, T.-B.; Sohn, B.; Choi, J.M.; Choi, H. Performance evaluation of closed-loop vertical ground heat exchangers by conducting in-situ thermal response tests. Renew. Energy 2012, 42, 77–83. [Google Scholar] [CrossRef]
  25. Do, T.M.; Kim, H.-K.; Kim, M.-J.; Kim, Y.-S. Utilization of controlled low strength material (CLSM) as a novel grout for geothermal systems: Laboratory and field experiments. J. Build. Eng. 2020, 29, 101110. [Google Scholar] [CrossRef]
  26. Cao, Z.; Zhang, G.; Liu, Y. Thermal performance analysis and assessment of PCM backfilled precast high-strength concrete energy pile under heating and cooling modes of building. Appl. Therm. Eng. 2022, 216, 119144. [Google Scholar] [CrossRef]
  27. Zhou, K.; Mao, J.; Li, Y.; Hua, Z. Comparative study on thermal performance of horizontal ground source heat pump systems with Dirichlet and Robin boundary conditions on ground surface. Energy Convers. Manag. 2020, 225, 113469. [Google Scholar] [CrossRef]
  28. COMSOL Multiphysics, User’s Guide; COMSOL: Stockholm, Sweden, 2020.
  29. Churchill, S.W. Friction factor equations span all fluid-flow regimes. Chem. Eng. 1977, 84, 91–92. [Google Scholar]
  30. Dinh, B.H.; Go, G.-H.; Kim, Y.-S. Performance of a horizontal heat exchanger for ground heat pump system: Effects of groundwater level drop with soil-water thermal characteristics. Appl. Therm. Eng. 2021, 195, 117203. [Google Scholar] [CrossRef]
  31. Go, G.H.; Lee, S.R.; Yoon, S.; Kang, H.B. Design of spiral coil PHC energy pile considering effective borehole thermal resistance and groundwater advection effects. Appl. Energy 2014, 125, 165–178. [Google Scholar] [CrossRef]
  32. Zhang, G.; Guo, Y.; Zhou, Y.; Ye, M.; Chen, R.; Zhang, H.; Yang, J.; Chen, J.; Zhang, M.; Lian, Y.; et al. Experimental study on the thermal performance of tunnel lining GHE under groundwater flow. Appl. Therm. Eng. 2016, 106, 784–795. [Google Scholar] [CrossRef]
  33. Tiwari, A.K.; Basu, P. Interpretation of TRT data in the presence of natural convection and groundwater flow in saturated ground. Comput. Geotech. 2021, 140, 104426. [Google Scholar] [CrossRef]
  34. Sani, A.K.; Singh, R.M. Response of unsaturated soils to heating of geothermal energy pile. Renew. Energy 2020, 147, 2618–2632. [Google Scholar] [CrossRef]
  35. Zhang, G.; Cao, Z.; Liu, Y.; Chen, J. Field Test and Numerical Simulation on the Long-Term Thermal Response of PHC Energy Pile in Layered Foundation. Sensors 2021, 21, 3873. [Google Scholar] [CrossRef]
  36. Guo, Y.; Zhang, G.; Liu, S. Investigation on the thermal response of full-scale PHC energy pile and ground temperature in multi-layer strata. Appl. Therm. Eng. 2018, 143, 836–848. [Google Scholar] [CrossRef]
  37. Ma, Q.J.; Wang, P.J. Underground solar energy storage via energy piles. Appl. Energy 2020, 261, 114361. [Google Scholar] [CrossRef]
  38. Choi, W.; Ooka, R. Effect of natural convection on thermal response test conducted in saturated porous formation: Comparison of gravel-backfilled and cement-grouted borehole heat exchangers. Renew. Energy 2016, 96, 891–903. [Google Scholar] [CrossRef]
  39. Pandey, U.; Basu, D. Effect of groundwater flow on thermal performance of SBTES systems. J. Energy Storage 2023, 74, 109375. [Google Scholar] [CrossRef]
  40. Angelotti, A.; Alberti, L.; Licata, I.; La Antelmi, M. Energy performance and thermal impact of a Borehole Heat Exchanger in a sandy aquifer: Influence of the groundwater velocity. Energy Conv. Manag. 2014, 77, 700–708. [Google Scholar] [CrossRef]
  41. Guo, L.; Zhang, J.; Li, Y.; McLennan, J.; Zhang, Y.; Jiang, H. Experimental and numerical investigation of the influence of groundwater flow on the borehole heat exchanger performance: A case study from Tangshan, China. Energy Build. 2021, 248, 111199. [Google Scholar] [CrossRef]
  42. Michalski, A.; Klitzsch, N. Temperature sensor module for groundwater flow detection around borehole heat exchangers, Geotherm. Energy 2018, 6, 15. [Google Scholar]
Figure 1. Schematic diagram of a vertical GHE system.
Buildings 14 01699 g001
Figure 2. Pictures of (a,b) testing sample used for backfilling, (c) soil sample, and (d) thermal property testing.
Buildings 14 01699 g002
Figure 3. Pictures of (a) borehole drilling and buried pipe, (b) backfilling, and (c) thermal response testing.
Buildings 14 01699 g003
Figure 4. Geometric size, mesh density, and boundary of the calculation model in COMSOL.
Buildings 14 01699 g004
Figure 5. Field testing and numerical results of outlet temperature of 4 different boreholes under the constant inlet temperature of 35 °C.
Buildings 14 01699 g005
Figure 6. Flowchart of numerical model computation.
Buildings 14 01699 g006
Figure 7. Temperature field around borehole of vertical GHEs.
Buildings 14 01699 g007
Figure 8. Influence of 4 different backfill materials on soil-temperature variations around vertical GHEs.
Buildings 14 01699 g008
Figure 9. Long-term (90 days) heat-transfer performance of 4 boreholes.
Buildings 14 01699 g009
Figure 10. Schematic diagram of the influence of groundwater seepage on vertical GHEs.
Buildings 14 01699 g010
Figure 11. Temperature field of 4# borehole under the effect of groundwater seepage.
Buildings 14 01699 g011aBuildings 14 01699 g011b
Figure 12. Influence of 4 different backfill materials on soil temperature variations around vertical GHEs under the influence of horizontal groundwater seepage.
Buildings 14 01699 g012
Figure 13. Long-term (90 days) heat-transfer performance of 4 boreholes (groundwater seepage of a horizontal direction).
Buildings 14 01699 g013
Figure 14. Long-term (90 days) heat-transfer performance of 4 boreholes (groundwater seepage of vertical direction).
Buildings 14 01699 g014
Figure 15. Long-term (90 days) heat-transfer performance of 4 boreholes (groundwater seepage of 45 ° angle to the horizontal direction).
Buildings 14 01699 g015
Table 2. Mixing ratio of backfill material for 4 boreholes (mass ratio in percentage, %).
Borehole NumberNatural SandCementFly AshGraphite PowderWater
1#100////
2#48530017
3#48525517
4#485201017
Table 3. Testing results of backfill materials.
Backfill Material in Different BoreholeThermal Conductivity
(W/(m K))
Specific Heat Capacity
(J/(kg K))
Density
(kg/m3)
1#1.6209061420
2#1.9338821955
3#2.3179661870
4#2.3919821855
Table 4. Testing results of soil properties used in the numerical model.
Soil LayerDepth Range
(m)
Thermal Conductivity
(W/(m K))
Specific Heat Capacity
(J/(kg K))
Density
(kg/cm3)
Backfill soil0–1.91.668821780
Silty clay1.9–5.01.739921830
Silty soil5.0–11.31.619121750
Silty clay11.3–24.41.759861870
Silty soil24.4–30.01.719231850
Table 5. Ground temperature (°C) for 4 boreholes.
Borehole Number/
Depth (m)
1#2#3#4#
220.119.519.820.2
418.818.118.618.0
617.517.918.117.8
817.718.118.3 17.9
1017.918.118.3 17.8
1218.118.218.117.8
1418.318.218.117.9
1618.218.218.317.8
1818.218.318.317.9
2018.218.318.318.0
2518.118.318.418.1
3018.318.518.519.2
Average ground temperature18.2518.3518.4418.38
Table 6. Error analysis of testing and modeling results.
Error Calculation Method1#2#3#4#
Average error (°C), ME0.320.210.410.45
Root mean square error (°C), S0.470.310.420.43
Disclaimer/Publisher’s Note: The statements, opinions and data contained in all publications are solely those of the individual author(s) and contributor(s) and not of MDPI and/or the editor(s). MDPI and/or the editor(s) disclaim responsibility for any injury to people or property resulting from any ideas, methods, instructions or products referred to in the content.

