Abstract
In this paper, we explore the integration of building information modeling (BIM) technology to assess carbon emissions, emphasizing the unique contributions to smart and sustainable approaches in prefabricated buildings and focusing on the application of digital construction strategies facilitated by BIM to evaluate carbon emissions in green prefabricated buildings, with a detailed case study on C-House at Southeast University, Nanjing, China. The research methodology involved creating a BIM model of C-House in Rhino and collecting data from the operationalization phase. This research work delves into analyzing the structural components, on-site assembling process, and evaluation of carbon emissions by using a BIM-based assessment, as well as the energy load and consumption of prefabricated components, including sustainable PV panels, to enhance building efficiency and sustainability. The findings uncover the life cycle of C-House, which spans seven stages, compared with the five stages of conventional builds. Currently in its third cycle, C-House exhibits significant reductions of 70.57% in carbon emissions during the second cycle and 43.53% in the first one. This highlights the pattern showing that the prolonged reuse of prefabricated buildings leads to decreasing emissions over time. Such results underscore the potential carbon emission reductions and environmental advantages of reusing green prefabricated buildings. Furthermore, this study provides insights into the entire life cycle of the building, from inception to occupation and post-phase performance evaluation. By employing BIM for modeling, simulation, and analysis, we offer practical insights into the application of smart technologies for sustainable construction practices, significantly contributing to the advancement of green and digital construction technologies.
1. Introduction
In the evolution of the construction industry, the advent of green prefabrication, uplifted via digital and smart construction strategies, marks a significant move towards sustainability. Green prefabrication emerges as a leader in construction industry innovation [].
Prefabrication has witnessed a paradigm shift while evolving from basic assembly-line production to digitally enabled manufacturing []. Building information modeling (BIM), 3D printing, and the Internet of things (IoT) are the key technologies transforming construction digitally; BIM has helped provide a digital model that streamlines project management, promotes sustainability, optimizes material uses, and minimizes CO2 emissions and waste []. Digital tools may also offer various solutions to handling labor shortages and skill gaps in the construction industry [] by automating and digitizing some aspects of industrial construction processes in which technology mitigates risks of human error and reduces reliance on manual labor []. However, in digitalizing construction and its process in green prefabrication, there are some challenges; for instance, a high initial investment cost, the complexity of technology, safety, and cybersecurity are concerns to look at and resolve []. In terms of sustainability, the green prefabrication and evaluation of digital construction strategies in this context requires focused strategies that reduce the carbon footprints of buildings, enhance efficiency, and promote economic aspects of construction []. Further, the social dimension of sustainability belongs to the categories of health, wellbeing, and inclusivity, which are gaining prominence in the discourse surrounding green prefabrication []. Digital tools enhance design to promote human well-being, air quality, and daylight [].
Compared with computer-aided design (CAD), BIM is more advantageous in building design, reducing design construction errors and, later, construction costs []. So far, BIM has contributed well to the industry, while its tools have been developed in the context of traditional non-prefabricated buildings []. The functional features related to prefabricated buildings are not complete in some existing BIM products, where they still need to be improved in terms of prefabricated buildings. The exploration of digital construction strategies within the jurisdiction of green prefabrication represents a journey towards sustainability, as well as efficient and resilient construction manufacturing.
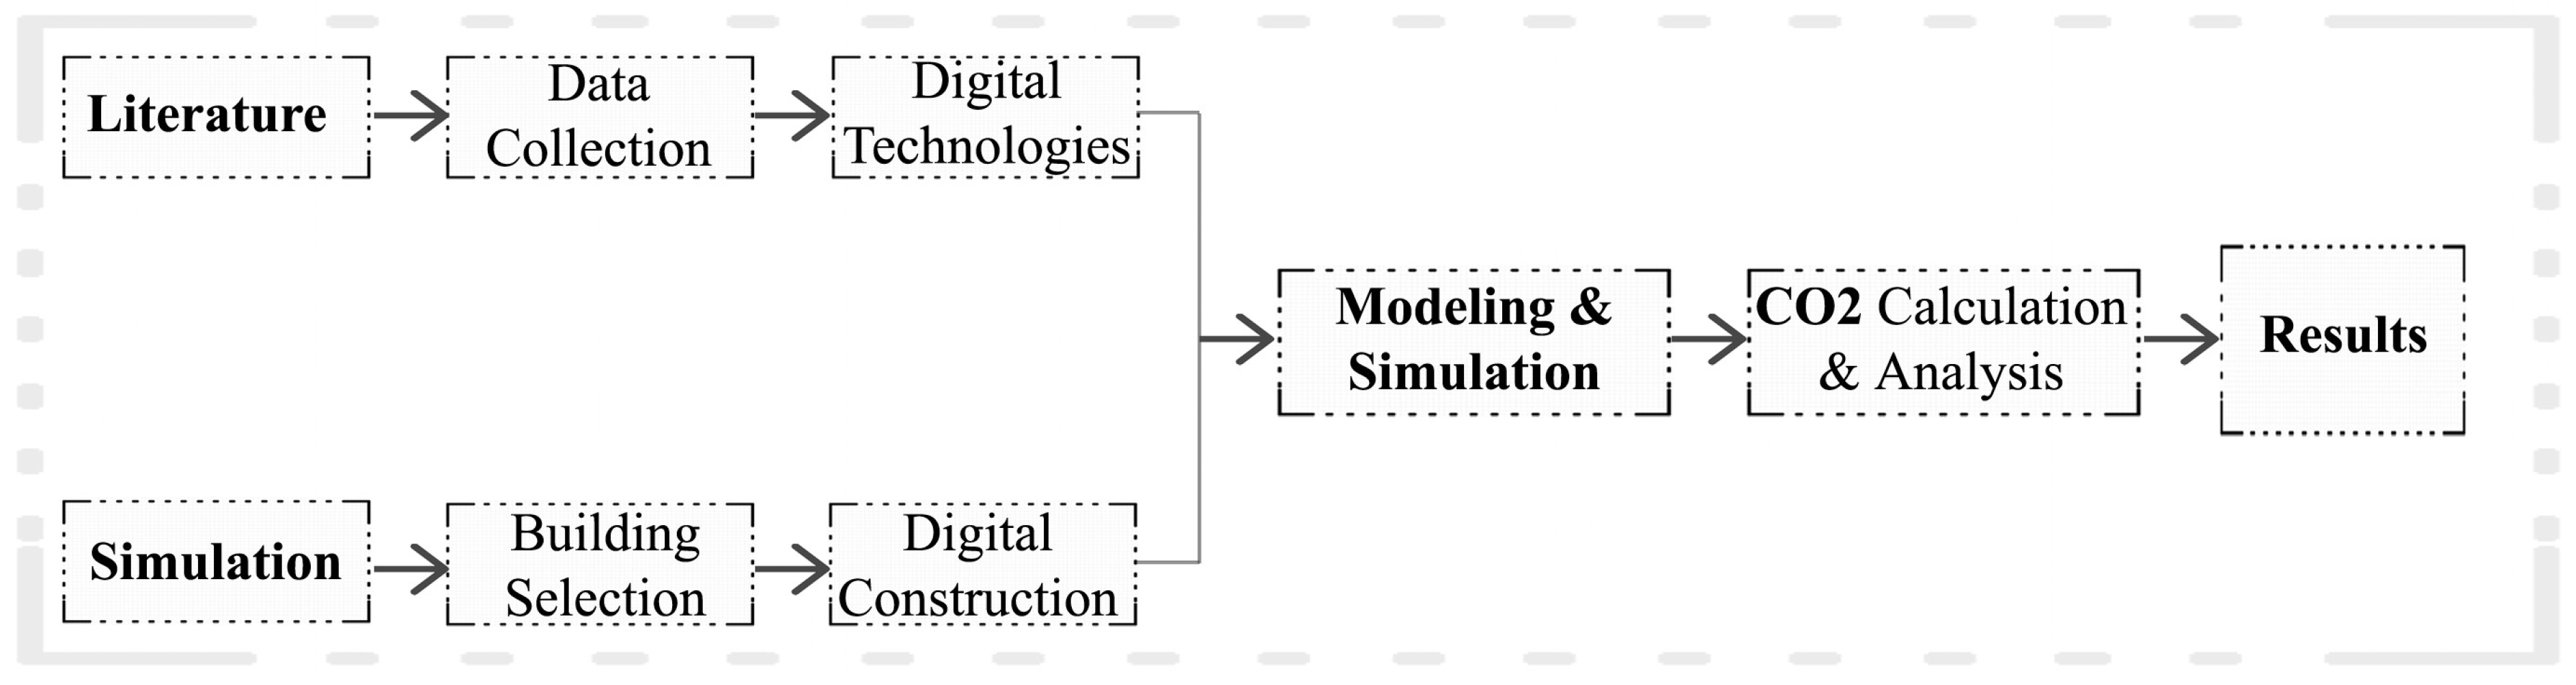
Through an analysis of energy and simulation, this work examines the sustainability of Southeast University’s C-House, a prefabricated building situated in Nanjing, China. This study evaluated carbon emissions by using BIM and investigated methods of optimization, such as passive options like photovoltaic (PV) panels. By integrating intelligent and eco-friendly strategies into digital construction, BIM enabled performance evaluation and resource conservation. To estimate carbon emissions, the life-cycle assessment of C-House was examined, with each stage being assessed by using mathematical formulas and BIM simulation tools. The framework for the project’s future is informed by this study, which gives digital building strategies priority in promoting green prefabrication. The promotion of sustainable practices in the field of green prefabrication requires the adaptation of sustainable policies, improving education in the sector. The evaluation of C-House shows effectiveness in reaching social, economic, and environmental goals. Upcoming frameworks will give priority to scalability, technology integration, and digital strategy refinement. This paper focuses on the synthesis of the latest research in the field of smart and sustainable construction and the prefabrication of green buildings to evaluate their strategies, implementation, and investigation while keeping in mind their potential and challenges in fostering sustainable practices.
This paper critically evaluates these strategies and investigates their core in contemporary research to reveal that digital innovation like BIM is reshaping the domain of prefabrication in alignment with smart and green development [
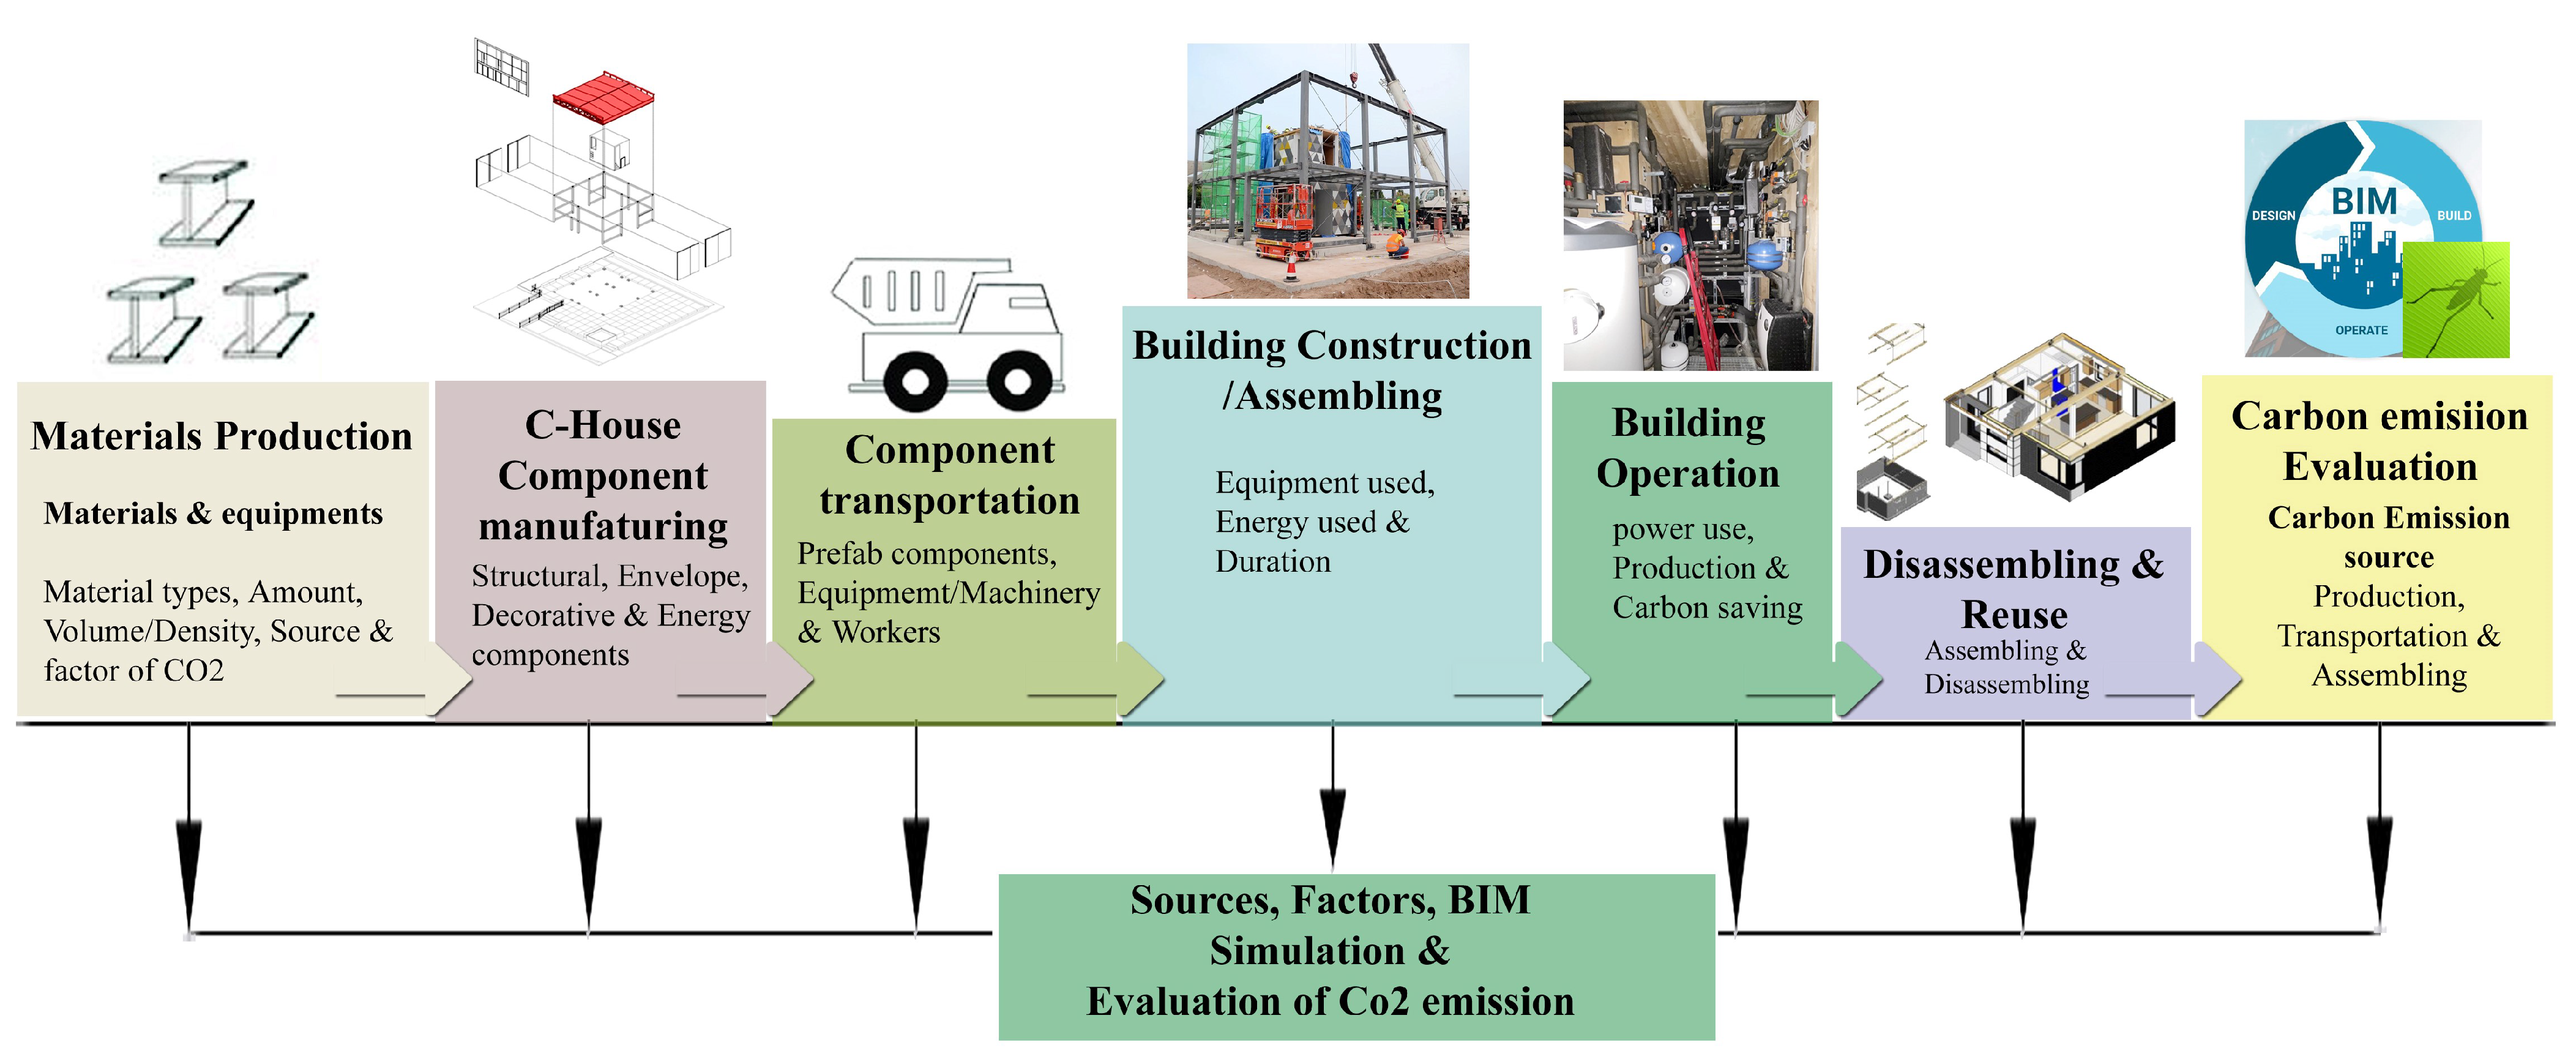
]. This study reveals seven stages in the life cycle of the prefabricated C-House, compared with the conventional five stages of a regular structure. C-House is in its third cycle, having finished the first two cycles. Reusing green prefab structures has a positive impact on the environment and can lower carbon emissions when the third cycle is completed.
2. Literature Overview
2.1. Application Research on BIM in Prefabricated Buildings
BIM can be used to facilitate cooperation and share information in a project team, which can simplify the process and improve the quality, efficiency, and sustainable components of overall construction in prefabricated buildings [,]. In the application of BIM to the management sector for prefab buildings, compared with traditional design methods, collaborative design using BIM has been found to be more optimized []. Further, real-time estimation software on a BIM platform can effectively optimize the design and reduce costs []. Additionally, through the application of BIM, the integration and visualization of precast concrete building components’ information is realized []. Results using prefab building materials show that they are more effective if they are based on BIM, which reduces costs and warehouse occupation’s mean storage [,]. BIM can also help in protecting the environment and developing sustainability, so it can be used to analyze the factors of buildings’ annual energy consumption and energy analysis to provide information on green building design [].
In this research, BIM refers to an engineering data platform that integrates various construction-related data with (3D) digital technologies [], where BIM can be used to simulate a construction project in a multi-dimensional digital model and provide multitudes of project benefits during the entire project life cycle []. Based on BIM, Ref. [] proposed an ontology-based semantic approach for quantity take-off in building prefabrication. Industrial practitioners also use BIM models to generate work packages for prefabrication construction processes []. Somehow, 4D-BIM integrates 3D models with scheduling data like timelines and logistics to visualize construction sequences virtually; it is the combination of 3D models and time, resulting in the simulation of construction projects and activities []. Fragmented work environments often lead to coordination issues in the construction industry [], and BIM offers a solid solution by fostering collaboration and shifting project delivery from segregation to integration, enhancing project success [], clash detection, and early documentation [].
2.2. Digital Technologies in Green Prefabrication
Construction in the contemporary era relies on or is transformed into digital construction, looking at digital technologies such as BIM, 3D printing, and the IoT to help improve energy efficiency in green buildings. According to Ref. [], these tools reshape building design, construction, and management; in this section, we examine their impact on green prefabrication along with digital strategies in the context of building evaluation []. Building information modeling (BIM) revolutionizes construction through digital means, as it represents its physical and functional attributes digitally, fostering integrated design and construction collaboration []. BIM helps to ensure accurate design, documentation, and resource optimization and enhances sustainability. BIM also aids in life-cycle management, evaluating environmental impacts across the building lifespan [], while the IoT and smart sensors enhance sustainability in prefabricated buildings by enabling real-time monitoring and the control of factors like energy use and air quality, which reduces energy consumption and ensures occupant comfort in both the construction and operation phases []. Digital technologies are revolutionizing green prefabrication, enhancing efficiency and adaptability to environmental aspects and social demands. With integrated design solutions like BIM and AI, these are the tools that drive the construction industry and manufacturing processes towards sustainability.
2.3. Assessment of Carbon Emissions in As-Built Prefabricated Buildings Using BIM
The assessment of CO2 emissions in as-built prefabricated structures using digital tools like BIM involves the evaluation of the environmental impact of construction activities and materials throughout the construction phase, where BIM integrates various data sources and simulation tools like Rhino and grasshopper to model and analyze building components, energy consumption, and emissions. The literature describes the utilization of BIM to quantify the carbon emissions associated with different stages of prefabricated building construction, including manufacturing, transportation, and assembling; by leveraging BIM technology, stakeholders can make informed decisions to calculate carbon emissions and promote sustainable construction practices []. The three main stages of prefabrication where one can evaluate carbon emissions are shown in Figure 1.
Figure 1.
Three main indicators and stages of prefabrication and carbon emission sources.
2.4. Carbon Emissions in Construction Phase
Carbon emissions in this phase primarily stem from energy usage, machine operation, and worker activities. Calculating emissions involves multiple steps, detailed as follows:
- a
- Data on machine shifts and workdays per subproject are gathered.
- b
- Carbon emission factors are computed for machinery and labor. For energy consumption, data from the “Standard for Building Carbon Emission Calculation” are preferred.
- c
- This is supplemented with “National unified construction machinery platform and shift cost quota 2017” data for missing values.
- d
- The carbon emission factor for labor stands at 6.61 kgCO2e/work day.
- e
- Multiplying the factors by the respective quantities yields the comprehensive emission coefficient for each subproject.
- f
- Summing these coefficients across all subprojects, along with engineering quantities, yields the total carbon emissions for the construction phase [].
2.5. Life-Cycle Assessment Process of Prefabricated Buildings in General
Life-cycle assessment (LCA) methods evaluate the environmental impacts of product or processes, which are crucial to understanding the construction industry’s environmental footprint in industrial architecture [,]. They also focus on a project’s life cycle to accurately depict research scenarios; for instance, prefabricated buildings were compared to ones cast in situ and found to offer cost savings, time efficiency, and reduced carbon emissions []. Transportation impacts constituting up to 20% of the total embodied impacts are significant. The following, in accordance with ISO 14040 [], outlines five stages in the life cycle of prefabricated buildings, namely, material production, transportation, assembling, use, and reuse:
- a
- In prefab buildings, carbon emissions are produced in six stages, including energy consumption during material production, with the highest-emission stage accounting for 96.2%.
- b
- Carbon emission factors are computed for machinery and labor. For energy consumption, data from the “Standard for Building Carbon Emission Calculation” are preferred.
- c
- Energy consumption of vehicles during the component transport stage.
- d
- Consumption of energy and building materials for machinery during field installation.
- e
- Consumption of building materials during the usage stage.
- f
- Energy consumption machinery during the demolition stage.
- g
- Artificial carbon emissions of the whole process.
During all these stages, carbon emissions are produced by building materials, machinery, and labor []. While examining each of the life-cycle assessment stages for prefabricated buildings, a comparison with the C-House case study will be made, which will help in the evaluation of the C-House life-cycle assessment by illustrating the differences among these stages.
3. Methodology
3.1. Data Collection and Work Flow Diagram
The research methodology in this article includes the work flow guidelines shown in Figure 2; the life-cycle assessment of the prefab building C-House; and its CO2 evaluation through BIM, which includes a significant amount of data collection and a literature review on prefabricated structures, carbon emissions, and digital construction. Publications, citations, and keywords were taken out of the articles and analyzed. Concurrently, this study was organized into three primary sections that demonstrate the methodology: collecting the relevant information; choosing a building—the case study of C-House in Nanjing; and using BIM to assess carbon emissions.
Figure 2.
The work flow and guideline diagram.
3.2. Life-Cycle Assessment (LCE), BIM Modeling, and Carbon Emission Evaluation of C-House
C-House at Southeast University, Nanjing, China, was selected for the case study because of the article’s requirements that it should be manufactured in a factory environment, transported to the site, and assembled there to understand its prefabricated components (Figure A1). In addition to the on-site assembly process (Figure A2), to gain insights into C-House’s life-cycle evaluation process, a diagram, shown in Figure 3, named the process of life-cycle evaluation in terms of assessment, was established to comparatively describe the seven phases involved; the source of carbon emissions of the study building was examined; the factors were simulated through BIM; and the emissions were evaluated through this diagram. We also examined the extensive components involved in each stage, which were analyzed as per the previous studies existing in the literature as per the article demand in terms of digital construction strategies in the evolution of green prefabricated buildings.
Figure 3.
A methodological life-cycle and carbon emission evaluation diagram for C-House.
A comprehensive 3D model of C-House was developed by using BIM software Rhino 7 and grasshopper (version 1.6.0), which evaluated the ventilation, air quality, and energy load. The framework, materials, and prefabricated components of the building were assessed for efficiency as part of the study’s analysis of digital methodologies for green prefabricated buildings. To maximize sustainability in already-existing structures, BIM techniques were applied. To distinguish among life-cycle assessment, carbon emission assessment, and simulation results, a data comparison was performed. To evaluate carbon emissions, data from all seven phases of the life cycle of C-House were gathered.
4. Case Analysis
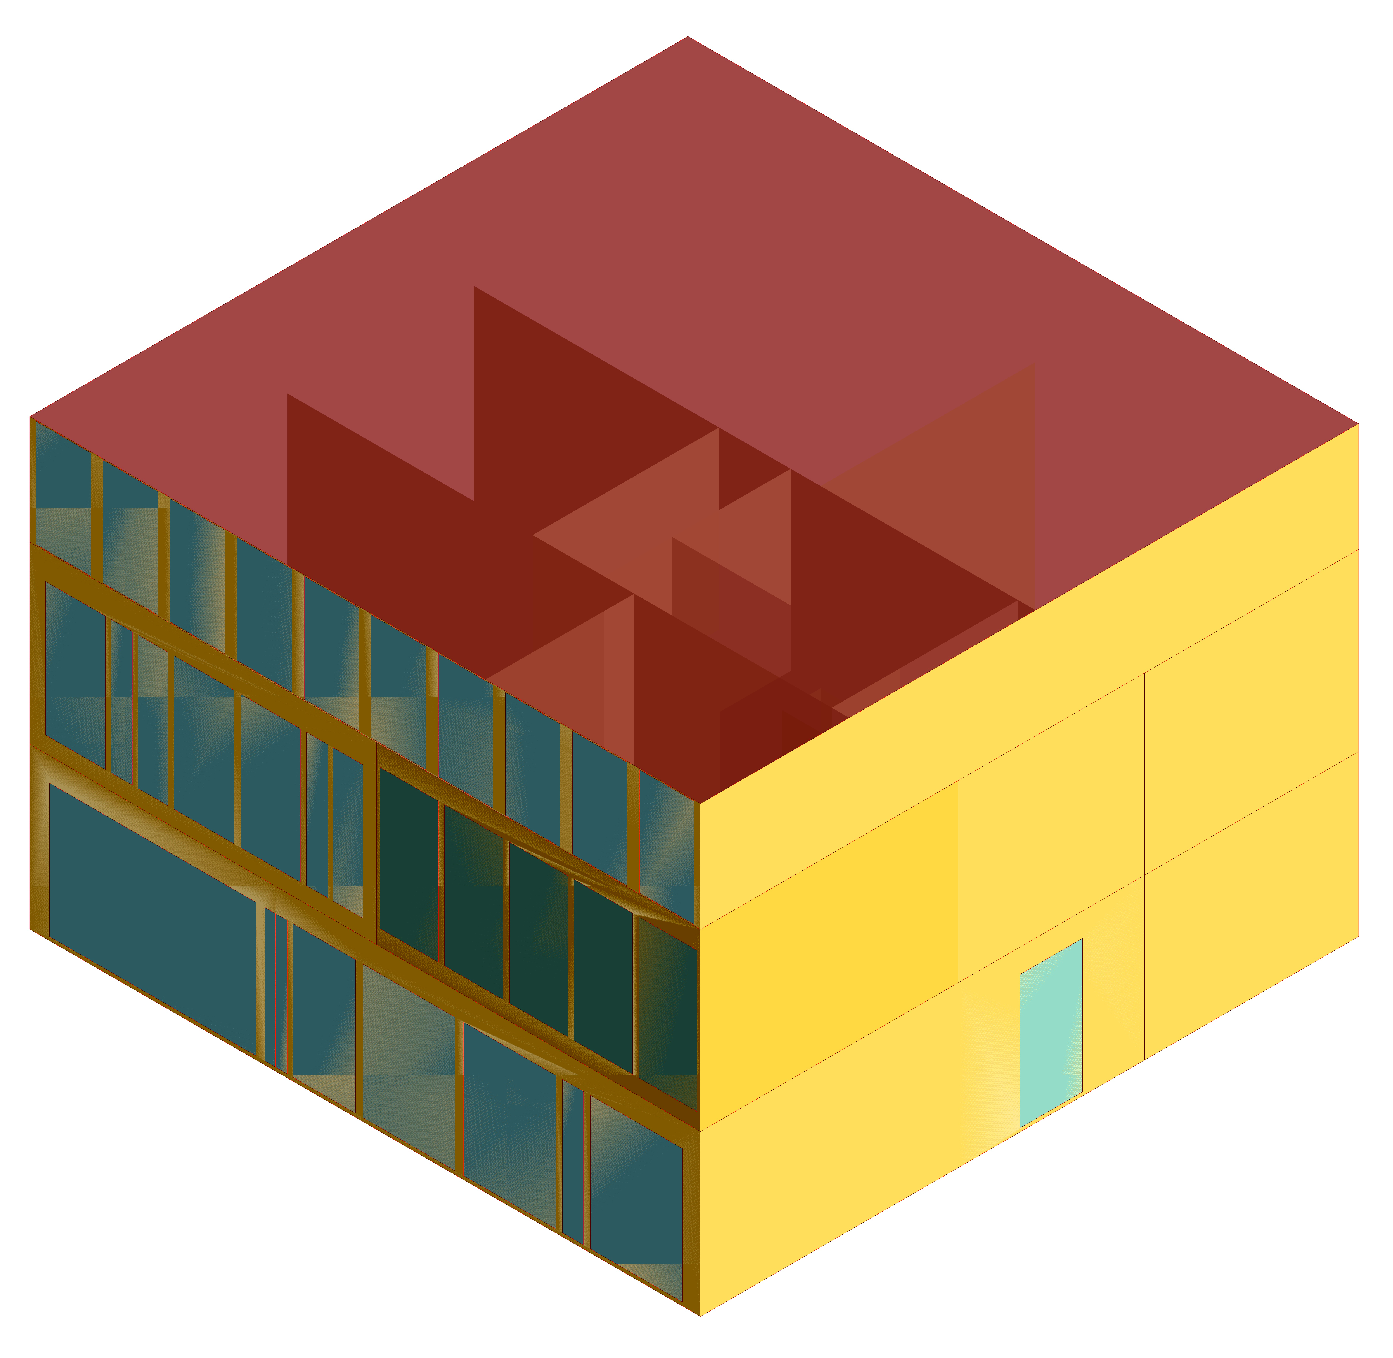
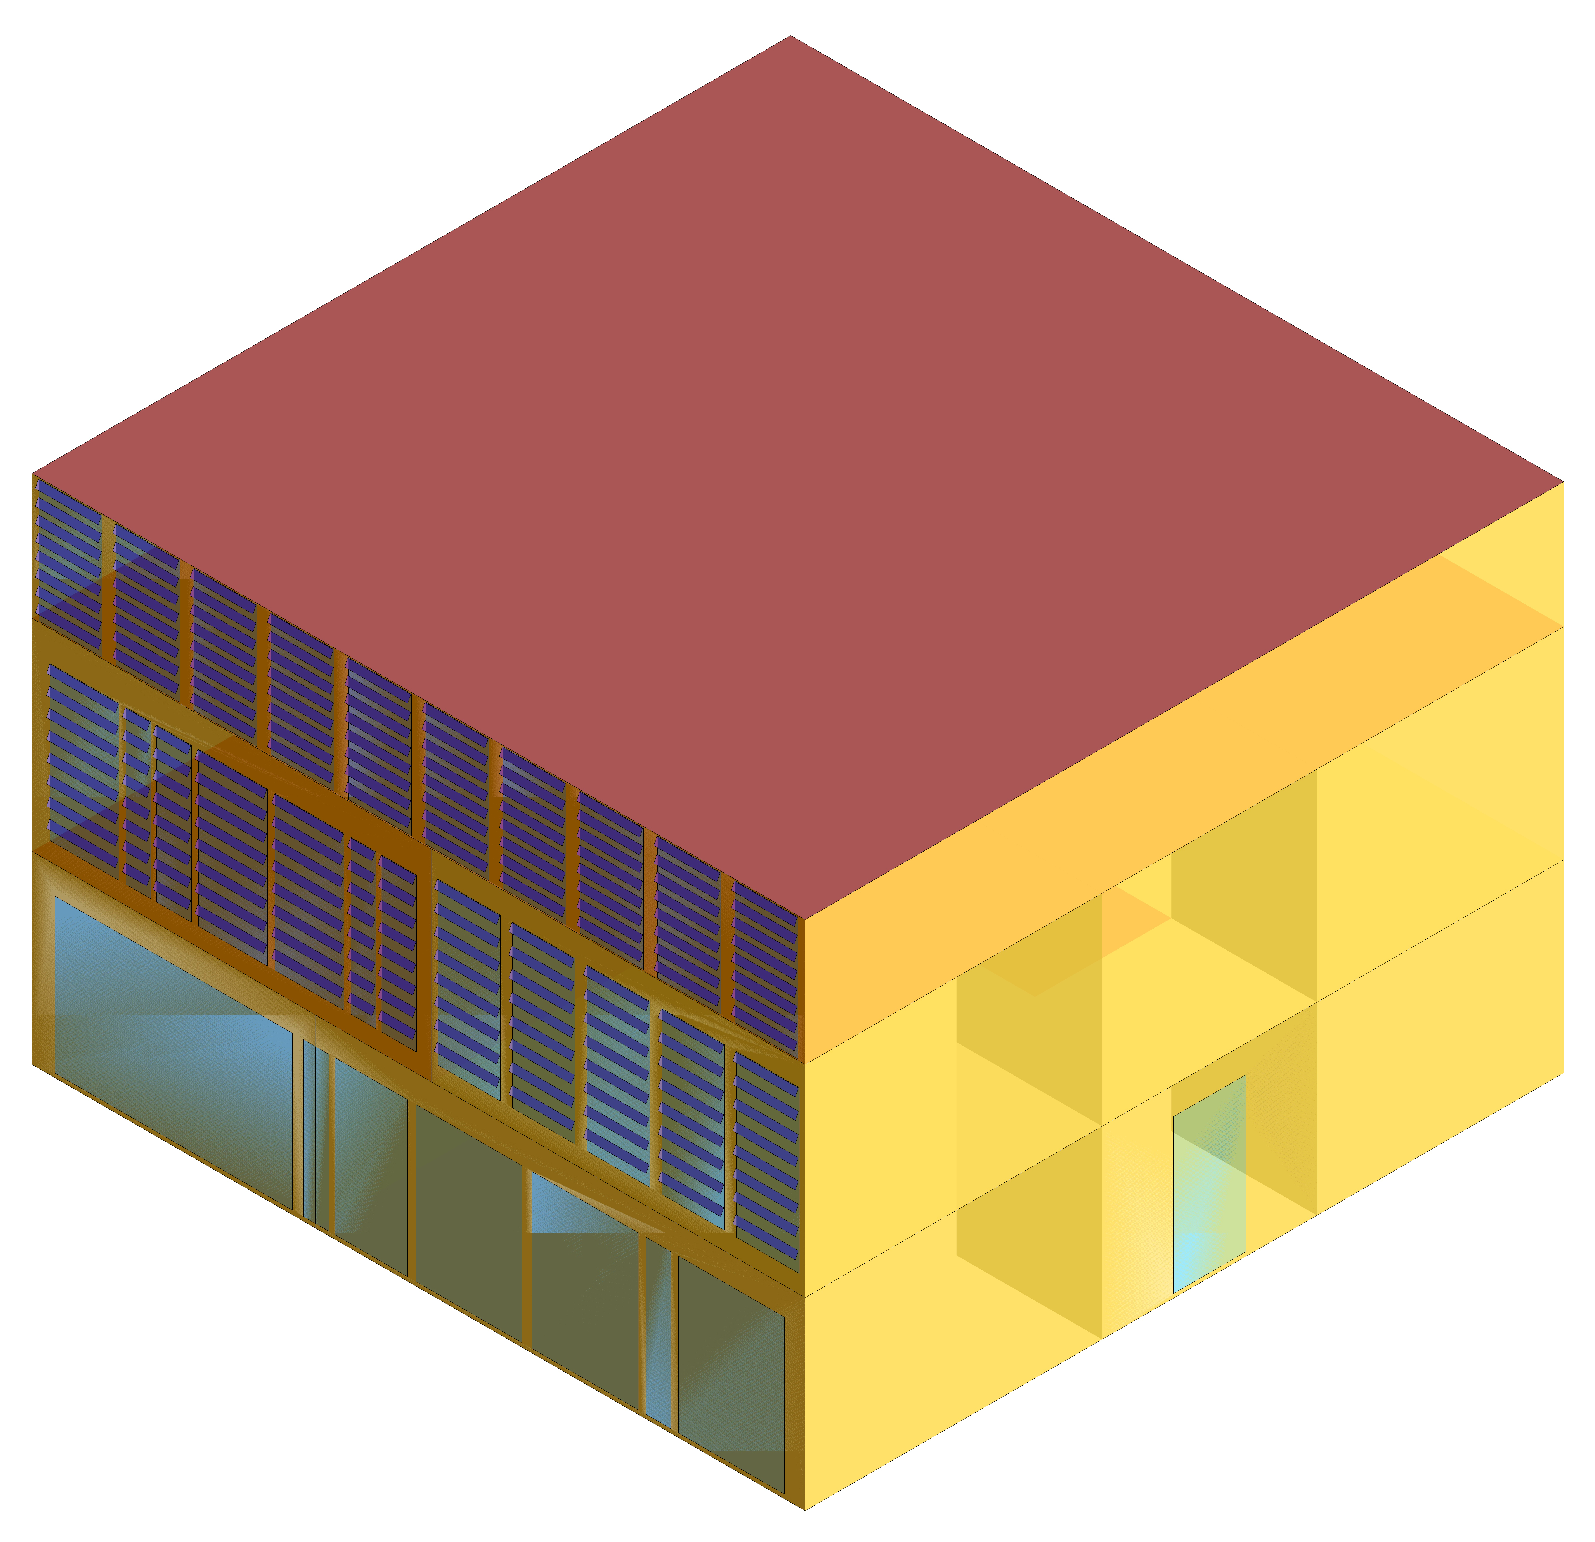
The selection of C-House, representing a green prefabricated building, aligns with the primary focus on digital construction strategies, analyzing carbon emissions and energy efficiency. The criteria for selection also included project scale, its multifunctional behavior, geographical location, climatic conditions, and the utilization of digital techniques for evacuation, like BIM. This case study offers practical insights into green prefabricated building strategies and their application.
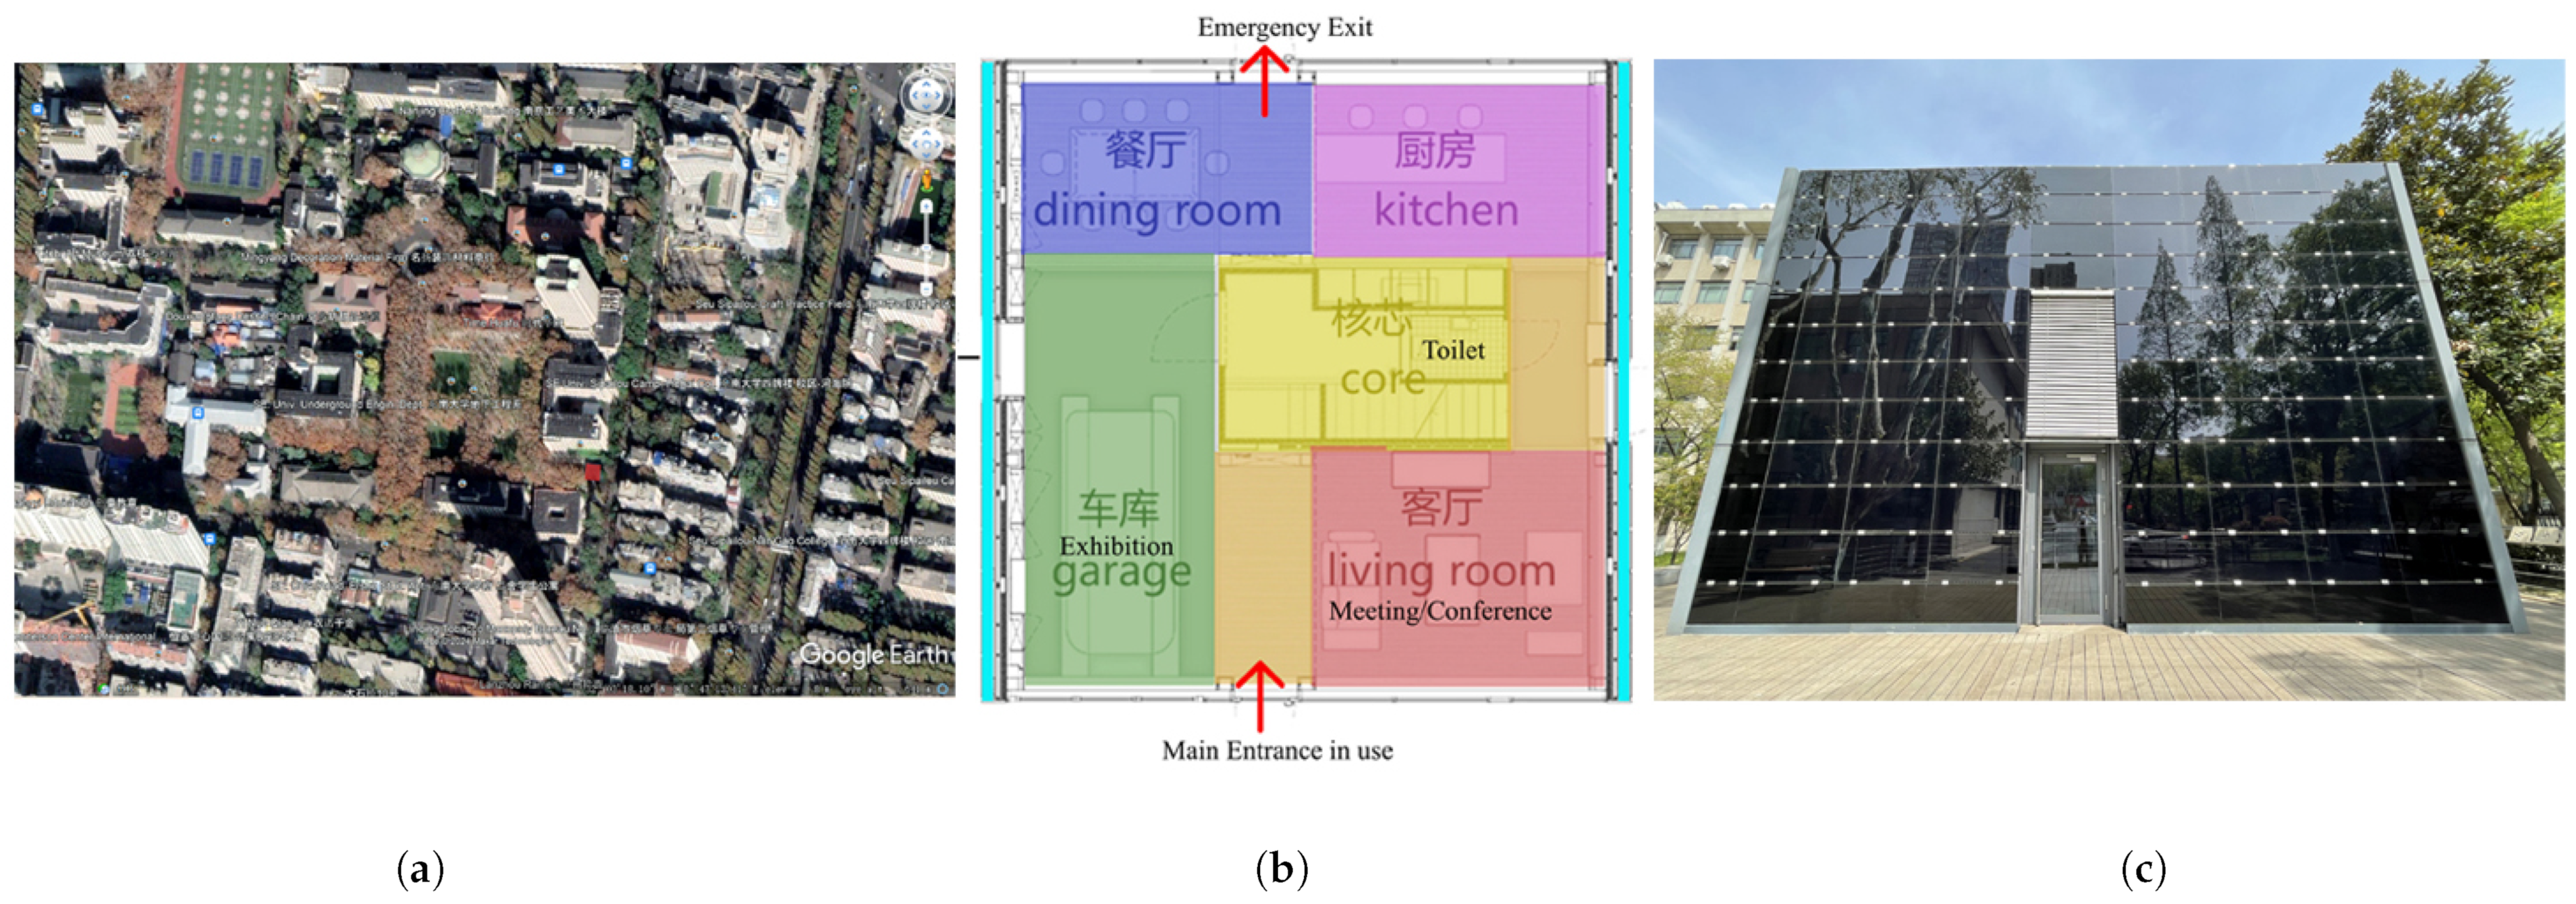
4.1. Geographical Location and Floor Plans of C-House
The building was located in the ancient capital of China at Nanjing No. 2 Sipailou, Xuanwu District, Nanjing City, Jiangsu Province, Southeast University (Sipailou Campus), and the spatial arrangement of its floor plan, as well as the exterior view of the building and PV panels, is shown in Figure 4.
Figure 4.
(a) Geographical location; (b) spatial arrangement and multi-dimensional floor plan; (c) Photovoltaic-covered envelope of the building C-House.
4.2. Prefabricated Building Components of C-House
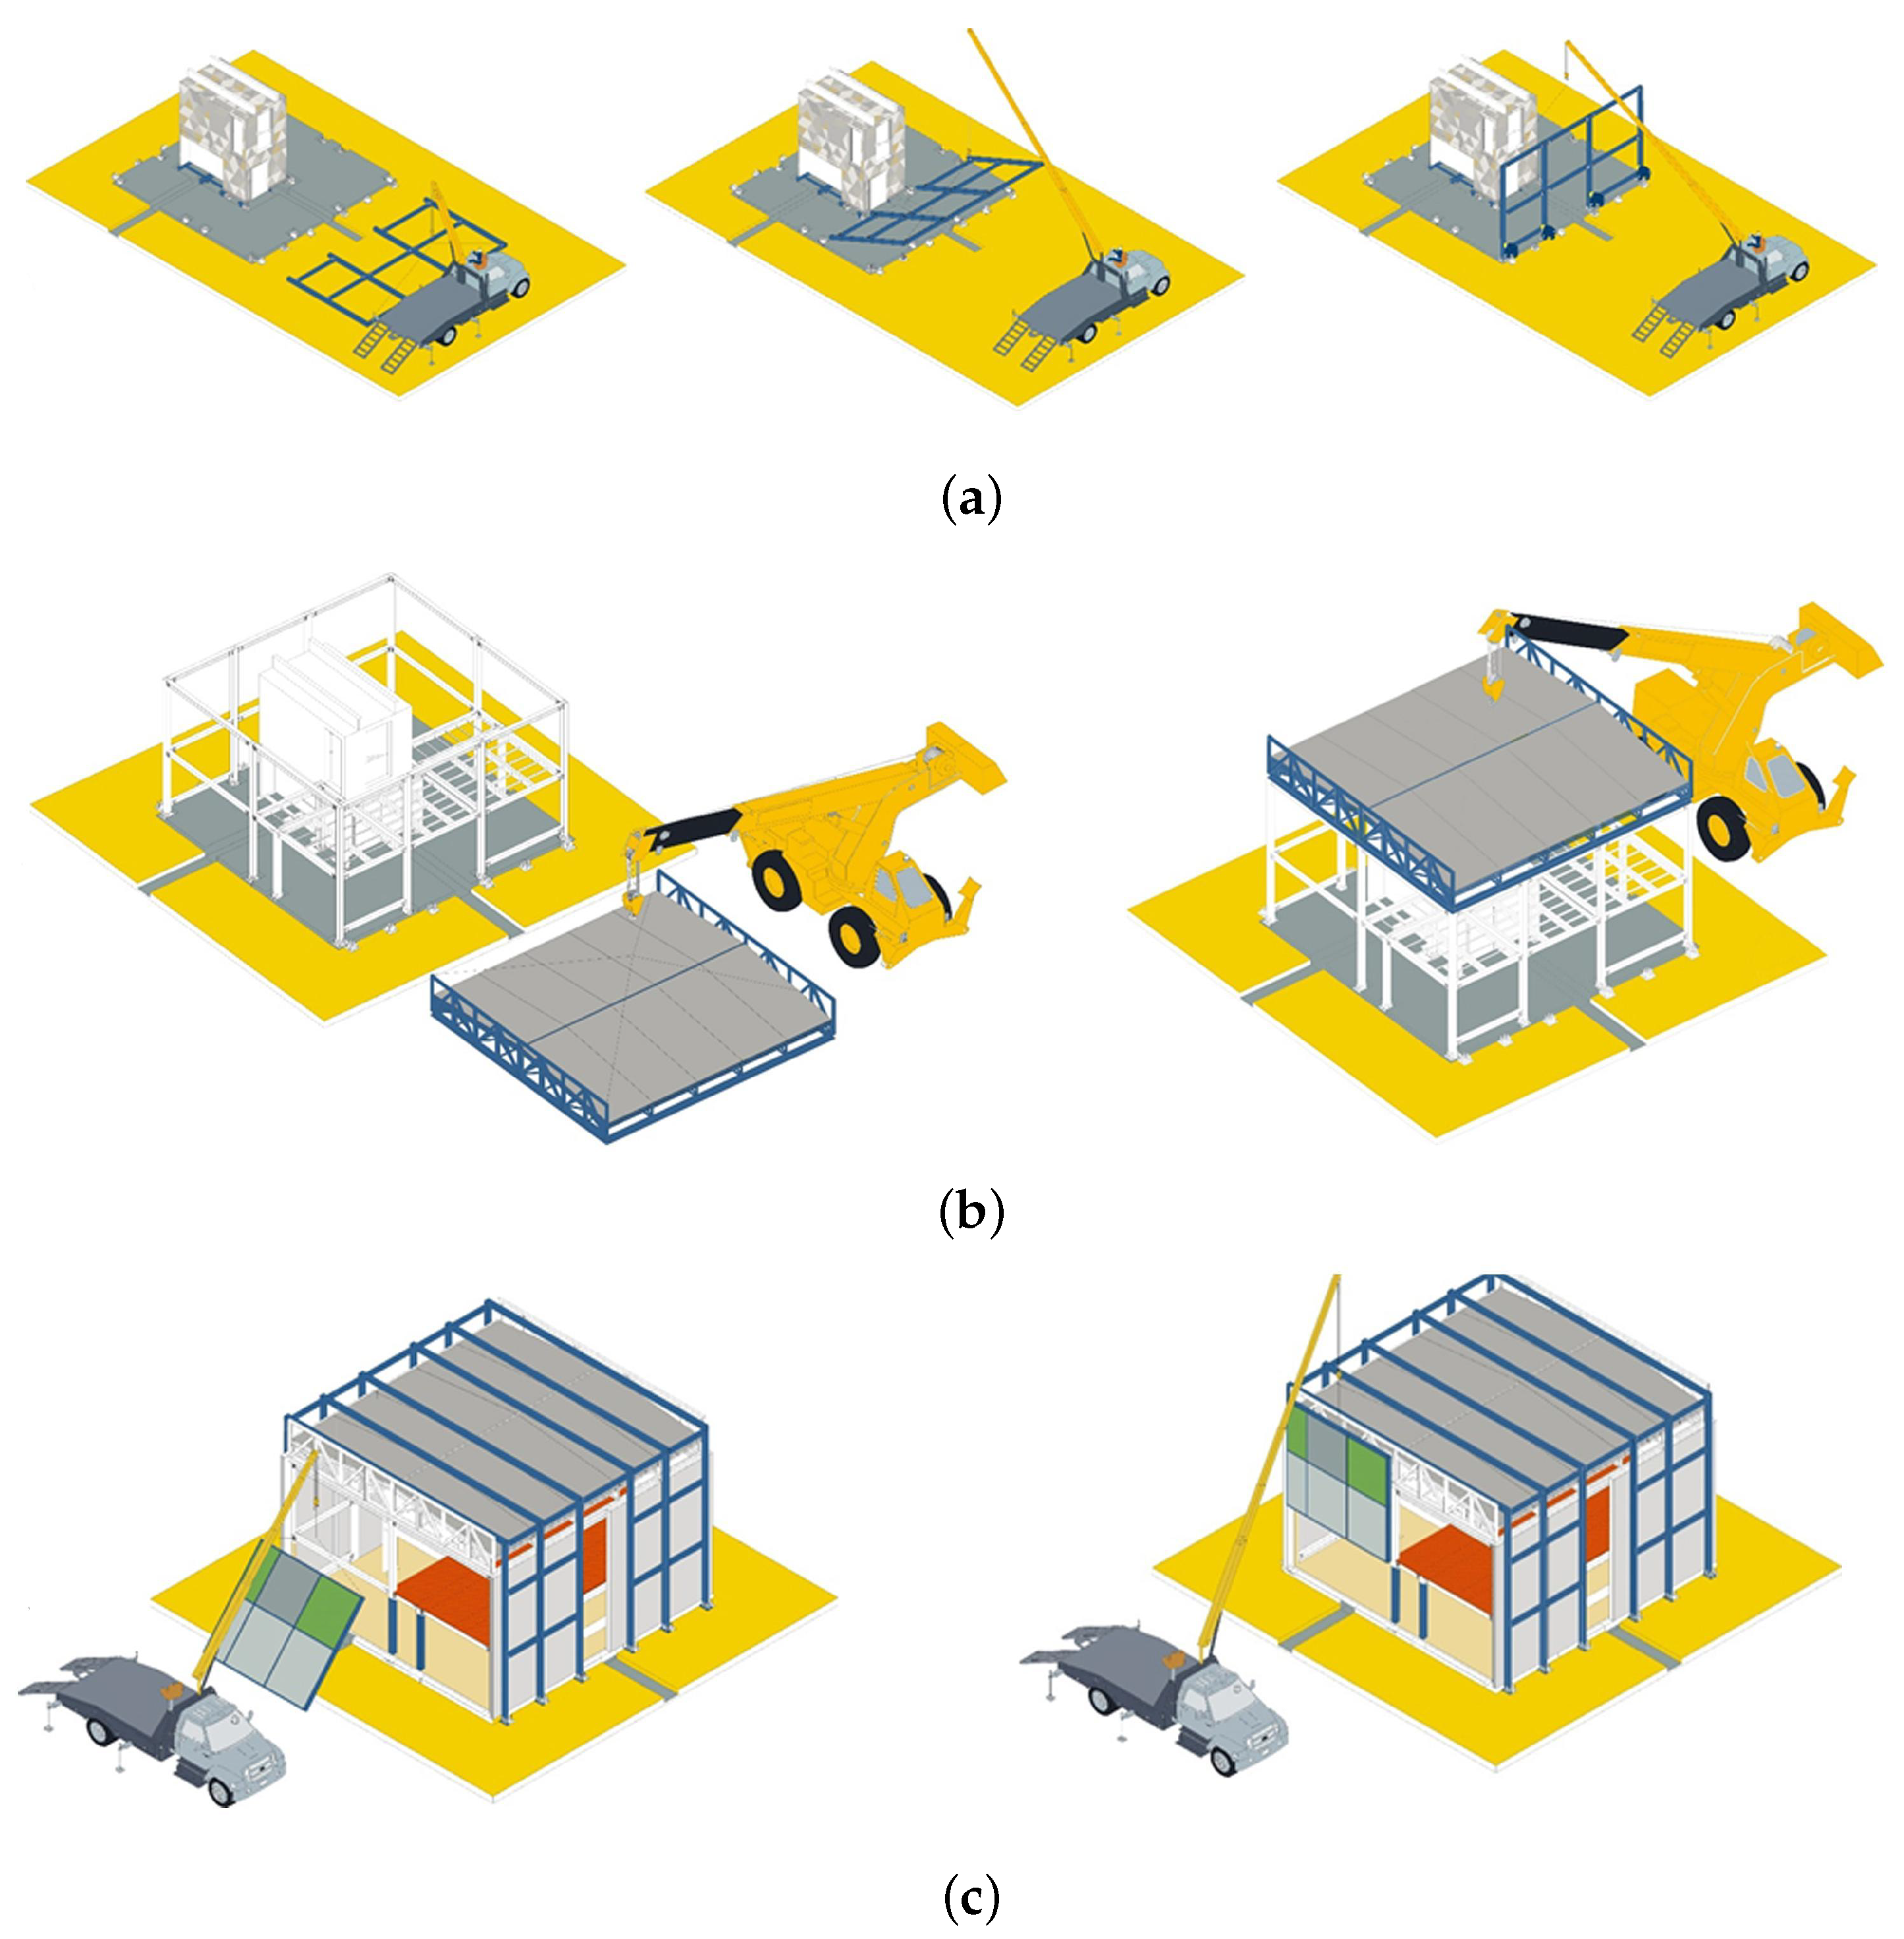
4.3. Assembly of Building on Site along with Its Prefabricated Components
Changing the vertical concept of component installation to horizontal installation on the ground can reduce the time required for a truck crane to repeatedly move up and down, avoid operational work, and significantly improve operational efficiency. For laborers/workers, this methodology can reduce the time working at heights and even eliminate the need for scaffolding when building the main structure, completely avoiding injuries such as falling from heights.
In the case of C-House, the roof components are the largest components in all the prefabricated building construction, with the heaviest weight and the processes with the most numerous requirements. The difference between C-House and normal roof construction is that all roof components from the structure to maintenance to surface layers are completed on the ground; the workers do not need scaffolding while installing the roof due to its low height.
On the ground, the curtain walls and glass panels are firstly installed by using a car crane to form multiple curtain wall units, which are installed separately by using the car crane. This improves the installation speed but also replaces manual labor with the help of a crane.
4.4. Detailed Life-Cycle Assessment of C-House
The types of materials and components used in C-House, their specific production amounts, their carbon emission factors, and their overall carbon emission values are what distinguish the various materials and components. For example, we can discuss the total carbon emissions from various materials. For instance, iron emits more emissions than aluminum. The following tables of materials and component specifications, along with carbon calculation data on each stage, and the final chart of the categorization of carbon emission computation, are available, in addition to the basic mathematical formula of each step by which we may calculate carbon emissions: Table A1, Table A2, Table A3, Table A4, Table A5, Table A6 in Appendix A. The total carbon emissions were calculated to streamline the statistical analysis in Section 4.4, which is focused on the detailed life-cycle assessment of C-House and includes information on material production, component manufacturing, and the detailed seven stages of the life cycle.
4.4.1. Material Production
The total carbon emissions of the material production phase () are calculated as
In Equation (1) [], represents the carbon emissions of the material production phase (kgCO2e), is the consumption of the type i main material (kg), and is the type i material’s carbon emission factor (kgCO2e/per unit material consumption).
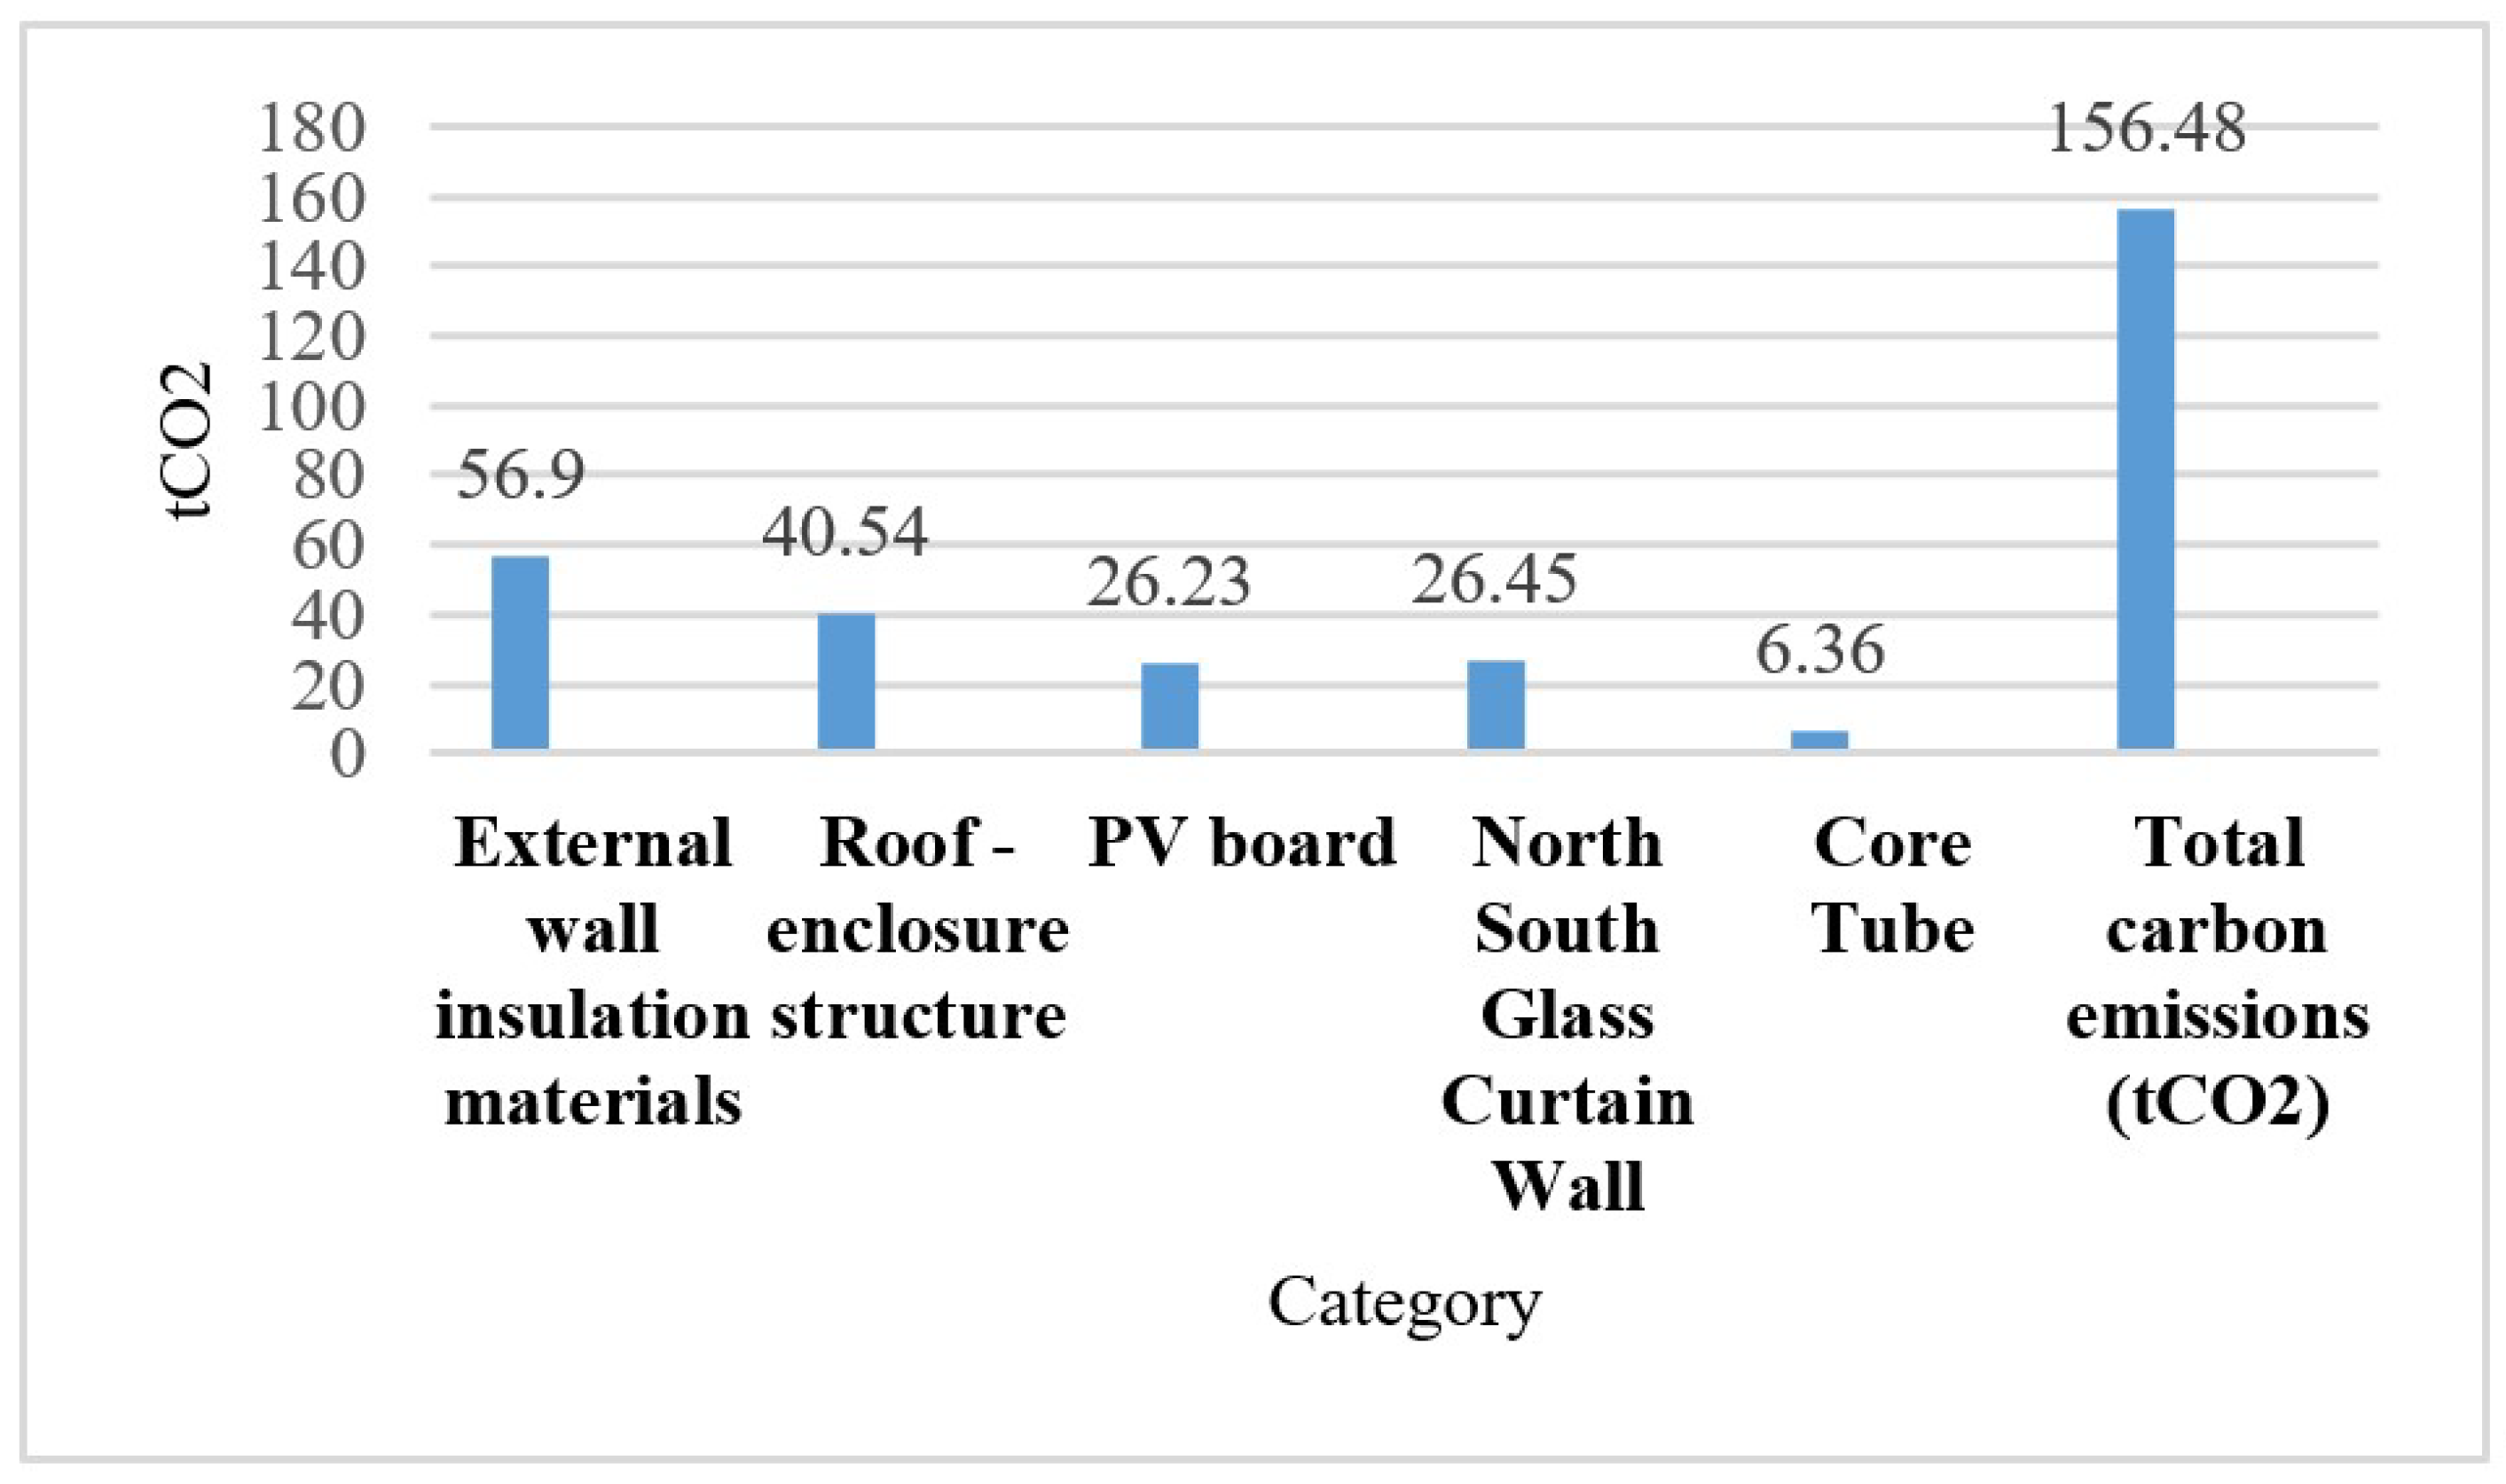
The carbon emissions calculated for the material production stage are further divided into five phases, i.e., external wall insulation materials: 56.90 tCO2; roof enclosure structure: 40.54 tCO2; PV board: 26.23 tCO2; north–south glass curtain wall: 26.45 tCO2; and core tube multi-category material extraction: 6.36 tCO2. The total amount of carbon emissions is 156.50 tCO2, as shown in Figure 5.
Figure 5.
Total amount of carbon emissions calculated for material production stage.
4.4.2. Component Manufacturing
The total carbon emissions of the component manufacturing phase () are calculated as
In Equation (2) [], represents the carbon emissions of the component manufacturing phase (kgCO2e), is the consumption of the type ith main component (kg), and is the type ith component’s carbon emission factor (kgCO2e/per unit component weight).
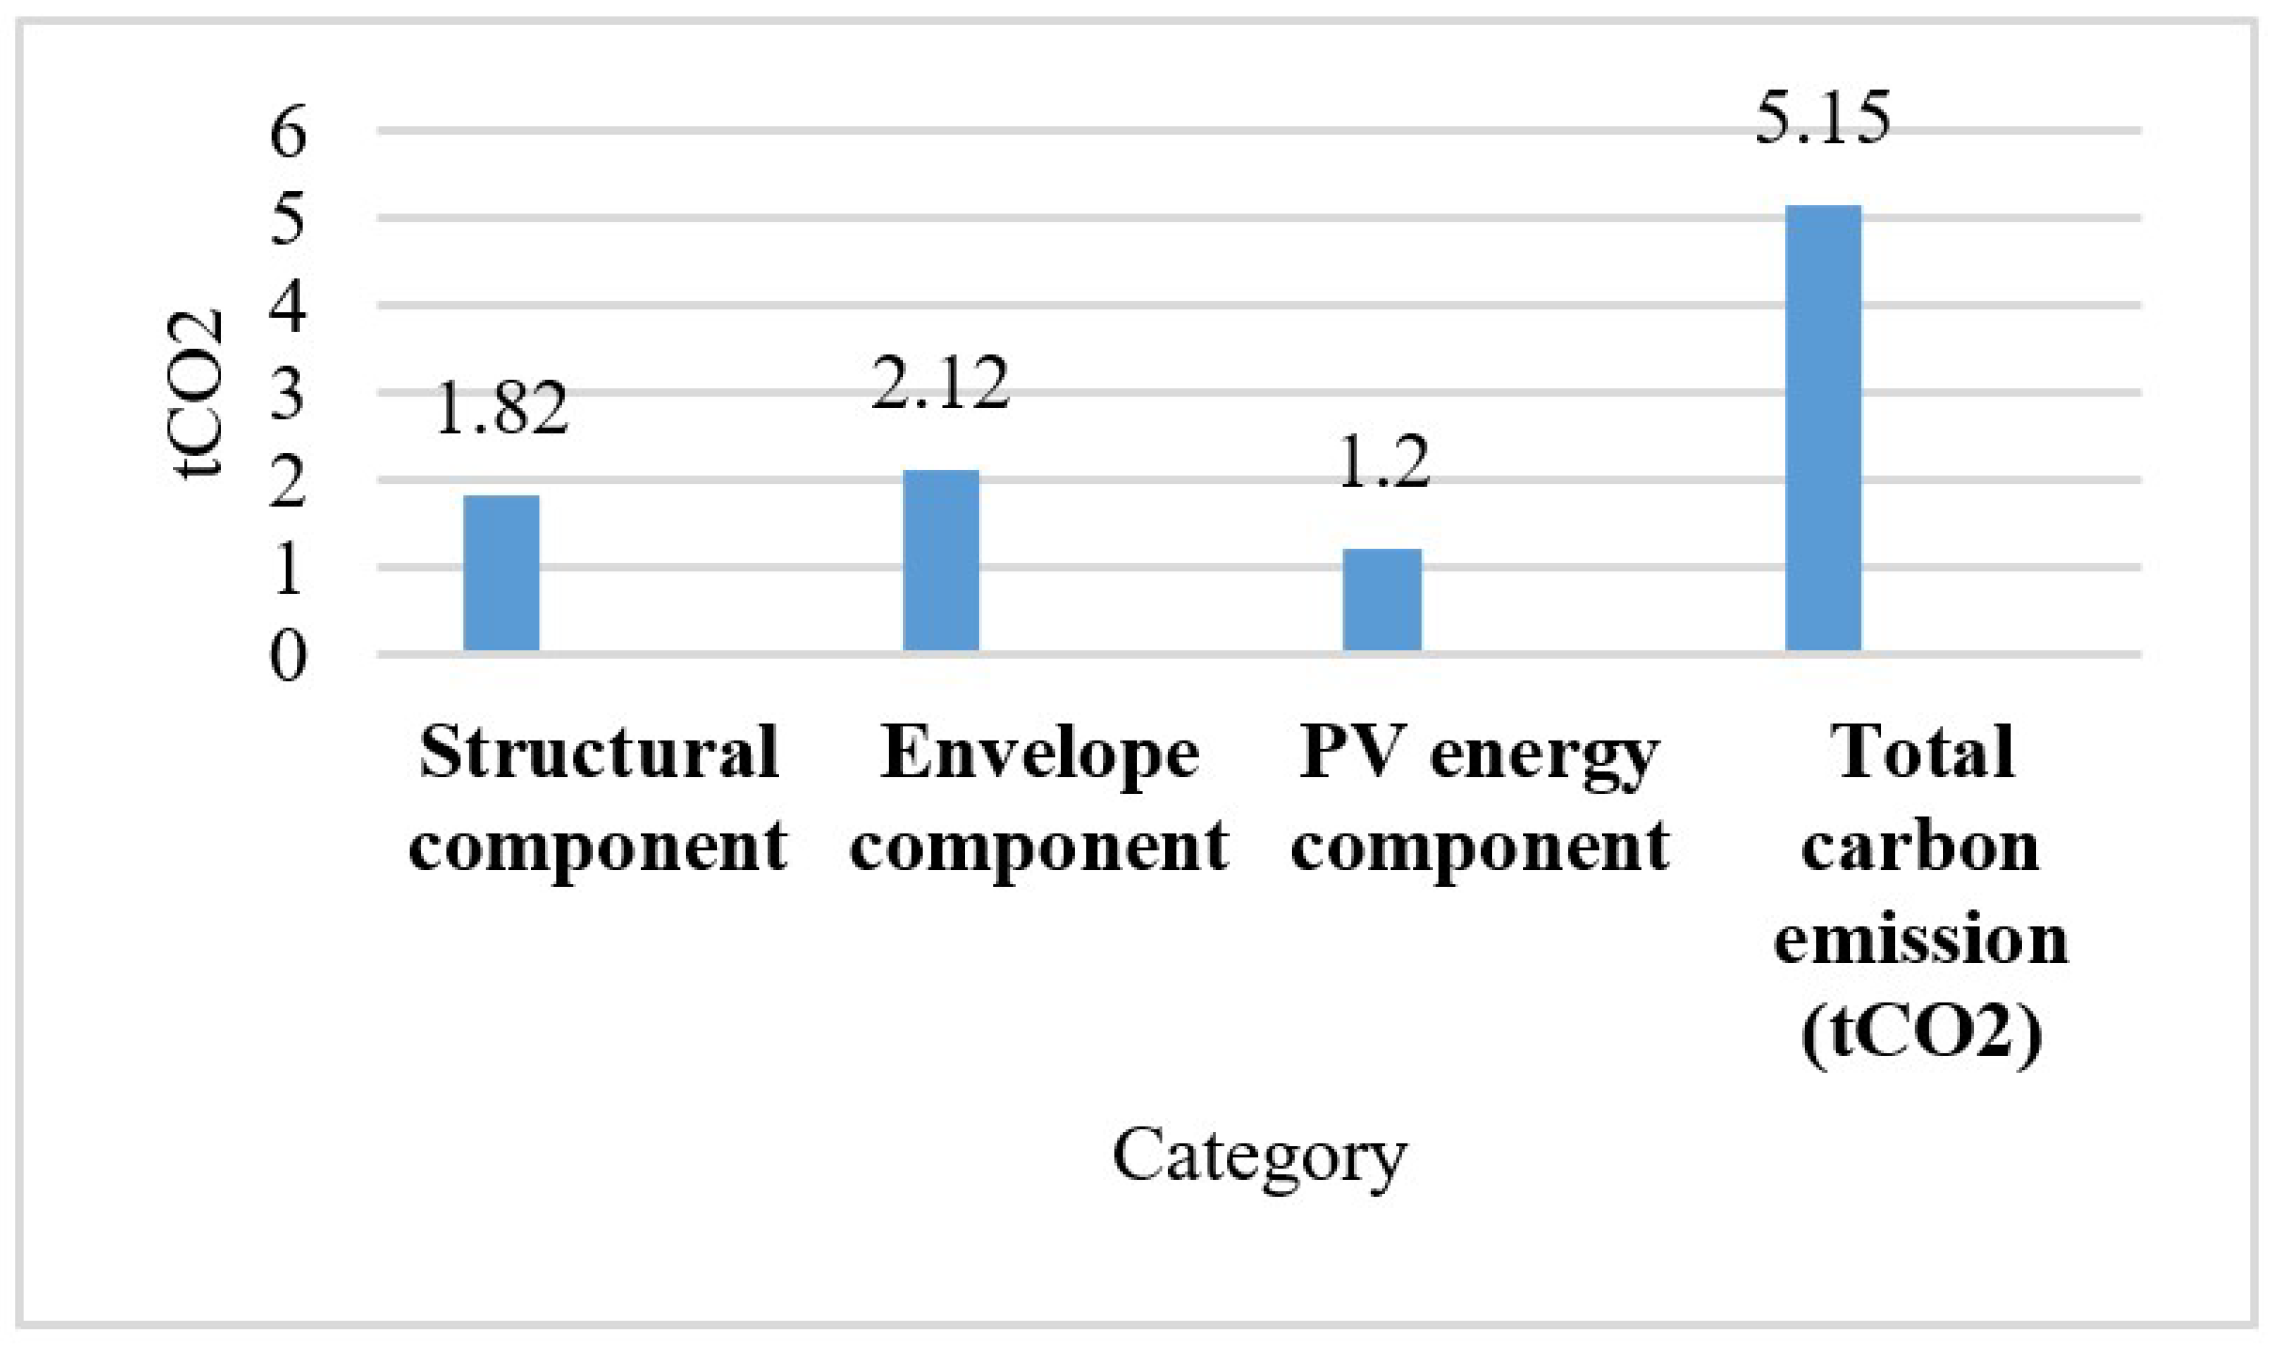
The carbon emissions calculated for the component manufacturing stage are further divided into three phases, i.e., structural components: 1.82 tCO2; envelope components: 2.12 tCO2; and PV energy components: 1.20 tCO2. The total amount of carbon emission is 5.15 tCO2, as shown in Figure 6.
Figure 6.
Total amount of carbon emissions calculated for component manufacturing stage.
4.4.3. Component Transportation
The total carbon emissions during the transportation of the building components () are calculated as
In Equation (3) [], represents the carbon emissions during the transportation of the building components (kgCO2e), is the consumption of the type i main component (kg), is the average transportation distance of the ith building component (km), and is the type jth transportation mode of the type ith component’s carbon emission factor [kgCO2e/(t·km)].
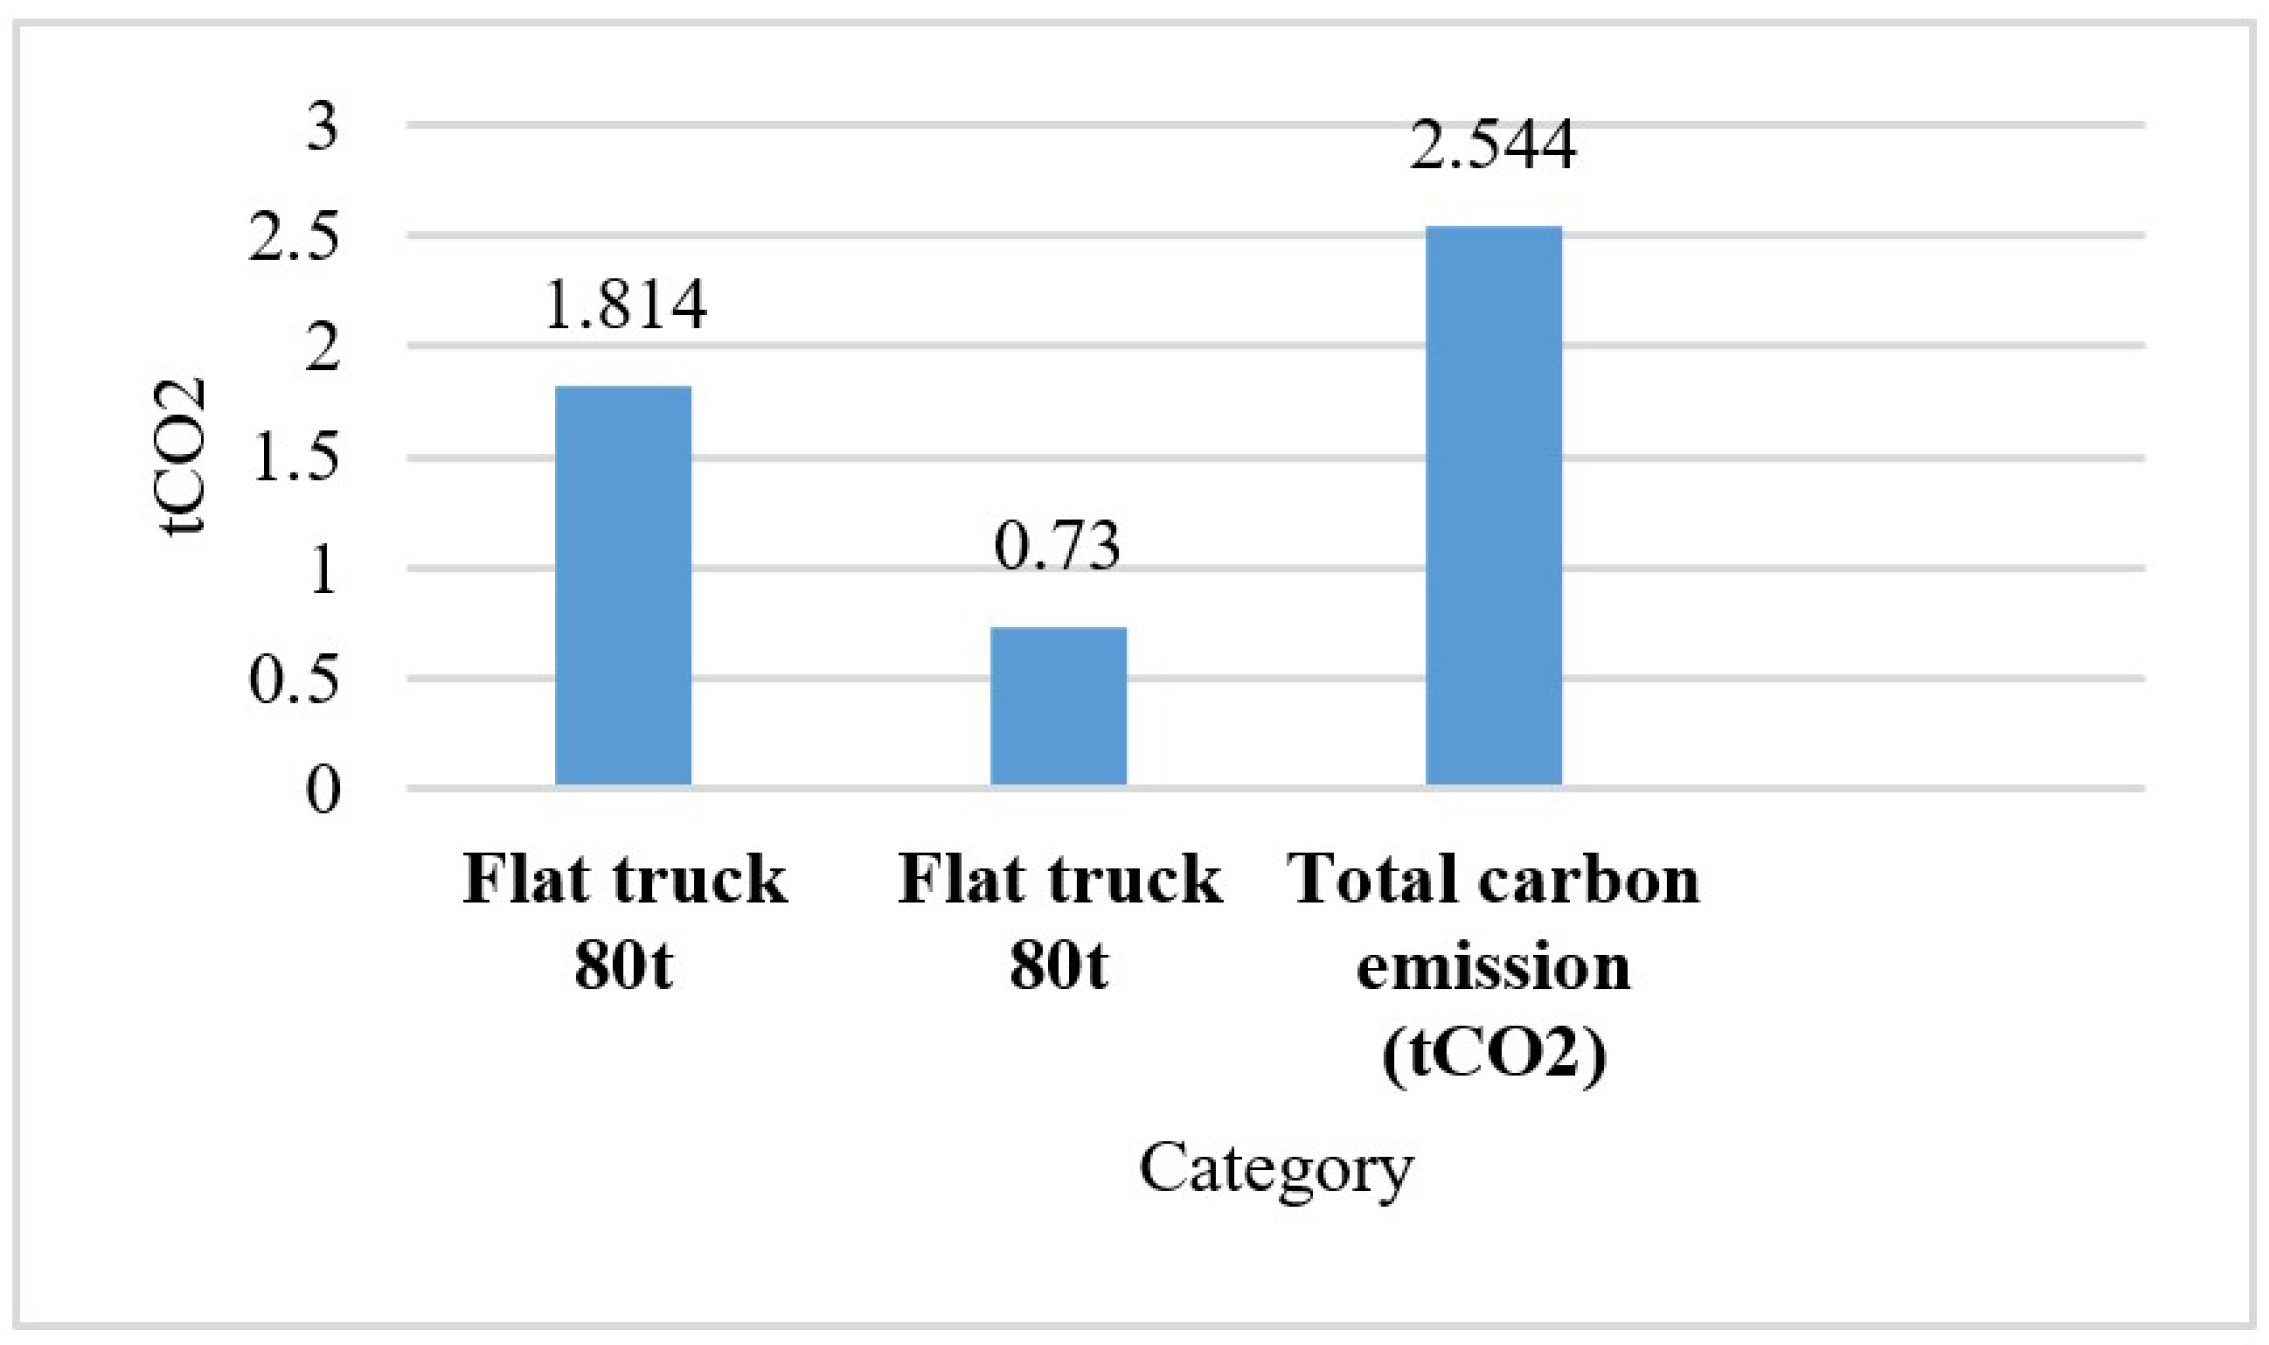
The carbon emissions calculated for the component transportation stage are further divided into two phases, i.e., flatbed truck 80 t: 1.81 tCO2; and flatbed truck 80 t: 0.73 tCO2. The total amount of carbon emissions is 2.54 tCO2, as shown in Figure 7.
Figure 7.
Total amount of carbon emissions calculated for component transportation stage.
4.4.4. Building Construction/Assembling
The total carbon emissions during the building construction phase () are calculated as
In Equation (4) [], represents the carbon emissions during the building construction phase (kgCO2e), is the total consumption of energy in the building construction phase (kWh or kg), is the type ith energy’s carbon emission factor (kgCO2e/kWh or kgCO2e/kg), and A is the building area (m2).
The carbon emissions calculated for the assembling stage are further divided into eight phases, i.e., workers: 11.2 tCO2; 80 t truck crane: 2.04 tCO2; mobile lifting: 1.92 tCO2; cutting machine: 0.02 tCO2; wood work saw: 0.13 tCO2; AC welding machine: 4.45 tCO2; electric wrench: 0.32 tCO2; and electric drill: 0.21 tCO2. The total amount of carbon emissions is 20.33 tCO2, as shown in Figure 8.
Figure 8.
Total amount of carbon emissions calculated for construction/assembling stage.
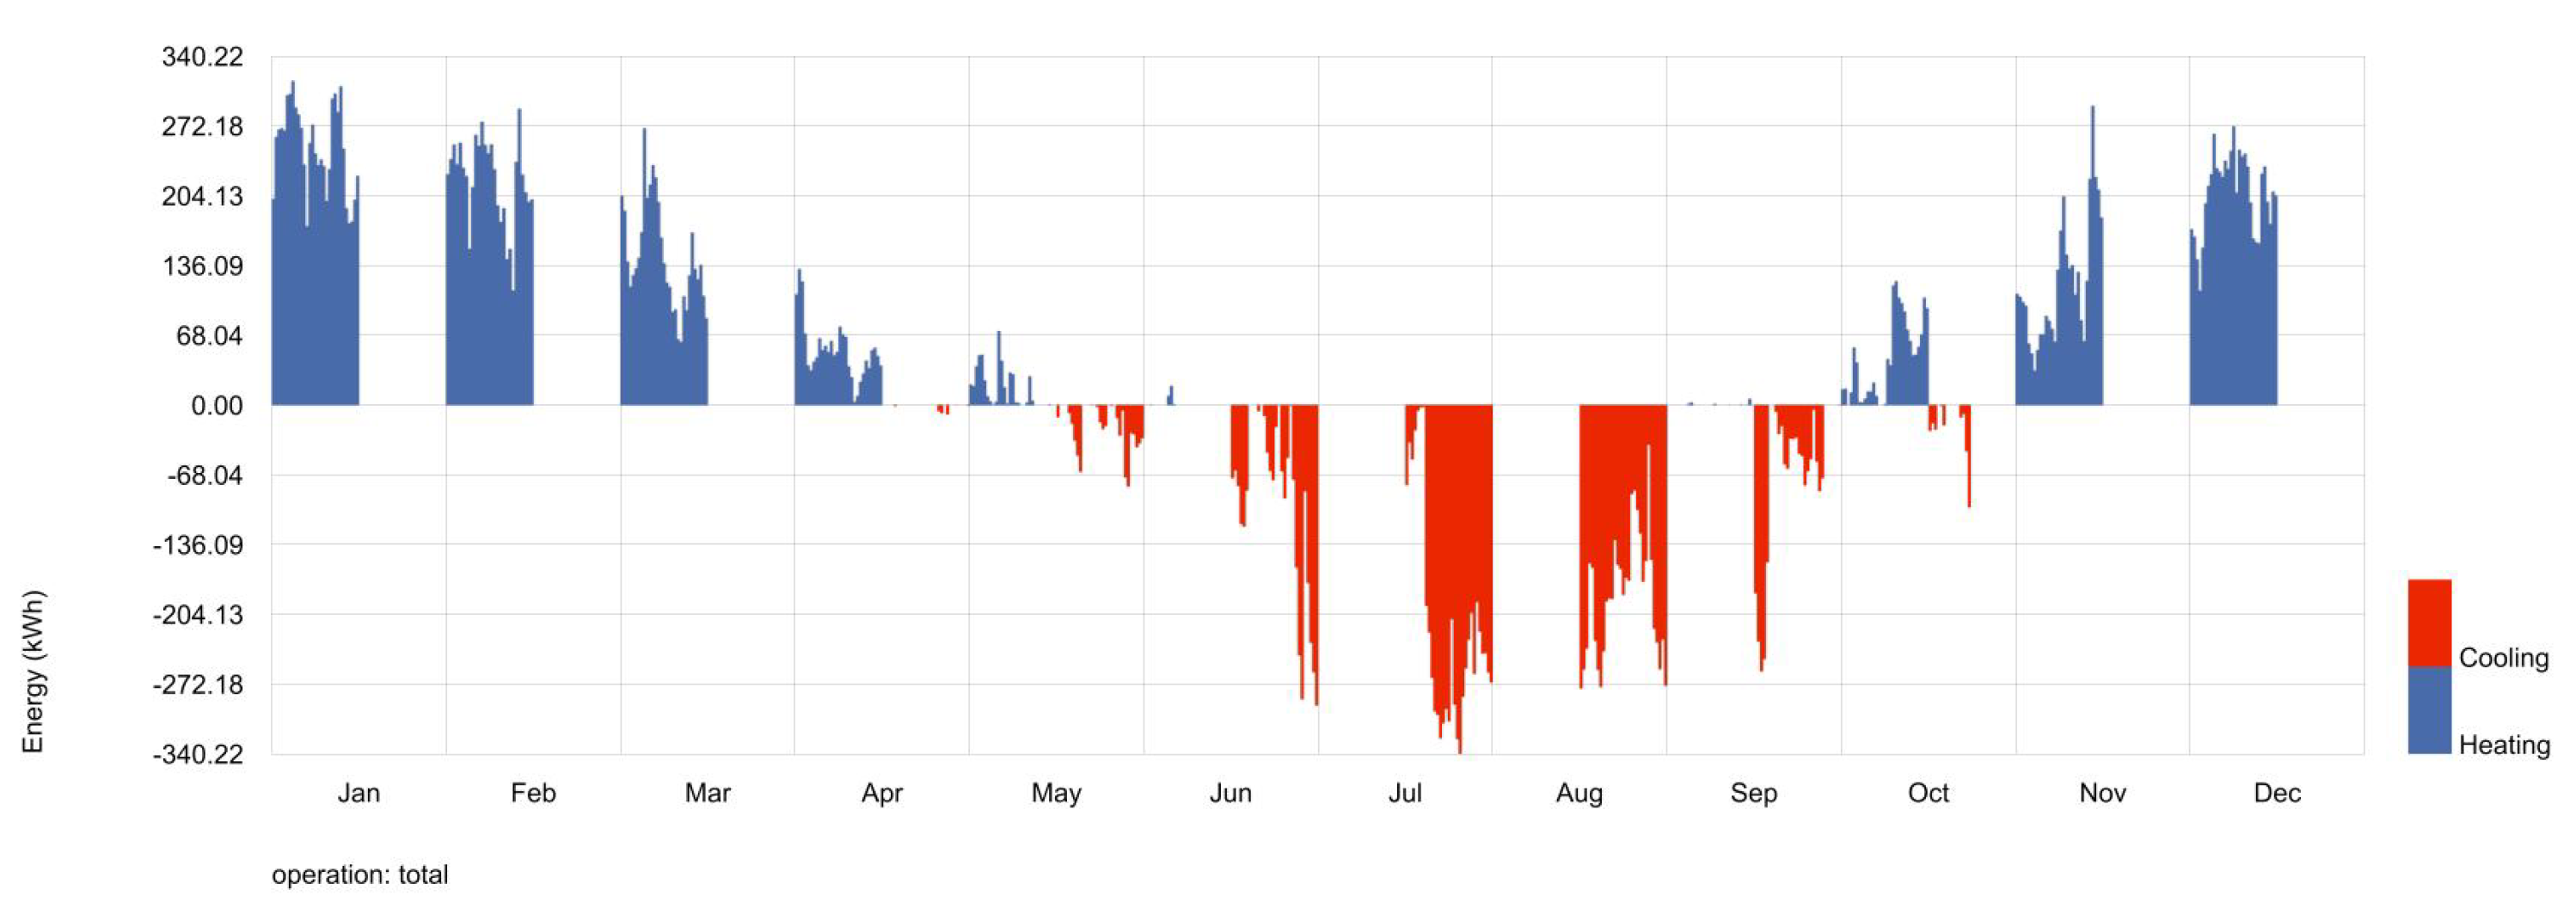
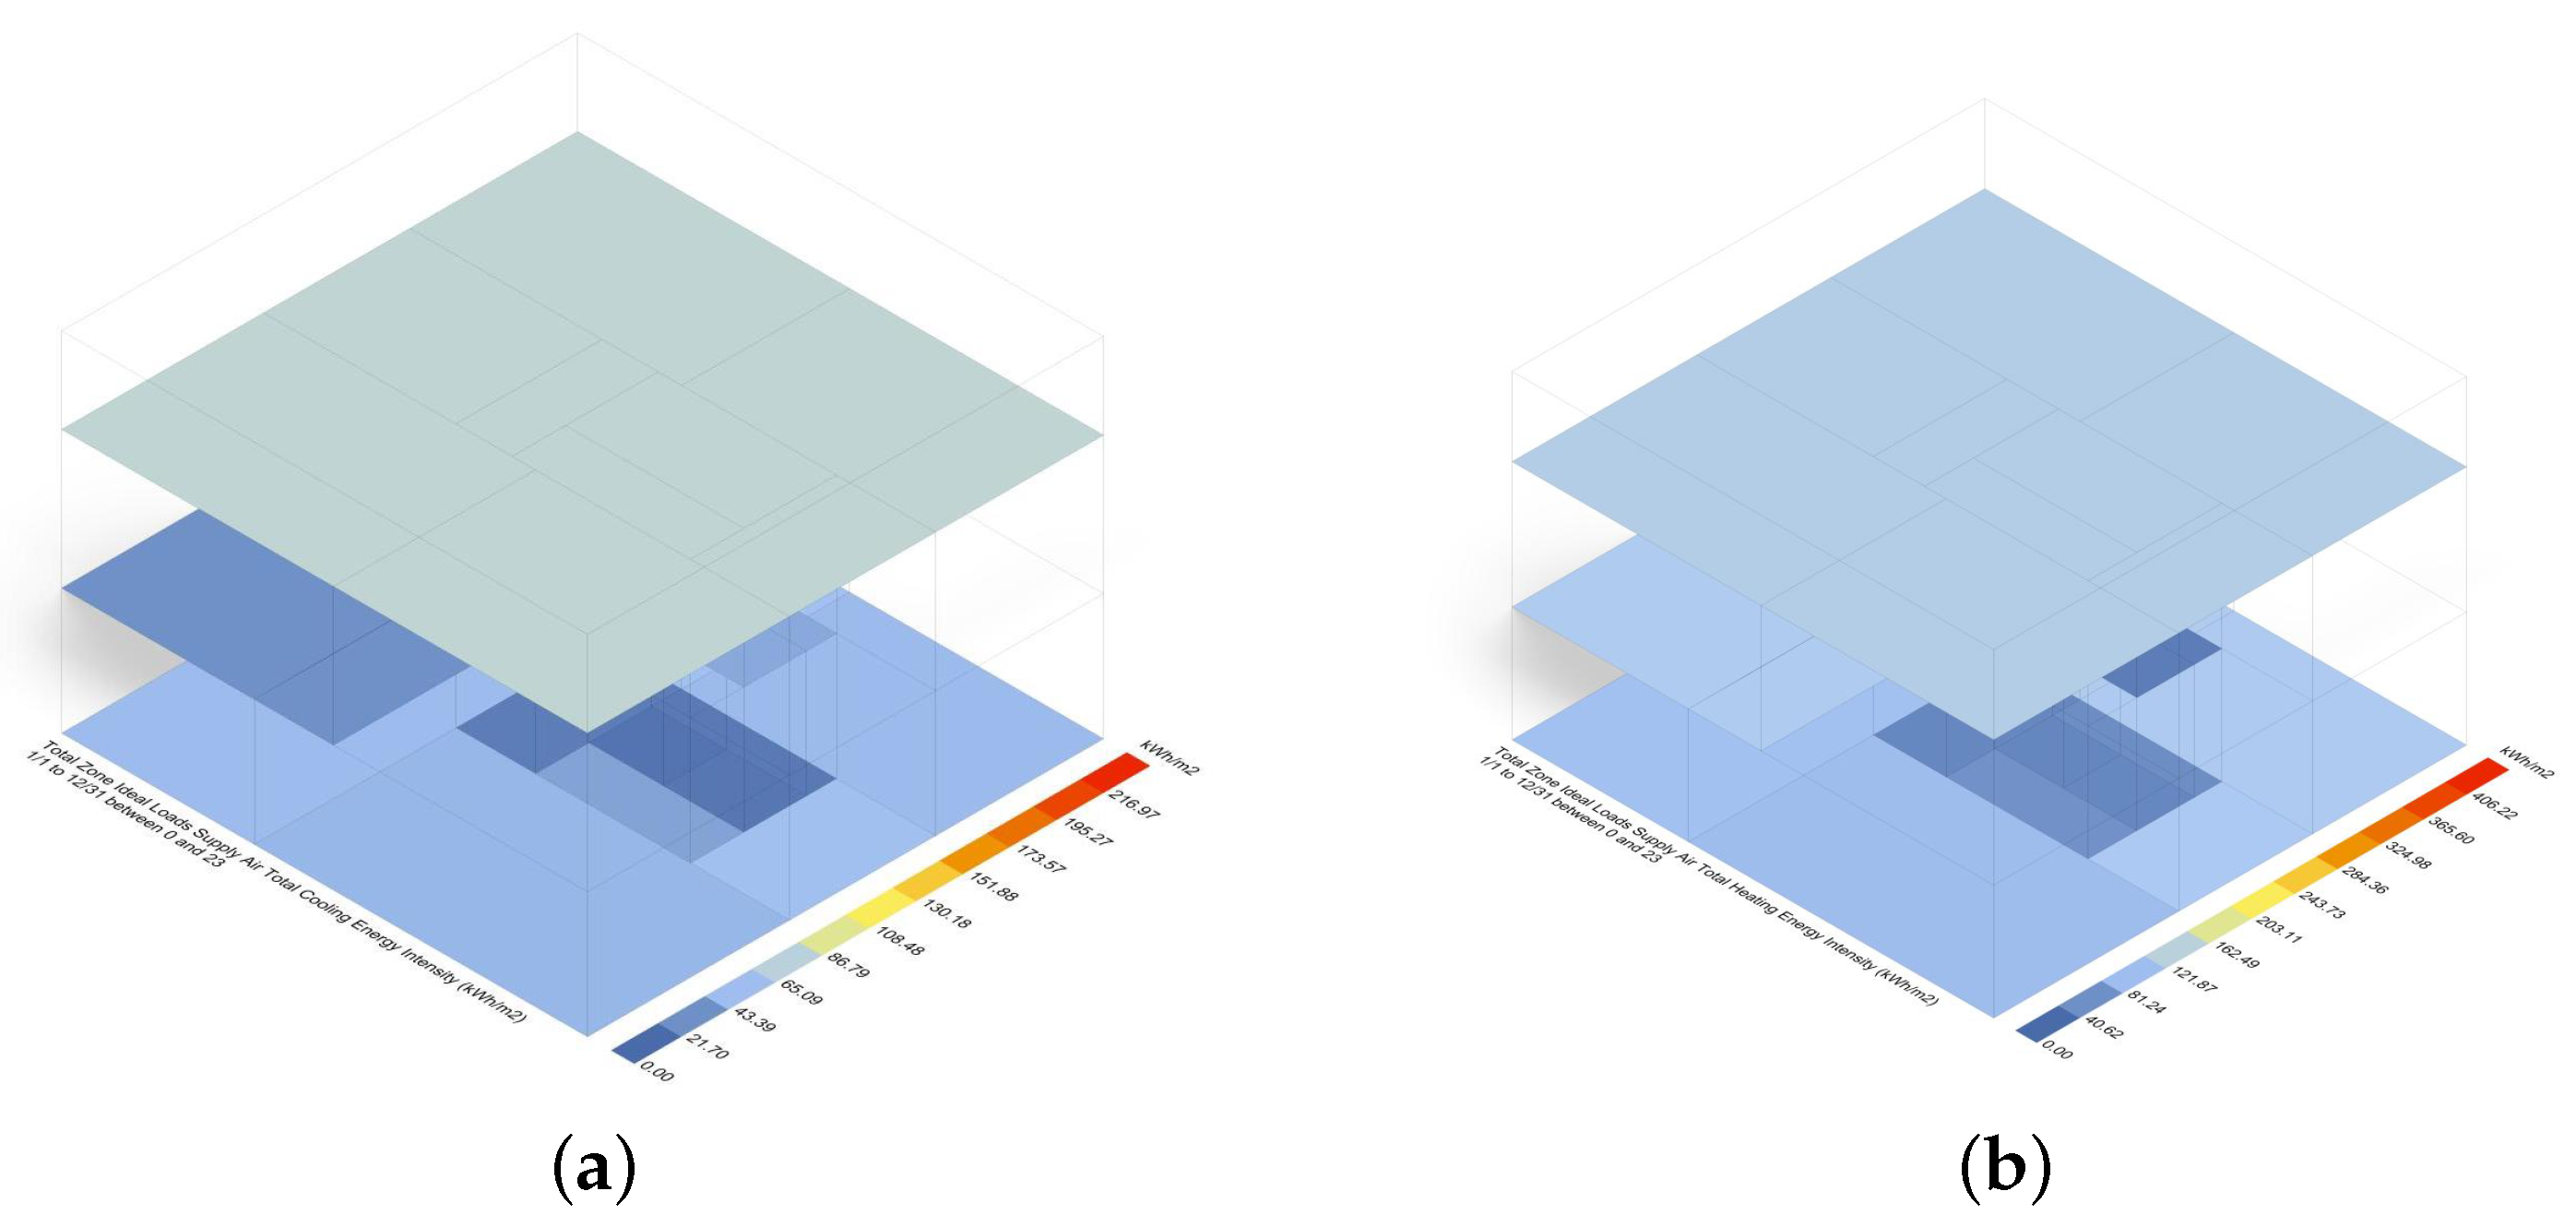
4.4.5. Building Operation
The total carbon emissions per unit building area during the building operation phase () are calculated as
In Equation (5) [], represents the carbon emissions per unit building area during the building operation phase (kgCO2e/m), is the annual consumption of type ith energy (unit/a), is the type i energy’s carbon emission factor (tCO2/tJ), y is the design lifetime of the building, and A is the building area (m).
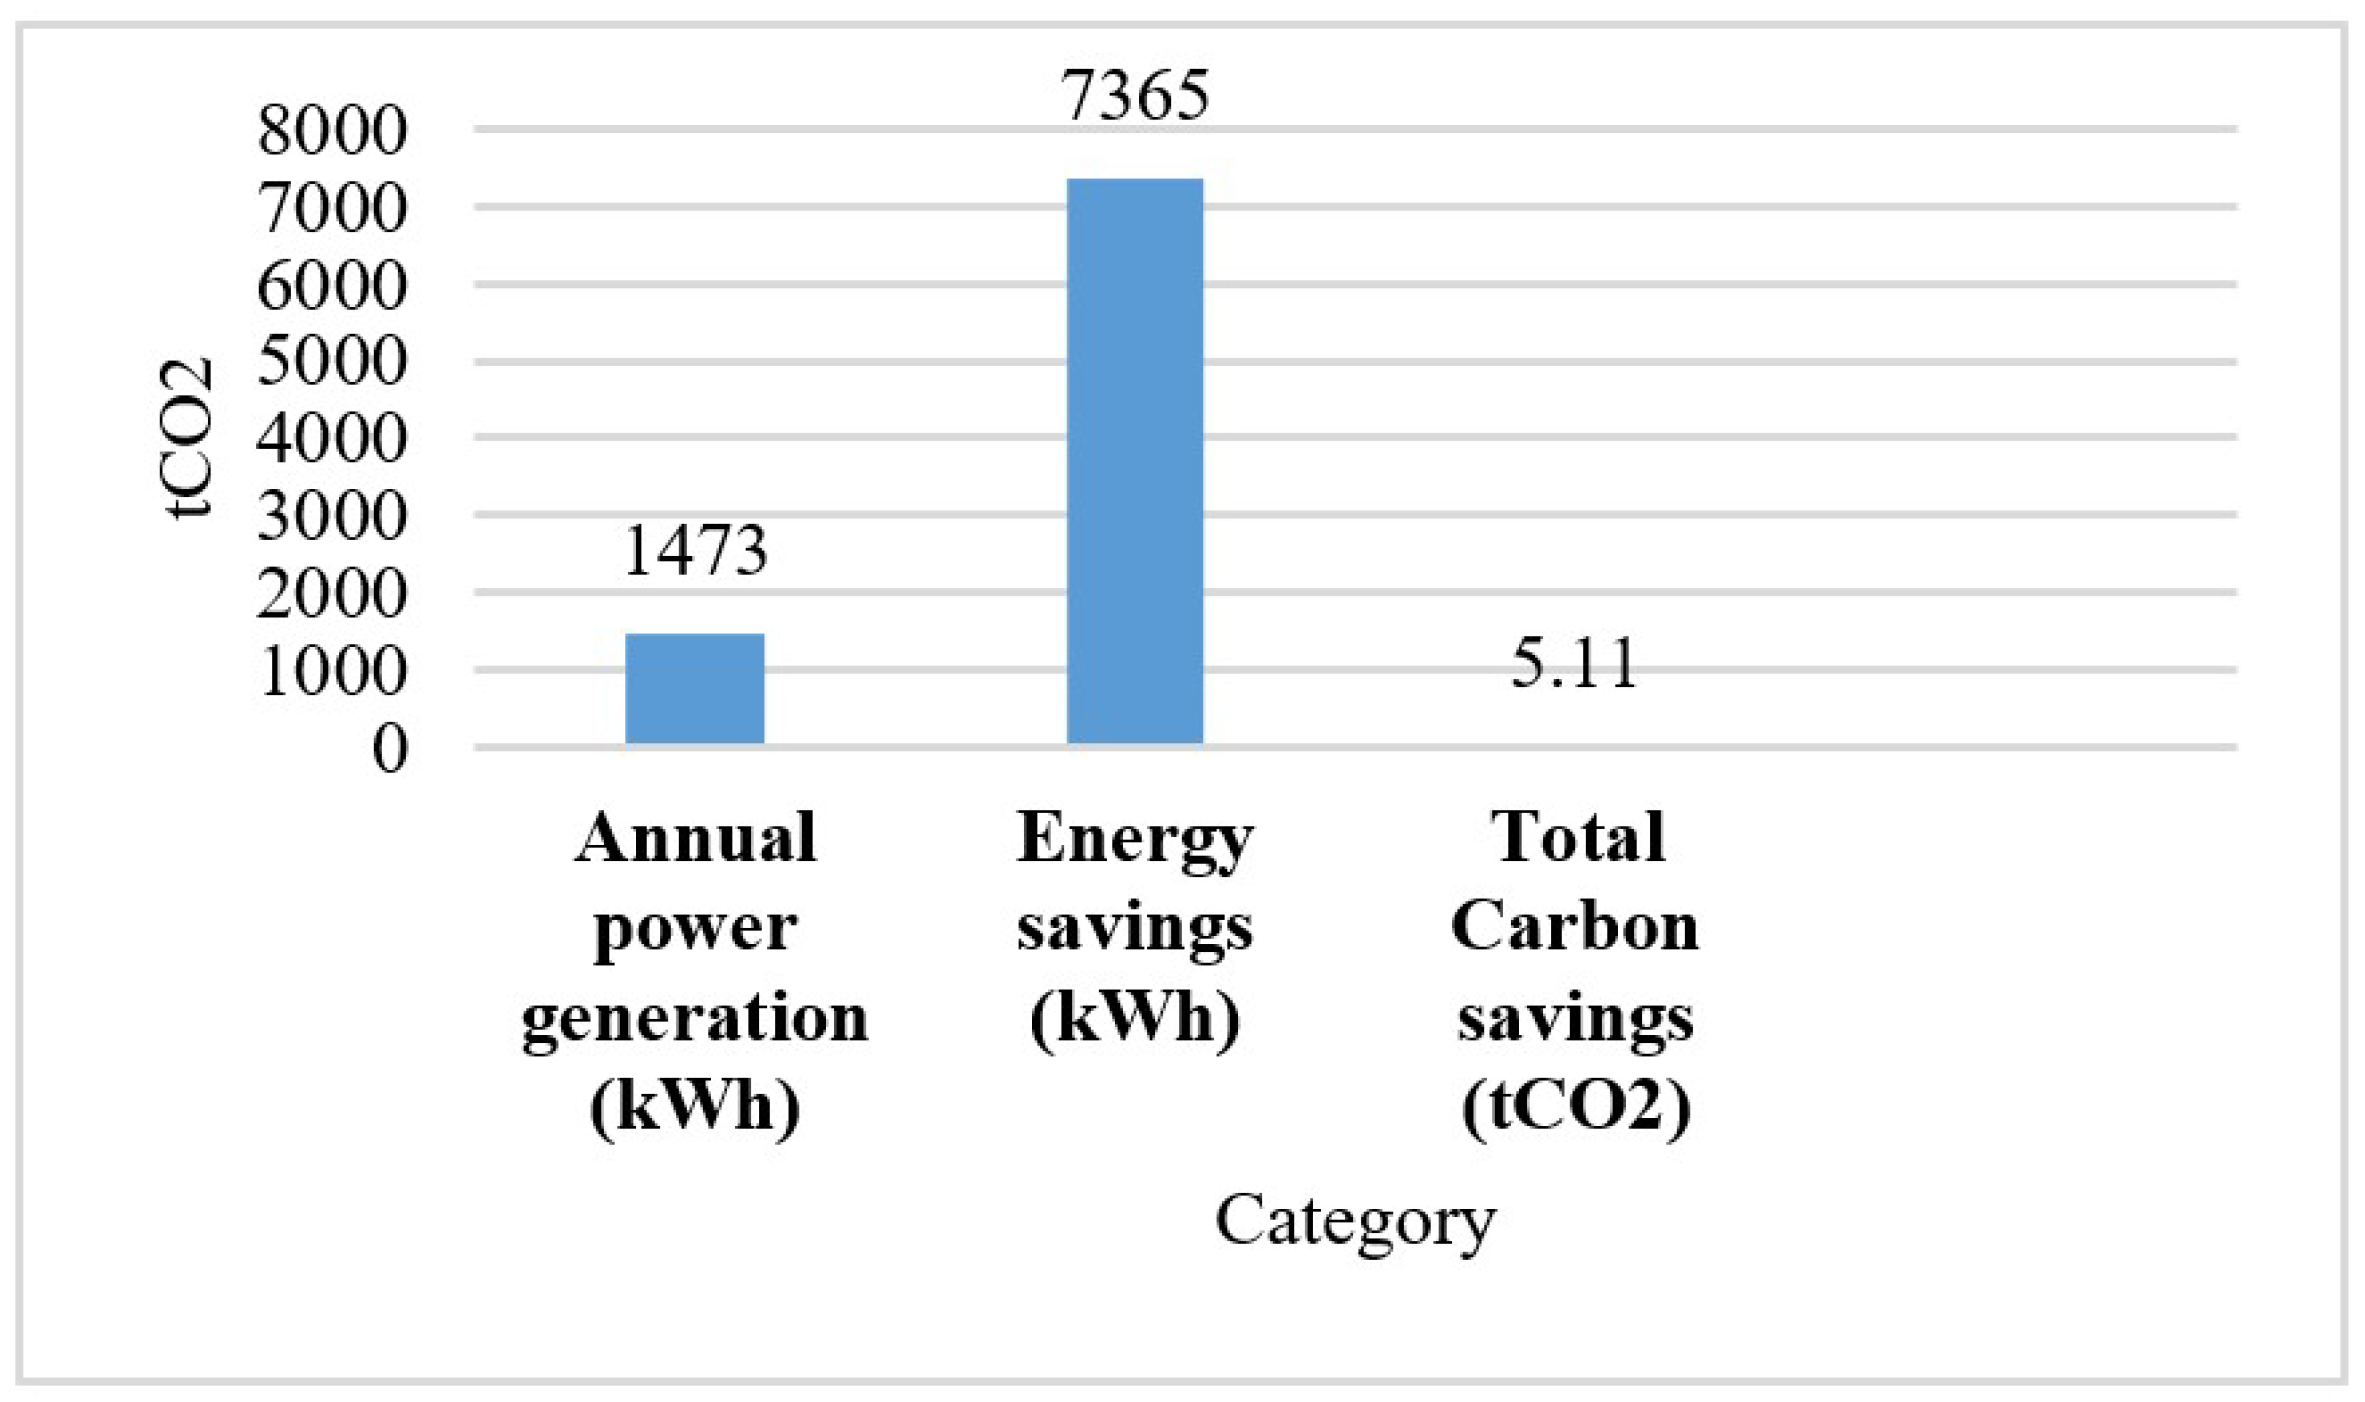
The carbon emissions calculated for the operational stage are further divided into two phases, i.e., average annual power generation (kWh): 1473; and energy savings from 2018 to the present (kWh): 7365. The total amount of carbon emissions in the operation stage is 5.11 tCO2, as shown in Figure 9.
Figure 9.
Total number of carbon emissions calculated for operation stage.
The carbon emission inventory provides some indicators for C-House which can improve the emission inventory; to be more precise, we have used PV panels to create energy around the building in addition to using wooden furniture, flooring, and wall cladding for the interior. In addition, the building’s deliberate placement among lush trees has been emphasized to reduce carbon emissions.
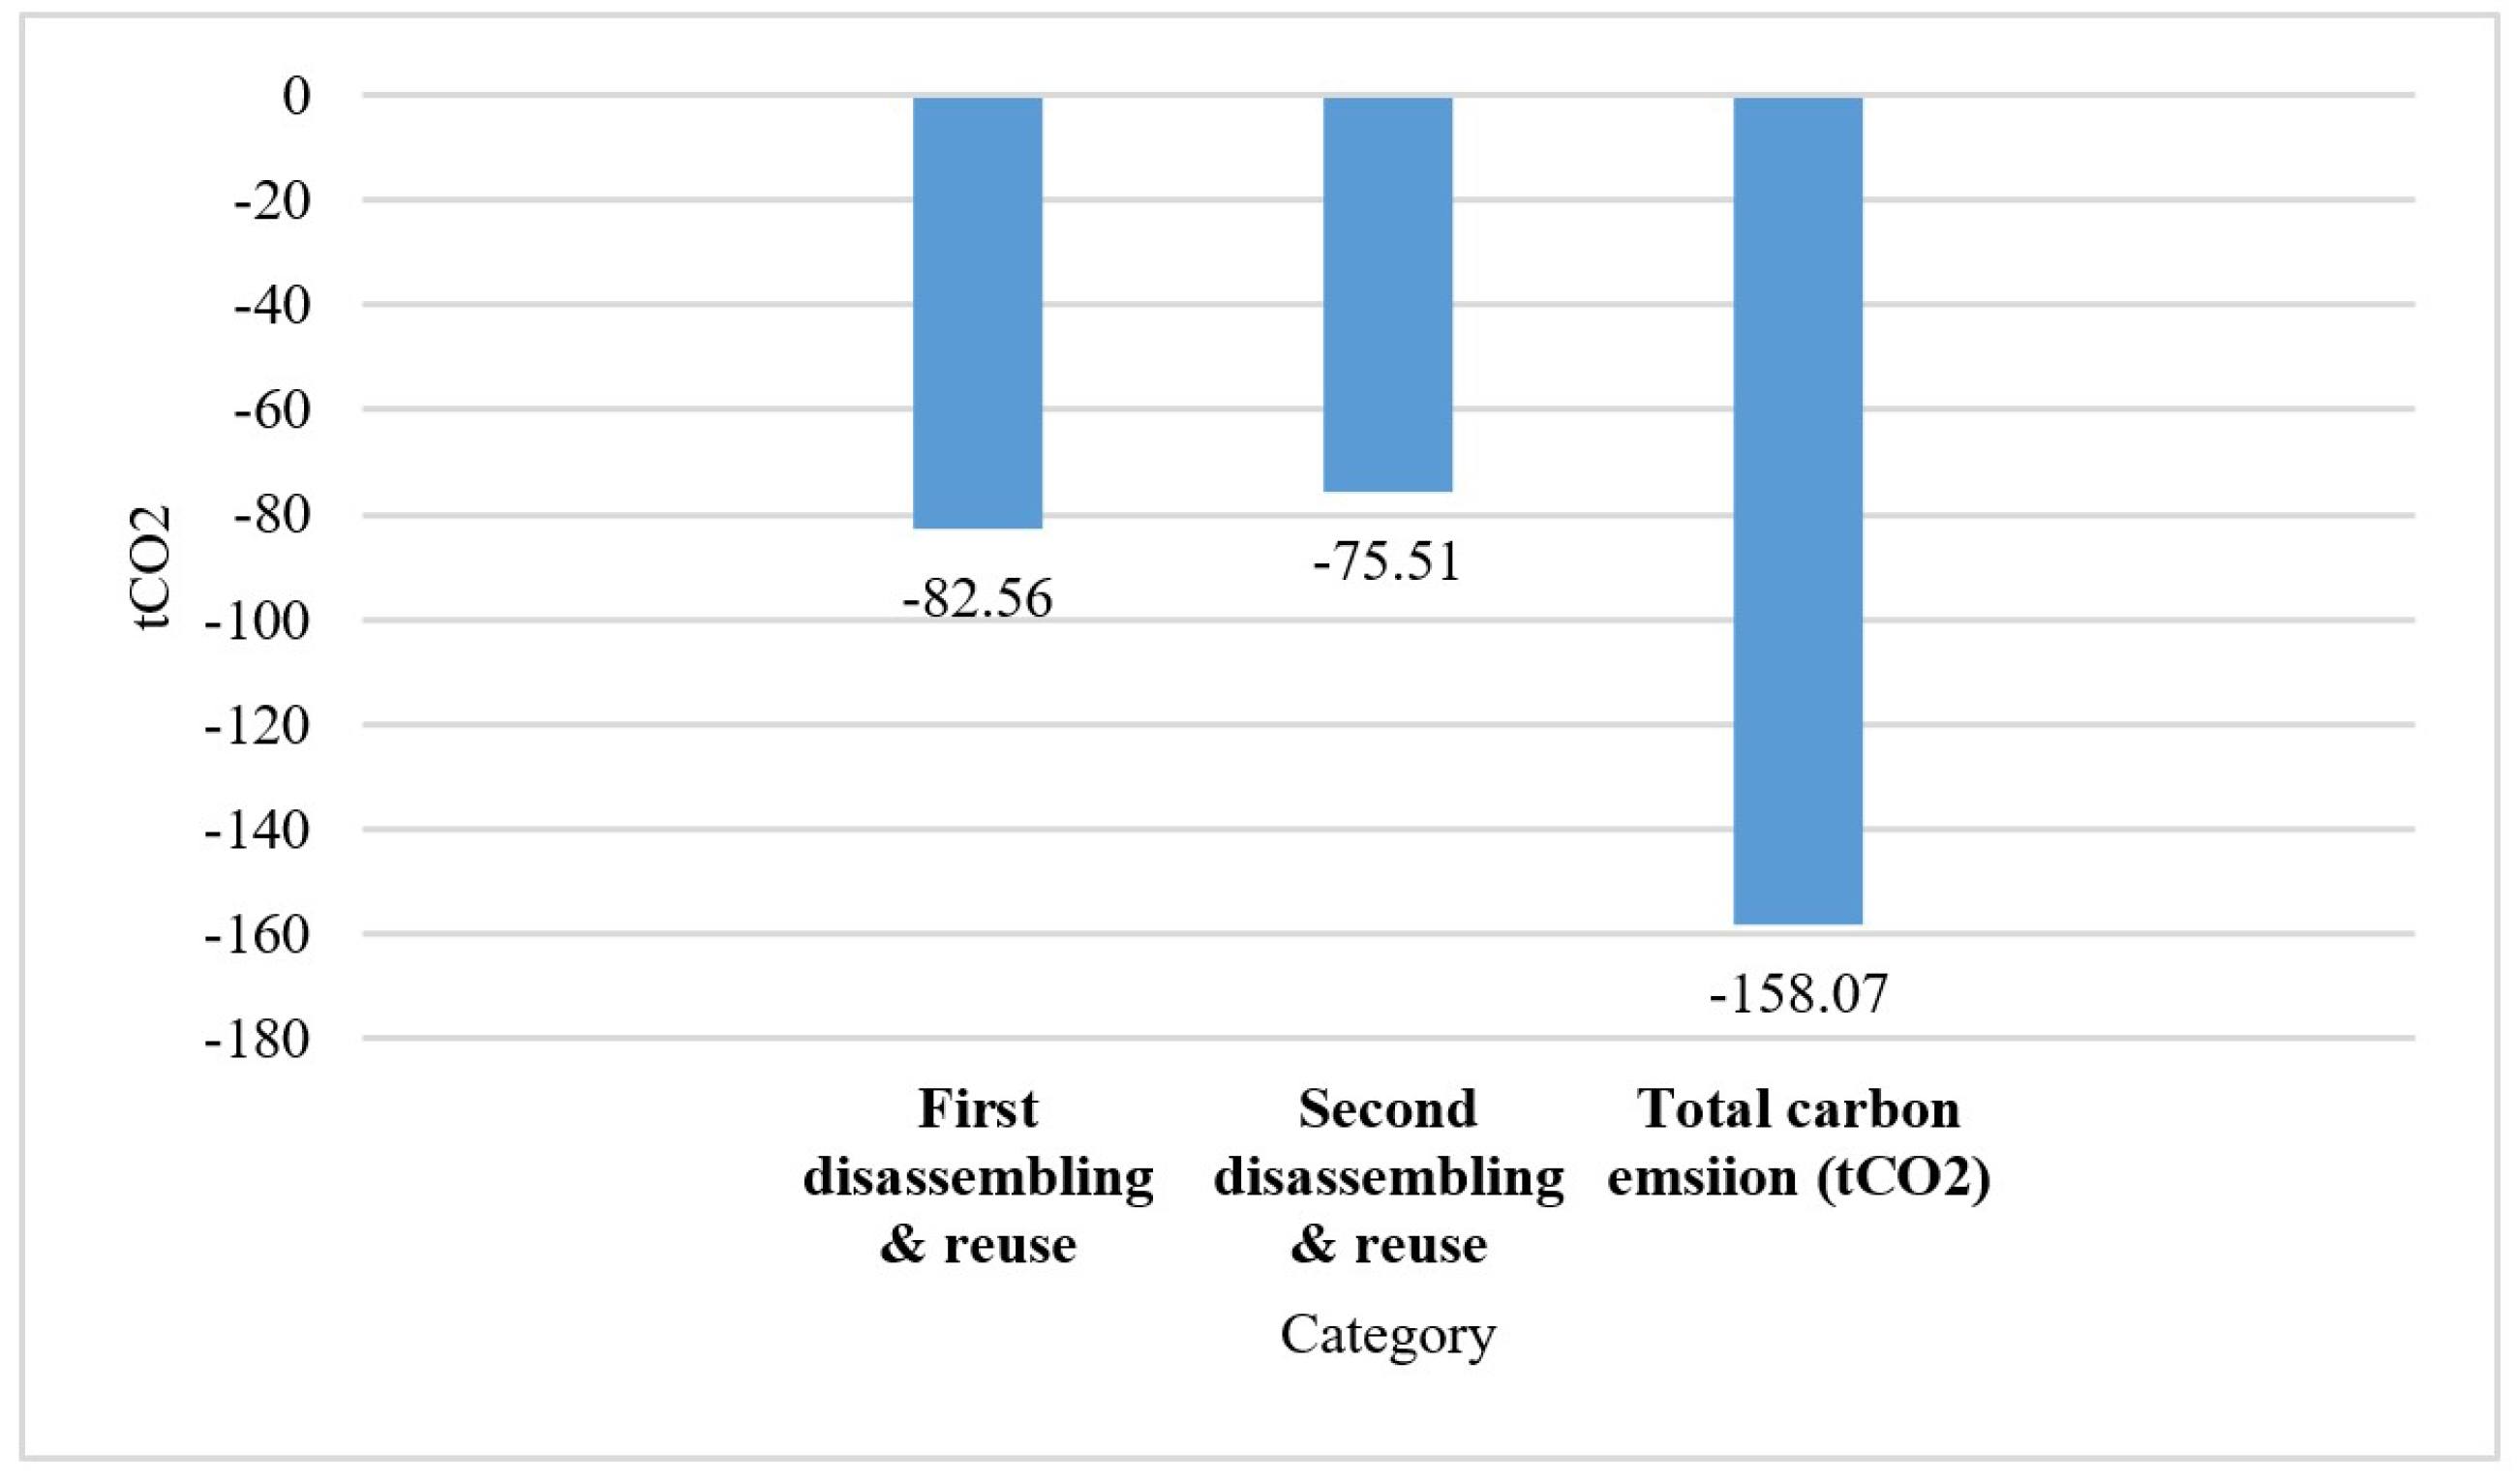
4.4.6. Disassembling and Reuse
The carbon emissions calculated for the disassembling and reuse stage are further divided into two phases, i.e., the first disassembling and reuse: −82.56 tCO; and the second disassembling and reuse: −75.51 tCO. The total amount of carbon emission is −158.07 tCO, as shown in Figure 10.
Figure 10.
Total amount of carbon emissions calculated for disassembling/reuse stage.
4.4.7. Renovation and Reuse
The total carbon emissions per unit building area during the building operation phase () are calculated as
In Equation (6) [], represents the carbon emissions per unit building area during the building operation phase (kgCO2e/m), is the annual consumption of type ith energy (unit/a), is the type i energy’s carbon emission factor (tCO/tJ), y is the design lifetime of the building, and A is the building area (m).
In both reuse scenarios, C-House’s life cycle did not require a calculation for the renovation stage. As a result, a formula to determine carbon emissions during the stages of renovation and reuse was created. Carbon emissions, however, have not yet been determined for this phase.
4.4.8. Seven-Stage Graph of C-House Life-Cycle Assessment, including Total Carbon Emissions and Its Evaluation
Standard: Standard for Building Carbon Emission Calculation (GB/T 51366-2019) [].
The total carbon emissions of the whole building life cycle are calculated as
In Equation (7) [], the total carbon emissions calculated during the overall life cycle of building are divided into seven phases, i.e., material production: 156.50 tCO; component manufacturing: 5.15 tCO; transportation: 2.54 tCO; assembling: 20.33 tCO; operation: 5.11 tCO; two times of disassembling and reuse: −82.56 and −75.51 = −158.07 tCO; renovation and reuse: not calculated (Figure 11).
Figure 11.
The total amount of carbon emissions in the building life cycle of C-House with all its seven stages.
Total first-life-cycle carbon emissions of C-House = 189.66t − 82.56 = 107.10 tCO. Total second-life-cycle carbon emissions of C-House = 107.10t − 75.51 = 31.59 tCO.
5. Energy Simulation Results for C-House
In the general simulation, in accordance with Nanjing guidelines and the local context, Rhino was used for modeling, although the weather file was obtained from Nanjing, Jiangsu, as shown in Table 1, and the grasshopper + ladybug tool (version 1.6.0) was used for the simulation. Furthermore, the table includes data on the file’s context.
Table 1.
General simulation and Nanjing guidelines along with the local context.
5.1. Energy Simulation Based on Visual Programming Language in Grasshopper
There are six important steps in this visual programming language that uses diagrams. Three steps make up the first section: “Honeybee Intersects Solids”, “Honeybee Construction Set”, and “Honeybee Days Schedule and Room Program Type”. The next and most critical step is to divide the rooms and place them into “Honeybee Solids” before moving them for the simulation. The simulation process would not be feasible without this stage. “Honeybee Rooms Apertures” and “Honeybee Model Integration” are covered in the third section. “Honeybee Energy Simulation and Visualization” is the fourth section. These actions, also known as the “Simulation Zone Set Points”, are a representation of the grasshopper simulation process, as shown in Figure 12.
Figure 12.
Energy simulation based on visual programming language in grasshopper.
5.2. Simulation Process of BIM-Model
The following diagrams, (Figure 13a–f) were created by using a simple model called “shoebox” for simulation. This model included the exterior floor (a), interior spaces (b), the aperture (c), the ceiling (d), the roof (e), and doors, and the model is denoted by (f). The solar path diagram is shown in Figure 14.
Figure 13.
Simulation process of the BIM model of C-House. (a) Exterior floor; (b) interior walls (with air walls); (c) aperture; (d) celling; (e) roof; (f) model.
Figure 14.
Solar path/analysis diagram of C−House.
5.2.1. BIM Simulation Process Based on Chinese Standards without Shades
The BIM model without shades for simulation was created as shown in Figure 15; the daily energy consumption figure based on Chinese standards is shown in Figure 16, the cooling energy intensity and heating energy intensity work is shown in Figure 17, and its site and source data are shown in Table 2.
Figure 15.
BIM model without shades.
Figure 16.
The daily energy consumption of C−House based on Chinese standards without shades.
Figure 17.
(a) Cooling energy intensity and (b) heating energy intensity model based on each room.
Table 2.
Site and source energy.
5.2.2. BIM Simulation Process Based on Chinese Standards with Shades
The calculations of energy load and carbon emissions during the simulation process showed notable differences between the model without shades, including its daily energy consumption and heating–cooling intensity model (Figure 18, Figure 19 and Figure 20), which followed Chinese standards, and the model with shades, which likewise followed Chinese standards. Table 3, for site and source energy, shows these variations across a range of values.
Figure 18.
BIM model with shades.
Figure 19.
The daily energy consumption of C−House based on Chinese standards with shades.
Figure 20.
(a) Cooling energy intensity and (b) heating energy intensity model based on each room, along with PV in real context of C-House.
Table 3.
Site and source energy.
5.2.3. The Percentage of and Reduction in Carbon Emissions Evaluated for Both Life Cycles of C-House
C-House has two life cycles, and with full life-cycle circularity, carbon emissions are continuously reduced. For the first-life-cycle carbon emissions, we have the values 82.56/189. 66 × 100% = 43.53%, where we saved 43.53% of carbon emissions. And for the second life cycle, we have the values 75.51/107.10 × 100% = 70.57%, where we saved 70.57% of carbon emissions. So, it was concluded that the more times a prefab building is reused, the longer the life-cycle carbon emissions are reduced. From the above analysis and data, C-House has completed its second life cycle, and now, it is in its third life cycle. If we can continue and close its life-cycle loop in its third life cycle and start its fourth life cycle, the carbon emissions will be reduced again and again. So, this means that the green prefabricated building, while being reused, reduces its carbon emissions.
6. Result and Discussion
To verify the carbon emission dynamic simulation and calculation method, this paper used the carbon emission calculation model and calculation method specified in the “Standard for Building Carbon Emission Calculation” (GBT 51366-2019) issued by the Ministry of Urban–Rural and Construction of China to carry out carbon emission calculations for the above case.
The definition of the whole life-cycle boundary of the building in the calculation was also derived from the Standard for Building Carbon Emission Calculation (GBT 51366-2019).
- The carbon emissions from the production phase of building materials are 156.5023 tCO;
- The carbon emissions from the component manufacturing stage are 5.156798 tCO;
- The carbon emissions from the construction stage are 20.33562 tCO;
- The carbon emissions from the construction stage are 5.118675 tCO;
- The carbon emissions from the disassembling and reuse stage are −82.564 tCO (the first disassembling) and −75.514 tCO (the second disassembling and reuse).
6.1. Analysis of Composition of Carbon Emissions in Each Stage of C-House Construction Process
The building construction process consists of the material preparation stage, component manufacturing stage, logistics transfer stage, and assembly construction stage and can also be called the physical process of the building. We calculated that 82.53% of the carbon emissions are produced in the material preparation stage of the construction process of C-House, 2.72% of the carbon emissions in the component manufacturing stage, 1.34% of the carbon emissions in the logistics transfer stage, and 10.72% of the carbon emissions in the assembly construction stage.
C-House, spanning seven stages versus five conventional stages, is in its third cycle and shows a notable 70.57% decrease in carbon emissions in the second cycle and 43.53% in the first one.
So, it has been concluded that the more times a prefab building is reused, the more the life-cycle carbon emissions will be reduced. From the above analysis and data, C-House has completed its second life cycle, and now, it is in its third life cycle.
6.2. Analysis of Carbon Emission Composition of C-House Component System
Due to the complexity of the interior decoration system and the specificity of C-House equipment, the interior decoration component system and the equipment piping system of the building were not included in the calculation of carbon emissions in this case. As a result, among the remaining component groups of C-House, the structural component system emits 1.828445 tCO, accounting for 33.5% of the carbon emissions during component manufacturing; the envelope component system emits 2.121288 tCO, accounting for 41.27% of the carbon emissions during component manufacturing; and the PV component system emits 1.207066 tCO, accounting for 25.23% of the carbon emissions. The reasons for such composition are as follows: Firstly, C-House is only a two-story residence, and its own structural proportion is not too high. Secondly, C-House has a central core layout; in order to let the living space arranged on all sides receive the best lighting and a sense of permeability, the north and south elevations are designed with a glass curtain wall design, and at the same time, in order to improve the thermal performance of the curtain wall, a triple bridge-breaking glass structure is used, so the enclosure components are not designed with a glass curtain wall. Thirdly, to realize the design purpose of the production capacity building, C-House utilizes the east, west, and roof facades of the building with crystalline silicon photovoltaic panels on the roof and thin film photovoltaic panels on the east and west facades, which make up the PV production capacity system of the building, with 176 photovoltaic panels in total. At the same time, to achieve rapid construction and ensure the safety and reliability of the building in the competition, a separate mounting frame was designed for the PV system, which greatly improved the carbon footprint of the PV component system.
6.3. Analysis of Carbon Emission Reduction Potential of Building Ectopic Retrofitting
Although C-House is a specially designed low-rise residential building, from the very beginning of the design, the possibility of the future relocation of the whole building was considered, and a reversible installation design was established for both the components and the component connection structure; so, it can achieve 99% recyclability, and the total carbon emission is only 10% of the physical process after completing one ectopic retrofitting, while it becomes a carbon-negative building directly after the second ectopic retrofitting. But this provides new ideas for the design of zero-carbon buildings. It is well known that in the field of construction, there are many carbon-saving technologies, but there are very few methods to realize carbon-negative ones, usually only carbon sinks, carbon adsorption materials, and new energy sources, so it is quite difficult to realize zero-carbon buildings. However, by building life extension or ectopic retrofitting to obtain negative carbon in the form of carbon substitution, even a building without special design and with a 30% component loss rate can achieve the zero-carbon status after adopting an appropriate carbon-reduction design and carrying out two ectopic retrofittings. While scenarios like ex situ retrofitting are extremely rare, building life extension can be scaled up to a large scale.
7. Conclusions
This study examines building performance optimization strategies based on BIM digital technology, focusing on the possibility of performing carbon emission assessments of prefabricated buildings through digital technology. By modeling the BIM model with high accuracy, the performance simulation of the building in design, production, construction, operation, and maintenance phases can be realized to calculate the carbon emissions of the building and discover the possible factors that increase the carbon emissions. We chose C-House, a case project with very distinctive features, as the building has gone through multiple life-cycle stages (including production, transshipment, three construction, two deconstruction, operation, and maintenance stages), to build a component-based BIM model to fully simulate and calculate the carbon emission values. If the life cycle of the building is extended and the durability of all types of building components is increased, the ability to reduce carbon emissions is particularly obvious, which is important for the subsequent further reduction in carbon emissions to improve building performance.
The pivotal outcomes derived from the seven-stage life cycle, analysis, and subsequent conclusions can be succinctly summarized as follows:
- The findings describe the life cycle of C-House, spanning seven stages versus five conventional stages. Now in its third cycle, C-House shows a notable 70.57% decrease in carbon emissions in the second cycle and 43.53% in the first one. This pattern underscores how the extended reuse of prefabricated buildings diminishes emissions over time, highlighting their potential environmental benefits.
- The report also highlights important metrics supporting the decrease in carbon emissions: PV panel integration combined with wooden interior accents to generate energy. Strategic positioning among trees additionally diminishes emissions.
- This paper emphasizes the crucial role of long-term environmental sustainability in building design decisions. Leveraging digital tools like BIM enables the precise modeling of building performance, promoting smart and green design construction strategies. Future studies should enhance simulation modeling and explore machine learning and IoT sensors for real-time data validation. BIM-based strategies can foster low-carbon, eco-friendly construction practices, yielding energy efficient, socially sustainable buildings.
Author Contributions
Data curation, H.U., B.H. and Y.G.; Writing—original draft, H.U.; Writing—review and editing, H.Z. and H.U. All authors have read and agreed to the published version of the manuscript.
Funding
This research was funded by National Key R&D Program of China—Strategic Scientific and Technological Innovation Cooperation “Joint Research and Demonstration of Green Low-carbon Renovation of Existing Buildings and the Technology of Carbon Neutralization”—grant number 2022YFE0208600.
Data Availability Statement
Dataset is available on request from the authors.
Conflicts of Interest
The authors declare no conflicts of interest.
Appendix A
Table A1, Table A2, Table A3, Table A4, Table A5, Table A6 in Appendix A show the total carbon emissions calculated to streamline the statistical analysis in Section 4.4, which is focused on the detailed life-cycle assessment of C-House and includes information on building material production, component manufacturing, and the detailed seven stages of the life-cycle ectopic retrofittings.
Table A1.
Life-cycle carbon emission table of C-House for material production stage.
Table A1.
Life-cycle carbon emission table of C-House for material production stage.
| Category | Material | Amount | Weight (t) | Material Carbon Emission Factor (tCO2/t) | Carbon Emissions (tCO2) |
|---|---|---|---|---|---|
| External wall insulation materials | Rock wool | 16 | 2.65 | 0.350 | 0.9275 |
| External wall panels 2460 | Oriented strand board (OSB)-2460 | 4 | 1.67 | 4.600 | 7.682 |
| External wall panel C-shaped steel | Steel-Q235 | 40 | 0.94 | 2.35 | 2.209 |
| H-welded steel—200 × 200 × 6 × 8 | Lightweight steel | 43 | 3.16 | 2.31 | 7.2996 |
| East gate | Glass | 2 | 0.15 | 0.760 | 0.114 |
| Cold-formed hollow steel—square column, F200 × 200 × 4.0 | Lightweight steel | 16 | 6.66 | 2.31 | 15.3846 |
| External wall panel surface layer steel plate | Aluminum | 8 | 0.47 | 2.480 | 1.1656 |
| I-beam lining plate | Steel-Q345 | 26 | 0.20 | 2.35 | 0.47 |
| Dark curtain wall glass—834 × 2255 | Curtain wall glass | 2 | 0.16 | 0.760 | 0.1216 |
| Glazed curtain wall glass—336 × 2255 | Curtain wall glass | 2 | 0.07 | 0.960 | 0.0672 |
| Curtain wall aluminum cover plate | Aluminum | 18 | 0.18 | 2.480 | 0.4464 |
| Cold-formed hollow steel—square, B60 × 60 × 4.0 | Lightweight steel | 154 | 4.93 | 2.31 | 11.3883 |
| Cold-formed hollow steel—square, B180 × 180 × 4.0 | Lightweight steel | 25 | 3.26 | 2.31 | 7.5306 |
| Beam–column connection component-1: beam–column connection component-200 | Lightweight steel | 50 | 0.39 | 2.31 | 0.9009 |
| Rectangular square steel pipe—horizontal: rectangular square steel pipe—horizontal | Lightweight steel | 16 | 0.13 | 2.31 | 0.3003 |
| Rectangular square steel pipe—vertical: rectangular square steel pipe—vertical | Steel-Q235 | 12 | 0.38 | 2.35 | 0.893 |
| 56.9006 (tCO2) | |||||
| Roof enclosure structure | |||||
| The roof truss wall is connected to the roof | Oriented strand board (OSB) | 2 | 2.30 | 4.600 | 10.58 |
| Oriented strand board (OSB) | 1 | 2.30 | 4.600 | 10.58 | |
| Lightweight steel | 1 | 7.18 | 2.31 | 16.5858 | |
| Angle steel: L75 × 90 | Lightweight steel | 73 | 1.21 | 2.31 | 2.7951 |
| 40.5409 (tCO2) | |||||
| PV board | |||||
| PV board fixture | Aluminum | 568 | 0.05 | 2.480 | 0.124 |
| PV board glass panel | Glass | 168 | 2.22 | 0.350 | 0.777 |
| PV board C-shaped steel keel | Lightweight steel | 54 | 0.80 | 2.35 | 1.88 |
| Cold-formed hollow steel—rectangular column, J200 × 150 × 4.0 | Lightweight steel | 12 | 4.05 | 2.31 | 9.3555 |
| Ordinary A-grade hexagonal head bolt: M12 | Steel-Q345 | 576 | 0.10 | 2.35 | 0.235 |
| Beam–column connection components | Steel-Q345 | 64 | 0.54 | 2.35 | 1.269 |
| Keelbe-E | Steel-Q345 | 2 | 5.36 | 2.35 | 12.596 |
| 26.2365 (tCO2) | |||||
| North South Glass Curtain Wall | |||||
| North–south gate | Stainless steel | 4 | 0.00 | 1446.390 | 0 |
| I-shaped steel strip cushion plate: I-shaped steel beam | Steel-Q235 | 6 | 1.84 | 2.35 | 4.324 |
| Curtain wall glass: dark-colored c wall glass | Curtain wall glass | 48 | 1.67 | 0.960 | 1.6032 |
| Curtain wall glass aluminum cover plate | Aluminum | 72 | 0.11 | 2.480 | 0.2728 |
| Curtain wall glass keel: wall glass keel | Steel-Q235 | 232 | 0.15 | 2.35 | 0.3525 |
| Curtain wall structural connectors | Steel-Q235 | 68 | 0.50 | 2.35 | 1.175 |
| Curtain wall aluminum cover plate | Aluminum | 48 | 4.14 | 2.480 | 10.2672 |
| Rectangular square steel pipe—horizontal | Steel-Q235 | 212 | 1.36 | 2.35 | 3.196 |
| Rectangular square steel pipe—vertical | Steel-Q235 | 86 | 2.18 | 2.35 | 5.123 |
| Bolts: bolts | Steel-Q235 | 176 | 0.06 | 2.35 | 0.141 |
| 26.4547 (tCO2) | |||||
| Core tube—multi-category material extraction | |||||
| Basic wall: core interior partition wall—80 | Pine | 12 | 2.35 | 2.180 | 5.123 |
| Basic wall: core surface layer—15 | Plastic | 9 | 0.72 | 1.580 | 1.1376 |
| Wooden structural beam: wooden structural beam—80 × 146 | Wooden | 4 | 0.05 | 2.180 | 0.109 |
| 6.3696 (tCO2) | |||||
| Total amount of carbon emission in all categories of materials (tCO2) | 156.5023 | ||||
Table A2.
Life-cycle carbon emission table of C-House for component manufacturing stage.
Table A2.
Life-cycle carbon emission table of C-House for component manufacturing stage.
| Category | Component Type | Type of Secondary Components | Number | Workers | Processing Time/Day | Processing Energy | Energy Carbon Emission Factor (tCO2/t) | Carbon Emissions from Processing Equipment (t CO2) |
|---|---|---|---|---|---|---|---|---|
| Structural component | Column | 10 mm column base plate—8 holes: 10 mm | 16 | 1 | 2 | 20 | 0.8112 | 0.259584 |
| Beam–column connecting components-200 | 50 | 1 | 6.25 | 20 | 0.8112 | 0.8112 | ||
| Rectangular square steel tube—column | 16 | 2 | 2 | 8 | 0.8112 | 0.1038336 | ||
| Beam | Rectangular square steel tube—beam | 12 | 2 | 1.5 | 8 | 0.8112 | 0.0778752 | |
| Angle steel: L75 × 9071 | 2 | 8.875 | 10 | 0.8112 | 0.575952 | |||
| 1.828445 (tCO2) | ||||||||
| Envelope component | Outside wall | C-House exterior wall panel 2460-2110 | 8 | 6 | 24 | 240 | 1.6224 | 0.778752 |
| Eastern door | 1 | 3 | 1.5 | 60 | 0.8112 | 0.048672 | ||
| Roof | Basic roof: C-House roof | 1 | 8 | 24 | 390 | 0.8112 | 0.316368 | |
| Curtain wall | Dark curtain wall glass—834 × 2255 | 31 | 10 | 14 | 95 | 4.056 | 0.48672 | |
| Glazed curtain wall glass—336 × 2255 | 31 | 8 | 11.875 | 65 | 3.2448 | 0.476218 | ||
| Folding door: southern door | 1 | 3 | 1.5 | 40 | 0.8112 | 0.032448 | ||
| 2.121288 (tCO2) | ||||||||
| PV energy component | PV support frame | Cold-formed hollow section steel—rectangular column: J200 × 150 × 4.0 | 12 | 2 | 1.5 | 8 | 0.8112 | 0.0778752 |
| Photovoltaic panel C-shaped steel keel: C-shaped steel keel-A | 16 | 2 | 2 | 8 | 0.8112 | 0.1038336 | ||
| Photovoltaic panel C-shaped steel keel: C-shaped steel keel-A2 | 16 | 2 | 2 | 8 | 0.8112 | 0.1038336 | ||
| Photovoltaic panel C-shaped steel keel: C-shaped steel keel-A3 | 10 | 2 | 1.25 | 8 | 0.8112 | 0.064896 | ||
| Photovoltaic panel C-shaped steel keel: C-shaped steel keel-B | 12 | 2 | 1.5 | 8 | 0.8112 | 0.0778752 | ||
| Beam–column connecting member-1: beam–column connecting member-150 | 52 | 1 | 6.5 | 15 | 0.8112 | 0.632736 | ||
| Beam–column connecting member-1: beam–column connecting member-170 | 12 | 1 | 1.5 | 15 | 0.8112 | 0.146016 | ||
| 1.207066 (tCO2) | ||||||||
| Total amount of carbon emission in component manufacturing stage (tCO2) | 5.156798 | |||||||
Table A3.
Life-cycle carbon emission table of C-House for component transportation stage.
Table A3.
Life-cycle carbon emission table of C-House for component transportation stage.
| Category | Loading and Unloading Personnel | Workers | Days | Distance (km) | Energy Consumption | Carbon Emission Factor (tCO2) | Carbon Emissions (tCO2) |
|---|---|---|---|---|---|---|---|
| Flatbed truck (80 t) | 4 | 2 | 2 | 740.5 | 126.78 | 4 | 1.81424 |
| Flatbed truck (80 t) | 4 | 1 | 1 | 6.9 | 15 | 4 | 0.73 |
| Total amount of carbon emissions in component transportation stage (tCO2) | 2.54424 | ||||||
Table A4.
Life-cycle carbon emission table of C-House for construction stage.
Table A4.
Life-cycle carbon emission table of C-House for construction stage.
| Category | Number | Equipment Amount | Energy Consumption | Duration of Use | Carbon Emission Factor | Carbon Emissions (tCO2) |
|---|---|---|---|---|---|---|
| Workers | 8 | - | - | 28 | 0.05 | 11.2 |
| 80-ton truck crane | 1 | 1 | 64.38 | 20 | 0.8112 | 2.04450112 |
| Mobile lifting platform | - | 2 | 45.66 | 26 | 0.8112 | 1.926048384 |
| Cutting machine | - | 1 | 4.8 | 7 | 0.8112 | 0.02725632 |
| Woodworking saw | - | 1 | 24 | 7 | 0.8112 | 0.1362816 |
| AC welding machine | - | 3 | 87.2 | 21 | 0.8112 | 4.45640832 |
| Electric wrench | - | 6 | 2.4 | 28 | 0.8112 | 0.32707584 |
| Electric drill | - | 2 | 4.8 | 28 | 0.8112 | 0.21805056 |
| Total amount of carbon emissions in construction stage (tCO2) | 20.33562 | |||||
Table A5.
Life-cycle carbon emission table of C-House for operation stage.
Table A5.
Life-cycle carbon emission table of C-House for operation stage.
| Category | Electricity Production | Electricity Use |
|---|---|---|
| August 2018 (the first month after completion) (kWh) | 2982 | 2091 |
| Annual estimate (kWh) | 11928 | 10455 |
| Average annual power generation (kWh) | 1473 | |
| Energy savings from 2018 to present (kWh) | 7365 | |
| Total amount of carbon emissions in operation stage (tCO2) | 5.118675 (tCO2) | |
| Carbon emissions of electricity in Jiangsu Province = 0.695 kgCO2/kWh | ||
Table A6.
Life-cycle carbon emission table of C-House for disassembling and reuse stage.
Table A6.
Life-cycle carbon emission table of C-House for disassembling and reuse stage.
| Category | Material Production Stage (tCO2) | Component Manufacturing Stage (tCO2) | Component Transportation Stage (tCO2) | Construction Stage (tCO2) | Operation Stage (tCO2) | Disassembling and Reuse Stage (tCO2) | First Recycling Process’ Carbon Savings (tCO2) |
|---|---|---|---|---|---|---|---|
| First disassembling and reuse | 22.507 | 0.968 | 0.73 | 39.443 | −3.49 | −142.722 | −82.564 (tCO2) |
| Second disassembling and reuse | 20.235 | 0.993 | 7.256 | 40.025 | −2.35 | −141.673 | −75.514 (tCO2) |
Figure A1.
Prefabricated structural components of C-House.
Figure A2.
(a–c) Assembling/construction of prefabricated structural components of C-House.
References
- Orstavik, F.; Dainty, A.R.; Abbott, C. Construction Innovation; John Wiley & Sons: New York, NY, USA, 2015. [Google Scholar]
- Zhou, S. Platforming for industrialized building: A comparative case study of digitally-enabled product platforms. Build. Res. Inf. 2024, 52, 4–18. [Google Scholar] [CrossRef]
- Sepasgozar, S.M.; Khan, A.A.; Smith, K.; Romero, J.G.; Shen, X.; Shirowzhan, S.; Li, H.; Tahmasebinia, F. BIM and digital twin for developing convergence technologies as future of digital construction. Buildings 2023, 13, 441. [Google Scholar] [CrossRef]
- Saad, S.; Alaloul, W.S.; Ammad, S.; Qureshi, A.H. A qualitative conceptual framework to tackle skill shortages in offsite construction industry: A scientometric approach. Eng. Constr. Archit. Manag. 2022, 29, 3917–3947. [Google Scholar] [CrossRef]
- Mital, A.; Pennathur, A. Advanced technologies and humans in manufacturing workplaces: An interdependent relationship. Int. J. Ind. Ergon. 2004, 33, 295–313. [Google Scholar] [CrossRef]
- Martin, L.; Perry, F. Sustainable construction technology adoption. In Sustainable Construction Technologies; Elsevier: Amsterdam, The Netherlands, 2019; pp. 299–316. [Google Scholar]
- Shen, L.y.; Tam, V.W.; Tam, L.; Ji, Y.b. Project feasibility study: The key to successful implementation of sustainable and socially responsible construction management practice. J. Clean. Prod. 2010, 18, 254–259. [Google Scholar] [CrossRef]
- Fu, Y.; Wang, H.; Sun, W.; Zhang, X. New dimension to green buildings: Turning green into occupant well-being. Buildings 2021, 11, 534. [Google Scholar] [CrossRef]
- Peters, T.; Halleran, A. How our homes impact our health: Using a COVID-19 informed approach to examine urban apartment housing. Archnet-IJAR Int. J. Archit. Res. 2021, 15, 10–27. [Google Scholar] [CrossRef]
- Cao, D.; Wang, G.; Li, H.; Skitmore, M.; Huang, T.; Zhang, W. Practices and effectiveness of building information modelling in construction projects in China. Autom. Constr. 2015, 49, 113–122. [Google Scholar] [CrossRef]
- Costa, G.; Madrazo, L. Connecting building component catalogues with BIM models using semantic technologies: An application for precast concrete components. Autom. Constr. 2015, 57, 239–248. [Google Scholar] [CrossRef]
- Cohen, M.J. The Future of Consumer Society: Prospects for Sustainability in the New Economy; Oxford University Press: Oxford, UK, 2016. [Google Scholar]
- Pereira, V.; Santos, J.; Leite, F.; Escórcio, P. Using BIM to improve building energy efficiency—A scientometric and systematic review. Energy Build. 2021, 250, 111292. [Google Scholar] [CrossRef]
- Liang, N.; Yu, M. Research on design optimization of prefabricated residential houses based on BIM technology. Sci. Program. 2021, 2021, 1422680. [Google Scholar] [CrossRef]
- Xiao, Y.; Bhola, J. Design and optimization of prefabricated building system based on BIM technology. Int. J. Syst. Assur. Eng. Manag. 2022, 13, 111–120. [Google Scholar] [CrossRef]
- Ji, Y.; Chang, S.; Qi, Y.; Li, Y.; Li, H.X.; Qi, K. A BIM-based study on the comprehensive benefit analysis for prefabricated building projects in China. Adv. Civ. Eng. 2019, 2019, 3720191. [Google Scholar] [CrossRef]
- Ma, G.; Jiang, J.; Shang, S. Visualization of component status information of prefabricated concrete building based on building information modeling and radio frequency identification: A case study in China. Adv. Civ. Eng. 2019, 2019, 6870507. [Google Scholar] [CrossRef]
- Wu, X. Wireless management system of prefabricated construction materials based on BIM technology. Eurasip J. Wirel. Commun. Netw. 2021, 2021, 116. [Google Scholar] [CrossRef]
- Fountain, J.; Langar, S. Building Information Modeling (BIM) outsourcing among general contractors. Autom. Constr. 2018, 95, 107–117. [Google Scholar] [CrossRef]
- Liu, Y. Green building design based on building information modeling technology. Agro Food Ind. Hi-Tech 2017, 28, 1307–1311. [Google Scholar]
- Liu, H.; Lu, M.; Al-Hussein, M. Ontology-based semantic approach for construction-oriented quantity take-off from BIM models in the light-frame building industry. Adv. Eng. Inform. 2016, 30, 190–207. [Google Scholar] [CrossRef]
- Liu, H.; Sydora, C.; Altaf, M.S.; Han, S.; Al-Hussein, M. Towards sustainable construction: BIM-enabled design and planning of roof sheathing installation for prefabricated buildings. J. Clean. Prod. 2019, 235, 1189–1201. [Google Scholar] [CrossRef]
- Kuncham, K. Timelining the Construction in Immersive Virtual Reality System Using BIM Application. Ph.D. Thesis, Texas A&M University, College Station, TX, USA, 2013. [Google Scholar]
- Czmoch, I.; Pękala, A. Traditional design versus BIM based design. Procedia Eng. 2014, 91, 210–215. [Google Scholar] [CrossRef]
- Poirier, E.A.; Forgues, D.; Staub-French, S. Understanding the impact of BIM on collaboration: A Canadian case study. Build. Res. Inf. 2017, 45, 681–695. [Google Scholar] [CrossRef]
- Umar, U.A.; Shafiq, N.; Malakahmad, A.; Nurudin, M.F.; Khamidi, M.F.; Farhan, S.A.; Gardezi, S.S.S. 4D BIM application in AEC industry: Impact on integrated project delivery. Res. J. Appl. Sci. Eng. Technol. 2015, 10, 547–552. [Google Scholar] [CrossRef]
- Singh, R.; Gehlot, A.; Akram, S.V.; Gupta, L.R.; Jena, M.K.; Prakash, C.; Singh, S.; Kumar, R. Cloud manufacturing, internet of things-assisted manufacturing and 3D printing technology: Reliable tools for sustainable construction. Sustainability 2021, 13, 7327. [Google Scholar] [CrossRef]
- Chang, Y.; Li, X.; Masanet, E.; Zhang, L.; Huang, Z.; Ries, R. Unlocking the green opportunity for prefabricated buildings and construction in China. Resour. Conserv. Recycl. 2018, 139, 259–261. [Google Scholar] [CrossRef]
- Nguyen, T.D.; Adhikari, S. The role of bim in integrating digital twin in building construction: A literature review. Sustainability 2023, 15, 10462. [Google Scholar] [CrossRef]
- Raouf, A.M.; Al-Ghamdi, S.G. Building information modelling and green buildings: Challenges and opportunities. Archit. Eng. Des. Manag. 2019, 15, 1–28. [Google Scholar] [CrossRef]
- Zheng, H.; Yang, S.; Lou, S.; Gao, Y.; Feng, Y. Knowledge-based integrated product design framework towards sustainable low-carbon manufacturing. Adv. Eng. Inform. 2021, 48, 101258. [Google Scholar] [CrossRef]
- Huang, Y.; Wang, A. Research on Carbon Emission of Prefabricated Structure in China. Buildings 2023, 13, 1348. [Google Scholar] [CrossRef]
- Finnveden, G.; Hauschild, M.Z.; Ekvall, T.; Guinée, J.; Heijungs, R.; Hellweg, S.; Koehler, A.; Pennington, D.; Suh, S. Recent developments in life cycle assessment. J. Environ. Manag. 2009, 91, 1–21. [Google Scholar] [CrossRef]
- Bonamente, E.; Merico, M.C.; Rinaldi, S.; Pignatta, G.; Pisello, A.; Cotana, F.; Nicolini, A. Environmental impact of industrial prefabricated buildings: Carbon and energy footprint analysis based on an LCA approach. Energy Procedia 2014, 61, 2841–2844. [Google Scholar] [CrossRef]
- Achenbach, H.; Wenker, J.L.; Rüter, S. Life cycle assessment of product-and construction stage of prefabricated timber houses: A sector representative approach for Germany according to EN 15804, EN 15978 and EN 16485. Eur. J. Wood Wood Prod. 2018, 76, 711–729. [Google Scholar] [CrossRef]
- Liu, G.; Gu, T.; Xu, P.; Hong, J.; Shrestha, A.; Martek, I. A production line-based carbon emission assessment model for prefabricated components in China. J. Clean. Prod. 2019, 209, 30–39. [Google Scholar] [CrossRef]
- GB/T 51366-2019; Standard for Building Carbon Emission Calculation. Building Press: Beijing, China, 2019.
Disclaimer/Publisher’s Note: The statements, opinions and data contained in all publications are solely those of the individual author(s) and contributor(s) and not of MDPI and/or the editor(s). MDPI and/or the editor(s) disclaim responsibility for any injury to people or property resulting from any ideas, methods, instructions or products referred to in the content. |
© 2024 by the authors. Licensee MDPI, Basel, Switzerland. This article is an open access article distributed under the terms and conditions of the Creative Commons Attribution (CC BY) license (https://creativecommons.org/licenses/by/4.0/).