
Bearing Capacity and Reinforced Mechanisms of Horizontal–Vertical Geogrid in Foundations: PFC3D Study


Abstract
1. Introduction
2. Methodology
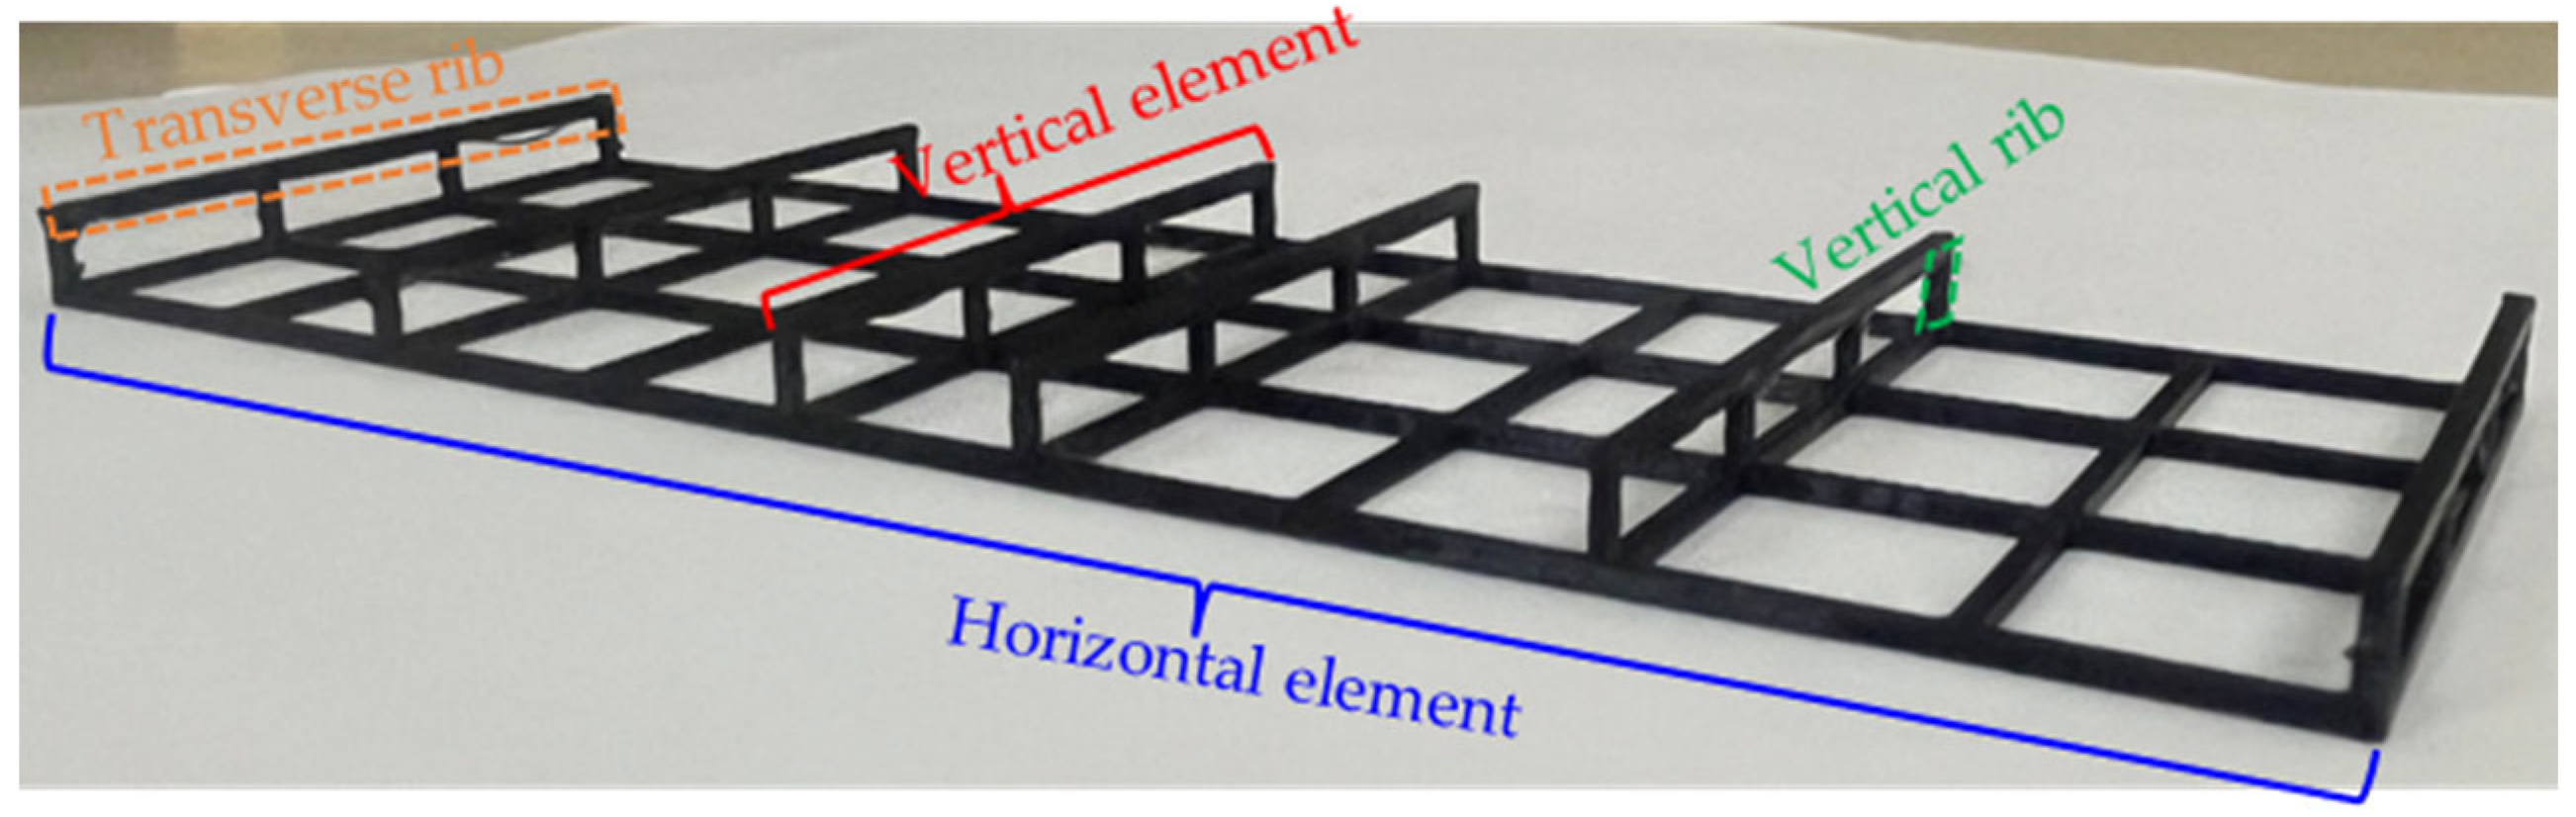
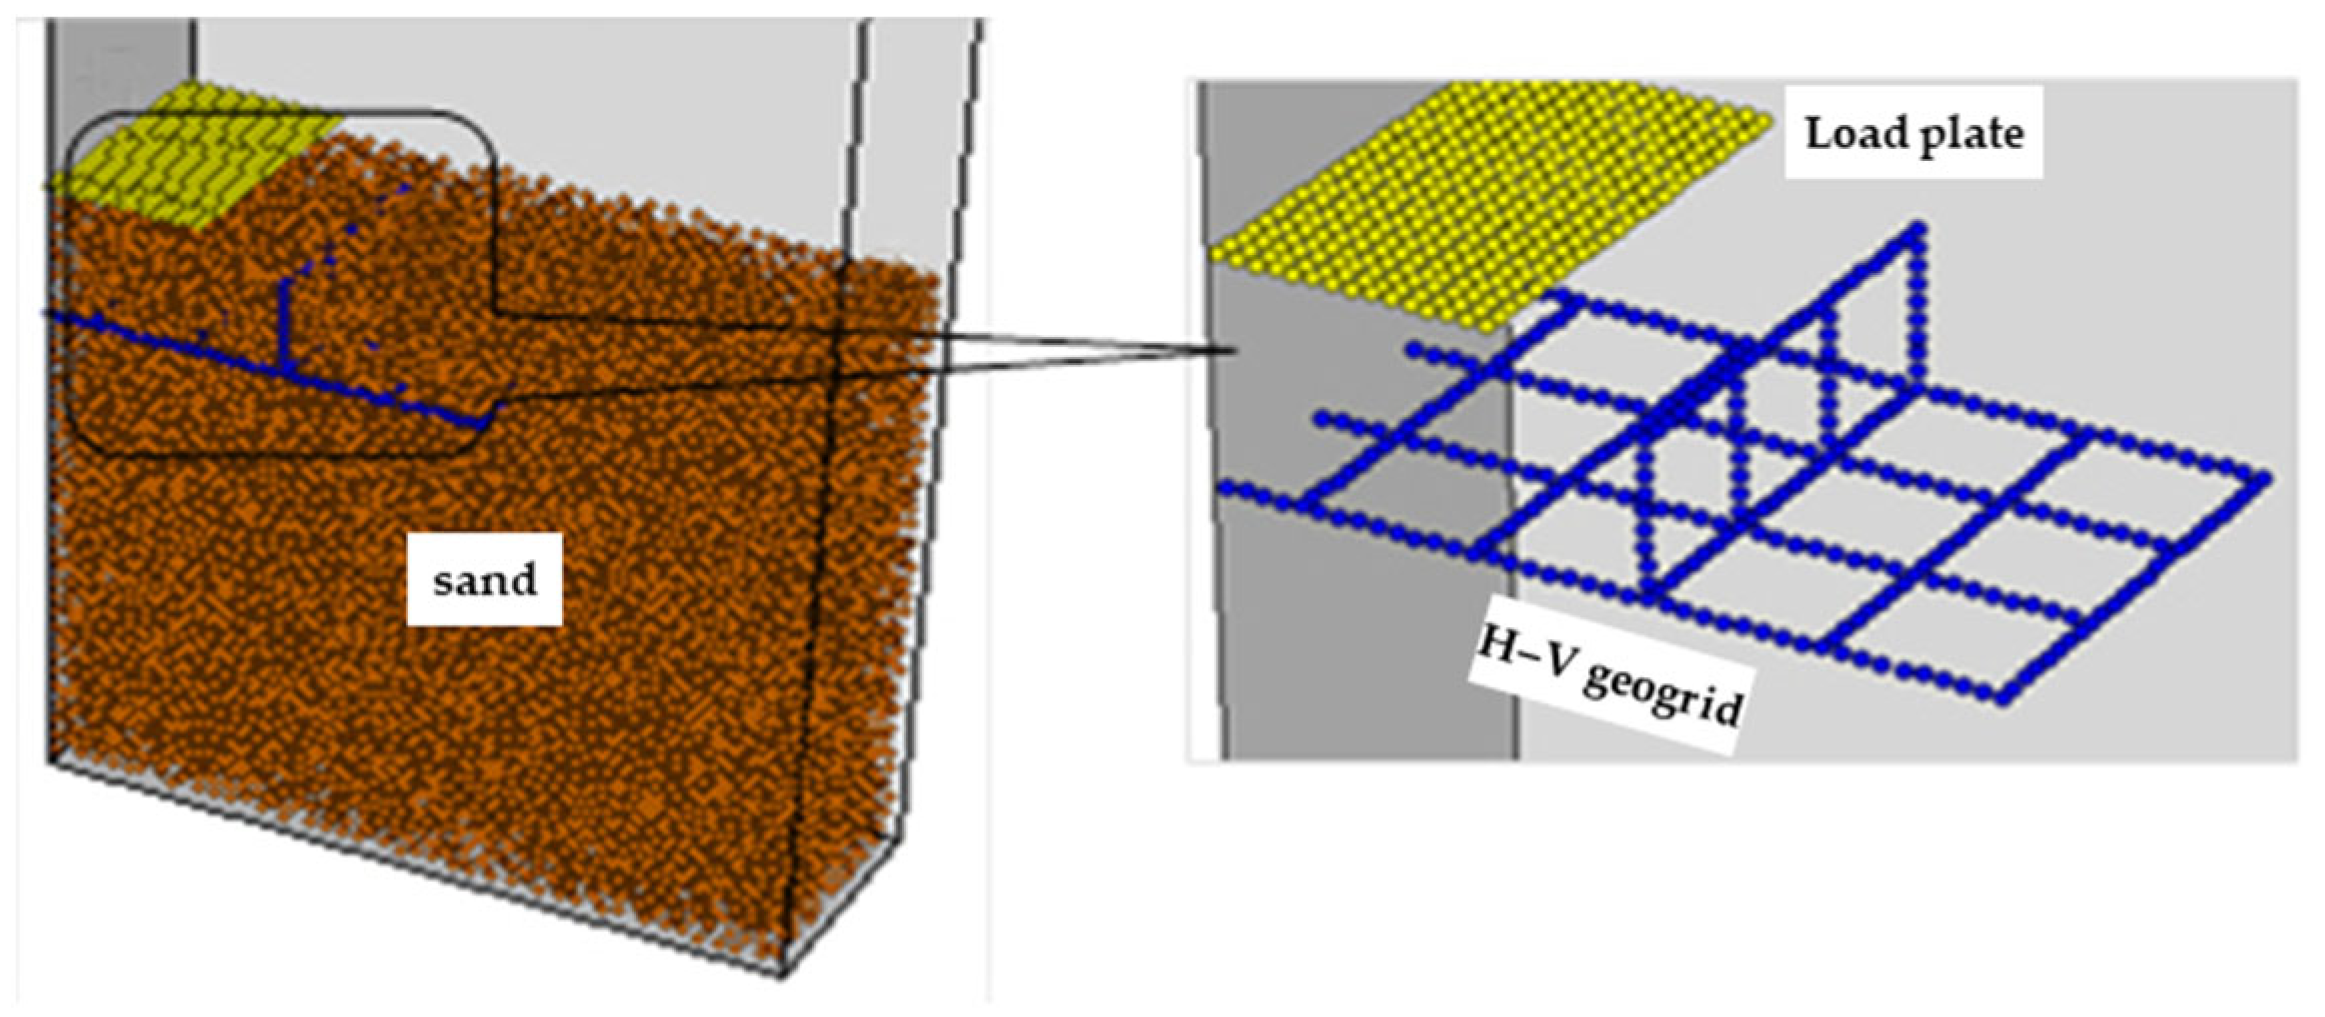
2.1. DEM Model
2.2. Boundary Condition
2.3. Parameters Calibration
3. Results and Discussion
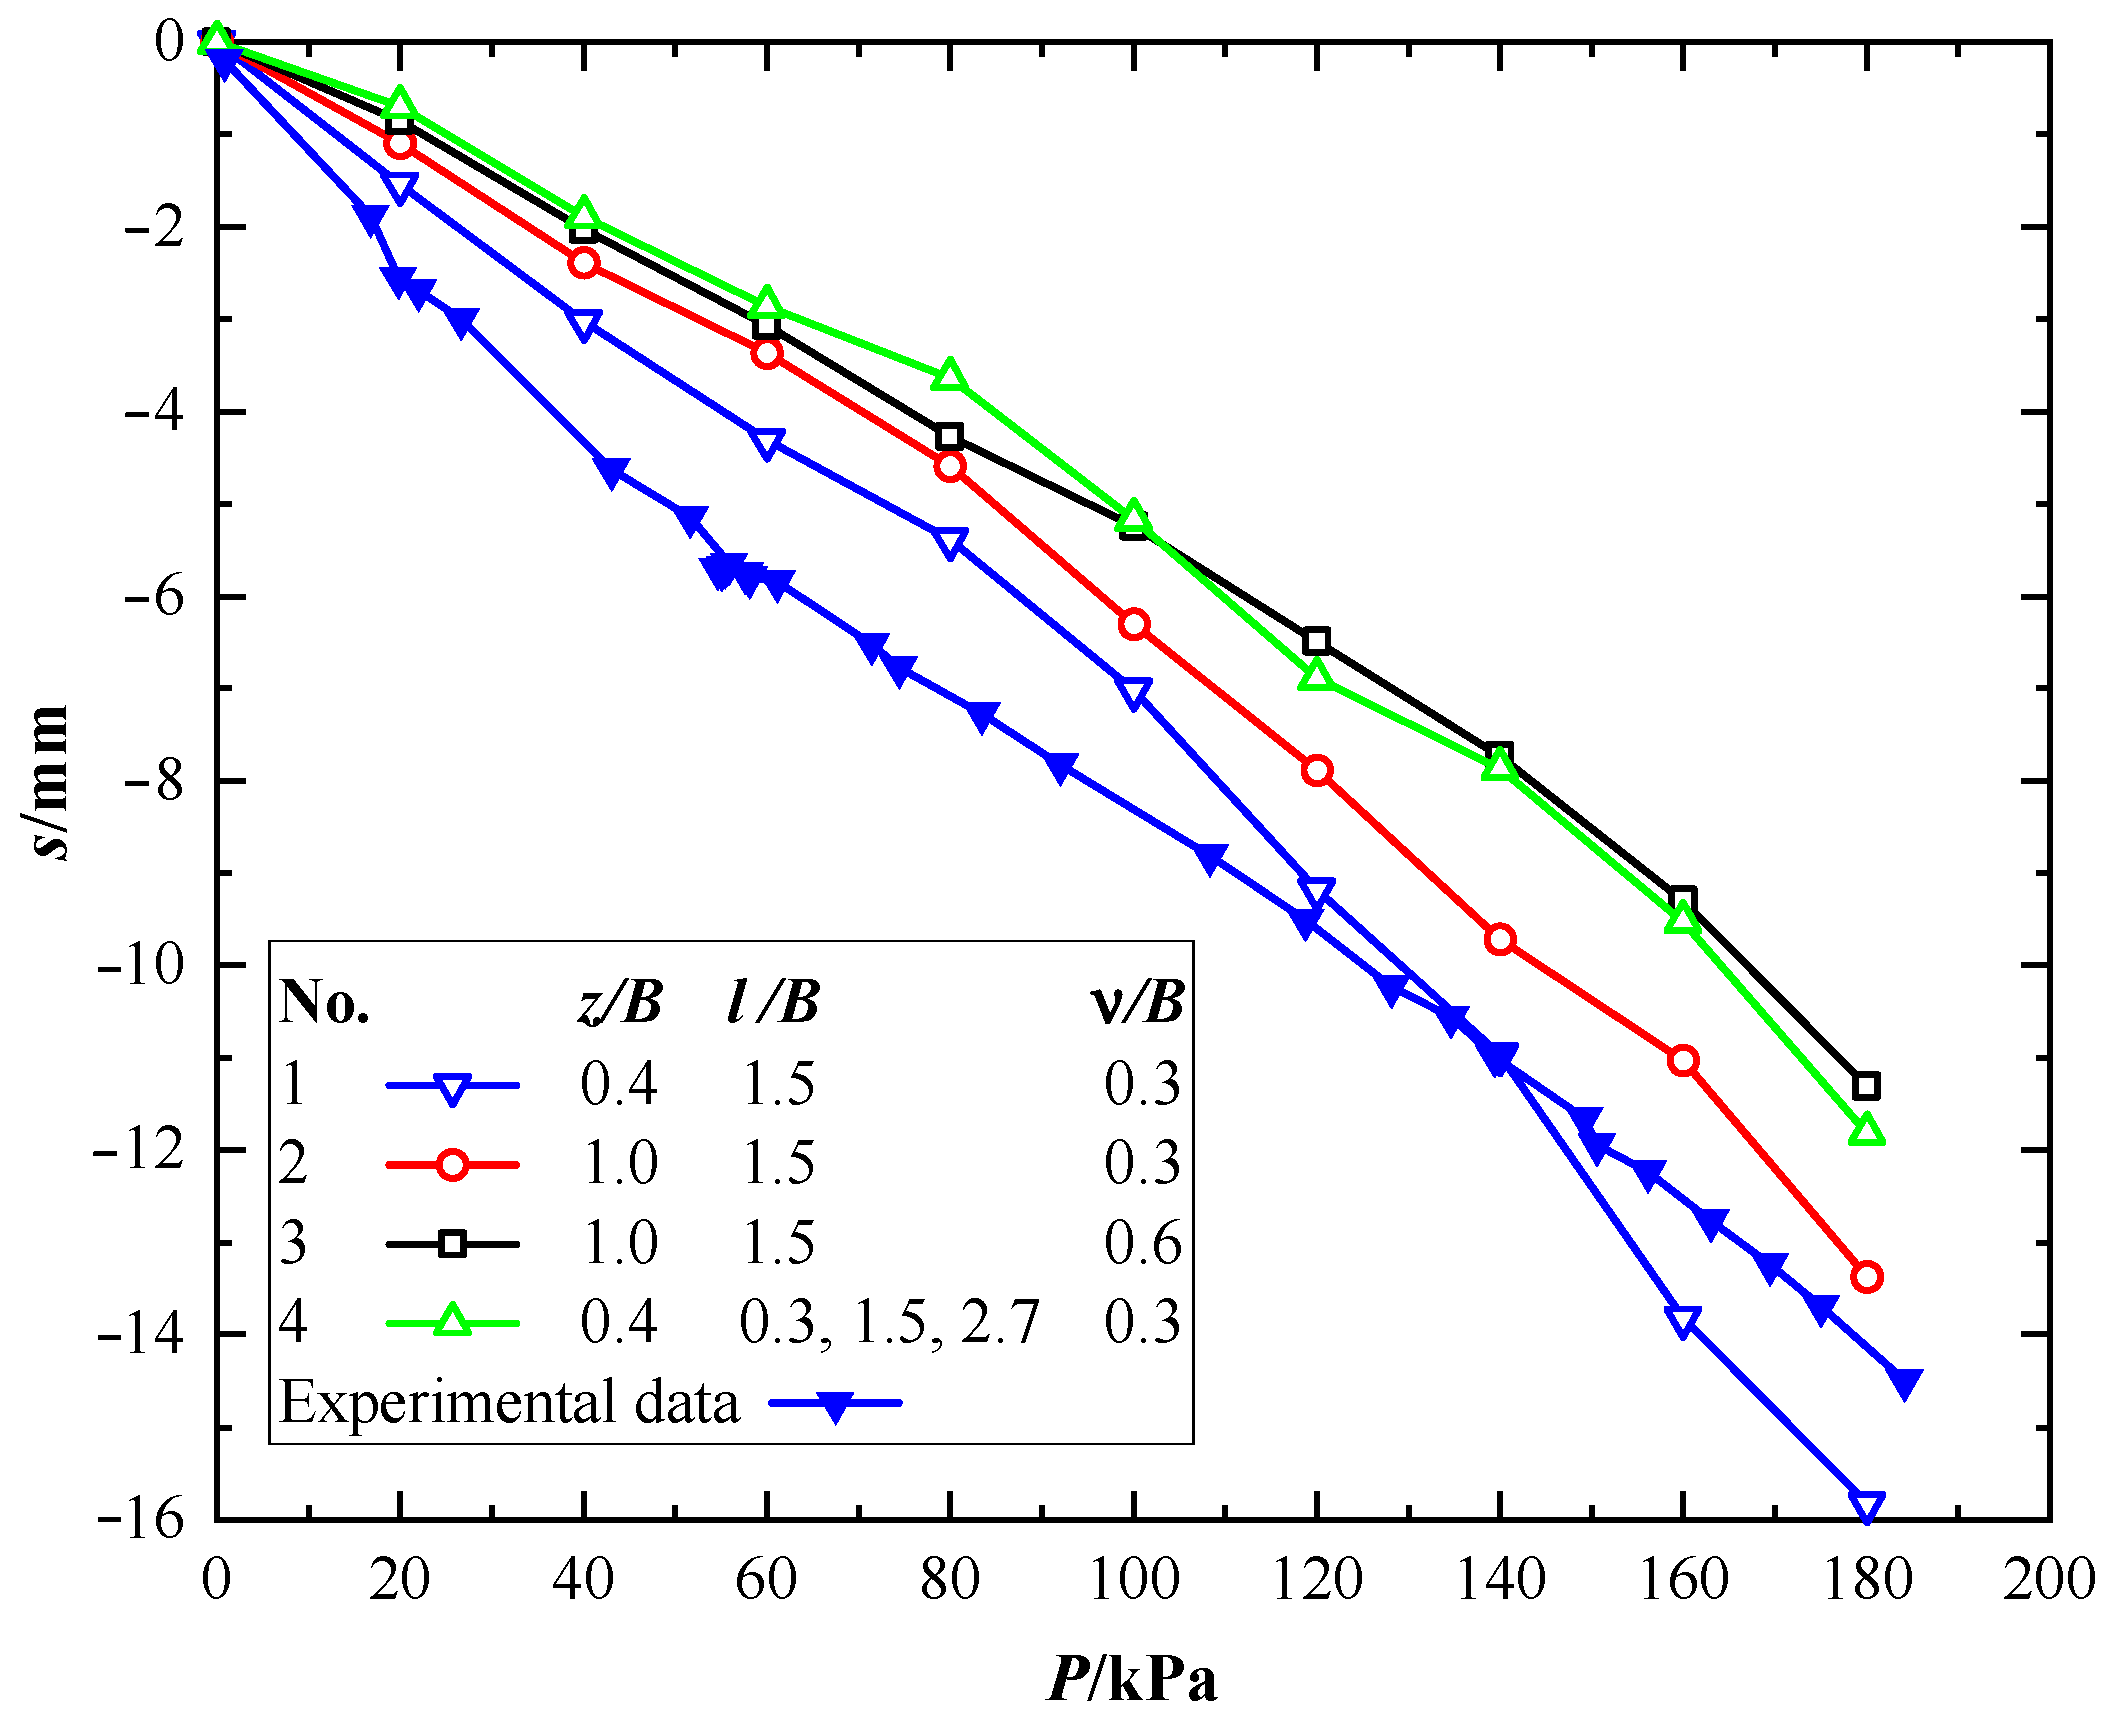
3.1. P–s Curves
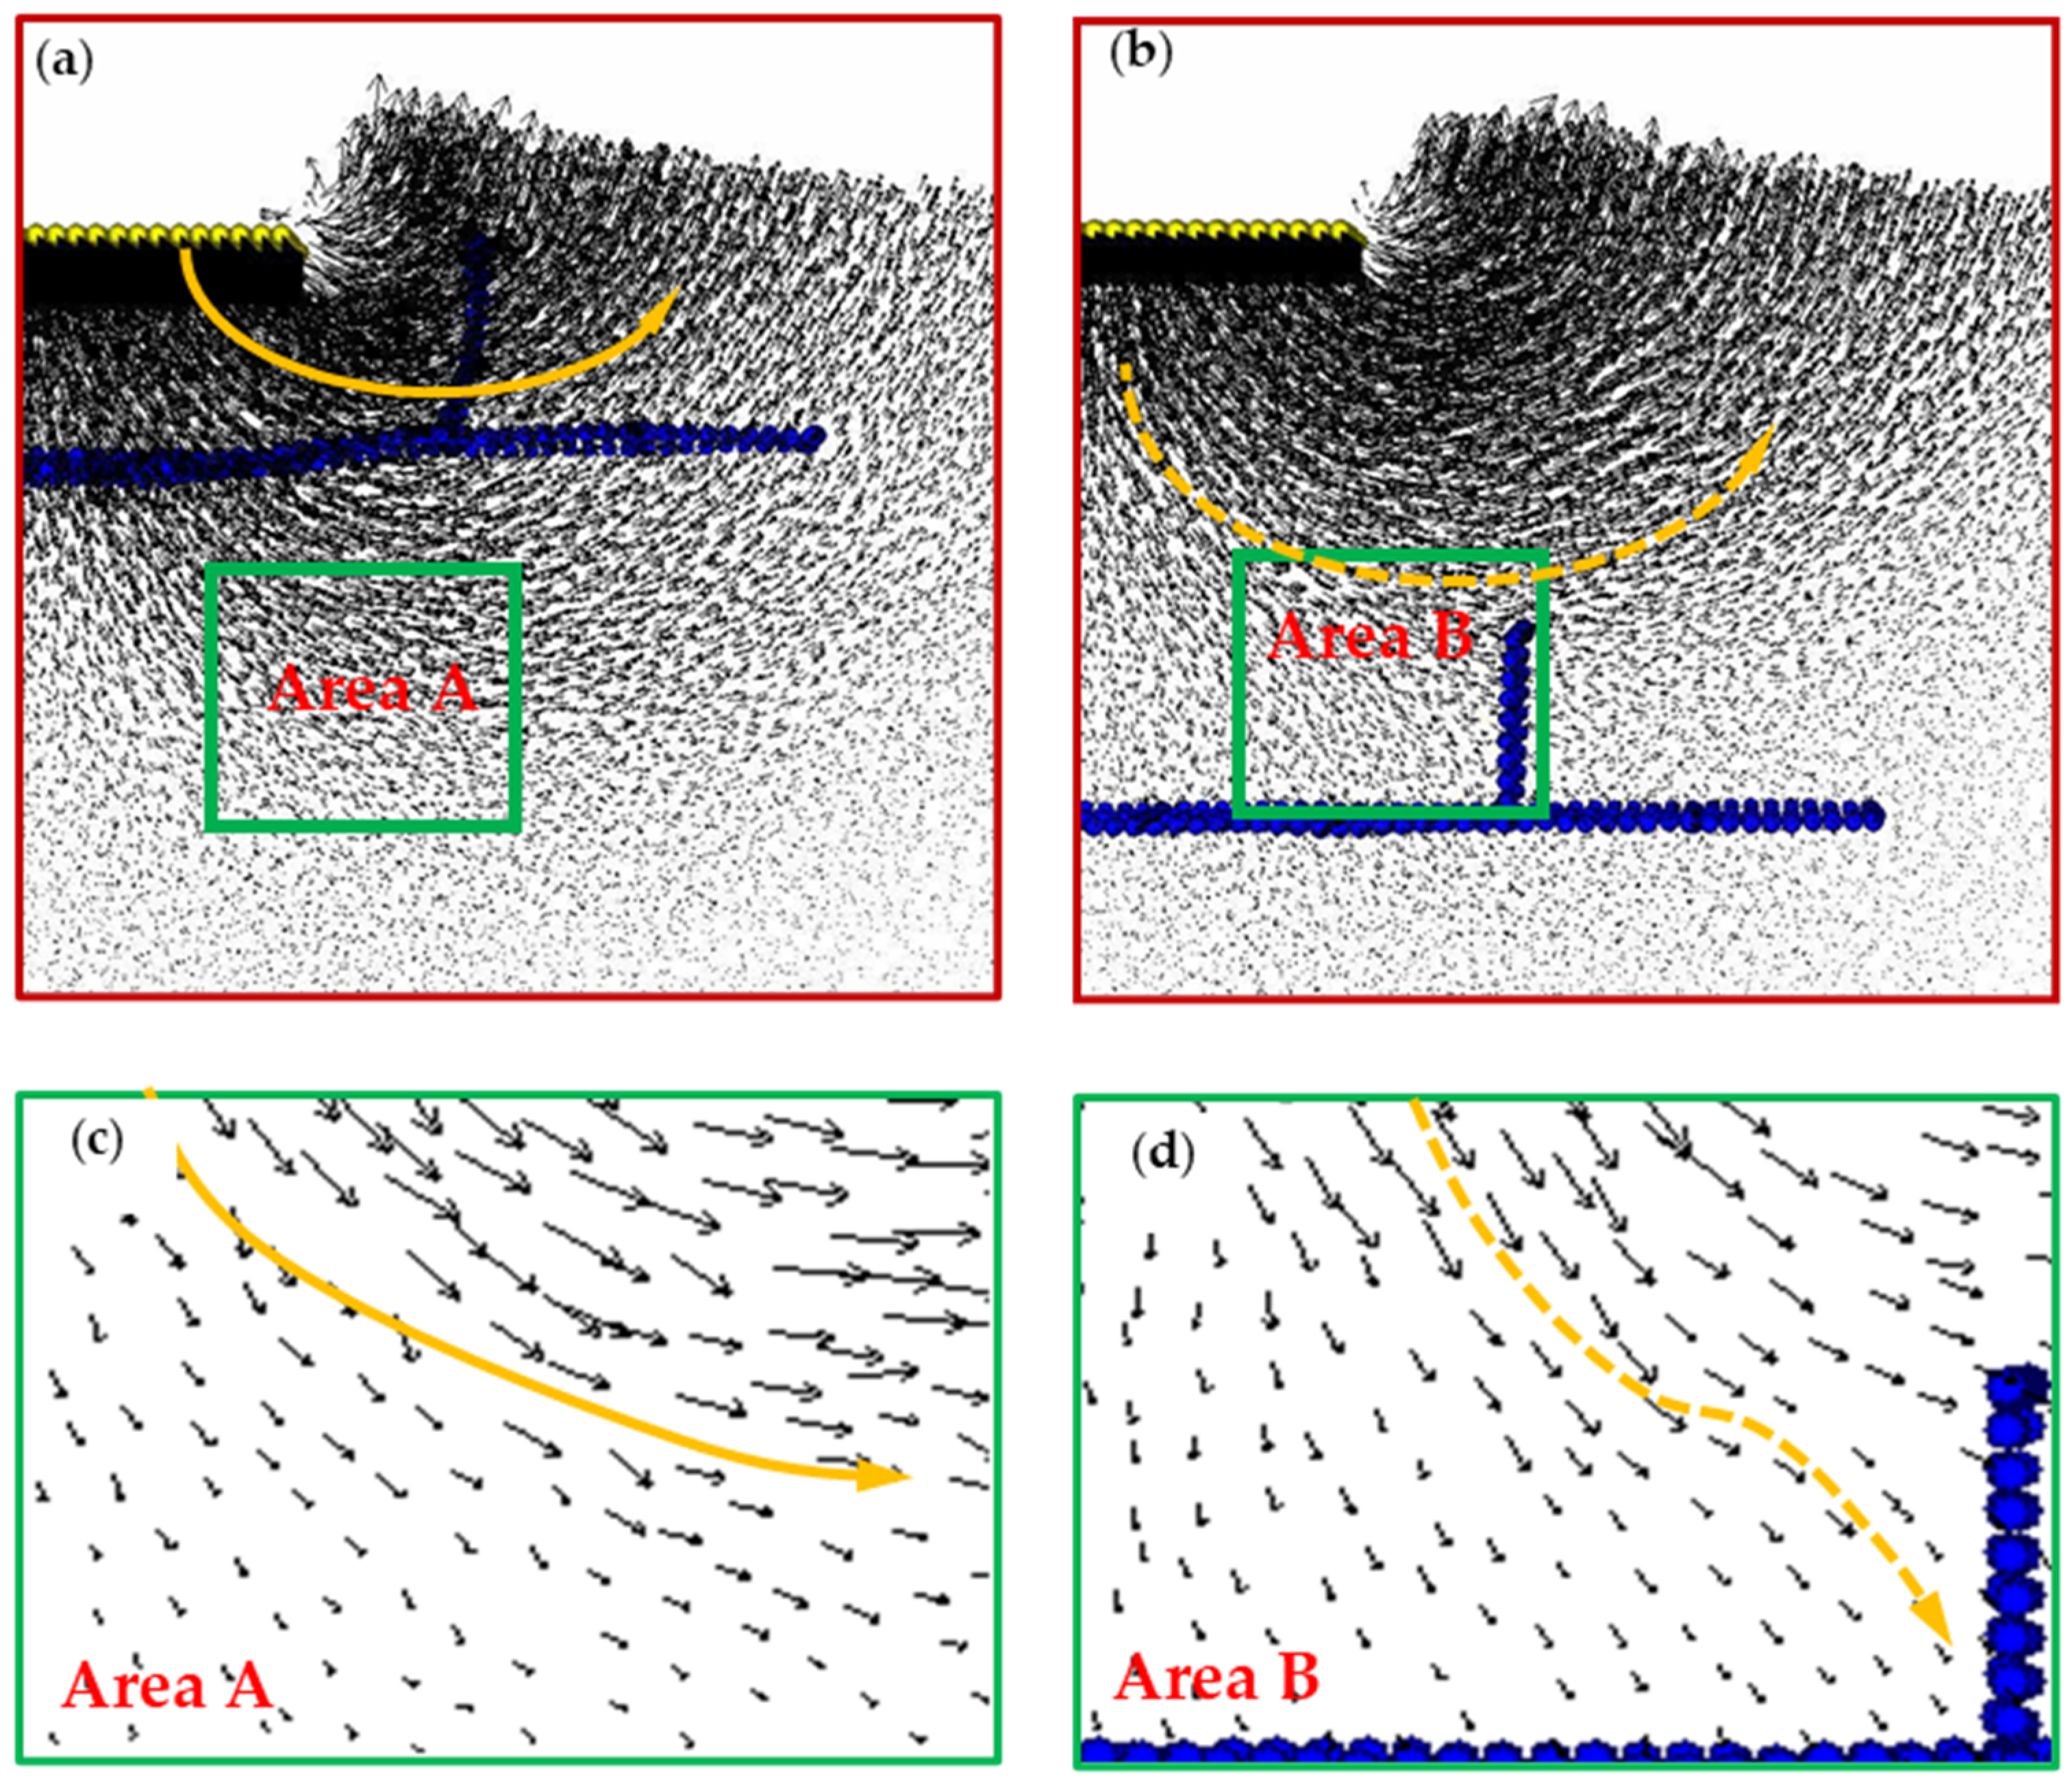
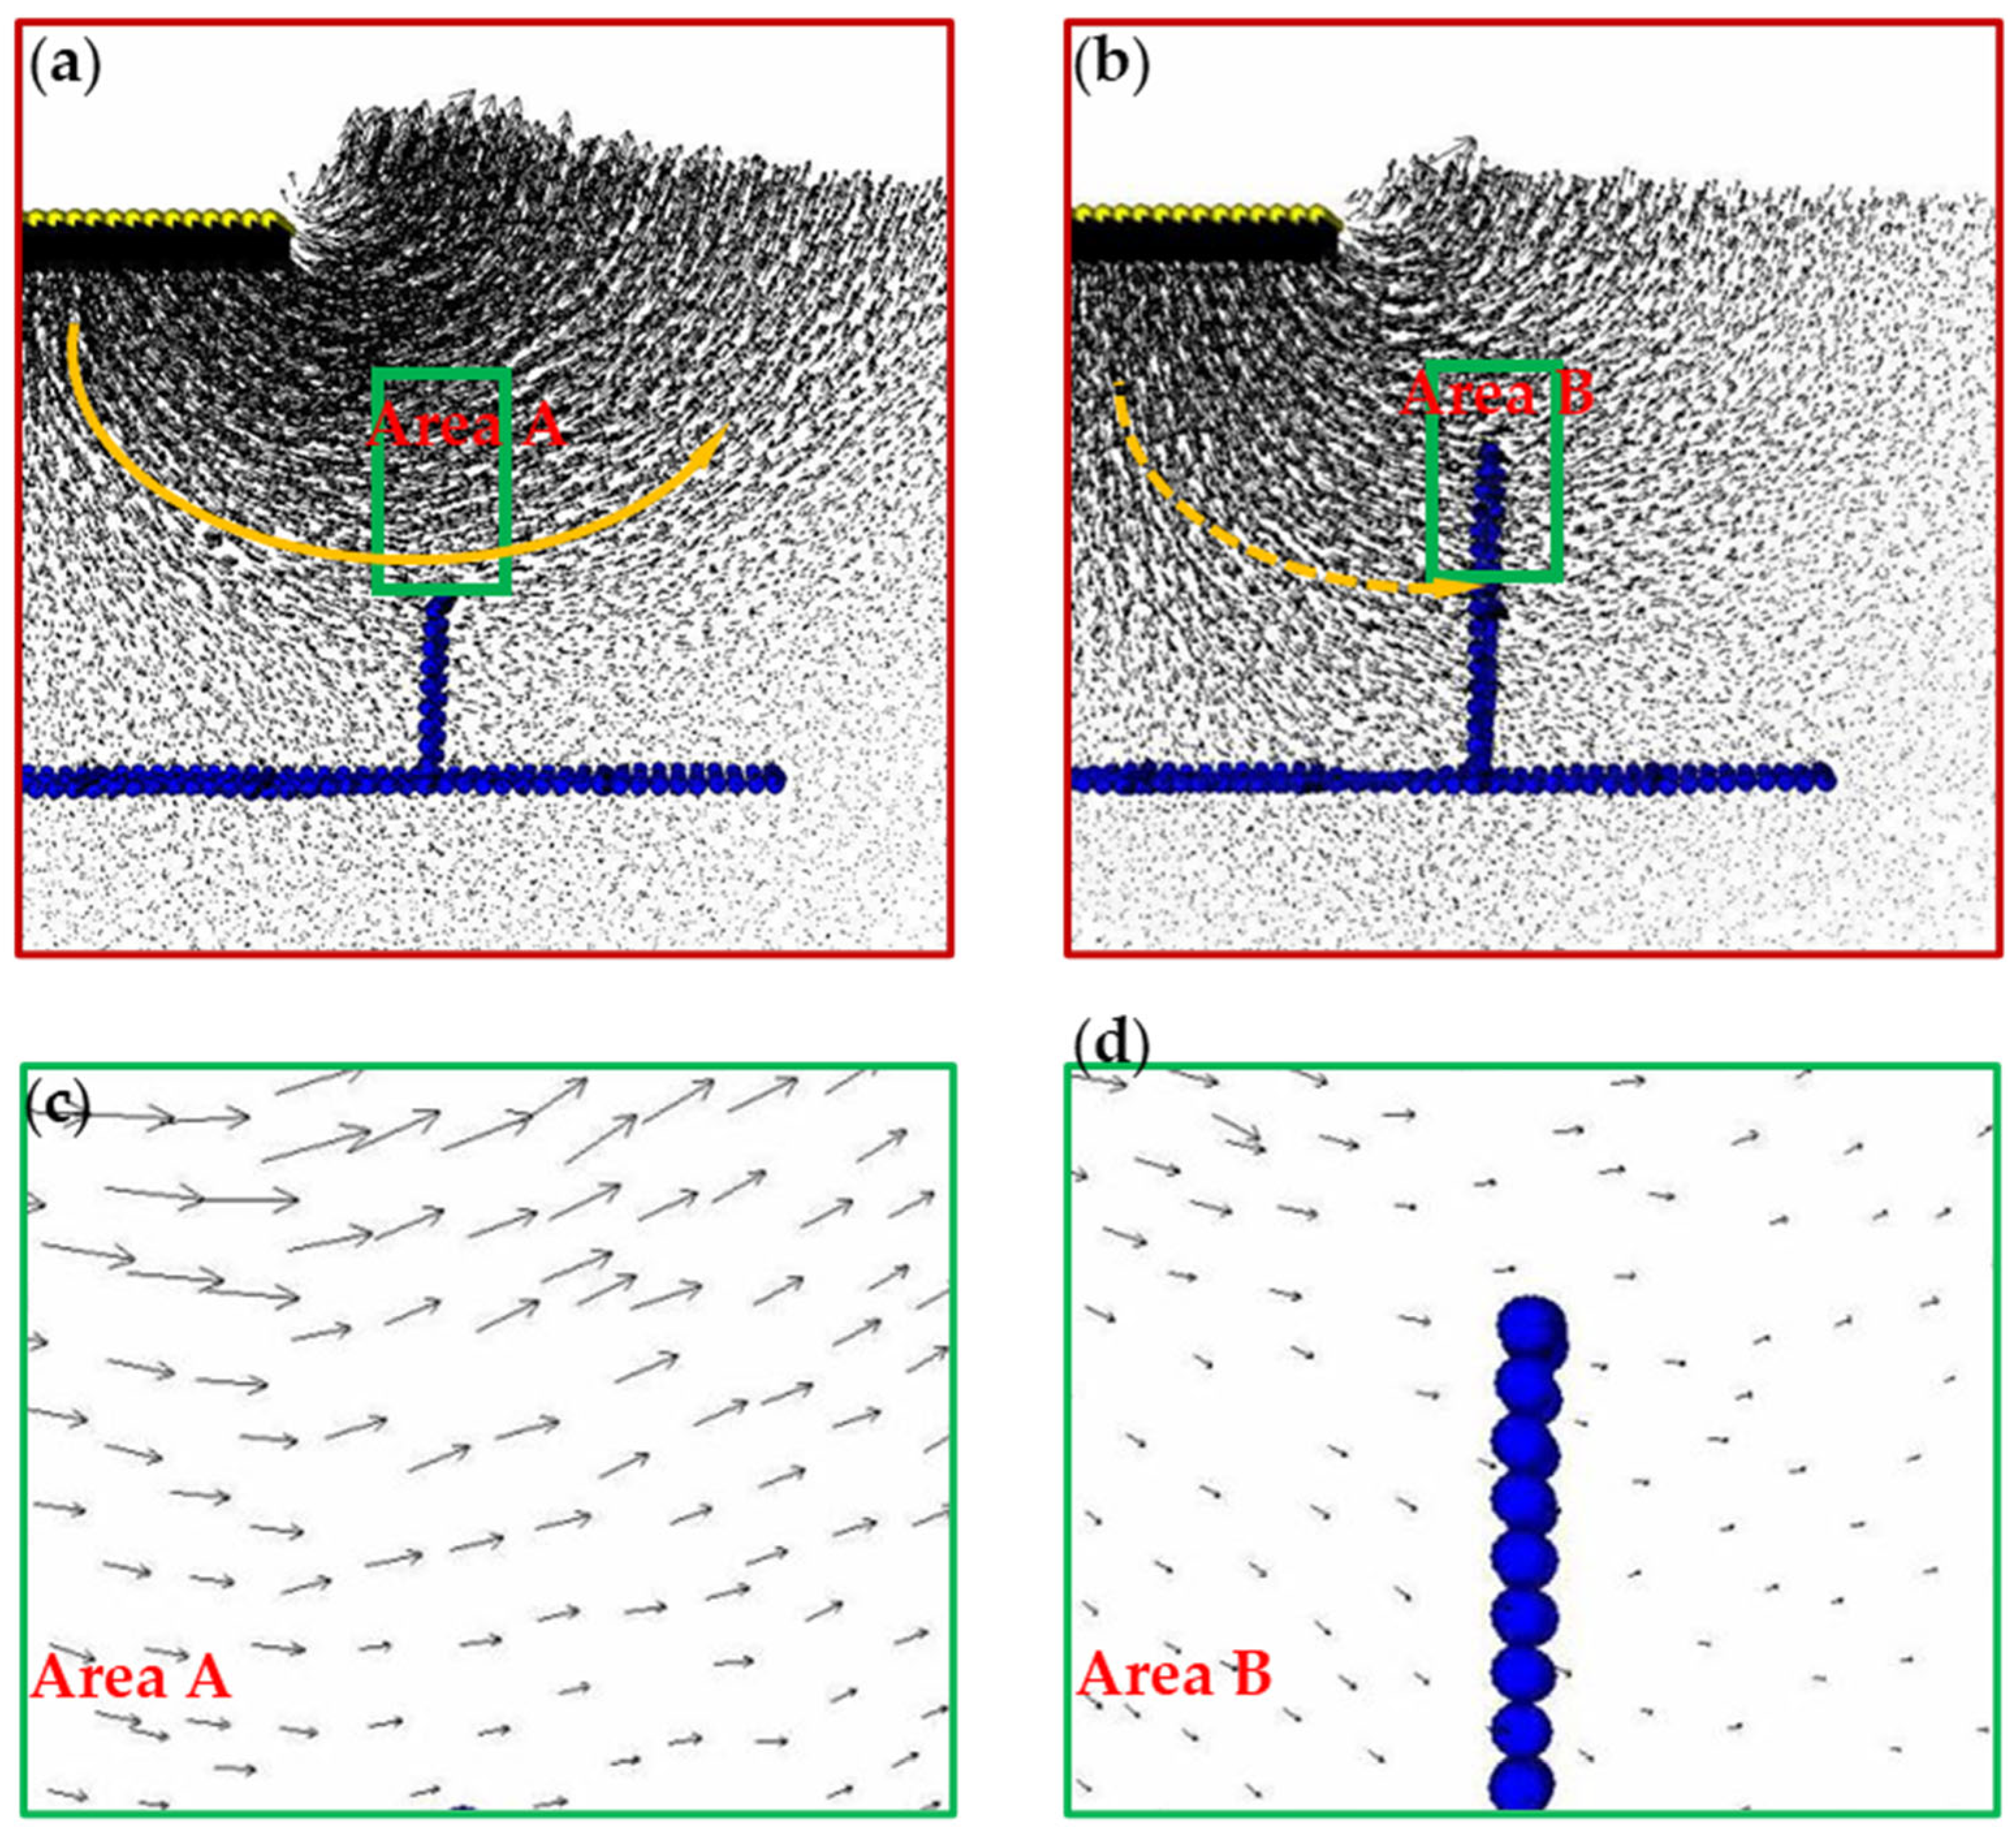
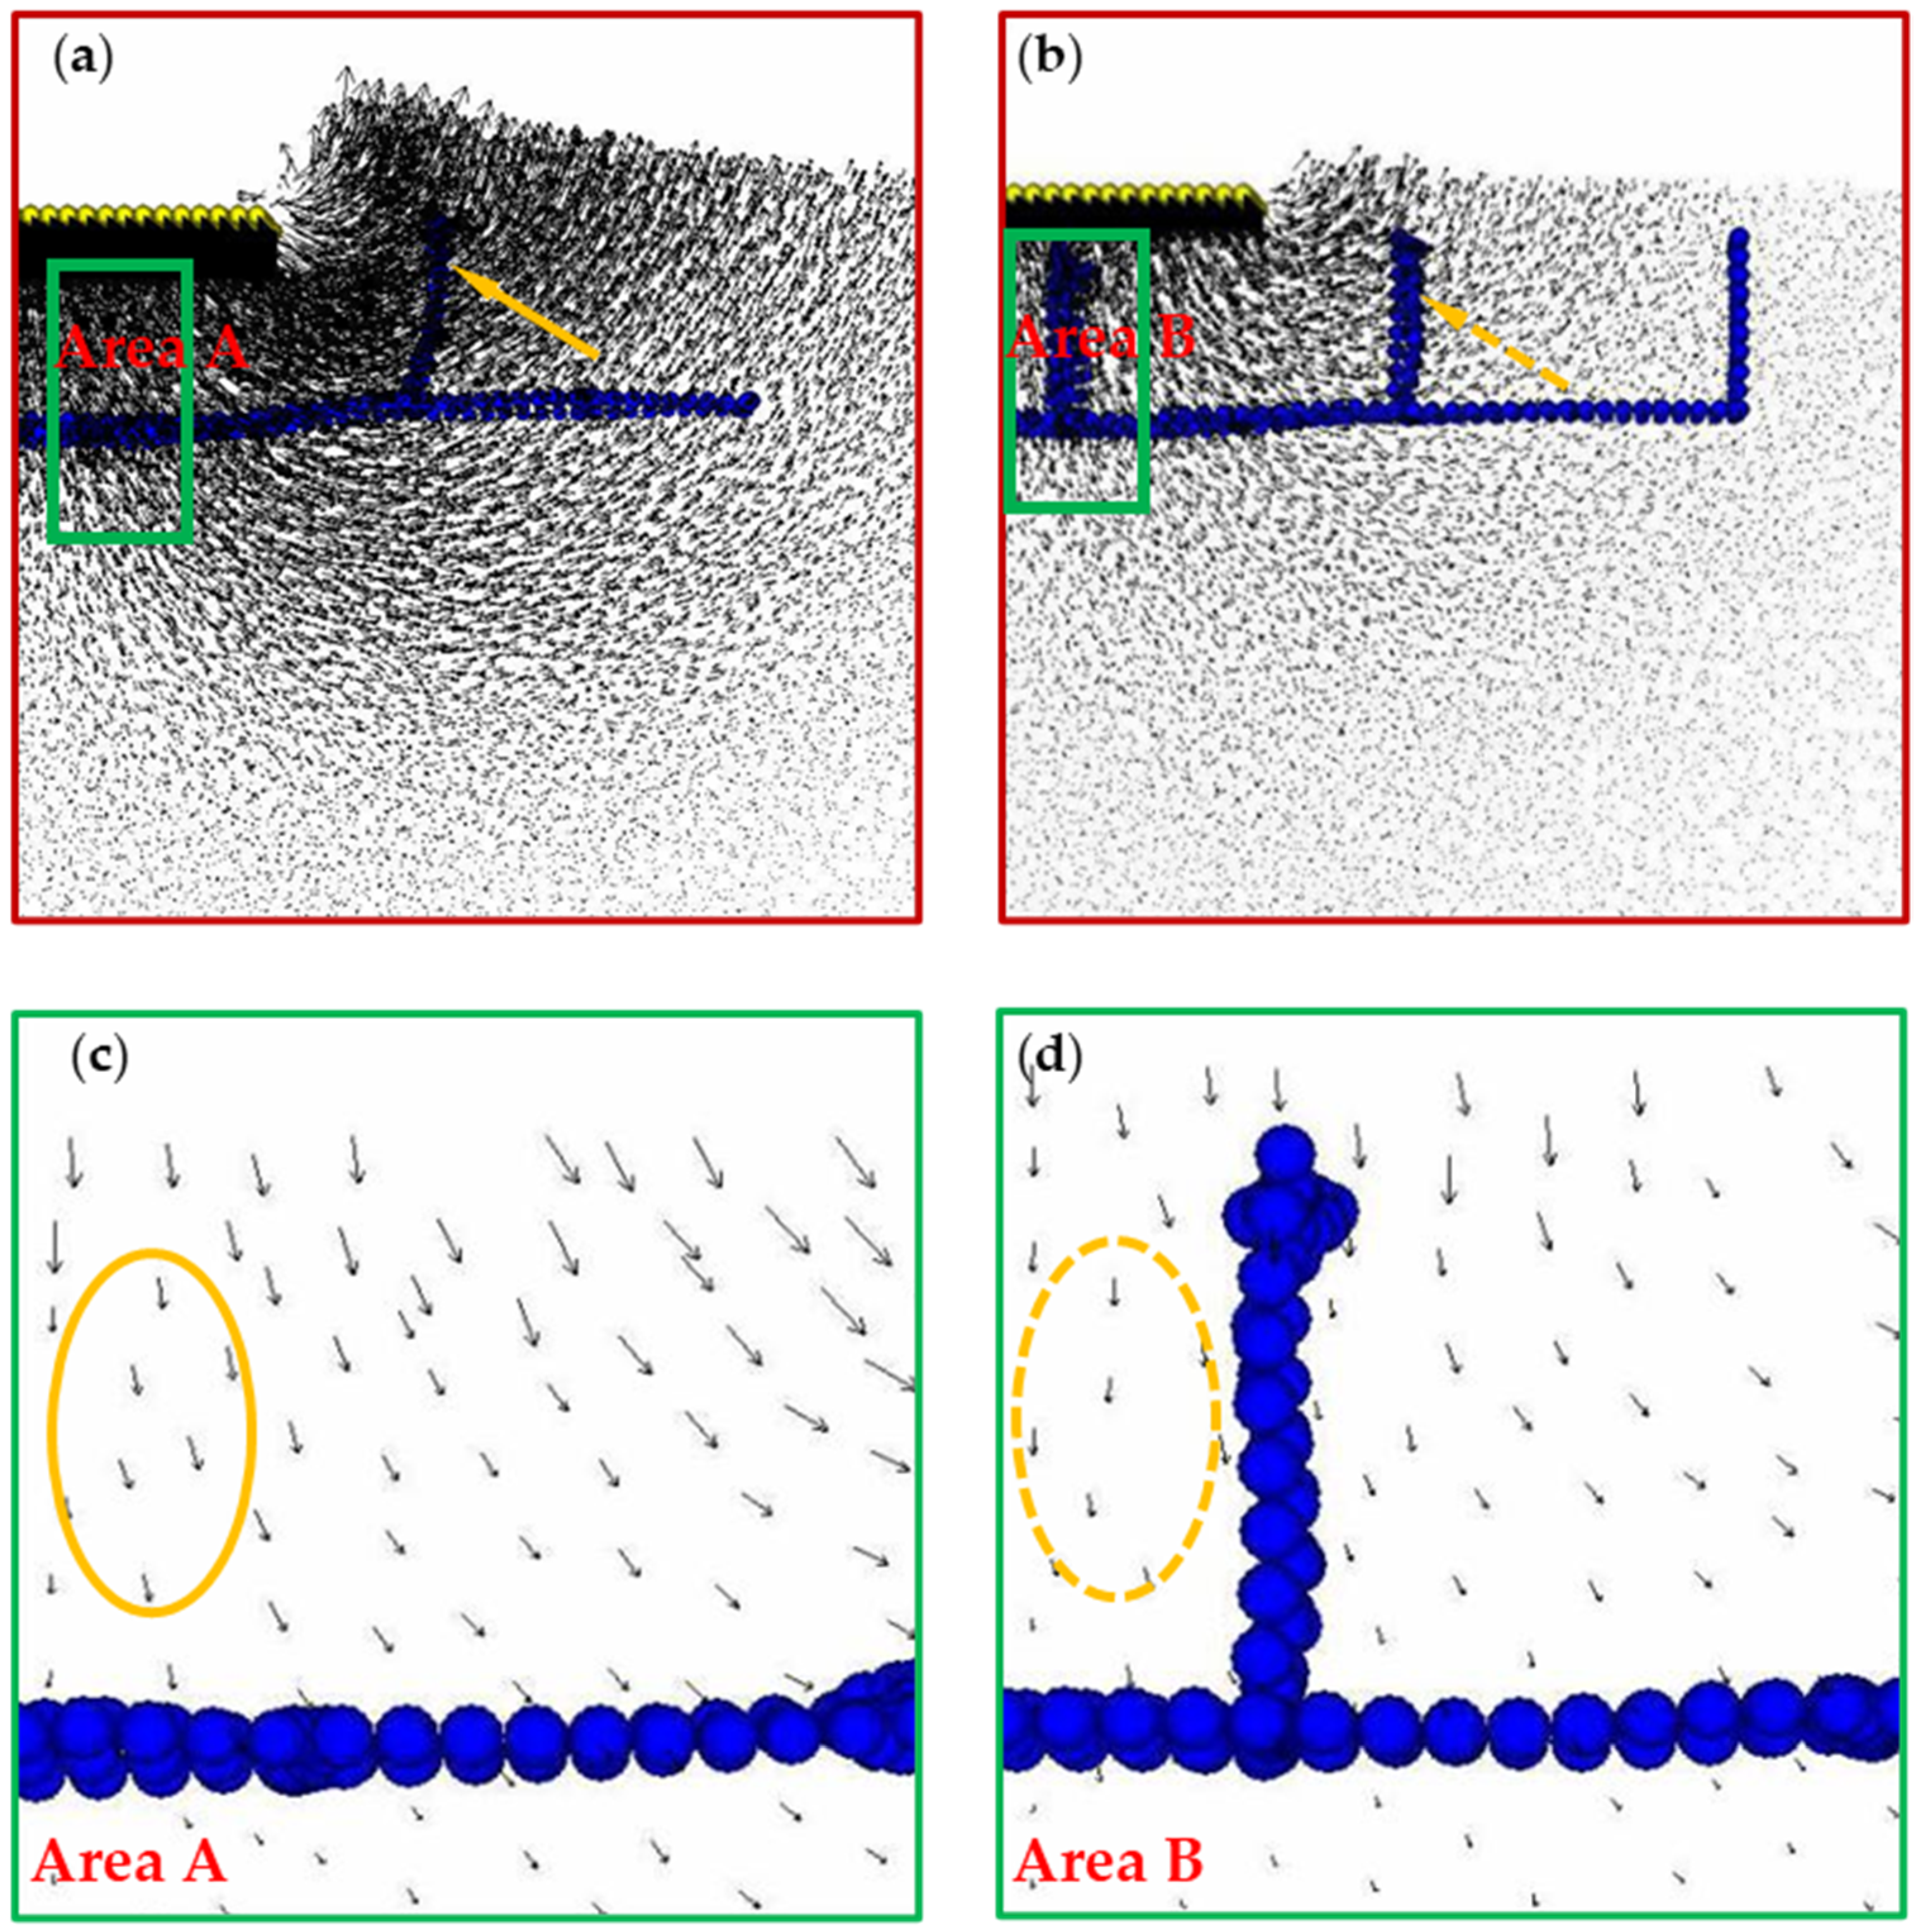
3.2. Displacement in the H–V Geogrid-Reinforced Foundation
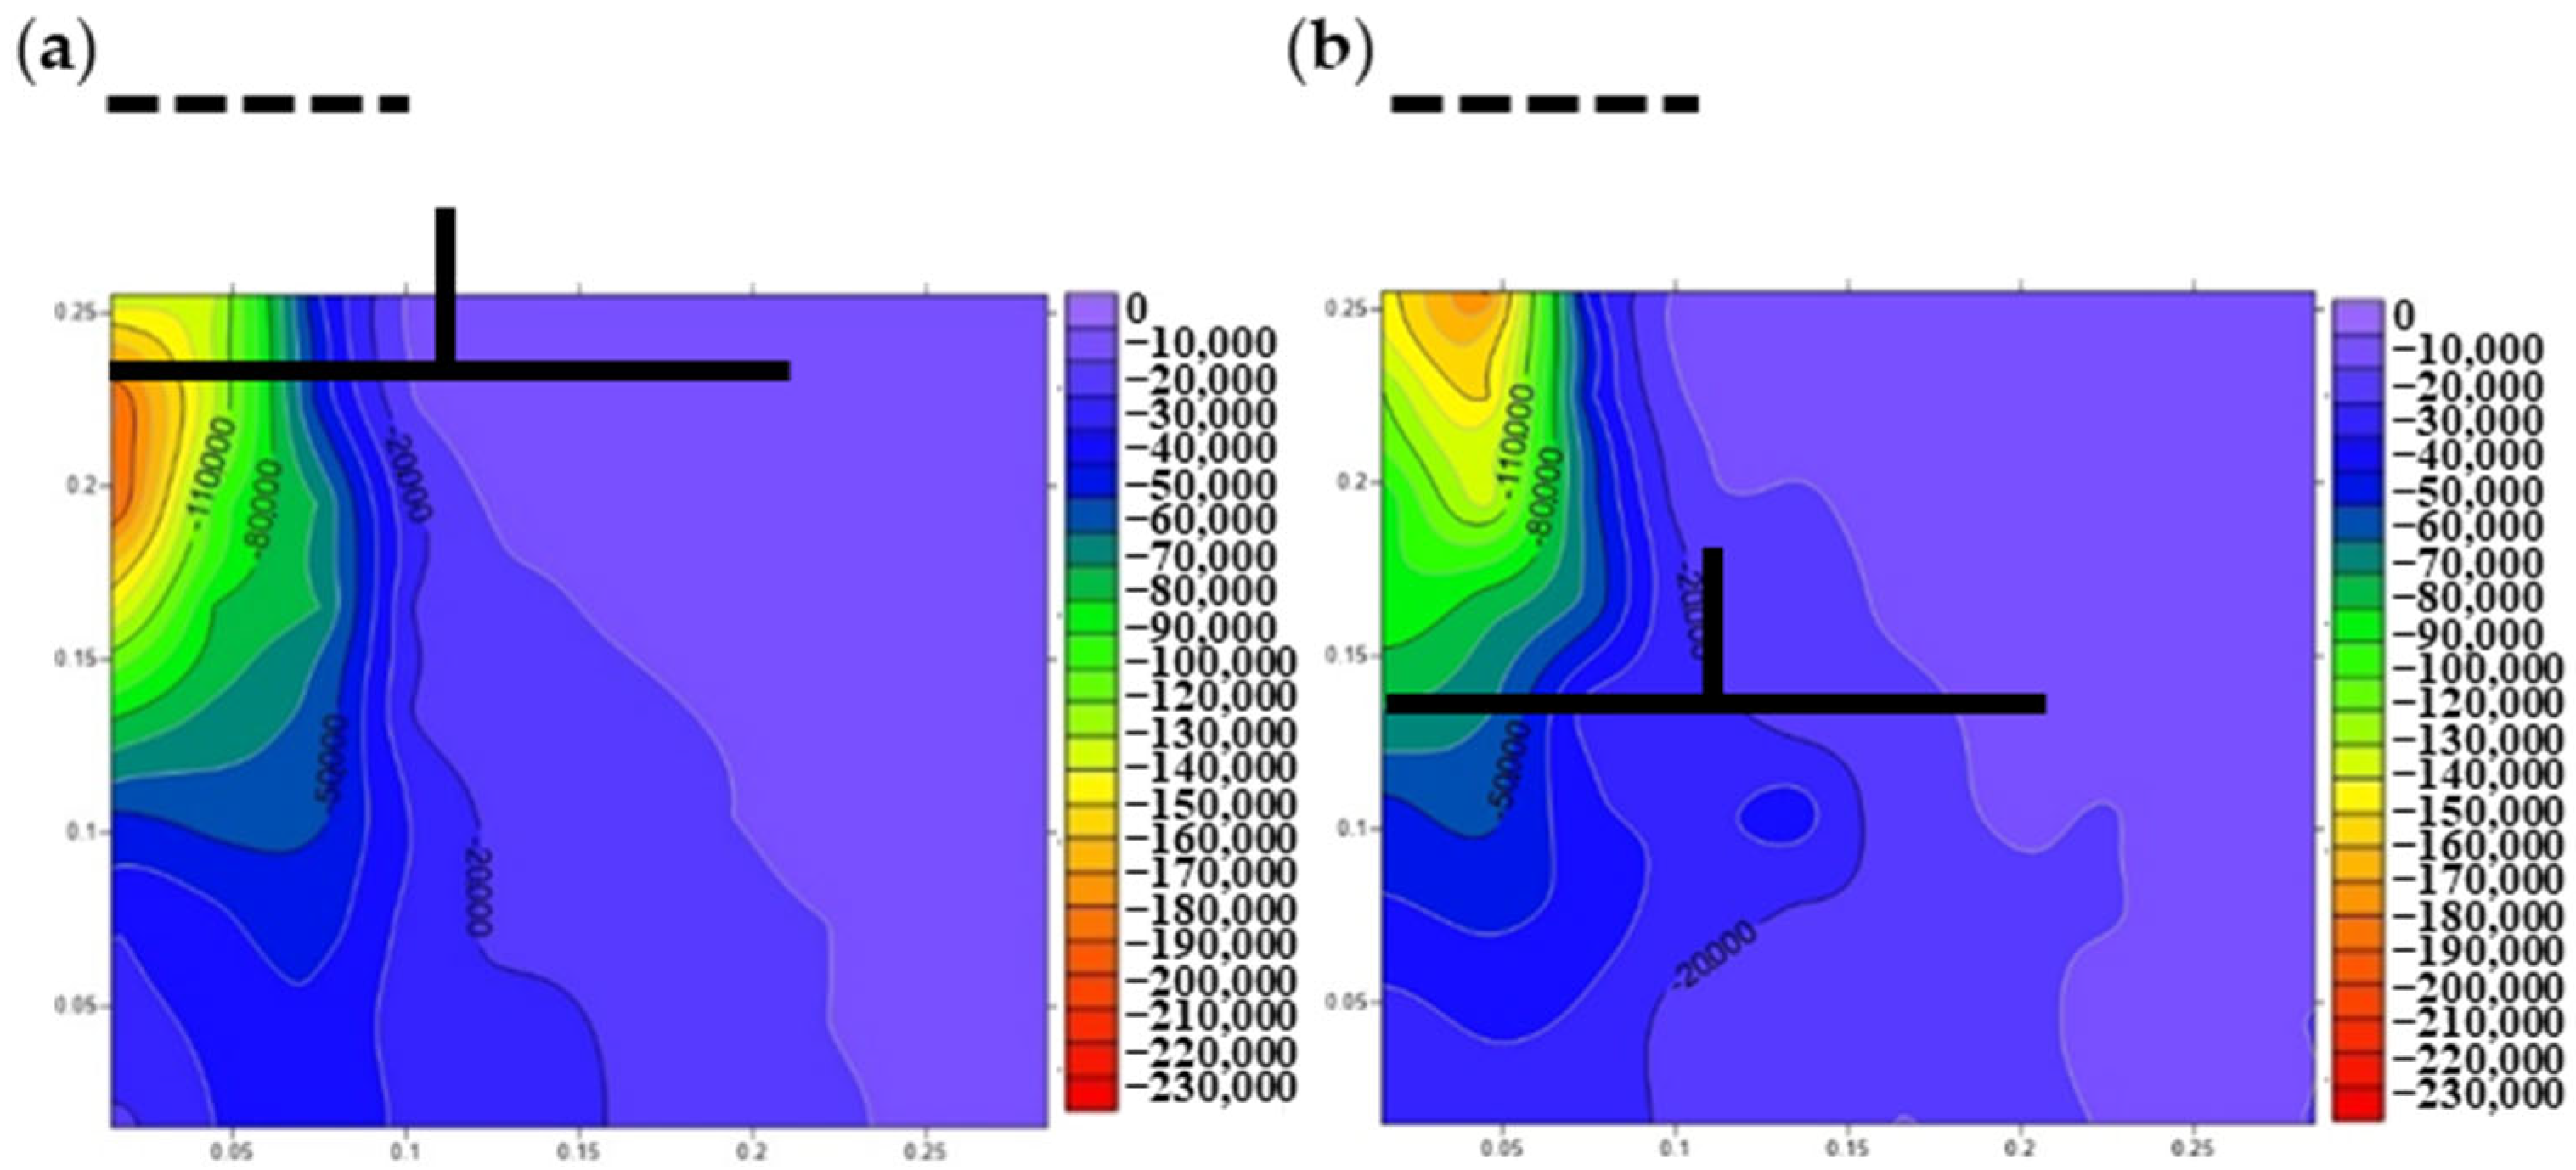
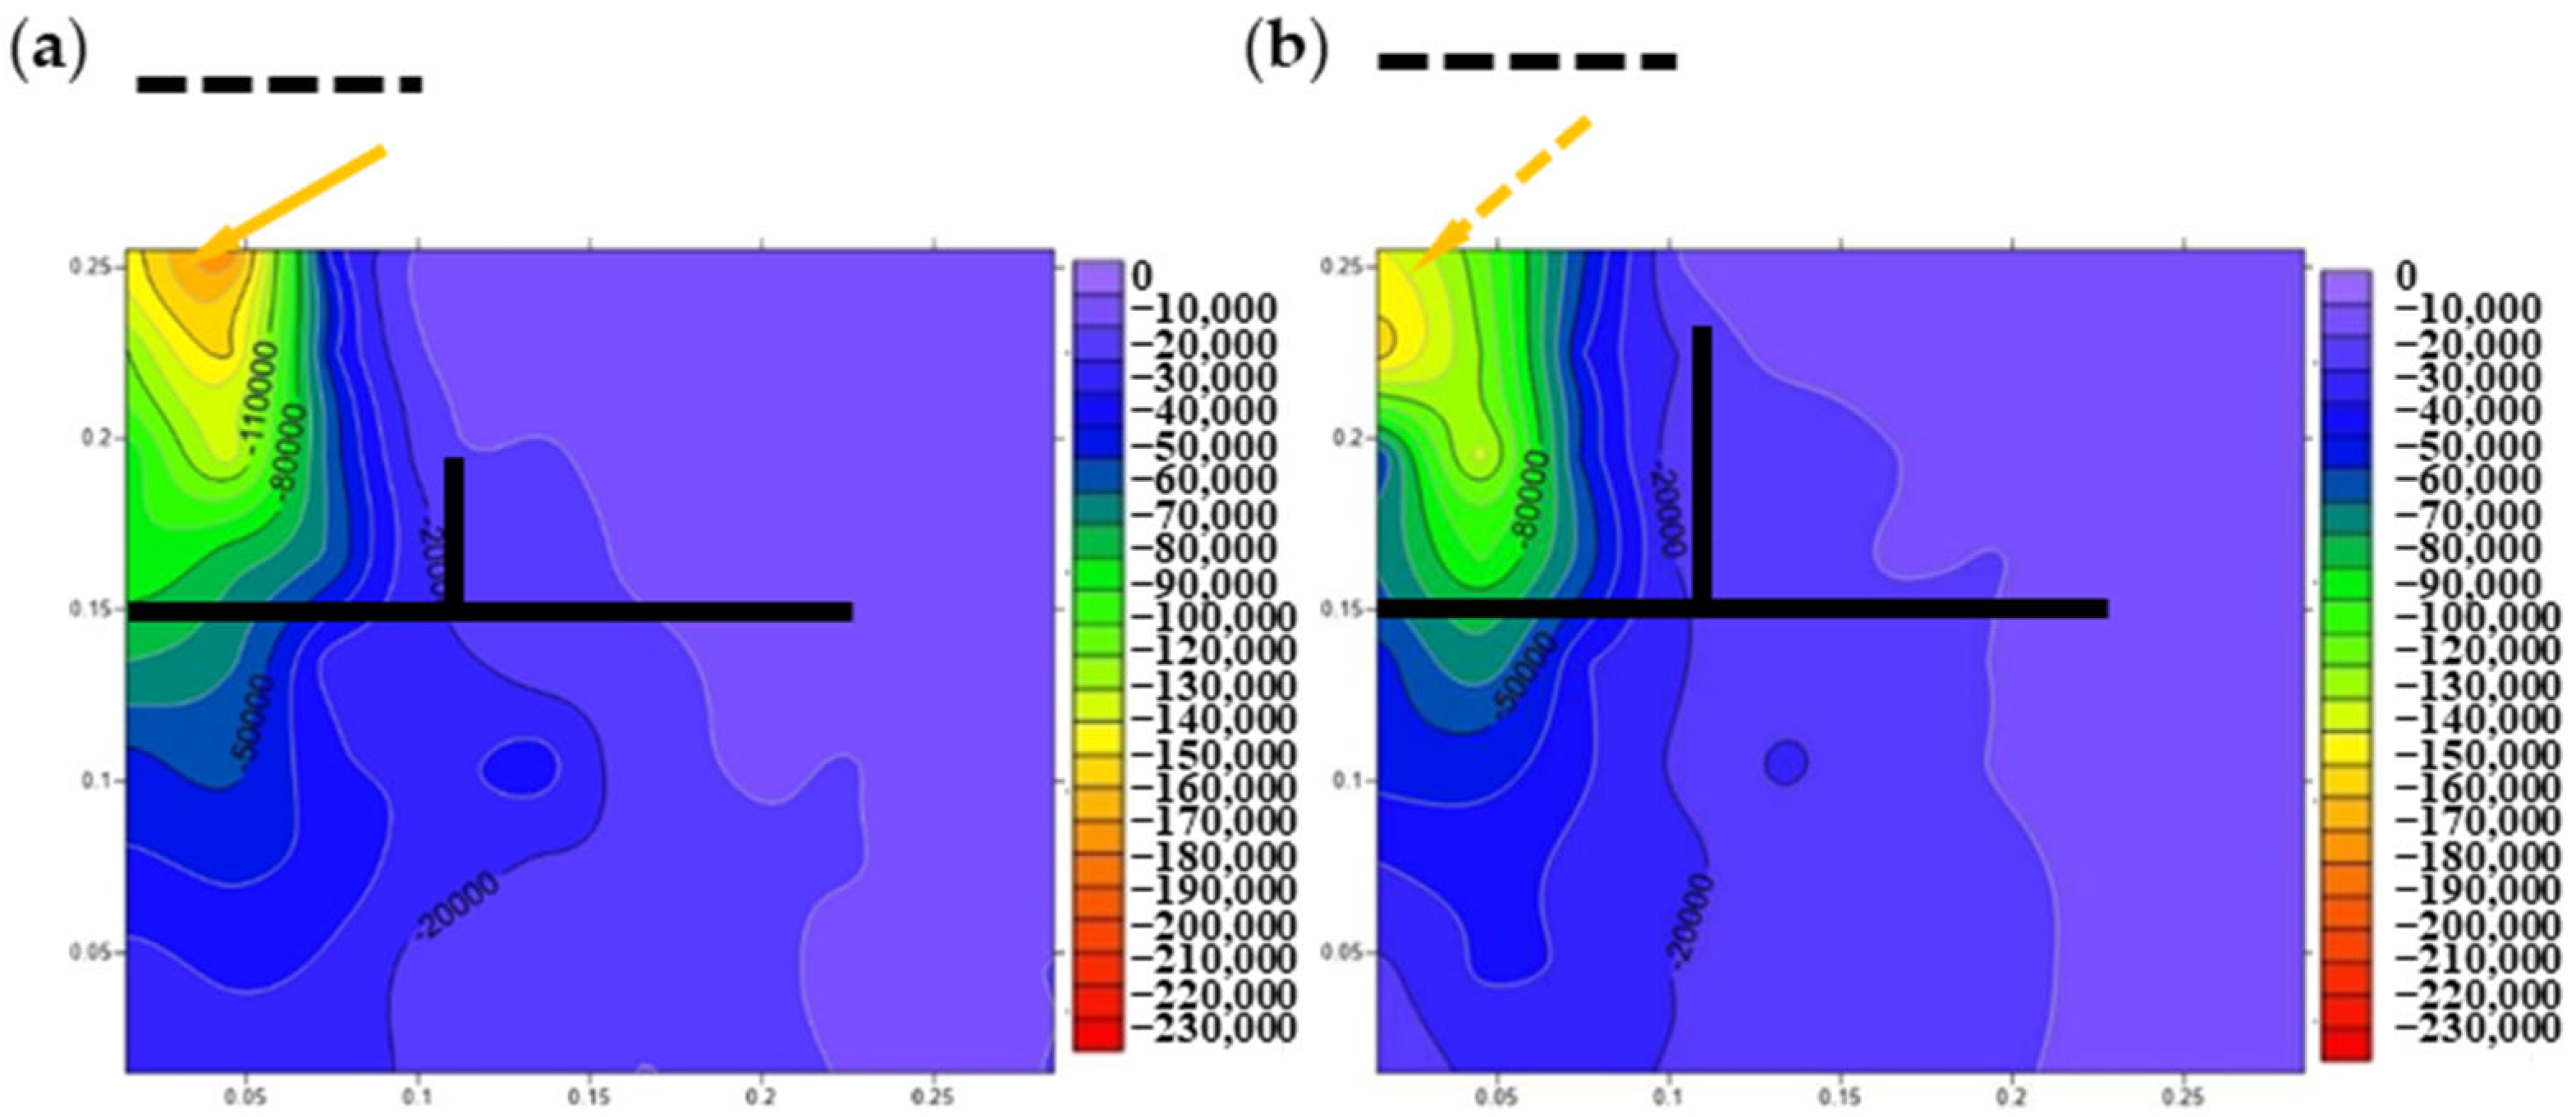
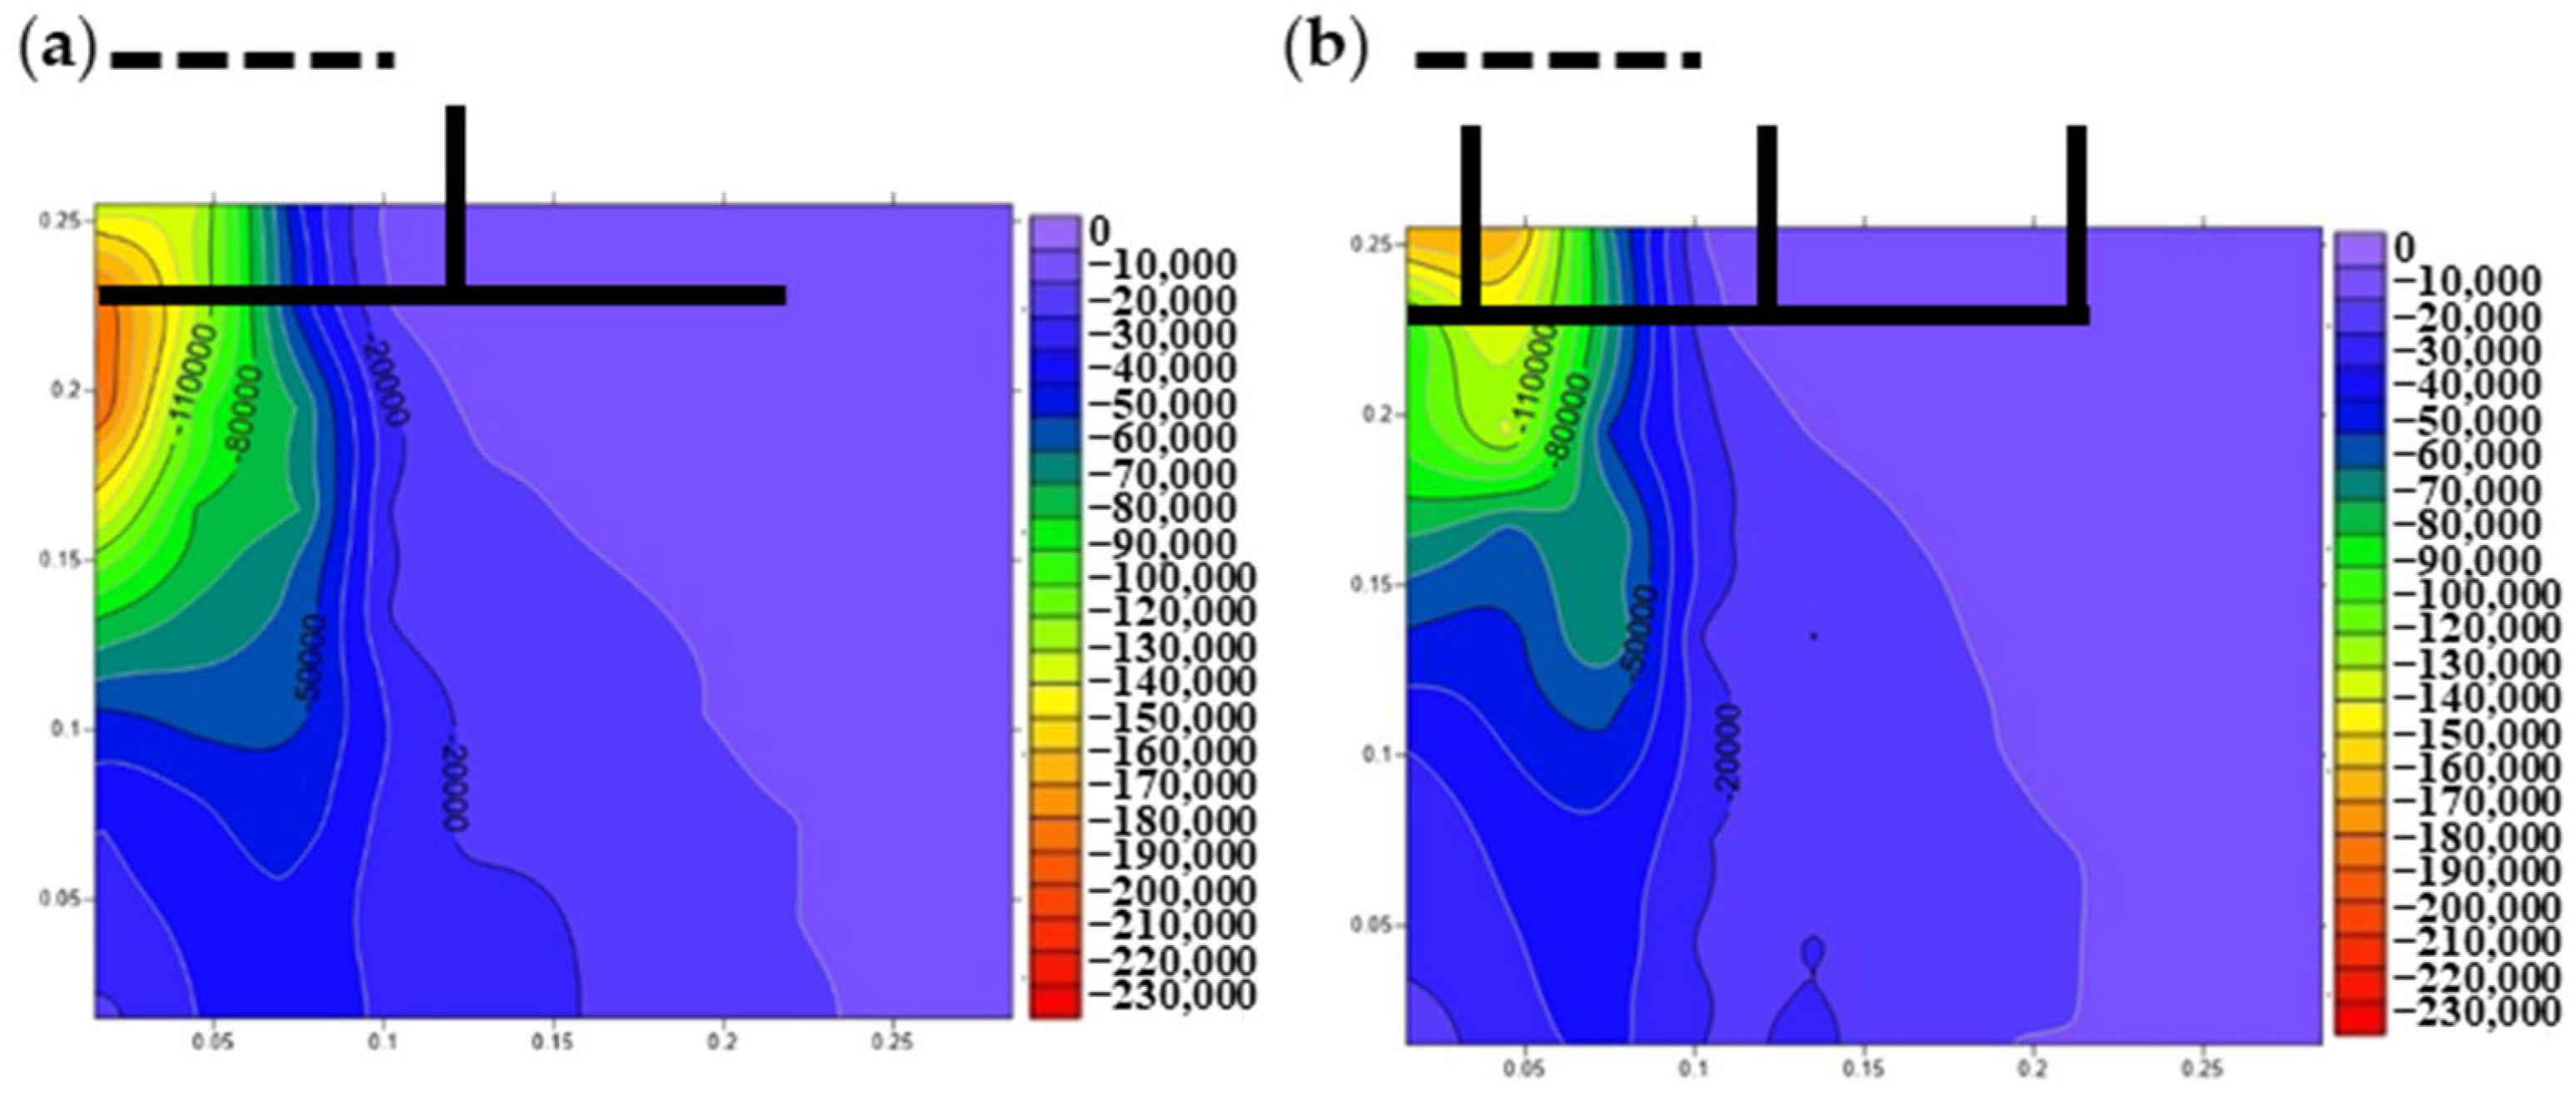
3.3. Stress Distribution in the H–V Geogrid-Reinforced Foundation
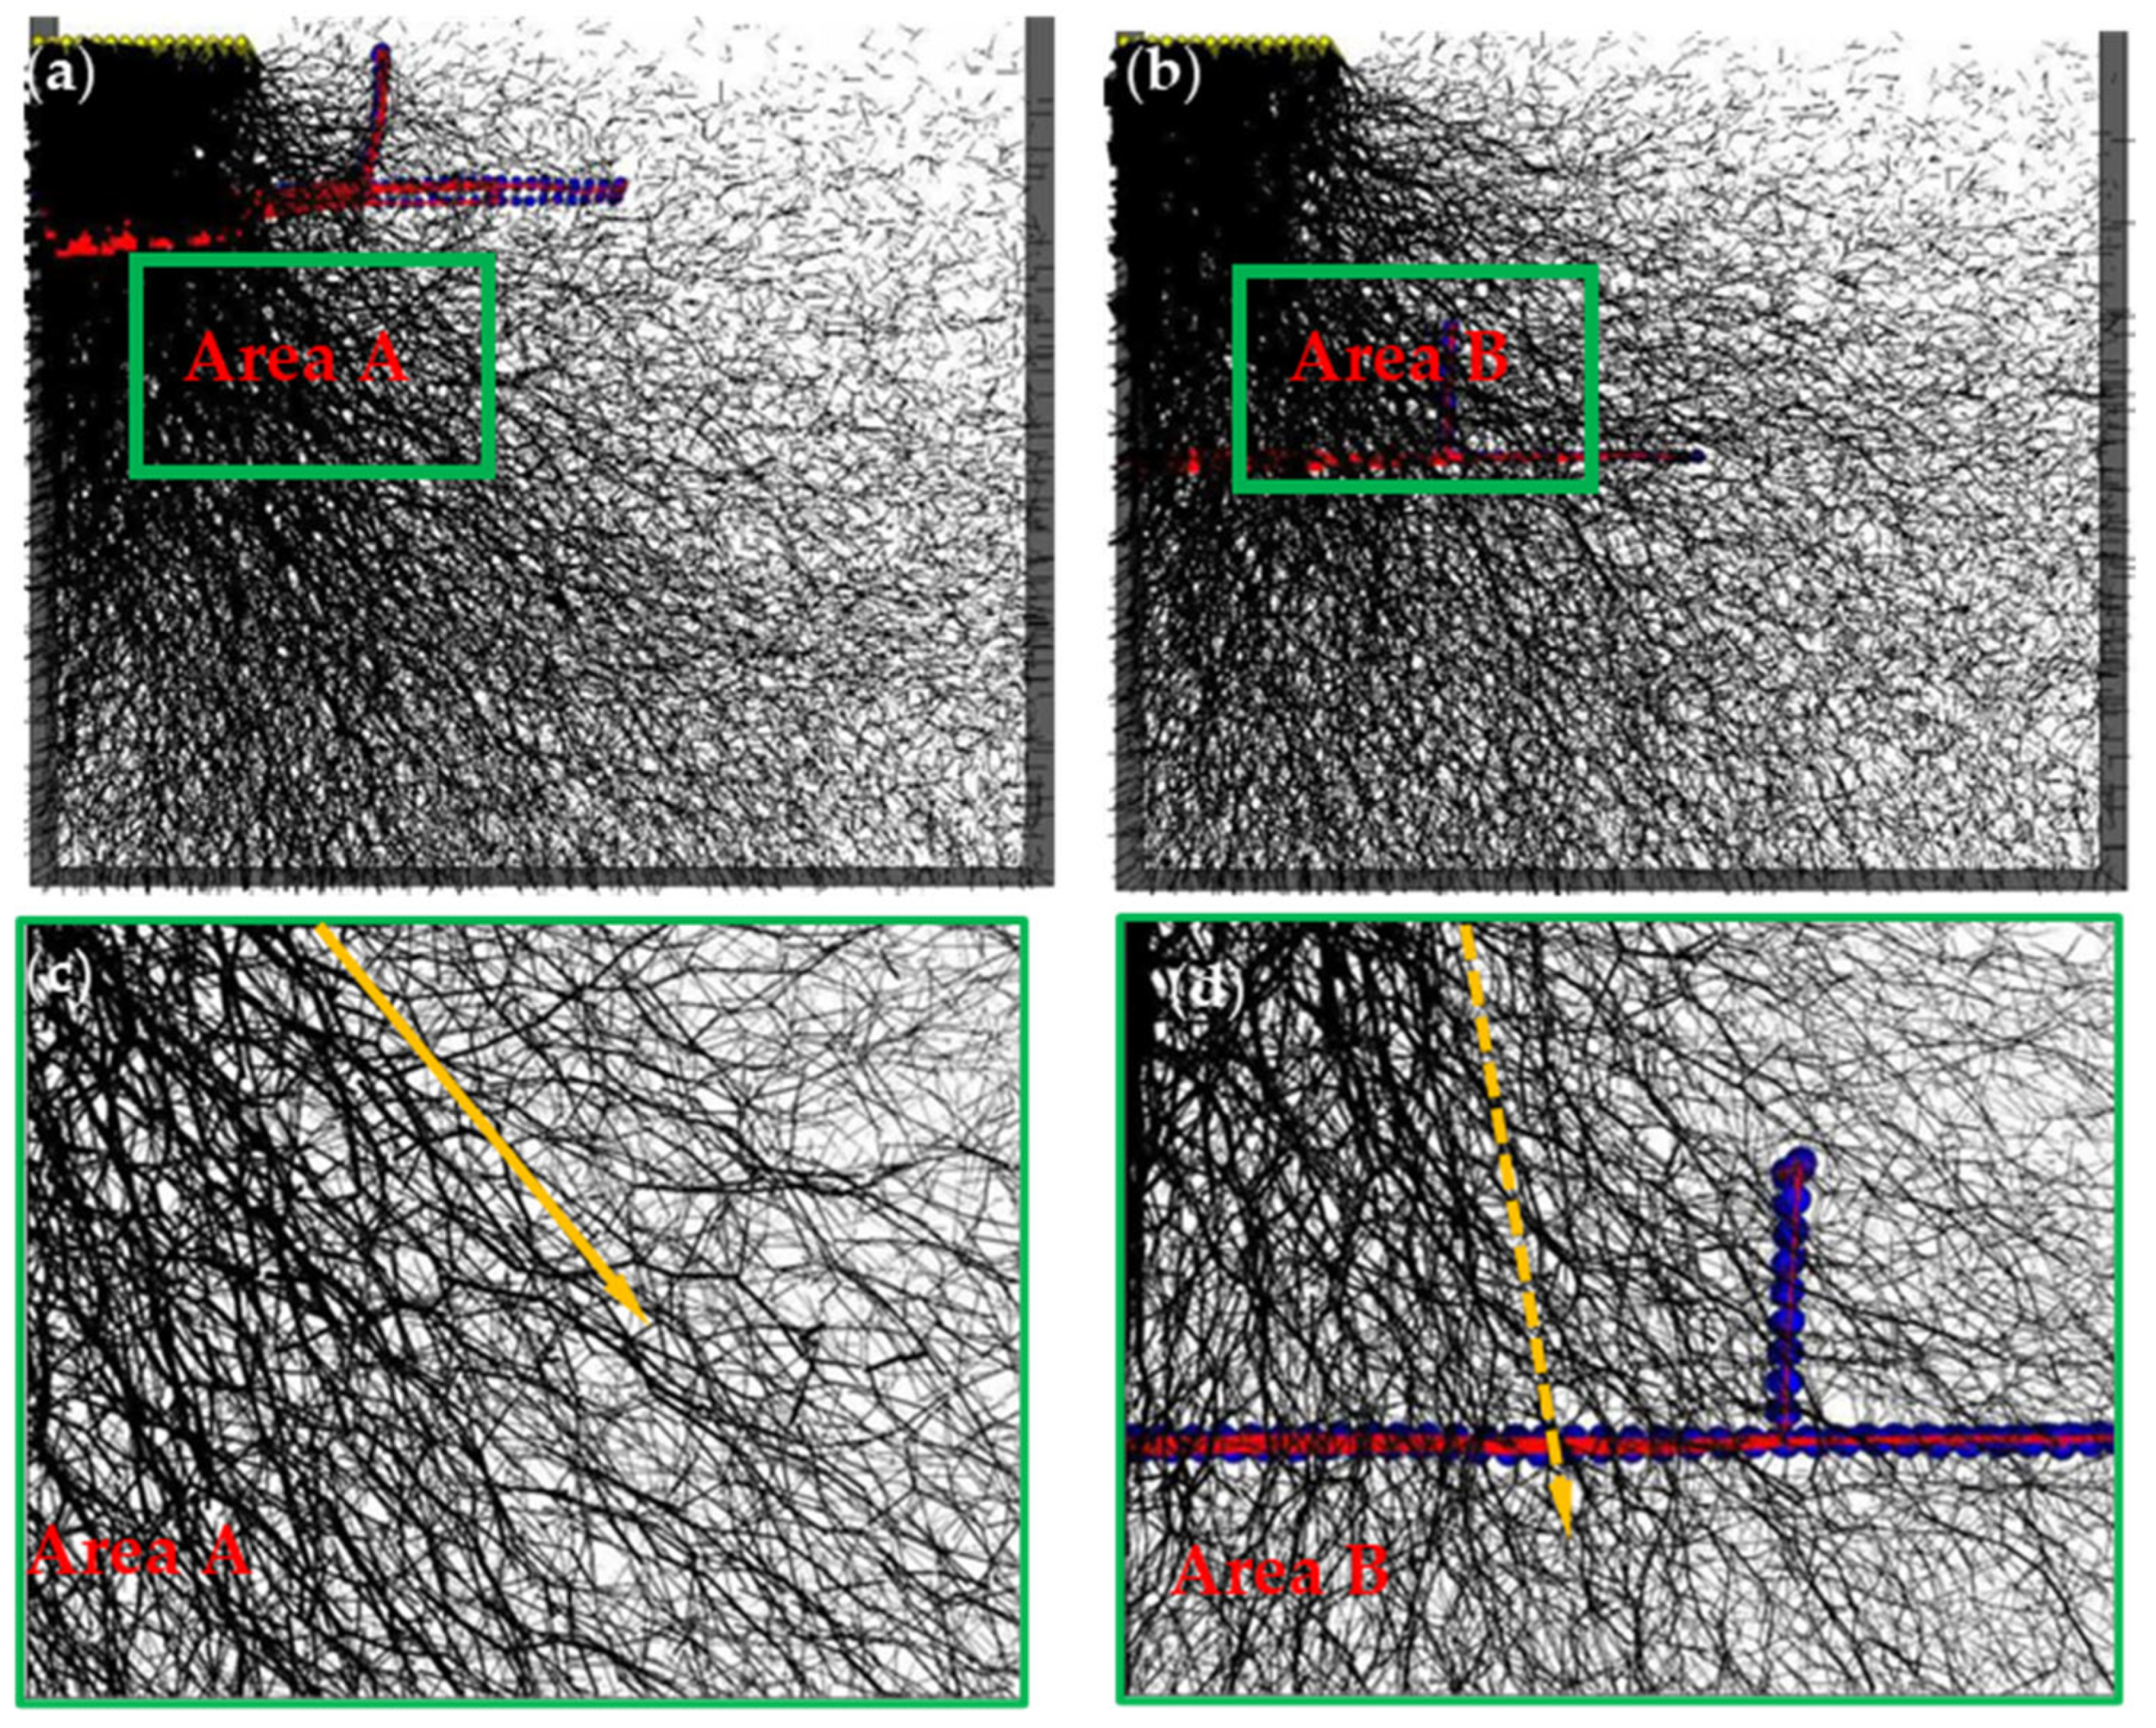
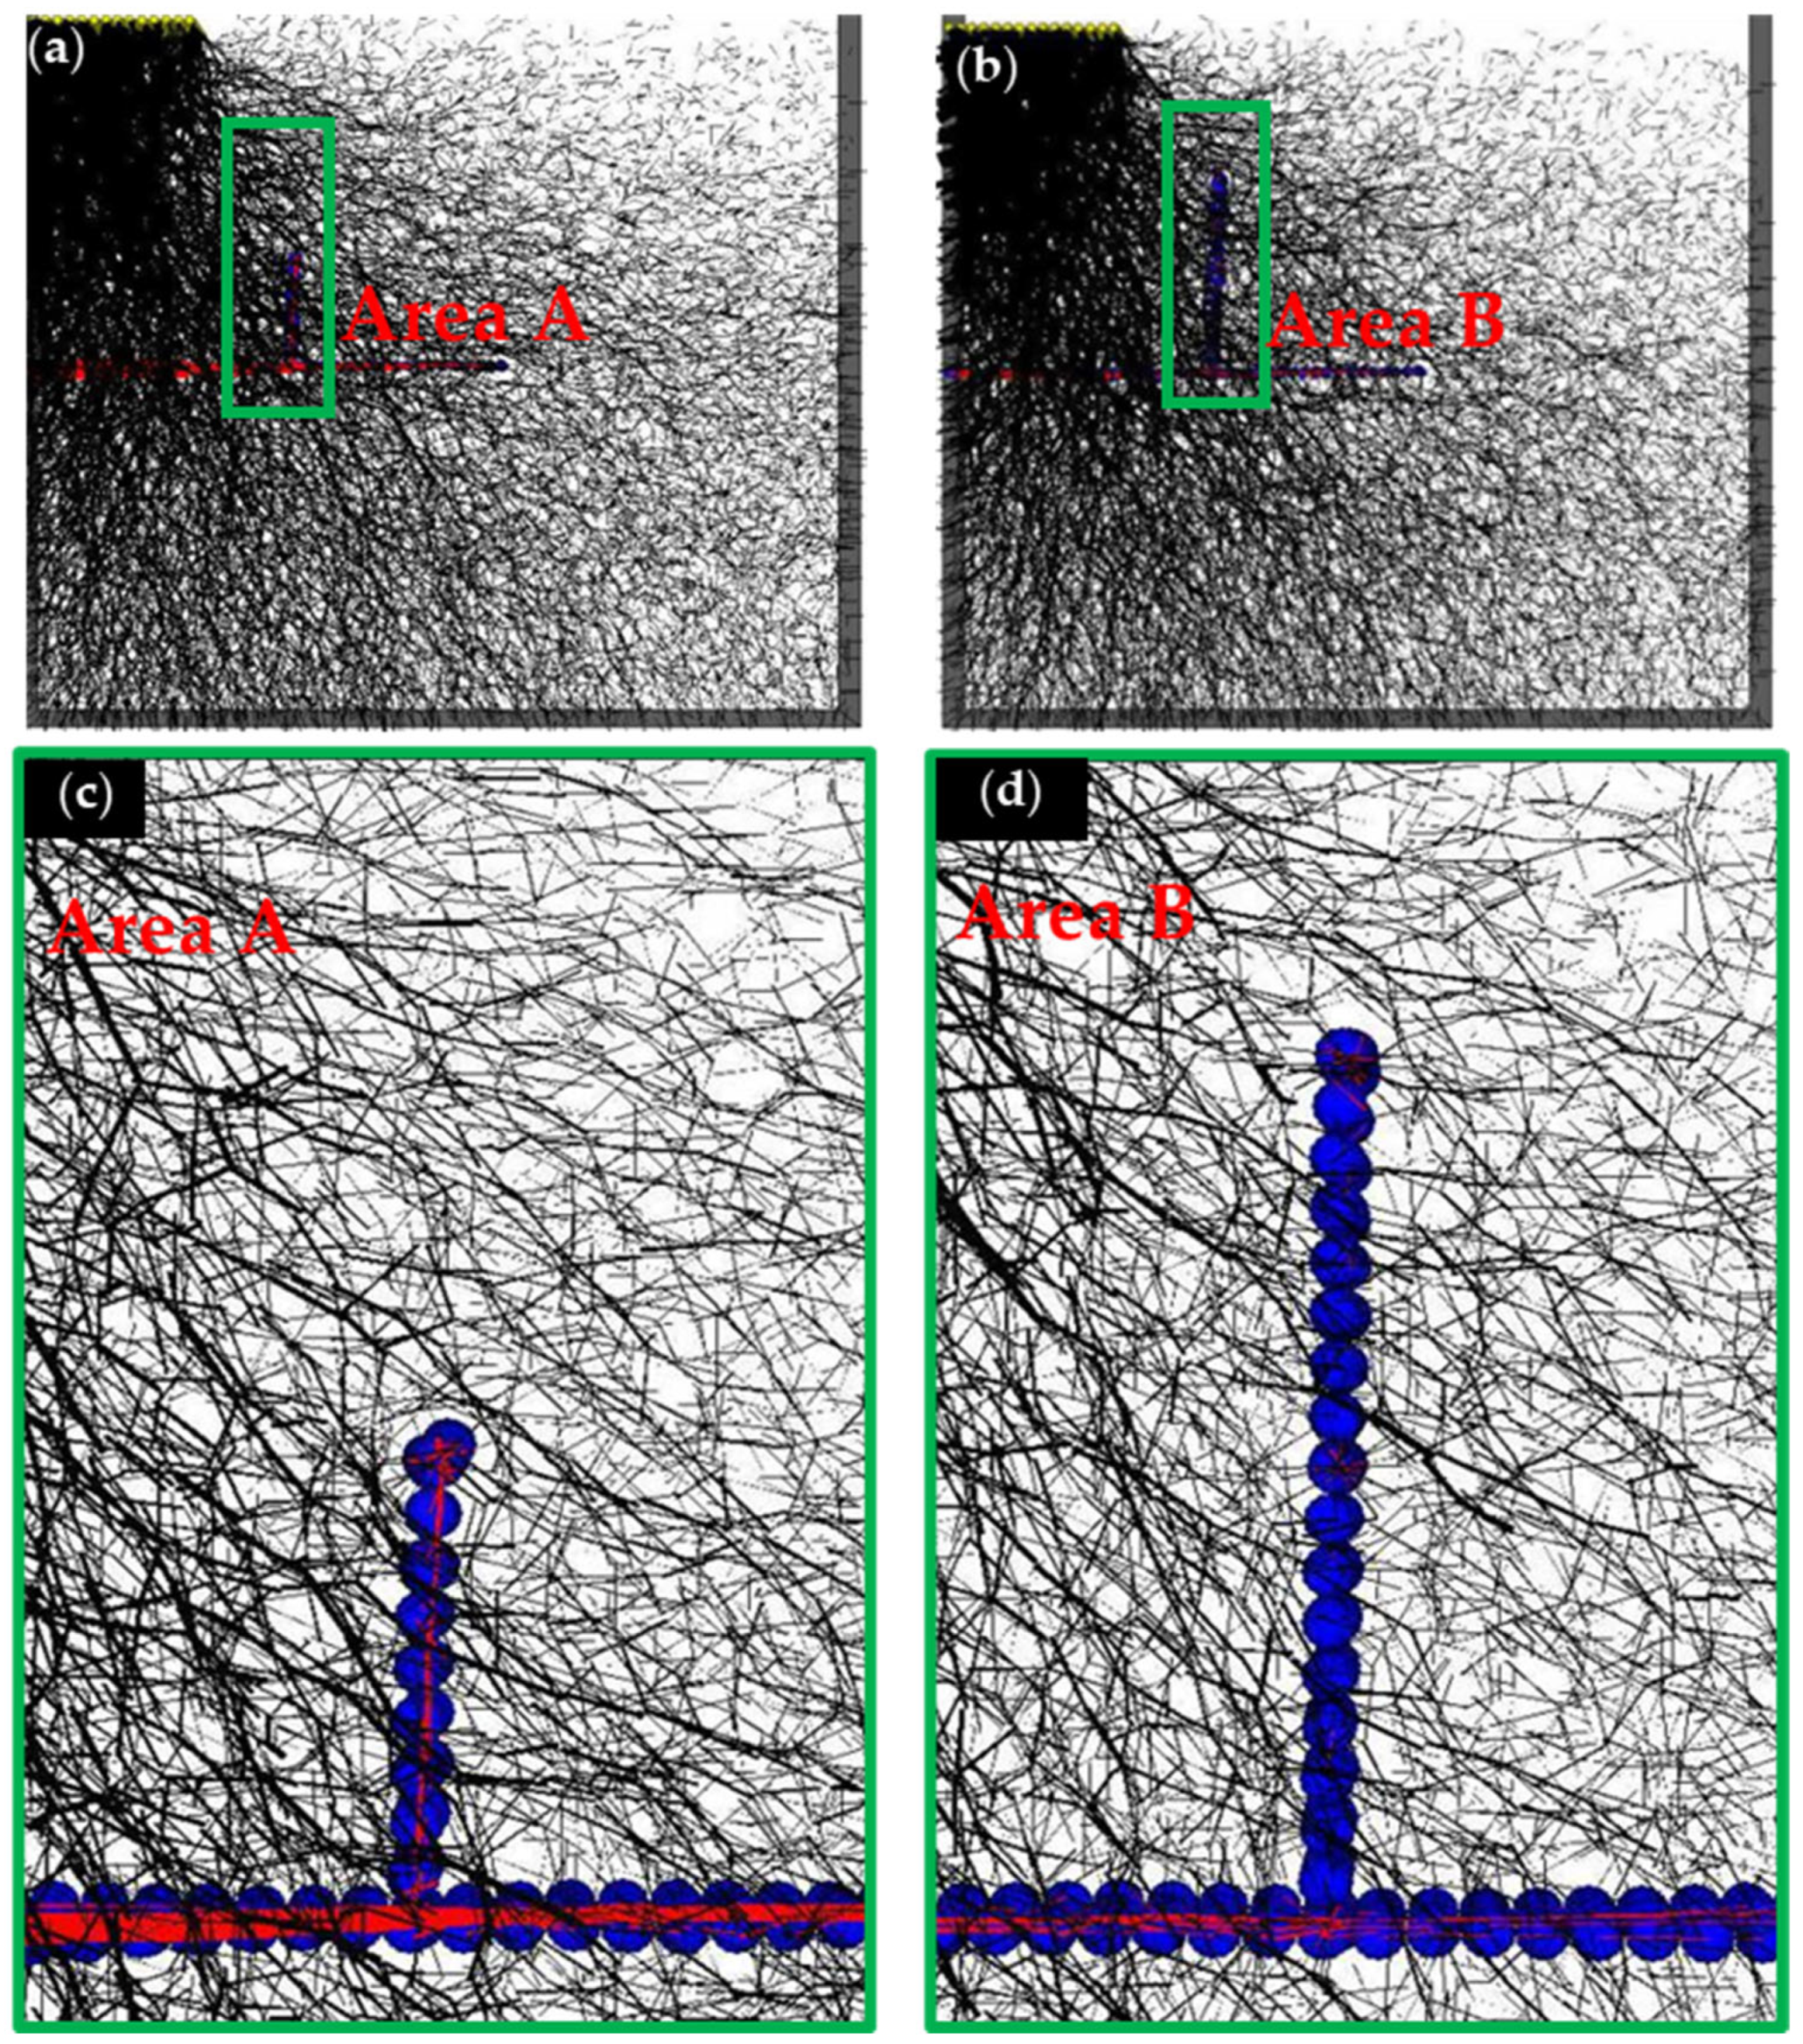
3.4. Contact Force distribution in the H–V Geogrid-Reinforced Foundation
3.5. Failure Theories
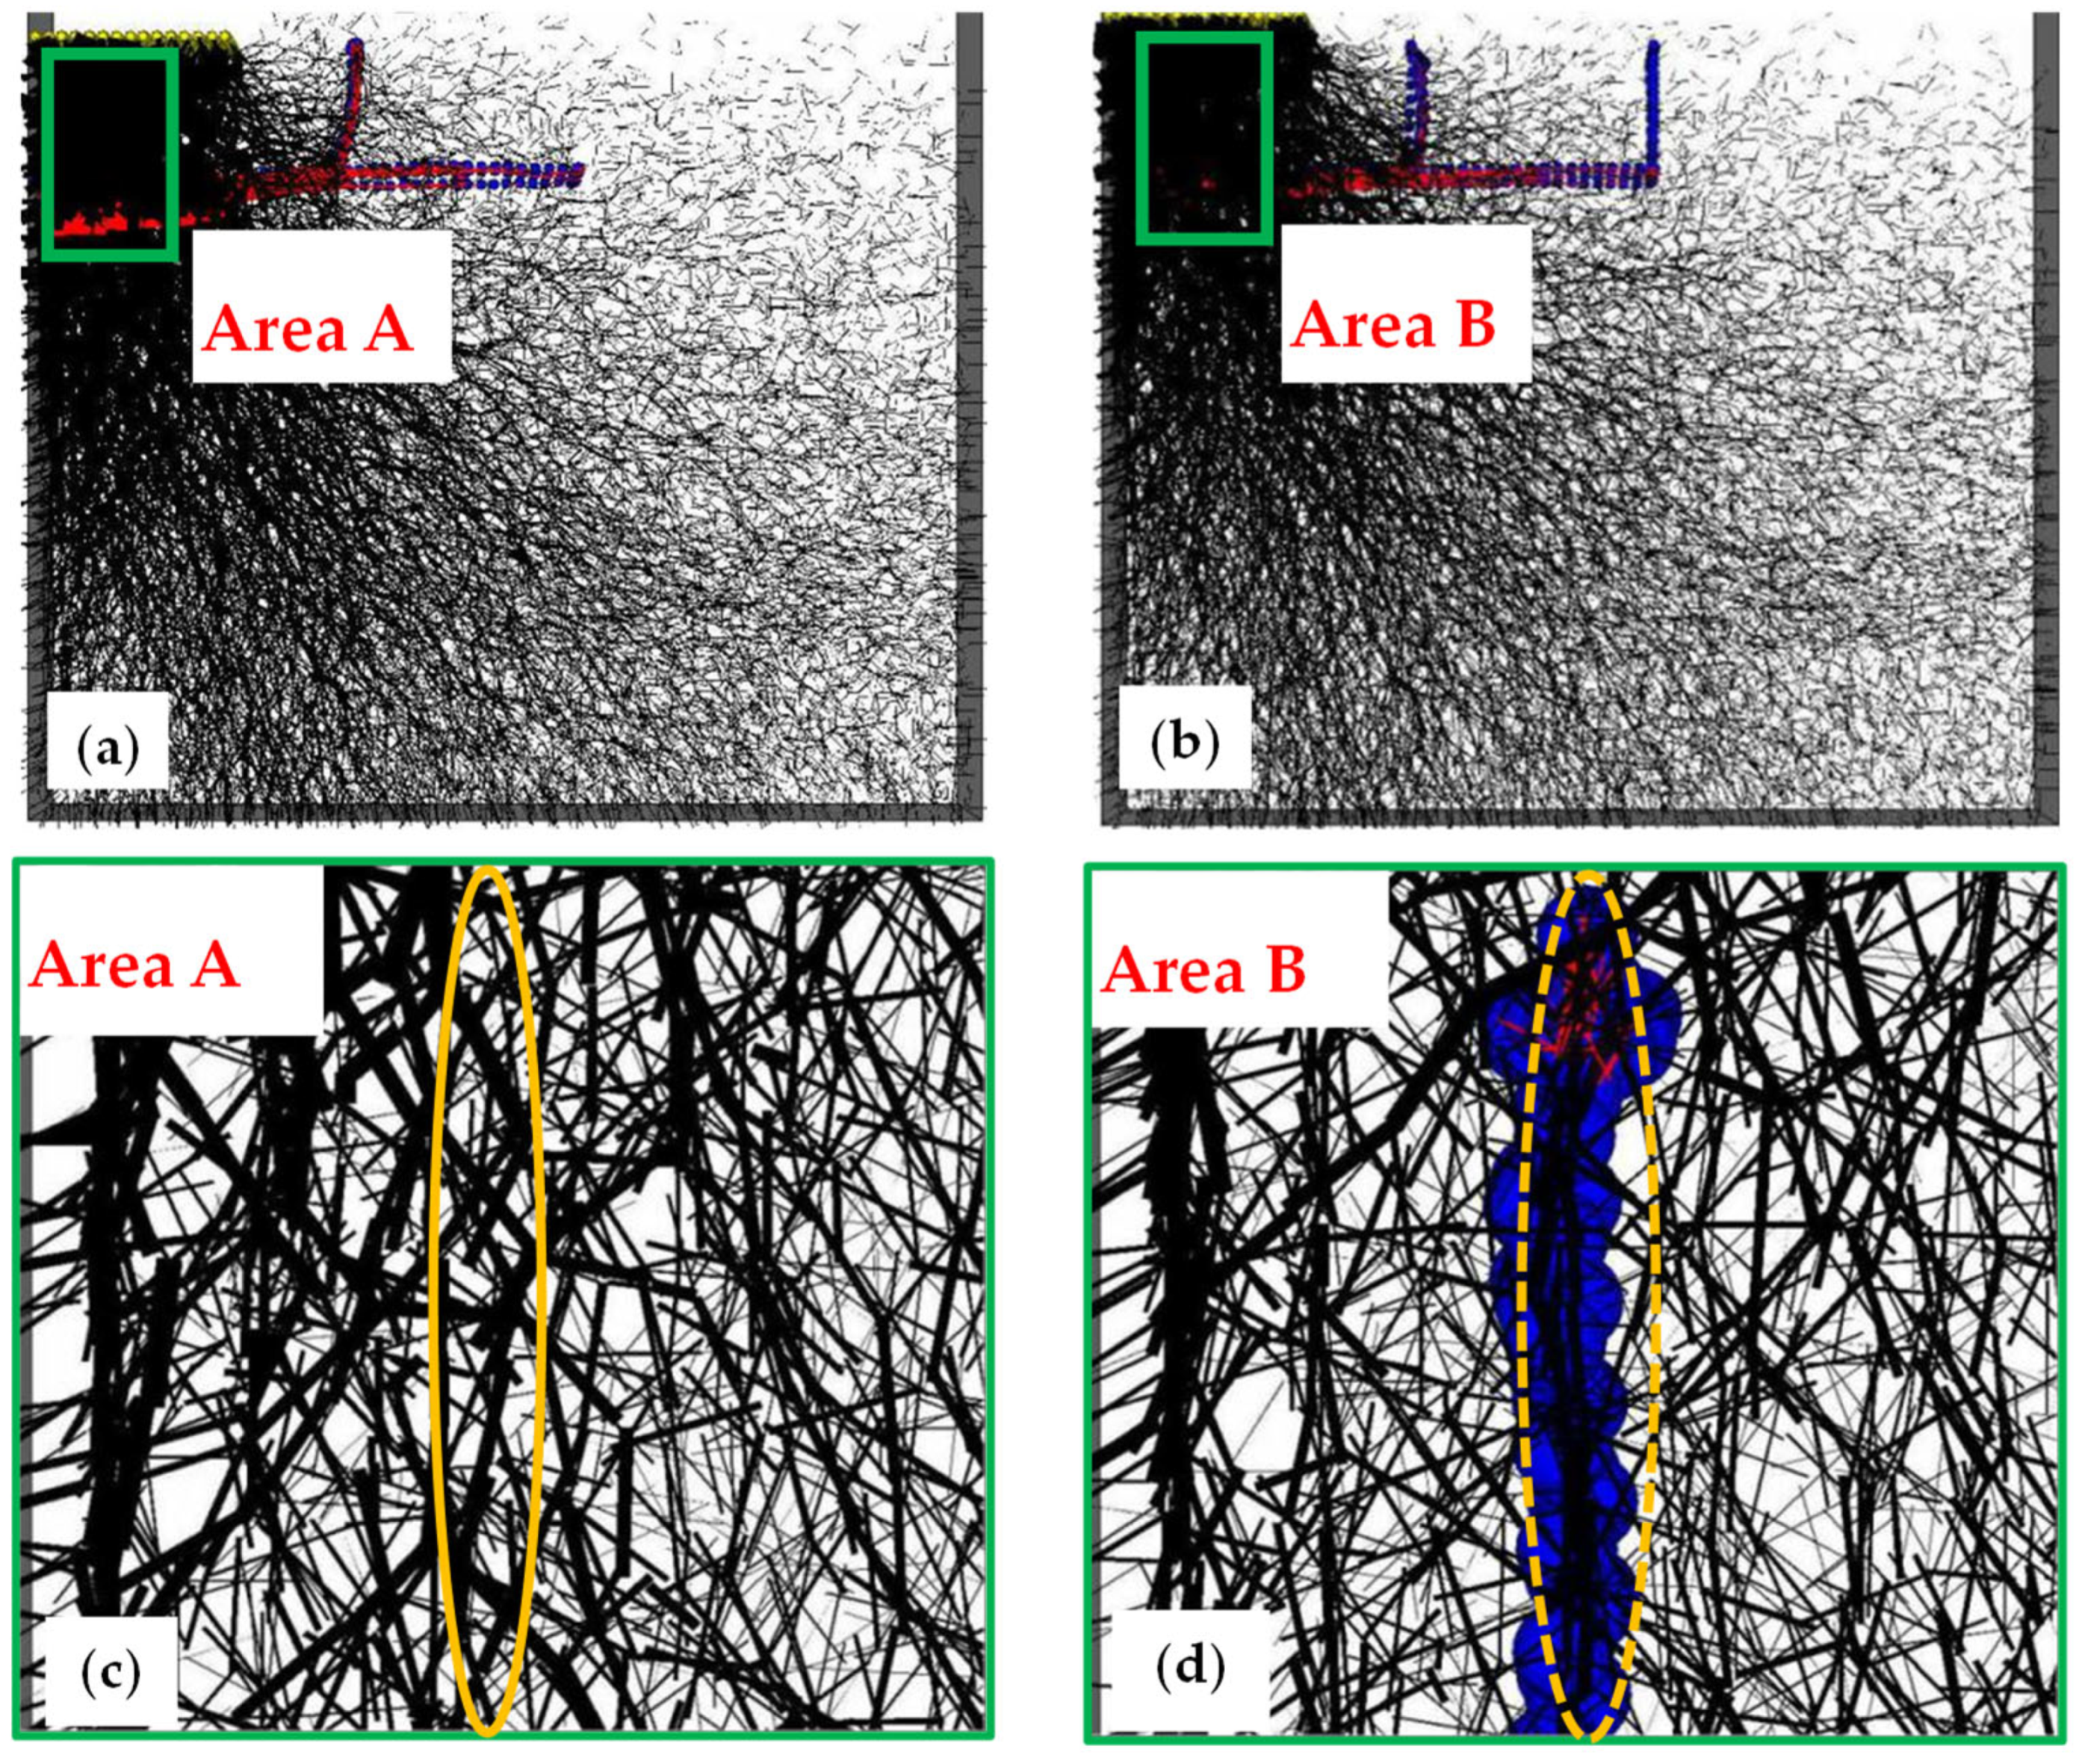
3.6. The Deformation of the H–V Geogrid
4. Conclusions
- (1)
- An embedment depth equivalent to the footing width improves the bearing capacity of the H–V geogrid-reinforced foundation compared to depths of 0.4 times the footing width, which has been identified as the optimal value in conventional geogrid-reinforced foundations. This increased embedment depth creates a deeper slip surface, impacting soil movement trajectory beyond immediate effects.
- (2)
- Boosting the height of vertical elements and introducing more of them significantly improves the bearing capacity of the H–V reinforced foundation. Foundations equipped with three pairs of vertical elements experience a significant boost, reaching 1.3 times the capacity compared to just one pair, and raising the vertical elements to 0.6 times the width of the footing results in 1.2 times the increase in capacity compared to those set at 0.3 times the footing width, with only a modest 12% uptick in geogrid usage. This underscores the strategic and economically beneficial reinforcement of vertical elements.
- (3)
- The vertical elements increase lateral restraint on the soil, reducing its movement and enhancing the “deep-footing” effect of the H–V geogrid. Heightened vertical elements also decrease soil displacement, aid in settling unevenness, and delay slip surface formation. They ensure uniform horizontal stress distribution during footing loading and minimize force chain deflection. Increasing the embedded depth of the H–V geogrid further strengthens lateral restraint, akin to conventional geogrids.
- (4)
- The H–V geogrid analysis reveals that transverse ribs deform more prominently near the footing’s center than longitudinal ribs. The confinement effect of vertical elements weakens with increasing horizontal distance from the center. Displacement of vertical elements rises from bottom to top, mainly towards the right, influenced by their connection to the longitudinal geogrid. Inflection points at around 1B and 1.5B from the center result from rigid connections between vertical and horizontal elements, reducing buckling and ensuring uniform reinforcement across the geogrid.
- (5)
- The approach provides a comprehensive understanding of how H–V geogrids differ from conventional geogrids and influence the overall performance of the reinforced foundation system. However, it is essential to note that soil properties such as cohesion, internal friction angle, water content, and the type and properties of the geogrid can significantly influence the bearing capacity of the H–V geogrid-reinforced foundation. Further investigation is warranted before its application in real-world practical engineering projects.
Author Contributions
Funding
Institutional Review Board Statement
Informed Consent Statement
Data Availability Statement
Conflicts of Interest
References
- Latha, G.M.; Venkateswarlu, H.; Krishna, A. Geocell Anchor Cage for enhanced load support in soil structures. Constr. Build. Mater. 2024, 425, 135998. [Google Scholar] [CrossRef]
- Dash, S.K.; Sireesh, S.; Sitharam, T.G. Model studies on circular footing supported on geocell reinforced sand underlain by soft clay. Geotext. Geomembr. 2003, 21, 197–219. [Google Scholar] [CrossRef]
- Zhang, M.X.; Javadi, A.A.; Min, X. Triaxial tests of sand reinforced with 3D inclusions. Geotext. Geomembr. 2006, 24, 201–209. [Google Scholar] [CrossRef]
- Boushehrian, A.H.; Hataf, N.; Ghahramani, A. Modeling of the cyclic behavior of shallow foundations resting on geomesh and grid-anchor reinforced sand. Geotext. Geomembr. 2011, 29, 242–248. [Google Scholar] [CrossRef]
- Makkar, F.M.; Chandrakaran, S.; Sankar, N. Behaviour of Model Square Footing Resting on Sand Reinforced with Three-Dimensional Geogrid. Int. J. Geosynth. Ground Eng. 2017, 3, 3. [Google Scholar] [CrossRef]
- Alimohammadi, H.; Zheng, J.; Schaefer, V.R.; Siekmeier, J.; Velasquez, R. Evaluation of geogrid reinforcement of flexible pavement performance: A review of large-scale laboratory studies. Transp. Geotech. 2021, 27, 100471. [Google Scholar] [CrossRef]
- Esmaeili, M.; Naderi, B.; Neyestanaki, H.K.; Khodaverdian, A. Investigating the effect of geogrid on stabilization of high railway embankments. Soils Found. 2018, 58, 319–332. [Google Scholar] [CrossRef]
- Bai, X.-H.; Huang, X.-Z.; Zhang, W. Bearing capacity of square footing supported by a geobelt-reinforced crushed stone cushion on soft soil. Geotext. Geomembr. 2013, 38, 37–42. [Google Scholar] [CrossRef]
- Xiao, C.; Gao, S.; Liu, H.; Du, Y. Case history on failure of geosynthetics-reinforced soil bridge approach retaining walls. Geotext. Geomembr. 2021, 49, 1585–1599. [Google Scholar] [CrossRef]
- Luo, F.; Huang, R.; Zhang, G. Centrifuge modeling of the geogrid-reinforced slope subjected to differential settlement. Acta Geotech. 2020, 15, 3027–3040. [Google Scholar] [CrossRef]
- Hegde, A.; Kadabinakatti, S.; Sitharam, T.G. Protection of Buried Pipelines Using a Combination of Geocell and Geogrid Reinforcement: Experimental Studies. In Ground Improvement and Geosynthetics; American Society of Civil Engineers (ASCE): Shanghai, China, 2014; pp. 289–298. [Google Scholar]
- Cicek, E.; Guler, E.; Yetimoglu, T. Effect of reinforcement length for different geosynthetic reinforcements on strip footing on sand soil. Soils Found. 2015, 55, 661–677. [Google Scholar] [CrossRef]
- Yetimoglu, T.; Wu Jonathan, T.H.; Saglamer, A. Bearing Capacity of Rectangular Footings on Geogrid-Reinforced Sand. J. Geotech. Eng. 1994, 120, 2083–2099. [Google Scholar] [CrossRef]
- Ghosh, A.; Ghosh, A.; Bera, A.K. Bearing capacity of square footing on pond ash reinforced with jute-geotextile. Geotext. Geomembr. 2005, 23, 144–173. [Google Scholar] [CrossRef]
- Bhandari, A.; Han, J. Investigation of geotextile–soil interaction under a cyclic vertical load using the discrete element method. Geotext. Geomembr. 2010, 28, 33–43. [Google Scholar] [CrossRef]
- Chen, J.; Bao, N.; Ma, C.; Sun, R. Triaxial behavior of unreinforced and geogrid-reinforced calcareous gravelly sand: Experiment and discrete element modelling. Constr. Build. Mater. 2024, 430, 136405. [Google Scholar] [CrossRef]
- Poorahong, H.; Jamsawang, P.; Thanasisathit, N.; Jongpradist, P.; Jing, G. Performance of a triaxial geogrid-reinforced crushed rock base underlain by a soft clay subgrade. Case Stud. Constr. Mater. 2024, 20, e03198. [Google Scholar] [CrossRef]
- Du, W.; Nie, R.; Qi, Y.; Ruan, B.; Mo, F. Investigation on the static performance of geogrid reinforced aeolian sand railway embankment: Field test and discrete element simulation. Geotext. Geomembr. 2024. [Google Scholar] [CrossRef]
- Hou, J.; Zhang, M.; Li, P. Simulation study of foundations reinforced with horizontal-vertical inclusions using particle flow code. J. Shanghai Jiaotong Univ. (Sci.) 2013, 18, 311–316. [Google Scholar] [CrossRef]
- Cheng, P.; Liu, Y.; Li, Y.P.; Yi, J.T. A large deformation finite element analysis of uplift behaviour for helical anchor in spatially variable clay. Comput. Geotech. 2022, 141, 104542. [Google Scholar] [CrossRef]
- Mahmood, A.A.; Elektorowicz, M. A review of discrete element method research on particulate systems. IOP Conf. Ser. Mater. Sci. Eng. 2016, 136, 012034. [Google Scholar] [CrossRef]
- Xu, F.; Moayedi, H.; Foong, L.K.; Moghadam, M.J.; Zangeneh, M. Laboratory and numerical analysis of geogrid encased stone columns. Measurement 2021, 169, 108369. [Google Scholar] [CrossRef]
- Zheng, G.; Yu, X.; Zhou, H.; Yang, X.; Guo, W.; Yang, P. Influence of geosynthetic reinforcement on the stability of an embankment with rigid columns embedded in an inclined underlying stratum. Geotext. Geomembr. 2021, 49, 180–187. [Google Scholar] [CrossRef]
- Han, J.; Bhandari, A.; Wang, F. DEM Analysis of Stresses and Deformations of Geogrid-Reinforced Embankments over Piles. Int. J. Geomech. 2012, 12, 340–350. [Google Scholar] [CrossRef]
- Ngo, N.T.; Indraratna, B.; Rujikiatkamjorn, C. DEM simulation of the behaviour of geogrid stabilised ballast fouled with coal. Comput. Geotech. 2014, 55, 224–231. [Google Scholar] [CrossRef]
- Zhou, W.; Yang, L.; Ma, G.; Chang, X.; Cheng, Y.; Li, D. Macro–micro responses of crushable granular materials in simulated true triaxial tests. Granul. Matter 2015, 17, 497–509. [Google Scholar] [CrossRef]
- Zhou, W.; Yang, L.; Ma, G.; Chang, X.; Lai, Z.; Xu, K. DEM analysis of the size effects on the behavior of crushable granular materials. Granul. Matter 2016, 18, 64. [Google Scholar] [CrossRef]
- Hou, J.; Li, H.; Liu, L.; Wang, S.; Teng, Y.; Bao, S. A DEM analysis of geomembrane-lined landfill subject to vertical loading. Geotext. Geomembr. 2021, 49, 369–375. [Google Scholar] [CrossRef]
- Chen, X.-J.; Fang, P.-P.; Chen, Q.-N.; Hu, J.; Yao, K.; Liu, Y. Influence of cutterhead opening ratio on soil arching effect and face stability during tunnelling through non-uniform soils. Undergr. Space 2024, 17, 45–59. [Google Scholar] [CrossRef]
- Cundall, P.A.; Strack, O.D. A discrete numerical model for granular assemblies. Geotechnique 1979, 29, 47–65. [Google Scholar] [CrossRef]
- Zhao, T.; Dai, F.; Xu, N.; Liu, Y.; Xu, Y. A composite particle model for non-spherical particles in DEM simulations. Granul. Matter 2015, 17, 763–774. [Google Scholar] [CrossRef]
- Feng, S.-J.; Wang, Y.-Q.; Chen, H.-X. DEM simulation of geotextile-geomembrane interface direct shear test considering the interlocking and wearing processes. Comput. Geotech. 2022, 148, 104805. [Google Scholar] [CrossRef]
- Calvetti, F.; Di Prisco, C.; Nova, R. Experimental and Numerical Analysis of Soil–Pipe Interaction. J. Geotech. Geoenviron. Eng. 2004, 130, 1292–1299. [Google Scholar] [CrossRef]
- Wang, Z.; Klapperich, H.; Ziegler, M. Discrete Element Modeling of Geogrid Reinforced Soil; Lehrstuhl für Geotechnik im Bauwesen und Institut für Grundbau: Aachen, Germany, 2016. [Google Scholar]
- Saha Roy, S.; Deb, K. Bearing capacity of rectangular footings on multilayer geosynthetic-reinforced granular fill over soft soil. Int. J. Geomech. 2017, 17, 04017069. [Google Scholar] [CrossRef]
- Saha Roy, S.; Deb, K. Effects of aspect ratio of footings on bearing capacity for geogrid-reinforced sand over soft soil. Geosynth. Int. 2017, 24, 362–382. [Google Scholar] [CrossRef]
- Hou, J.; Liu, S.; Nam, B.; Ma, Y. Bearing Capacity and Mechanism of the H–V Geogrid-Reinforced Foundation. Polymers 2023, 15, 2606. [Google Scholar] [CrossRef] [PubMed]
- Wang, Z.; Jacobs, F.; Ziegler, M.; Yang, G. Visualisation and quantification of geogrid reinforcing effects under strip footing loads using discrete element method. Geotext. Geomembr. 2020, 48, 62–70. [Google Scholar] [CrossRef]
- Huang, C.; Hong, L. Ultimate Bearing Capacity and Settlement of Footings on Reinforced Sandy Ground. Soils Found. 2000, 40, 65–73. [Google Scholar] [CrossRef]
- Huang, C.C.; Menq, F.Y. Deep-Footing and Wide-Slab Effects in Reinforced Sandy Ground. J. Geotech. Geoenviron. Eng. 1997, 123, 30–36. [Google Scholar] [CrossRef]
- Zhang, T.-T.; Zhang, M.-X.; Juan, H. Bearing Capacity Behavior and Failure Modes of HV Reinforcement Foundation Based on Strength Reduction Finite Element Method. J. Shanghai Jiaotong Univ. 2011, 45, 757. [Google Scholar]
- Li, J.; Tian, Y.; Cassidy, M.J. Failure mechanism and bearing capacity of footings buried at various depths in spatially random soil. J. Geotech. Geoenviron. Eng. 2015, 141, 04014099. [Google Scholar] [CrossRef]


| Parameter | Sand | Geogrid | Model Box | Footing |
|---|---|---|---|---|
| Normal stiffness (N/m) | 5×10⁵ | 6 × 10⁷ | 5 × 10⁵ | 5 × 10⁶ |
| Shear stiffness (N/m) | 5 × 10⁵ | 1 × 10⁷ | 5 × 10⁵ | 5 × 10⁶ |
| Density (kg/m3) | 2.63 × 10³ | 3 × 10³ | – | 2 × 10³ |
| Particle radius (m) | 0.4 × 10⁻² | 2.5 × 10⁻³ | – | 0.5 × 10⁻² |
| Friction coefficient | 0.7 | 0.5 | 0.7 | 0 |
| Normal contact bond strength (N) | 0 | 1 × 10⁴ | – | – |
| Shear contact bond strength (N) | 0 | 1 × 10⁴ | – | – |
| Parallel bond gap | 0 | 10 | – | – |
| Shear parallel bond strength (Pa) | 0 | 1 × 10⁸ | – | – |
| Normal parallel bond strength (Pa) | 1 × 10⁸ | |||
| Shear parallel bond stiffness (Pa/m) | 3 × 10⁶ | |||
| Normal parallel bond stiffness (Pa/m) | 6 × 10⁷ |
| No. | z/B | L/B | l/B | v/B |
|---|---|---|---|---|
| 1 | 0.4 | 2.7 | 1.5 | 0.3 |
| 2 | 1.0 | 1.5 | 0.3 | |
| 3 | 1.0 | 1.5 | 0.6 | |
| 4 | 0.4 | 0.3, 1.5, 2.7 | 0.3 |
Disclaimer/Publisher’s Note: The statements, opinions and data contained in all publications are solely those of the individual author(s) and contributor(s) and not of MDPI and/or the editor(s). MDPI and/or the editor(s) disclaim responsibility for any injury to people or property resulting from any ideas, methods, instructions or products referred to in the content. |
© 2024 by the authors. Licensee MDPI, Basel, Switzerland. This article is an open access article distributed under the terms and conditions of the Creative Commons Attribution (CC BY) license (https://creativecommons.org/licenses/by/4.0/).
Share and Cite
Wu, J.; Zhang, F.; Gao, L.; Hou, J. Bearing Capacity and Reinforced Mechanisms of Horizontal–Vertical Geogrid in Foundations: PFC3D Study. Buildings 2024, 14, 1533. https://doi.org/10.3390/buildings14061533
Wu J, Zhang F, Gao L, Hou J. Bearing Capacity and Reinforced Mechanisms of Horizontal–Vertical Geogrid in Foundations: PFC3D Study. Buildings. 2024; 14(6):1533. https://doi.org/10.3390/buildings14061533
Chicago/Turabian StyleWu, Jinjun, Fabin Zhang, Liang Gao, and Juan Hou. 2024. "Bearing Capacity and Reinforced Mechanisms of Horizontal–Vertical Geogrid in Foundations: PFC3D Study" Buildings 14, no. 6: 1533. https://doi.org/10.3390/buildings14061533
APA StyleWu, J., Zhang, F., Gao, L., & Hou, J. (2024). Bearing Capacity and Reinforced Mechanisms of Horizontal–Vertical Geogrid in Foundations: PFC3D Study. Buildings, 14(6), 1533. https://doi.org/10.3390/buildings14061533