Abstract
People spend up to 45% of their time in their living space, which has a major impact on their physical and mental health, behaviour, happiness and overall life satisfaction. In these times of rapid change and new, modern demands on living, it is necessary to understand the needs of residents and current design trends in order to incorporate both into the design of new living spaces. The aim of this study is to use the views of residents and architects collected through surveys to rank apartments and identify differences in the definition of what a high-quality apartment would be based on their spatial characteristics. The previously developed Housing Quality Assessment Model was used to assess the 126 most represented apartment layouts in the city of Osijek, Croatia, built since 1930. Apartment layouts were further divided according to the time of their construction, location, and size for comparison purposes. The research shows that residents rated apartments with higher ratings than architects in all categories and that residents and architects gave different ratings on certain characteristics of the apartment, e.g., the existence of additional storage space, the existence of a bathroom window, the size and orientation of living rooms, the type of spatial organisation, etc.
1. Introduction
Housing offers a sense of personal security, privacy and personal space [] and has a great impact on its residents. It encompasses all the infrastructure, utilities and services necessary for human survival, including access to employment and security []. According to the United Nations Universal Declaration of Human Rights [], everyone has the right to an adequate standard of living, which includes housing. As people generally spend about 90% of their time indoors and 45% in their homes [], it is important to provide them with a high-quality, healthy and adaptable space that meets all of their housing needs. As housing is a fundamental necessity and an important factor for the general quality of life [], it is essential to assess the extent to which the current living environment meets the needs, expectations, and aspirations of the residents []. The quality of housing should be considered at all stages of planning, design, construction and maintenance of housing stock. Knowledge and understanding of occupant’s needs is important for all stakeholders involved in the construction and operation of housing, and these needs should be clearly recognized and addressed in a timely manner, as preferences are constantly changing [].
Location and living conditions (social, spatial, physical and urban) have become very important for a large number of people due to the recent pandemic []. In addition, today, people expect high housing quality when buying a property, and there is an increasing need for scientifically sound methods for the systematic assessment of housing that is able to take into account multiple, contradictory, and incompatible aspects [].
Since housing is one of the most expensive purchases people make in their lives and a crucial factor for their well-being [], it is necessary to know their housing needs and desires, which should be included in the planning of new housing stock. The definition of housing quality embraces many factors which include the physical condition of the building and other facilities and services that make living in a particular area desirable []. This study focuses only on the physical characteristics of the apartment, while other aspects of housing quality will be investigated in future studies. Research on the quality of apartments, more precisely their spatial characteristics, was conducted in the city of Osijek, the fourth largest city in the Republic of Croatia and the centre of Osijek-Baranja County, an agricultural region in the eastern part of the country. Osijek is a lowland city that has developed along the Drava River and covers an area of around 170 km2. According to the 2021 census, the urban area of Osijek had 75,535 inhabitants living in 42,132 housing units []. In Croatia, there are no guidelines or regulations that govern the design of apartments in detail, with the exception of the ordinance that governs the construction of socially subsidized housing (in Croatian: Program društveno poticane stano- gradnje or abbreviated POS), and as such, it is not binding for other developers and architects. The POS program was launched with the aim of enabling the citizens of the Republic of Croatia to solve the housing problem under much more favourable conditions than the market conditions []. Additionally, this regulation only specifies some spatial characteristics of the apartment, in particular, the size of the apartment, which rooms an apartment of a certain size must have and the net usable area of the rooms.
For the purposes of the study, the Housing Quality Assessment Model (HQAM) developed in previous research by the first author was used []. The model was applied to an identical sample of 126 apartment layouts in the city of Osijek (which constitute a significant portion of apartment building stock). The first part of the study relates to the survey of the opinions of users and architects. The average or majority opinion of the residents on the individual spatial characteristics of the apartment was taken from the previous survey, while the opinion of the architects was obtained in March 2024 on the basis of the same questionnaire.
The aim of the study is to determine the ratings of residents and architects for the most represented apartments in the city of Osijek in order to be able to determine whether there are differences between the opinions of the two groups. Based on the ratings, a secondary aim is to determine which spatial characteristics are present in the apartments that are rated best and in those that are rated the worst by both groups.
The additional goal is to compare apartment ratings according to year of their construction (five periods of housing policies), location (seven city districts) and size (number of rooms in apartment) in order to gain an insight into the current state and characteristics of the Osijek housing stock. The results of the study will show the profession (architects) the residents’ opinions and determine to what extent the current housing stock follows new and modern demands on living in these times of rapid change. Also, it is expected that the results of the conducted research described in this paper will give insight into the level of understanding that the residents have about the quality housing, i.e., whether they understand the basic postulates of a healthy and high-quality design of apartments, as they are defined in scientific research and proven in practice.
Existing studies have shown that poor housing quality is associated with residents’ poor physical and mental health [,]. In addition, studies have shown that the physical qualities of the home have a positive impact on productivity [], happiness and life satisfaction [], with housing satisfaction being one of the most important indicators []. Most research on housing quality is based on residential satisfaction [,,], which is a multidimensional and very complex construct [] that researchers define as the gap between a respondent’s needs and aspirations and the reality of the current residential context [,]. The concept of housing satisfaction relates to how a consumer of a housing product reacts to the overall components of such product, predicated on their taste as indicated by his expectations [].
So far, residential satisfaction and, thus, the quality of housing in different countries has been examined on the basis of different domains and criteria, considering different resident characteristics and different types of housing. Studies have been carried out in Europe [,,,], Asia [,,], America [,], Africa [,,] and Australia [,] to investigate the quality of housing in large housing estates [], affordable housing [,,], public [,,] and private housing estates [,]. The surveys involved tenants in rental housing [,], low-income communities [,], students and young people [,,], the elderly population [,], etc. Also, previous studies assessed the residential quality using different dimensions and criteria, as well as evaluation tools. []. The results of these studies tend to vary from country to country, suggesting that housing satisfaction is a very context-dependent construct [] and that appropriate studies are needed in case-specific situations.
Some of the significant conclusions of previous research are: residential satisfaction is driven by housing characteristics []; dwelling size is demonstrated to be a strong indicator of residential satisfaction, and helpful apartment amenities are a source of residential comfort; the quality of the apartment design is an important component in measuring housing quality [].
Looking at the spatial characteristics of the apartment that are the focus of this study, the literature shows that small living spaces and poor quality private open spaces have a negative impact on mental health []. In contrast, good natural light and ventilation, the interior space and layout, a private outdoor area [] and adequate storage space are associated with positive mental wellbeing []. In addition, small openings that do not allow the necessary light into the apartment lead to lower productivity and the health of residents is linked to the apartment ventilation []. The research conducted during and after the pandemic points to the importance of flexible apartment layouts and living spaces [,] and to the introduction of zoning to make apartments more sustainable and adaptable to changing needs and different lifestyles []. Research on housing in Turkey showed how residents’ perception of apartment size, orientation, and size of different spaces has an important role in residents’ happiness []. Different studies reveal how interior layout, arrangement and size of living rooms, kitchens, bedrooms and bathrooms [], design of living rooms, bathrooms and toilets [], bedrooms and kitchen locations, dining area/room size [] and adaptability [] influence residential satisfaction.
The available data show that the opinions of architects and residents are the same regarding certain spatial characteristics of the apartment, while in some, they differ. For example, in the 2022 Iranian survey [] on the role, function and influence of balconies, the results showed that a high percentage of residents emphasized the importance of an adequate balcony. Moreover, they preferred south-facing balconies connected to the living room over the bedroom or kitchen [], while residents in a South Korean study preferred balconies connected to bedrooms []. A Polish study on the use of apartment balconies revealed that residents favoured north-facing balconies, while architects preferred south orientation with balconies connected to the living room []. Interestingly, the study on the opinion of clients, valuers, realtors and architects on the importance of south-facing orientation and natural cross-ventilation of the apartment showed that most of the apartment clients are not aware of the importance of these apartment characteristics [].
In an Australian study on child- and family-friendly apartment design, residents (parents) warned that apartment open spaces were often of unusable size, while architects argued the need for high-quality and flexible balcony space []. In this study, the architects did not make any recommendations for the size of the balcony, but the Polish architects are of the opinion that an area of 2.5 to 5.0 m2 is sufficient [].
The results of a Chinese study on the floor plans of medium-sized apartments show that the number of rooms and the storage space are important criteria for the residents’ evaluation of apartments []. The same study shows that a separate storage room is not required in a small apartment, but a dining room and a study area are considered mandatory. Similarly, the results of an Australian study from 2023 show that the residents of an apartment prefer a separate dining area [].
In a Swedish quantitative study of contemporary apartment floor plans remodelled by end-users, it was found that residents converted apartments with circular connections between rooms into rooms that become pass-through spaces []. A Czech study on differences in floor plan preferences between architects and non-architects revealed that the groups disagree on apartment layouts in terms of connections between rooms. While architects prefer an apartment with a central living room and a separate private zone, non-architects favoured the layout of the socialist prefabricated apartment with a corridor connecting all rooms in the apartment [].
In addition to previously mentioned studies, various tools, models and systems have been developed to define the quality of housing, some of them are listed below. In 1974, in France, the Association Qualitel (AQ) developed a tool that contained a series of indicators that were simple and easy to understand even for non-experts in the field of housing []. Every year, AQ conducts a survey called the Qualitel barometer, which measures the satisfaction levels of residents and their main expectations regarding housing []. The Housing Quality Indicator (HQI) and Design Quality Indicator (DQI) systems were developed in the United Kingdom in the late 1990s. The HQI (1998–2023) contained 10 indicators related to (i) visual impact, layout and landscaping, open space and routes and movement of site, (ii) size, layout, noise, light, services, adaptability, accessibility within the unit and sustainability of the unit and the external environment to determine the quality of the site, and (iii) the external environment []. Each indicator comprised a series of questions and was scored out of a tenth of the total possible score and residents of the HQI also had the option to change the weighting of each indicator. The DQI is a tool that addresses the problem of building quality and is useful for investors and residents. To facilitate comparison between different respondent groups, the results are presented graphically []. The Swiss instrument Système d’evaluation de logements (SEL) contains 25 indicators and measures the quality of the building on the basis of three dimensions: site location, building and apartment []. In the mid-2000s, a Housing Performance Evaluation Model (HPEM) for multi-family housing was developed in Korea to promote housing quality improvement initiatives and support homebuyers’ decision-making when comparing and selecting housing []. In Pakistan, an HQD (Housing Quality Determinants) was developed for the assessment of affordable housing []. In 2016, Le et al. [] developed a system of indicators to measure the quality of social housing in Vietnam. This tool is useful for investors and consultants as well as non-professionals to make a better decision about buying a home. The Mexican Housing Evaluation Methodology (HEM) comprises 51 criteria divided into social, physical, spatial and urban dimensions, with some of the indicators for the spatial dimension being the quality of bedrooms, kitchen, natural ventilation and sunlight [].
The Home Quality Mark (HQM) certification developed by the Building Research Establishment (BRE) shows potential buyers and tenants the quality of their homes []. It comprises 11 different categories of criteria, including the ‘comfort category’, which assesses daylight, noise, sound insulation, ventilation, temperature and air pollutants. The American WELL Performance Rating addresses seven topics related to the performance of indoor air quality, water quality management, lighting measurements, thermal conditions, acoustic performance, environmental monitoring and occupant experience []. The Green Building Council has published a report on health and well-being in homes, which contains five categories for healthy homes, including the interior design category noise protection, interior colour and quality conditions for living spaces, kitchens, laundry rooms, bedrooms and storage rooms. This is not a set framework, but it can provide key stakeholders with information on how to measure their projects [].
These tools assess housing quality on the basis of many dimensions (e.g., housing, building, location, neighbourhood, socio-economic dimension, etc.), but often, a dimension is only determined by a few indicators that do not allow a realistic assessment of that dimension []. Since potential residents come from different economic backgrounds, live in different countries, climates and cultures, and have different perceptions of housing quality, a single, standardised assessment tool may not be appropriate []. Finally, the family structure [], the needs [] and the personal characteristics of the residents [] lead to different expectations of the home. For this reason, the residents’ attitudes, needs and wishes must be taken into account in the home assessment [].
This section presents the problem definition and the aim of the study, an overview of existing research work and existing methods and models on housing quality. The procedure for conducting the study is presented in the Materials and methods section. The third section contains the results where the ratings of selected apartments in the city of Osijek are presented from the residents’ and the architectural (professional) point of view. The second to last section is the discussion, in which the two sets of apartment ratings are compared, followed by the conclusions.
2. Materials and Methods
The study of the quality of spatial characteristics of housing in the city of Osijek was carried out using the Housing Quality Assessment Model (HQAM). The model was developed as part of previous research by the first author presented in a paper published in 2023 []. The HQAM was used because it was the most suitable for the purpose of this research. It was developed to be able to gather the opinions of both architects and residents, and it refers exclusively to spatial criteria of apartments, compared to other models that contain different dimensions, each of which is represented by only a few indicators. During the research and development of the model, through several iterations of interviews and surveys with both architects and residents, criteria categories were selected and reviewed, as well as the spatial criteria of the apartment itself. Therefore, it contains the most comprehensive set of criteria on spatial characteristics. Also, it was possible to apply HQAM to both groups of respondents, as the survey, which is an integral part of the model, was adapted to be understood by both experts and non-experts in housing. HQAM is programmed in a Microsoft Office 15 Excel spreadsheet. Input data for the model consisted of the data on apartments in the city of Osijek and survey results on spatial characteristics of apartments from both residents who live in apartments [] and the architects who design residential buildings.
In this paper, the term one-room (1 R) apartment is used for an apartment that contains a living room, a kitchen, a bathroom and most often some type of outdoor space (usually a loggia), while in a studio apartment, the kitchen area is an integral part of the living room area. A room is a space in which two people can sleep (larger than 10 m2), while a half-room is a space used by one person and is usually no larger than 8 m2. It should be noted that according to the current regulations in Croatia, the living room is considered a room []. In that context, two and a half room apartment (2.5 R) means that the apartment has a living room, a kitchen, a bathroom, a bedroom and a half-room. In the presentation of the results and in the discussion section, the word apartment is often used instead of apartment floor plans.
Phases of the research presented in this paper are shown in the diagram in Figure 1 and described in more detail below.
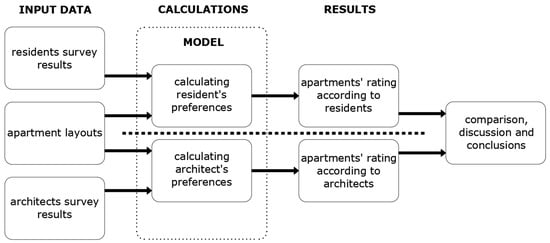
Figure 1.
Phases in the implementation of research work.
2.1. Housing Quality Assessment Model
The following is a brief description of how the HQAM works, while a detailed description of the selection of criteria for apartment assessment and the development of the model and how it works (criteria categories, criteria within a category and the method of awarding points within the model) can be found in a previously published paper [].
The operations in the model are carried out in three preparatory actions: collection of data on spatial characteristics of apartments (SCA), determination of the importance of each indicator category (IC) of apartment characteristics (AC) and definition of the importance of each indicator (II) for a person or, in the case of this research, a group of people (residents or architects) who carry out the assessment. HQAM works in seven steps in which the rating for each of the assessed apartments is calculated. These seven steps are as follows:
- Entering general apartment information into the model;
- Entering data on the importance of each category of indicators into the model;
- The model calculates the share of the indicator categories in the overall rating;
- Data entry on the importance of each indicator within each indicator category;
- The model awards points for each indicator;
- The model calculates a rating for each indicator category;
- The model defines the overall rating of the apartment (AR) [].
Figure 2 [] shows the relationship between all the preparatory actions and steps of the model, while Equation (1) [] gives the formula on the basis of which the model calculated points and on the basis of which the Excel spreadsheet was programmed to calculate overall apartment ratings. It should be noted that the HQAM was modified for the purposes of this study so that all criteria categories are equally important, i.e., they are included in the overall assessment with a share of 20%, which ensures the comparability of the assessment results from the perspective of the residents and the architects.
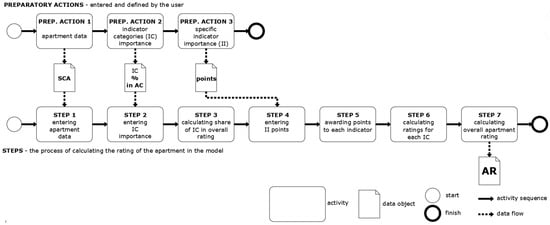
Figure 2.
Graphical representation of the model [].
- AR—overall apartment rating
- —the number of points achieved by the indicator within a certain indicator category
- —share of the indicator category in the total score
- —number of indicators within an indicator category
- IC—indicator categories:
- (ar)—additional rooms
- (rs)—room size
- (wo)—windows orientation and ventilation
- (ci)—circulation
- (so)—spatial organization
- n and m—vary and depend on the number of rooms in the evaluated apartment
According to the equation, the overall apartment rating (AR) is equal to the sum of the ratings of the five indicator categories (IC) used to evaluate the SCA []. It should be noted that the number of indicators within the room size and window orientation categories varies and depends on the number of rooms in the assessed apartment. The points are assigned to individual spatial characteristics of the apartment in the model in one of three ways, depending on the characteristic. For the first type, the respondent group (residents or architects) ranks the desirability of the characteristic on a 5-point Likert scale. If the respondent ranks the characteristic as desirable (4 or 5) and the apartment has the characteristic, one point is awarded; if it does not, then no points are awarded. Similarly, if the characteristic is not desirable (1 or 2) and the apartment does not have it, one point is awarded, and if the apartment does have an undesirable characteristic, no points are awarded. Finally, if the respondent scores the characteristic as neither desirable nor undesirable, that characteristic is taken out of further consideration.
For the second type, the respondent selects the interval which is deemed to be the best. For example, the size of the living room. If the selected interval is 15–20 m2, and the apartment has a living room of that size, one point is awarded; if it is smaller, no points are awarded.
Thirdly, for those spatial characteristics which have a larger number of possible outcomes, the respondent lists the order of preference, for example, for the orientation of the living room. The respondent might say that the best orientation is south, followed by west, then east and lastly north. If the apartment in question has its living room facing south, it will receive 1 point; for the west, it will receive 0.67 points; for the east, 0.33 points; and finally, for the north, it will receive 0 points. The same principle would apply for characteristics with 3 or 5 possible outcomes; only then the point graduation would be 1, 0.5 and 0 for 3 outcomes; and 1, 0.75, 0.5, 0.25 and 0 for 5 possible outcomes. If the apartment meets all of the respondent’s conditions, the overall score is 100 points; if some of the conditions are not met, the apartment’s score is lower.
2.2. Apartments Selected for the Assessment
To carry out the study of assessment of the spatial characteristics of apartments, the available project documentation of apartment buildings was collected and analysed, which means that the apartments were analysed in the form in which they were built and that subsequent interventions by the residents were not considered. The designs of the apartment buildings constructed until 1991 were collected from the Croatian State Archives in Osijek. Apartment building designers or contractors have provided designs for apartment buildings constructed after 1991. The following data were collected for each of the apartment buildings:
- General data (address, cadastral number, year of building permit, investor, designer);
- Apartment building data (number of apartments in the building);
- Information on each apartment (purpose and room sizes, apartment spatial organisation and orientation).
The apartment building database contains 590 apartment buildings with 14,714 apartments. Some of the buildings were built based on the same blueprints. The relevance of the apartment database stems from the fact that the 2021 census showed that the city of Osijek has 42,132 housing units (houses and apartments), which means that the research covers around 35% of the total housing stock of the city of Osijek. This percentage increases significantly if we consider only the number of residential units in apartment buildings because, according to the Ministry of Physical Planning, Construction and State Assets, residential units in apartment buildings in the Republic of Croatia makeup around a third of the total housing stock []. The selection process of apartments for assessment is shown in Figure 3.
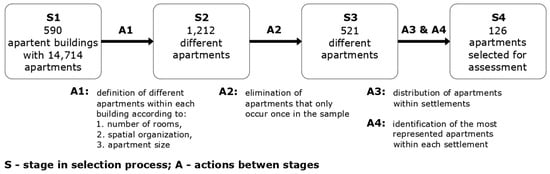
Figure 3.
Procedure for the selection of assessed apartments.
In order to make the sample manageable and comprehensible, it was first defined which apartments in each apartment building are the same in terms of the number of rooms, the type of spatial organisation and apartment size (Figure 3, Action 1) and the 1212 different apartment floor plans were filtered. Since the apartments to be assessed were to represent the majority of the housing stock in Osijek, the apartments that only occurred once in the sample were removed (Figure 3, Action 2), leaving 521 apartments for consideration. The apartments were then grouped by neighbourhoods (Figure 3, Action 3), and for each neighbourhood, the most frequently built apartments were defined (Figure 3, Action 4). A total of 126 apartment floor plans were selected on the basis of the above criteria. One apartment floor plan in the sample represents approximately 100 to 150 apartments in the neighbourhoods built between 1945 and 1991. Neighbourhoods built between 1930 and 1945 and those built after 1991 were an exception, as fewer apartments were built here than in the neighbourhoods built between 1945 and 1991 and because most apartments have unique floor plans. The apartments in these neighbourhoods were selected according to the spatial organization and the size of the apartment, with one apartment floor plan representing 10 to approximately 50 apartments. These 126 floor plans in the sample represent 4652 built apartments in the city of Osijek. The apartments are located in 32 neighbourhoods in seven city districts Figure 4.
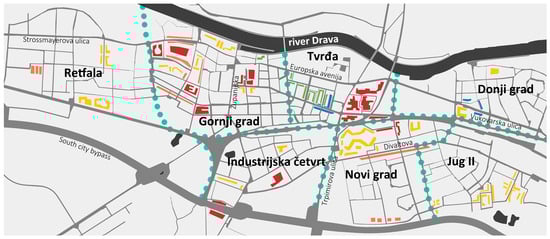
Figure 4.
Location of 32 neighbourhoods within seven city districts: built before 1945 (green), built between 1945 and 1959 (blue), built between 1960 and 1970 (red), built between 1971 and 1991 (yellow) and built after 1991 (orange); the light blue dots represent the boundaries of the city districts, the bodies of water are shown in black and the streets are dark grey.
2.3. Residents’ Preferences with Regard to the Spatial Characteristics of the Apartments
The data from an earlier survey on residents’ opinions [] on the spatial characteristics of the apartment were used as input data for determining the ranking of apartments in Osijek according to residents’ opinions. This survey included the opinions of 389 respondents from the city of Osijek who live in apartment buildings. People were approached in the streets in those neighbourhoods where the apartments which are rated in the sample are located. Before starting the questionnaire, the potential respondents were asked qualifying questions. The first question asked was whether the person lived in the apartment, and the second was whether they lived in the neighbourhood where the surveyor found them. If both questions were answered with ‘yes’, the respondent continued with the completion of the survey on the printed form. It was also taken care that there were respondents who were male and female and of different ages. For questions regarding the size of individual rooms, the respondents could choose from one of the offered intervals, which were previously defined in discussions with architects in the previous stage of the research. To explain certain specific apartment characteristics the residents might not be familiar with, such as zoning, circular connection, and enfilade, the respondents were shown (in the survey itself) how they look like on an example of an apartment layout [].
2.4. The Architect’s Attitude to Spatial Characteristics of the Apartment
The survey on architects’ opinions on the spatial characteristics of apartments was conducted in March 2024. Twenty architects with 6 to 40 (M = 18.7) years of experience in the design of residential buildings took part in the survey. Fifty-five per cent (N = 11) of respondents were women. The survey was conducted online by sending a link to the online questionnaire to the architects’ e-mail addresses. The questions in the survey were identical to the questions in the questionnaire on the basis of which the residents’ opinions were obtained. The architects were chosen from the pool of professionals who have in the past designed apartment buildings in the city of Osijek.
3. Results
To make it easier to compare the results, they are presented separately for the residents’ ratings and the architects’ ratings, and the results for each subchapter are also sorted by the ten highest and lowest rated apartments in the sample, the year of construction of the building (the age of the apartment), the neighbourhood in which the apartment is located, the apartment size (number of rooms in the apartment), and the 10 highest and lowest rated two-room apartments in the sample (N = 57), which are the most frequently represented apartments in the city of Osijek []. The respondents’ (architects’ and residents’) answers relevant to this study are listed in Table 1, with the most frequent answers given as the mean (M) or the number (N) of respondents who chose the same answer.

Table 1.
Opinions of residents and architects on spatial characteristics of the apartment.
The apartment sample comprises 126 apartments of different sizes (number of rooms). The average size of certain apartment rooms are as follows: The average square meterage of the living room is 18.31 m2, the living room with dining room is 19.45 m2, the kitchen is 5.97 m2, the kitchen with dining room is 10.36 m2, the two-person bedroom is 14.56 m2 and room for one person is 7.18 m2. All other spatial characteristics of the apartments in the sample are listed in Table 2.
Table 2.
Characteristics of the apartments in the sample.
3.1. Apartments Rated according to Residents’ Views
Residents’ preferences applied to the apartments provided an average rating of 61.82. The highest-rated apartment is a three-room apartment in Sjenjak, Novi grad, from 1981, with a rating of 85.42 (Figure 5a), while the lowest-rated apartment is a two-room apartment in the neighbourhood of Drvljanik, Tvrđa, from 1965, with a rating of 39.58 (Figure 5b). Because there are apartments that have the same number of points, apartments are ranked from 1st to 97th place. Table 3 shows the ten highest-rated apartments, while Table 4 lists the 10 lowest-rated apartments according to residents’ preferences.
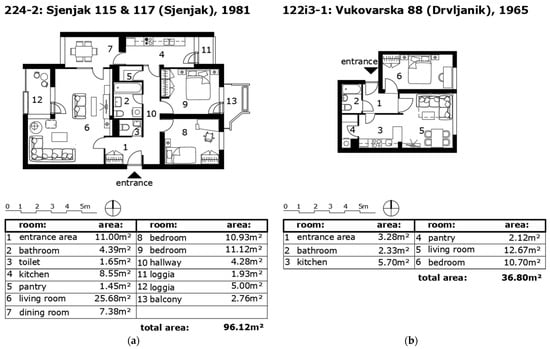
Figure 5.
Floor plans of (a) the highest-rated and (b) the lowest-rated apartment according to residents.
Table 3.
The 10 highest-rated apartments according to residents’ preferences.
Table 4.
The ten lowest-rated apartments according to residents’ preferences.
In order to be able to understand the ratings of the apartments according to the time of their construction, the apartments are subdivided according to the housing policy periods applicable at the time of their construction. First, a division was made according to three basic periods: the pre-socialist period (before 1945), the socialist period (1945–1991) and the post-socialist period (after 1991). In the next phase, the period from 1945 to 1991 was further divided into three periods: a period of establishment of the socialist housing system (1945–1959), a period of revolutionary reforms (1960–1975) and a period of market economy (1976–1991) []. Residents rated apartments built before 1945 the highest, with an average rating of 68.05, while they rated apartments built after 1991 the lowest, with an average rating of 59.12. The average ratings of apartments built within a given housing policy period are shown in Table 5.
Table 5.
Ratings of apartments according to the year of their construction by residents.
Since 126 apartments are located in 32 neighbourhoods, the average apartment ratings are presented according to the seven districts in which the individual neighbourhood is located. Residents rated apartments in Novi grad with the highest average rating of 65.13, while apartments in Jug II received the lowest average rating of 54.64. The average ratings of the apartments in all seven districts are shown in Table 6.
Table 6.
Ratings of apartments according to location by residents.
The ratings of the apartments according to size, more precisely according to the number of rooms, are listed in Table 7. Three-and-a-half-room apartments have the highest average rating of 68.83, while one-and-a-half-room apartments have the lowest average rating of 57.08. The average apartment in the city of Osijek and thus also in the sample (N = 57) is a two-room apartment with an average rating of 60.11. Table 8 and Table 9 show the first 10 and last 10 apartment ratings according to residents’ preferences. The highest-rated two-room apartment was built in Sjenjak, Novi grad, in 1981 and has a rating of 84.31 (Figure 6), while the lowest-rated two-room apartment is located in the neighbourhood of Drvljanik, Tvrđa, was built in 1965 and has a rating of 39.58. This apartment is also the lowest-rated apartment by residents in the entire sample (Figure 5b).
Table 7.
Ratings of apartments according to size by residents.
Table 8.
Ten best-rated two-room apartments according to residents’ preferences.
Table 9.
Ten worst-rated two-room apartments according to residents’ preferences.
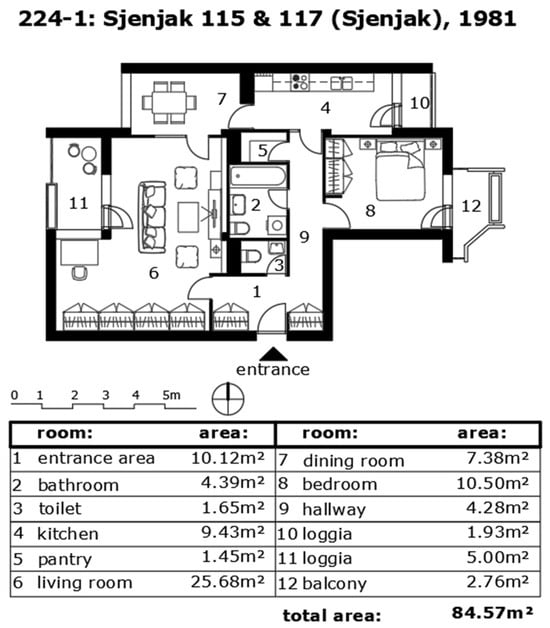
Figure 6.
Floor plan of the highest-rated two-room apartment.
The highest-rated two-room apartments are located in Novi grad, with an average rating of 62.18, while the lowest average rating was achieved by apartments in Jug II (M = 52.40). Depending on the year of construction, two-room apartments built between 1945 and 1959 have the highest average rating (M = 64.65), while those built after 1991 have the lowest average rating (M = 57.87).
3.2. Apartments Rated according to Architects’ Views
Architects rated 126 apartments in the sample with an average rating of 51.89. The highest-rated apartment is a three-room apartment in Sjenjak, Novi grad from 1974 with a rating of 78.45 (Figure 7a), while the lowest-rated apartment is a two-room apartment in the neighbourhood of Jug II from 1966 with a rating of 29.03 (Figure 7b). Some apartments share the same number of points, so the apartments are ordered from 1 to 100. Table 10 shows the 10 highest-rated apartments, while Table 11 lists the 10 lowest-rated apartments according to architects’ preferences.
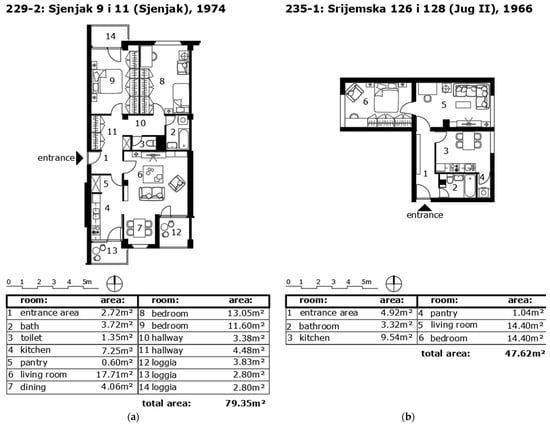
Figure 7.
Floor plans of (a) the highest-rated and (b) the lowest-rated apartment according to architects.
Table 10.
Ten best-rated apartments according to architects’ preferences.
Table 11.
Ten worst-rated apartments according to architects’ preferences.
Architects rated apartments built between 1976 and 1991 the highest, with an average rating of 56.38, while they rated apartments built between 1960 and 1975 the lowest, with an average rating of 48.69. The average ratings of apartments built within a given housing policy period are shown in Table 12.
Table 12.
Ratings of apartments according to the year of their construction by architects.
According to apartment location, architects rated apartments in Novi grad with the highest average rating of 55.13, while apartments in Jug II received the lowest average rating of 43.55. The average ratings of the apartments in all seven districts according to architects’ preferences are shown in Table 13.
Table 13.
Ratings of apartments according to location by architects.
The ratings of the apartments according to the number of rooms are listed in Table 14. The highest-rated apartment size, according to architects, is a four-and-a-half-room apartment with the highest rating of 60.40, while one-and-a-half-room apartments have the lowest average rating of 44.58. The most represented apartments are two-room apartments (N = 57), with an average rating of 50.84. Table 15 and Table 16 show the first and last 10 ranked two-room apartments according to architects’ preferences. The highest-rated two-room apartment was built in Sjenjak, Novi grad, in 1981 with a rating of 77.08 (the same two-room apartment was also rated highest by the residents, Figure 6), while the lowest-rated two-room apartment is located in the neighbourhood of Jug II built in 1966 with a rating of 29.03 which is also the lowest-rated apartment in the entire sample according to architects (Figure 7b).
Table 14.
Ratings of apartments according to size by architects.
Table 15.
The first 10 rankings of two-room apartments according to architects’ preferences.
Table 16.
The last ten rankings of two-room apartments according to architects’ preferences.
The highest-rated two-room apartments, according to architects, are located in Retfala, with an average rating of 54.05, while the lowest average rating was achieved by apartments in Jug II (M = 41.45). According to the construction year, apartments built after 1991 have the highest average rating (M = 57.89), while apartments built between 1960 and 1975 have the lowest average rating (M = 46.84) by architects.
4. Discussion
Existing research shows that the apartment and its quality, particularly the good quality of spatial characteristics such as apartment size [], interior space and layout, outdoor space, natural light and ventilation [], and storage space [], influence the physical and mental health of residents while ventilation influences physical health and a lack of natural light is associated with lower productivity. The orientation and size of certain areas of the apartment play an important role in the residents’ happiness [], and apartment adaptability and design influence residential satisfaction [,]
The results of the survey of architects show that their opinions coincide with those of their colleagues who took part in foreign studies. They have the same opinions regarding the following spatial apartment characteristics: south-facing living areas and natural cross ventilation [], the importance of the circular connection [], the separation of the sleeping area and living space [], the flexibility of the apartment [], the need for a private outdoor space connected to the living room []. The opinions of the architects reflect their training and ideas of healthy and quality design of residential spaces, and it is to be expected that there are few differences between their opinions.
With regard to the design guidelines defined in the POS ordinance [], the architects’ opinions differ on the following characteristics: the presence of several storage rooms (POS defines only one) and an additional toilet (POS requires an additional toilet for apartments of 2.5 R or more), the minimum size of the living room (POS defines a living room of 20–25 m2, depending on the size of the apartment, while architects define it as 15–20 m2), the size of the one-person bedroom (POS defines the room with at least 8 m2, architects with at least 10 m2), in POS a window in the kitchen is optional, kitchens without a window must have a ventilation shaft. While the opinions on the existence of an outdoor area of the apartment, and the size of the kitchen and bedrooms for parents are in line with the ordinance. The POS ordinance does not specify the design of the other spatial characteristics of the apartment. With regard to the features not included in this study, POS defines the minimum width of the room, the ratio of which must not be less than half the length, and the depth of the room, which must not be more than 2.5 times the height of the room. In addition, the glass area of the window is defined as at least one-seventh of the floor area of the room [].
Although the opinions of the architects from Osijek coincide with those of their foreign colleagues, the opinions of the residents differ from those of the architects and also from residents in other studies. For example, the 2022 Iranian survey showed how residents preferred south-facing balconies connected to the living room over the bedroom or kitchen [], which is the case with residents in Osijek apartments. Interestingly, residents in South Korean study preferred balconies connected to bedrooms []. Most residents of Osijek prefer north-facing living spaces, which corresponds to the results of a study conducted in Poland [], while Iranian residents favoured south orientation []. Although these three studies do not represent a sufficiently large sample, their results can be explained by the results of a study conducted by Antoniou and Dimopoulos (2019), which showed that apartment buyers are not aware of the importance of southern orientation [].
The importance of having storage space in the apartment varies. Chinese research has shown that they are important for medium-sized apartments, while the same respondents believe that a separate storage room is not needed in small apartments []. The residents questioned in our survey are of the opinion that no more than one storage room is needed in the apartment. The residents of the apartments in Osijek preferred the dining area in the kitchen to the dining area in the living room or dining room, which is opposite to the Chinese and Australian studies [,].
A Swedish study on apartment floor plans remodelled by end-users showed how residents changed circular connections between rooms into rooms that become pass-through spaces []. In contrast to this research, the residents of Osijek consider the central living room to be the most desirable apartment organization in terms of communication, followed by the circular connection, while pass-through spaces are the least desirable. It is interesting to note that residents in Osijek rated the apartments from the socialist era the highest. This can be linked to the Czech study, which showed that residents rated the floor plan of the socialist prefabricated apartment with a corridor connecting all rooms better than newer apartments []. In contrast to the Czech respondents, Osijek residents did not prefer the central corridor as the main means of communication within the apartment, but the apartments received a high score based on other spatial characteristics such as private outdoor space and two-sided orientation. The apartments in the sample that were rated lowest by the residents are mostly organised around a central corridor; they do not have a balcony or a two-sided orientation that would allow cross-ventilation of the apartment. This, and the fact that best rated apartments have two-sided orientation shows the importance of cross-ventilation for the residents of Osijek.
Comparing the results of the study with existing research findings, we can conclude that residents’ preferences vary depending on the country, climate and culture in which they live. In future studies, the personal characteristics of residents, such as age and gender, income, education and family structure, must be considered in order to obtain more precise information about residents’ preferences with regard to the spatial characteristics of the apartment.
In this paper, 126 apartment floor plans ranging in size from a studio to a 4.5-room apartment were analysed using the previously developed HQAM []. The results are presented separately by residents and architects, according to the highest to the lowest ratings and the average ratings by year of construction of the apartment (five periods of housing policy), location in the city (7 districts) and number of rooms. The 10 highest and lowest-rated apartments and the 10 highest and lowest-rated two-room apartments were singled out for both residents and architects. Two-room apartments were selected because the results can be best compared due to the fact they are most represented in the sample (N = 57) as well as being the most represented apartments in the housing stock of the city of Osijek []. The results show that the average rating of the residents (AR: 61.82) for the whole sample is higher than the rating of the architects (AR: 51.89). The same trend can be seen in the ratings, both for the entire sample and for the two-room apartments. This can be attributed to residents rating the apartments based on what they know rather than the contemporary housing design aspirations that architects find desirable and apply in their practice, which are more in line with contemporary housing aspirations and needs. For example, the arrangement of the kitchen and living room in separate rooms is a feature of 66 apartments that are favoured by the residents, while the architects prefer these two functions in the same space, which is only found in 17 apartments. This characteristic of the apartment is directly related to the organisation of the dining area, which residents believe should be located in the kitchen and architects believe should be located in the living room. In the sample, the dining area is located in the kitchen in 89 out of 126 apartments, while in 27 apartments, it is located in the living room. It is interesting to note that the residents indicated that an apartment should not have more than one storage room, while the architects consider this feature desirable, and only three apartments have it.
4.1. Residents and Architects Ratings of the Entire Sample
Residents gave the best average rating to apartments built before 1945 (AR: 68.05), but none of these apartments is among the 10 best-rated apartments. Apartments built before 1945 achieved the highest average rating because all apartments have an outdoor area and an additional toilet, almost all rooms exceed the minimum dimensions (the exceptions are some half rooms and kitchens), all apartments have a kitchen and a bathroom with a window, as well as a two-sided orientation. In most cases, the kitchen (which is also the dining room) and living room are separate rooms; in most apartments, the loggia or balcony is accessible from the living room, and all apartments are adaptable.
According to residents, apartments built after 1991 have the lowest average rating of all apartments in relation to their year of construction (AR: 59.12). The reason for this is that not a single apartment built after 1991 has an additional toilet, almost all kitchens are smaller than the minimum dimensions defined by the residents, 50% of the kitchens and none of the bathrooms have windows, and 50% of the apartments do not have a two-sided orientation. Although residents want an apartment with a central living room, they want the kitchen to be separated from it in a separate room (which is not the case in any apartment). In 66.67% of apartments with rooms, the rooms are accessed via the living room, i.e., the sleeping area is not separated from the rest of the apartment by a separate hallway.
According to the architects, most of the apartments in the top 10 highest-rated apartments were built between 1976 and 1991, which is also the period with the highest average apartment rating (AR: 56.38). The apartments receive the highest ratings due to the fact that almost all of them have an outdoor area and a window in the kitchen and that in most apartments, the outdoor area is accessible from the living room, the kitchen and living room are connected by a door (which is a medium-important option), most of the rooms have desirable dimensions and orientations, and most of the bathrooms do not have windows. Of the 10 worst-rated apartments, according to the architects, half of them is also from the worst-rated period of housing policy (1960 and 1975), with an average rating of 48.69.
Among both residents and architects, the apartments in the Novi grad district received the best average ratings (residents AR: 65.13, architects AR: 55.13), while the apartments in the Jug II district received the worst average rating (residents AR: 54.64, architects AR: 43.55). The apartments in Novi grad have the highest ratings because it is important for both residents and architects that the apartments have an outdoor area, a window in the kitchen, only in one of the apartments is the bedroom accessed through the living room, outdoor areas are accessed through the living room, and 50% of apartments are adaptable. In this district, most apartments (13) are organised by zones, with a circular connection or around a central living room, which is a more important characteristic for both residents and architects than the organisation of the apartment around a central corridor, which is the case in 92 apartments or 73% of the apartments in the sample. The apartments in the Jug II district achieve the lowest average rating because half of the apartments have no outdoor space, almost all have no additional toilet, more than half of the apartments 2 R and larger do not have two-sided orientation, most are organised around a corridor, in almost half of the 2 R and larger apartments the rooms are entered through the living room, i.e., their sleeping area is not separated from the rest of the apartment, and no apartment larger than 1 R is adaptable.
The ratings of the apartments according to the number of rooms, i.e., according to the size of the apartments by the residents and by the architects, are different. While the residents’ average rating is highest for 3.5 R apartments (AR: 68.83), the architects’ average rating is highest for 4.5 R apartments (AR: 60.40). Residents and architects gave the lowest average rating for 1.5 R apartments, with residents giving 57.08 and architects 44.58. It is interesting to note that architects rated studio apartments better (AR: 51.46) than one-bedroom apartments (AR: 47.22) and two-room apartments (AR: 50.84). It can be seen from both the residents’ and the architect’s ratings that apartments larger than 2 R are rated better than apartments with two or fewer rooms. The reason why larger apartments are, on average, better rated can be attributed to the fact that more factors are being scored, meaning that a lower score on a certain characteristic will have a smaller impact on the overall score of the apartment. For this reason, it is best to compare apartments by size. As there are few apartments of a particular size in the sample (four apartment sizes have less than 10 apartments in the sample), only 2 R apartments were looked at in more detail. These apartments make up 45.24% of the sample.
4.2. Best-Rated Apartments in the Sample
Among the top 10 apartments rated by residents, most of them were built in the period of the market economy (1976–1991), and most of them are 2.5 R (N = 3) and 3 R (N = 3), and half of them are located in Novi grad. All of these apartments have an outdoor area, a storage room, no ceiling higher than 3 m, a window in the kitchen, two-sided orientation; none of the bedrooms are entered directly from the living room, one bedroom has an undesirable orientation (west), only one kitchen is below the minimum area, in 9 out of 10 apartments out door is accessed from living room, 8 out of 10 apartments are adaptable, and the same number of apartments have a living room and a kitchen in separate rooms. The apartment with the highest rating in the sample, according to resident opinion, is a three-room apartment in Sjenjak, Novi grad from 1981 with a rating of 85.42. The apartment lost points because there is no window in the bathroom, the living room faces west, it has a dining area in the dining room and is organized around a circular connection as opposed to the desirable central living room. An anomaly among the top 10 highest-rated apartments is the 1 R in seventh place from Vijenac Petrova (Retfala) from 1978 with a rating of 77.00, which lost the most points because of the undesirable orientation of the kitchen, the spatial organisation around the hallway, the bathroom without a window and because it is not adaptable.
The architects rated four 2 R apartments, two 2.5 R apartments, three 3 R apartments and one 3.5 R apartment as the best. As many as 7 of the 10 best-rated apartments are located in Novi grad. The apartments received high ratings because all of them have outdoor space, ceiling heights of up to 3 m, all but one half room are desirable dimensions, they have windows in the kitchen, they are all adaptable, most of them have outdoor areas accessible from the living room, only one apartment does not have a sleeping area separated by a hallway, most of the apartments are either divided into zones (N = 3) or have a circular connection (N = 4). According to the architects, the apartment in Sjenjak in the Novi grad district from 1974 was rated the best, with a rating of 78.45. The apartment lost points because it does not have an additional toilet and storage room, the orientation of the rooms is unfavourable, and the kitchen is not part of the living room.
Among the 10 best-rated apartments from the point of view of residents and architects, there are six of the same apartment layouts. The apartments received a high rating because they have the same characteristics, which are important to both residents and architects. Apartments are rated higher by the residents because their bathroom has a window, because they do not have more storage space, because more rooms have a desirable orientation and because the kitchen and living room are separate rooms. Interestingly, half of the apartments have a dining area in the dining room, which was defined by both residents and architects as the least desirable characteristics regarding the positioning of the dining table and where the apartments lost points.
4.3. Lowest Rated Apartments in the Sample
Seven of the ten worst-rated apartments from the residents’ point of view are 2 R apartments, most of them in Jug II (N = 4), two each in Gornji grad, Novi grad and Tvrđa. The apartments lost points because none of them have an outdoor area and a window in the bathroom, all kitchens are small, 6 out of 10 kitchens and most bedrooms have a less desirable orientation, 9 out of 10 apartments are organised around the hallway, only half of them have two-sided orientation, and only two apartments are adaptable. The worst-rated apartment, which is also the worst-rated 2 R apartment in the sample, is an apartment from Drvljanik (Tvrđa), built in 1965. The apartment has a rating of 39.58. The apartment received the points only because it has a room with desirable dimensions, its kitchen and bedroom have the most desirable orientation (east), the bedroom is not entered through the living room, and it is adaptable. Among the lowest rated apartments is also a 3 R apartment from the same neighbourhood, which achieved a rating of 49.39; it is an apartment that has no loggia, an additional toilet, a kitchen with desirable dimensions, in which the bathroom has no window, the apartment is organised around a hallway and its dining room is not separated from the living room.
According to the architects, the worst-rated apartments were built between 1961 and 1970, and 6 out of 10 are 1 R. What all 10 apartments have in common is that none of them have extra storage space, an outdoor area, an extra toilet, all kitchens are of small size, the kitchens and a living room are in a separate room. In addition, only three apartments have a two-sided orientation, only one is not organized around the corridor, and 9 out of 10 apartments have a dining room in the kitchen. The worst-rated apartment is the apartment in Jug II, built in 1966, which received a rating of 29.03 only because its living room and kitchen are separate rooms, it has a ceiling height of less than 3 m, a window in the kitchen, two-sided orientation, and a room and a living room of desirable dimensions.
Among the 10 lowest-rated apartments, according to the residents and the architects, there are six of the same apartment layouts, specifically two 1 R and four 2 R apartments. It is interesting to note that the other four apartments rated worst by the architects were 1 S apartments, while the residents rated two 2 R, one 1 R and one 3 R apartment as the worst. All of the apartments lost the points both in resident and architect ratings because the kitchen with dining area is smaller than desirable because they are organised around the hallway and because a large portion of the rooms are entered through the living room, meaning that the sleeping area is not separated from the rest of the apartment by a hallway, and because they are not adaptable.
4.4. Highest Rated Two-Room Apartments
According to the residents, the 10 best 2 R apartments earned high marks mainly because they all have a window in the kitchen and no more than one storage room, a ceiling height of more than 3 m, and most of the rooms have the desired dimensions and orientations; only one out of 10 apartments is unilaterally oriented, it also has no outdoor area and only in one apartment is the bedroom entered through the living room. The apartment rated best by residents is located in Sjenjak, Novi grad, and has a rating of 84.31. It lost points for the fact that it has no window in the bathroom, the living room is to the west, it has a separate dining room, and it has a circular connection instead of being organised around the central living room.
Of the 10 best-rated 2 R apartments, according to the architects, five were built between 1976 and 1991, the period with the highest average rating according to the architects, and four apartments are located in the Novi grad district, which, according to architects and residents, is the district with the highest average rating. These apartments have an outdoor area, all bedrooms, living rooms and kitchens with dining rooms have a desirable number of square metres and most spaces have a desirable orientation. In addition, only one apartment does not have a window in the kitchen, one has an entrance to the rooms through the living room, two have a one-sided orientation, and in two, there is no access to the outdoor space from the living room, 50% of apartments have a dining area in the living room and most of them are adaptable. The highest-rated 2 R apartment is located in Sjenjak (Novi grad); it was built in 1981 and achieved a rating of 77.08 (the same apartment was also rated highest by the residents). The apartment lost points because there is no additional storage, it has a living room on the west, the living room and kitchen are separate rooms, and dining table is located in the dining room.
The apartments rated best by the residents were all built during socialism, while among the 10 best apartments, according to the architects, two apartments were built in 2006. The best apartments, according to both residents and architects, are located in the same districts: Novi grad, Gornji grad, the Tvrđa and Retfala. The best-rated two-bedroom apartment, according to both residents and architects, is the same apartment from Sjenjak, Novi grad, built in 1981. The apartment achieved the highest rating both from residents and architects because it has an outdoor area, an additional toilet, a large enough living room, a favourable orientation of both rooms and kitchen, a window in the kitchen, a two-sided orientation, a connection between the living room and outdoor space, bedroom separated from the living room by a separate hallway and is adaptable. The residents’ rating is slightly higher because the apartment has no extra storage space, as the kitchen and bedroom are separate.
4.5. Lowest Rated Two-Room Apartments
Although the period of housing construction after 1991 received the lowest average apartment rating, there is only one 2 R apartment from this period among the 10 lowest-rated apartments. The worst-rated 2 R apartment is also the worst-rated apartment by residents in the entire sample. The 2 R apartments received the lowest ratings because none of them have an additional toilet, they are all organised around a central corridor, only one apartment has a loggia, most of the bedrooms are on less desirable orientations, 8 out of 10 kitchens have no windows, 60% of them do not have two-side orientation, not a single one has a sleeping area organised around separate hallway, and only three apartments are adaptable.
Of the 10 worst-rated 2 R apartments, according to the architects, 9 were built in the second period of the socialist housing policy (1961–1975). As with the residents’ ratings, the worst-rated 2 R apartment is also the worst-rated apartment in the entire sample. The 10 worst-rated apartments are characterised by the lack of additional storage space and an extra toilet. The apartments are arranged around the hallway; they do not have a separate sleeping area, and only one of them has an outdoor area and is adaptable.
The greatest agreement between the opinions of residents and architects can be found in the assessment of the worst two-room apartments. Seven out of ten apartments are on the list by both residents and architects. The apartments scored most of the points on the sufficient space of the living rooms and bedrooms and the fact that most kitchens have a window. Ratings are higher by residents because apartments have no additional storage space and a dining room in the kitchen that is separate from the living room.
4.6. Most Important Differences in Apartment Ratings
Residents and architects differently rated all apartments, and it must be noted that residents’ rates are higher than architects, on average by 9.95 points. The differences in ratings for each individual layout vary from 0.24 to 27 points. Differences in the rankings between different time periods are decreasing from the pre-socialist period, when the average difference between the ratings was 14.86 points, to the post-1991 construction period when the average difference between the ratings was 4.68 points. The difference in points between these two periods is due to the fact that the apartments have desirable features for residents: separation of the kitchen and dining room from the living room and the ability to ventilate the bathroom. And because of these very characteristics, they lost points in the architects’ ratings. The apartments built after 1991 have the lowest difference in the ratings of residents and architects because most of them are organised around a central living room, which is one of the three best spatial organizations for both residents and architects, and the architects’ rating is higher because the apartments have living rooms with a kitchen, which residents do not prefer.
Although the vast majority of the apartments were rated higher by the residents than by the architects, nine apartments have a higher rating by the architects, and six of them were built in the period between 1960 and 1975 (the best period of housing policy according to the architects). The reason for this is because five out of six apartments have the kitchen and dining table within the living room while all other characteristics received similar points both from residents and architects.
The biggest difference in points and ranking is in the apartment, which was ranked 10th by the architects (3 R, Vijenac Augusta Cesarca, 1962, AR: 66.35) and 84th (AR: 51.54) by the residents. This is because this apartment has extra storage space, a bathroom without windows, each room with the architect’s most desirable orientation and a kitchen and dining area as part of the living room, while residents have opposing opinions about these characteristics, so the rating of the apartment was much lower.
The apartment, which is ranked best by the architects (3 R, Sjenjak, 1974), is also in the top 10, more precisely in ninth place according to the residents. The apartment is highly rated by both residents and architects because it fully meets certain characteristics that are common to both residents and architects and because it has a moderately desirable variant of the spatial characteristic for other characteristics (for example, kitchen and living room connected by doors).
5. Conclusions
In comparison to previous studies that dealt with the assessment of the quality of housing from the perspective of different participants in the design or construction process or of the residents and which addressed only a few questions from different dimensions of the assessment of housing, this paper has a detailed examination of one of the dimensions: apartment dimension through its spatial characteristics.
The apartments achieved different ratings based on the fact that residents and architects have different views on additional storage space, the presence of a window in the bathroom, the square footage of the living and half-rooms, the orientation of the living rooms and kitchens and the differently arranged preferences for the spatial organisation of the apartment, the connection between the kitchen and living room and the location of the dining table.
Apartments are, on average, rated higher by residents because apartments are more in line with their stated preferences. This might suggest that residents rate apartments based on their knowledge gained from living in similar apartments to the ones in the sample, while architects are much more critical of the extent to which the current housing stock meets modern housing needs. The attitudes of the residents are shaped by their experiences. It is, therefore, to be expected that they view the spaces they live in as good or, at worst, acceptable and on the basis of that experience, they evaluate other apartments. This is shown by the fact that they rate the newest apartments within the sample with the lowest average rating in the entire sample, in contrast to the architects who view this period of housing construction to be the best among the three main housing policy periods.
The limitations of the research are as follows: (1) The importance of all five criteria categories is 20% in order to make the ratings of architects and residents more comparable, but a more realistic situation would result if the individual categories were included in the calculation with different percentages. For the architects, this is still possible with the paired comparison analysis through interviews, but for the residents, from whom we need more responses for the sample to be relevant, this method is tiring and time-consuming and would lead to many people dropping out of the survey. This problem could perhaps be solved by including a question in the survey where residents can define the importance of each criteria category using a Likert-type question and obtaining relevant data based on the number of respondents. (2) The sample was based on the representation of characteristic apartments in the city, which resulted in a smaller number of apartments of a certain size in the sample (S, 1.5 R, 3.5 R and 4.5 R). (3) The model is also limited to the assessment of only one outdoor space, whereby in the case of several outdoor spaces in apartments, the most favourable connection to the interior was always taken, but additional balconies were evaluated neither positively nor negatively. In the case of a lack of outdoor space, the apartments are disadvantaged by two criteria categories (ar—additional rooms/spaces and ci—circulation). (4) The apartment ratings are defined on the basis of the average or majority opinion of architects and residents (depending on the type of question in the survey); in order to obtain even more precise ratings, the socio-economic characteristics of the residents should be taken into account in future studies. (5) The study was conducted at a local level (in the neighbourhoods of a single city), so the specificity of the location could affect the results, which is why it is necessary to include residents of other locations in future studies.
As the research progresses, it is planned to expand the criteria by which the apartments are evaluated to include additional categories and criteria that will include quality criteria for other non-spatial characteristics of the apartment itself, as well as criteria for evaluating the building, location, and other socioeconomic characteristics of housing quality in apartment buildings. Future research should also examine certain opinions of residents, such as opinions about the spatial organisation of the apartment through a central living room (open floor plan in which there is both a dining room and a kitchen), because in another question, they indicated that they prefer to eat in the kitchen, and the kitchen is separate from the living room. It is not clear whether there was any confusion, as the questionnaires given to the residents included floor plans that depicted the terminology. Future studies should take into consideration the socio-economic characteristics of residents and residents from other locations to gain more accurate insights into residents’ opinions and preferences.
Ratings defined in research for individual apartments and apartments according to neighbourhood, age and size of apartment can be used by residents when deciding which particular apartment to buy. For architects, the results could provide information on the direction in which the refurbishment of individual apartments should take place and also serve as a guideline for architects when designing apartments. Developers could also make practical use of the model to offer those types of apartments with spatial characteristics favourable to their potential customers, given how understanding users’ preferences can decrease uncertainty in the development of new building designs for unknown end users and increase users’ satisfaction.
Finally, since HQAM can reflect the opinions of both architects and residents, architects and decision-makers can derive design guidelines that should be made mandatory, such as the two-sided orientation of apartments with two or more rooms, mandatory inclusion of the apartment’s outdoor space in the form of a loggia or balcony, regardless of the size of the apartment, designing kitchens with a window that provides light and ventilation, etc. to create standards that define the minimum requirements that a particular apartment must meet in order for the resident to receive a certain quality of living. Those design guidelines could include other aspects of quality of living, such as building quality, location, indoor comfort, etc., which are out of the scope of this research.
Therefore, it is recommended that architects, housing developers and policy makers take these apartment characteristics into account when planning new apartment building housing stock.
In the end, it can be concluded that there are varying opinions on what are the best spatial characteristics of an apartment. It would be worth noting why the residents have different opinions of architects and would their opinions change if presented with reasoning for an apartment having extra storage, different orientations, etc. But, for the most part, the differences are not significant enough to warrant a systematic redesign of the design principles of residential buildings, but to see whether there is some middle ground to be found and to listen to what the end users of the apartments might prefer and for what reason.
Author Contributions
Conceptualisation, I.B.M.; methodology, I.B.M.; formal analysis, I.B.M. and D.K.; investigation, I.B.M. and D.K.; resources, I.B.M.; data curation, I.B.M.; writing—original draft preparation, I.B.M. and D.K.; writing—review and editing, I.B.M.; visualisation, I.B.M. and D.K.; supervision, I.B.M. All authors have read and agreed to the published version of the manuscript.
Funding
This research received no external funding.
Data Availability Statement
The data used to support the findings of this paper are included within the article.
Conflicts of Interest
The authors declare no conflicts of interest.
References
- Streimikiene, D. Quality of Life and Housing. Int. J. Inf. Educ. Technol. 2015, 5, 140–145. [Google Scholar] [CrossRef][Green Version]
- Adegbile, M.; Onifade, V.; Peter, S. Influence of Housing Attributes on Housing Satisfaction in Selected Residential Areas of Ogun State, Nigeria. Environ. Technol. Sci. J. 2019, 10, 1–15. [Google Scholar]
- Universal Declaration of Human Rights. Available online: https://www.un.org/en/about-us/universal-declaration-of-human-rights (accessed on 7 February 2024).
- Jara-Baeza, F.; Rajagopalan, P.; Andamon, M.M. A holistic assessment of indoor environmental quality perception in Australian high-rise social housing. Energy Build. 2023, 284, 112859. [Google Scholar] [CrossRef]
- Reyes, A.; Novoa, A.M.; Borrell, C.; Carrere, J.; Pérez, K.; Gamboa, C.; Daví, L.; Fernández, A. Living Together for a Better Life: The Impact of Cooperative Housing on Health and Quality of Life. Buildings 2022, 12, 2099. [Google Scholar] [CrossRef]
- Walisinghe, K.; Wickramaarachchi, N. Assessment of Residential Satisfaction: Evidence from Public and Private Housing Schemes. J. Real Estate Stud. 2021, 18, 33–56. [Google Scholar]
- Choi, J.; Cho, T. Comparing Perception Concerning the Importance of Apartment Complex Components between Consumers and Housing Providers. J. Asian Archit. Build. Eng. 2014, 13, 109–116. [Google Scholar] [CrossRef]
- Mercader-Moyano, P.; Morat-Pérez, O.; Muñoz-González, C. Housing Evaluation Methodology in a Situation of Social Poverty to Guarantee Sustainable Cities: The Satisfaction Dimension for the Case of Mexico. Sustainability 2021, 13, 11199. [Google Scholar] [CrossRef]
- Natividade-Jesus, E.; Coutinho-Rodrigues, J.; Antunes, C.H. A multicriteria decision support system for housing evaluation. Decis. Support Syst. 2007, 43, 779–790. [Google Scholar] [CrossRef]
- Herbers, D.J.; Mulder, C.H. Housing and subjective well-being of older adults in Europe. J. Hous. Built Environ. 2017, 32, 533–558. [Google Scholar] [CrossRef]
- Tibesigwa, B.M.; Hao, L.; Karumuna, B.V. The concept of spatial quality and its challenges on exercised affordable housing design typology in Dar es Salaam—Tanzania. Habitat Int. 2017, 59, 44–59. [Google Scholar] [CrossRef]
- Croatian Bureau of Statistics: Popis Stanovništva, Kućanstava i Stanova 2021. Available online: https://dzs.gov.hr/u-fokusu/popis-2021/88 (accessed on 18 February 2024).
- APN. Općenito o Programu POS-A. Available online: https://apn.hr/izgradnja-i-prodaja-stanova-pos/put-do-stana (accessed on 7 May 2024).
- Brkanić Mihić, I. Housing Quality Assessment Model Based on the Spatial Characteristics of an Apartment. Buildings 2023, 13, 2181. [Google Scholar] [CrossRef]
- Fakunle, A.; Ogundare, J.; Olayinka-Alli, L.; Ogunronbi, M.; Bello, T.; Elujulo, O.; Olamide, O.; Saliu, I. Housing Quality and Risk Factors Associated with Respiratory Health Conditions in Nigeria. Housing 2018, 19, 20. [Google Scholar]
- Akbari, P.; Yazdanfar, S.-A.; Hosseini, S.-B.; Norouzian-Maleki, S. Housing and mental health during outbreak of COVID-19. J. Build. Eng. 2021, 43, 102919. [Google Scholar] [CrossRef]
- Babalola, O.; Ibem, E.; Olotuah, A.O.; Opoko, A.; Fulani, O.; Adewale, B. Housing quality and its predictors in public residential estates in Lagos, Nigeria. Environ. Dev. Sustain. 2020, 22, 3973–4005. [Google Scholar] [CrossRef]
- Gür, M.; Murat, D.; Sezer, F. The effect of housing and neighborhood satisfaction on perception of happiness in Bursa, Turkey. J. Hous. Built Environ. 2020, 35, 679–697. [Google Scholar] [CrossRef]
- Al Shawabkeh, R.K.; Alzouby, A.M.; Rjoub, A.; Alsmadi, M.; AlKhamaiseh, M.; Shboul, D.; Smadi, A.; Al-Bzour, A.; Al-Omari, R.; Alobaidat, E. Evaluating the satisfaction rate for affordable housing in non-gated residential area (NGR): The case of Al-Sharq housing project in Zarqa-Jordan. Int. J. Hous. Mark. Anal. 2021, 14, 192–217. [Google Scholar] [CrossRef]
- Brkanić, I. Housing Quality Assessment criteria. Electron. J. Fac. Civ. Eng. Osijek e-GFOS 2017, 8, 37–47. [Google Scholar] [CrossRef]
- Li, J.; Li, D.; Ning, X.; Sun, J.; Du, H. Residential satisfaction among resettled tenants in public rental housing in Wuhan, China. J. Hous. Built Environ. 2019, 34, 1125–1148. [Google Scholar] [CrossRef]
- Elsinga, M.; Hoekstra, J. Homeownership and housing satisfaction. J. Hous. Built Environ. 2005, 20, 401–424. [Google Scholar] [CrossRef]
- Kabisch, S.; Poessneck, J.; Soeding, M.; Schlink, U. Measuring residential satisfaction over time: Results from a unique long-term study of a large housing estate. Hous. Stud. 2022, 37, 1858–1876. [Google Scholar] [CrossRef]
- Mridha, M. Living in an apartment. J. Environ. Psychol. 2015, 43, 42–54. [Google Scholar] [CrossRef]
- Borgoni, R.; Michelangeli, A.; Pirola, F. Residential Satisfaction for a Continuum of Households: Evidence from European Countries; Global Labor Organization (GLO): Milan, Italy, 2018. [Google Scholar]
- Milić, J.; Zhou, J. Residential satisfaction among young people in post-socialist countries: The case of Serbia. J. Hous. Built Environ. 2018, 33, 715–730. [Google Scholar] [CrossRef]
- Poli, T.; Adianto, J. Housing Satisfaction of The Indonesian Adolescents. Int. J. Built Environ. Sci. Res. 2022, 6, 1–16. [Google Scholar] [CrossRef]
- Al-Baaj, D.-A.; Alsaati, H. Quality Assessment of Residential Complexes Standards of Satisfaction in Basra City of Iraq. Int. J. Sustain. Dev. Plan. 2023, 18, 2233–2244. [Google Scholar] [CrossRef]
- Yunda, J.G.; Ceballos-Ramos, O.; Rincón-Castellanos, M. The challenge of low-income housing quality in Latin American cities: Lessons from two decades of housing policies in Bogotá. Hous. Stud. 2022, 37, 1877–1895. [Google Scholar] [CrossRef]
- Tajudeen, A.; David, T.; Basirat, M.-A.; Azeez, B. Comparative Assessment of Students’ Satisfaction with Hostel Accommodation in Selected Private Universities in Ogun State, Nigeria. Eur. Sci. J. ESJ 2016, 12, 410. [Google Scholar] [CrossRef]
- Chisholm, E.; Howden-Chapman, P.; Fougere, G. Tenants’ Responses to Substandard Housing: Hidden and Invisible Power and the Failure of Rental Housing Regulation. Hous. Theory Soc. 2020, 37, 139–161. [Google Scholar] [CrossRef]
- Chohan, A.; Che-Ani, A.; Shar, B.; Awad, J.; Jawaid, A.; Mohd Tawil, N. A Model of Housing Quality Determinants (HQD) for Affordable Housing. J. Constr. Dev. Ctries. 2015, 20, 117–136. [Google Scholar]
- Chohan, A.H. Matrix of Affordable Housing Assessment: A Development Process. Designs 2022, 6, 4. [Google Scholar] [CrossRef]
- Gan, X.; Zuo, J.; Baker, E.; Chang, R.; Wen, T. Exploring the determinants of residential satisfaction in public rental housing in China: A case study of Chongqing. J. Hous. Built Environ. 2019, 34, 869–895. [Google Scholar] [CrossRef]
- Yau, Y.; Ho, D.; Wing, C.K.; Lau, W.-Y. Estimation algorithm for predicting the performance of private apartment buildings in Hong Kong. Struct. Surv. 2009, 27, 372–389. [Google Scholar] [CrossRef]
- Mohit, M.A.; Ibrahim, M.; Rashid, Y.R. Assessment of residential satisfaction in newly designed public low-cost housing in Kuala Lumpur, Malaysia. Habitat Int. 2010, 34, 18–27. [Google Scholar] [CrossRef]
- Amián, J.G.; Alarcón, D.; Fernández-Portero, C.; Sánchez-Medina, J.A. Aging Living at Home: Residential Satisfaction among Active Older Adults Based on the Perceived Home Model. Int. J. Environ. Res. Public Health 2021, 18, 8959. [Google Scholar] [CrossRef]
- Sinha, R.C.; Sarkar, S.; Mandal, N.R. An Overview of Key Indicators and Evaluation Tools for Assessing Housing Quality: A Literature Review. J. Inst. Eng. Ser. A 2017, 98, 337–347. [Google Scholar] [CrossRef]
- Amerio, A.; Brambilla, A.; Morganti, A.; Aguglia, A.; Bianchi, D.; Santi, F.; Costantini, L.; Odone, A.; Costanza, A.; Signorelli, C.; et al. COVID-19 Lockdown: Housing Built Environment’s Effects on Mental Health. Int. J. Environ. Res. Public Health 2020, 17, 5973. [Google Scholar] [CrossRef] [PubMed]
- Foster, S.; Hooper, P.; Turrell, G.; Maitland, C.; Giles-Corti, B.; Kleeman, A. Grand designs for design policy: Associations between apartment policy standards, perceptions of good design and mental wellbeing. SSM Popul. Health 2022, 20, 101301. [Google Scholar] [CrossRef] [PubMed]
- Hooper, P.; Kleeman, A.; Edwards, N.; Bolleter, J.; Foster, S. The architecture of mental health: Identifying the combination of apartment building design requirements for positive mental health outcomes. Lancet Reg. Health West. Pac. 2023, 37, 100807. [Google Scholar] [CrossRef] [PubMed]
- Mubinova, S.; Gokgol, M.K. What are the impacts of architectural design on occupants’ well-being, and how can architects optimize spaces to enhance productivity? Proc. Lond. Int. Conf. 2023, 34–40. [Google Scholar] [CrossRef]
- Adeeb Fahmy Hanna, H. Towards domestic space design in the post-COVID-19 era: A review of relevant literature. Alex. Eng. J. 2023, 73, 487–503. [Google Scholar] [CrossRef]
- Kleeman, A.; Foster, S. ‘It feels smaller now’: The impact of the COVID-19 lockdown on apartment residents and their living environment—A longitudinal study. J. Environ. Psychol. 2023, 89, 102056. [Google Scholar] [CrossRef]
- Capolongo, S.; Rebecchi, A.; Buffoli, M.; Appolloni, L.; Signorelli, C.; Fara, G.M.; D’Alessandro, D. COVID-19 and Cities: From Urban Health strategies to the pandemic challenge. A Decalogue of Public Health opportunities. Acta Biomed. 2020, 91, 13–22. [Google Scholar] [CrossRef]
- Chung, S.-H.; Kim, J.H. Analysis of Indoor Residential Environment Satisfaction among Social Housing Households in Seoul. Buildings 2023, 13, 2761. [Google Scholar] [CrossRef]
- James, R.N. Multifamily Housing Characteristics and Tenant Satisfaction. J. Perform. Constr. Facil. 2007, 21, 472–480. [Google Scholar] [CrossRef]
- Molaei, P.; Hashempour, P.; Tang, L.M. Semi-open spaces of apartments considering COVID-19 pandemic: General expectations of balcony design in the post-pandemic world. Archit. Eng. Des. Manag. 2022, 18, 705–722. [Google Scholar] [CrossRef]
- Smektała, M.; Baborska-Narozny, M. The use of apartment balconies: Context, design and social norms. Build. Cities 2022, 3, 134–152. [Google Scholar] [CrossRef]
- Antoniou, D.; Dimopoulos, T. Southern Orientation and Natural Cross Ventilation: Mind the Gap(s) What Clients, Valuers, Realtors and Architects Believe. Int. J. Real Estate Land Plan. 2018, 1, 426–439. [Google Scholar]
- Tucker, R.; Andrews, F.; Johnson, L.; Palmer, J. Architects’ professional perspectives on child- and family-friendly apartment design in Australia. J. Asian Archit. Build. Eng. 2022, 21, 2262–2276. [Google Scholar] [CrossRef]
- Gao, X.; Asami, Y.; Zhou, Y.; Ishikawa, T. Preferences for Floor Plans of Medium-Sized Apartments: A Survey Analysis in Beijing, China. Hous. Stud. 2013, 28, 429–452. [Google Scholar] [CrossRef]
- Baker, J.; Oppewal, H. The effects of floor plan representations on preferences for apartments. J. Hous. Built Environ. 2023, 38, 727–752. [Google Scholar] [CrossRef]
- Femenias, P.; Geromel, F. Adaptable housing? A quantitative study of contemporary apartment layouts that have been rearranged by end-users. J. Hous. Built Environ. 2020, 35, 481–505. [Google Scholar] [CrossRef]
- Boumová Pužová, I.; Zdráhalová, J. The Apartment with the Best Floor Plan Layout: Architects versus Non-architects. Crit. Hous. Anal. 2016, 3, 1. [Google Scholar] [CrossRef]
- Moreira da Costa, J.; Sampaio, M.F. User Information in the housing market. In Proceedings of the XXXVII IAHS World Congress on Housing, Santander, Spain, 26–29 October 2010; pp. 1–8. [Google Scholar]
- Association Qualitel. Available online: https://www.qualitel.org/ (accessed on 23 March 2024).
- The National Affordable Homes Agency. 721 Housing Quality Indicators (HQI) Form. Available online: https://assets.publishing.service.gov.uk/government/uploads/system/uploads/attachment_data/file/366634/721_hqi_form_4_apr_08_update_20080820153028.pdf (accessed on 22 March 2023).
- Rogers, P. CIC Design Quality Indicator Online. Available online: http://www.dqi.org.uk/dqi/Common/DQIOnline.pdf (accessed on 14 January 2023).
- SEL. Available online: https://www.wbs.admin.ch/fr/application/methodologie (accessed on 2 April 2023).
- Kim, S.-S.; Yang, I.; Yeo, M.; Kim, K.-W. Development of a housing performance evaluation model for multi-family residential buildings in Korea. Build. Environ. 2005, 40, 1103–1116. [Google Scholar] [CrossRef]
- Le, L.H.; Ta, A.D.; Dang, H.Q. Building up a System of Indicators to Measure Social Housing Quality in Vietnam. Procedia Eng. 2016, 142, 116–123. [Google Scholar] [CrossRef]
- BRE. Home Quality Mark. Available online: https://www.homequalitymark.com/wp-content/uploads/2020/01/HQM-Guide-document_BRE_115302_0120-v2.3.pdf (accessed on 11 May 2024).
- WELL. WELL Performance Rating. Available online: https://v2.wellcertified.com/en/performance-rating/overview (accessed on 11 May 2024).
- GBC. Health and Wellbeing in Homes. Available online: https://ukgbc.org/wp-content/uploads/2017/12/Healthy-Homes-Full-Report.pdf (accessed on 11 May 2024).
- Haddad, M.; Judeh, M.; Haddad, S.I. Factors Affecting Buying Behavior of an Apartment an Empirical Investigation in Amman, Jordan. Res. J. Appl. Sci. Eng. Technol. 2011, 3, 234–239. [Google Scholar]
- Brkanić, I. Model Korisničkog Vrednovanja Prostornih Karakteristika Stanova. Doctoral Dissertation, Fakultet Tehničkih Nauka, Univerzitet u Novom Sadu, Novi Sad, Republika Srbija, 2018. [Google Scholar]
- Ministarstvo Zaštite Okoliša, Prostornog Uređenja i Graditeljstva. Pravilnik Minimalnih Tehničkih Uvjeta za Projektiranje i Gradnju Stanova iz Programa Društveno Poticane Stanogradnje. Available online: https://narodne-novine.nn.hr/clanci/sluzbeni/2004_07_106_2064.html (accessed on 10 May 2024).
- Ministry of Physical Planning, Construction and State Assets, Program of Energy Reconstruction of Apartment Buildings for the Period 2014–2020. Available online: http://www.mgipu.hr (accessed on 19 November 2019).
- Brkanić, I.; Stober, D.; Mihić, M. A Comparative Analysis of the Spatial Configuration of Apartments Built in Osijek, Croatia, between 1930 and 2015. J. Asian Archit. Build. Eng. 2018, 17, 23–30. [Google Scholar] [CrossRef]
Disclaimer/Publisher’s Note: The statements, opinions and data contained in all publications are solely those of the individual author(s) and contributor(s) and not of MDPI and/or the editor(s). MDPI and/or the editor(s) disclaim responsibility for any injury to people or property resulting from any ideas, methods, instructions or products referred to in the content. |
© 2024 by the authors. Licensee MDPI, Basel, Switzerland. This article is an open access article distributed under the terms and conditions of the Creative Commons Attribution (CC BY) license (https://creativecommons.org/licenses/by/4.0/).