Article

Study on the Impact of Tree Species on the Wind Environment in Tree Arrays Based on Fluid–Structure Interaction: A Case Study of Hangzhou Urban Area

1
Department of Landscape and Architecture, Zhejiang Agriculture and Forestry University, Hangzhou 311300, China
2
China Construction Fifth Engineering Division Co., Ltd., Hangzhou 311300, China
*
Author to whom correspondence should be addressed.
These authors contributed equally to this work.
Buildings 2024, 14(5), 1409; https://doi.org/10.3390/buildings14051409
Submission received: 21 March 2024 / Revised: 17 April 2024 / Accepted: 24 April 2024 / Published: 14 May 2024
(This article belongs to the Special Issue Urban Climate, Comfort and Building Energy Performance)

Abstract

:
In order to improve the level of the urban living environment and improve the comfort level of the microclimate, this paper investigates and simulates numerically the influence on the wind environment of different tree species in various tree array layouts, aiming to enhance wind comfort in tree landscapes and reduce the risk of high wind speeds. Initially, the study analyzes the commonly used tree species in Hangzhou’s urban tree arrays (beech, soapberry, and camphor trees), summarizing three types of tree array layouts: retention, through, and enclosure. Subsequently, standard tree models are established to define their crown porosity, trunk elastic modulus, and other physical characteristics. Using fluid–structure interaction methods, the impact of different tree species on the wind environment within various tree array layouts is numerically simulated at a wind speed of 14 m/s. In conclusion, the retention layout is most effective in controlling wind speed. Camphor trees perform excellently in reducing wind speed within both retention and enclosure tree array layouts, with wind reduction efficiencies of 16.06% and 14.09%, respectively. Soapberry trees show optimal wind speed reduction in the through layout, achieving 12.31%.

1. Introduction

In recent years, the acceleration of urbanization has led to increasingly prominent issues such as the urban heat island effect, air pollution, and deterioration of living environments [1]. Trees, as a vital part of urban ecosystems, not only improve the urban breeze environment by absorbing carbon dioxide and reducing temperature but also help alleviate the urban heat island effect, optimize wind flow, and thus provide a more pleasant outdoor environment for citizens [2]. Due to the increased frequency of extreme climate events, urban climates are frequently changing, leading to profound changes in the microclimate of living environments [3]. Currently, the development direction of residential area construction in our country is focused on creating comfortable, healthy, climate-appropriate, and people-centered living environments [4,5]. An appropriate wind environment can effectively improve microclimate comfort, mitigate the heat island effect, and disperse air pollutants, directly affecting the level of the living environment and the health of residents [6]. The issue of how to improve urban microclimates and enhance people’s quality of life through environmental design based on existing urban planning urgently needs to be addressed.
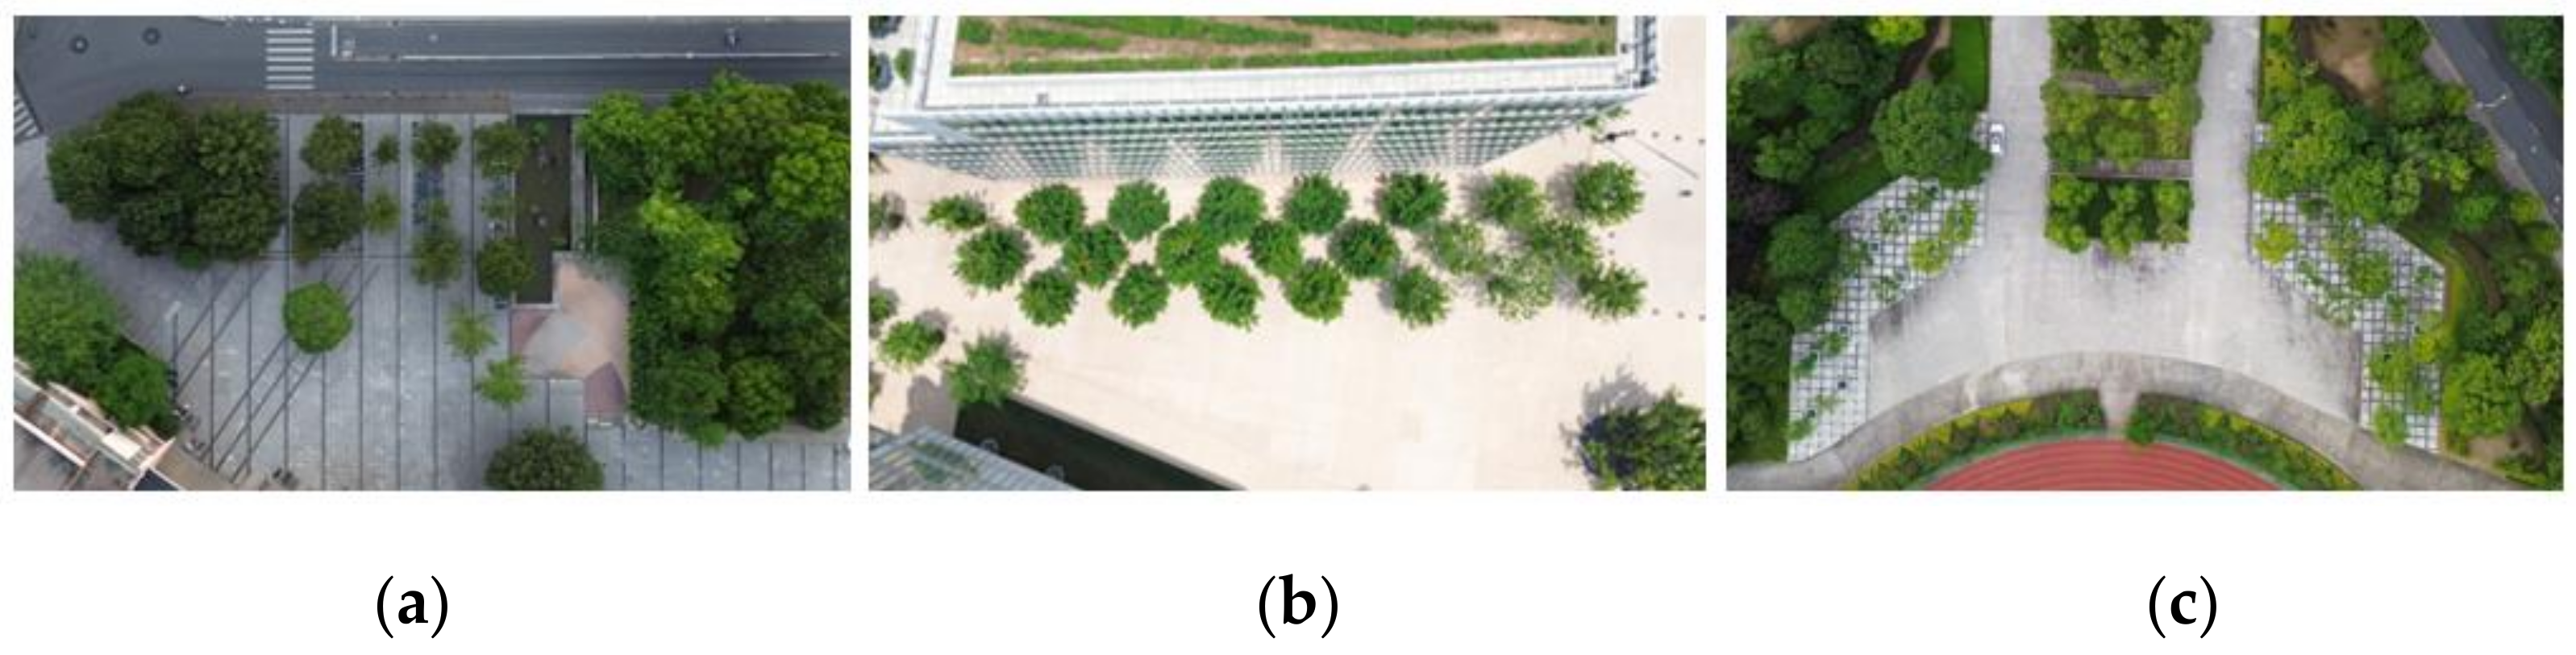
To alleviate the environmental problems brought by the development of urbanization, many first-tier cities take the lead in many measures, such as improving the use of roof greening; in areas with a lack of green space, roof greening can utilize original hard pavement surfaces through vertical greening measures, improving the urban heat island effect and reducing building energy consumption at the same time. Urban squares, as an integral part of public spaces, are not only centers of urban cultural and social life but also key elements of urban ecosystems [7]. At the same time, the square often adopts a large area of hard pavement, which will not only aggravate the urban heat island effect, but also is not conducive to the improvement of microclimate. Similar to roof greening, planting tree arrays on the hard ground is used to slow down the urban airflow and improve the internal flow of the air, and it also can add beauty [8]. Wind will form a “shelter zone” in the tree lee area, changing the near-ground fluency in the adjacent area [9,10,11], effectively reducing ground temperature and mitigating the heat island effect. In the related studies of tree array landscapes, Wu Yi [12] explored the formation of tree shade and its daily changes, noting that the movement of tree shade is caused by changes in the position of the sun, and the size of the shade is influenced by the tree’s own characteristics, such as the shape, size, and height of the canopy. Whyte [13] emphasized that the design of excellent spaces should integrate trees and resting facilities, highlighting that they provide not only aesthetic value but also ecological benefits such as shading, cooling, and wind protection. These studies often start from the perspective of individual plants, with fewer focusing on the influence of trees on the internal wind environment of tree arrays, tending to overlook the interactions and impacts of tree arrays as a whole on the wind environment. Therefore, researching the overall layout of trees on the wind environment within tree arrays is of significant practical importance for constructing comfortable and healthy living area wind environments, creating livable urban ecological environments, and achieving sustainable urban development.
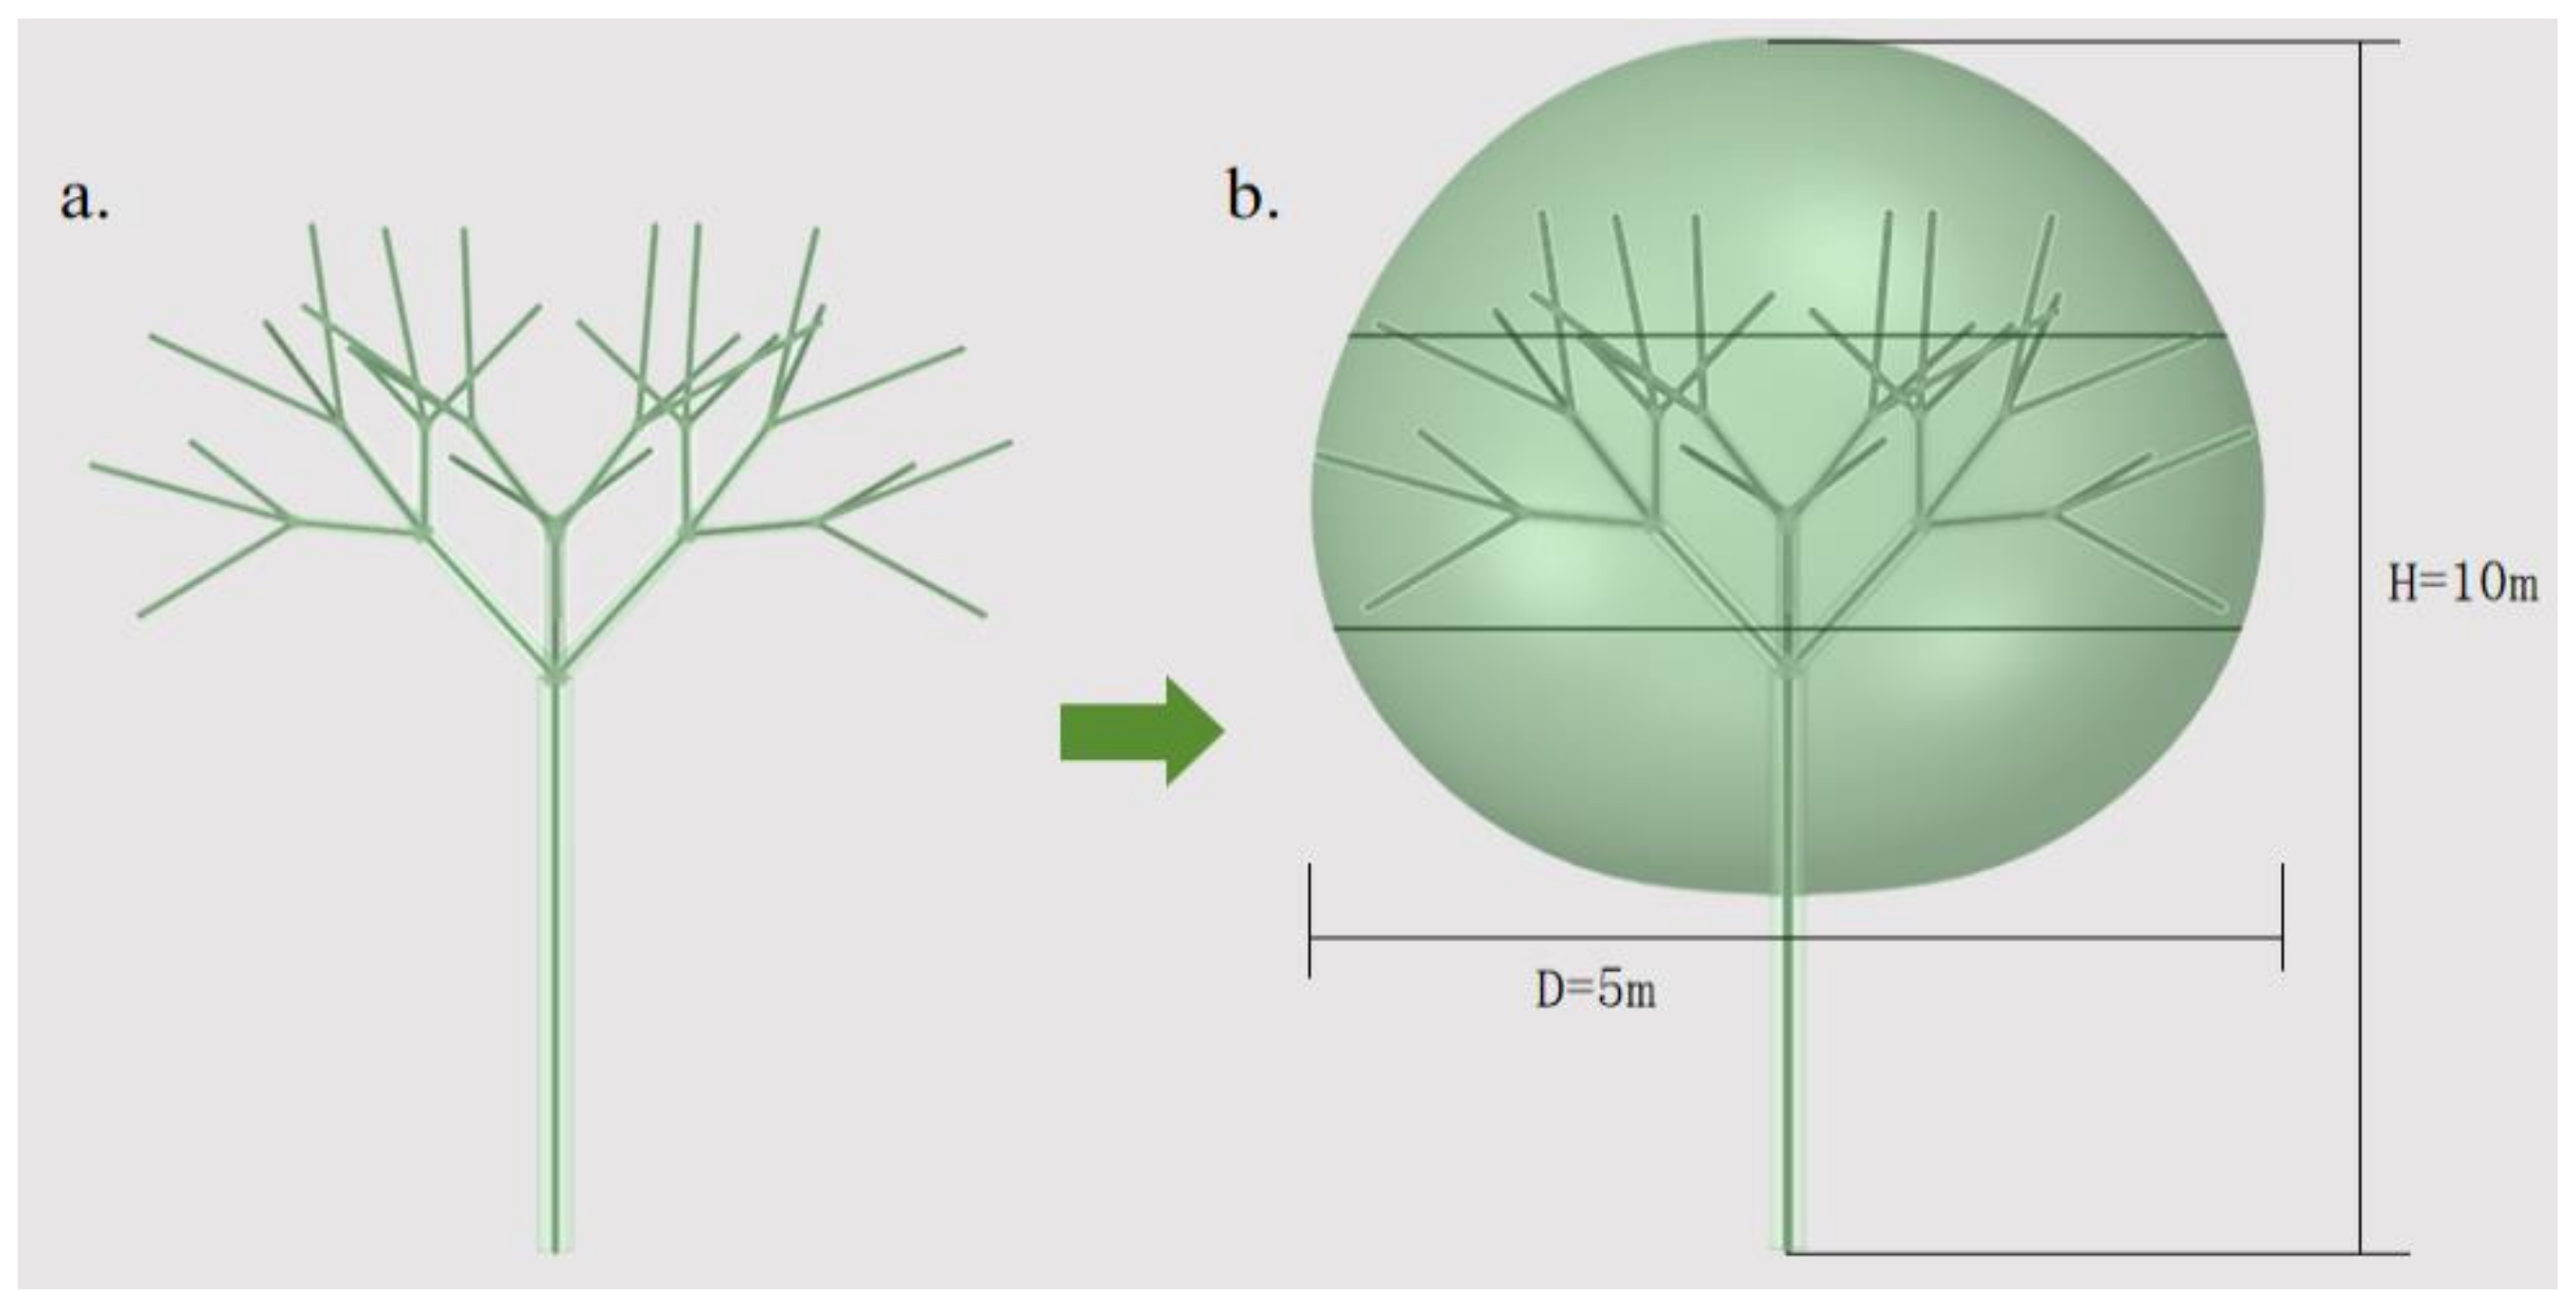
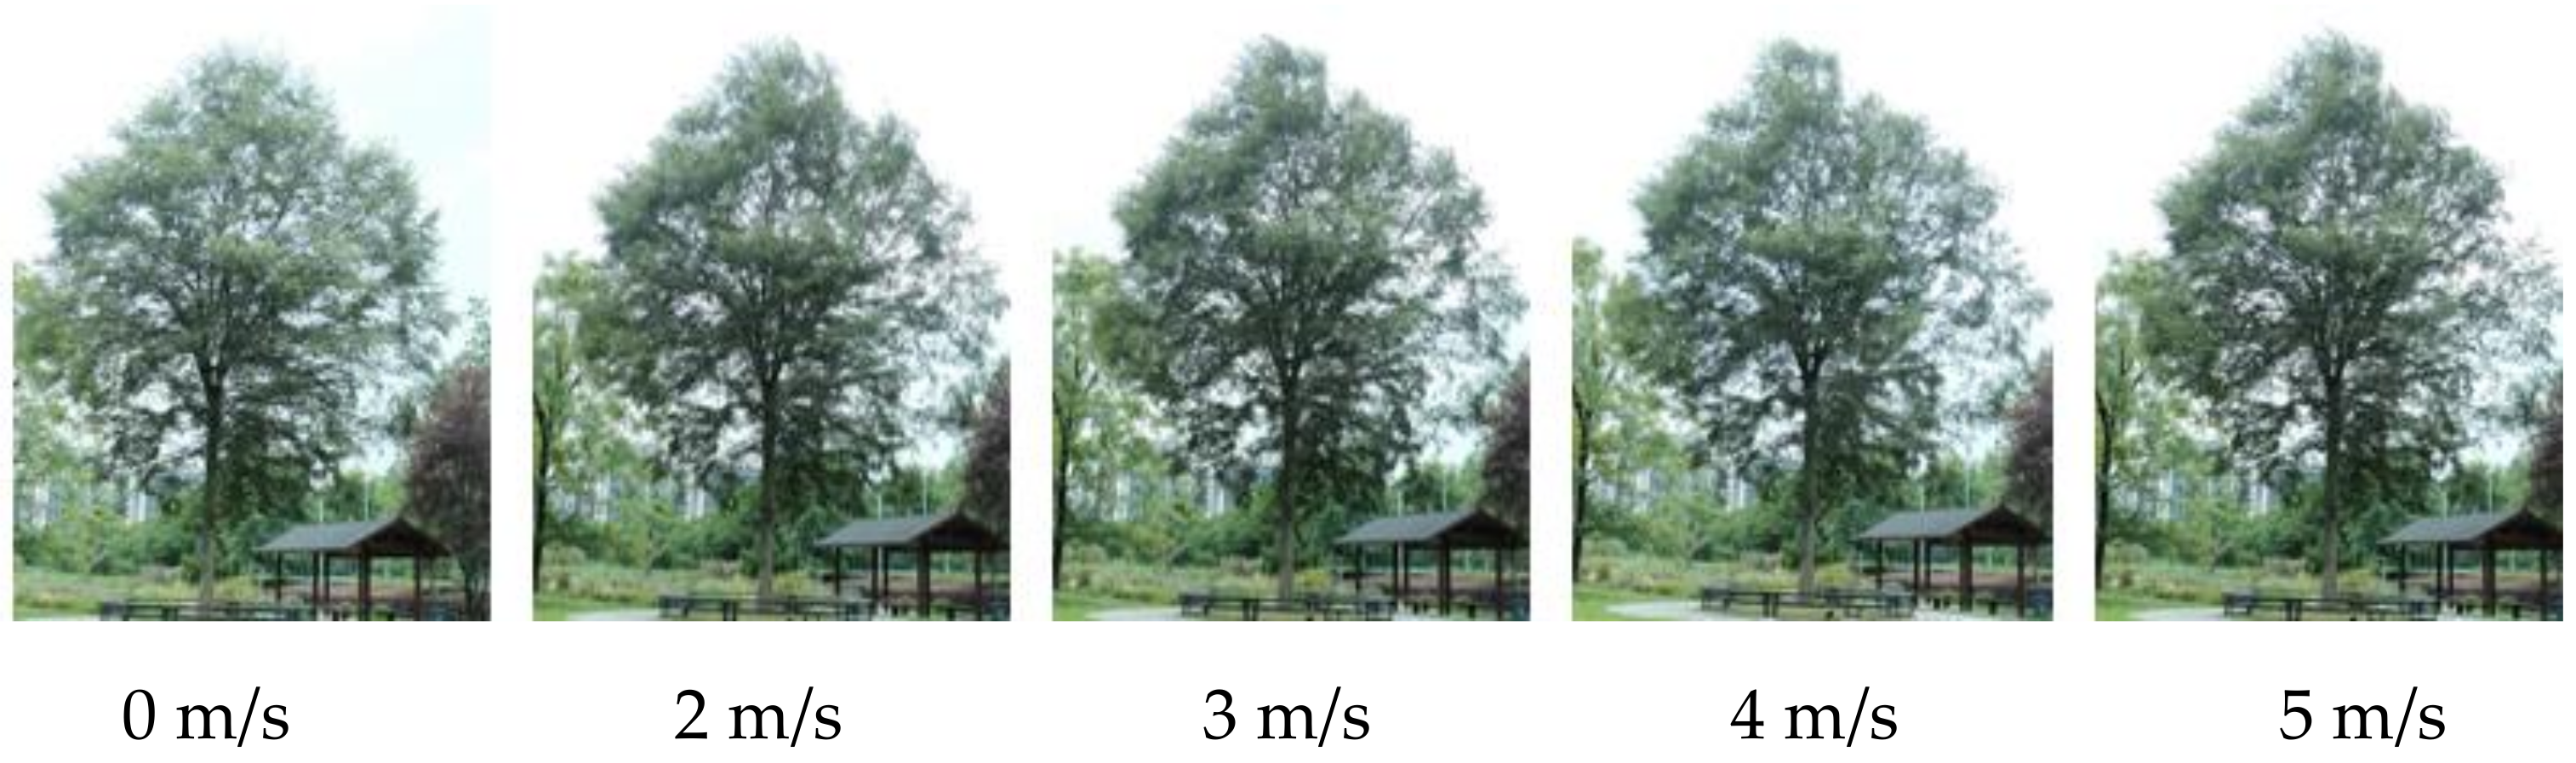
Under the influence of natural wind, the flexibility and permeability of tree branches and leaves lead to noticeable phenomena such as treetop displacement, crown shrinkage, and trunk bending [14]. This is known as the wind-induced response phenomenon, or fluid–structure interaction in fluid mechanics, which refers to the interaction between fluid (wind) and solid (trees) and is significant for understanding and optimizing the urban wind environment. James et al. [15] conducted research on the wind-induced response of trees with different crown types through field measurements. Li Feng [16] conducted wind tunnel experiments using Podocarpus macrophyllus saplings as the model to study the differences in the wind-induced response of trees and the effect on the wind environment behind the trees, under various crown shapes, arrangements, and porosity conditions. Lian Shihua [17] studied rubber trees, simplifying the tree crown and trunk into two parts, establishing a mechanical model of the tree, and analyzing the tree’s lodging, bending, and torsional responses under wind action. Existing scholars often use field measurements or wind tunnel experiments to study the wind-induced response of trees, which cannot eliminate environmental interference factors, leading to less accurate experimental results. Moreover, the significant differences in geometric construction and physical–mechanical properties among different tree species have led to an inconsistent understanding of the wind resistance mechanisms. Although there is relatively in-depth research on the wind resistance of common windbreak tree species such as poplars, pines, and spruces, in landscape design, many tree species play a role in controlling wind speed, and research on such tree species is particularly lacking.
In order to solve the above problem which has not been solved by scholars, this paper, based on the role of fluid–solid coupling between trees and flow field, from the perspective of landscape gardening, studies the impact of commonly used tree arrays on the wind environment under natural wind conditions, and researches the impact of tree arrays on the wind environment under the fluid–solid coupling by changing the type of tree and the form of layout, so as to optimize the wind environment, improve the wind comfort of the tree arrays’ landscapes, and reduce the wind disaster brought by the high wind speeds.

2. Field Measurement

2.1. Tree Species Use Research and Analysis

Hangzhou is located in southeastern China, the climate is mild, and the choice of tree species in the landscape is also rich and diverse, making the study of tree array landscape more representative and diverse, and with the convening of large-scale activities such as the Asian Games, a large amount of resources have been invested in environmental protection and green city construction, which provides a good policy and public support environment for the study of the tree array landscape.
We selected tree arrays with a basic area of 1000 m2 or more, regular tree arrays with a scale of no less than 3 rows × 3 columns, and non-regular tree arrays with no less than 10 trees in the square, and we conducted the research on 18 different types of venues, such as Hangzhou City Wave Culture City and Zhejiang People’s Congress Hall, through screening. The research results are shown in Table 1.

2.2. Tree Array Layout Research and Analysis

Schroeder and colleagues [18] employed video imaging technology to summarize the spatial layout of trees in parks, identifying the number of trees and their spatial arrangement influenced by visual preference. This study provides new insights for understanding and optimizing tree layouts in parks and recreational environments. Tang Chaojun categorized tree arrays into three types based on aesthetics and usage requirements: through type, recreational type, and ornamental type [19]. In this paper’s field research, tree array layouts were categorized into three types based on the usage and design intent: retention-type tree array layout, through-type tree array layout, and enclosed-type tree array layout. Liu’s study [20] suggests that with the increase in the distance between trees, the airflow recovery along the axis accelerates. The planting distance between trees in actual tree arrays ranges from 4 to 12 m [21]. After comprehensive consideration, the tree spacing was set at 1.5 times the crown width (8 m), which balances the airflow effect between adjacent trees and represents a common planting distance in reality (Figure 1).
Retention-type tree array layout: Commonly used in leisure spaces like street corner squares and parks, this design features a regular grid planting with seating and other facilities to enhance pedestrian convenience and urban space usability. The actual photographs are shown in Figure 2a.
Through-type tree array layout: Positioned in transit areas like park entrances and near subway exits, this layout provides shade and ventilation along pathways. It is characterized by grid planting on either side of passageways, integrating closely with roads and pavements for efficient movement. The actual photographs are shown in Figure 2b.
Enclosed-type tree array layout: Found in park gathering areas and riverside spaces, this layout combines lawns and plazas to create semi-open spaces for activities like leisure and performances. The design varies with the terrain, featuring an open center and enclosed edges, emphasizing spatial enclosure. The actual photographs are shown in Figure 2c.

3. Study Method and Simulation Validation

3.1. Evaluating Indicator

3.1.1. Average Airflow Intensity

First, the flow field is normalized: the results after simulation are scaled to a specific range, as shown in Equation (1). The data of the tree array’s internal flow field is subtracted from the free flow field data, as illustrated in Equation (2), and the processed data yield a normalized velocity difference cloud map at pedestrian breathing height under different conditions ( U Δ ).
U + i = U i v
U Δ i = U + i U + greenbelt   less
The wind speed difference cloud maps under various conditions are divided by the airflow field data without trees, as shown in Equation (3). Then, the square of the difference is calculated to determine the average effect of different layout forms on the airflow at pedestrian breathing height, as demonstrated in Equation (4). This index indicates that if D ¯ i is positive/negative, it represents that the tree layout has an overall facilitating/hindering effect on the planar airflow at the pedestrian breathing zone.
D i = U Δ i U t r e e l e s s × 100 %
D i ¯ = j = 1 N D i j N
In the formula, i is the different simulation conditions; N is the number of grids of the pedestrian breathing plane in the tree array; and j is the sample point.

3.1.2. Air Reduction Efficiency

The reduction efficiency of wind speed by different layout forms merits attention, as it provides guidance for tree layout design in residential areas, aiming to create a comfortable wind environment. By comparing the dr values for each scenario, it is possible to approximate the wind reduction capability of different types of trees at pedestrian height, indicating the trees’ wind reduction efficiency. The dr is the ratio of the difference between the average wind speed at the pedestrian height (1.5 m) inflow boundary µ0 and the average wind speed at the downwind outflow boundary um after passing through each layout to the average wind speed at the inflow boundary µ0, as shown in Equation (5).
d r = u 0 u m u 0
In the formula, µ0 is the average value of the inflow wind velocity; and µm is the average value of the outflow wind speed.

3.2. Model Building

3.2.1. Parameter Settings of the Branches

According to the survey of landscape tree species in Hangzhou in the second chapter, most of the crown types are combined axis branches, and the crowns of different tree species are basically the same, so it is unified as a consistent standard wood model. In the survey, representative tree species commonly used for greening were selected. First, four different sample trees were measured, and the average value of the data of tree height, branch height, breast diameter, and crown amplitude were calculated (Table 2). The standard value was determined, and the model of standard tree trunk and branches was established using L-system. The model is shown in Figure 3a.
According to the porous media model theory, the entire tree crown is regarded as a porous medium entity [22], and a porous media model for the leaves and fine branches area is established using the additional source method. The shape is simplified to an ellipsoid based on the outer contour of the branches, with a crown width of 5 m. The final model is shown in Figure 3b.

3.2.2. Mechanical Properties of the Trees

The mechanical material characteristics of the branches were determined by referencing the measurements and analytical calculations of tree elastic modulus by Hu Xiaoyi [23]. The physical and mechanical properties of wood for major tree species in China and the United States’ “Wood handbook: Wood as an engineering material” [24,25] provided the necessary parameters such as branch density and elastic modulus. During simulation verification, the wood physical parameters of the beech tree, a common tree species in tree arrays, were used as the standard wood physical parameters. The parameter settings are presented as described in Table 3:

3.2.3. Boundary Condition Setting

The main content of the boundary conditions includes the positional and parametric information of the boundaries, such as the inlet, outlet, symmetrical surfaces, and solid walls. The purpose of setting boundary conditions is to control the characteristics at the interface between different objects. Boundary conditions are crucial for conducting fluid–structure interaction numerical simulations, as the basic parameters set directly affect the process and accuracy of CFD numerical simulation results. The size of the computational domain is based on the tree height H, set at various multiples of the tree height. To ensure that the wind speed can fully develop within the computational domain and to balance computational cost and time, the model’s domain boundaries are set as follows: the wind speed inlet is 3H from the trees; the outlet is 9H; the sidewalls are 3H from the trees, with the entire domain height at 3H (Figure 4). Due to the irregular shape of the trees, the grid incorporates an internal section with the trees using an unstructured grid. To allow adequate computation of the airflow, local refinement is applied, with dimensions set to 70 m × 50 m × 15 m; the Mesh software (Ansys meshing) is used to generate the overall tree grid using a tetrahedral mesh type. The pulsating wind field model contains 2.25 million cells with a mesh quality of 0.86 (Figure 5).
The boundary conditions are set as follows: The turbulence model adopts a velocity inlet at the entrance boundary (Figure 6), with the inflow speed based on gradient wind. The reference height is set at 1H, and the flow velocity is adjusted according to operational conditions. The tree canopy is defined as an interior surface. The k-ε turbulence model is utilized for the turbulence modeling. The ground roughness is set at 0.3 in accordance with Chinese load standards, and the surrounding boundaries are defined as no-slip stationary walls (wall).

3.3. Numerical Simulated Parameter Settings

3.3.1. Settings of Fluid–Solid Coupling

In this paper, Geometry module, Transient Structural module, and Fluid Flow module in Ansys are applied to realize the numerical simulation of tree model and fluctuating wind field fluid model in Workbench platform. The tree model was analyzed in the Transient Structural module, and the setting of the material characteristics of the 3D model was completed in the Engineering Data. The fluctuating wind field model was analyzed in the Fluid Flow module, and the basic parameter setting of the pulsating wind field was completed in the setup. The parameter settings of bidirectional flow–solid coupling are shown in Table 4.

3.3.2. Parameter Setting of the Tree Porosity

Kenney demonstrates that the two-dimensional porosity of plants can be measured using digitized photographs [26]. This is a commonly used and relatively accessible method for characterizing plant structures. Without disturbing the airflow in front of the trees, photographs are taken to record the characteristics of the windward and lateral sides of the trees at different wind speeds. Using a Fujifilm X-T2 camera, with a resolution of up to 24.1 million pixels, canopy images of the surveyed trees are captured. The images are then pixelated using Adobe Photoshop software to accurately calculate the two-dimensional porosity of the trees at different wind speeds.
Porosity at different wind speeds (0, 2, 3, 4, 5 m/s) is recorded, with each wind speed being recorded three times and the average value at different speeds being calculated. The camera is mounted on a tripod to ensure that the photography does not affect the surrounding wind environment, maintaining a consistent shooting azimuth at different wind speeds, and recording the wind speed at the time of photography. The measurement time should be chosen on days with higher wind speeds. An example of the photographed images is shown in Figure 7.
Grant and Nickling demonstrated the inevitable relationship between two-dimensional porosity (OP) and three-dimensional porosity (VP) [27], showing that the two-dimensional porosity increases as a power function of the three-dimensional porosity. They derived the conversion formula, with the specific relationship presented in Equation (8).
O P = A P A P + A U
X D X P = A D A P
O P = V P 2.782
In the formula, OP represents the two-dimensional porosity, and VP is the three-dimensional porosity. AP denotes the actual porosity area of the Chinese elm, while AU represents the actual windward area of the Chinese elm at different wind speeds. XD is the pixel value of the trunk; XP represents the pixel value of the tree’s two-dimensional porosity; AD is the actual area of the trunk; AP again refers to the actual value of the tree’s two-dimensional porosity area.
The tree branches and leaves deform under the force of the wind, altering their characteristic parameters. Especially at higher wind speeds, leaves and branches reorient along the wind direction. This deformation ability affects the tree’s porosity, the airflow passing through the tree, and the resulting drag coefficient, with these changes in tree characteristics leading to variations in the tree’s deceleration efficiency. Moreover, observations of trees swaying in real life indicate that canopy deformation is uneven, with the top canopy being more noticeably deformed due to sparse leaves and flexible branches, while the lower canopy, with its dense leaves and thick branches, deforms less. Porosity, as an important tree characteristic, is significantly influenced by wind speed and direction, and its variation also differs with canopy height. Therefore, when exploring the relationship between porosity and wind speed, the canopy is divided into upper, middle, and lower layers for separate porosity calculations. After pixelating tree photographs using Photoshop software, the numerical values of the three-dimensional porosity are presented in Table 5.

3.3.3. Verification Result

Based on the model construction and parameter settings in the previous section, numerical simulations were conducted using FLUENT software for both “without considering tree canopy stratification” and “with considering tree canopy stratification” scenarios. The simulation results were then compared and analyzed against the measured wind speed data. This study’s numerical simulation of wind speed was analyzed at 1.5 m and 5 m heights, taking the average wind speed of 20 equidistant points along the X-direction. The comparison of wind speeds in the horizontal direction between the numerical simulation results and the measured experimental wind field data is shown in Figure 8.
Integrating the measured data from the field and the results of numerical simulations, the variation pattern of wind speed in the flow field behind the tree shows that the discrepancy between the measured and simulated wind speeds is relatively small. This error might be due to the instability of wind speed in reality, whereas during simulation, the wind flows in at a steady rate, leading to deviations in the results. Additionally, the presence of other environmental factors during measurement can also affect the data. However, overall, the trend of wind speed change is essentially consistent, indicating that the experimental parameters set can effectively reflect the wind-induced deformation of trees and the airflow characteristics behind them.

4. Impact of Different tree Species in Tree Gust Environments

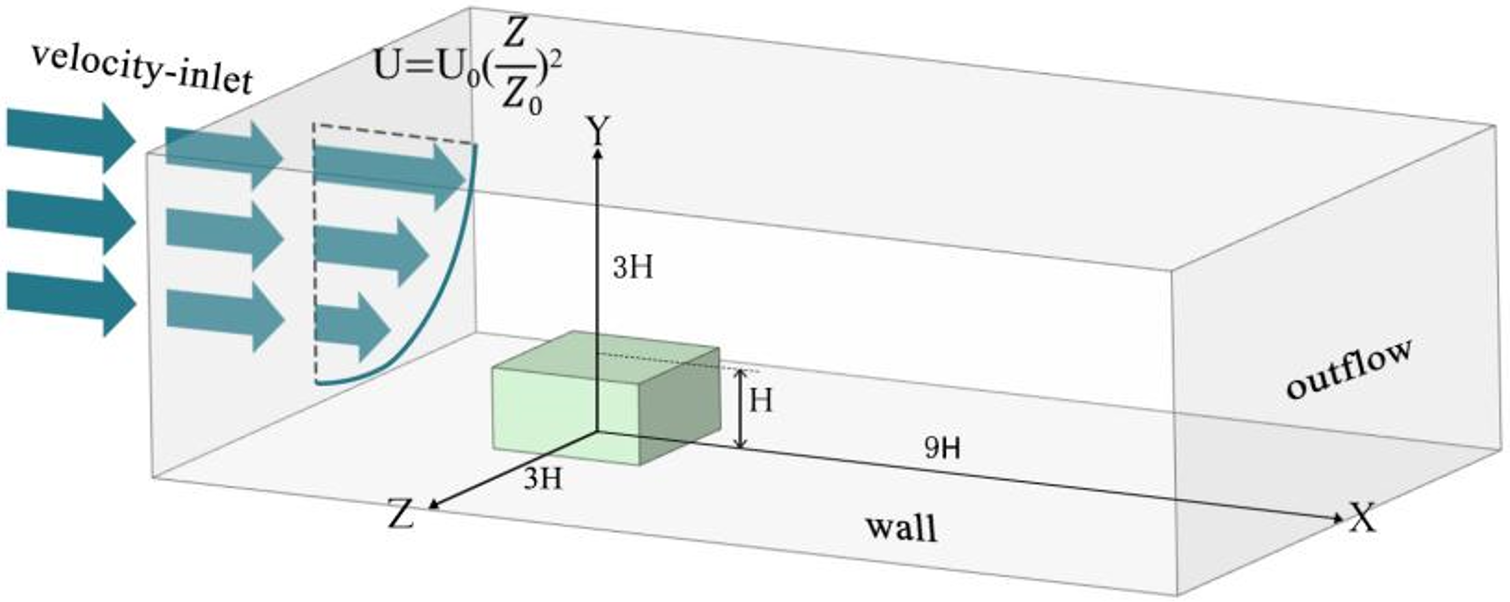
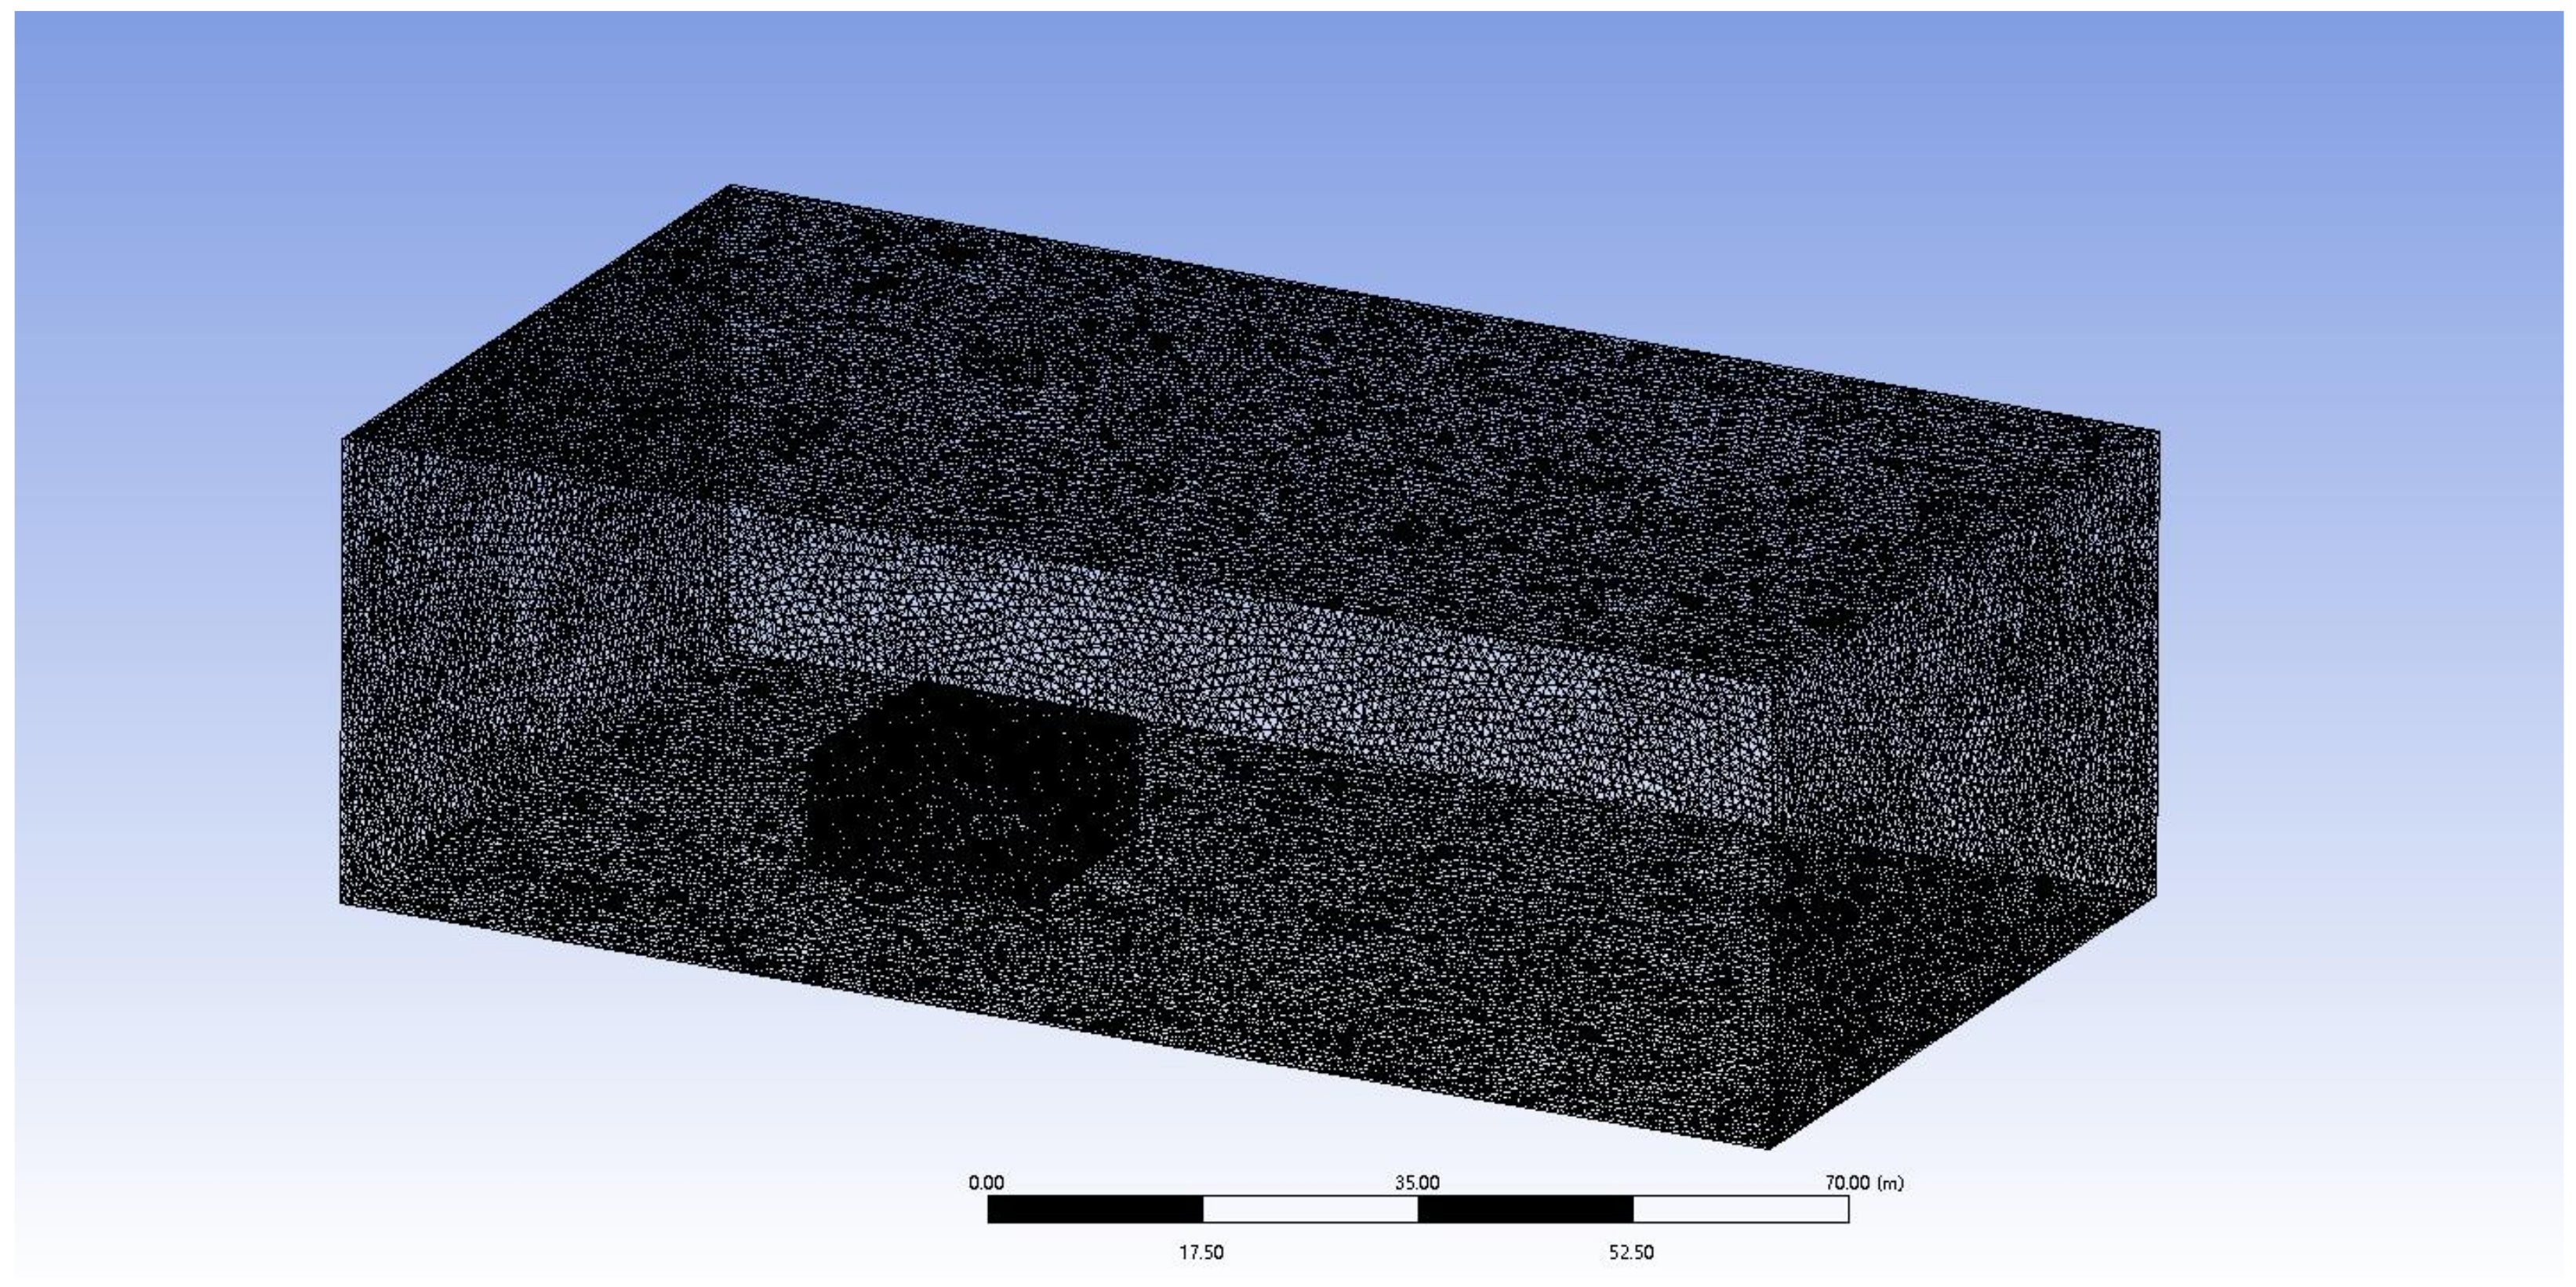
Based on the measured and simulated results from the previous chapter, it is evident that in the case of fluid–structure interaction, the porosity of the upper, middle, and lower layers of the trees are different in both magnitude and rate of change. Therefore, data on the porosity of three types of trees at high wind speeds across different layers were obtained based on actual measurements, with the parameter settings detailed in Table 6. Due to the fact that the wind speeds capable of causing tree deformation mainly fall between Beaufort scale levels 4 and 7, the stronger the wind within this range, the more pronounced the fluid–structure interaction becomes. Therefore, in this paper, the inflow wind speed is set at 14 m/s, which corresponds to level 7 on the Beaufort scale. This level represents the extreme wind speed that most trees can withstand without breaking [28].
Different tree species have distinct material properties, so in numerical modeling, it is necessary to assign appropriate material parameters to different models to distinguish their mechanical characteristics. These varying mechanical characteristics also have different impacts on the flow field [29]. According to “Physical and Mechanical Properties of Major Chinese Tree Species” and the American “Wood Handbook: Wood as an Engineering Material”, the measurements for different tree species materials are detailed in Table 7.

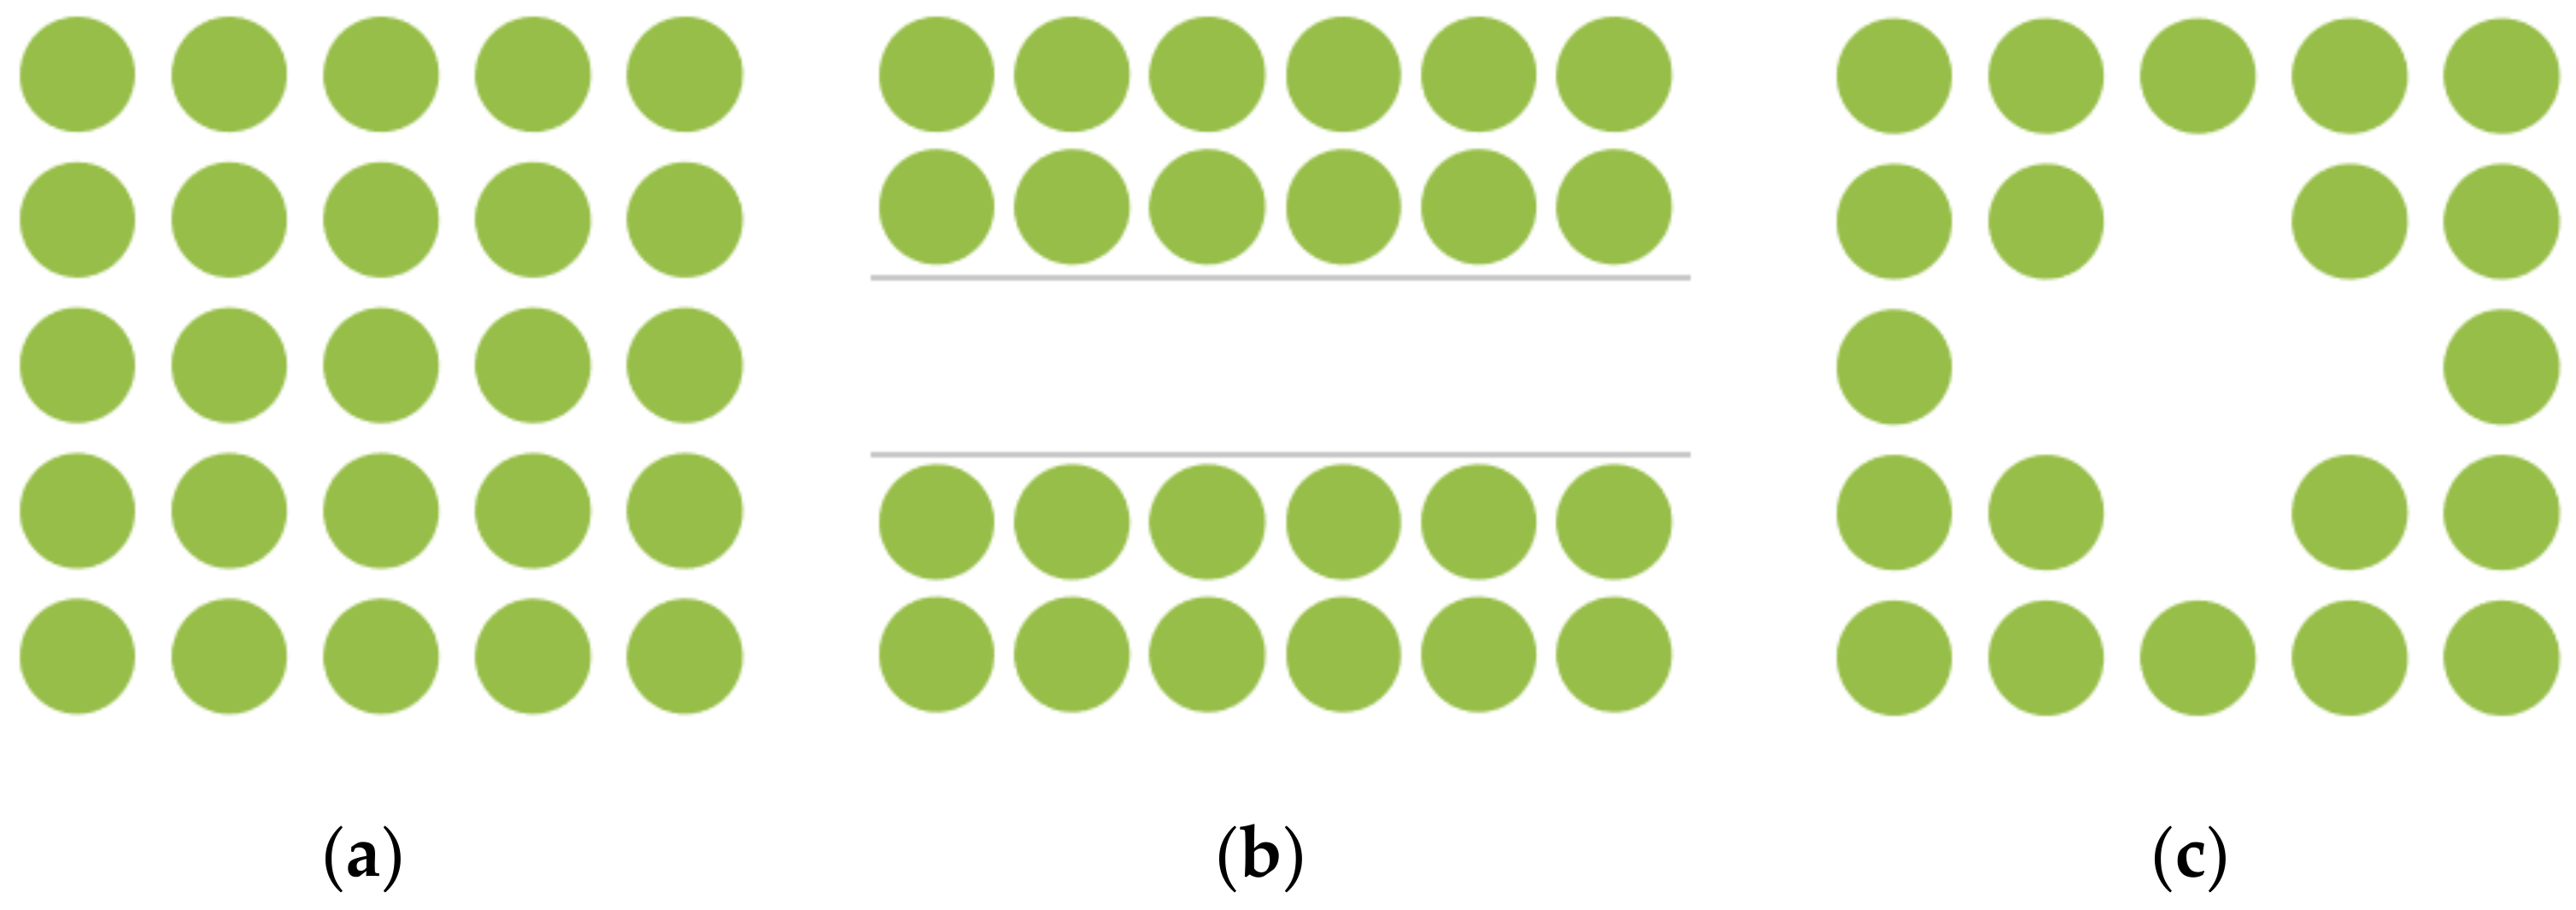
4.1. Stay-Type Tree Array Layout

4.1.1. Analysis of Wind Environment Characteristics at Pedestrian Height
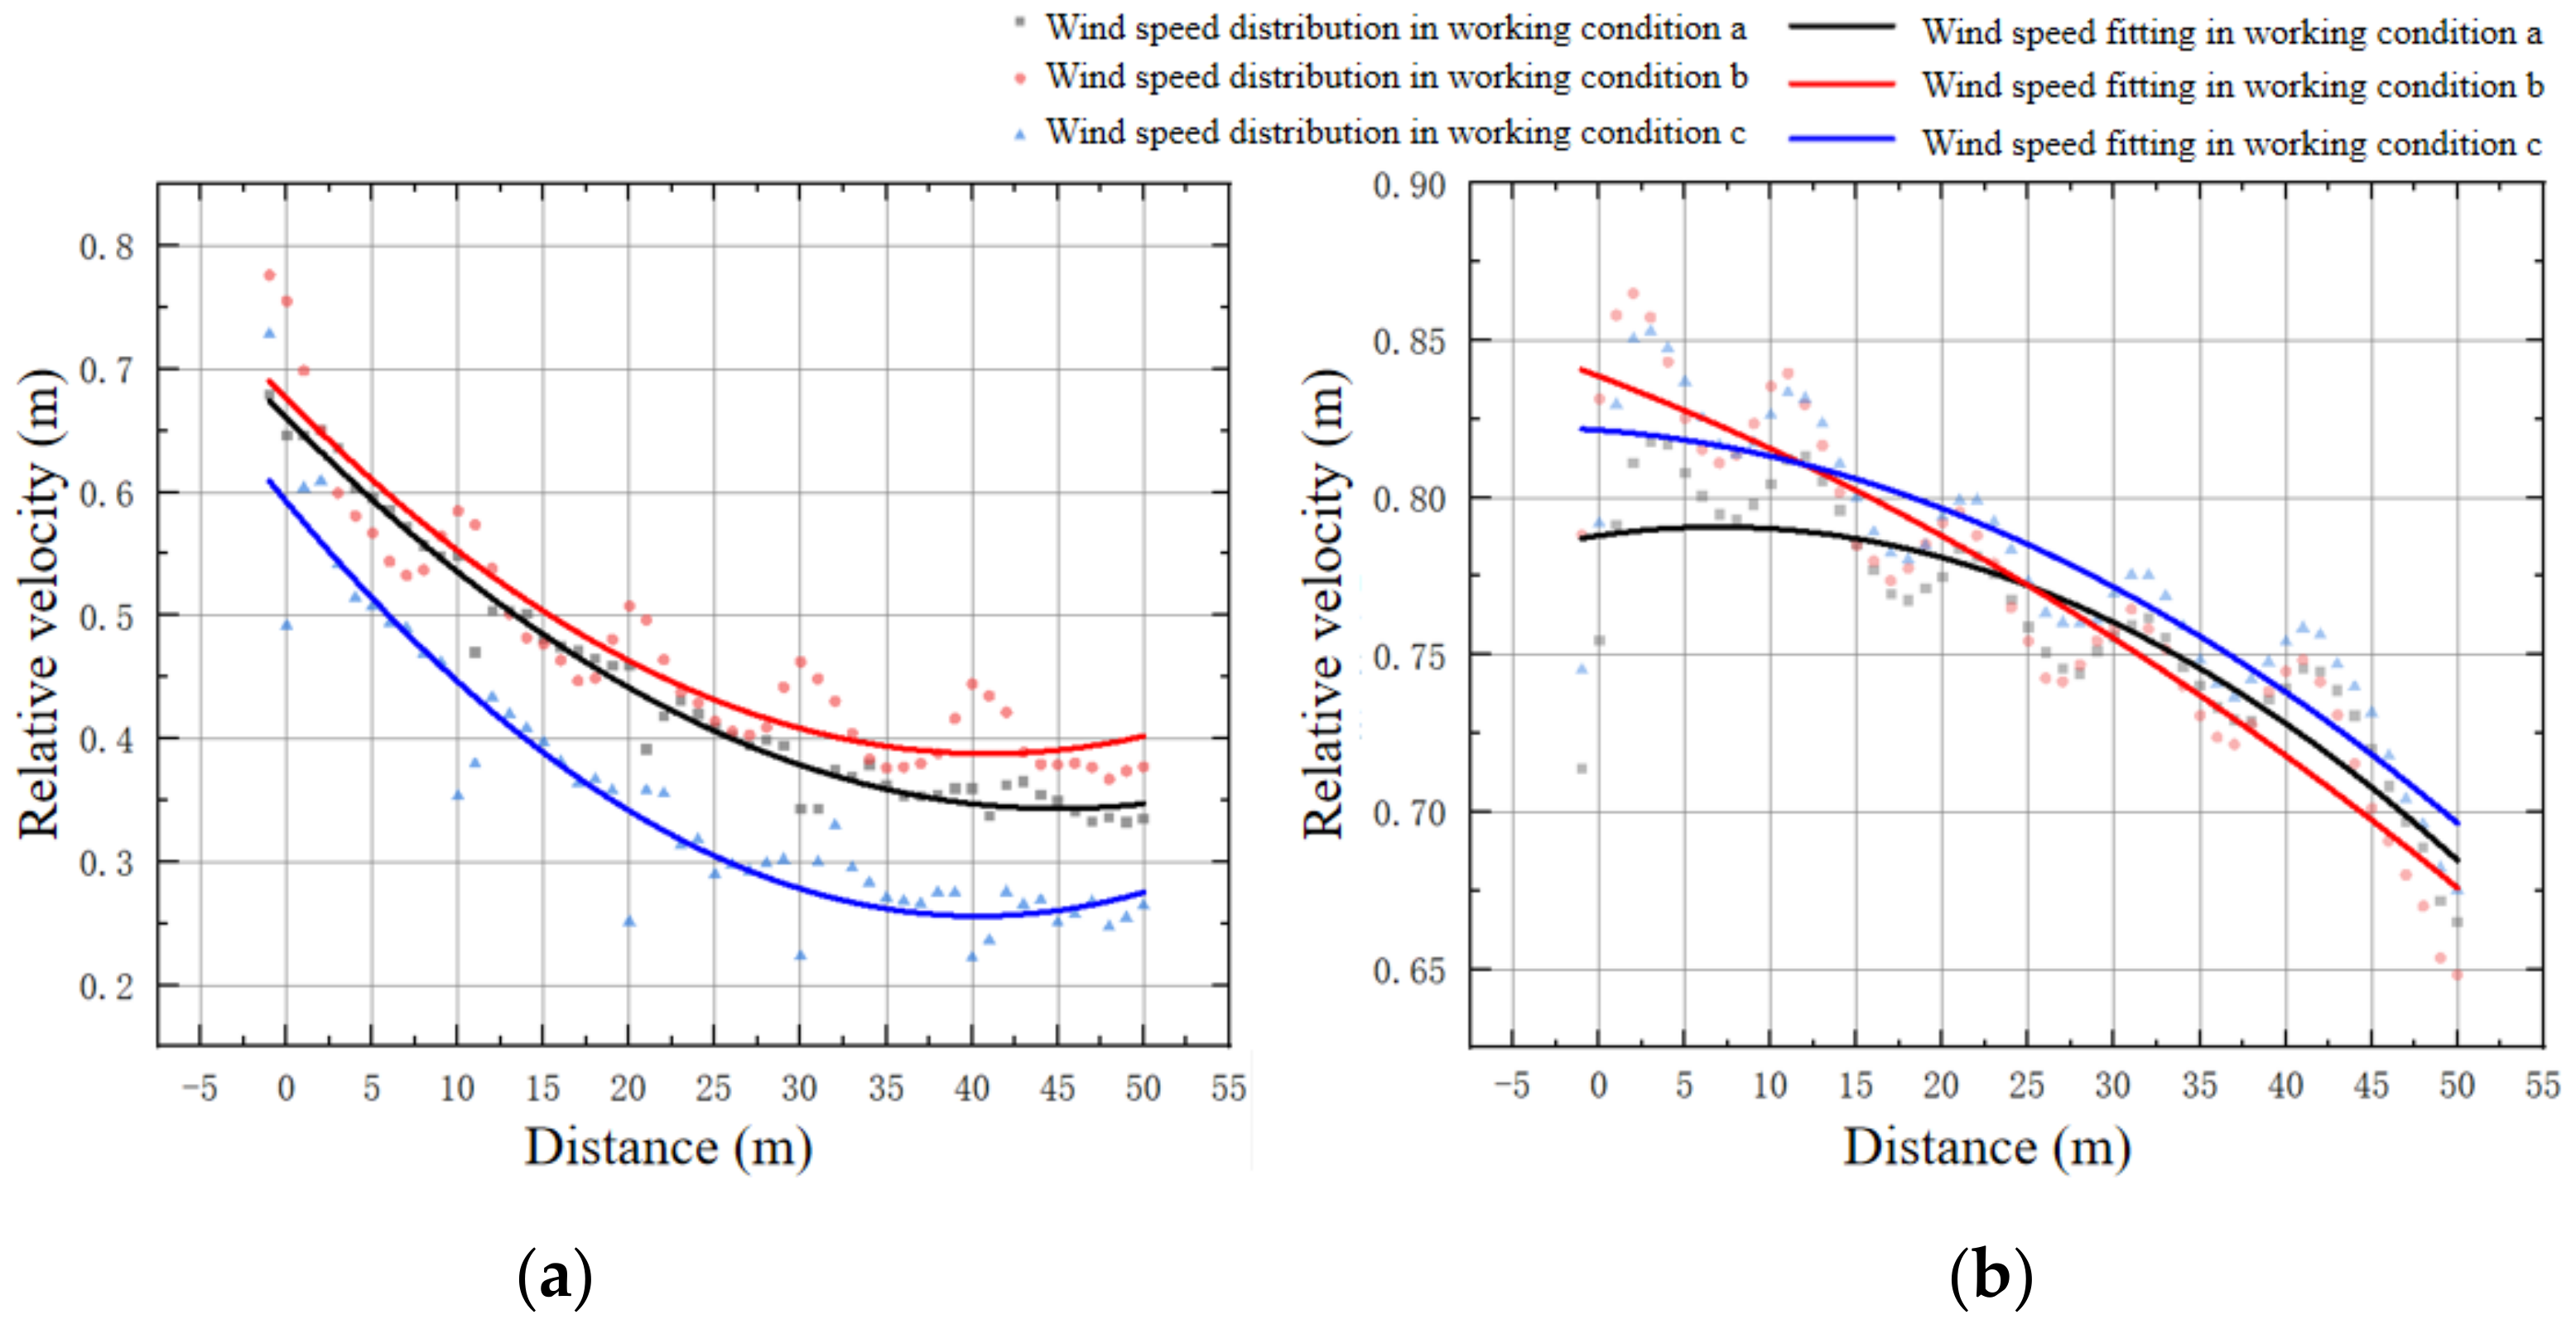
According to Figure 9, in the flow field distribution of the stationary tree array layout, a significant impact of tree arrangement on wind speed distribution can be observed. In this layout, the wind speed in the central area of the trees generally shows a decreasing trend, while in the area between the trees, the wind speed noticeably increases. This phenomenon creates the so-called “channel effect”, where the wind speed accelerates when passing through the gaps between trees, thus forming high-speed airflow channels between the tree arrays. However, it is important to note that this acceleration effect is not constant; as the distance from the starting point of the tree array to the rear end increases, the wind speed gradually decreases, until it becomes consistent with the wind speed in the central area of the trees at the rear end of the array. Under condition a, the primary relative wind speed range is from 0.35 to 0.95; for condition b, the relative wind speed range slightly extends to 0.4 to 0.95, with the acceleration effect of the wind speed being more pronounced under specific conditions. In condition c, the relative wind speed range is from 0.3 to 0.9, with a broader range of wind speed variation.
Analyzing from the perspective of minimum relative wind speed, in condition c, the minimum relative wind speed in the tree center interval is 0.3, indicating that the tree array layout in condition c has the most effective performance in reducing wind speed compared to the other two conditions. In contrast, the minimum relative wind speeds for conditions a and b are 0.4 and 0.35, respectively. Similarly, analyzing the maximum relative wind speed in the tree center interval reveals that condition c has the smallest value compared to the other two conditions (as shown in Figure 10a), which can be specifically ordered as follows: condition c < condition b < condition a. This indicates that condition c achieves the best effect in reducing wind speed in the tree center interval.
Further analysis of the spacing between trees shows that before X = 10 m, condition a has the highest degree of acceleration between trees relative to the other two conditions, with the maximum relative speed between trees reaching up to 0.9. In contrast, the maximum relative speeds between trees in conditions c and b are both around 0.85. This suggests that in the front section of the tree array (0–10 m), condition b better reduces wind speed. In the middle section of the tree array (10–25 m), due to the weakening of the “channel effect” and the interference of trees, the wind speed in condition a is significantly reduced, with the relative wind speeds being condition b < condition a < condition c; in the rear section of the tree array (25–50 m), the wind speed in condition a continues to weaken and is the smallest relative to the other two conditions, specifically ordered as follows: condition a < condition b < condition c.
In summary, in the stationary tree array layout, the configuration of trees has a significant impact on the distribution of wind speed. The effects on the flow field vary greatly under different operational conditions, with condition c showing the best performance in reducing wind speed, particularly in the tree center area and across the entire tree array. Furthermore, condition a exhibits the most significant tree-to-tree acceleration effect in the front section of the tree array, but in the middle and rear sections, the wind speed reduction effect gradually becomes apparent, eventually reaching the minimum.

4.1.2. Average Airflow Intensity

By using Tecplot software to calculate and analyze the average airflow intensity at pedestrian breathing height under three different residential greenery layout forms, and compiling the results into Table 8, it was found that the average airflow intensity for all three conditions was negative. This indicates that overall, the tree layouts significantly reduce the wind speed at pedestrian breathing height.

4.1.3. Air Reduction Efficiency

As shown in Table 9, an analysis of the effects of three different tree layouts (conditions a, b, and c) on the outflow wind speed was conducted. It was found that condition c has the highest efficiency in reducing wind speed, with an average wind reduction percentage of 16.06%. This indicates that under the layout of condition c, the trees have the most significant blocking effect on the wind.

4.2. Through-Type Tree Array Layout

4.2.1. Analysis of Wind Environment Characteristics at Pedestrian Height

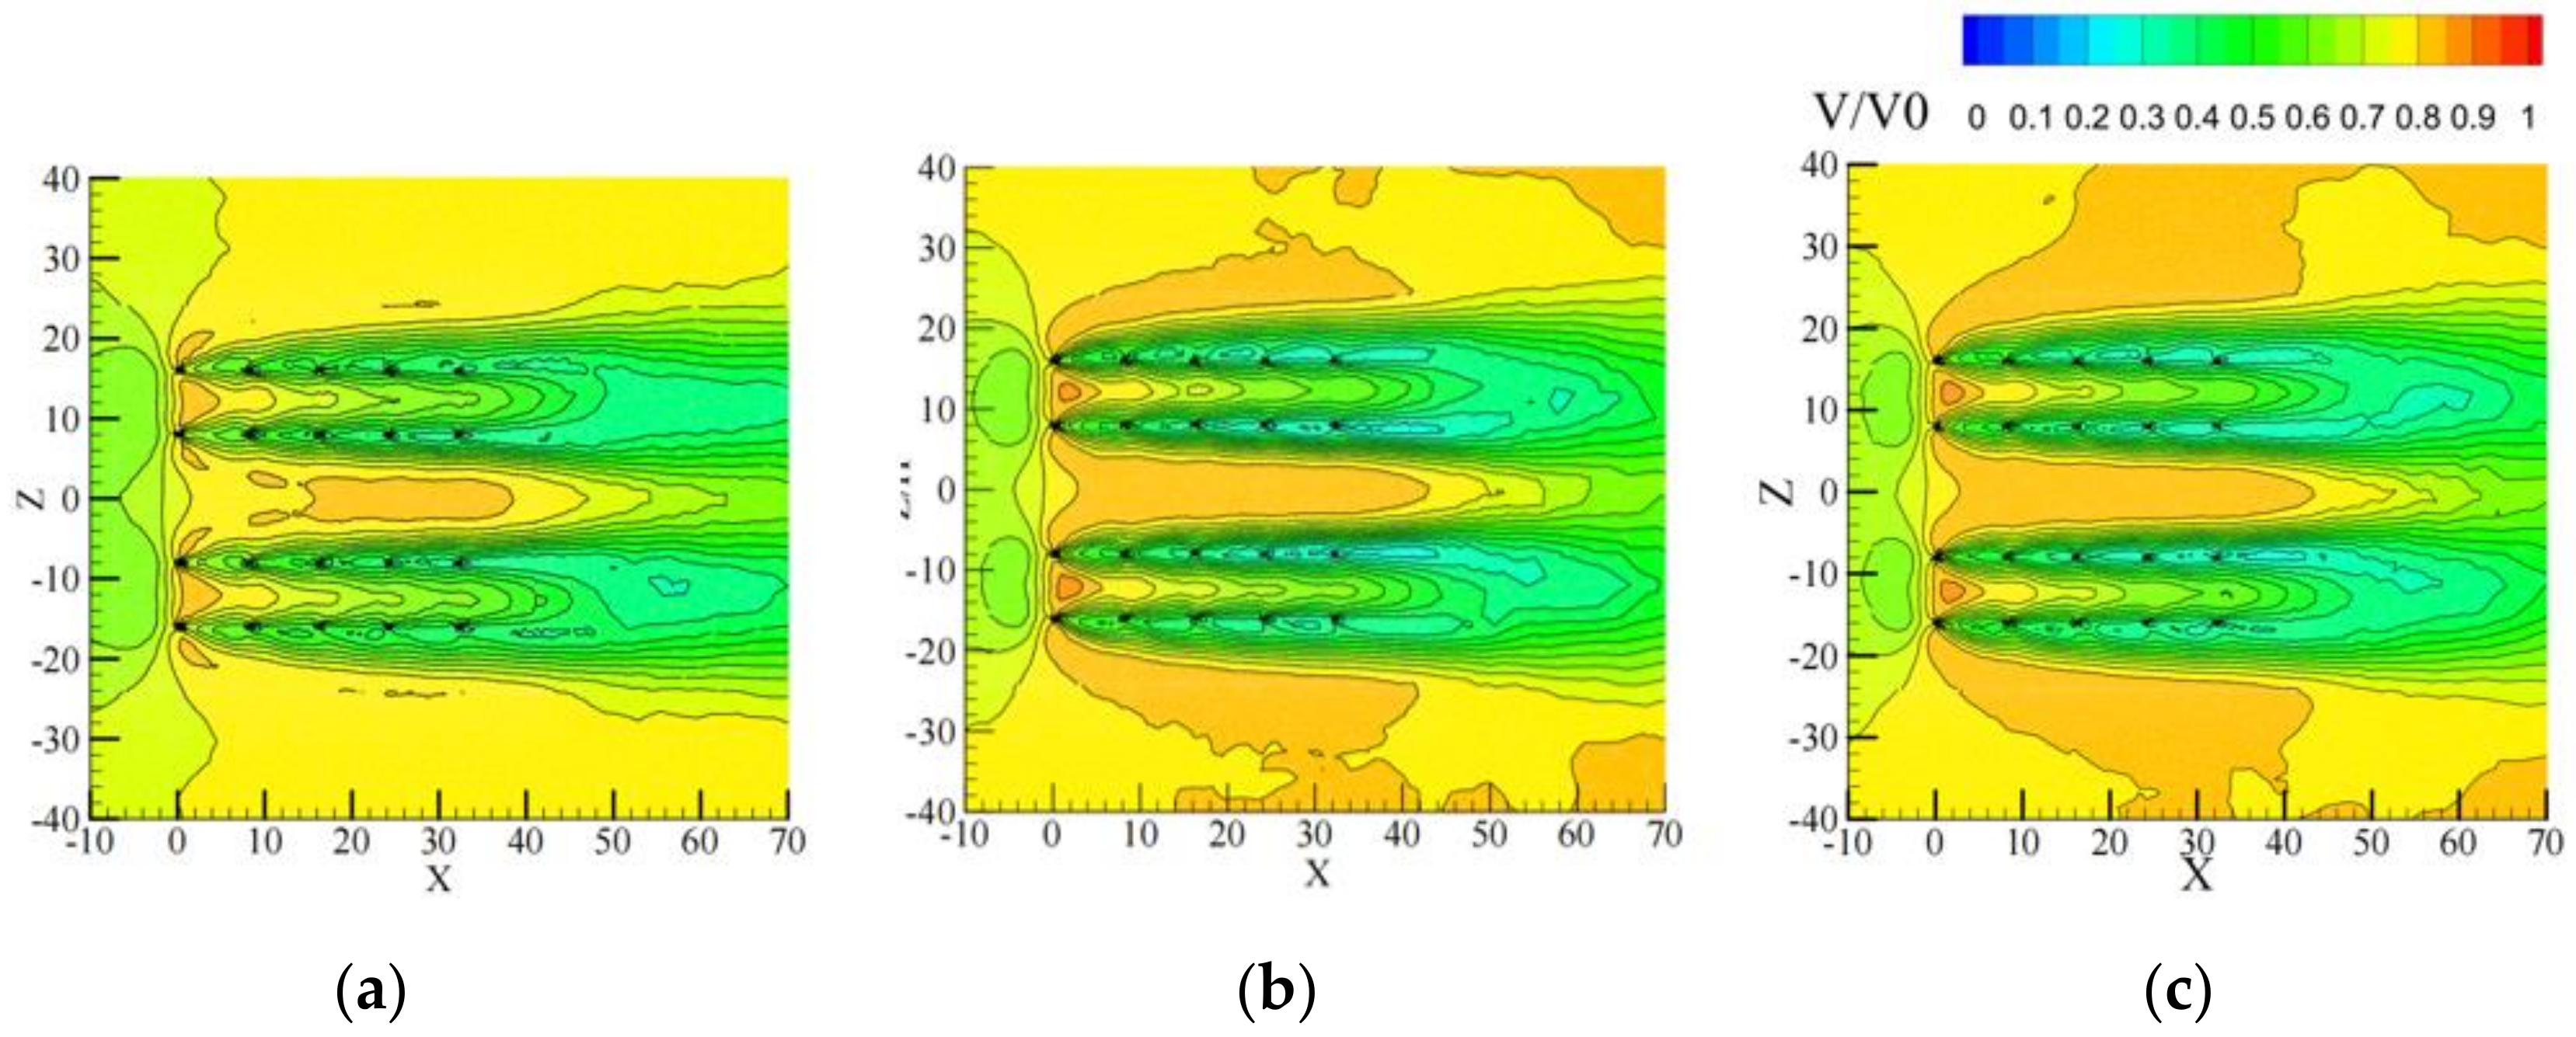
The analysis results from 
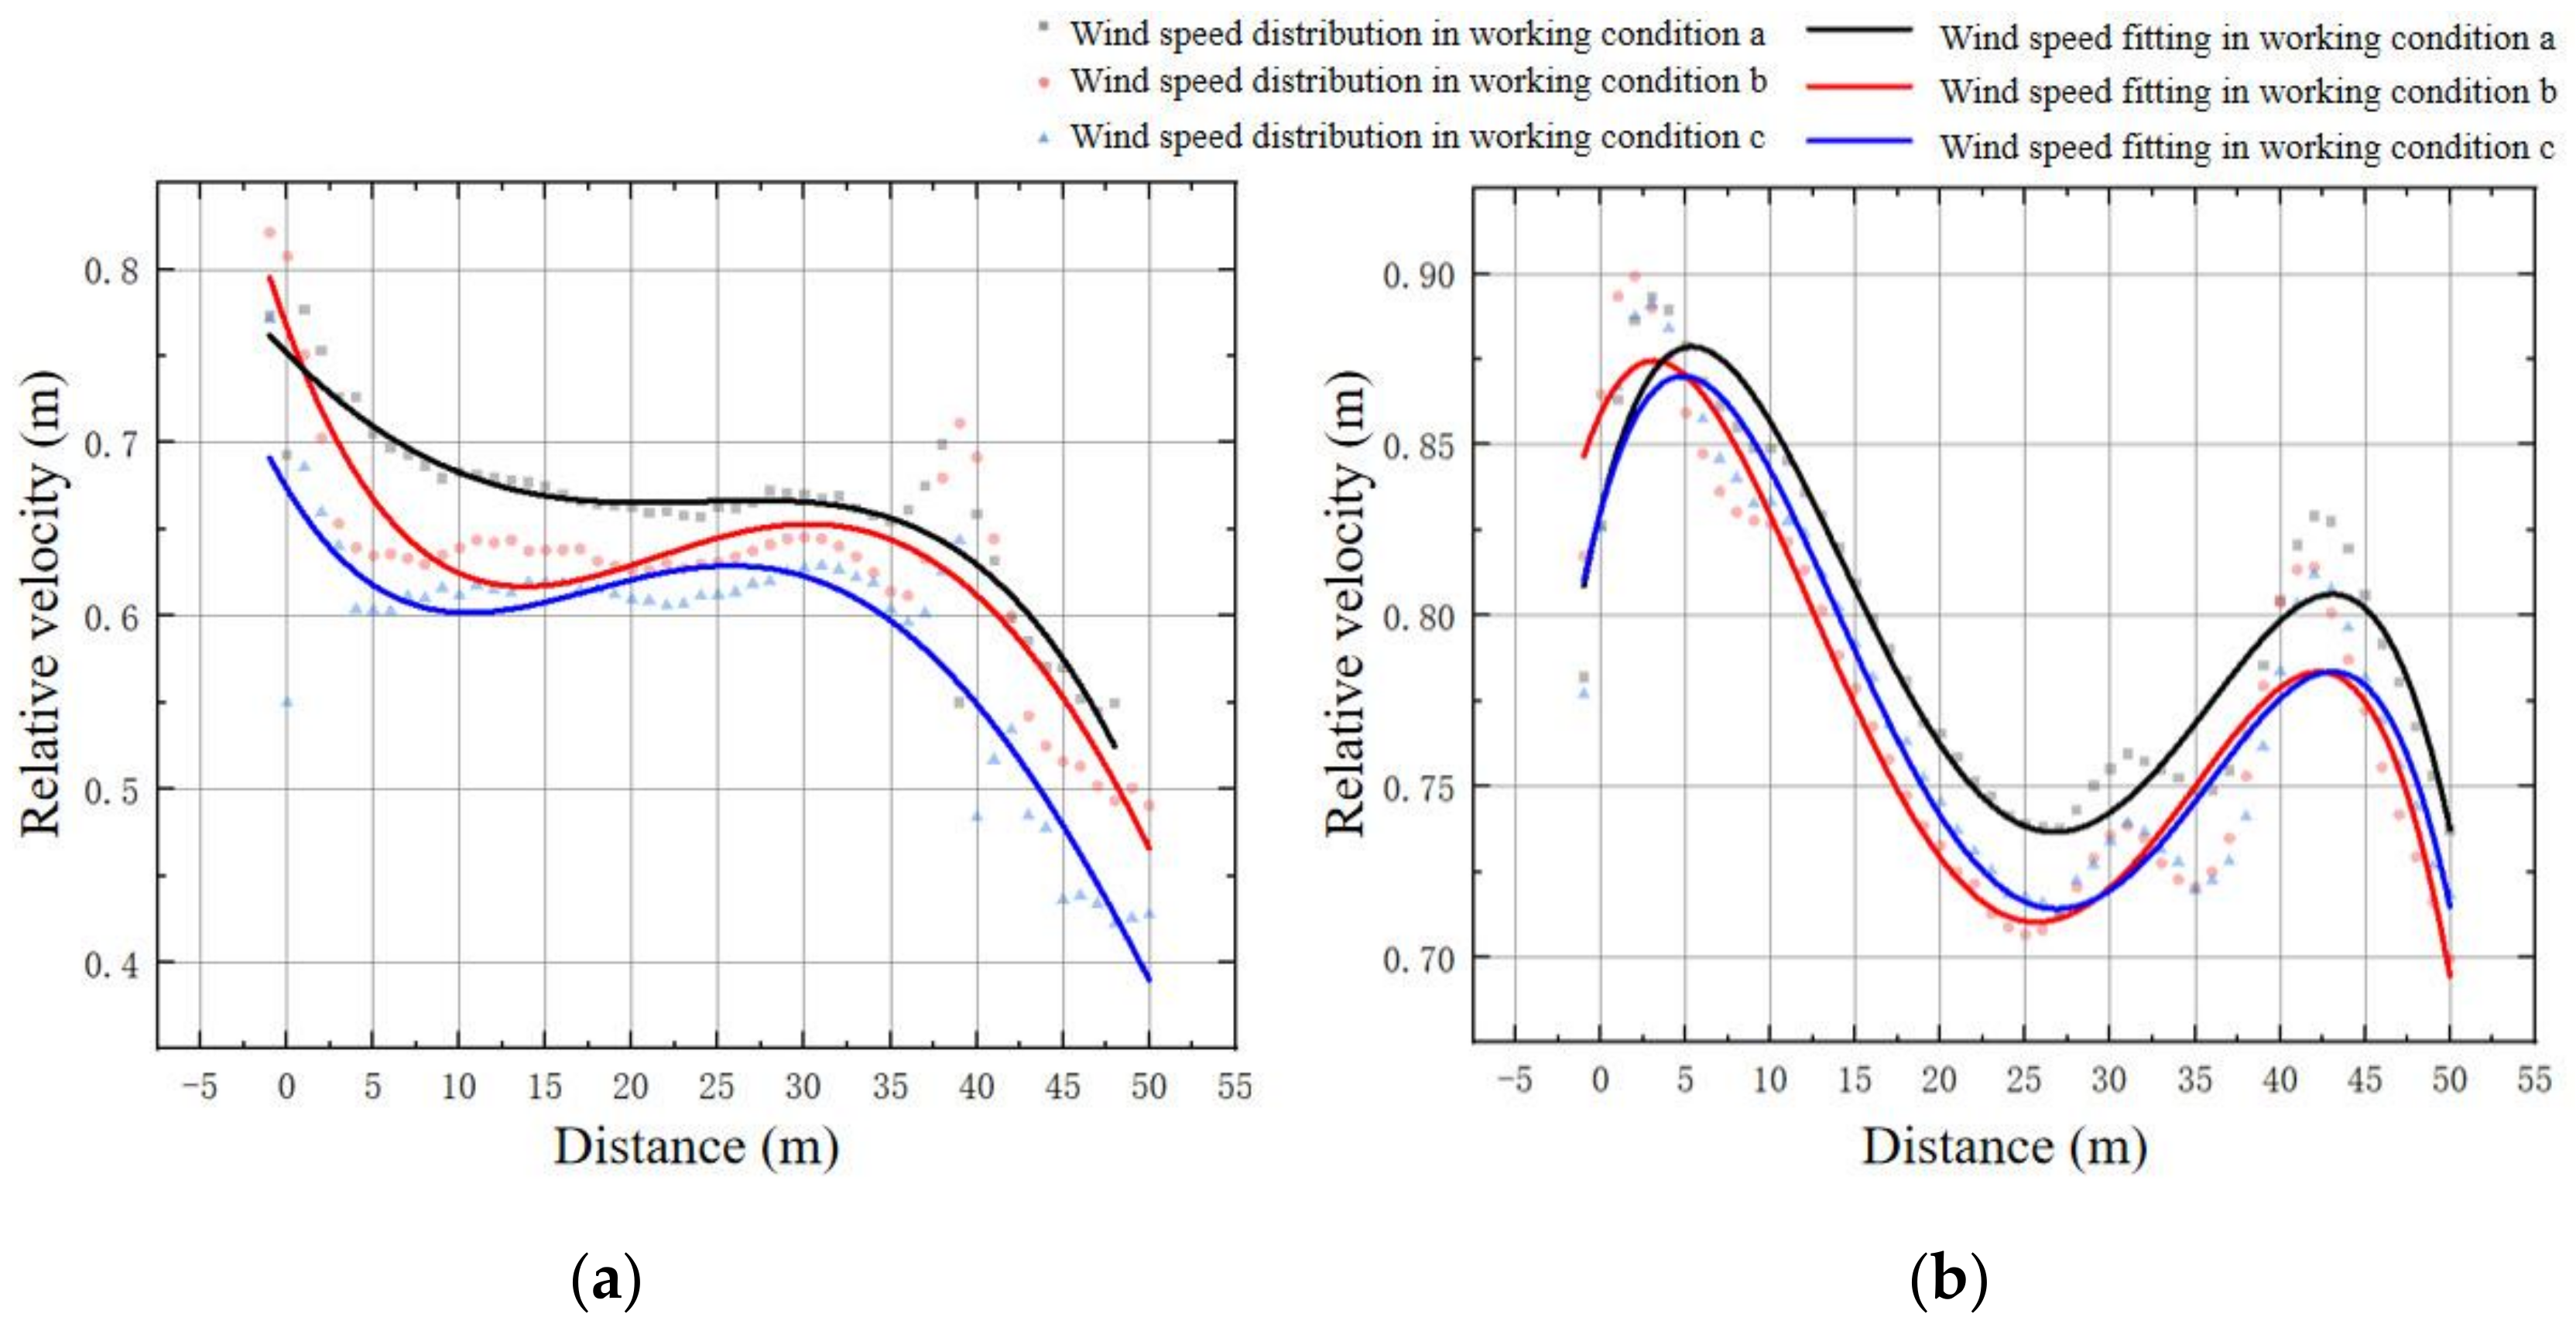
Figure 11 show that in the flow field with a through-type tree array layout, the configuration of trees has an important and significant impact on wind speed distribution. In this specific layout, due to the “channel effect”, the wind speed in the pass-through areas generally exhibits a significant increase. However, within the tree planting areas, the wind speed noticeably decreases due to the natural blocking effect of the trees, with the difference between inflow and outflow wind speeds ranging from 0.5 to 0.65. Under the specific condition a, the primary relative wind speed variation range was observed to be between 0.35 and 0.8. For condition b, this range of relative wind speed variation slightly expanded, from 0.3 to 0.85. In the case of condition c, although the range of relative wind speed variation remained the same; at 0.3 to 0.85, the wind speed reduction effect was more pronounced compared to condition b.
Regarding the wind speed changes in the pass-through area, all three conditions exhibited a pattern of acceleration followed by deceleration, reaching a peak near the position X = 22.5. By analyzing the maximum and minimum relative wind speeds in the pass-through area, it was found that in condition b, both values were lower than in the other two conditions, which can be specifically ordered as follows: condition b < condition a < condition c. This result indicates that condition b demonstrated the most optimal wind speed reduction effect in the pass-through area.
Further analysis of the wind speed distribution within the tree planting area reveals a distinct contrast with the pass-through area’s wind speed distribution (Figure 12). Inside the tree planting area, the wind speed follows a pattern of deceleration followed by acceleration, reaching its minimum value around X = 30. Comparing the wind speed distribution under different conditions, it is observed that conditions a and c show a similar pattern in relative wind speed distribution, while condition b exhibits the highest maximum wind speed value, further indicating that condition b has the weakest wind speed reduction effect in the tree planting area. In contrast, conditions a and c demonstrate more consistency in their performance in this aspect.

4.2.2. Average Airflow Intensity

Comparative analysis of the average airflow intensity at pedestrian breathing height in the through-type tree array resulted in Table 10, which shows that the average airflow intensities for all three conditions are negative. This indicates that, overall, the through-type layout has a significant mitigating effect on the airflow intensity throughout the tree array.
Specifically, condition b has an average airflow intensity of −25.12%, demonstrating the strongest wind speed reduction effect. This might be due to its superior wind speed mitigation in the pass-through area compared to the other two conditions. In contrast, conditions a and c have average airflow intensities of −20.94% and −19.66%, respectively, both of which are similar in overall wind speed reduction but lower than condition b, indicating a relatively weaker effect in reducing wind speed.

4.2.3. Air Reduction Efficiency

Based on the data analysis from Table 11, it is evident that in the case of the through-type layout, the area affected by the channel effect is significantly larger than that of the stationary layout. Combining this with the comparison of wind reduction efficiency data between the two, it can be concluded that in terms of efficiency in reducing wind speed, the through-type layout generally falls short of the stationary layout. Further comparative analysis of the performance in wind speed reduction efficiency among the three different conditions (a, b, c) shows that condition b exhibits the best performance in wind speed mitigation, with an average wind reduction percentage reaching 10.31%. This data indicates that under the through-type layout, condition b achieves the most significant effect in blocking and regulating the wind.
Comparing the performance in wind reduction efficiency between conditions a and c, it is observed that their efficiencies are relatively close, reaching 9.61% and 9.37%, respectively. Both percentages are slightly lower than the efficiency of condition b, indicating that although conditions a and c can achieve a certain effect in reducing wind speed, there is still a gap compared to condition b.

4.3. Enclosed-Type Tree Array Layout

4.3.1. Analysis of Wind Environment Characteristics at Pedestrian Height

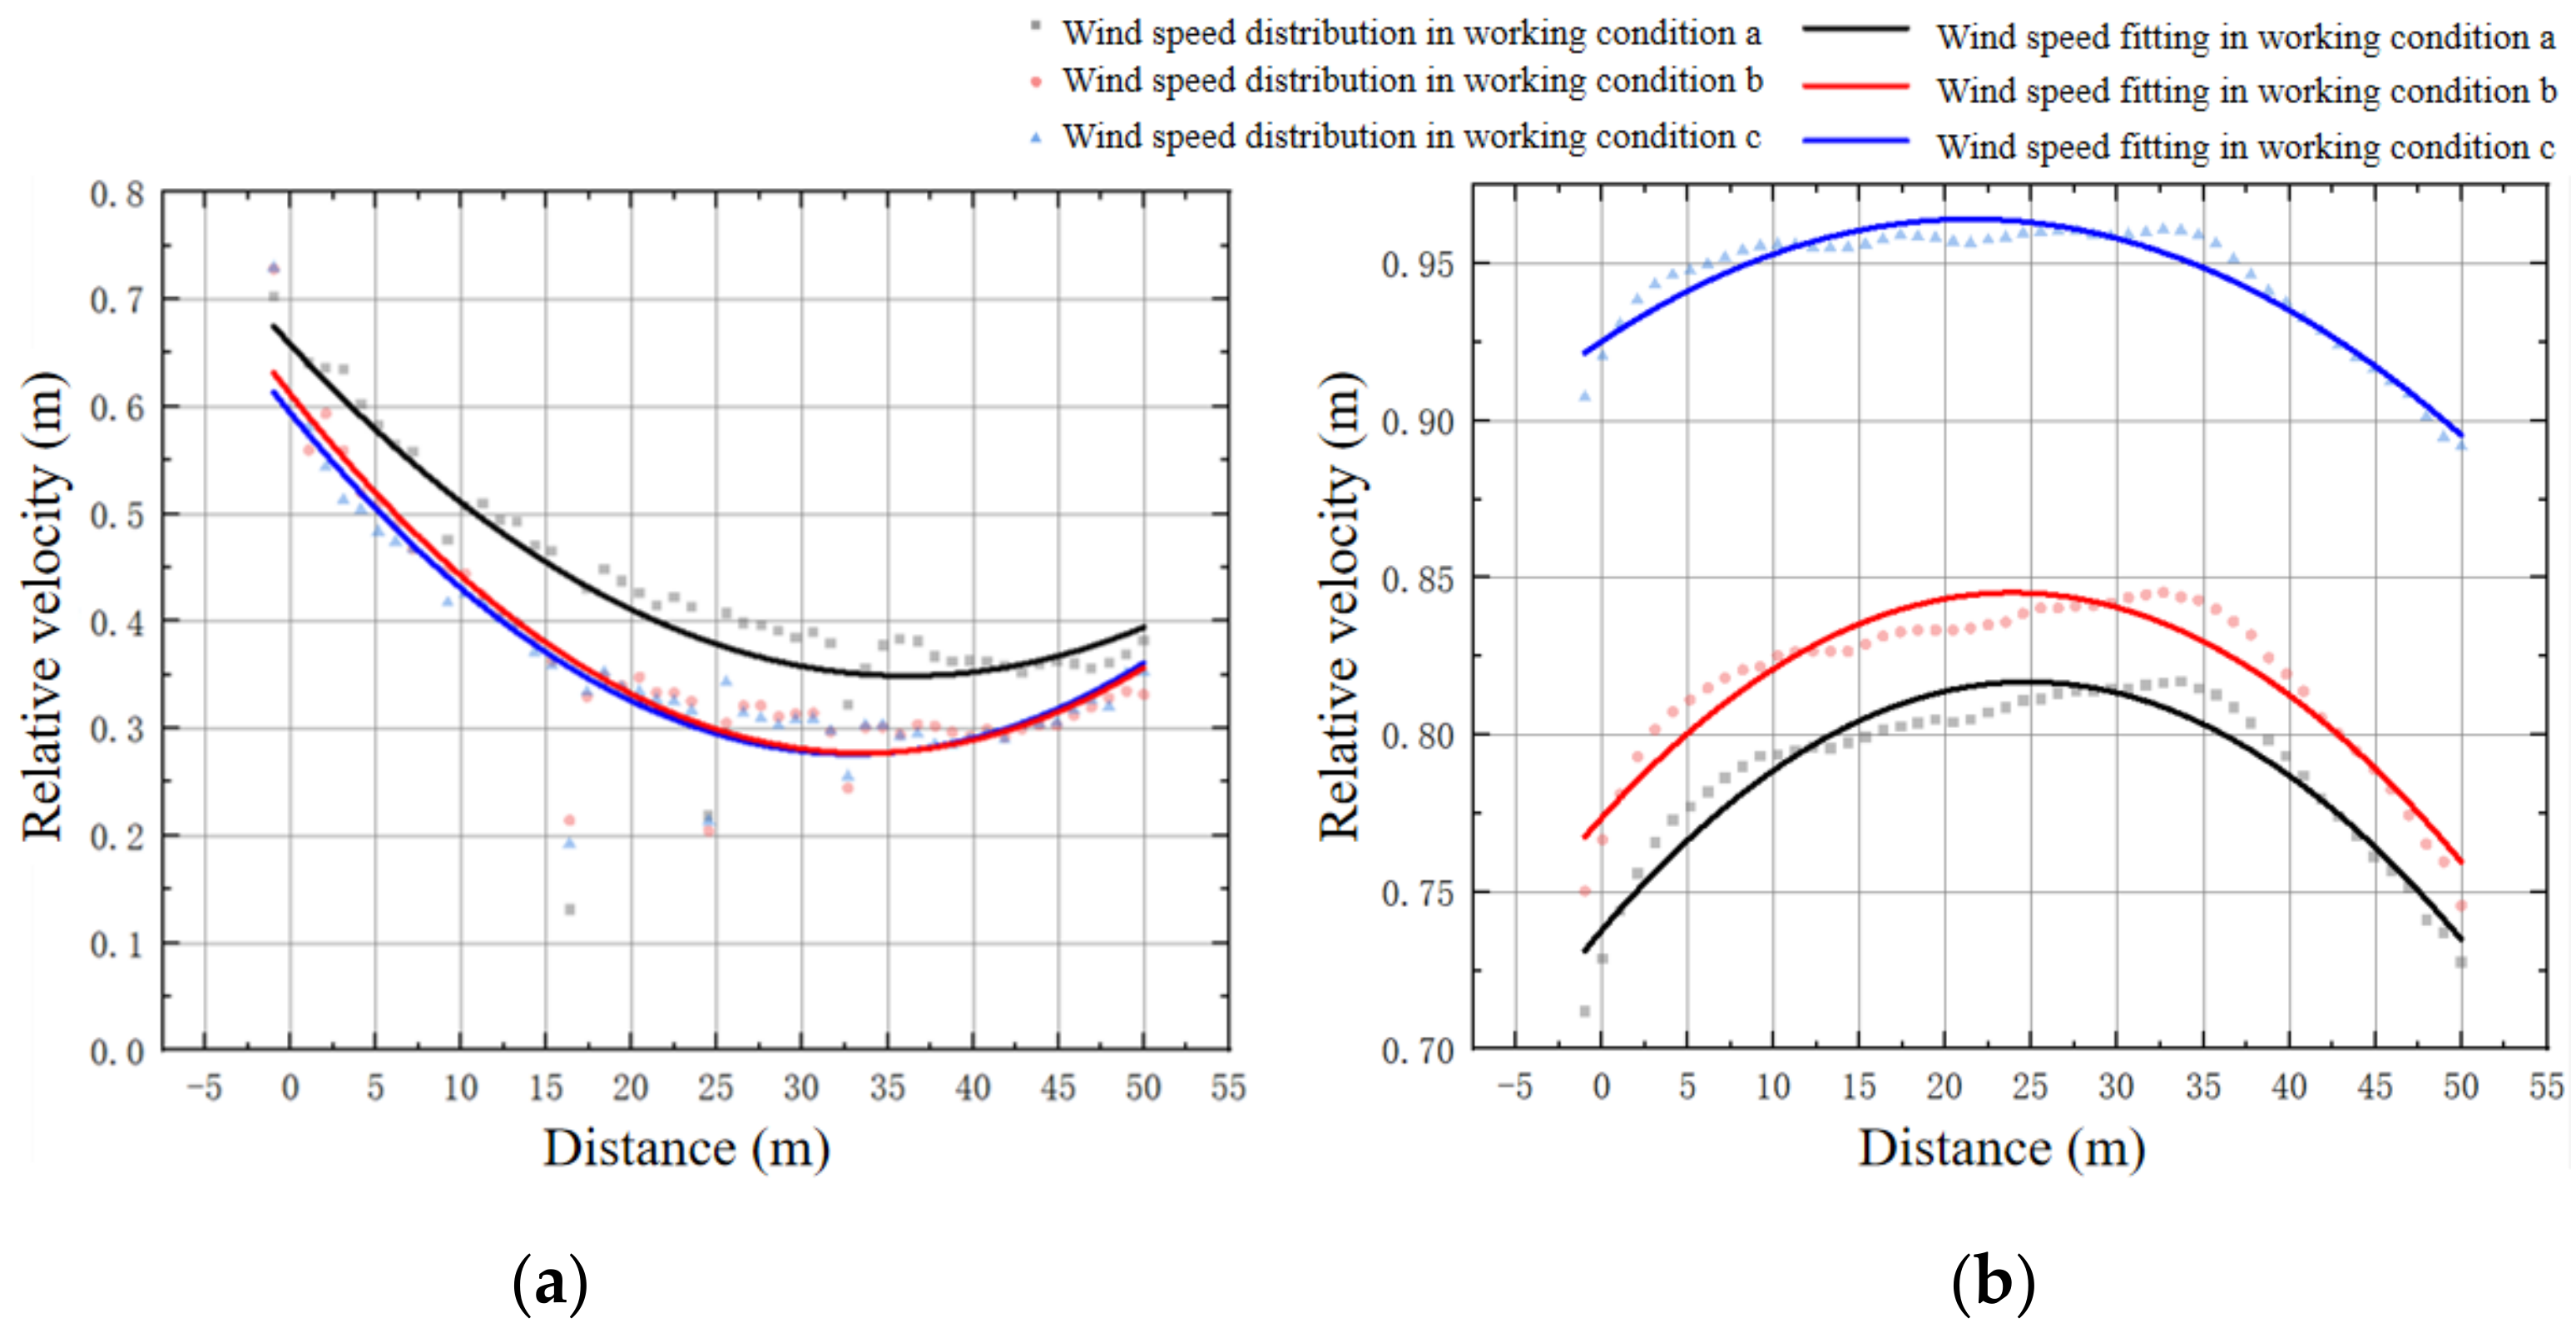
In the enclosed tree array layout, pedestrian usage areas are primarily concentrated within the enclosed space, with the surrounding trees serving mainly for wind-blocking and aesthetic purposes. Therefore, the analysis of this tree array layout focuses more on the flow field distribution in the enclosed area (−10 < Z < 10). According to Figure 13, within the enclosed area, the relative wind speed shows a clear reduction. In the front section of the tree array (0 < X < 10), due to the “channel effect” between trees, there is a certain degree of acceleration, but the trend of wind speed reduction is more pronounced compared to the other two tree layout forms. This is because there are fewer trees at the front end, leading to shorter “channels” and thus no formation of longer acceleration areas. Analyzing the flow field distribution of the three conditions, it is found that under condition a, the relative wind speed is higher compared to the other two conditions, with a wind speed range of 0.9 to 0.65. In contrast, the wind speed ranges for the other two conditions are between 0.85 and 0.6, showing a greater reduction effect on wind speed.
The flow field within the enclosed area is analyzed based on the classification of the flow field in the tree center area (Z = 0) and the tree gap area (Z = 5), as shown in Figure 14. For the wind speed changes in the pass-through area, all three conditions show a continuous weakening trend, with the relative wind speed in the tree center area being lower than in the tree gap area. In the tree center area of the enclosed region, the wind speed reduction is weaker, and the wind speed is more stable, with condition c having the lowest relative wind speed, ranging between 0.6 and 0.64, specifically ranked as condition c < condition a < condition b.
Further analysis of the wind speed distribution in the tree gap area reveals a different pattern from the tree center, with the wind speed in the enclosed area of the tree gap showing a rapid decrease, reaching its minimum value around X = 25 (approximately 0.71). Comparing the wind speed distribution under different conditions, it is observed that conditions a and c maintain a consistent relative wind speed distribution, while condition b has the largest wind speed, indicating that condition b has the weakest wind speed reduction effect in the tree planting area.

4.3.2. Average Airflow Intensity

A comparative analysis of the average airflow intensity data under the enclosed tree array layout (Table 12) shows a consistent trend across the three different conditions, with all average airflow intensities being negative. This indicates that under these conditions, wind speed is generally effectively mitigated. Although these average airflow intensity values fluctuate around −20%, the difference is not significant. However, even such minor variations can have profound implications for pedestrian comfort and overall air quality in the context of urban planning and green space design.
Among the conditions, condition c, with an average airflow intensity of −20.33%, shows the most significant wind speed reduction effect. Condition a has an average airflow intensity of −19.96%, while condition b is at −20.23%, meaning that in terms of wind speed reduction capability, condition c exhibits the best performance, followed by condition b, with condition a being the least effective of the three.

4.3.3. Air Reduction Efficiency

After a detailed analysis of the data presented in Table 13, it is evident that among the three different conditions, condition c exhibits the most significant wind reduction efficiency, reaching 14.09%, marking it as the most effective in mitigating wind speed. In comparison, condition a shows the least impressive performance in wind reduction efficiency, with a difference of 2.92% between them. This finding not only highlights the differential impacts of various conditions on the wind environment but also provides important references for further optimization of wind mitigation measures. Further analysis also reveals the impact of different tree array layouts on wind reduction efficiency. In the enclosed layout, the area affected by the channel effect lies between the stationary and through-type tree array layouts.

5. Conclusions and Outlook

5.1. Conclusions

After a detailed analysis of how different tree species impact the wind environment in stationary, through-type, and enclosed tree array layouts, the following conclusions were reached:
Overall, among the three tree array layouts, the stationary layout is the most effective in controlling wind speed, followed by the enclosed tree array layout. The through-type tree array layout has the weakest wind control due to having the largest area affected by the channel effect.
For the stationary tree array layout, condition c (Camphor tree) exhibited the best wind speed reduction capability, with an average airflow intensity of −25.77% and a wind reduction efficiency of 16.06%. This is followed by the Chinese hackberry, while the performance of the Elm tree is relatively weak. Therefore, in areas with generally high wind speeds, such as riverside (lake) green spaces and between tall buildings, it is recommended to use Camphor trees in the tree array. For areas with lower wind speeds, such as inside parks and courtyards, Elm trees are recommended due to their lesser impact on air circulation.
In the through-type tree array layout, condition b (Chinese hackberry) showed better wind speed reduction performance than the other two conditions, with an average airflow intensity of −25.12% and a wind reduction efficiency of 12.31%. The through-type tree array layout often forms faster wind speeds in pass-through areas due to the channel effect, affecting pedestrian wind comfort. Therefore, this layout strategy requires tree species that can effectively control wind speed, and the Chinese hackberry meets this requirement.
For the enclosed tree array layout, the Camphor tree is again confirmed to be the tree species with the highest wind speed reduction effect, making it the optimal choice for mitigating wind speed in strong wind conditions within the enclosed layout. This condition has an average airflow intensity of −20.33% and a wind reduction efficiency of 14.09%. Enclosed tree array layouts are often used for gatherings, camping, and other activities, also demanding effective wind speed control, making the Camphor tree the optimal choice for this layout.

5.2. Outlook

(1)
This study has limitations regarding wind speed, as different trees have varying tolerance levels to extreme wind speeds due to differences in canopy shape and material elasticity. Research into the maximum wind speeds that different trees can withstand is of significant importance in the field of wind load analysis.
(2)
Although this paper discusses the impact of wind on pedestrian comfort, it does not fully consider how variations in temperature and humidity due to air flow affect pedestrian comfort. These aspects will be addressed in future research.

Author Contributions

Conceptualization, J.Z.; methodology, J.Z. and C.Z.; software, J.Z. and C.Z.; validation, Z.C.; formal analysis, G.Z. and Y.Z.; investigation, X.L.; resources, X.L.; data curation, X.L.; writing—original draft preparation, J.Z. and G.Z.; writing—review and editing, G.Z. and C.Z.; visualization, X.L.; supervision, Z.C.; project administration, J.Z.; funding acquisition, Z.C. All authors have read and agreed to the published version of the manuscript.

Funding

This work is supported by the National Natural Science Foundation of China, grant numbers 52108257.

Data Availability Statement

The data that support the findings of this study are available from the corresponding author upon reasonable request.

Acknowledgments

We are thankful to all our colleagues and co-authors for their very valued contributions to this work. The authors are also very appreciative of the reviewers’ comments, which helped better the manuscript.

Conflicts of Interest

Author Xiaojun Luo and Chicheng Zhou are employed by the China Construction Fifth Engineering Division Co., Ltd. The remaining authors declare that the research was conducted in the absence of any commercial or financial relationships that could be construed as a potential conflict of interest.

References

  1. Zhang, L.; Zhan, Q.; Lan, Y. Effects of the tree distribution and species on outdoor environment conditions in a hot summer and cold winter zone: A case study in Wuhan residential quarters. Build. Environ. 2018, 130, 27. [Google Scholar] [CrossRef]
  2. Zhao, Q.; Zhang, T. Integration of evaluation Methods and Strategies of Urban Outdoor Wind Environment. In Proceedings of the 2015 China Urban Planning Annual Conference, Guiyang, China, 19 September 2015. 15p. [Google Scholar]
  3. Tian, Y.Y.; Zhou, W.; Qian, H. solemnly, Pan Xuelian. Impact of Typhoon Mangosteen on urban green space and biomass in Shenzhen. Sheng Tai Xue Bao 2020, 40, 2589–2598. [Google Scholar]
  4. Zhang, Y. Simulation Study of the Greening Optimization Design of Shenyang Citizen Square Based on the Comfort of Air Environment. Master’s Thesis, Shenyang Jianzhu University, Shenyang, China, 2019. [Google Scholar]
  5. England, A.H.; Baker, C.J.; Saunderson, S.E.T. A dynamic analysis of windthrow of trees. Forestry 2000, 73, 225–238. [Google Scholar] [CrossRef]
  6. Manickathan, L.; Defraeye, T.; Allegrini, J.; Derome, D.; Carmeliet, J. Comparative study of flow field and drag coefficient of model and small natural trees in a wind tunnel. Urban For. Urban Green. 2018, 35, 230–239. [Google Scholar] [CrossRef]
  7. Wu, F.; Li, S.; Liu, X. Temperature and humidity of the forest square, no forest square and lawn and human comfort. Sheng Tai Xue Bao 2007, 27, 2964–2971. [Google Scholar]
  8. Meng, H.; Li, A. Research review on layout mode and greening form based on wind environment. Build. Sci. 2015, 2, 54–59. [Google Scholar]
  9. Yang, W.; Wang, J.; Dong, H.; Wang, L.; Zhang, G.; Lu, Q.; Zhao, A. Two lines of wind speed flow field and wind tunnel effect in the sand forest belt. For. Sci. 2011, 47, 95–102. [Google Scholar]
  10. Dong, H.; Yang, W.; Wang, L.; Lu, Q.; Wang, J.; Liang, H.; Zhao, A. Experiment of wind speed flow field and wind tunnel effect in single belt arbor. Resour. Environ. Arid Areas 2009, 23, 110–116. [Google Scholar]
  11. Lubitz, W.D.; White, B.R. Wind-tunnel and field investigation of the effect of local wind direction on speed-up over hills. J. Wind Eng. Ind. Aerodyn. 2007, 95, 639–661. [Google Scholar] [CrossRef]
  12. Wu, Y. Tree shade and street greening. Yuan Yi Xue Bao 1963, 3, 295–308. [Google Scholar]
  13. William, H.W.; Ye, Q.; Yang, T. The Social Life in Small Urban Space. Shanghai City Plan. 2018, 3, 130–131. [Google Scholar]
  14. Ren, Y.F. Study on Wind Response and Wind Prevention Effect Based on Two-Way Flow-Solid Coupling. Master’s Thesis, Beijing Forestry University, Beijing, China, 2020. [Google Scholar]
  15. James, K.R.; Haritos, N.; Ades, P.K. Mechanical Stability of Tree under Dynamic Loads. Am. J. Bot. 2006, 93, 1522–1530. [Google Scholar] [CrossRef] [PubMed]
  16. Lee, F. Experimental Study on Wind Tunnel of Tree Wind Force. Master’s Thesis, Hunan University, Changsha, China, 2020. [Google Scholar]
  17. Lian, S. Discussion on the cause of wind damage in rubber tree. Re Dai Zuo Wu Xue Bao 1984, 1, 59–72. [Google Scholar]
  18. Schroeder, H.W.; Orland, B. Viewer preference for spatial arrangement of park trees: An application of video-imaging technology. Environ. Manag. 1994, 18, 119–128. [Google Scholar] [CrossRef]
  19. Tang, C.; Zeng, X.; Zhao, H. Overview of tree array landscape and analysis of summer environmental elements in Hangzhou. J. Chin. Urban For. 2018, 17, 1–5. [Google Scholar]
  20. Liu, C. Airflow in the Vicinity of Vegetation and Soil Wind Erosion. Ph.D. Dissertation, Beijing Normal University, Beijing, China, 2017. [Google Scholar]
  21. Henry, Y. Analysis of the Influence of Tree Species Selection and Planting Spacing on the Microclimate in Shady Squares. Master’s Thesis, Shenyang Agricultural University, Shenyang, China, 2018. [Google Scholar]
  22. Li, D. Crown Canopy Porosity Estimation Based on Porous Media Theory and Computer Graphics. Master’s Thesis, Nanjing Forestry University, Nanjing, China, 2022. [Google Scholar]
  23. Hu, X. Numerical Algorithm for a Class of Fluid-Solid Coupling Problem and Physical Simulation of Swaying Trees in Wind Field. Ph.D. Thesis, Zhejiang University, Hangzhou, China, 2008. [Google Scholar]
  24. Loehrmann, J. Wood Handbook: Wood as an Engineering Material. In Agriculture Handbook; United States Department of Agriculture (USA): Washington, DC, USA, 1999; p. 1. [Google Scholar]
  25. Research Institute of Wood Industry, Chinese Academy of Forestry Sciences. Physical and Mechanical Properties of the Major Tree Species in China; China Forestry Press: Beijing, China, 1982. [Google Scholar]
  26. Kenney, W.A. A method for estimating windbreak porosity using digitized photographic silhouettes. Agric. For. Meteorol. 1987, 39, 91–94. [Google Scholar] [CrossRef]
  27. Grant, P.F.; Nickling, W.G. Direct field measurement of wind drag on vegetation for application to windbreak design and modelling. Land Degrad. Dev. 1998, 9, 57–66. [Google Scholar] [CrossRef]
  28. GB/T 50378; 2019 Green Building Evaluation Standard. Ministry of Housing and Urban-Rural Development, PRC: Beijing, China, 2019.
  29. Huang, X. Assessment of Tree Safety under Wind Loads. Master’s Thesis, Nanjing Forestry University, Nanjing, China, 2019. [Google Scholar]
Figure 1. Layout form of the tree array. (a) Retention-type tree array layout; (b) Through-type tree array layout; (c) Enclosed-type tree array layout.
Buildings 14 01409 g001
Figure 2. Different types of tree array layout. (a) Retention-type tree array layout; (b) Through-type tree array layout; (c) Enclosed-type tree array layout.
Buildings 14 01409 g002
Figure 3. Standard wood model. (a) Bow model diagram; (b) Tree canopy size map.
Buildings 14 01409 g003
Figure 4. Calculate domain settings.
Buildings 14 01409 g004
Figure 5. Grid schematic diagram.
Buildings 14 01409 g005
Figure 6. Boundary condition setting.
Buildings 14 01409 g006
Figure 7. Changes of trees under different wind speeds.
Buildings 14 01409 g007
Figure 8. Simulated and experimental comparison of relative wind speeds at different distance profiles after the tree. (a) Comparison of the wind speed after the tree at 1.5 m; (b) Comparison of the wind speed after the tree at 5 m.
Buildings 14 01409 g008
Figure 9. Wind speed distribution at pedestrian breathing height in different tree species. (a) Beech; (b) Soapberry; (c) Camphor.
Buildings 14 01409 g009
Figure 10. Distribution diagram of the wind speed under the three conditions. (a) Wind speed distribution in the central range of the trees Z = 0; (b) wind speed distribution of the tree spacing interval Z = 10.
Buildings 14 01409 g010
Figure 11. Wind speed distribution at the height where pedestrians breathe among various tree species. (a) Beech; (b) Soapberry; (c) Camphor.
Buildings 14 01409 g011
Figure 12. Distribution diagram of the wind speed under the three conditions. (a) Distribution of wind speed in the tree planting interval Z = 10; (b) wind speed distribution in the passage interval Z = 0.
Buildings 14 01409 g012
Figure 13. Wind velocity distribution at the pedestrian breathing level across different types of trees. (a) Beech; (b) Soapberry; (c) Camphor.
Buildings 14 01409 g013
Figure 14. Wind speed diagram of the three conditions. (a) Wind speed distribution map in the central area of the trees Z = 0; (b) wind speed distribution in the interspaced area Z = 5.
Buildings 14 01409 g014
Table 1. Usage of tree array landscape trees in Hangzhou.
Serial NumberSiteTree SpeciesLatin NameArea (m2)
1Wave Culture CityCamphorCinnamomum camphora1570
2Zhejiang People’s Great HallCamphorCinnamomum camphora1280
3Liu Lang Wen Ying ParkWeeping willowSalix babylonica1370
4Tianmu LiQuercus natalesQuercus texana Buckley10,450
5Fengshan ParkSoapberrySapindus mukorossi Gaertn1750
6Taizi Bay ParkCamphorCinnamomum camphora1140
7Wanyue Street Riverside green spaceCamphorCinnamomum camphora2410
8Fred SquareBeechZelkova serrata830
9Hangzhou flower nurseryFragransOsmanthus fragrans1200
10Zijingang Campus of Zhejiang UniversityBeechZelkova serrata900
11Yinlan CenterQuercus natalesQuercus texana Buckley2500
12Hangzhou University of Electronic Science and TechnologyRoystonea regiaRoystonea regia800
13Fengtan Culture SquareFragransOsmanthus fragrans600
14Fengjia River GreenwayCamphorCinnamomum camphora1100
15Alibaba Riverside ParkSoapberrySapindus mukorossi Gaertn2100
16The First Affiliated Hospital of Zhejiang UniversityCamphorCinnamomum camphora600
17Hangzhou Lin’an Campus of Medical CollegeBeechZelkova serrata2145
18Zhejiang A & F University national major buildingSoapberrySapindus mukorossi Gaertn870
Table 2. Standard wood measurement data.
Samples NumberHeight of Tree (m)Clear Length (m)Diameter at Breast Height (cm)Crown Breadth (m)
110.753.16264.19
210.172.91195.04
310.782.83235.82
410.572.97235.07
Average value10.572.96265.03
Standard value10.603.00265.00
Table 3. Standard wood mechanical parameter setting.
Density (kg/m3)The Backbone Elastic Model (MPa)Elasticity Model of Branches (MPa)Poisson Ratio
45012508000.3
Table 4. Parameter settings of flow-solid coupling.
ProjectParameter Setting
Engineering dataCustom linear elastic material
Constraint conditionTransient mechanical analysis
Analytic procedureTransient mechanical analysis
Turbulence modelk-ε turbulence model
Time step0.05 s
Computation time10 s
Table 5. 3D porosity parameters.
Wind SpeedUpper Porosity VP1Middle Porosity VP2Lower Porosity VP3
0 m/s0.8720.9050.864
2 m/s0.8830.9050.867
3 m/s0.8850.9090.873
4 m/s0.8900.9150.877
5 m/s0.8940.9170.878
Table 6. Porosity setting of the three trees.
6 m/s10 m/s14 m/s
BeechUpper porosity0.8980.9160.933
Middle porosity0.9180.9290.940
Lower porosity0.8810.8940.906
SoapberryUpper porosity0.7410.7080.915
Middle porosity0.6370.7280.828
Lower porosity0.7840.8600.961
CamphorUpper porosity0.6160.6450.787
Middle porosity0.6530.7310.809
Lower porosity0.6150.6760.737
Table 7. Tree mechanical parameters setting.
Varieties of TreesDensity (kg/m3)Elastic Model (MPa)Modulus of Shearing (MPa)Poisson Ratio
Beech4501250469.920.33
Soapberry7001450557.690.30
Camphor580950339.290.41
Table 8. Average airflow intensity of airflow at pedestrian breathing height in different tree layout forms D ¯ i (%).
Condition aCondition bCondition c
−20.51%−20.35%−25.77%
Table 9. Wind-lowering efficiency at pedestrian breathing height under different tree layout forms.
Condition aCondition bCondition c
15.13%14.97%16.06%
Table 10. Average airflow intensity at the height of pedestrian breathing amidst various tree arrangement configurations. D ¯ i (%).
Condition aCondition bCondition c
−20.94%−25.12%−19.66%
Table 11. Wind attenuation effectiveness at the height of pedestrian respiration across various tree layout configurations.
Condition aCondition bCondition c
9.61%12.31%9.37%
Table 12. Mean air flow strength at the level of pedestrian respiration within diverse forms of tree layouts. D ¯ i (%).
Condition aCondition bCondition c
−19.96%−20.13%−20.33%
Table 13. Efficiency of wind reduction at the level of pedestrian breathing for different forms of tree arrangements.
Condition aCondition bCondition c
11.17%13.01%14.09%
Disclaimer/Publisher’s Note: The statements, opinions and data contained in all publications are solely those of the individual author(s) and contributor(s) and not of MDPI and/or the editor(s). MDPI and/or the editor(s) disclaim responsibility for any injury to people or property resulting from any ideas, methods, instructions or products referred to in the content.

