Article

Numerical Evaluation of the Punching Shear Strength of Flat Slabs Subjected to Balanced and Unbalanced Moments

by
Roberta Prado Mendes
1,
Leonardo Carvalho Mesquita
1,
Maurício Pina Ferreira
2,
Leandro Mouta Trautwein
3,
Markssuel Teixeira Marvila
1 and
Marília Gonçalves Marques
1,*
1
Civil Engineering Course, Federal University of Viçosa, Campus Rio Paranaiba, km 7, MG 230, Rio Paranaíba 38810000, MG, Brazil
2
Faculty of Civil Engineering Course, Federal University of Para, Street Augusto Corrêa, 001, Belém 66075110, PA, Brazil
3
Architecture and Urban Design, School of Civil Engineering, State University of Campinas, Street Saturnino de Brito, 224, Cidade Universitária Zeferino Vaz, Campinas 13083889, SP, Brazil
*
Author to whom correspondence should be addressed.
Buildings 2024, 14(4), 985; https://doi.org/10.3390/buildings14040985
Submission received: 20 February 2024 / Revised: 20 March 2024 / Accepted: 31 March 2024 / Published: 2 April 2024
(This article belongs to the Section Building Structures)

Abstract

:
In reinforced concrete flat slab buildings, the transference of unbalanced moments in the slab–column connections usually results from the asymmetry of spans, vertical loads, and horizontal forces from the wind. The punching strength of the slab–column connections can limit the load-carrying capacity of the structure in these cases, leading to structural collapse. The design code provisions are still based on empirical or semi-empirical equations; as the punching shear failure mechanisms are complex, and the ultimate strength is affected by several parameters. In this context, this paper presents the results of the computational investigation of the mechanical behaviour of flat slabs subjected to balanced and unbalanced moments using numerical Finite Element models. The numerical models were calibrated and accurately reproduced the behaviour and the punching resistance for concentric and eccentric loading. Furthermore, a parametric study was conducted to evaluate the mechanical behaviour of flat slabs under different load eccentricities, confirming that the increase in the unbalanced moment negatively impacts the load-carrying capacity of the slab–column connection. Furthermore, it was observed that all computational results obtained from models with unbalanced bending moments were higher than those estimated by the design codes.

1. Introduction

In reinforced concrete flat slab buildings, the slab–column connections are often subject to horizontal and vertical forces and unbalanced bending moments. The punching shear failure of slab–column connections subjected to concentric loads is a crucial design aspect, and it has been the subject of study by several authors [1,2,3,4,5,6,7,8,9,10]. The application of eccentric loads, generated by different distances between columns, by unequal loads applied to the slab panel, or by the incidence of horizontal loads on the structures, results in a non-uniform distribution of shear stresses around the column, which can, in many cases, diminish the load-carrying capacity of the slab–column connection.
In the literature, few studies address the punching resistance of flat slabs under eccentric loading. However, most of these studies [6,11,12,13,14] focus on experimental approaches, with only the works of Zivkovic et al. [4] and El-Naqeeb and Abdelwahed [15] providing a numerical assessment of this phenomenon. Zivkovic et al. [4] investigated the influence of eccentric loads and openings close to the columns on the punching resistance of plain and reinforced concrete flat slabs. The analyses showed that the punching resistance estimated computationally was significantly higher for all the slabs analysed than the value obtained using Eurocode 2 [16]. El-Naqeeb and Abdelwahed [15] conducted numerical research to investigate the behaviour of thick flat footings subjected to concentric and eccentric loads, with and without shear reinforcement. They found that increasing the eccentricity of the load significantly reduced the punching shear resistance of footings, with or without shear reinforcement, while enhancing the footings’ deformation capacity. In all studies, it is difficult to understand the interaction between the punching shear failure mechanisms and the internal forces associated with the eccentric loading (bending moment, torsional moment, and shear force).
This gap in research, coupled with uncertainties about the punching shear strength of flat slabs with different geometric parameters, boundary conditions, and load types, directly impacts the methodologies prescribed by design codes. In this context, ACI 318 [17], Eurocode 2 [16], and the Brazilian code [18] present discrepancies in the design of flat slabs subjected to unbalanced bending moments. Therefore, the mechanical behaviour of flat slabs under eccentric loads is not yet fully understood. Additional research is needed to improve understanding of this phenomenon and develop design approaches that lead to more accurate and reliable assessments.
These assessments can be made through experimental tests or computational analyses. In general, experimental tests require sophisticated equipment and specialised labour, making this approach economically costly. Furthermore, the responses obtained from experimental tests are limited to specific points of the model. As demonstrated by several authors [19,20,21,22], the F.E.M. can simulate the behaviour and estimate the strength of different types of reinforced concrete structures quickly and economically.
In this context, this paper aims to computationally analyse the mechanical behaviour of flat slabs subjected to concentric and eccentric loads, using numerical Finite Element (F.E.) models validated considering experimental results presented by Ferreira et al. [12]. The specific objectives are as follows: (i) explore the effect of unbalanced moments in reinforced concrete flat slabs; (ii) compare the punching resistance estimated numerically with the values provided by current design codes; and (iii) evaluate the distribution of cracks, vertical displacements, and strains in failure scenarios.

2. Experimental Test

The F.E. models developed in this work were validated using the experimental results presented by Ferreira et al. [12]. These models were created and analysed considering the geometric, material, and loading characteristics of slabs LS05 and LS06 tested by these authors.
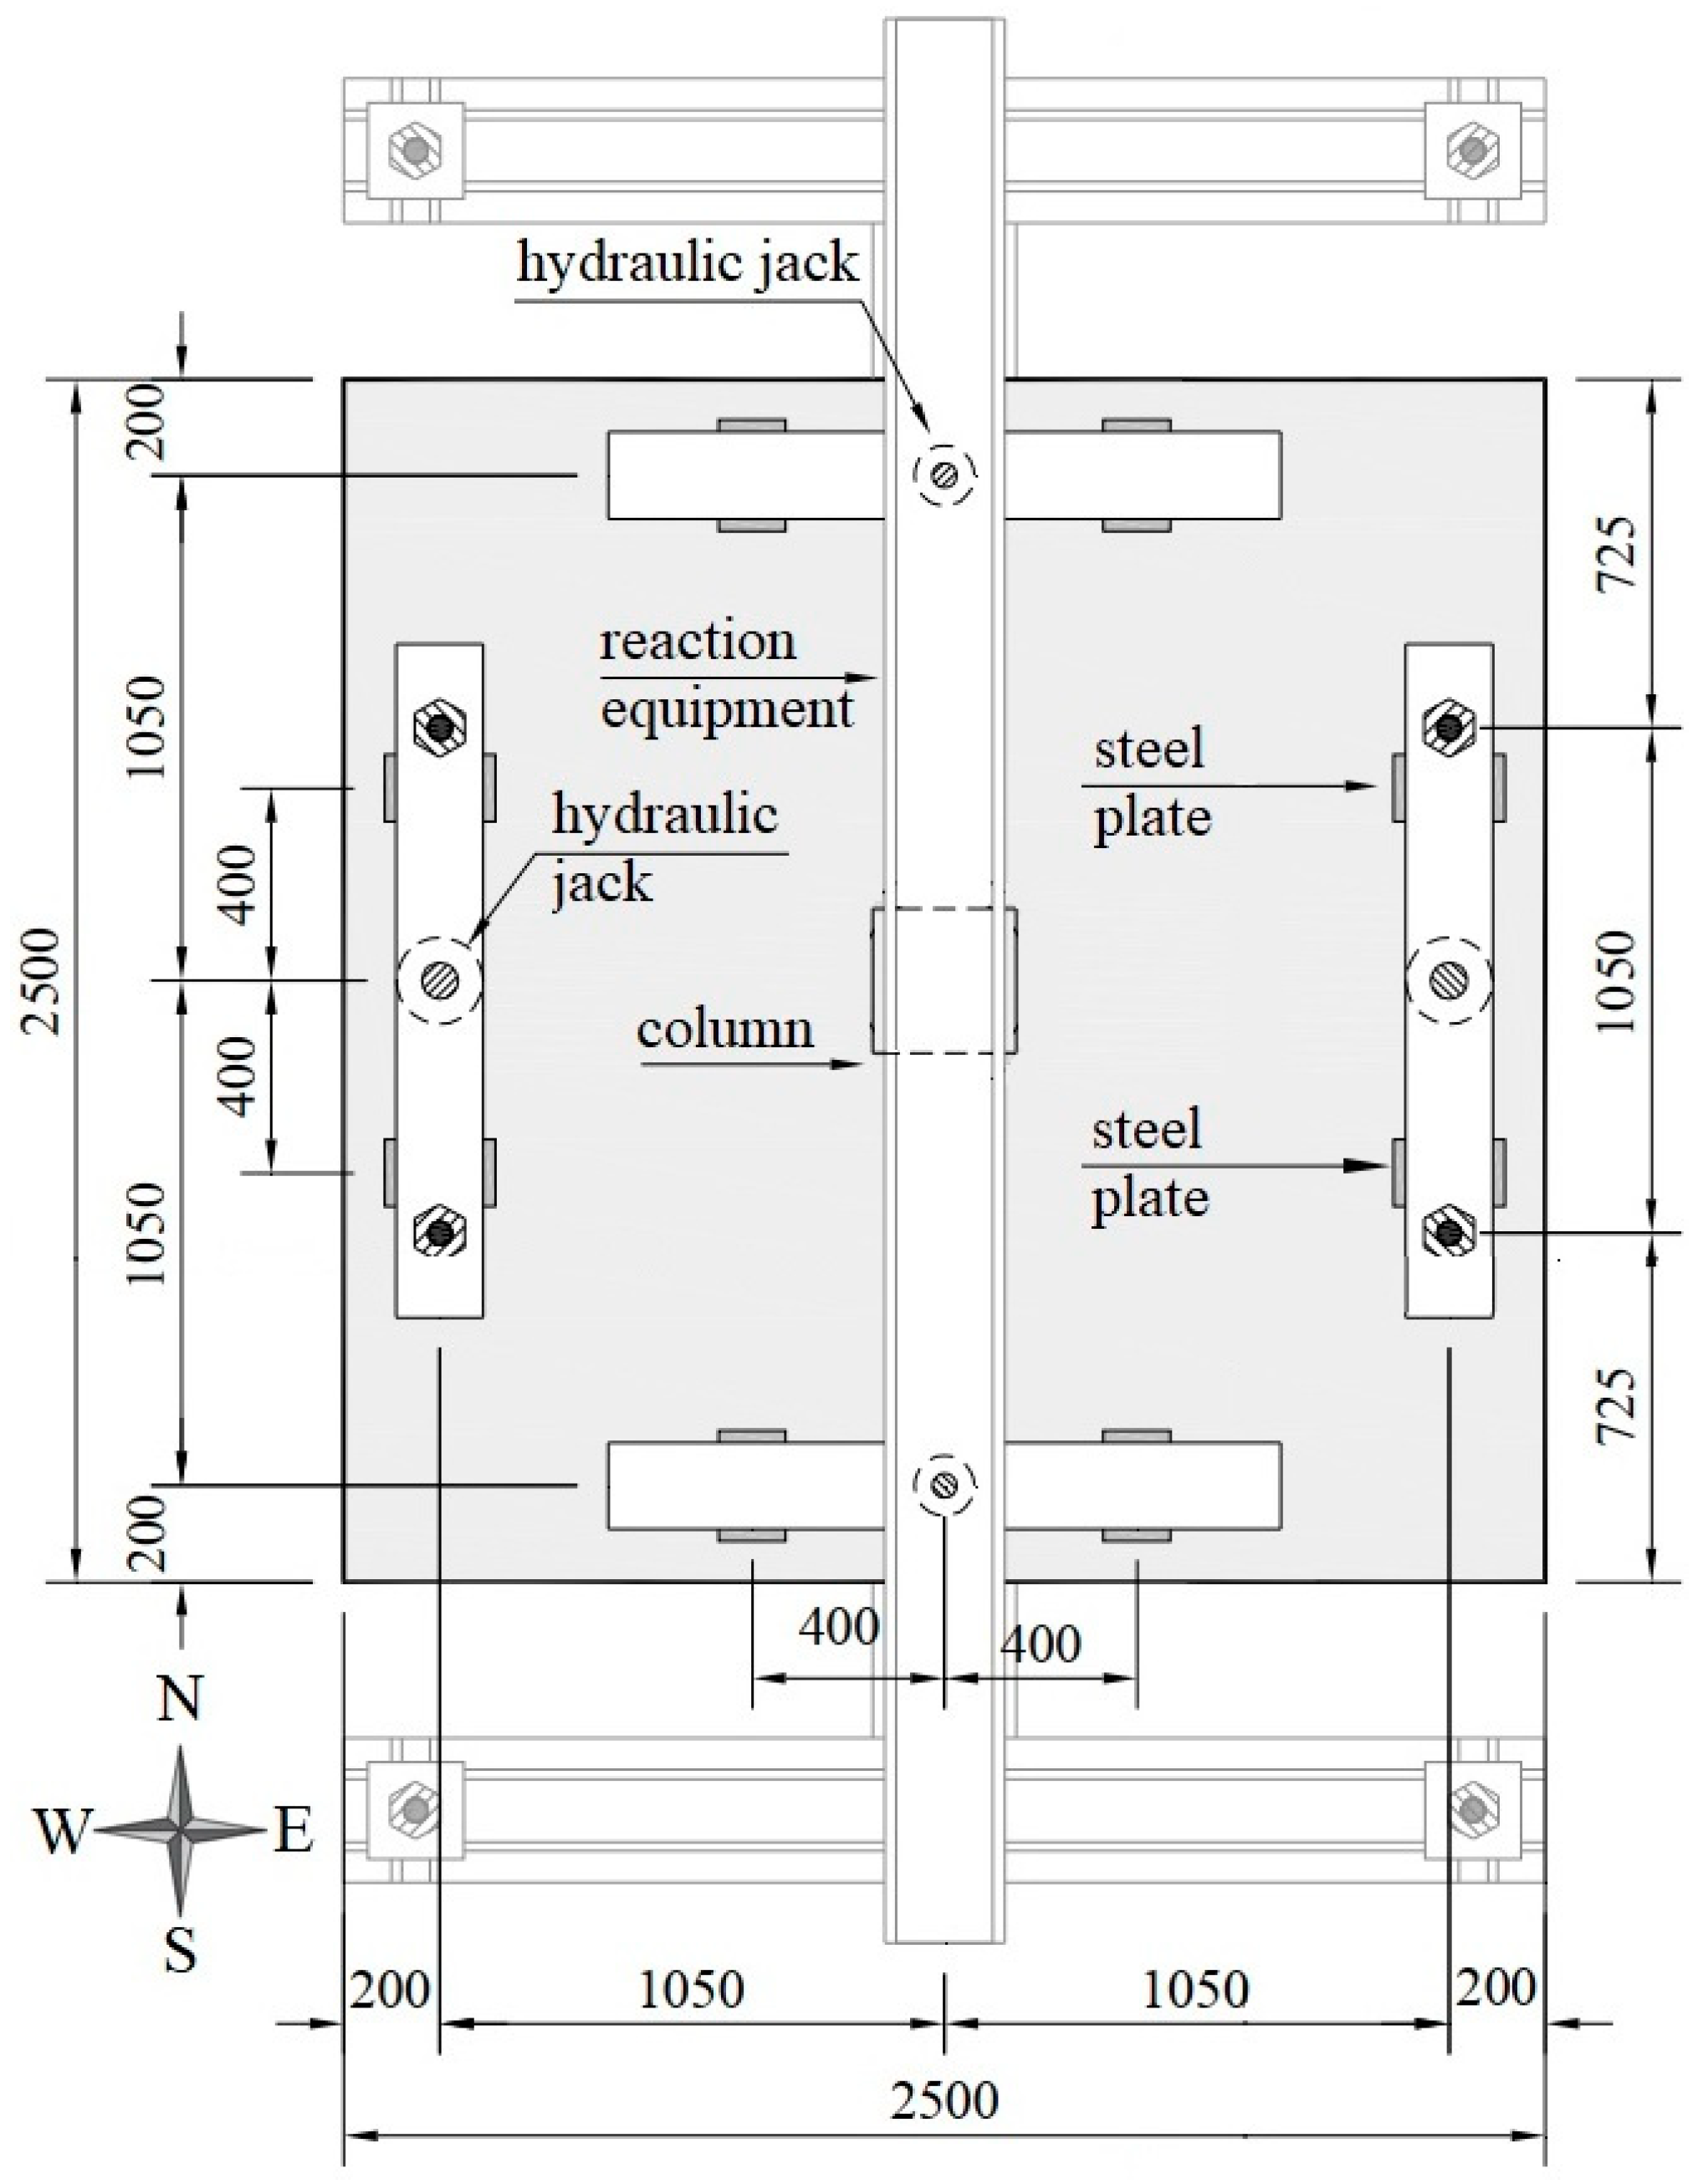
The two flat slabs have identical geometric dimensions, measuring 2.500 mm by 2.500 mm with a thickness of 180 mm, and are supported by a square column with a side length of 300 mm, as shown in Figure 1. The distinction between the two slabs lies in their load application: LS05 is subjected to concentric loading, while LS06 is subjected to eccentric loading with the transference of unbalanced moments, as in real situations. In slab LS06, 0.25 P was applied on each edge of the east–west section. In contrast, the north–south section was subjected to varying load magnitudes: the north side received an increase in +∆P, while the south side had a decrease in −∆P, where ∆P = 0.15 P. Figure 2 presents the test system used by Ferreira et al. [12].
The concrete compressive strength was 50.5 MPa and 50.1 MPa for slabs LS05 and LS06, respectively. In both cases, the flexural reinforcement was composed of 16 mm bars with fy = 540 MPa, having a flexural reinforcement ratio of 1.58%.

3. Numerical Models

The F.E. models presented in this study were developed using the GiD software version 16 [23] and analysed using the A.T.E.N.A. software version 5.9.1 [24].

3.1. Geometrics Parameters

To reduce the CPU time of the structural analysis, the F.E. models representing the LS05 and LS06 flat slabs were developed considering the existing symmetry planes. Thus, in the case of the LS05 slab, where there are eight equal load application points, the computational model was developed considering the symmetries in the north–south and east–west directions (Figure 1). For the LS06 slab, given its asymmetric loading, a model was created with symmetry in the north–south direction. To validate this modelling approach for the LS06 slab, a complete model was also developed without accounting for symmetry planes.

3.2. Boundary Conditions and Reference Points

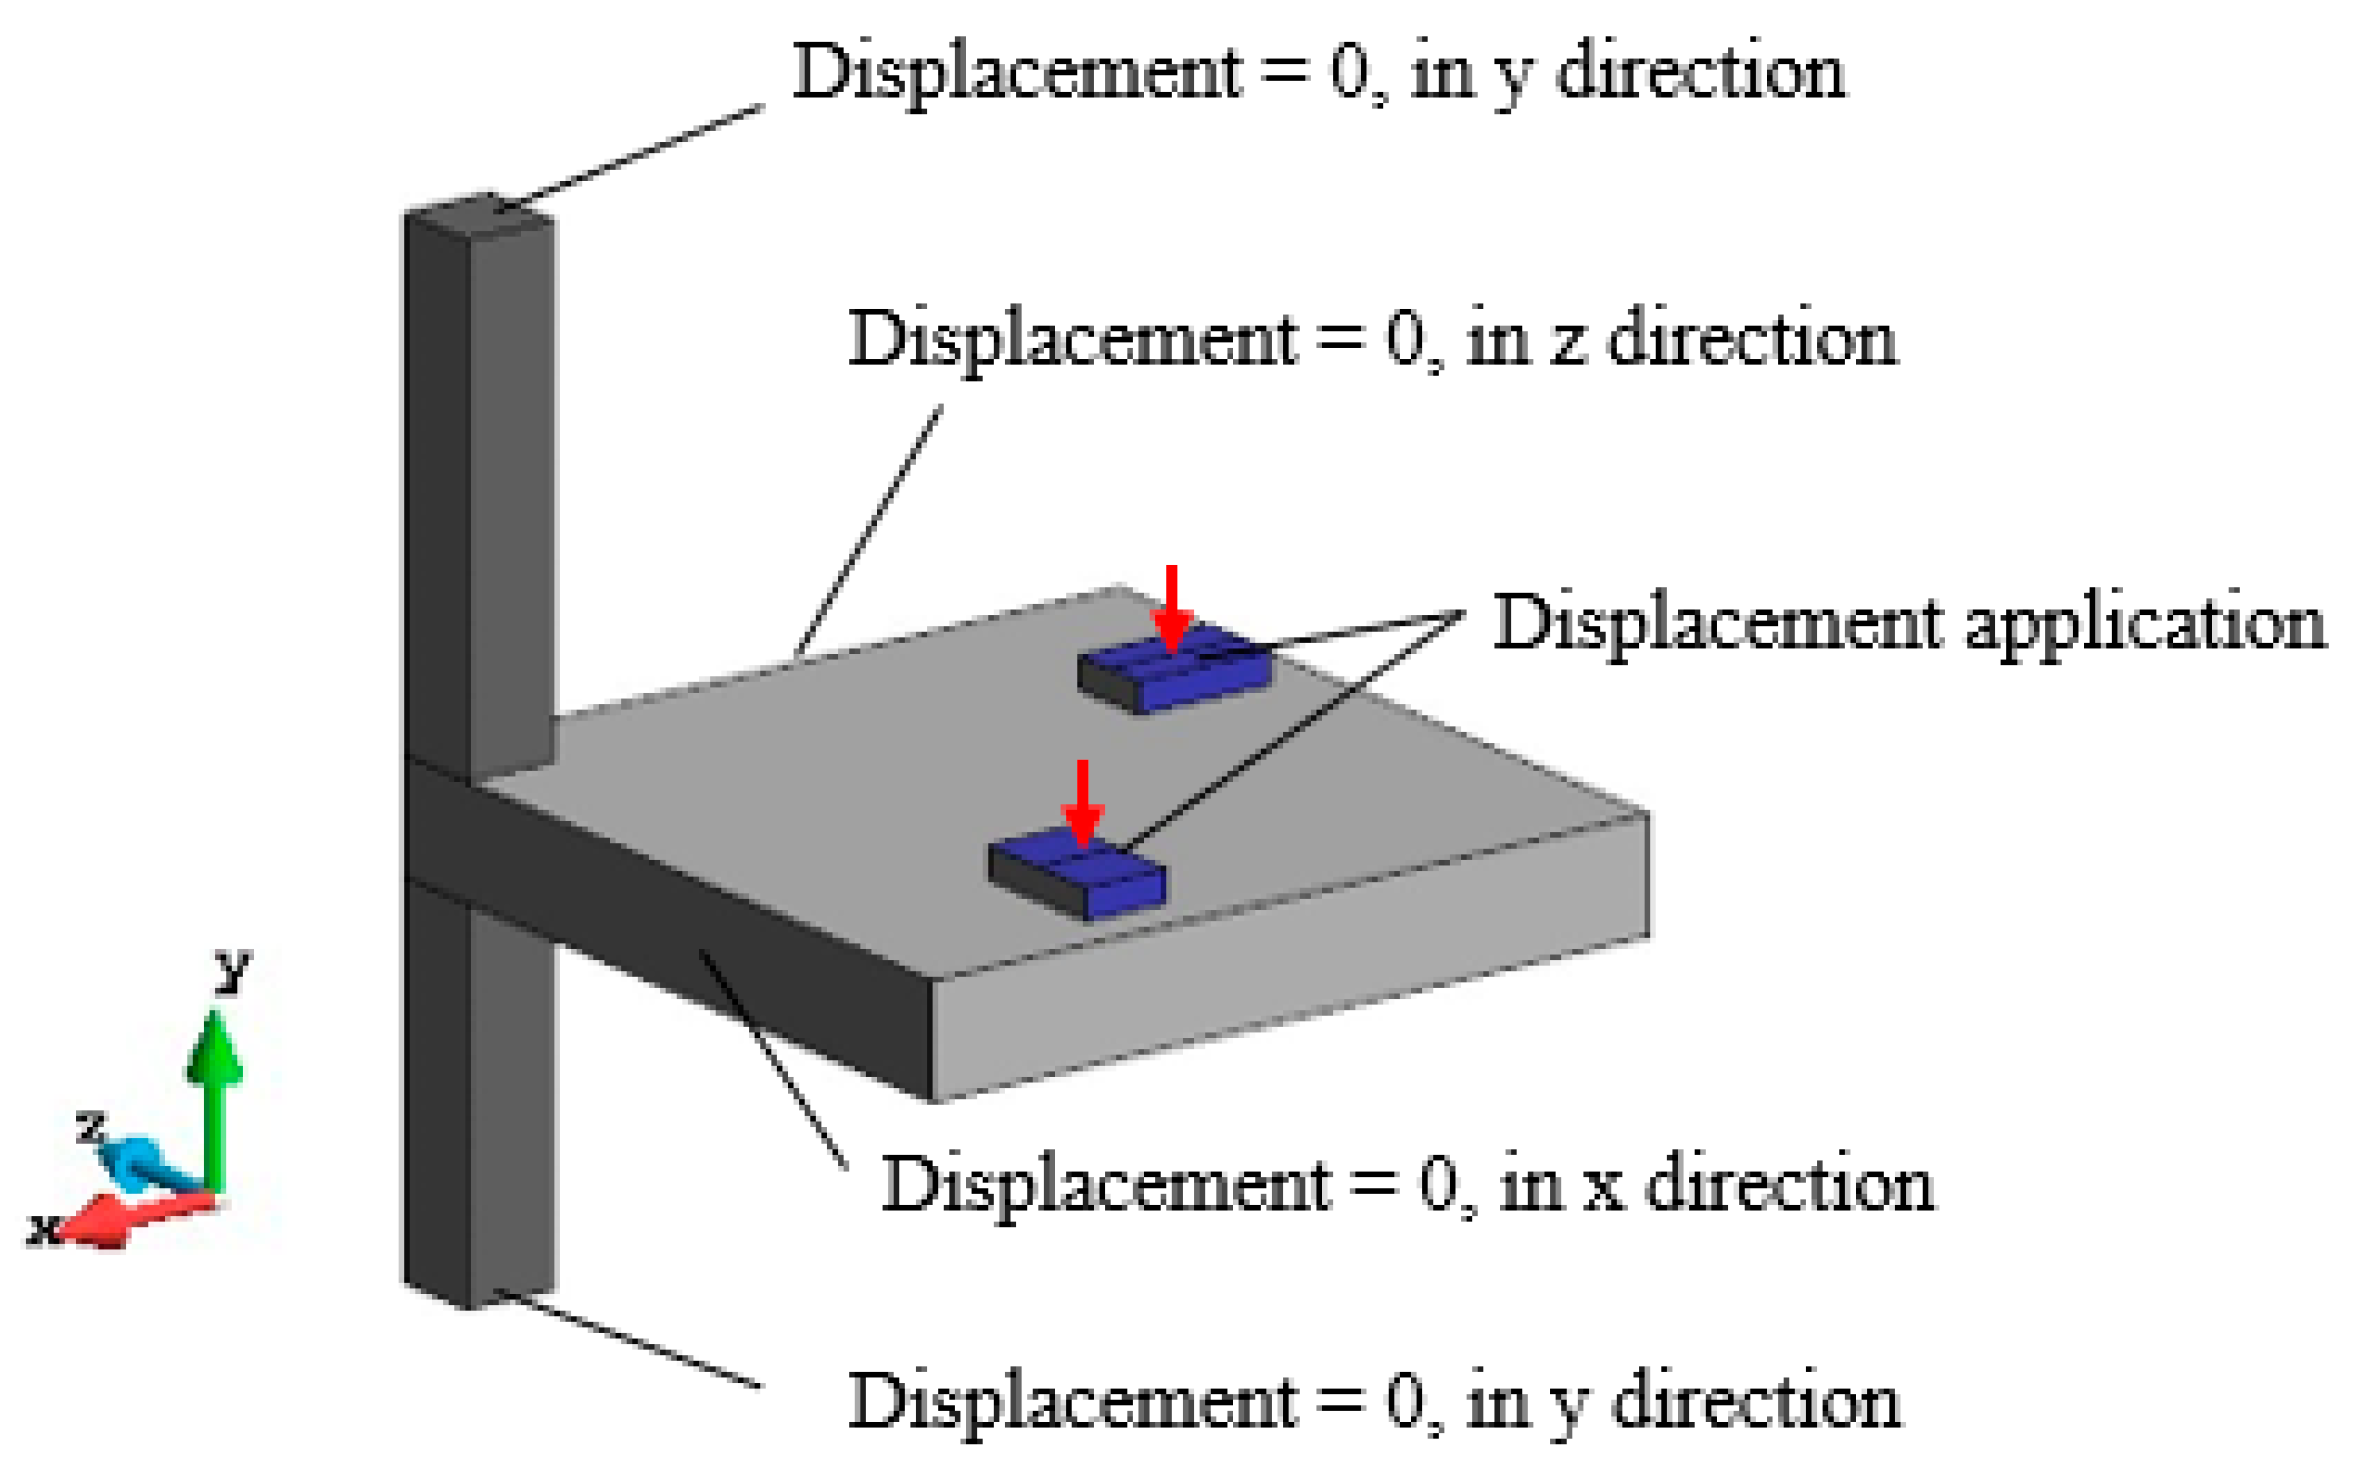
In order to adequately simulate the experimental tests, the boundary conditions shown in Figure 3 were adopted. To simulate the continuity of the slab, horizontal displacements were restricted on the faces aligned with the symmetry planes: north–south and east–west for the LS05 model and north–south for the LS06 model. Associated with this, in all models, the vertical displacements at the column ends were restricted to simulate the setup used in the experimental tests.
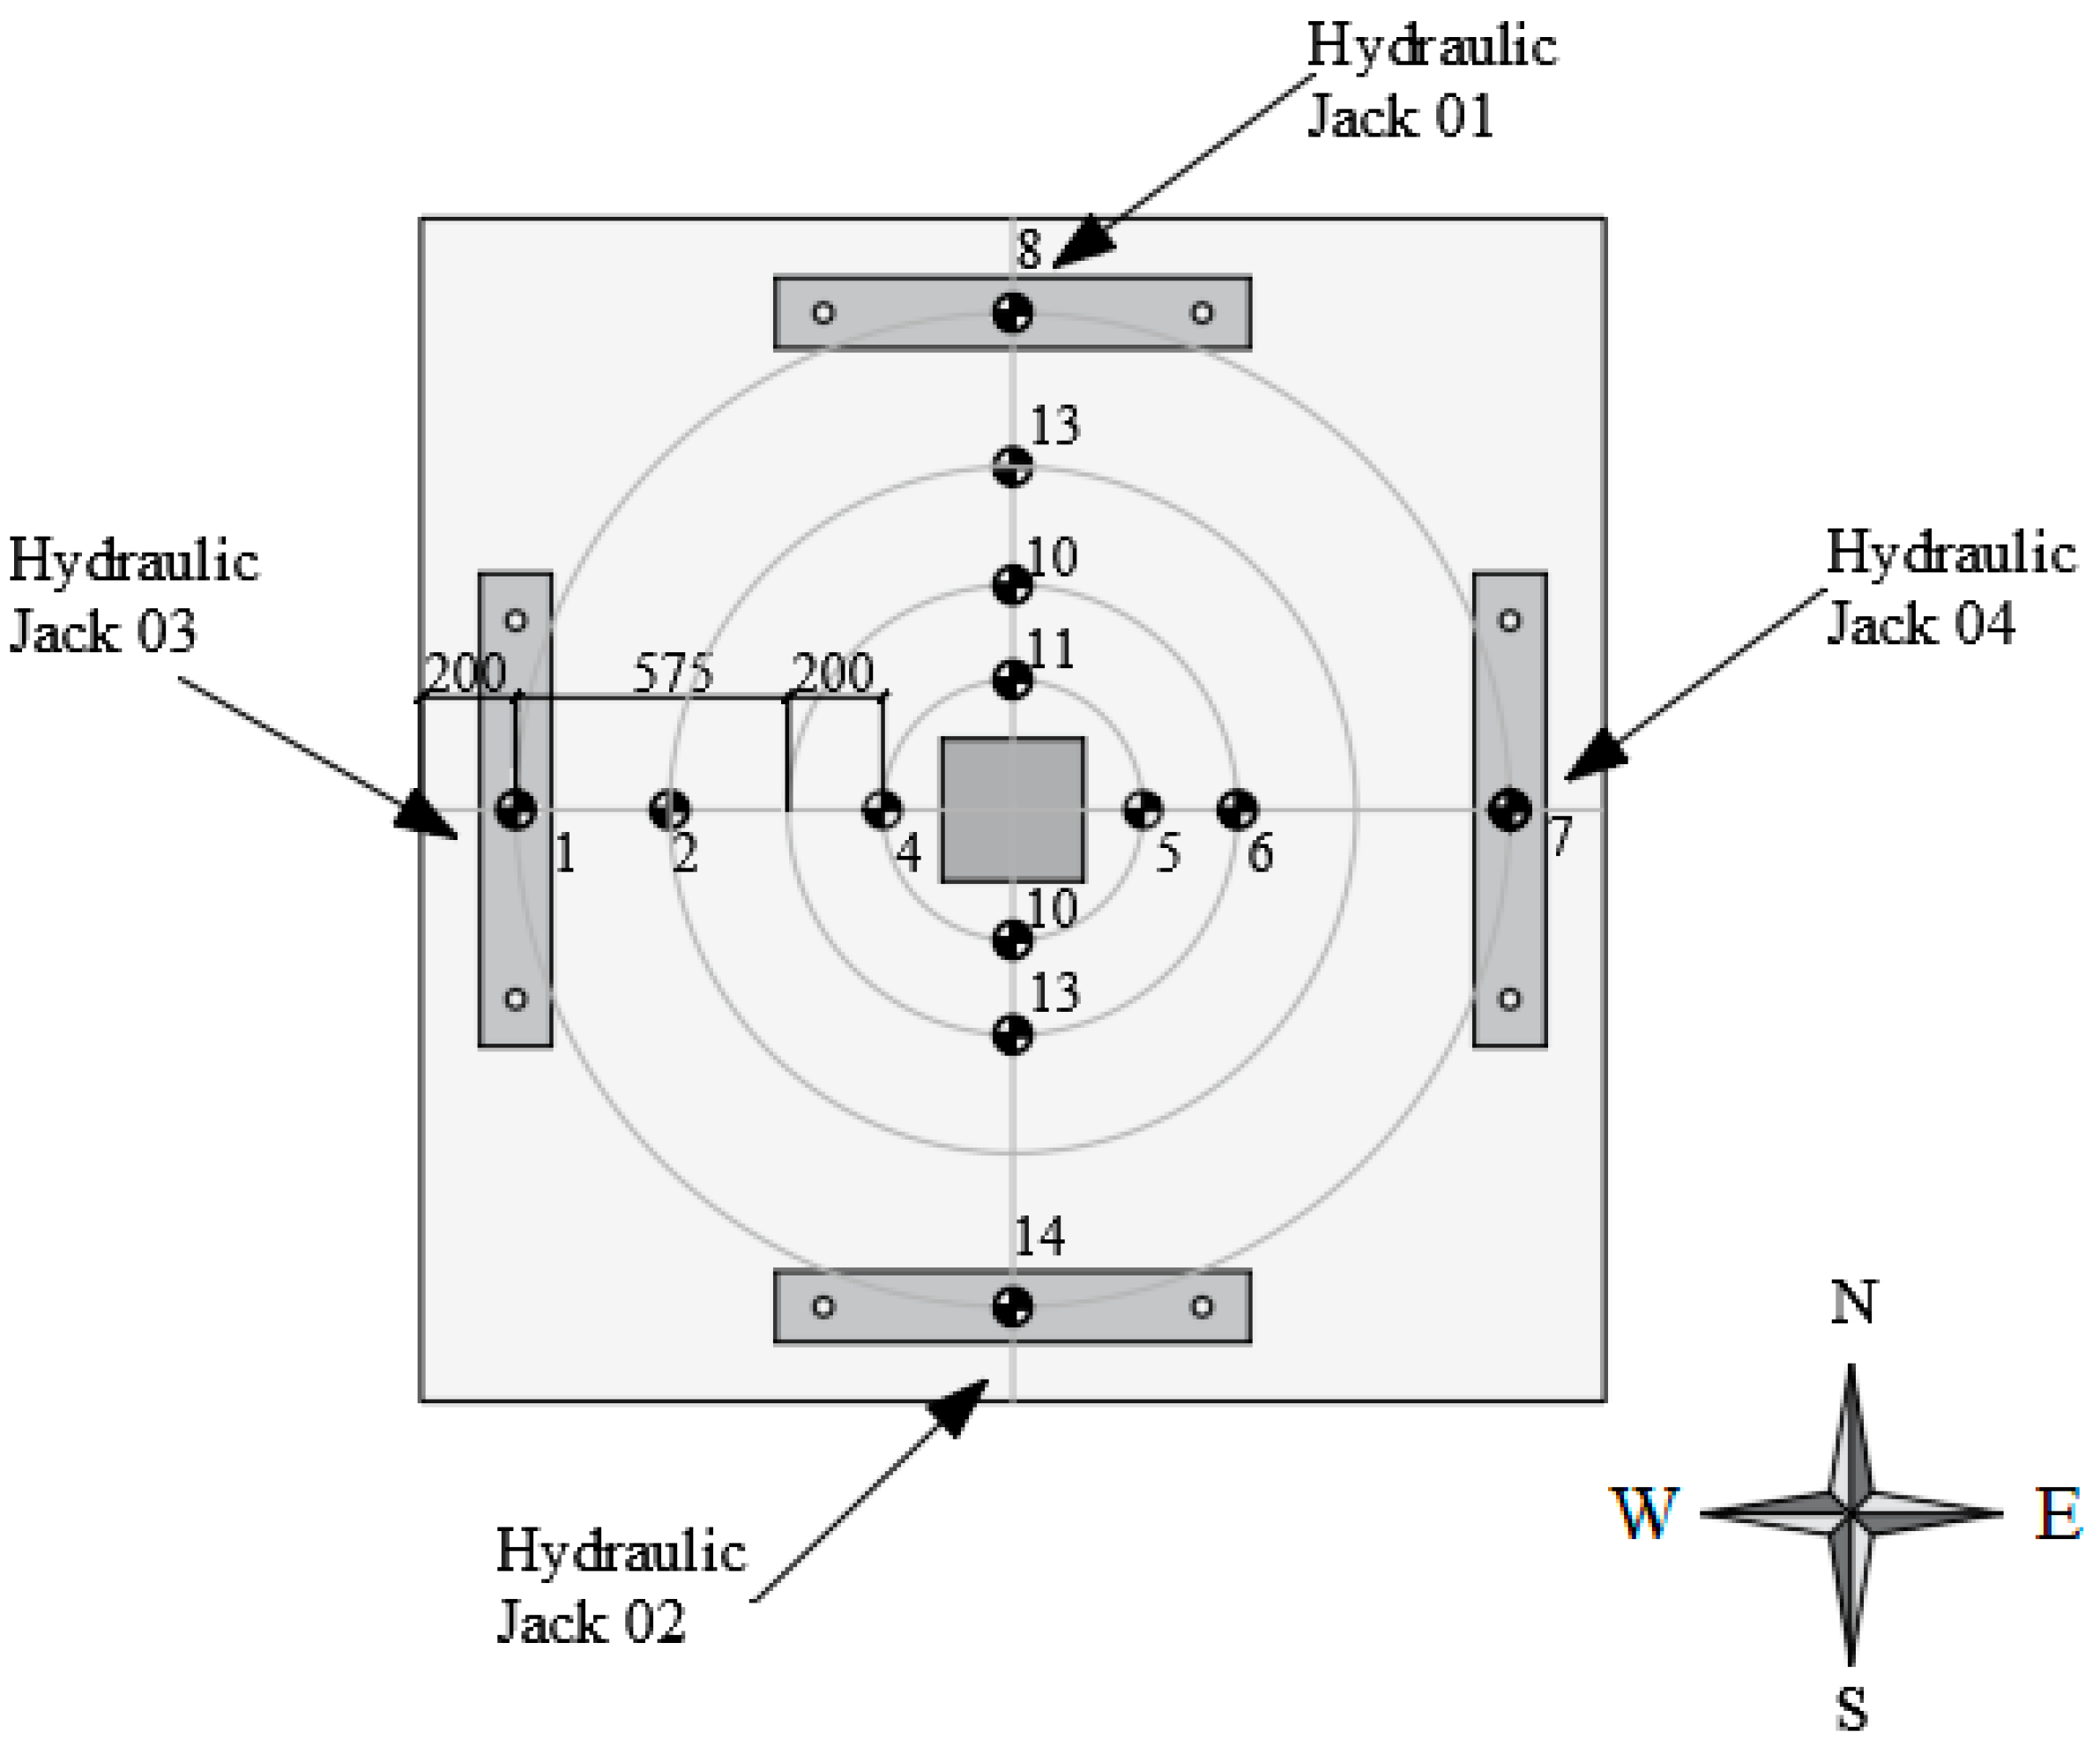
The vertical displacements of the slabs were monitored at 14 reference points distributed along their symmetry axis, as shown in Figure 4. The rotation on each axis was calculated by considering the variation in vertical displacement between two points, divided by the distance between them. In the experimental test, the forces 0.25 P and 0.25 P ± ∆P were applied using four hydraulic jacks located at points 1, 7, 8, and 14. These forces were introduced into the slab through eight rigid plates, equally spaced.

3.3. Load Conditions

In the computational analyses, the loading condition was simulated by applying displacement increments until the structural collapse of the slab–column connection occurred. For the LS05 model, displacement increments of 0.1 mm were applied to all rigid plates. In the LS06 model, the displacement increments listed in Table 1 were applied due to load eccentricity. These increments were defined based on the relationship between the individual load applied by each hydraulic jack and the total load. In order to analyse the influence of the displacement increment on the computational response, the LS06 model was also investigated by considering constant displacement increments equal to the mean values presented in Table 1.

3.4. Reinforcement Bars and Concrete

The reinforcement bars considered in all models follow the geometric configurations used by Ferreira et al. [12]. On the top face of the slab, 16.0 mm steel bars were spaced at 100 mm and 90 mm in x and y directions, respectively. The bottom flexural reinforcement was 8 mm bars positioned directly below alternate top bars. Figure 1 presents the flexural reinforcement of these slabs. The mechanical behaviour of the steel was simulated using the perfect elastoplastic model called Reinforcement EC2 with fy = 540 MPa and Es = 213 GPa.
The concrete was simulated using the CC3DNonLinCementitious2 model (fracture-plastic model), which is available in the A.T.E.N.A. library and recommended by Cervenka et al. [24]. The mean compressive strength of the concrete was taken as f c = 50.5 MPa and f c = 50.1 MPa for slabs LS05 and LS06, respectively, as presented by Ferreira et al. [12]. The tensile strength of the concrete ( f c t ), the modulus of elasticity ( E c ), the Poisson’s ratio ( ν c ), and the fracture energy of the concrete ( G f ) were defined using the recommendations presented by the fib Model Code 2010 [25] and NBR 6118 [18].
The mechanical properties of the concrete are essential for accurate simulation of the structural behaviour of flat slabs. In many cases, due to simplifications in the modelling, such as the assumption of perfect adhesion between the reinforcement bars and the concrete slab and the imposition of a no-slip condition between the slab and the rigid plate, the F.E. model may exhibit a behaviour that is more rigid than what is observed in experimental tests. To consider the impact of these simplifications on the structural response of the F.E. models, it was decided to calibrate the mechanical behaviour of the concrete assuming four different scenarios: (i) 50% f c t , 50% E c , and 70% G f ; (ii) 50% f c t , 70% E c , and 70% G f ; (iii) 50% f c t , 100% E c , and 70% G f ; and (iv) 100% f c t , 100% E c , and 100% G f . In such scenarios, only the parameters not experimentally determined by Ferreira et al. [12] were calibrated. As discussed in Section 4.1, the ideal values for these parameters were selected to provide the best consistency in terms of flexural response between experimental and numerical results.

3.5. Finite Element Mesh

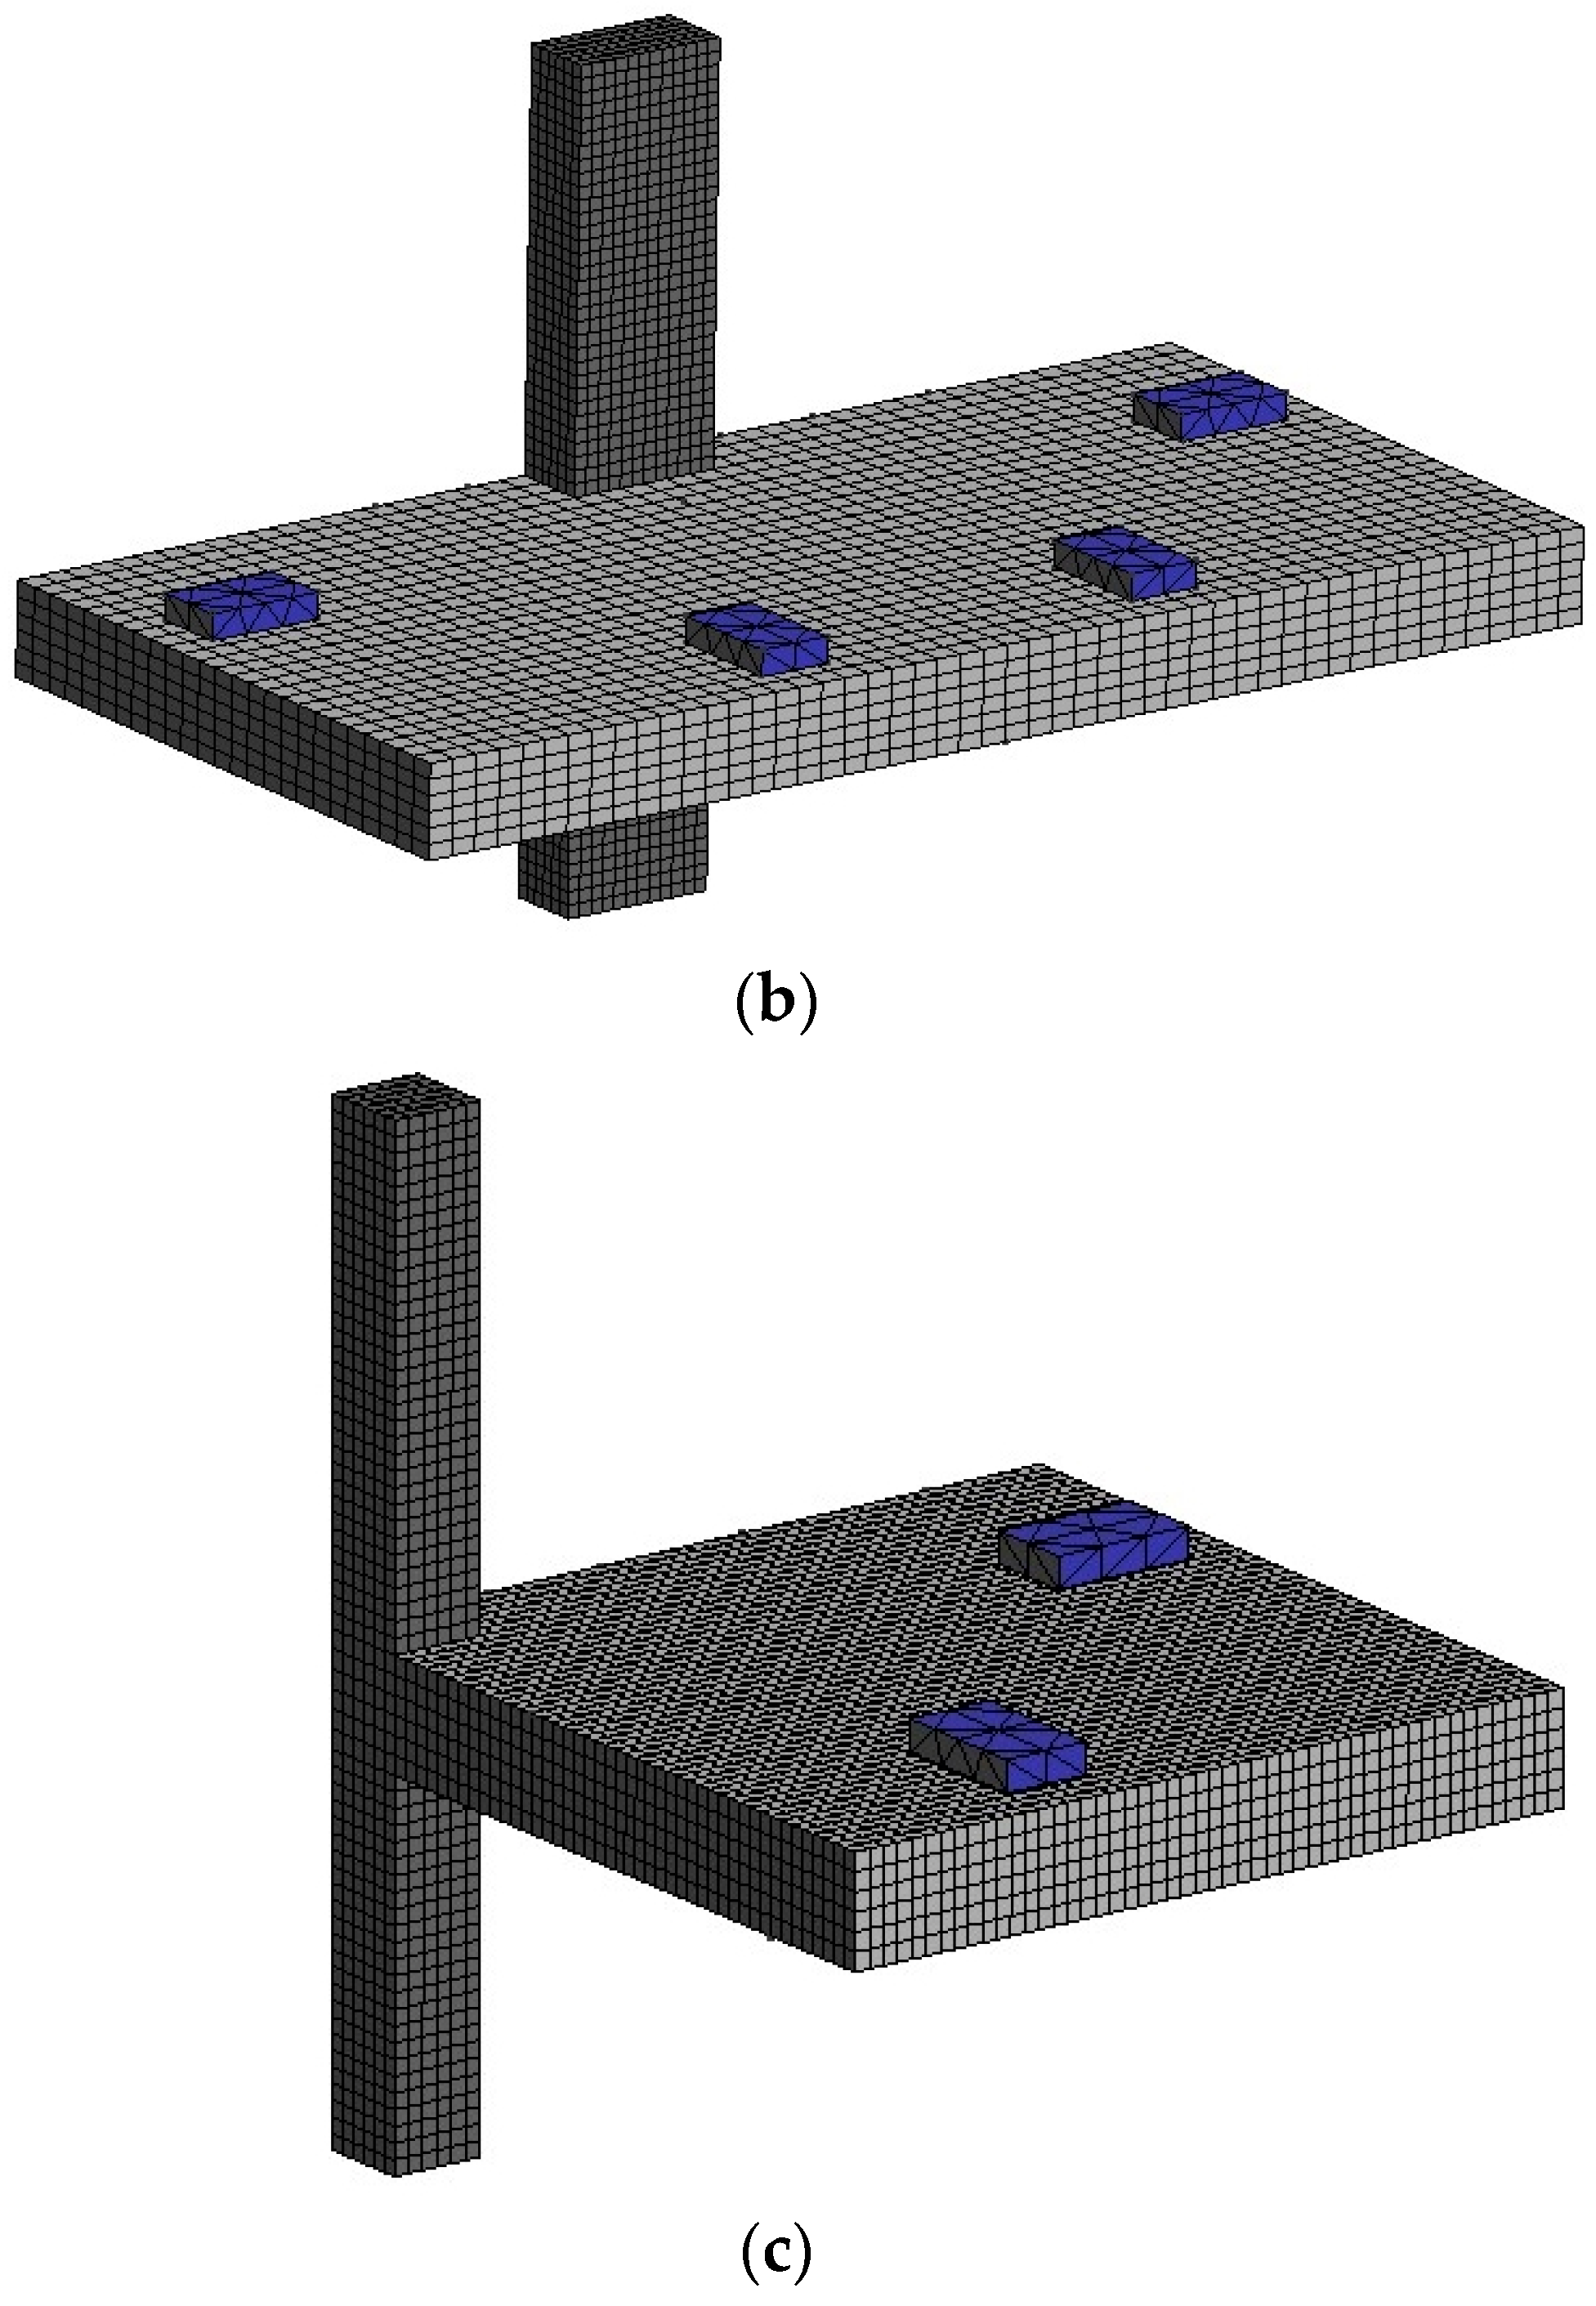
The concrete was discretised using hexahedral elements with eight nodes, eight integration points, linear interpolation, and a maximum dimension equal to 25 mm (Figure 5). As suggested by de Boer et al. [26], six elements were used across the thickness direction in all parts of the slabs. The reinforcement bars were discretised using unidirectional elements with two nodes, one integration point, linear interpolation, and a maximum dimension equal to 25 mm. Lastly, the rigid plates were discretised by tetrahedral elements with four nodes, one integration point, linear interpolation, and a maximum dimension equal to 50 mm.

4. Validation of the F.E. Models

The finite element models presented in this study were validated using the experimental results obtained by Ferreira et al. [12] as a reference.

4.1. Concrete Parameters

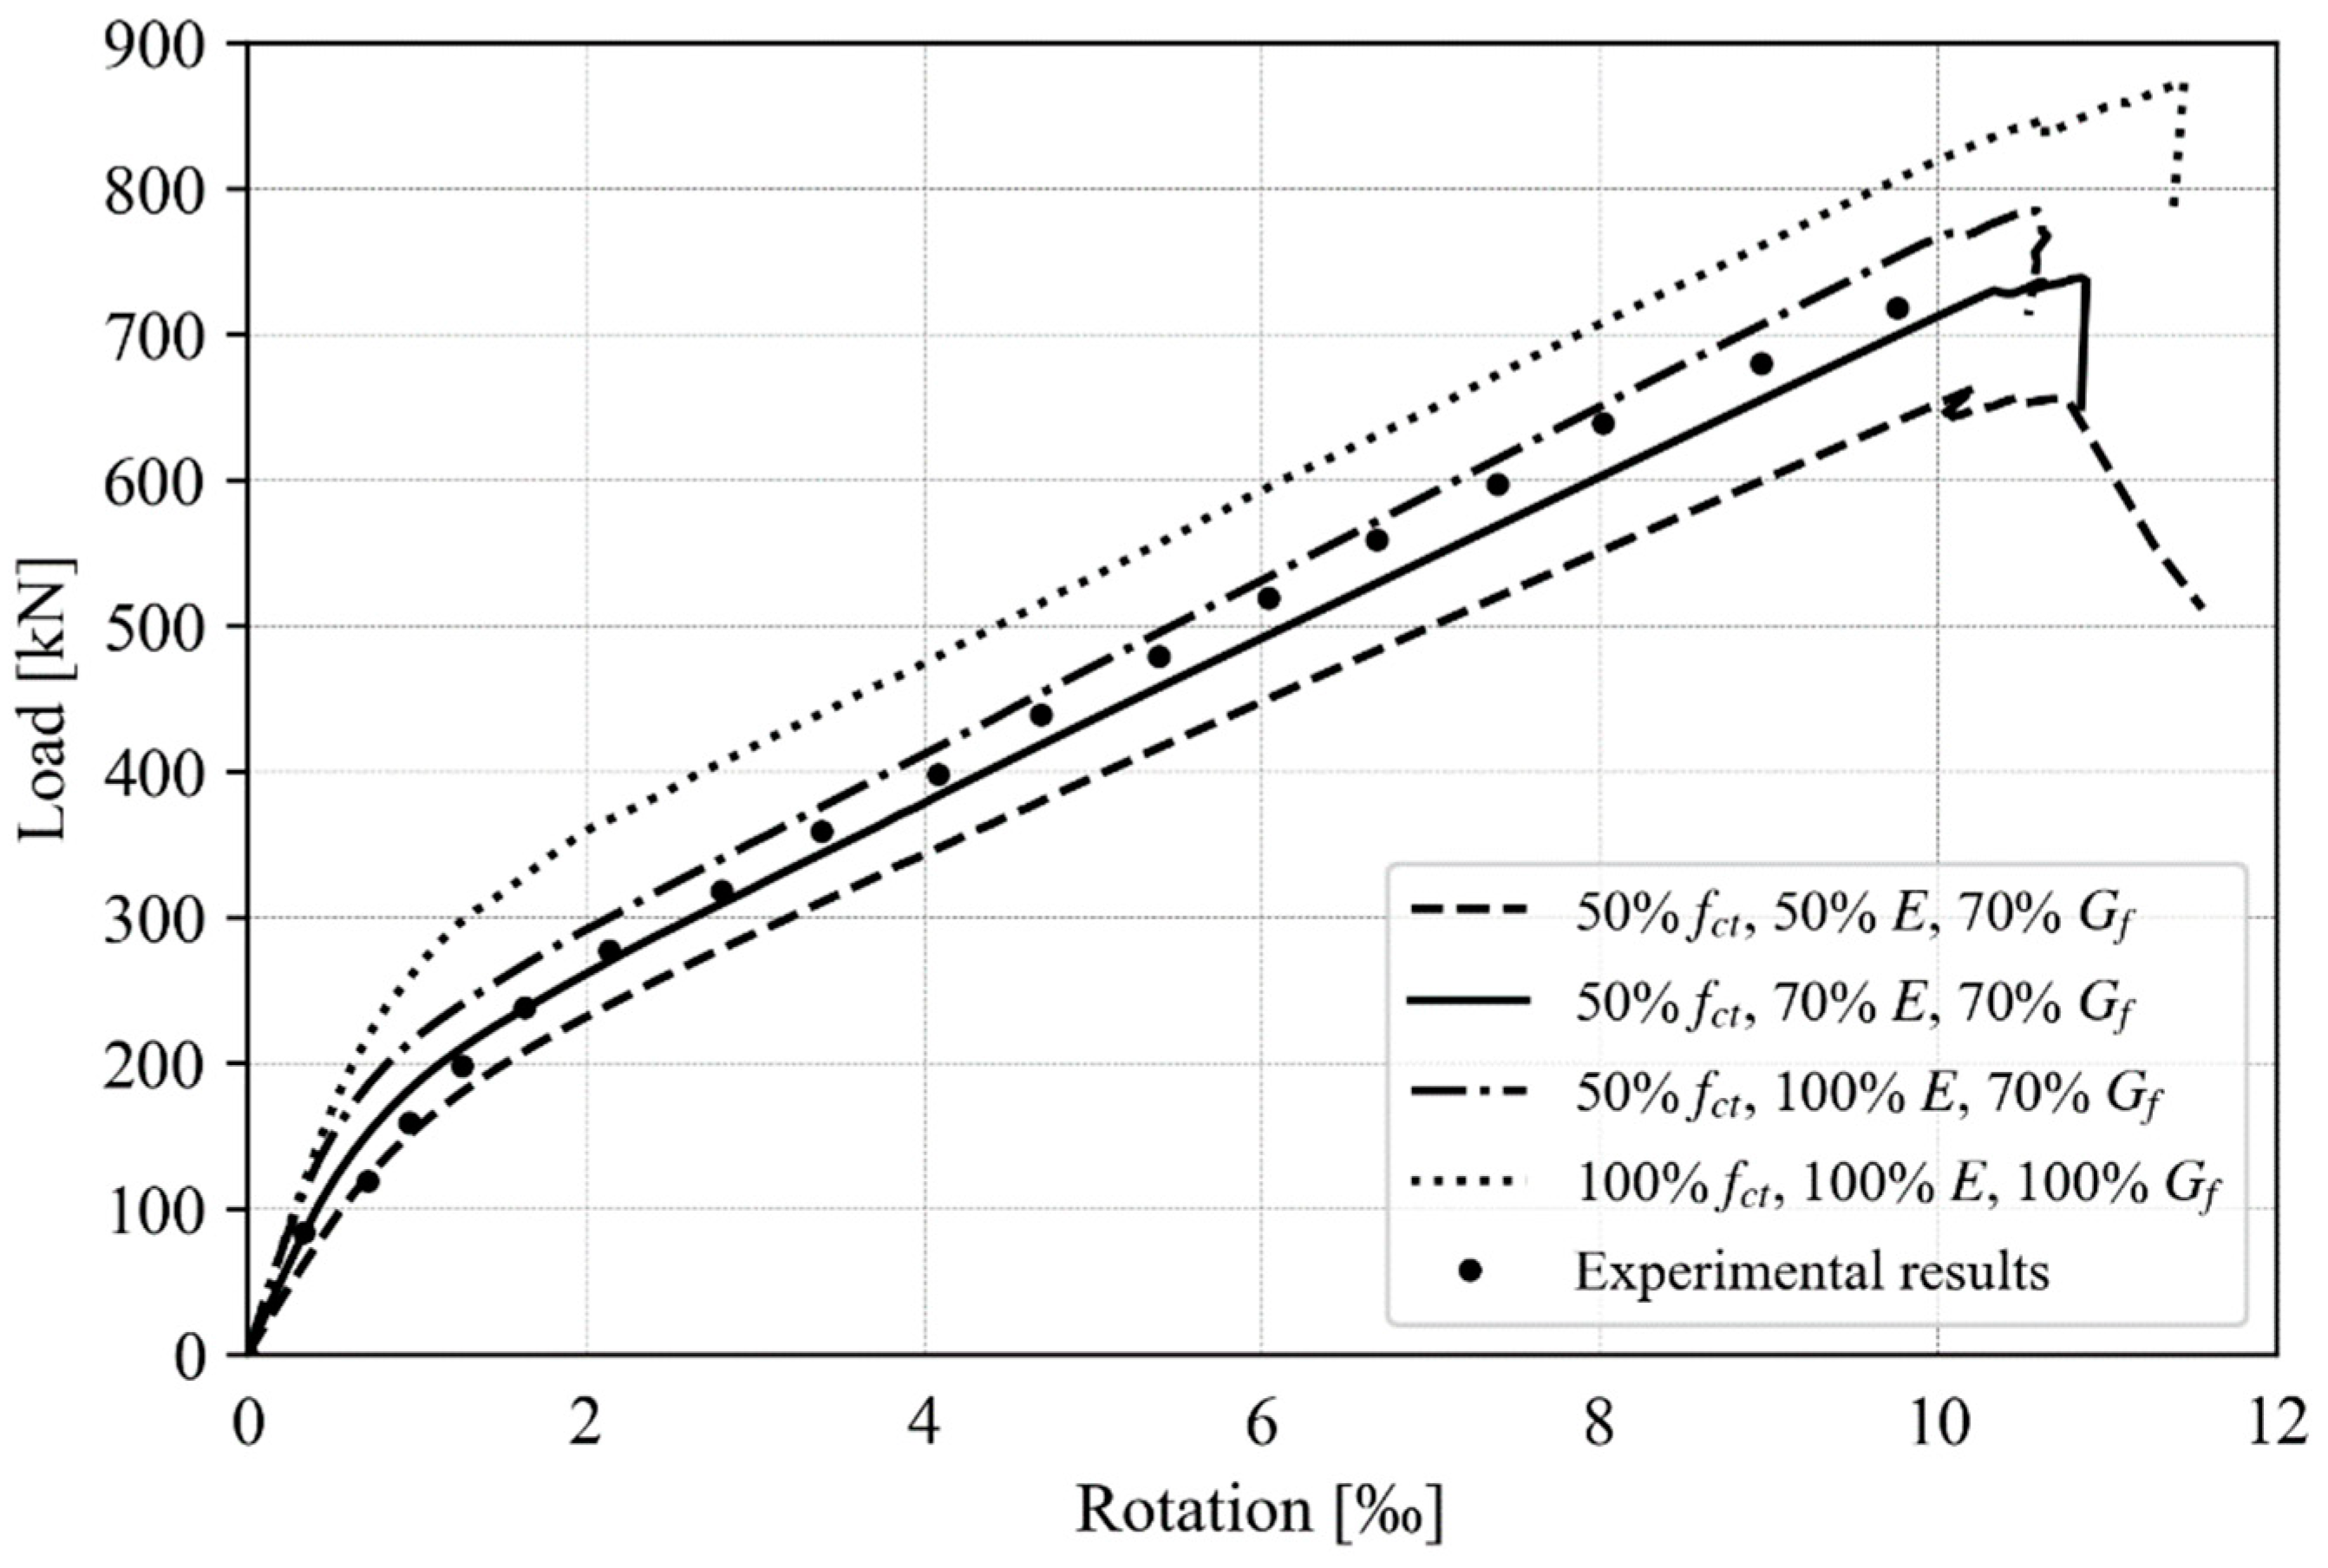
The mechanical behaviour of the concrete was calibrated using the LS05 model as a reference. As detailed in Figure 6, the results obtained considering the four scenarios mentioned in Section 3.3 are compared with the reference experimental results.
Analysing Figure 6, it is possible to verify that scenarios (ii) and (iii) presented the parameters that aligned most closely with the experimental results. However, due to the initial linear–elastic response, scenario (ii) was chosen as the ideal case. Consequently, the results discussed in subsequent sections adopt the following mechanical parameters for concrete: a tensile strength of 2.2 MPa, a modulus of elasticity of 27.86 Gpa, and a fracture energy of 0.054368 N/mm.

4.2. Symmetry Conditions

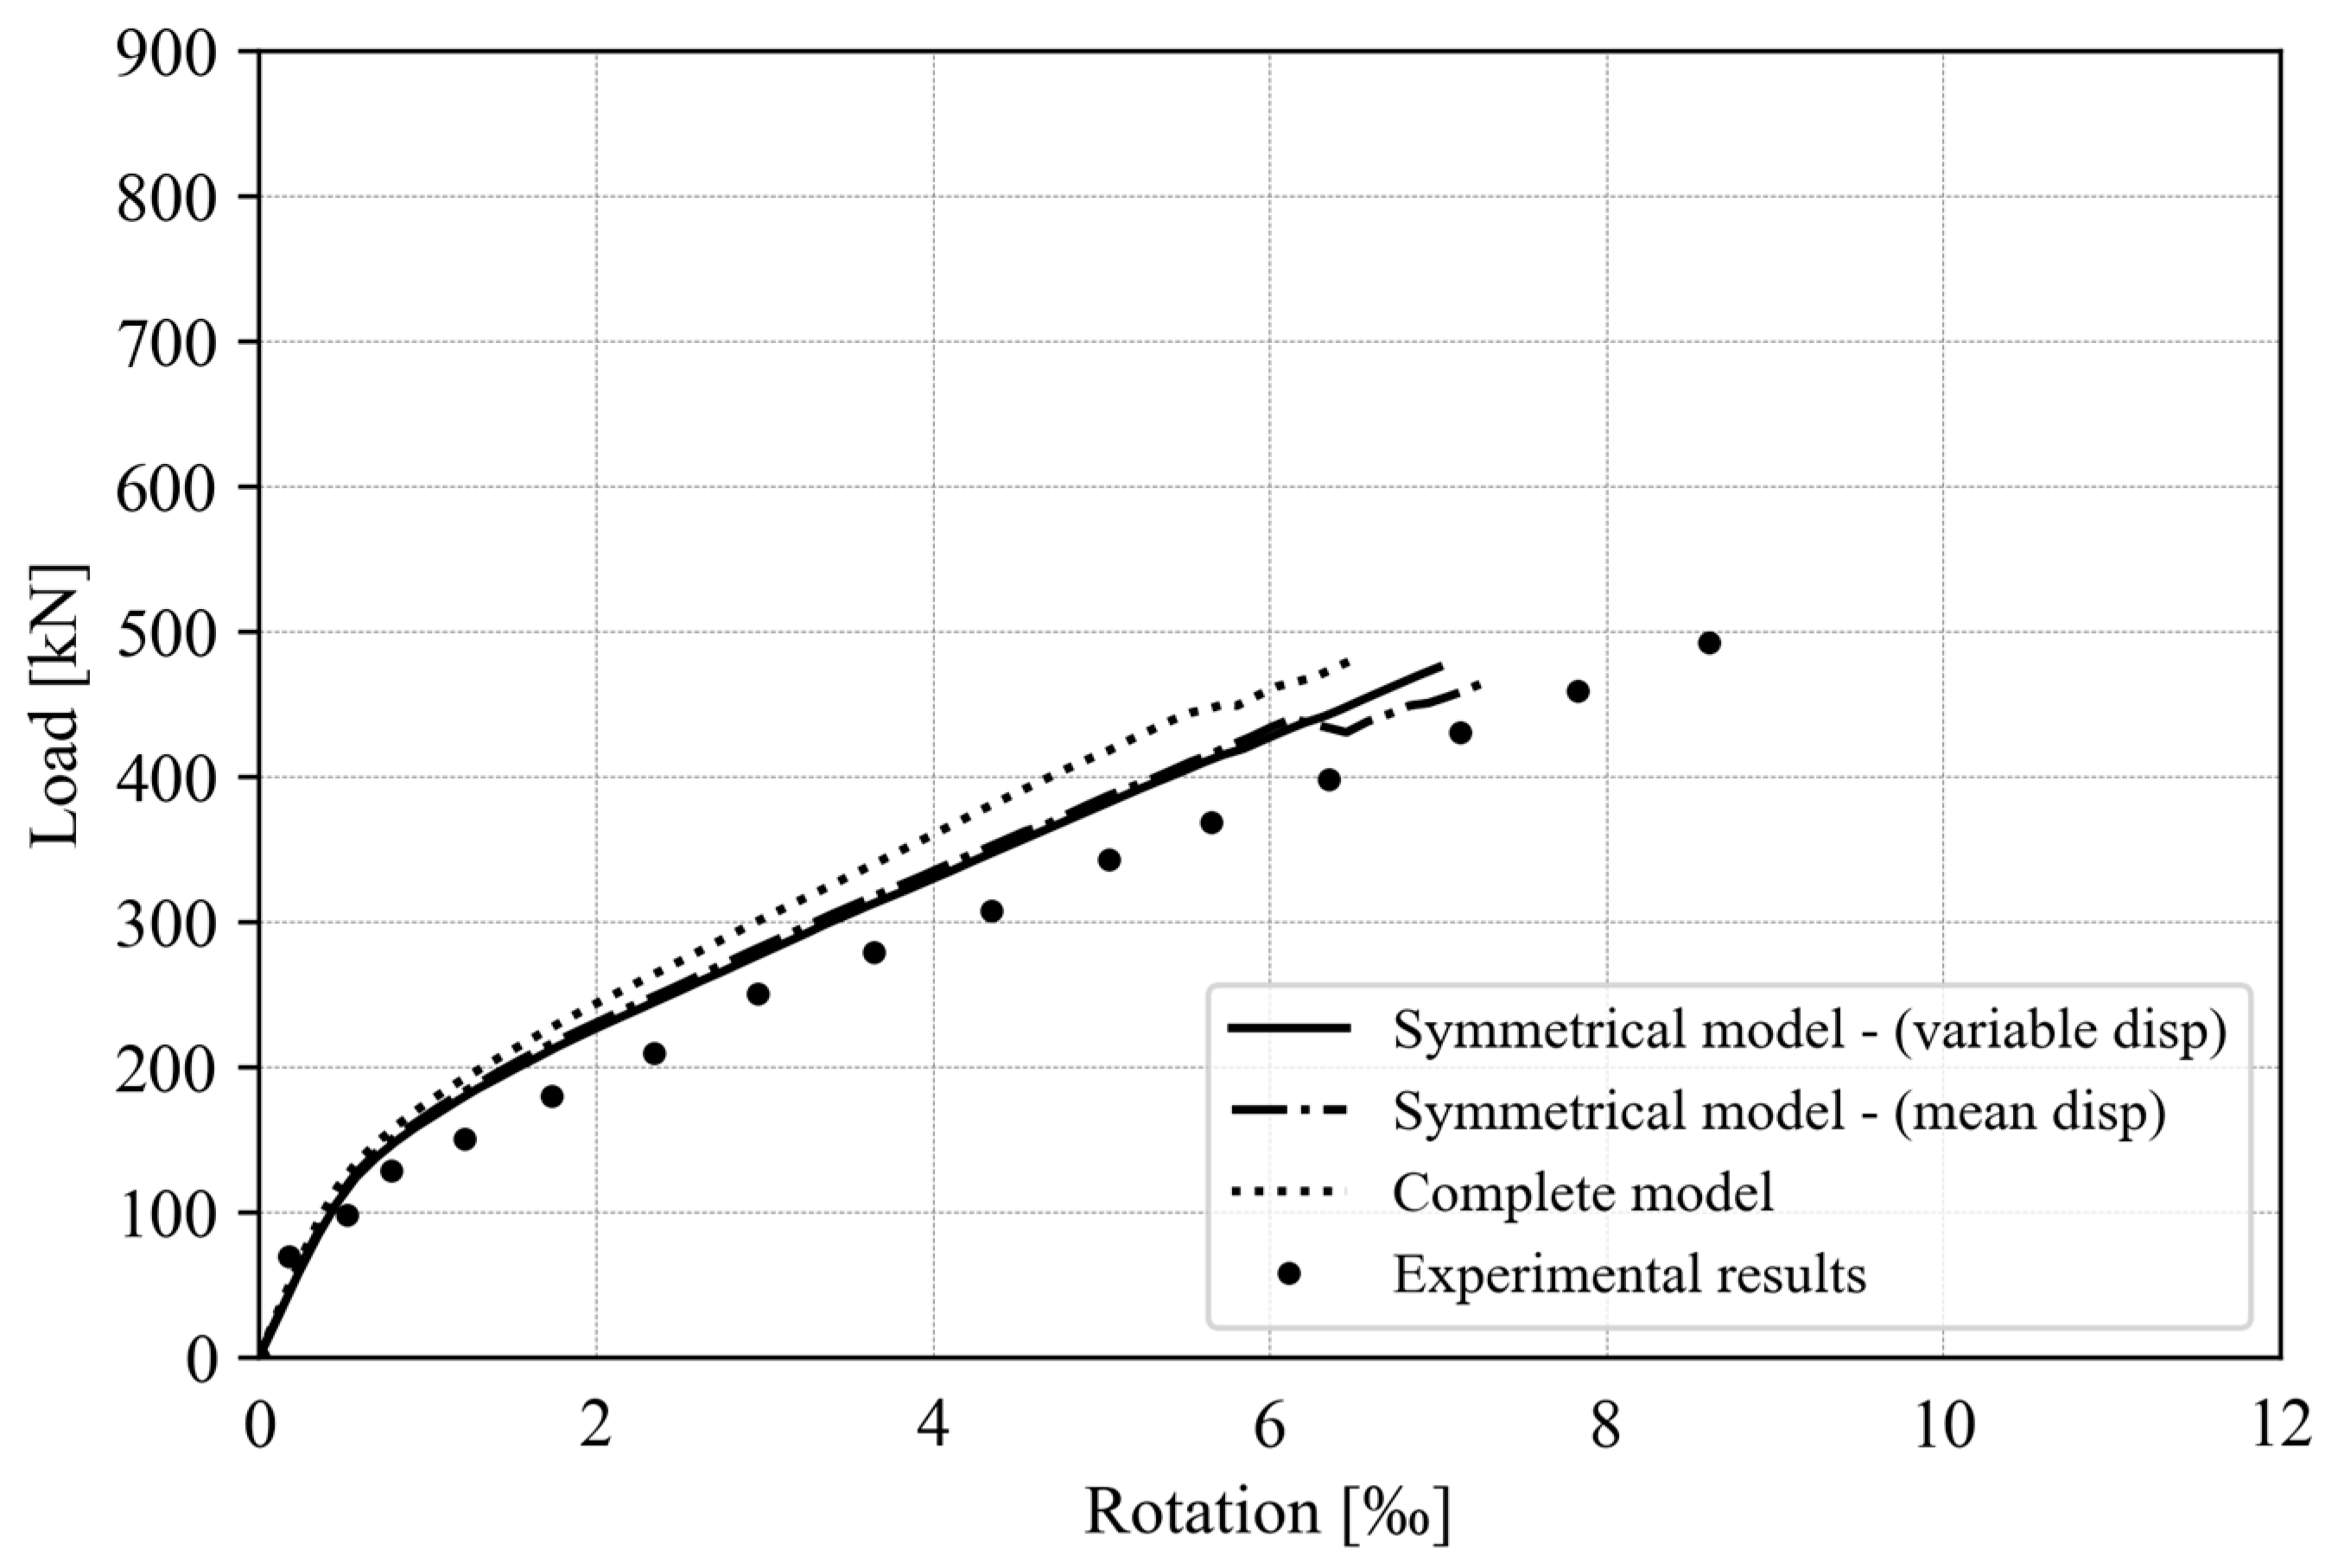
Figure 7 shows the numerical results obtained by the LS06 model in two configurations: without a symmetry plane (complete model) and with a symmetry plane (symmetrical model). This figure also includes the reference experimental results for the LS06 slab.
As seen in Figure 7, the mechanical parameters of the concrete, calibrated based on the LS05 slab as described in Section 4.1, produced similar results for both versions of the LS06 slab subjected to unbalanced loads. During the initial linear–elastic phase, the models exhibited analogous mechanical behaviour. However, after the first cracks appeared, the model with symmetry became more rigid than the model without symmetry. This difference can be justified by analysing the boundary conditions used to represent symmetry, which, in addition to restricting horizontal displacements, increased the flexural stiffness of the slab along this symmetry plane. Comparing the results obtained by the symmetric models, it is noted that there are no significant differences between the two loading conditions (variable and mean displacement increment).

4.3. Ultimate Shear Force and Rotation

Table 2 presents a comparative analysis between the experimental and numerical results concerning the flat slabs’ ultimate shear force and rotation.
Among the three cases examined, the most significant discrepancy between the punching strength determined experimentally and computationally was 11%, observed in the LS06 slab (symmetrical model). According to [17], the relationship between experimental and numerical loads should not exceed 1.15. Therefore, the values presented in Table 2 are within an acceptable range of variation.

4.4. Crack Distribution

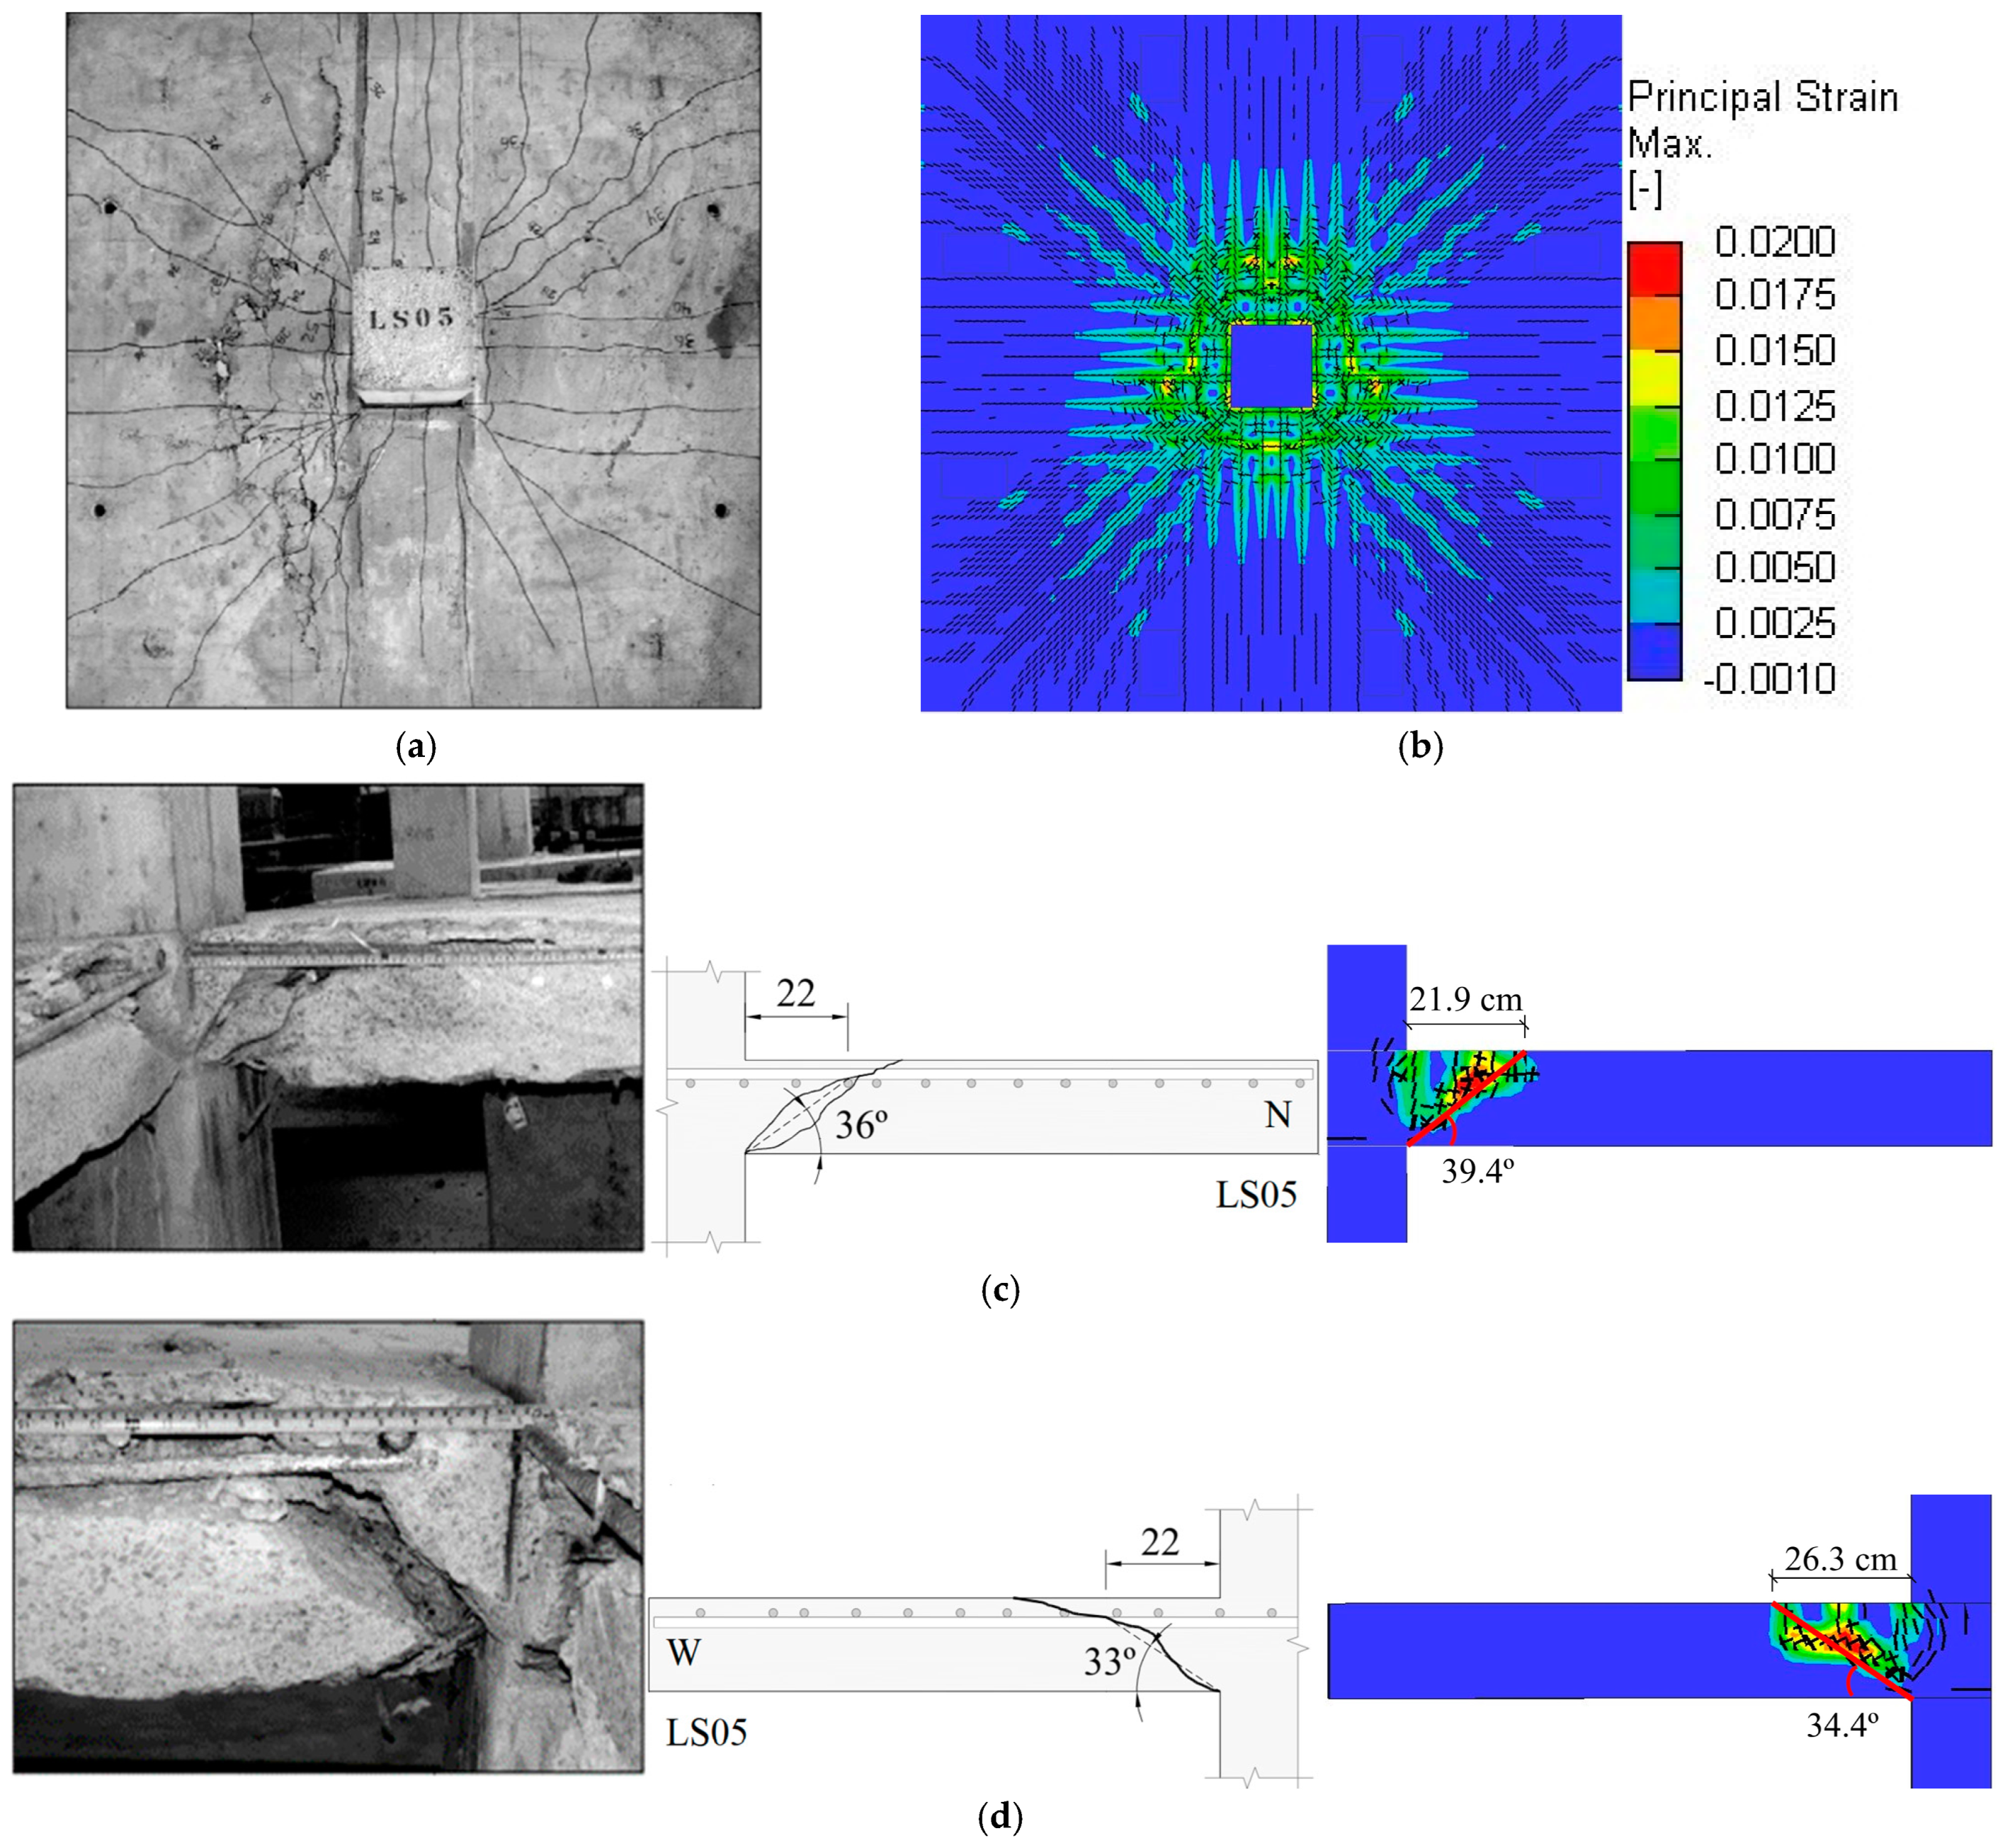
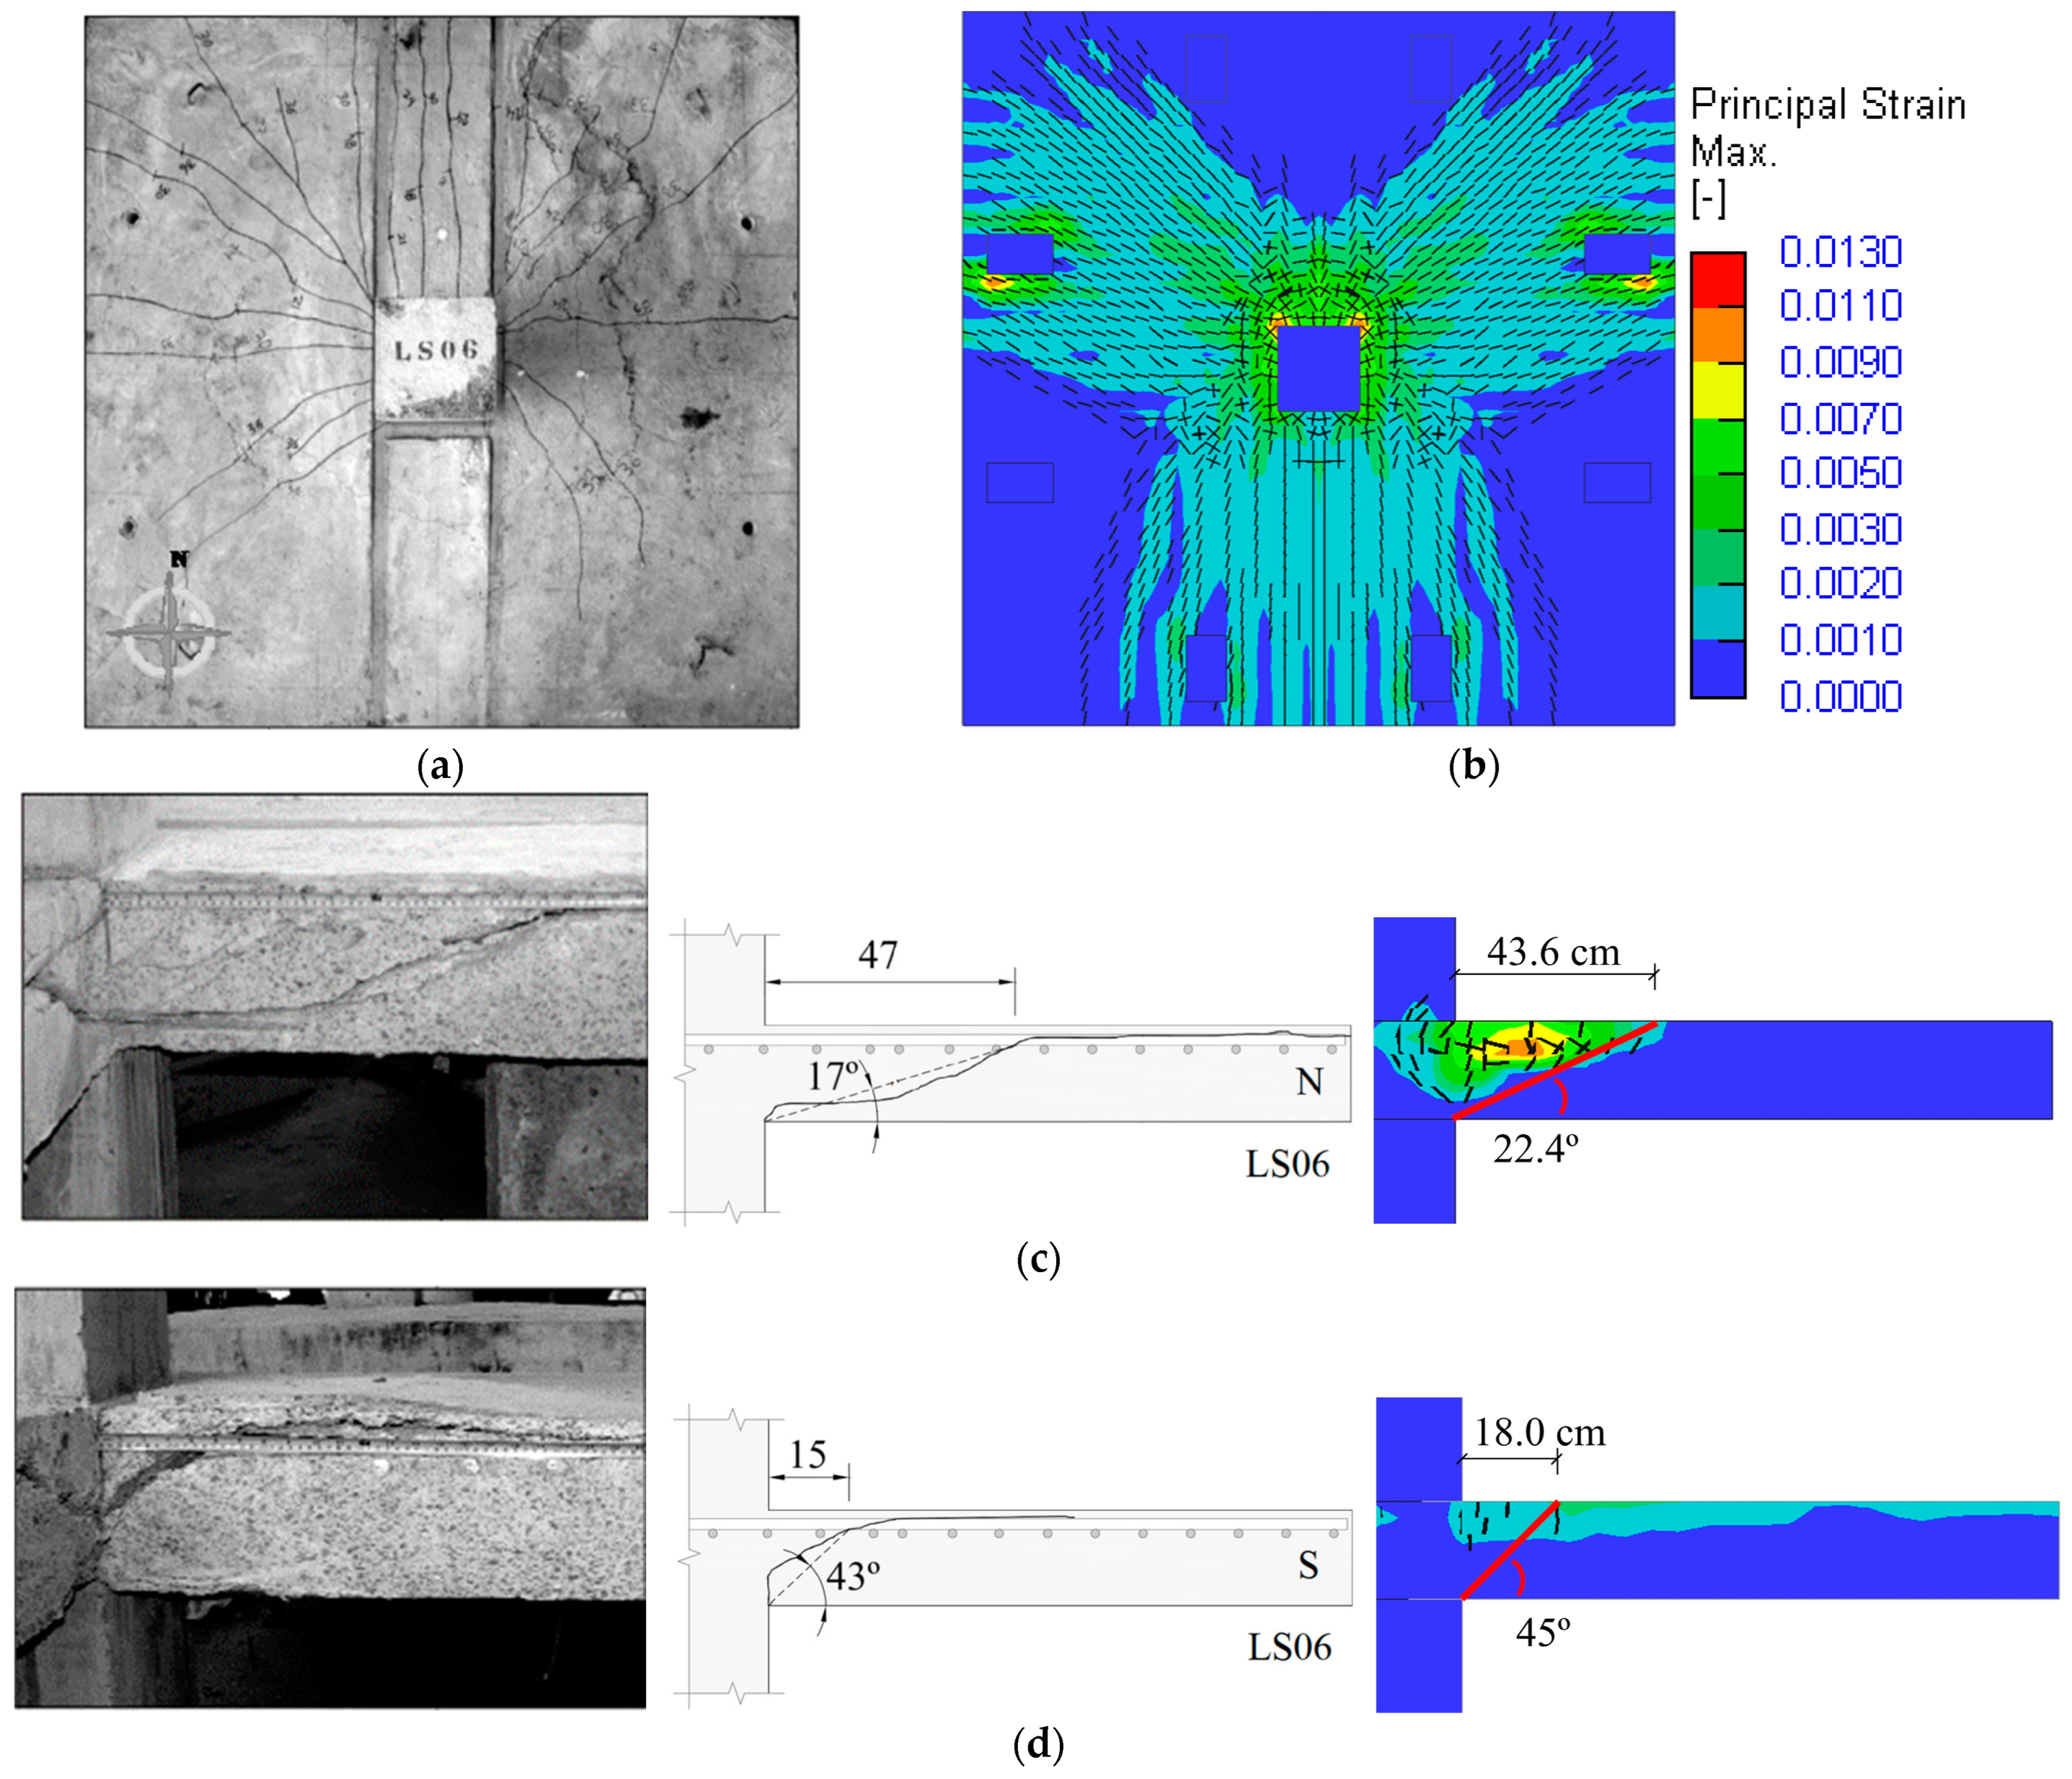
The crack patterns obtained computationally for slabs LS05 and LS06 are presented below. In these results, the black lines represent cracks with opening width greater than 0.05 mm, the minimum value perceptible to the naked eye. The colour map indicates the maximum principal strains and highlights the region most susceptible to structural collapse.

4.4.1. Slab LS05

Figure 8 shows the crack distributions found experimentally by [12] and obtained by the LS05 model. Given this model’s two planes of symmetry, the crack distribution is identical across all four quadrants. As can be seen, the experimental and numerical results follow the same cracking pattern with straight radial cracks along the top face of the slab and circumferential cracks around the column. A similarity between the results obtained is also observed when analysing the lateral planes (see Figure 8c,d). In the experiment, the inclination angles of the failure surface measured 36° towards the north (Figure 8c) and 33° towards the west (Figure 8d). These angles are consistent with the computational findings, which reported 39.4° and 34.4°, respectively.
During the initial loading phase, radial cracks form in the slab. Subsequently, circumferential cracks appear around the column. As the load increases, these cracks not only propagate but also intensify, and this behaviour is consistent with experimental observations.

4.4.2. Slab LS06

As shown in Figure 9a, the LS06 slab, subjected to an asymmetric load, showed a higher cracking degree in the region with the highest load application (north direction). Once again, the computational model presented a cracking pattern similar to that observed experimentally (Figure 9b), with a more pronounced cracking level in the north direction. In both cases, it is possible to observe the existence of straight radial cracks along the top face of the slab and circular cracks around the column. In the experiment, the inclination angles of the collapse cracks measured 17° towards the north direction (Figure 9c) and 43° towards the south direction (Figure 9d). These angles are consistent with the computational findings, which reported 22.4° for the north and 45° for the south directions.

4.5. Steel Strains

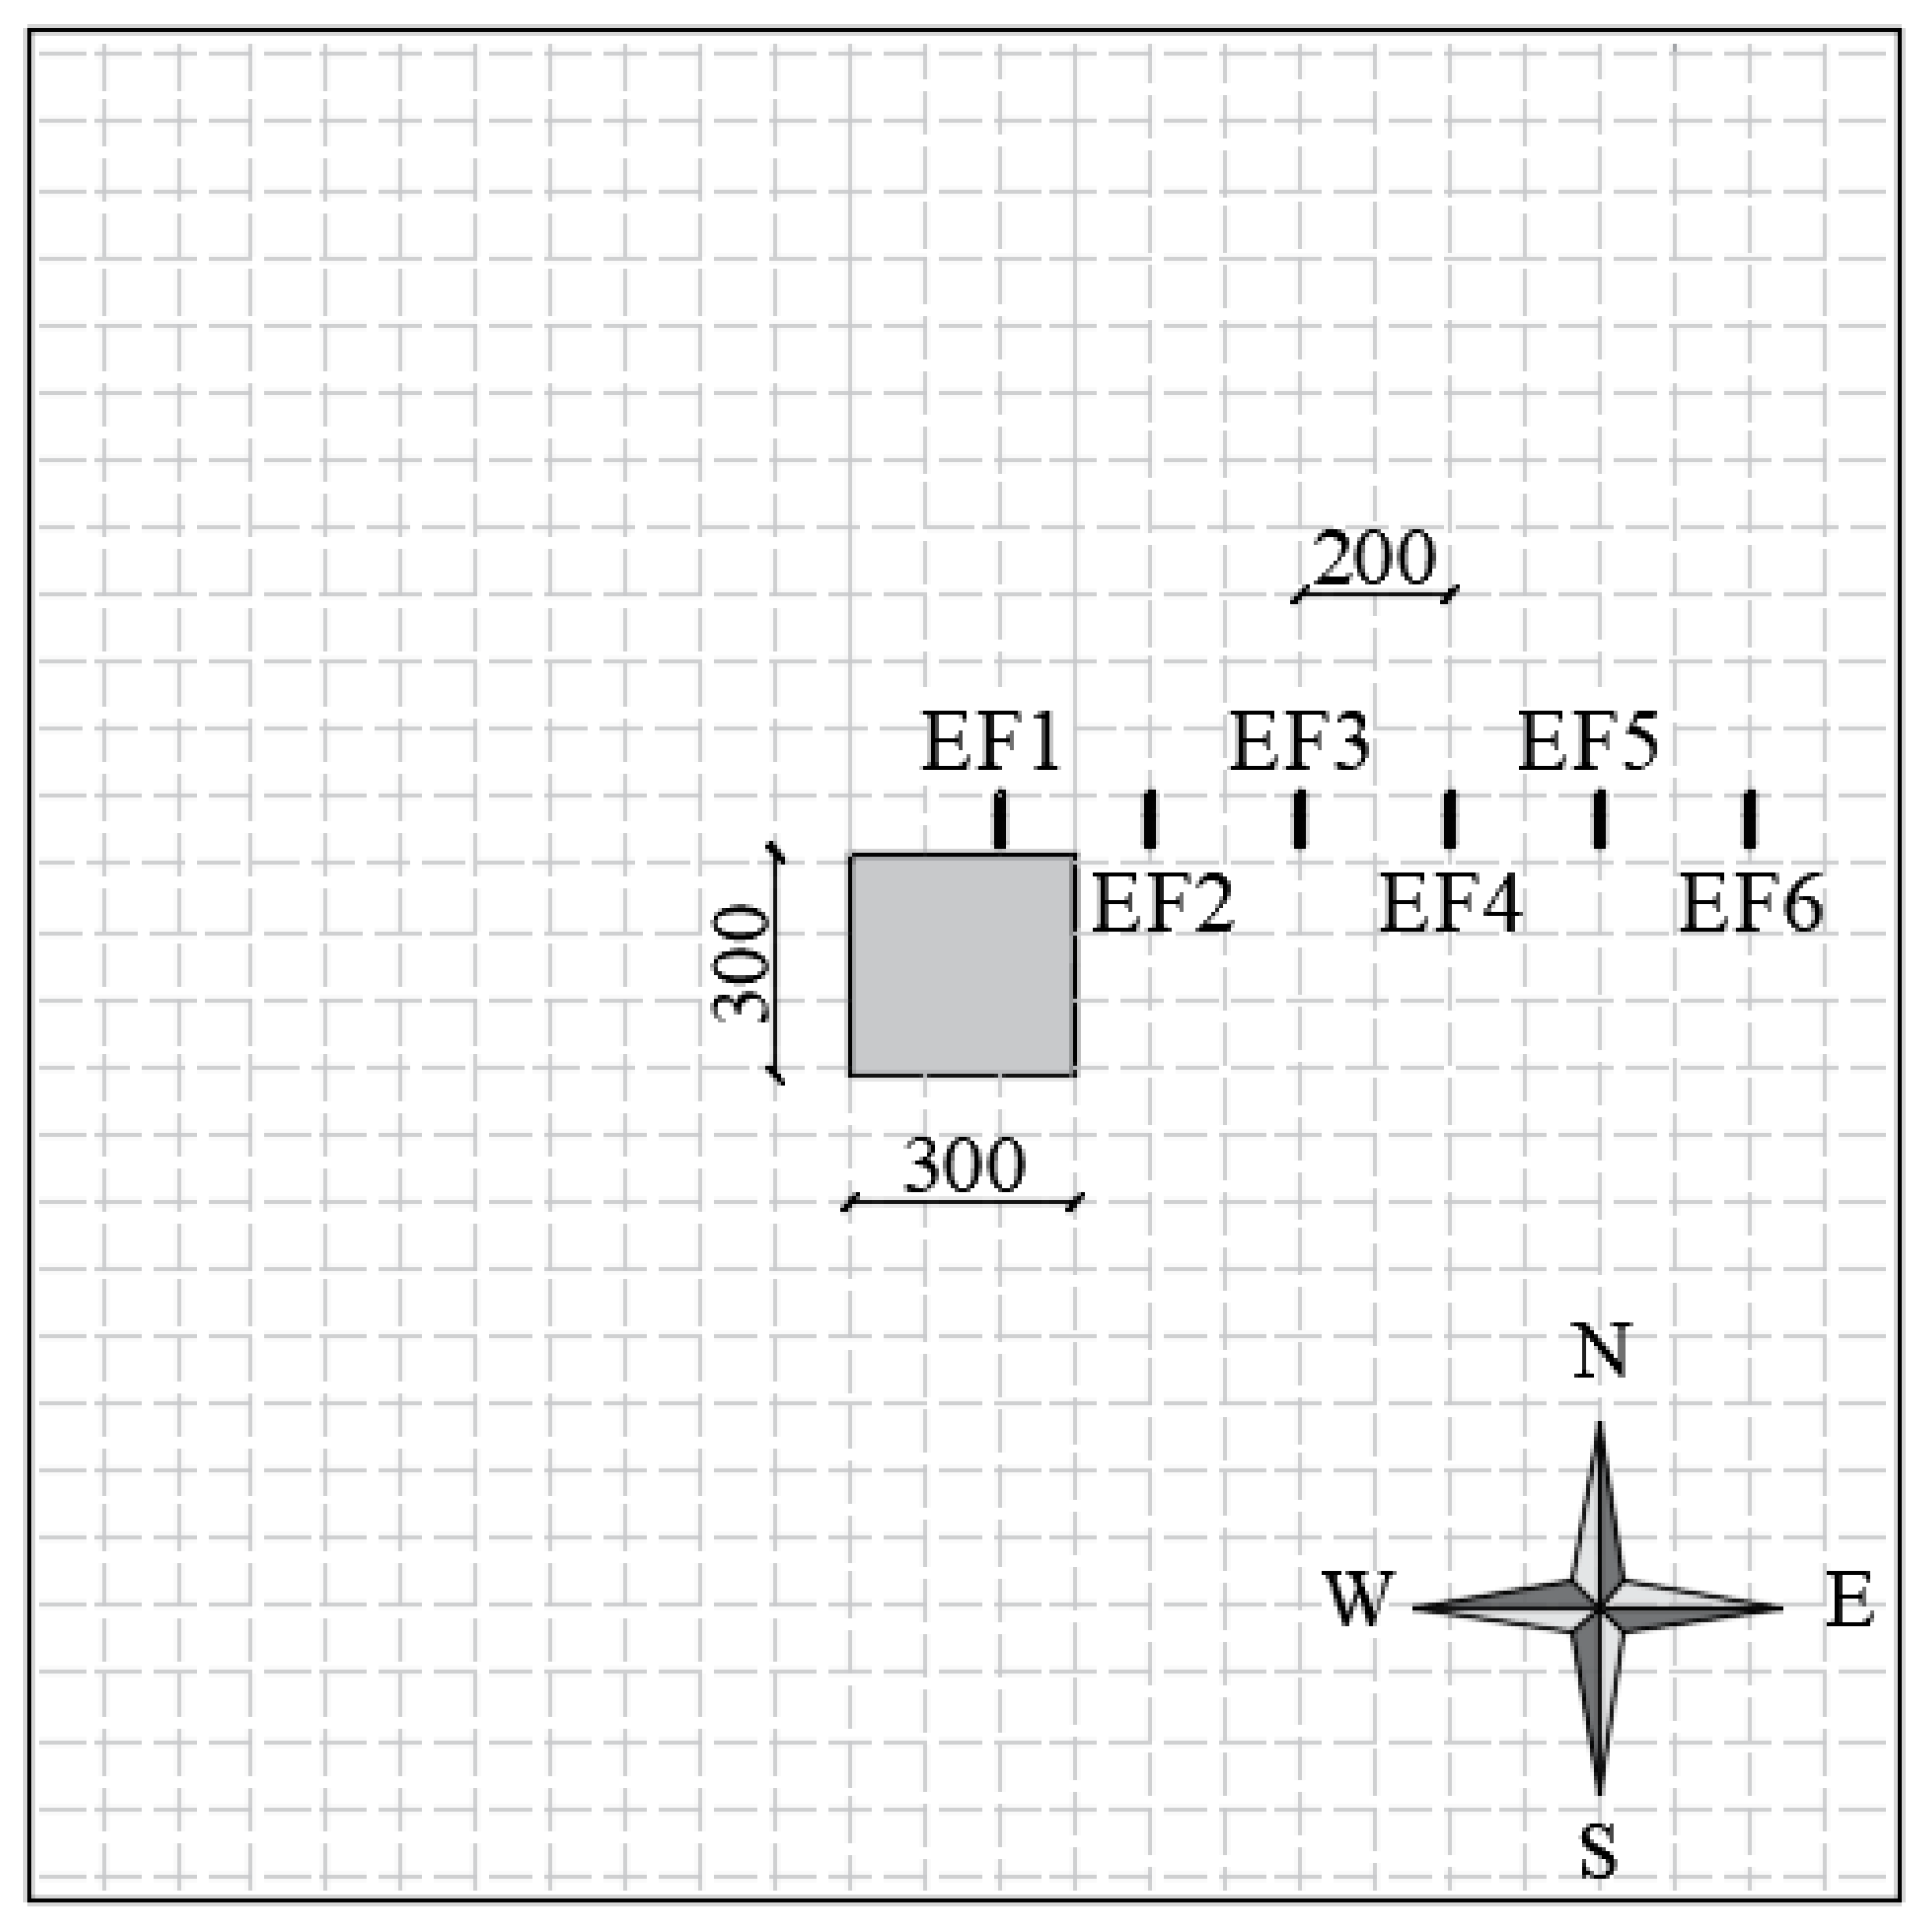
The steel strains were measured using six strain gauge sensors strategically located in the reinforcement bars localised close to the top face of the slab, as illustrated in Figure 10. These sensors were positioned in the direction with the most intense efforts (north–south direction).

4.5.1. Slab LS05

The steel strains obtained experimentally and computationally for flat slab LS05 are presented in Figure 11. As seen at all measurement points, there is a remarkable similarity between the experimental and numerical results. This observation demonstrates that the behaviour of steel bars in the F.E. model is consistent with the experimental behaviour.

4.5.2. Slab LS06

The results obtained for slab LS06, shown in Figure 12, demonstrate compatibility between the experimental and numerical strains in the steel bars. This figure shows that the compatibility is greater in reinforcement bars that are more distant from the column, but for those close to the column (strain gauge sensors EF1, EF2, and EF3), the relation becomes more discrepant.
The computational investigation showed that the reinforcement bars close to the column exhibit greater tensile strains up to a load of 427 kN. The maximum tensile stress moves slightly away from the column in the range between 458 kN and the ultimate punching shear force. This behaviour can explain the strain reduction in the reinforcement bars close to the column, which was not observed in the experimental study.

4.6. Concrete Strains

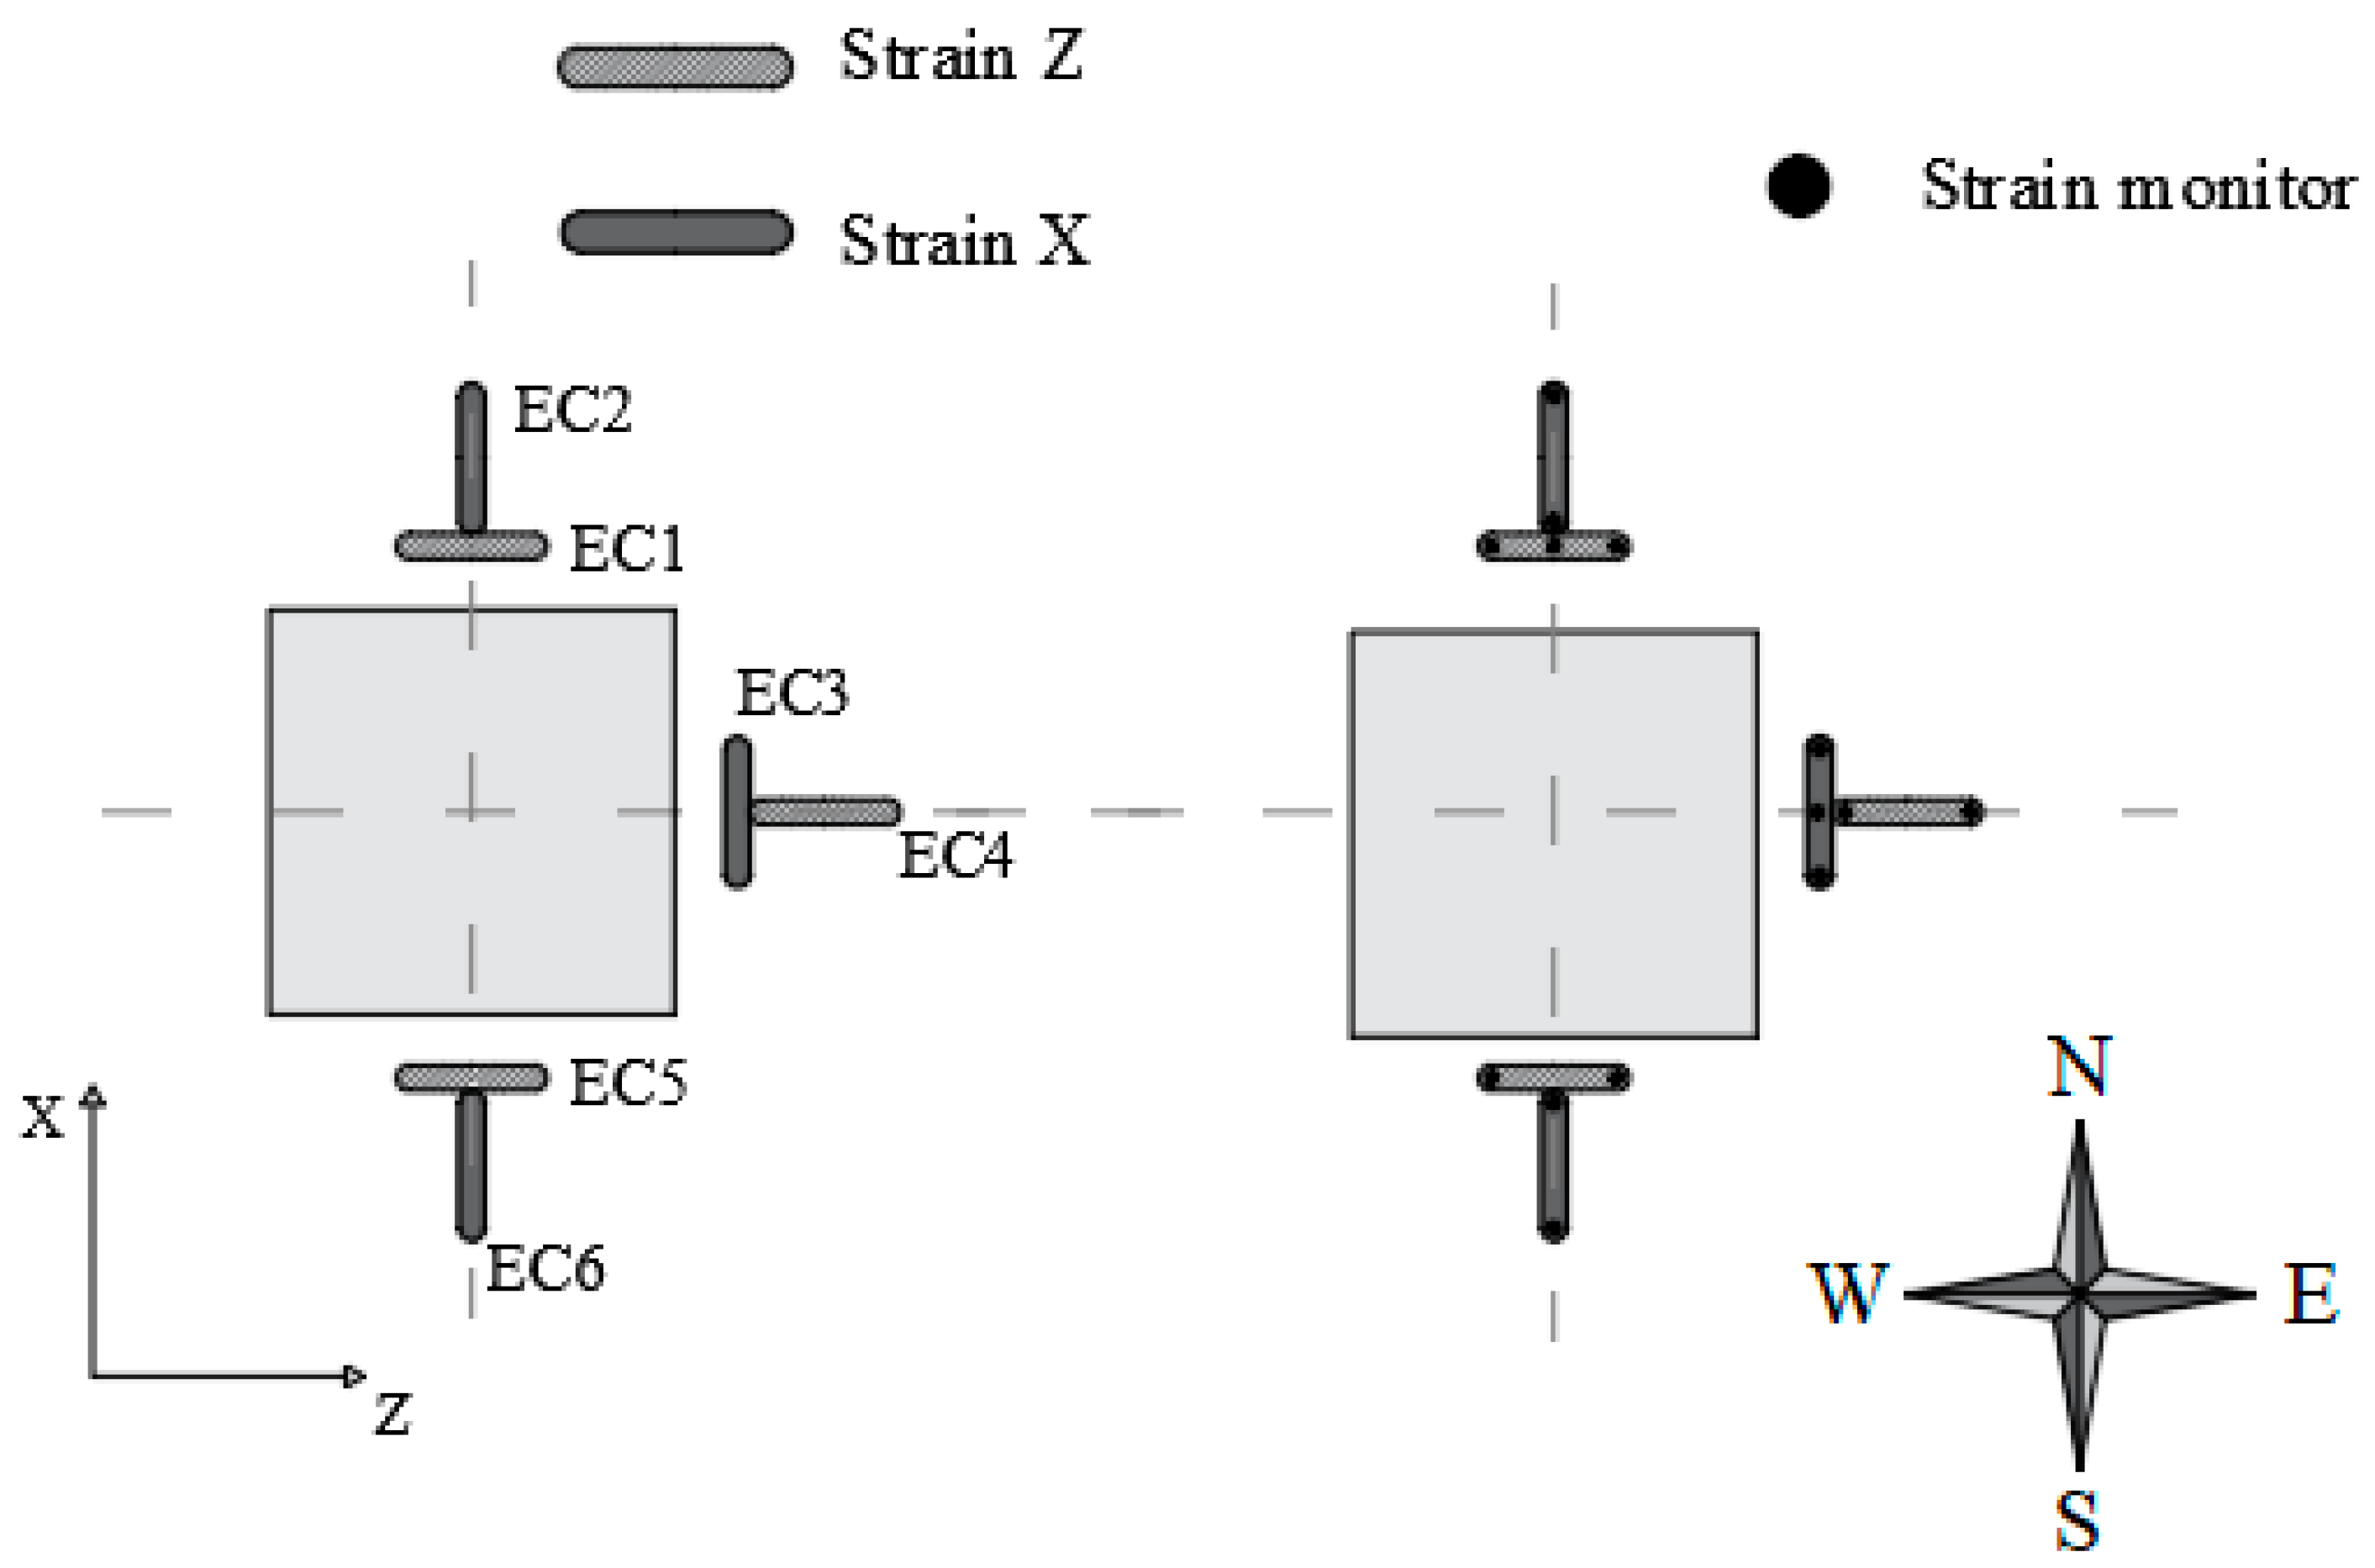
In the computational model, strains in the concrete were monitored using point monitors defined in the extreme positions of the strain gauges of the experimental test, respecting the geometric coordinates and directions of the experimental approach. Figure 13 illustrates the positioning of the strain gauges used experimentally and their correspondence with the point monitors of the computational model. The average strain of the monitoring points defined in each strain gauge sensor was used to evaluate concrete strains in all computational models.

4.6.1. Slab LS05

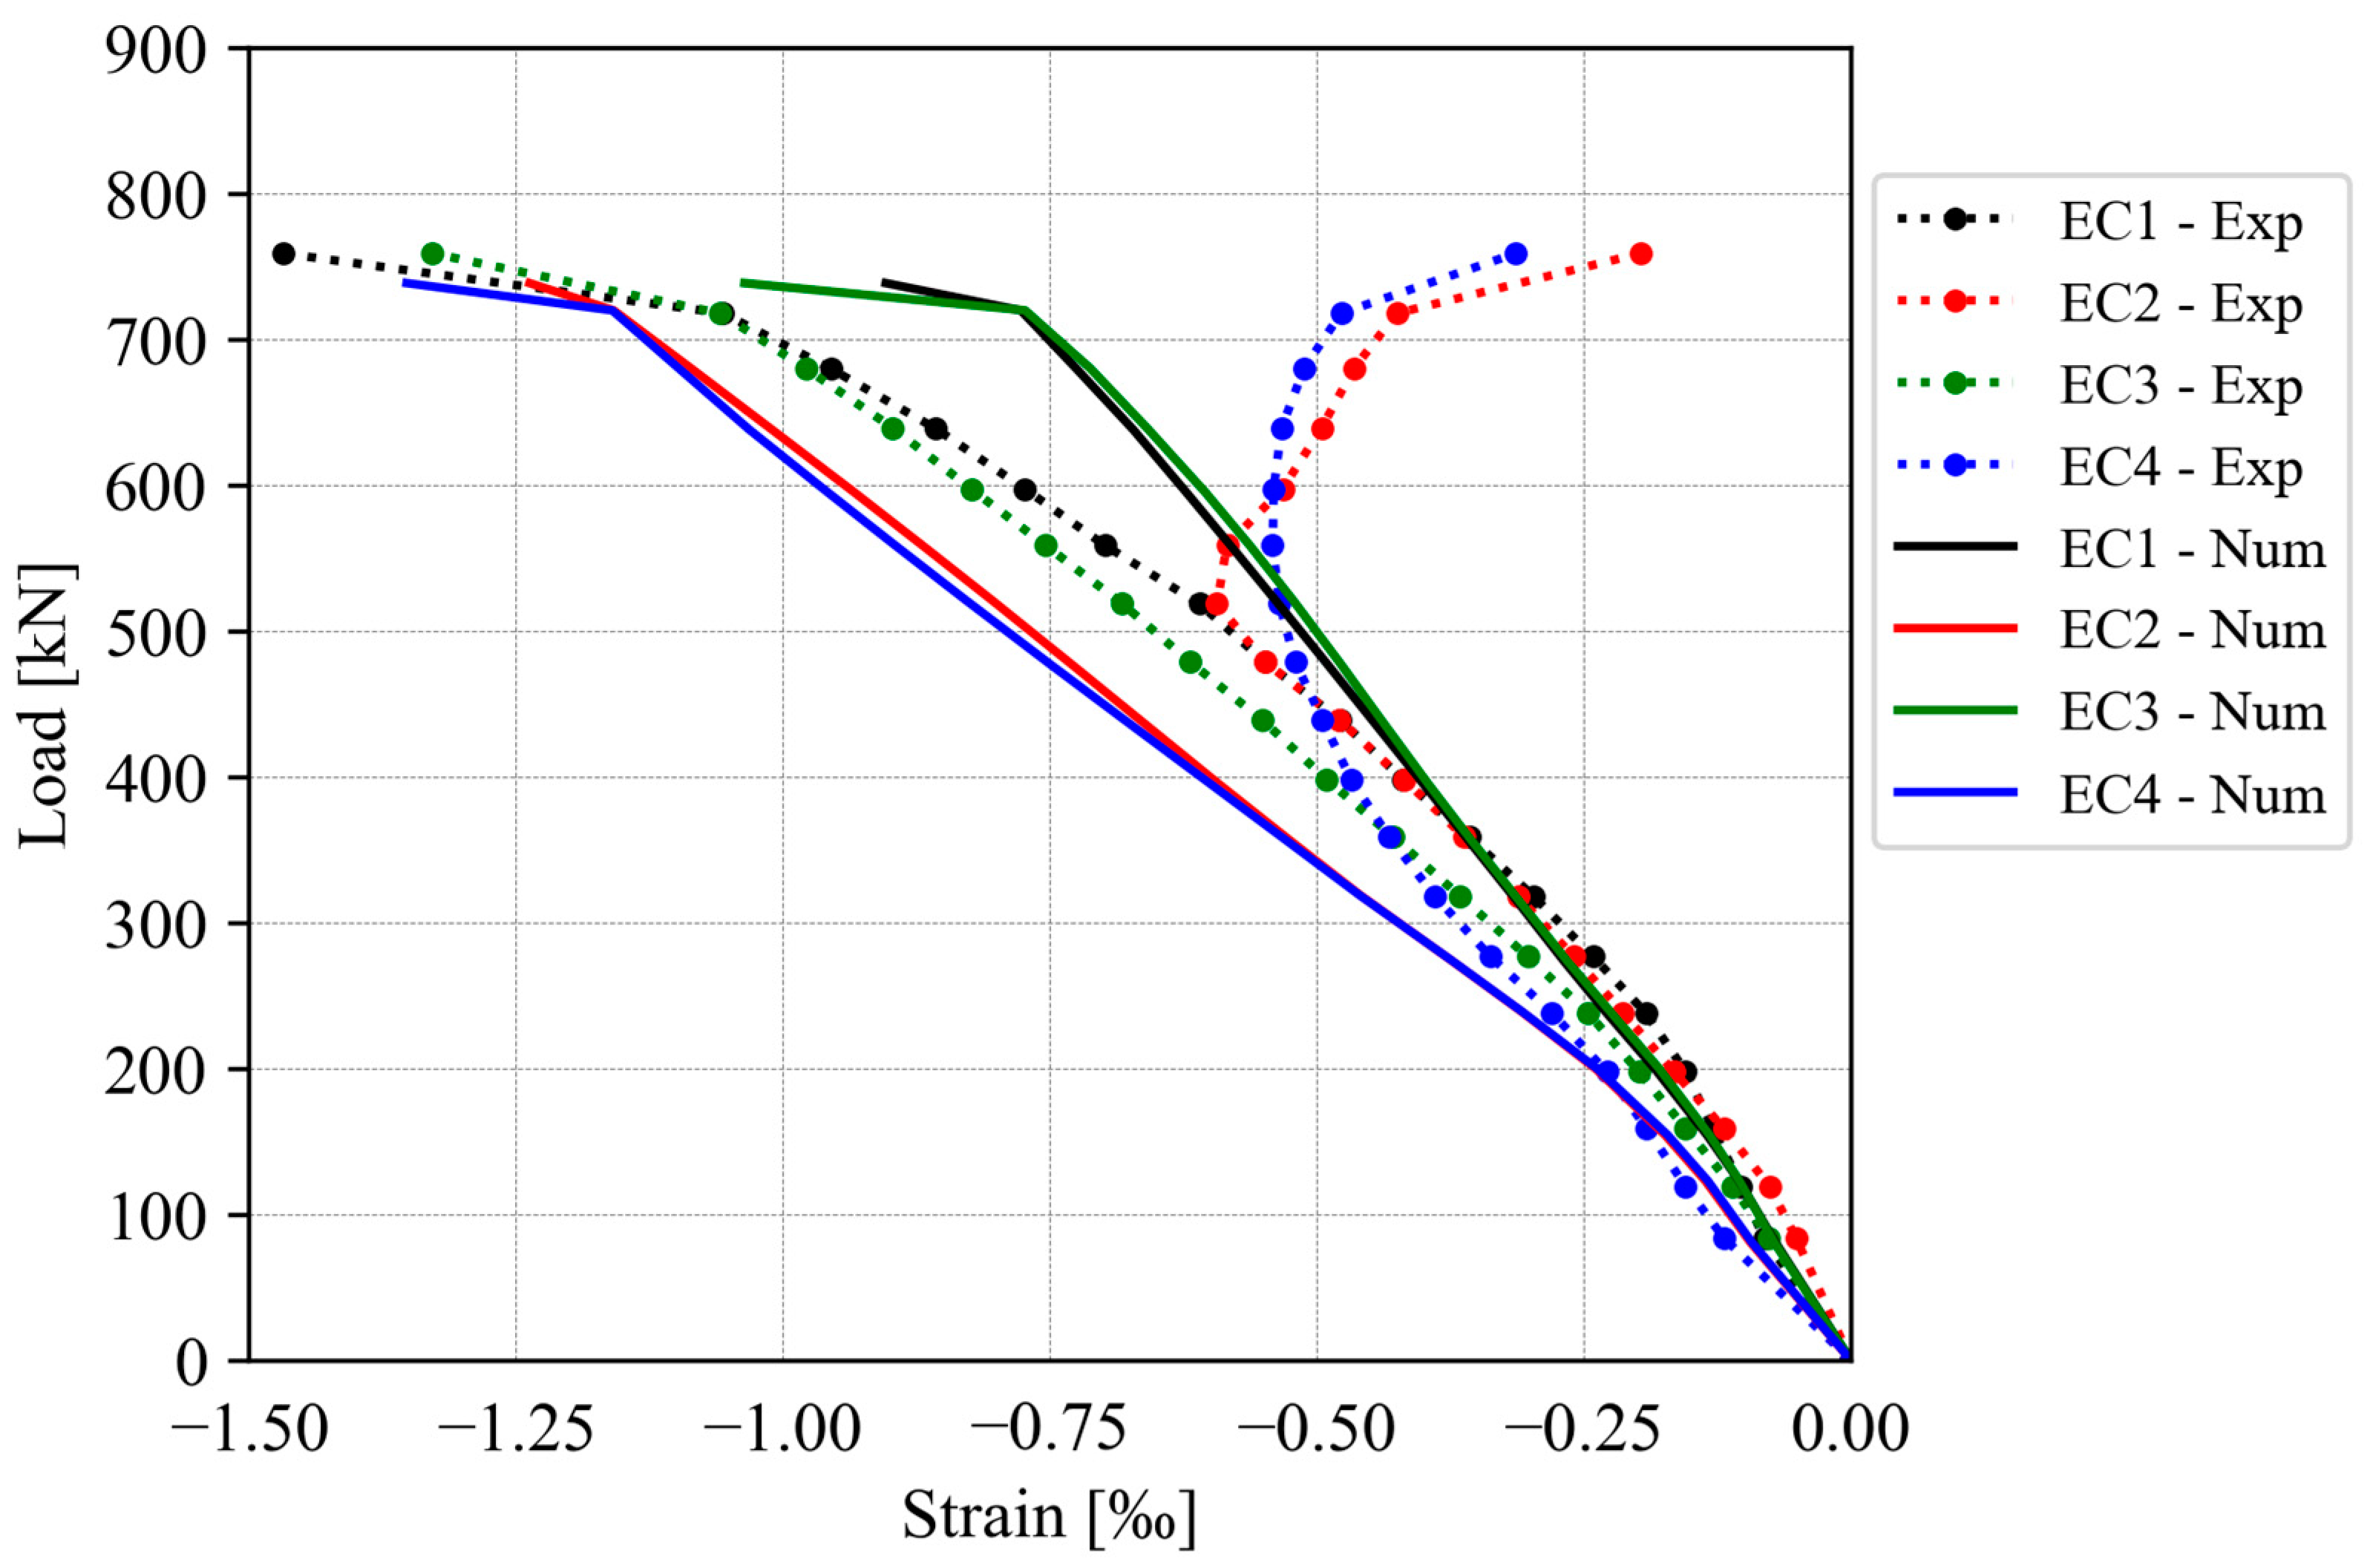
The concrete strains obtained experimentally and computationally for flat slab LS05 are presented in Figure 14. In this figure, sensors EC1 and EC3 indicate that the experimental strains were lower than those in the numerical model. Meanwhile, for sensors EC2 and EC4, the experimental and numerical results were similar, up to a load of 500 kN. After reaching this load value, there was an experimental decrease in strains, which can be attributed to concrete decompression resulting from the stress distribution. This behaviour aligns with findings from Guandalini et al. [27], who identified the development of a flexural curvature close to the column as the cause of this phenomenon.

4.6.2. Slab LS06

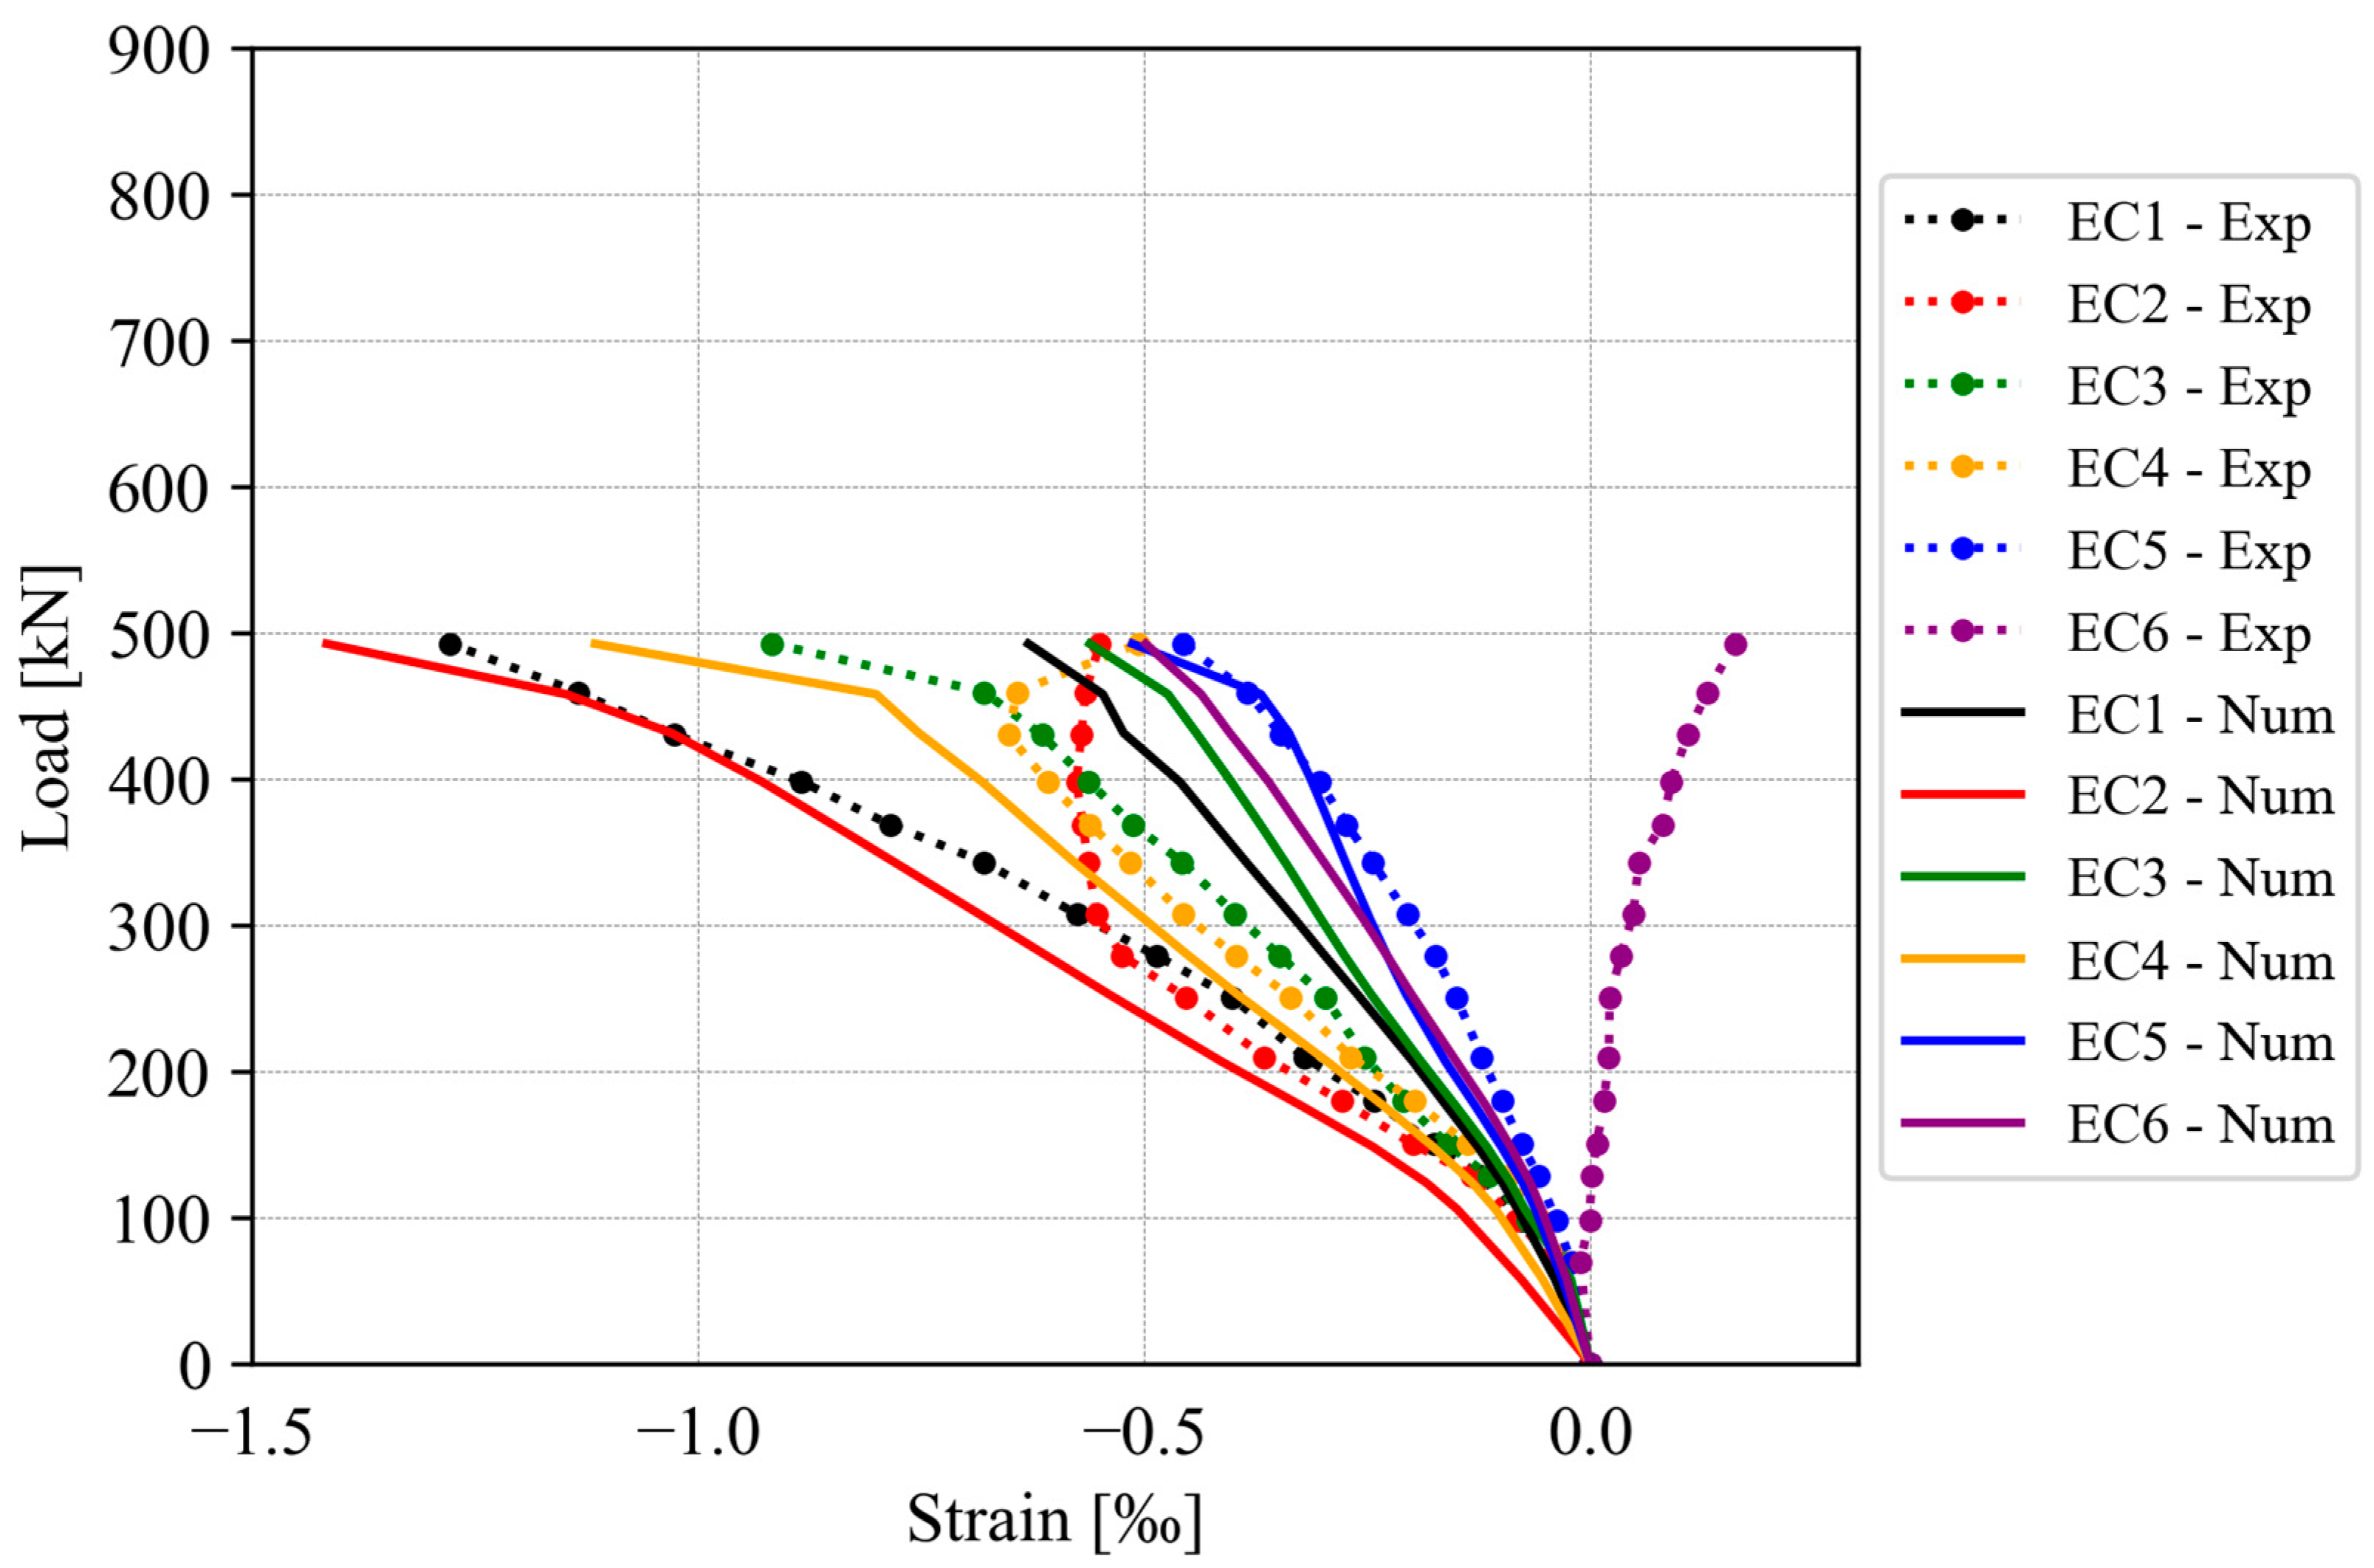
Figure 15 shows the concrete strains for flat slab LS06. As can be seen, the experimental and numerical concrete strain results close to the column (strain gauges EC1 and EC3) presented discrepancies. The experimental values found are up to three times higher than the numerical ones. On the other hand, in the strains recorded by EC2 and EC4 sensors, the numerical results exceeded the experimental ones, with the maximum ratio between them equal to 0.6. A distinct behaviour appears for the EC6 sensor. Tensile strains were measured experimentally, which were not observed in the numerical model. Despite these discrepancies, all values remain within a similar range of variation.
The differences between numerical and experimental results can be attributed to several factors. Among them are the proximity between the strain gauge sensors and the column, the uncertainties associated with the mechanical properties of the material, numerical errors generated from approximations in the analysis of F.E. models, the size and conditions of adherence of the strain gauges during the application of the load, the boundary conditions, and characteristics of the loading process. All aspects evaluated in this section allow us to conclude that the F.E. models developed are valid and capable of adequately representing the mechanical behaviour of smooth slabs subjected to balanced and unbalanced moments.

5. Parametric Study and Design Codes Comparison

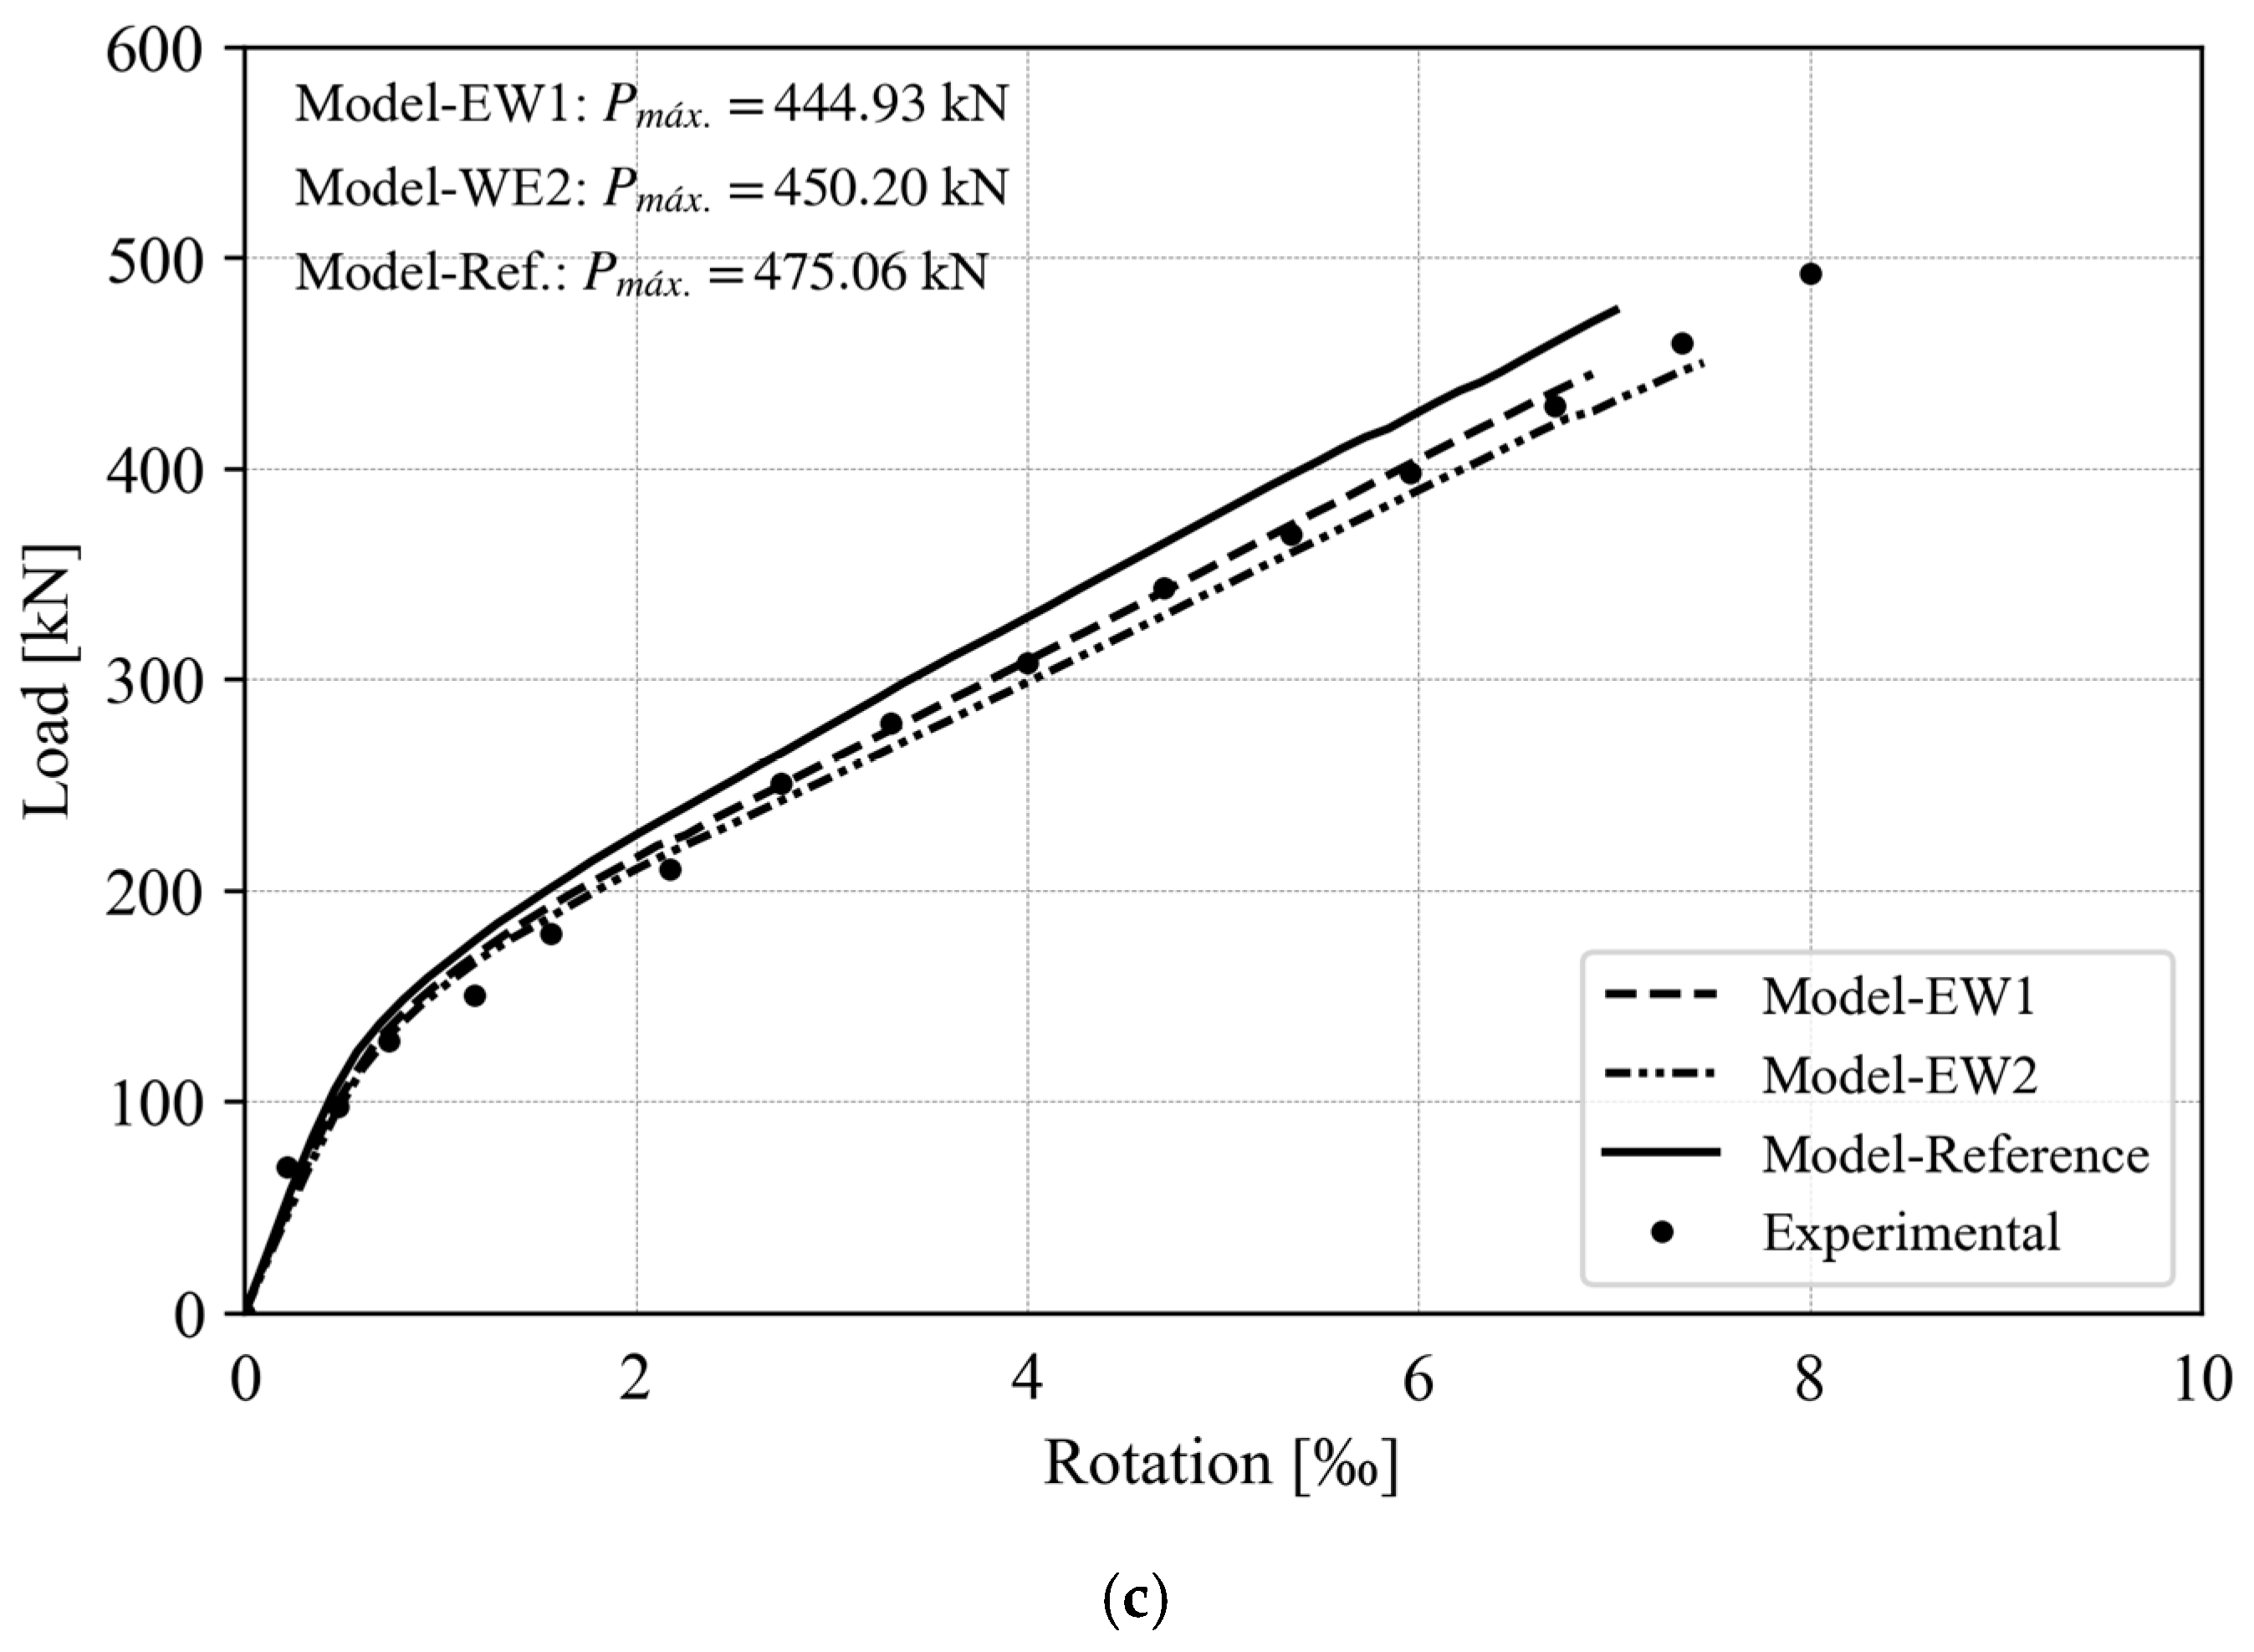
Using the LS06 model (symmetrical model) validated in the previous section, a parametric study was carried out to evaluate the mechanical behaviour of flat slabs subjected to different levels of unbalanced moments, presented in Table 3. Parameters in bold indicate changed values. For models in Group 1, displacements (forces) applied to the rigid plates increased in the north direction. In Group 2, displacements decreased in the south direction. Finally, for Group 3, displacements increased in both the east and west directions.

5.1. Ultimate Shear Forces and Rotations

Table 4 presents the ultimate shear forces and maximum rotations found after introducing unbalanced displacements (Table 3) in the LS06 model.
Compared to the reference model, the F.E. models that experienced either an increase in load in the north direction (Group 1) or a decrease in the south direction (Group 2) (subjected to unbalanced moments of greater magnitude) presented a lower ultimate shear load. The rotations exhibited different responses. In Group 1, there was a decrease in maximum rotation, while in Group 2, there was an increase. However, the maximum rotations were lower than the reference value in both groups. Group 3 exhibited a reduction in the ultimate shear load due to the increased loading in the east and west directions. Nevertheless, the rotation remained close to the reference model.
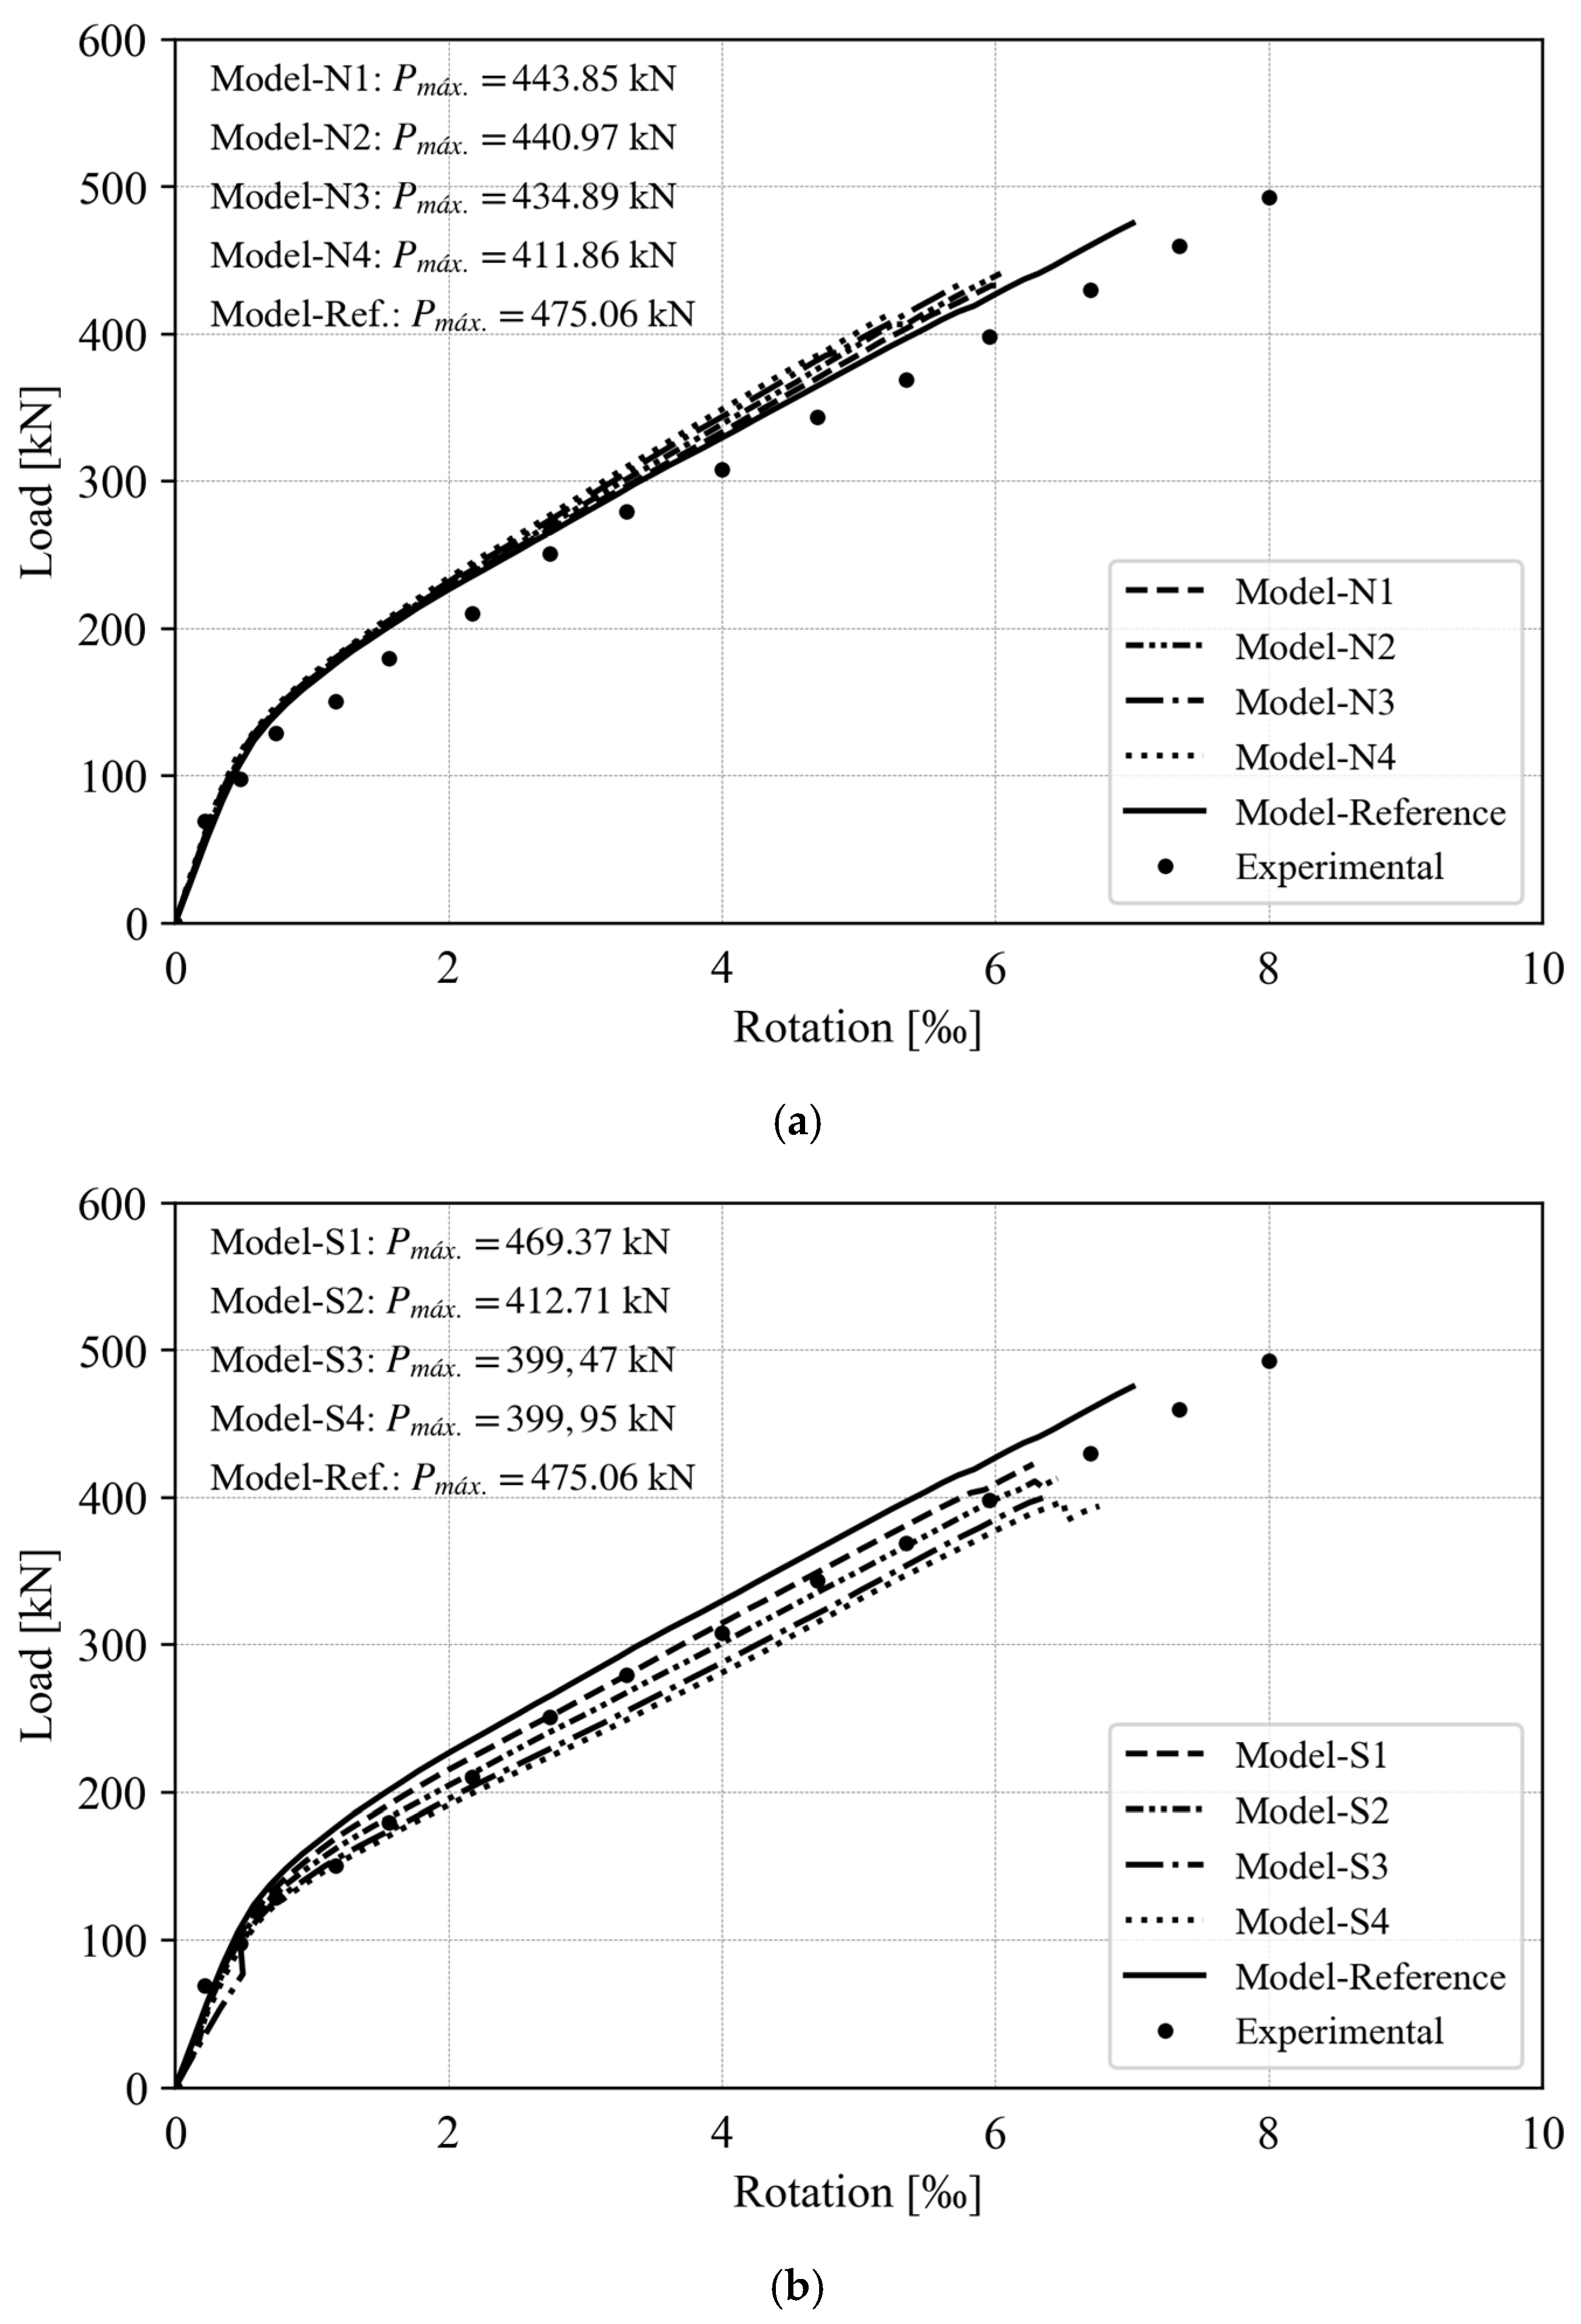
Figure 16 presents the load versus rotation curves obtained by the F.E. models of Groups 1, 2, and 3. The rotations were calculated considering the vertical displacement of the reference points (Figure 3) located in the north direction.
Analysing these results, it can be observed that, in Group 1, the increase in unbalanced bending moments generated by the increase in loads on the rigid plate located in the north direction did not cause significant changes in the stiffness of the structural element. On the other hand, in Group 2, the increase in unbalanced moments reduced the models’ stiffness. Reduced loading in the south direction resulted in less rotation, leading to a more pronounced rotation in the north direction, subsequently diminishing the stiffness of the slab–column connection.

5.2. Cracking Pattern

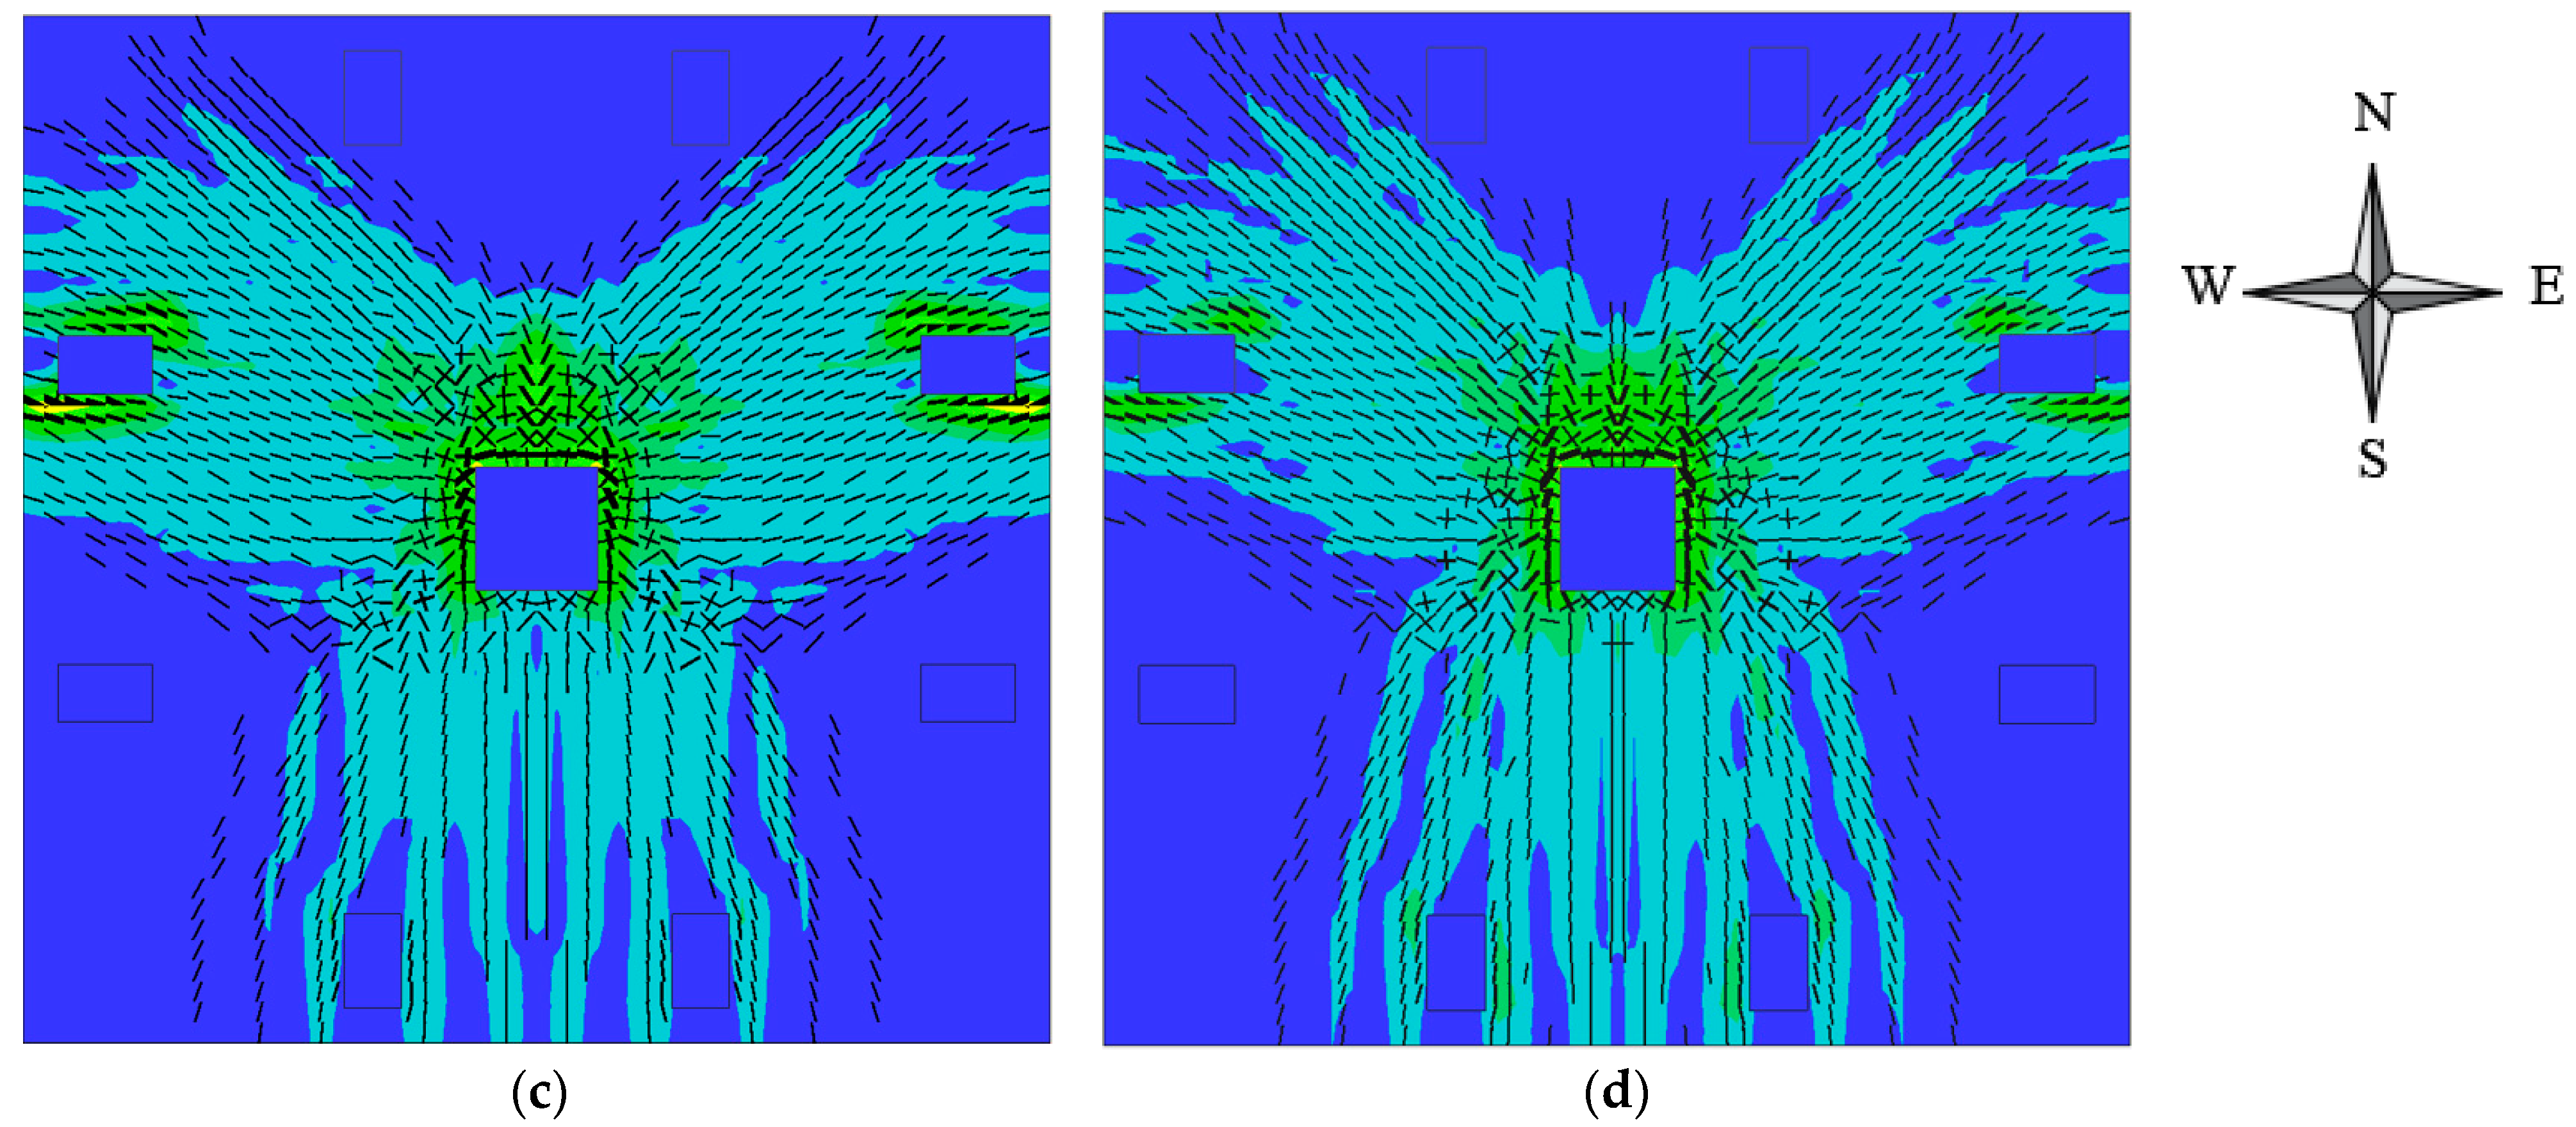
Figure 17 shows that the reference model LS06 and the models N4, S4, and EW2 (Groups 1, 2, and 3, respectively) presented the same cracking pattern. The most notable distinction is the pronounced concentration of cracks surrounding the column, forming a U-shape with its base oriented towards the north.

5.3. Desing Codes Comparison

Table 5 presents the ultimate shear forces for LS06, Group 1, Group 2 and Group 3 flat slab calculated using the guidelines of codes ACI 318 [17], Eurocode 2 [16], Model Code [25], the next generation of Eurocode 2 (FprEN) [28], and the Brazilian code [18]. The equations used in these guidelines codes are presented in Appendix A.
According to these codes, punching shear resistance is influenced by several factors, including the column dimensions, concrete compressive strength, steel tension, and the effective depth of the slab.
The analysis of the control perimeters of each code is based on the evaluation of the applied shear stress (design value) and the shear stress resistance (material parameter). The shear strength is determined based on each slab’s specific characteristics. The design codes specify that the presence of bending moment in the connection between the slab and the column leads to an increase in applied shear stress, potentially increasing the likelihood of punching failure. Moreover, the design codes account for the effects of load eccentricity by applying coefficients to amplify the shear stress, resulting in a conservatively reduced theoretical strength.
The models listed in Table 4 share similar characteristics, including dimensions and mechanical properties. The unique distinction lies in the application of the unbalanced moment, as demonstrated in Table 3. However, they exhibited different collapse loads, ranging from 269.6 kN to 434.6 kN, with an average value of 349.9 kN and a coefficient of variation (C.O.V.) of 16.3%. Slabs subjected to higher unbalanced moments, such as N4 and S4, exhibited lower punching shear strength, as indicated by the design codes.
Based on the design results obtained from the codes, all outcomes were conservative, indicating values lower than those estimated by Groups 1, 2, and 3. Notably, the ACI 318 code [17] provided the lowest values, whereas Eurocode 2 [16] presented the highest values for ultimate load. Except for ACI 318, it was observed that an increase in the unbalanced moment tended to slightly reduce the estimated collapse load across the codes. When comparing slabs N1 and N4, ACI 318 exhibited a 4% increase, while Eurocode 2 demonstrated an 8% decrease.

6. Conclusions and Remarks

The present study evaluated the mechanical behaviour of flat slabs subjected to non-eccentric (balanced moments) and eccentric (unbalanced moments) loads. To achieve this, numerical finite element models were developed using the software GiD [23] and A.T.E.N.A. [24]. These models were then validated against the experimental results from Ferreira et al. [12]. Finally, utilising the validated LS06 model, a parametric study was conducted to assess the mechanical behaviour of flat slabs under various levels of unbalanced moments. Some points to highlight:
  • The numerical results of both loading cases (non-eccentric and eccentric) agreed well with the experimental results. The most significant discrepancy between the ultimate experimental and computational shear forces was 11%, referring to the LS06 model (eccentric load) with one plane of symmetry.
  • Regarding cracking, all F.E. models exhibited cracking patterns identical to those found experimentally by the reference authors.
  • The strains in the concrete slab were the parameters that showed the most significant discrepancies. Such differences can be attributed to several factors, including the proximity between the strain gauge sensors and the column, uncertainties associated with the mechanical properties of the material, numerical errors generated from approximations in the analysis of F.E. models, the size and conditions of adherence of the strain gauges during the application of the load, the boundary conditions, and characteristics of the loading process.
  • All aspects allow us to conclude that the F.E. models developed are valid and capable of adequately representing the mechanical behaviour of smooth slabs subjected to balanced and unbalanced moments.
  • The parametric study results confirmed that the increase in the unbalanced moment negatively impacts the punching strength of the slab–column connections.
  • In summary, the unbalanced moment results in an increase in shear stress in the slab–column connection, a phenomenon observed by all numerical models in Groups 1, 2, and 3, and corroborated by the design codes.

Author Contributions

R.P.M.: Conceptualisation, Methodology. Software. Validation. L.C.M.: Formal analysis, Writing—original draft. M.P.F.: Investigation, Data Curation. L.M.T.: Validation, Writing—review & editing. M.T.M.: Supervision, Writing—review & editing. M.G.M.: Supervision, Resources, Funding acquisition. All authors have read and agreed to the published version of the manuscript.

Funding

National Council for Scientific and Technological Development, CNPq (Brazil)—Funding code 001.

Data Availability Statement

Some or all data, models, or code that support the findings of this study are available from the corresponding author upon reasonable request. The possible data to be provided are: Extra data about numerical models, Numerical model figures and Complete design carried out according to codes.

Acknowledgments

The authors would like to thank the Institutional Scientific Initiation Scholarship Program, PIBIC UFV CNPq 2022–2023, for the scholarship received by the first author.

Conflicts of Interest

The authors declare that they have no known competing financial interests or personal relationships that could have appeared to influence the work reported in this paper.

Appendix A. Punching Shear Provisions in Design Codes

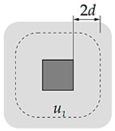
The punching shear provisions of the Brazilian code are also based on the fib Model Code 2010 [25]. Hence, the calculation equations are similar to Eurocode 2 [16]. The code uses the partial safety factors γ c = 1.4 and γ s = 1.15 to compute the shear stress resistance. Unlike Eurocode 2, the size effect factor is not restricted in NBR 6118 [18] equations (refer to Table A1), where u i is the critical perimeter in which the stress is considered, could be u 0 , u 1 or u o u t .
If shear reinforcement is required, an additional verification must be conducted at the perimeter outside of the shear reinforcement u o u t located at a distance of 2 d from the last layer of shear reinforcement, and 2 d is set as the maximum tangential spacing s c between two lines of shear reinforcement elements, otherwise, a discontinuous perimeter must be considered as shown in Table A1. The yield strength of the shear reinforcement is calculated as follows for studs:
f y w k = m i n 345   M P a ;   f y k
Table A1. Punching shear equations of NBR 6118 [18].
Crushing of compression strut:
τ R d 2 = 0.27 γ c 1 f c k 250 f c k
Diagonal tension:
τ R d 1 = 0.182 γ c 1 + 200 d ( 100 ρ f c k ) 1 / 3
Examples of control perimeters:
Buildings 14 00985 i001
The punching shear provisions of Eurocode 2 [16] are based on the empirical calculation methods introduced in the fib Model Code 2010 [25]. The code adopts the partial safety factors γ c = 1.5 and γ s = 1.15 for concrete and reinforcing steel to estimate the shear stress resistance. The critical perimeter u i is defined depending on the verification. To verify the strength of the compression strut, the control perimeter coincides with the column edges. For the diagonal tension verification, the control perimeter is defined at 2 d of the loaded area with rounded corners.
Table A2 presents the Eurocode 2 [16] equations for punching shear. The parameters to determine the design punching shear stress resistance are listed in the following: f c k , characteristic compression strength in MPa; ρ , longitudinal reinforcement ratio, limited to 0.02%; and ξ , size effect factor, expressed by:
ξ = 1 + 200 d   2   ( w i t h   d   i n   m m )
If shear reinforcement is provided, the punching shear stress resistance depends on the following variables: s r is the spacing of shear reinforcement, limited to 0.75 d ; A w s is the area of one perimeter of shear reinforcement around the column; α is the angle between the shear reinforcement and the horizontal plane of the slab; and f y w k is the characteristic yield stress of shear reinforcement, limited to 1.15 250 + 0.25 d M P a .
When shear reinforcement is provided, an additional verification must be conducted at the perimeter outside of the shear reinforcement ( u o u t ) located at a distance of 1.5 d from the last layer of shear reinforcement, with a maximum effective distance between two shear reinforcing elements of 2 d .
Table A2. Punching shear equations of Eurocode 2 [16].
Crushing of compression strut:
v R d , m a x = 0.24 γ c 1 f c k 250 f c k
Diagonal tension:
v R d , c = m a x 0.18 γ c ξ ( 100 ρ f c k ) 1 / 3 0.0525 γ c ξ 3 f c k
Example of control perimeter:
Buildings 14 00985 i002
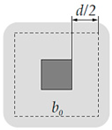
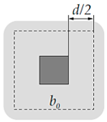
The punching shear provisions of ACI 318 [17] are based on the empirical equation. The American code included a size effect factor based on the work developed by Dönmez & Bažant. The perimeter of the critical section b 0 is defined at 0.5 d and it is constructed by straight lines for square and rectangular columns. As shown in Table A3, the stress corresponding to the nominal shear strength is expressed as a function of the following variables: f c is the specified compression strength; ϕ is the strength reduction factor, equals to 0.75 for shear verification; αs is the parameter that accounts for the column location equals to 40 for internal columns; β is the ratio of long to short sides of the column; and λ s is the size effect factor, expressed by:
λ s = 2 1 + 0.004 · d     1.0   w i t h   d   i n   m m
The contribution of shear reinforcement is function of the following variables: s is the spacing of shear reinforcement, limited to 0.5 d ; A v is the sum of all studs or stirrups leg within a line geometrically similar to the perimeter of the column section; and f y t is the characteristic yield stress of shear reinforcement, limited to 420 MPa.
For the slab with shear reinforcement, the nominal shear stress must be verified at the perimeter bout, located at a distance of d / 2 from the last line of shear reinforcement.
Table A3. Punching shear equations of ACI 318 [17].
Stress corresponding to the nominal shear strength without shear reinforcement:
v c = m i n ϕ · 0.33 λ s f c   ϕ · 0.17 1 + 2 β · λ s f c   ϕ · 0.083 · 2 + α s · d b 0 · λ s f c ( i n   S . I .   u n i t s ;   M P a ,   m m )
Examples of control perimeters:
Buildings 14 00985 i003
The fib Model Code 2010 [25] provisions for punching shear are based on the C.S.C.T. According to this mechanical model, the shear strength capacity is governed by slab rotation. The shear design force V E d acts on the basic control perimeter b 1 at 0.5 d v from the loaded area, where dv is the effective depth of the slab (usually d v = d ). The equations are summarised in Table A4.
The punching shear resistance is expressed as a function of the following parameters: γ c is the partial safety factor, equals to 1.5; and b 0 is the reduced control perimeter, obtained by multiplying the basic control perimeter by the parameter k e , which is defined as:
k e = 1 1 + e u b u
where e u is the eccentricity of the resultant of shear forces with respect to the centroid of the basic control perimeter and b u is the diameter of a circle with the same surface as the region inside the basic control perimeter: k s y s is the coefficient that depends on the performance of the punching shear reinforcing system. For cases where the lateral stability does not depend on the frame action of slabs and columns and where the adjacent span does not differ in length by more than 25%, the following approximated values may be adopted for the coefficient k e = 0.90 for inner columns; and k ψ is the parameter expressed as a function of the slab rotation and maximum aggregate size d g .
The following parameters control the contribution of shear reinforcement: A s w is the sum of the cross-sectional area of the reinforcement within the zone bounded by 0.35 d v to dv from the edge of the column; α is the angle between the shear reinforcement and the horizontal plane of the slab; and σ s w d is the stress that is activated in the shear reinforcement, calculated as:
σ s w d = E s ψ 6 · sin α + cos α · sin α + f b d f y w d d ϕ w f y w d
where E s is the steel Young modulus of shear reinforcement, ϕ w diameter of the shear reinforcement, f y w d is the yield strength of shear reinforcement, and f b d is the bond strength. When shear reinforcement is provided, an additional verification must be conducted at the perimeter outside of the shear reinforcement b 0 , o u t located at a distance of 0.5 d beyond the outer layer of reinforcement, and 3 d is considered as the maximum distance between two shear reinforcement bars.
The slab rotation can be calculated by different approximation levels (LoA), considering that every level of approximation represents a different grade of precision. The following expression for the level of approximation II (LoA II), recommended for design situations. The LoA II is the most used and widely adopted model in research involving the comparison of experimental and numerical models with results estimated by the fib Model Code 2010 [25].
ψ = 1.5 · r s d · f y d E s · m E d m R d 1.5 ( L e v e l   I I )
where, r s is the distance from the column axis to the line of contra flexure of the radial bending moments; m R d is the design average flexural strength per unit length in the support strip, b s = 1.5 r s , x r s , y 1 / 2 , defined by Equation (A7), and m E d is the average moment per unit length for calculation of the flexural reinforcement in the support strip, which can be approximated depending on the support type. For inner columns m E d can be estimated by Equation (A8).
m R d = ρ · f y d · d 2 · 1 ρ · f y d γ c 2 · f c k
m E d = V E d · 1 8 + e u , i 2 · b s
Table A4. Punching shear equations of fib Model Code 2010 [25].
Maximum shear force resistance:
V R d , m a x = m i n k s y s · k ψ , d , 1 f c k γ c b 0.5 d v   f c k γ c b 0.5 d v  
without shear reinforcement:
V R d , c = k ψ , d , 1 f c k γ c b 0.5 d v  
Examples of control perimeters:
Buildings 14 00985 i004

References

  1. Sagaseta, J.; Muttoni, A.; Ruiz, M.F.; Tassinari, L. Non-Axis-Symmetrical Punching Shear around Internal Columns of RC Slabs without Transverse Reinforcement. Mag. Concr. Res. 2011, 63, 441–457. [Google Scholar] [CrossRef]
  2. Durucan, C.; Anil, Ö. Effect of Opening Size and Location on the Punching Shear Behavior of Interior Slab-Column Connections Strengthened with CFRP Strips. Eng. Struct. 2015, 105, 22–36. [Google Scholar] [CrossRef]
  3. Ismail, E.S.I.M. Non-Linear Finite Element Analysis of Reinforced Concrete Flat Plates with Opening Adjacent to Column under Eccentric Punching Loads. HBRC J. 2018, 14, 438–449. [Google Scholar] [CrossRef]
  4. Živković, S.; Bešević, M.; Purčar, M.V.; Kozarić, L. Nonlinear Finite Element Analysis of Punching Shear Strength of Eccentrically Loaded RC Flat Slabs with Opening. KSCE J. Civ. Eng. 2019, 23, 4771–4780. [Google Scholar] [CrossRef]
  5. Marques, M.G.; Liberati, E.A.P.; Pimentel, M.J.; de Souza, R.A.; Trautwein, L.M. Nonlinear Finite Element Analysis (NLFEA) of Reinforced Concrete Flat Slabs with Holes. Structures 2020, 27, 1–11. [Google Scholar] [CrossRef]
  6. Bursać, S.; Bešević, M.; Vojnić Purčar, M.; Kozarić, L.; Đurić, N. Experimental Analysis of Punching Shear Strength of Eccentrically Loaded Slab with the Opening along the Face of the Internal Column. Eng. Struct. 2021, 249, 113359. [Google Scholar] [CrossRef]
  7. Ungermann, J.; Schmidt, P.; Christou, G.; Hegger, J. Eccentric Punching Tests on Column Bases—Influence of Column Geometry. Struct. Concr. 2022, 23, 1316–1332. [Google Scholar] [CrossRef]
  8. Vargas, D.; Lantsoght, E.O.L.; Genikomsou, A.S. Flat Slabs in Eccentric Punching Shear: Experimental Database and Code Analysis. Buildings 2022, 12, 2092. [Google Scholar] [CrossRef]
  9. Aguiar, A.; Oliveira, D.; Reis, L.; Nzambi, A. Punching Shear Strength of Waffle Flat Slabs with Opening Adjacent to Elongated Columns. Eng. Struct. 2021, 243, 112641. [Google Scholar] [CrossRef]
  10. Brigo, H.; Ashihara, L.J.; Marques, M.G.; Liberati, E.A.P. Non-Linear Analysis of Flat Slabs Prestressed with Unbonded Tendons Submitted to Punching Shear. Buildings 2023, 13, 923. [Google Scholar] [CrossRef]
  11. Krüger, G.; Burdet, O.; Favre, R. Punching Strength of R.C. Flat Slabs with Moment Transfer; International Workshop on Punching Shear: Stockholm, Sweden, 2000; pp. 1–8. [Google Scholar]
  12. Ferreira, M.d.P.; Oliveira, M.H.; Melo, G.S.S.A. Tests on the Punching Resistance of Flat Slabs with Unbalanced Moments. Eng. Struct. 2019, 196, 109311. [Google Scholar] [CrossRef]
  13. Secci, L.; Lapi, M.; Teoni, E.; Pinho Ramos, A.; Orlando, M. Eccentric Punching Strength of Continuous Flat Slabs—Analysis of Different Experimental Setups. Struct. Concr. 2021, 22, 1183–1204. [Google Scholar] [CrossRef]
  14. Al-Bayati, A.F.; Lau, T.L.; Clark, L.A. Punching Shear Design of Waffle Slabs at Internal Column Connections. Pract. Period. Struct. Des. Constr. 2023, 28, 1–8. [Google Scholar] [CrossRef]
  15. El-Naqeeb, M.H.; Abdelwahed, B.S. Numerical Assessment of Punching Shear Strength of Eccentrically Loaded Footings with Nonconventional Shear Reinforcement. Structures 2023, 49, 716–729. [Google Scholar] [CrossRef]
  16. European Committee for Standardization. Eurocode 2—Design of Concrete Structures of Concrete Part 1: General and for Buildings Rules; European Committee for Standardization: Brussels, Belgium, 2004. [Google Scholar]
  17. American Concrete Institute. 318-19 Building Code Requirements for Structural Concrete and Commentary; American Concrete Institute: Indianapolis, IN, USA, 2019; ISBN 9781641950565. [Google Scholar]
  18. Associação Brasileira de Normas Técnicas. NBR 6118—Projeto de Estruturas de Concreto; Associação Brasileira de Normas Técnicas: Rio de Janeiro, Brazil, 2014; p. 238. [Google Scholar]
  19. Obaidat, Y.T.; Barham, W.; Obaidat, A.T.; Al-Khazaaleh, N.A.A. Modeling of Confined Circular RC Columns Using Artificial Neural Network and Finite Element Method. Structures 2022, 40, 74–87. [Google Scholar] [CrossRef]
  20. Yang, J.; Xia, J.; Zhang, Z.; Zou, Y.; Wang, Z.; Zhou, J. Experimental and Numerical Investigations on the Mechanical Behavior of Reinforced Concrete Arches Strengthened with UHPC Subjected to Asymmetric Load. Structures 2022, 39, 1158–1175. [Google Scholar] [CrossRef]
  21. Aghani, K.; Afshin, H.; Abedi, K. Finite Element-Based Prediction of the Long-Term Deflection of Reinforced Concrete Beams Strengthened with Prestressed Fiber-Reinforced Polymers. Structures 2022, 43, 358–373. [Google Scholar] [CrossRef]
  22. da Paz, G.L.G.; Marques, M.G.; Ruas, S.R.C. Numerical Analysis of Reinforced Concrete Columns Strengthened with Sleeve Wedge Bolts and a Self Compacting Concrete Layer. Structures 2022, 43, 726–737. [Google Scholar] [CrossRef]
  23. CIMNE GiD—The Personal Pre and Post Processor 2020. Available online: https://edisciplinas.usp.br/mod/url/view.php?id=3168131 (accessed on 30 March 2024).
  24. Cervenka Consulting ATENA—Computer Program for Nonlinear Finite Element Analysis of Reinforced Concrete Structures 2023. Available online: https://www.cervenka.cz/products/atena/ (accessed on 30 March 2024).
  25. Fédération Internationale du Béton. Model Code 2010; FIB Bulletins; FIB. The International Federation for Structural Concrete: Lausanne, Switzerland, 2010; ISBN 978-2-88394-095-6. [Google Scholar]
  26. de Boer, A.; Hendriks, M.; Uijl, J.; Belletti, B.; Damoni, C. Nonlinear FEA Guideline for Modelling of Concrete Infrastructure Objects. In Computational Modelling of Concrete Structures; CRC Press: Boca Raton, FL, USA, 2014; Volume 2, pp. 977–985. ISBN 9781138026421. [Google Scholar]
  27. Guandalini, S.; Burdet, O.L.; Muttoni, A. Punching Tests of Slabs with Low Reinforcement Ratios. ACI Struct. J. 2009, 106, 87–95. [Google Scholar] [CrossRef]
  28. European Committee for Standardization. FprEN 1992-1-1—Eurocode 2. Design of Concrete Structures—Part 1-1: General Rules—Rules for Buildings, Bridges and Civil Engineering Structures; European Committee for Standardization: Brussels, Belgium, 2021. [Google Scholar]
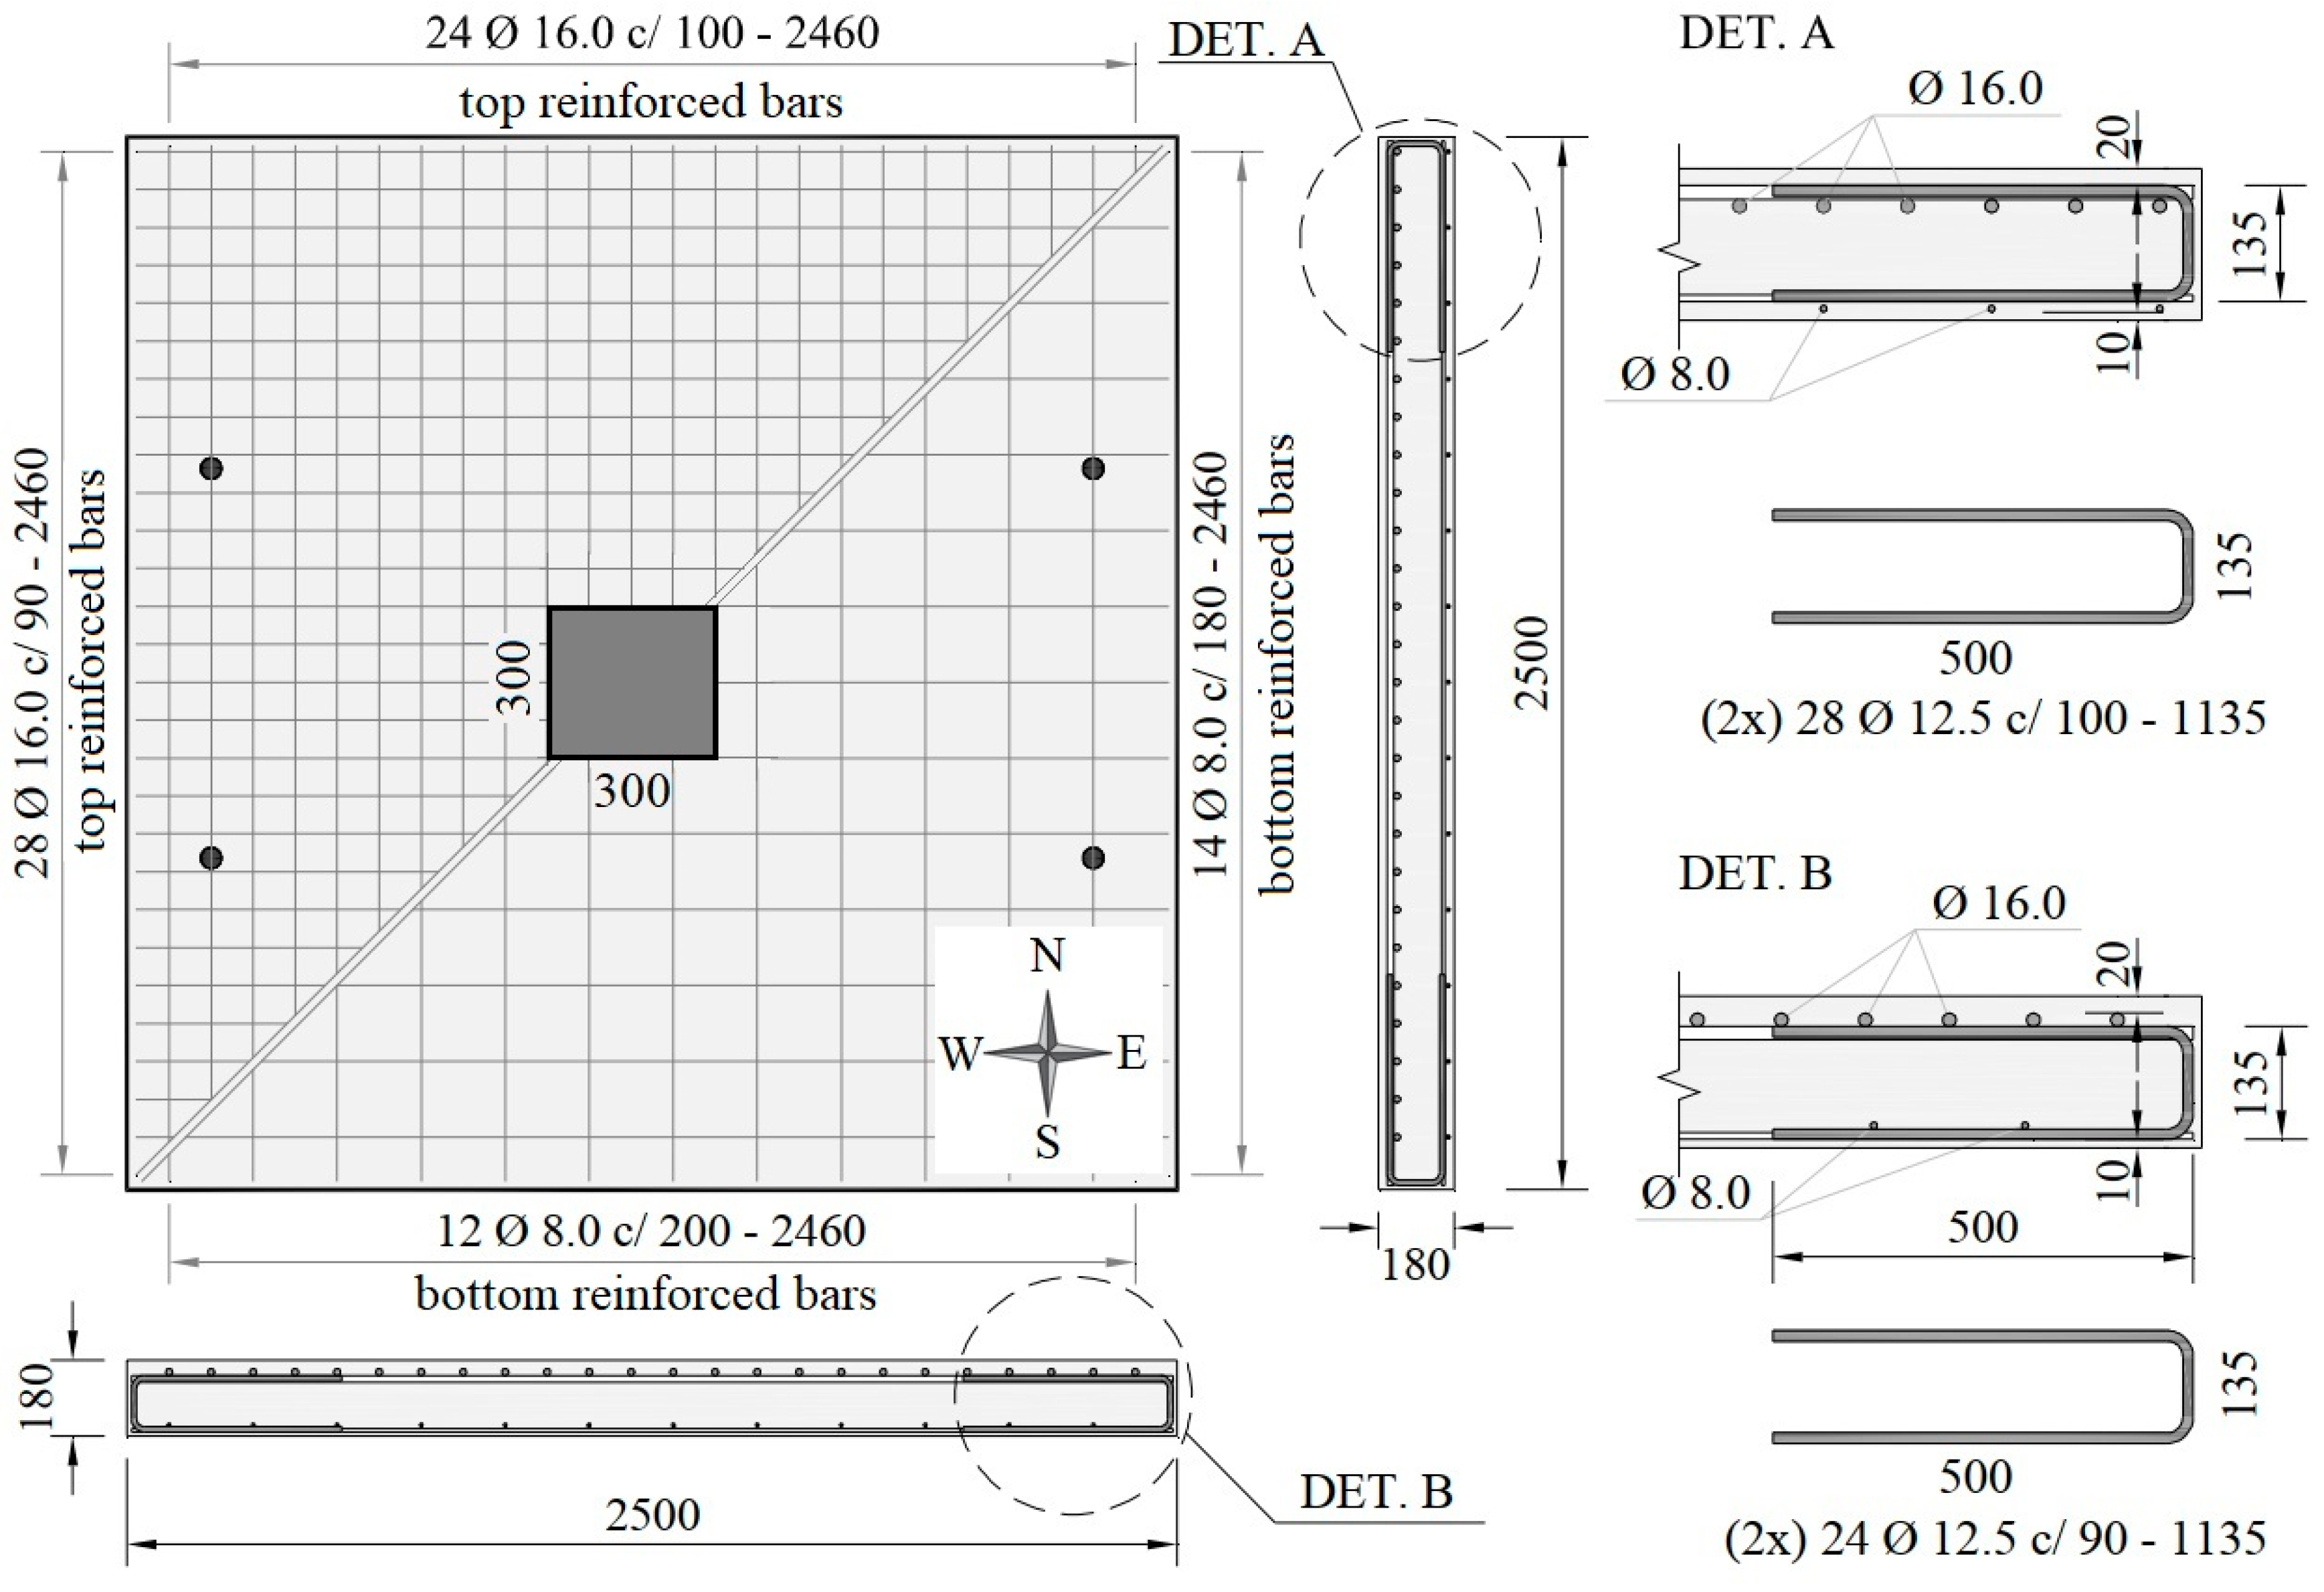
Figure 1. Geometry and detailing of the flexural reinforcement of slabs LS05 and LS06. Reprinted with permission from Ref. [12].
Buildings 14 00985 g001
Figure 2. Test system (superior view) as adopted by Ferreira et al. Reprinted with permission from Ref. [12].
Buildings 14 00985 g002
Figure 3. Boundary conditions of the computational model of slab LS05.
Buildings 14 00985 g003
Figure 4. Position of the hydraulic jacks and vertical displacements measuring points on the slabs.
Buildings 14 00985 g004
Figure 5. Mesh adopted for (a) LS06 model without the symmetry plane, (b) LS06 model with one symmetry plane, and (c) LS05 model.
Buildings 14 00985 g005aBuildings 14 00985 g005b
Figure 6. Load vs. rotation results for the LS05 slab considering the four different concrete mechanical parameter scenarios.
Buildings 14 00985 g006
Figure 7. Load vs. rotation results for the LS06 slab considering two different configurations.
Buildings 14 00985 g007
Figure 8. Cracking patterns obtained experimentally (a) and numerically (b) for the LS05 model. In (c), lateral cracks on the north–south symmetry plane are presented. In (d), lateral cracks on the east–west symmetry plane are shown.
Buildings 14 00985 g008
Figure 9. Cracking patterns obtained experimentally (a) and numerically (b) for the LS06 model. In (c), lateral cracks on the north–south symmetry plane are presented. In (d), lateral cracks on the east–west symmetry plane are shown.
Buildings 14 00985 g009
Figure 10. Position of strain gauge sensors.
Buildings 14 00985 g010
Figure 11. Strains in reinforcement steel bars for flat slab LS05.
Buildings 14 00985 g011
Figure 12. Strains in reinforcement steel bars for flat slab LS06.
Buildings 14 00985 g012
Figure 13. Positions of strain gauges sensors and strain monitors on the concrete slab.
Buildings 14 00985 g013
Figure 14. Strains in concrete flat slab for LS04 model.
Buildings 14 00985 g014
Figure 15. Strains in concrete flat slab for LS06 model.
Buildings 14 00985 g015
Figure 16. Load versus rotation curves for (a) Group 1, (b) Group 2, and (c) Group 3.
Buildings 14 00985 g016aBuildings 14 00985 g016b
Figure 17. Cracking patterns observed in models (a) LS06, (b) N4, (c) S4, and (d) EW2 when subjected to the ultimate shear force.
Buildings 14 00985 g017aBuildings 14 00985 g017b
Table 1. Displacement increments used in the computational analysis of the LS06 model.
Load
Step
Experimental ResponseDisplacement Increment
(Each Rigid Plate—Figure 4)
Jack 01
L1 (kN)
Jack 02
L2 (kN)
Jack 03
L3 (kN)
Jack 04
L4 (kN)
Total Load
TL (kN)
L1/TLL2/TLL3/TLL4/TL
112.53.88.07.469.20.0900.0270.0580.053
224.16.015.115.398.00.1230.0310.0770.078
336.19.522.622.9128.60.1400.0370.0880.089
448.012.029.929.8157.20.1530.0380.0950.095
559.915.037.237.4187.00.1600.0400.0990.100
672.118.044.844.6217.00.1660.0410.1030.103
783.821.554.753.2250.70.1670.0430.1090.106
896.825.060.059.8279.10.1730.0450.1070.107
9107.927.367.467.5307.60.1750.0440.1100.110
10121.032.076.776.0343.20.1760.0470.1120.111
11132.233.083.083.0368.70.1790.0450.1130.113
12144.136.590.090.0398.10.1810.0460.1130.113
13156.739.598.498.0430.10.1820.0460.1140.114
14168.542.5105.1105.8459.40.1830.0460.1140.115
15181.047.5112.5114.0492.50.1840.0480.1140.116
Mean displacement of each hydraulic jack [mm]0.1630.0420.1030.103
Table 2. Comparison between collapse loads and rotations obtained experimentally and by F.E. models.
Model V e   k N V n   k N V e / V n Ψ e   [ ] Ψ n   [ ] Ψ e / Ψ n
LS05779.0735.61.069.7610.620.92
LS06 (symmetrical model)528.0475.11.118.617.001.23
LS06 (complete model)528.0480.41.108.616.501.32
Note: V e represents the ultimate shear force obtained experimentally, V n is the ultimate shear force determined through F.E. models, Ψ e denotes the rotation measured in experimental tests, and Ψ n indicates the rotation derived from numerical models.
Table 3. F.E. models and unbalanced displacements evaluated in the parametric study.
PositionMean Value (1) Group 1Group 2Group 3
N1N2N3N4S1S2S3S4EW1EW2
North0.1630.1700.1800.1900.2000.1630.1630.1630.1630.1630.163
South0.0420.0420.0420.0420.0420.0300.0200.0100.0050.0420.042
East/West0.1030.1030.1030.1030.1030.1030.1030.1030.1030.1200.130
(1) Mean displacement of each hydraulic jack [mm] as shown in Table 1.
Table 4. Ultimate shear forces and maximum rotations.
Model V n [kN] V r e f / V n Ψ n   [ ] Ψ r e f / Ψ n
Group 1N1443.851.076.271.12
N2440.971.086.041.16
N3434.891.095.771.21
N4411.861.155.201.35
Group 2S1469.371.016.281.12
S2412.711.156.451.09
S3399.471.196.501.08
S4393.951.216.761.04
Group 3EW1444.931.076.891.02
EW2450.201.067.460.94
Note: V r e f represents the ultimate shear force obtained from reference F.E. model equal to 475.06 kN (Table 2), V n is the ultimate shear force determined through new F.E. models, Ψ r e f denotes the rotation measured using reference F.E. model equal to 7.0 ‰ (Table 2), and Ψ n indicates the rotation derived from new numerical models.
Table 5. Ultimate shear forces for LS06, Group 1, Group 2 and Group 3 slab based on design codes.
PmáxACI 318Pmáx/
PACI
Eurocode 2Pmáx/
PEC2
Model CodePmáx/
PMC
FprENPmáx/
PFprEN
ABNT NBR 6118Pmáx/
PNBR
Experimental Test528.0354.21.49416.61.27258.92.04404.91.30300.81.76
LS06 (symmetrical model)475.1354.21.49416.61.27288.71.83333.01.59300.81.76
N1443.9277.91.60426.41.04352.51.26338.41.31307.91.44
N2441.0278.91.58415.11.06336.51.31336.81.31299.81.47
N3434.9281.01.55404.41.08323.61.34335.21.30292.11.49
N4411.9289.21.42394.21.04322.51.28333.51.23284.71.45
S1469.4269.61.74420.71.12327.51.43353.41.33303.81.54
S2412.7288.91.43409.71.01346.51.19351.31.17295.91.39
S3399.5293.81.36399.31.00338.81.18349.21.14288.41.39
S4394.0295.91.33394.21.00334.51.18350.21.12284.71.38
EW1444.9277.61.60389.51.14294.71.51351.21.27281.31.58
EW2450.2275.81.63434.61.04361.61.25383.41.17313.91.43
Disclaimer/Publisher’s Note: The statements, opinions and data contained in all publications are solely those of the individual author(s) and contributor(s) and not of MDPI and/or the editor(s). MDPI and/or the editor(s) disclaim responsibility for any injury to people or property resulting from any ideas, methods, instructions or products referred to in the content.