Abstract
Accurately predicting construction costs during the initial planning stages is crucial for the successful completion of construction projects. Recent advancements have introduced various machine learning-based methods to enhance cost estimation precision. However, the accumulation of authentic construction cost data is not straightforward, and existing datasets frequently exhibit a notable presence of missing values, posing challenges to precise cost predictions. This study aims to analyze diverse substitution methods for addressing missing values in construction cost data. Additionally, it seeks to evaluate the performance of machine learning models in cost prediction through the removal of conditional outliers. The primary goal is to identify and propose optimal strategies for handling missing value in construction cost records, ultimately improving the reliability of cost predictions. According to the analysis results, among single imputation methods, median imputation emerges as the most suitable, while among multiple imputation methods, lasso regression imputation produces the most superior outcomes. This research contributes to enhancing the trustworthiness of construction cost predictions by presenting a pragmatic approach to managing missing data in construction cost performance records, thereby facilitating more precise project planning and execution.
1. Introduction
1.1. Research Background and Objectives
The industrial perspective on the importance of cost management in construction projects, emphasizing economic efficiency, is widely acknowledged by the majority of stakeholders in the construction industry. However, the traditional understanding of the necessity of cost management has been limited to the realm of cost reduction, primarily focused on aspects such as minimizing material and labor expenses, as well as indirect cost savings through process management. This perception has been prevalent among members of the construction industry, where cost management has historically been perceived as a means to achieve savings specifically in various cost components []. For the successful completion of construction projects, it is crucial to accurately predict and manage construction costs and risks from the early stages, particularly during the project’s initiation and planning phases. However, the reality is that the majority of South Korean construction companies and related institutions tend to treat cost information merely as data rather than proactively assessing it. Recently, there has been an attempt to introduce machine learning into cost management for precise predictions through quantitative analysis.
The dataset utilized for machine learning training should be constructed based on historical project actual construction cost data. However, in typical cases, there is a lack of standards or systems for accumulating and managing performance data related to completed project construction costs. The absence of such a systematic record-keeping system results in insufficient available construction cost data, leading to challenges in the collection process []. Consequently, there is a shortage in the accumulation of actual data regarding construction costs, and the accumulated data often contains numerous missing values, constraining the training of machine learning models. Particularly in large-scale datasets, with few exceptions, the prevalence of missing values is notable []. The existence of these missing values renders the dataset incomplete, and utilizing incomplete data may result in inaccurate interpretations and outcomes regarding the inherent patterns in the data. Therefore, inputing missing values is a crucial step in the preprocessing phase before conducting actual analysis []. Hence, selecting an appropriate strategy for handling incomplete data is of paramount importance in the field of data analysis [].
Therefore, the purpose of this study is to apply various imputation methods for missing values in the construction cost prediction machine learning model. The study aims to select a suitable method for imputing missing values in construction cost performance data based on the comparison of prediction performance and outlier removal results, considering the correlation characteristics among construction cost influencing factors. The data used in this study were collected from 906 construction cost performance records through the public procurement agencies and the Construction Cost Information Plaza provided by the Korea Public Procurement Service. Based on the collected data, influential factors have been identified, and a dataset has been constructed to execute machine learning for predicting construction costs based on this foundation. After defining the constructed model as the base model, various methods for imputing missing values are applied and categorized into single imputation methods and multiple imputation methods. The applied single imputation methods include median imputation, mode imputation, and mean imputation. The multiple imputation methods encompass regression-based approaches such as linear regression, support vector machine regression, ridge regression, random forest regression, lasso regression, decision tree regression, and K-nearest neighbors regression imputation. An analysis has been conducted on the training outcomes of a machine learning model for predicting construction costs using the applied imputed dataset and the outlier removal process. Through this analysis, training performance was compared, and the characteristics of influencing factors were validated. Based on these results, one of the most suitable methods for handling missing values in the imputed dataset will be chosen. The study aims to propose the optimal method for imputing missing values in the dataset for construction cost prediction.
1.2. The Scope and Methodology of the Research
This study aims to compare imputation methods during the preprocessing phase of constructing a dataset used in training machine learning models for construction cost prediction. The applied imputation methods include three main methods for single imputation and nine methods for multiple imputation, with a particular focus on regression-based approaches. In this research, by applying these methods and comparing the results of prediction performance and outlier removal based on the adjusted dataset, the study aims to select a suitable imputation method for handling missing values in construction cost data, considering the correlation among factors influencing construction costs. The specific research methods are as follows.
First, factors influencing construction costs for the planning and design stages are derived based on information available through the ‘Korea Online E-Procurement System []’ provided by the Public Procurement Service of Korea. Through various research materials, it has been identified that construction cost influencing factors include total area, building area, site area, landscape area, basement, ground level, total height, typical floor height, and parking lots. Data were collected through the Public Procurement Service’s Korea Online E-Procurement System and the Construction Cost Information Plaza []. The collected data span from 2018 to 2022, covering construction projects. These projects include structures made of reinforced concrete and steel frame construction, and the purposes of the buildings range from educational facilities to government buildings, encompassing a variety of public structures. Based on the identified influential factors, a total of 906 data samples are collected according to the previously mentioned conditions. Utilizing the data collected based on these identified influential factors, a baseline model is constructed for the implementation of machine learning.
Secondly, various methods are applied to impute missing values in the constructed dataset for the prediction of construction costs, leading to the development of a complete construction cost training dataset. The constructed dataset undergoes conditional outlier removal and Z-score processing. Through this process, changes in the number of data points are observed, and the success of imputing missing values, considering the correlation among influencing factors in the actual construction cost data, is evaluated. Subsequently, the results are compared and analyzed.
Finally, utilizing the dataset that has undergone imputation for missing values and outlier removal during the data preprocessing phase, a machine learning model for construction cost prediction is trained. Throughout this process, various aspects such as error rates, accuracy during the machine learning process, and the comprehensive analysis of the correlation between the derived factors are considered. Based on this analysis, a suitable imputation method for handling missing values in actual construction cost data is selected. The research flowchart is depicted in Figure 1.
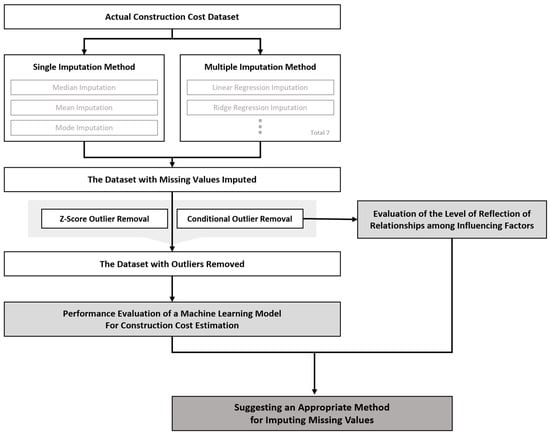
Figure 1.
Research Flowchart.
2. Related Works
Recently, there has been an increase in research on developing models and algorithms for construction cost prediction using various combinations of machine learning algorithms. This study aims to identify suitable supplementary methods to enhance the predictive performance of machine learning models for construction cost prediction. Specifically, it seeks to identify appropriate imputation methods for handling missing values in construction cost data, optimizing training performance, and improving the accuracy of construction cost predictions.
Hong [] proposed a machine learning model based on accumulated data from newly constructed zero-energy buildings to approximately predict construction costs according to the desired characteristics of the client. The collected data for zero-energy building construction costs consisted of a total of 53 entries. Due to the limited quantity and imbalanced distribution of the data, the study addressed this challenge by leveraging CTGAN (Conditional Tabular Generative Adversarial Nets), a data augmentation technique. The study utilized augmented data generated by CTGAN for machine learning, and it demonstrated that construction cost data augmentation using CTGAN effectively reflected the characteristics of the original construction cost data. Through this approach, the study provided evidence that the performance of the approximate construction cost prediction model based on Artificial Neural Networks (ANN) improved.
Kim et al. [] applied a model combining neural networks and genetic algorithms to predict the initial construction costs of residential buildings. The model was validated using data from a total of 498 residential buildings constructed in Korea from 1997 to 2000. The research results demonstrated that optimizing the parameters of the error backpropagation network using a genetic algorithm was effective in predicting the initial construction costs.
Son and Kim [] proposed a multivariate artificial neural network model applicable to construction cost prediction in the project planning and budgeting process of educational facility projects. After the publication of their book, they applied the construction cost index to the detailed construction cost calculated by the quantity takeoff and utilized multivariate performance data with the application of the construction cost index in an artificial neural network. The goal was to present a construction cost model that allows cost prediction in the conceptual phase of educational facility projects. The model’s utility was validated, and the evaluation results showed an average error rate of 6.82%, with a recorded accuracy of 93.18%. Since the proposed artificial neural network model was trained using the construction budget amounts for educational facilities constructed in the past five years, its application is anticipated in future budget allocations for educational facility construction projects [].
El-Sawalhi [] employed various approaches considering project performance and risks to estimate construction project costs. They used SVM (Support Vector Machine) to predict the parameter costs of road construction projects, aiding in the performance of construction management duties. The database used in this study collected 12 influential factors that have the most significant impact on cost prediction from completed road projects. The training model demonstrates a high accuracy rate of 95% in cost estimation, underscoring its potential utility in early project planning stages. The study also suggests further research to evaluate this model against other predictive methods, such as regression models and artificial neural networks, to broaden its applicability and improve precision in construction cost forecasting.
Hyari [] proposed an artificial neural network model for conceptual cost estimation of public construction projects. The model predicted the cost of engineering services, considering both design costs and construction supervision costs. The database was based on a dataset obtained from the Jordanian government’s bidding department. During the model development process, factors influencing the cost of engineering services were identified, and an appropriate artificial neural network was applied to the cost estimation model. The model predicted the cost of engineering services as a percentage of construction costs based on project type, engineering service category, project location, and project scope. The result of the research indicated that the model could provide acceptable performance for predicting the cost of engineering services in conceptual cost estimation models. The developed model is expected to complement existing models focused on construction cost estimation by adding the cost of engineering services, contributing to the overall cost estimation of public construction projects.
Wang et al. [] utilized deep neural networks (DNN) and SHapley Additive exPlanations (SHAP) based on data from 98 public school projects in the Hong Kong Special Administrative Region to quantitatively explore construction cost estimation. They validated their results through comparative analysis using conventional machine learning models for construction cost prediction. The research findings indicated that economic factors play a crucial role in reducing construction cost estimation errors and are more critical than project characteristics. These results are expected to assist stakeholders in the field of construction engineering and management in making informed decisions. Additionally, researchers can benefit from understanding the actual impact of various influencing factors on construction cost estimation.
Elhag and Boussabaine [] developed two Artificial Neural Network (ANN) models to predict the lowest bid prices for primary and secondary school buildings. The study included 30 projects, and the relevant data were extracted from the BCIS database. While Model 1 utilized 13 cost-determining attributes, Model 2 used only four input variables. The results demonstrated that both ANN models were effectively trained during the training phase and exhibited generalization capabilities during the testing session. ANN Models 1 and 2 achieved average accuracies of 79.3% and 82.2%, respectively.
Al-Tawal et al. [] developed, trained, and tested ANN models using cost and design data from 104 projects constructed in Jordan over the past five years. In the detailed design phase, the first ANN model was developed using 53 design factors. Then, in the approximate design phase, the factors were reduced to 41 to develop the second prediction model. In the conceptual design phase, the third ANN model was developed using 27 design factors. These models achieved average cost estimation accuracies of 98%, 98%, and 97% in the detailed design, approximate design, and conceptual design phases, respectively. The introduced ANN approach as a management tool is expected to be a useful tool for stakeholders to predict costs in the early stages of construction projects with limited data.
Kovačević, et al. [] aim to accurately estimate the construction costs of transportation infrastructure, specifically reinforced concrete (RC) and prestressed concrete (PC) bridges, at the initial project stages. The research introduces various machine learning methods, including MLP-ANN, MLP-ANN ensemble, regression tree ensemble, SVR, and GPR (Gaussian Process Regression). It aims to create a dataset for 181 RC and PC bridges constructed on the Pan-European Corridor X and to test all models under the same conditions using 10-fold cross-validation. Most models captured the complex interactions between input features well and demonstrated strong generalization capabilities, with Gaussian Process Regression (GPR) showing superior performance while maintaining lower complexity compared to ensemble models. The study shows that machine learning-based methods can eliminate biases due to human factors and provide the construction industry with tools for rapid and reliable cost estimation for bridge construction. While problems in cost estimation may arise from regression algorithms, they can also be considered classification problems based on the grouping of cost data, in which case classification algorithms could be applied. It was suggested that the developed models could be modified and applied to other costs throughout the project lifecycle.
Park [] utilized a construction cost budget prediction model for the budget of public office buildings. Construction cost data were obtained from the Public Procurement Service’s Construction Cost Information Plaza, focusing on public office buildings. The research aimed to develop and compare construction cost budget prediction models using Artificial Neural Networks (ANN) and multiple linear regression analysis techniques. The objective was to verify whether each model could be utilized for predicting construction cost budgets for public office buildings, extracting key features and implications. However, there were limitations due to the constraints of available data, making it challenging to perform construction cost predictions.
When attempting to construct a dataset for actual construction costs to predict construction expenses, challenges related to the difficulty of collecting construction cost data and the issue of missing data in the collected dataset may arise. In existing research cases, there seems to be a lack of consideration for addressing these problems in the context of construction cost prediction. This study aimed to propose an appropriate imputation method that considers the correlation between factors influencing construction costs to minimize information loss in the original data. The proposed imputation method, considering the interaction among factors influencing construction costs, is deemed crucial for enhancing both dataset construction and prediction performance when utilizing machine learning methods for construction cost prediction.
3. Model Configuration and Outlier Removal for Cost Prediction
3.1. Missing Data Imputation Method
The method of imputing missing values involves replacing missing values with values inferred from the relationships with other variables and the observations where missing values exist. This method is categorized into single imputation and multiple imputation, aiming to construct a complete dataset. Single imputation provides a single value generated through a series of processes as the replacement for missing values. The multiple imputation method entails the generation of N sets of singularly imputed data through a series of systematic procedures. Each of the N datasets undergoes a distinct analytical process, and subsequently, the outcomes are amalgamated into a unified result.
3.1.1. Single Imputation Method
The single imputation method provides a single value generated through a series of processes as the replacement for missing values. It involves replacing missing values with a single value, such as the median, mean, or mode, which is generated through a systematic procedure. This approach has the advantage of relatively easy application, as it replaces missing values with a single value for the respective variable, allowing for the derivation of a complete dataset. However, since all missing values are replaced with a single value, there is a high likelihood of introducing bias into the estimates.
3.1.2. Multiple Imputation Method
The multiple imputation method was proposed to address the limitations of single imputation methods, such as the occurrence of biases in estimates. The key distinction of multiple imputations lies in generating several sets of single imputed data through a series of processes. Each of the several datasets undergoes individual analytical procedures, and subsequently, the results are amalgamated into a unified outcome. However, to conduct an analysis on a single incomplete dataset, users need to possess multiple imputed datasets. Additionally, inaccuracies may arise in the imputed data when learning inherent data patterns during the process of data imputation. This can potentially lead to a decrease in the accuracy of the imputed data.
In this study, we employed the regression model-based imputation method among various multiple imputation techniques. The regression model-based imputation typically designates the dependent variable as the variable with missing values, while the independent variables utilize the given set of other variables []. This method involves establishing a regression model, applying regression analysis, and replacing missing values with the regression-predicted values obtained from the analysis results. The imputed values for missing data vary depending on the regression model used. In this research, the employed regression models include linear regression, support vector machine regression, ridge regression, random forest regression, lasso regression, decision tree regression, and k-nearest neighbors regression.
Linear regression is a regression analysis technique that models the linear correlation between the dependent variable y and one or more independent variables X. Equation (1) represents the linear regression model. Lasso regression and ridge regression are regularization methods used in linear regression models to reduce model complexity. Support vector machine regression calculates the similarity between input values and support vectors, assigns weights accordingly, and uses them to calculate predicted values. In this research, the ‘sigmoid’ kernel was employed in the support vector machine regression to effectively model nonlinear relationships within a particular dataset. The ‘sigmoid’ kernel facilitates linear separation in issues with complex data structures by mapping the data to a higher-dimensional space. This method enhances the model’s ability to learn the inherent patterns in the data, thereby improving its predictive performance.
The decision tree model is a model that automatically discovers rules in the data through learning and creates tree-based classification rules. Random forest regression, as shown in Figure 2a, is an ensemble technique based on decision trees. It involves generating multiple decision trees and calculating the final predicted value by averaging their predicted values. In this research, the random state value was set to 0 for two regression models, thereby specifying the initial seed value for the random number generator within the algorithm. Fixing this value to a specific number ensures that consistent results are achieved whenever the same data and parameter settings are utilized, thus guaranteeing the reproducibility of the experiment.
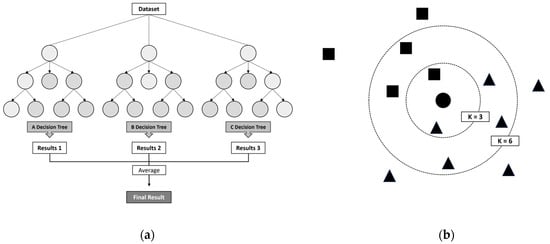
Figure 2.
(a) Random Forest Regression Model (b) K-Nearest Neighbors Regression Model.
K-nearest neighbors regression, as depicted in Figure 2b, involves finding the k-nearest neighbors among existing data when a new observation is given. It classifies and predicts based on values similar to those of the nearby neighbors, considering the attributes. In this study, the KNN regression model used for imputing missing values was set with the number of neighbors as five. The significance of the number of neighbors, K, in a model directly impacts its complexity and performance. A lower K can make the model overly sensitive to noise, leading to a higher risk of overfitting, while a higher K might result in the model being overly simplified, causing underfitting. Therefore, choosing K = 5 was expected as it effectively operates across various scenarios, offering a balanced approach between capturing the complexity of the data and facilitating generalization.
3.2. Dataset for Machine Learning Training
Constructing a dataset for machine learning models is a crucial task. Additionally, when building the dataset, it is essential to choose influential factors for predicting construction costs.
This study aims to estimate the appropriate construction costs during the planning and design phase of the architectural design process. To estimate construction costs, it is necessary to define the factors influencing construction costs, and these factors are related to the constraints provided during the design phase. Influencing factors include total area, building area, site area, landscape area, basement, ground level, total height, typical floor height, and parking lot size. Such information can be collected based on data provided by the Public Procurement Service’s Korea ON-Line E-Procurement System and Construction Cost Information Plaza.
Based on the selected influential factors, data on construction projects completed between 2018 and 2022 were collected from the Public Procurement Service’s Korea Online E-Procurement System and the Construction Cost Information Plaza. The data primarily consists of buildings constructed with reinforced concrete and steel frame structures, with the uses of these buildings primarily being educational facilities, government buildings, and other public structures. A total of 909 cases, including overall construction costs by facility type, were collected. Cases without essential data (total area, building area, ground level) for predicted construction costs were excluded, resulting in a total of 906 cases used in the dataset. Before the data preprocessing stage, the number of missing values for each influencing factor in the original dataset is shown in Table 1.

Table 1.
Number of Missing Values by Influencing Factor.
3.3. Construction of Machine Learning Base Model for Cost Prediction
3.3.1. Base Model Configuration
The dataset used for training the machine learning model for construction cost prediction is based on 906 cases of collected actual construction cost data. The development environment is built on Visual Studio Code, using the Python language. The primary objective of this study is to propose methods for appropriately filling in missing values in actual construction cost data. Therefore, the conditions for all prediction models are set to be the same, except for variations in the missing value imputation methods. Moreover, out of the 906 case data, 70% are utilized as training data, while the remaining 30% are used as test data. During the machine learning process, the case data are randomly extracted for each training session to divide them into training and test data groups. When dealing with complex and noisy data such as construction cost prediction, the selection of an activation function that can reduce the model’s sensitivity to noise is crucial. For this reason, the ELU (Exponential Linear Unit) activation function was chosen in this study. Additionally, the configuration of node progression is a significant factor when processing large datasets or training complex models. Therefore, to ensure that the model can thoroughly learn the diverse characteristics of the data, a larger number of nodes were used in the initial layer. Subsequently, the number of nodes was reduced to 100 → 64 → 32 → 1 in the following layers to effectively summarize and compress the important information.
3.3.2. Model Configurations by Case
The basic model configuration conditions remain constant, with variations introduced solely in the missing value imputation methods. There are a total of 10 applied missing value imputation methods, comprising 3 single imputation methods and 7 multiple imputation methods based on regression models. In single imputation methods, median imputation, mode imputation, and mean imputation are applied. In multiple imputation methods, regression model-based imputations include linear regression imputation, support vector machine regression imputation, ridge regression imputation, random forest regression imputation, lasso regression imputation, decision tree regression imputation, and k-nearest neighbors regression imputation. The model conditions for each case are detailed in Table 2.
Table 2.
Model Configurations.
The default settings for imputing missing values using multiple imputation methods are as follows. For the support vector machine regression imputation method, the kernel was set to ‘sigmoid’. In the case of ridge regression and lasso regression imputation methods, ‘random state’ was set to 0 and ‘alpha’ was set to 1.0. The random forest regression and decision tree regression imputation methods had their ‘random state’ set to 0, while for the KNN imputation method, the number of neighbors was set to 5.
3.3.3. Outlier Removal Based on Conditions and Z-Score
Filling missing values using single and multiple imputation methods for construction cost actual data can be effective in completing the dataset. However, depending on the method used, there is a possibility that incorrect data may be filled in, potentially leading to gaps not only in the analysis of the characteristics of influential factors in the constructed dataset but also in the correlation analysis between influencing factors. Therefore, to confirm the presence of gaps, it is necessary to check for outliers in the replaced data values.
After the missing value imputation process, conditions were defined to remove outliers based on actual construction cost data. The study established three conditions for removing anomalies: first, when the building area is greater than the total area; second, when the landscape area is greater than the site area; and third, when the building area is greater than the site area. Data corresponding to these three conditions undergo a process of removing entire rows. In the next step, among the data that was not removed, outliers are identified and removed using the Z-Score outlier detection method. In this study, the Z-Score outlier detection method was employed to identify and remove outliers. This method involves comparing the Z-Score of data points against a predefined threshold, ‘threshold = 1.96’, where data points with a Z-Score exceeding this threshold are considered outliers and subsequently removed. Outliers were independently removed for each column of the provided dataset. Through this process, the number of outlier data points is measured based on the missing value imputation method, and it is verified whether consideration was given to the correlation between influential factors in construction cost prediction.
The dataset, processed through the missing value imputation and outlier removal processes, is utilized for training machine learning models for construction cost prediction.
Figure 3 is a diagram illustrating the data preprocessing process that involves missing value imputation and outlier removal. Based on the processed data, a comparison of the performance of various machine learning models was conducted. In this manner, the study aimed to consider the correlation between influential factors in construction cost prediction and the performance of machine learning models, ultimately seeking to choose the optimal method for imputing missing values in actual construction cost data.
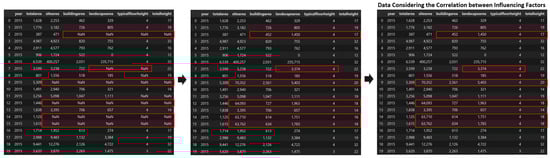
Figure 3.
Changes in Data Based on Data Preprocessing.
4. Analysis of the Training Results
4.1. Differences in Data Composition by Missing Value Imputation Methods
The filled values vary depending on the method used to replace missing values in the actual construction cost data. The three single imputation methods applied in this study involve assigning the same constant value to all missing values. However, the seven multiple imputation methods, mentioned as regression model-based imputation methods, fill in missing values through an analysis of the constructed data patterns. The analysis of data patterns may vary depending on the type of regression model, leading to differences in the imputation of missing values. Therefore, while it is crucial to find an appropriate imputation method through performance comparison for effective model training, it is equally important to consider an imputation method that takes into account the characteristics of data patterns and influential factors.
In this study, to assess whether characteristics between data patterns and influential factors are considered, the changes in data quantity are examined through conditional outlier removal and Z-Score outlier removal methods. For each missing value imputation method, the total amount of data after outlier removal is compared, allowing for the assessment of the level of consideration for influential factor characteristics. A suitable missing value imputation method is then selected based on the judgment of an appropriate level beyond the baseline.
The first outlier removal method, conditional outlier removal, is based on the correlation between influential factors. It establishes conditions based on the correlation and removes rows where the conditions are not met, considering them as outliers. The conditions applied for conditional outlier removal include three cases: when the building area is greater than the floor area, when the landscaping area is greater than the site area, and when the building area is greater than the site area. If any of these conditions are met, the entire row of data is deleted. Subsequently, the second method, Z-Score outlier removal, is a general method that uses the mean and standard deviation to remove outliers. The changes in data quantity according to the outlier removal process are shown in Table 3.
Table 3.
Changes in Data Based on Data Preprocessing.
Based on the examination of the pattern of changes in data quantity, it was observed that in the case of conditional outlier removal, the number of removed outliers was relatively small when the median imputation method was applied among the single imputation methods. This is because some values are deleted when conditional outlier removal is applied to the original data. The reason for deletion is that during the imputation of missing values, values that were not reflected in the correlation between floor area, landscaping area, building area, and site area were replaced. Data excluded from the relationships between influential factors in construction costs, as a result of this exclusion, may provide inaccurate data patterns during model training, potentially reducing the performance of machine learning models. Therefore, in this study, it is necessary to remove outliers generated during missing value imputation to enhance the training performance of construction cost prediction machine learning models.
The research results demonstrate that in the case of multiple imputation methods, linear regression imputation, support vector machine regression imputation, ridge regression imputation, and lasso regression imputation methods result in fewer instances being identified as outliers compared to other regression model imputation methods. In conclusion, the study shows that, for single imputation methods, the median imputation method, and for multiple imputation methods, linear regression imputation, support vector machine regression imputation, ridge regression imputation, and lasso regression imputation methods reflect the relationships between influential factors at a relatively high level compared to other imputation methods.
4.2. Training Results by Missing Value Imputation Method
The results of the performance analysis of construction cost prediction machine learning models, utilizing single imputation methods applied based on the basic model configuration, specifically median imputation, mode imputation, and mean imputation, are presented in Figure 4, Figure 5 and Figure 6. In the figure, a “wavy line” is used to omit certain loss sections to improve the visibility of the graph, which is affected by the sharp decrease in ‘train_loss’ and ‘validation_loss’.
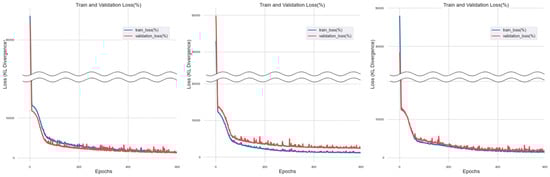
Figure 4.
Training Results of Median Imputation Method.
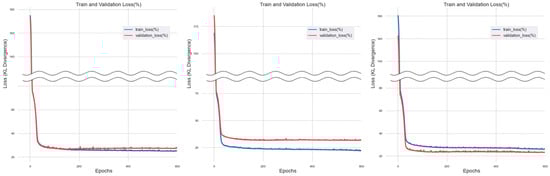
Figure 5.
Training Results of Mode Imputation Method.
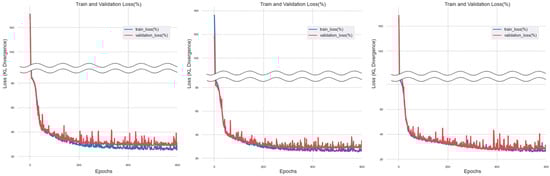
Figure 6.
Training Results of Mean Imputation Method.
For single imputation methods, datasets were generated by applying median imputation, mode imputation, and mean imputation for machine learning training. The results of the training show that, for the dataset with median imputation, ‘train_loss’ and ‘validation_loss’ gradually converge to 0 as epochs (training iterations) progress. As observed from the results of three training sessions conducted through k-fold cross-validation, the gap between ‘train_loss’ and ‘validation_loss’ narrows as the number increases, and then stabilizes at a certain level. On the other hand, for the dataset with mode imputation, there is a convergence trend up to 200 epochs, but as the epochs progress, the gap between ‘train_loss’ and ‘validation_loss’ gradually widens. For the dataset with mean imputation applied, as the number of epochs increases, the gap between ‘train_loss’ and ‘validation_loss’ tends to narrow and gradually converge towards zero. However, the progression of the graph is not consistent, and noise continues to appear persistently.
For machine learning training on the linear regression model, multiple imputation methods, including linear regression imputation, support vector machine regression imputation, ridge regression imputation, random forest regression imputation, lasso regression imputation, decision tree regression imputation, and k-nearest neighbors regression imputation, were applied to create datasets. The training results are presented in Figure 7, Figure 8, Figure 9, Figure 10, Figure 11, Figure 12 and Figure 13.
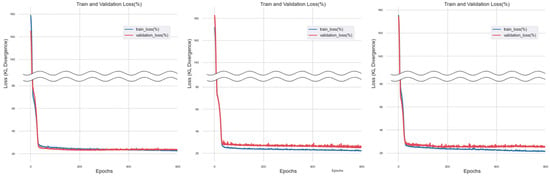
Figure 7.
Training Results of Linear Regression Imputation Method.
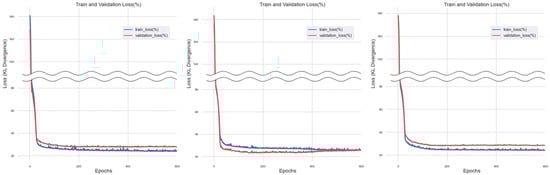
Figure 8.
Training Results of Support Vector Machine Regression Imputation Method.
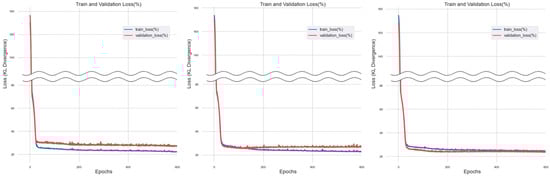
Figure 9.
Training Results of Ridge Regression Imputation Method.
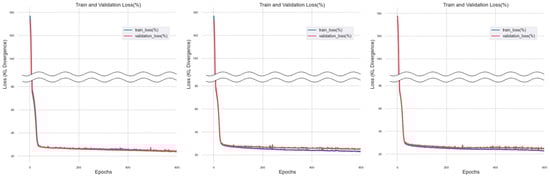
Figure 10.
Training Results of Random Forest Regression Imputation Method.
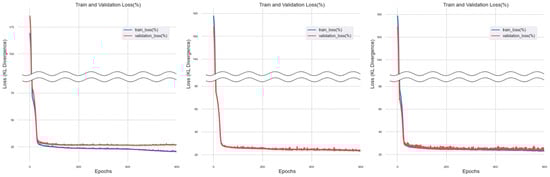
Figure 11.
Training Results of Lasso Regression Imputation Method.
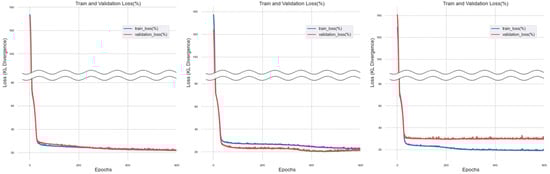
Figure 12.
Training Results of Decision Tree Regression Imputation Method.
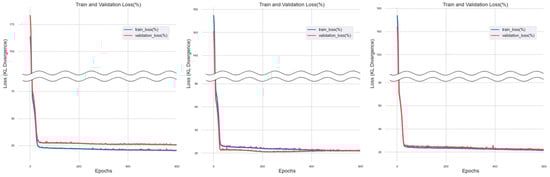
Figure 13.
Training Results of K-Nearest Neighbors Regression Imputation Method.
In the case of multiple imputation methods, various regression model-based imputation methods were applied to create a dataset for machine learning training. When training was conducted using the dataset imputed through linear regression, the ‘train_loss’ showed a converging trend to 0 as epochs progressed, while the ‘validation_loss’ converged to 0 but maintained a certain value.
For the dataset imputed through support vector machine regression, the overall trend converged to 0, but ‘validation_loss’ maintained a constant value. In the case of the dataset imputed through ridge regression, ‘train_loss’, and ‘validation_loss’ converged to 0, maintaining a constant gap as epochs progressed.
When training was conducted using the dataset imputed through ridge regression, both ‘train_loss’ and ‘validation_loss’ demonstrated a tendency to converge towards zero. However, even as the number of training iterations increased, they maintained a steady state at the point of convergence.
When training was performed using a dataset imputed with Random Forest, a significant amount of noise was observed throughout the training process, resulting in unstable graph patterns. Moreover, in some folders, a crossing pattern between ‘train_loss’ and ‘validation_loss’ was observed.
Training with the dataset imputed through Lasso regression revealed that both ‘train_loss’ and ‘validation_loss’ exhibited a convergence towards zero. However, beyond a certain level of training iterations, only ‘train_loss’ continued to converge towards zero.
Upon conducting training with the dataset imputed through Decision Tree Regression, the overall graph trended towards convergence at zero. However, it was observed that minor noise occurred within the graph.
Upon training with the dataset imputed via the KNN regression approach, a notable reduction in graph noise was observed compared to other methods. Additionally, as the number of epochs increased, a trend towards zero was evident for both ‘train_loss’ and ‘validation_loss’. However, during this process, instances of ‘train_loss’ and ‘validation_loss’ intersecting were also encountered.
Unlike single imputation methods for missing values, the use of multiple imputation methods can result in situations where ‘validation_loss’ is lower than ‘train_loss’. This phenomenon can occur during the application of k-fold cross-validation, where the machine learning model undergoes training three times. The composition of training and test data, randomly extracted in each training session, can vary, leading to the possibility of lower ‘validation_loss’ in certain folds. This is because the randomly selected data in some folds may contain patterns that are easier to predict.
4.3. Optimal Method Selection Based on Machine Learning Training Performance
To evaluate the optimal missing value imputation method for creating a dataset for a machine learning model predicting construction costs, the level of reflection of relationships between influential factors and the learning performance of the construction cost prediction machine learning model was assessed. The results of evaluating the level of correlation maintenance between influential factors showed that, for single imputation methods, median imputation and mode imputation were relatively high. For multiple imputation methods, linear regression imputation, support vector machine regression imputation, ridge regression imputation, and lasso regression imputation were relatively highly evaluated.
The relative training performance evaluation results for the dataset missing value imputation methods of the machine learning model for construction cost prediction are shown in Figure 14. According to the analysis results, in the case of single imputation methods, median imputation is relatively low, with an average error rate of 16.91%. Among the multiple imputation methods, lasso regression exhibits the lowest average error rate at 15.54%, followed by decision tree regression and random forest regression.
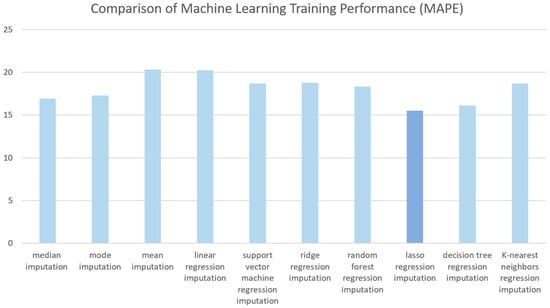
Figure 14.
Comparison of Machine Learning Training Performance (MAPE).
Therefore, considering both the level of reflection of relationships between influential factors and the training performance of the construction cost prediction machine learning model, lasso regression imputation is deemed the most appropriate for filling in missing values in actual construction cost data.
5. Conclusions
To enhance predictive performance during the process of constructing a machine learning model, data preprocessing is essential. In the process of building a machine learning model that deals with large-scale data, the data preprocessing stage, especially the replacement of missing values, is crucial. There are various methods to replace missing values, and in this study, three representative methods among single imputation methods and seven regression model-based imputation methods among multiple imputation methods were applied to replace missing values in the construction cost actual data.
To evaluate the suitability of the generated dataset based on the applied methods, two criteria were used for assessment. The first criterion, determining suitability through the reflection of correlations between influential factors, indicated that median imputation, mode imputation, linear regression imputation, support vector machine regression imputation, ridge regression imputation, and lasso regression imputation methods were deemed appropriate. The second criterion, evaluating suitability based on the learning performance of the construction cost prediction machine learning model, revealed that, among single imputation methods, median imputation, and among multiple imputation methods, lasso regression imputation, was considered suitable due to its low average error rates. In summary, it was concluded that using the lasso regression method to replace missing values is appropriate, considering the correlation between influential factors and improving the learning performance of the machine learning model for construction cost prediction.
Analyzing these results, based on the second criterion of comparing the learning performance of the construction cost prediction machine learning model, it can be observed that median imputation, despite being a single imputation method, yields relatively low error rates compared to most multiple imputation methods. However, the position of the median can vary depending on the distribution of the data, as well as the range of maximum and minimum values. This indicates that the learning performance may vary depending on the data distribution. Therefore, especially when larger or smaller construction projects are added to the actual construction cost data, where the position of the median can change with additional data collection, applying single imputation methods might be challenging. Considering these two evaluation criteria and the potential expansion of the data range, the application of lasso regression imputation among multiple imputation methods is deemed the most appropriate.
Construction costs can vary significantly depending on various conditions in each region or country, and predicting construction costs in any given area requires access to that region’s data. Securing sufficient data for construction cost prediction in each region is a challenging task, and even when data are obtained, there might be data that cannot be partially collected. Due to these issues, finding ways to appropriately address missing data is essential for enhancing the usability of the collected construction cost data. This research could be significant in showing how to address missing values in the challenging context of construction cost prediction, where data acquisition is difficult, and how the performance of construction cost prediction changes depending on the method used to handle missing data.
To improve the accuracy of construction cost prediction, it is necessary to secure a sufficient amount of construction cost data. However, until enough data can be gathered, it is considered necessary to find ways to optimally fill in missing data, as in this study, in order to enhance the usability of the data that has been collected. Missing values in actual construction cost data often share similar data patterns, so it is expected that using an appropriate regression model, as demonstrated in this study, can replace missing values to some extent. However, there are many cases of research expenses showing outliers that deviate from general patterns, indicating that such models alone may have limitations in completely substituting for missing data. This research serves as an initial step in the development of machine learning-based construction cost prediction, seeking the optimal method to replace missing data in construction cost prediction based on general models. However, future research will need to focus on developing learning models that can be applied to various conditions and cases that can be used in construction cost prediction and researching ways to replace missing data under specific conditions.
Author Contributions
H.L. conceived the experiments, analyzed the data, and wrote the paper; S.Y. supervised the research. All authors have read and agreed to the published version of the manuscript.
Funding
This work is supported in 2024 by the Korea Agency for Infrastructure Technology Advancement (KAIA) grant funded by the Ministry of Land, Infrastructure and Transport (Grant RS-2021-KA163269).
Institutional Review Board Statement
Not applicable.
Informed Consent Statement
Not applicable.
Data Availability Statement
The cost data used in the research was collected from a public institution in Korea and is unavailable due to privacy.
Conflicts of Interest
The authors declare that they have no known competing financial interest or personal relationships that could have influenced the work reported in this study.
References
- Kim, S. A Study on the Prediction of Construction Costs for Apartment Buildings and Characteristics of Factors Affecting Cost Variations. Master’s Thesis, Yonsei University Graduate School of Engineering, Seoul, Republic of Korea, 2003. [Google Scholar]
- Seo, Y. A Study on Construction Cost Prediction Models in the Planning and Design Stages through Analysis of Actual Construction Costs. Master’s Thesis, Korea University Graduate School of Engineering, Seoul, Republic of Korea, 2009. [Google Scholar]
- Lee, S.; Jeon, S. An Empirical Comparison of Imputation Methods for Missing Data. KIIS Spring Conf. 2009, 19, 250–251. [Google Scholar]
- Lee, S. Performance Comparison of Imputation Algorithms for Missing Data. Master’s Thesis, Graduate School of Korea University, Seoul, Republic of Korea, 2020. [Google Scholar]
- Kim, Y. Comparison of Imputation Methods for Missing Data in Meteorological Data. Master’s Thesis, Graduate School of Inha University, Incheon, Republic of Korea, 2020. [Google Scholar]
- Korea Online E-Procurement System. Available online: https://www.g2b.go.kr/index.jsp (accessed on 1 March 2023).
- The Construction Cost Information Plaza. Available online: https://pcae.g2b.go.kr:8044/pbs/psa/psa0000/index.do (accessed on 1 March 2023).
- Hong, E. A Study on Construction Cost Prediction of Zero-Energy Buildings Based on Artificial Neural Networks Using CTGAN. Master’s Thesis, Graduate School of Ewha Womans University, Seoul, Republic of Korea, 2022. [Google Scholar]
- Kim, G.; Jo, H.; Ahn, S. A Study on the Comparison of Prediction Accuracy in Construction Cost Prediction Models Using Neural Networks and Genetic Algorithms. J. Archit. Inst. Korea 2006, 22, 111–118. [Google Scholar]
- Son, J.; Kim, C. A Study on the Development of Artificial Neural Network Models for Predicting Construction Costs in the Conceptual Phase of Educational Facilities. Korean J. Constr. Eng. Manag. 2006, 7, 91–99. [Google Scholar]
- El-Sawalhi, N.I. Support Vector Machine Cost Estimation Model for Road Projects. J. Civ. Eng. Archit. 2015, 9, 1115–1125. [Google Scholar] [CrossRef]
- Hyari, K.H.; Al-Daraiseh, A.; El-Mashaleh, M. Conceptual Cost Estimation Model for Engineering Services in Public Construction Projects. J. Manag. Eng. 2015, 32, 1115–1125. [Google Scholar] [CrossRef]
- Wang, R.; Asghari, V.; Cheung, C.M.; Hsu, S.C.; Lee, C.J. Assessing Effects of Economic Factors on Construction Cost Estimation Using Deep Neural Networks. Autom. Constr. 2022, 134, 104080. [Google Scholar] [CrossRef]
- Elhag, T.M.S.; Boussabaine, A.H. An Artificial Neural System for Cost Estimation of Construction Projects. In Proceedings of the 14th Annual ARCOM Conference, Reading, UK, 9–11 September 1998; Volume 1, pp. 219–226. [Google Scholar]
- Al-Tawal, D.R.; Arafah, M.; Sweis, G.J. A Model Utilizing the Artificial Neural Network in Cost Estimation of Construction Projects in Jordan. Eng. Constr. Archit. Manag. 2021, 28, 2466–2488. [Google Scholar] [CrossRef]
- Kovačević, M.; Ivanišević, N.; Petronijević, P.; Despotović, V. Construction cost estimation of reinforced and prestressed concrete bridges using machine learning. GRAĐEVINAR 2021, 73, 1–13. [Google Scholar] [CrossRef]
- Park, J. Development and Comparison Study of ANN and MLR Models for Predicting Construction Budgets. Master’s Thesis, Sejong University Graduate School, Seoul, Republic of Korea, 2023. [Google Scholar]
Disclaimer/Publisher’s Note: The statements, opinions and data contained in all publications are solely those of the individual author(s) and contributor(s) and not of MDPI and/or the editor(s). MDPI and/or the editor(s) disclaim responsibility for any injury to people or property resulting from any ideas, methods, instructions or products referred to in the content. |
© 2024 by the authors. Licensee MDPI, Basel, Switzerland. This article is an open access article distributed under the terms and conditions of the Creative Commons Attribution (CC BY) license (https://creativecommons.org/licenses/by/4.0/).