Article

Study on Acoustic–Electric Response Characteristics of Unsaturated Loess under Different Moisture Content

1
School of Resources and Safety Engineering, Central South University, Changsha 410017, China
2
Northwest Institute of Eco-Environment and Resources, Chinese Academy of Sciences, Lanzhou 730000, China
3
School of Civil Engineering, Central South University, Changsha 410017, China
*
Author to whom correspondence should be addressed.
Buildings 2024, 14(3), 819; https://doi.org/10.3390/buildings14030819
Submission received: 23 February 2024 / Revised: 10 March 2024 / Accepted: 12 March 2024 / Published: 18 March 2024
(This article belongs to the Section Building Materials, and Repair & Renovation)

Abstract

:
In order to study the characteristics of P-wave velocity and resistivity of loess with different moisture contents, low-field nuclear magnetic resonance, resistivity, and P-wave velocity tests were carried out on loess samples with 11 different moisture contents. The test results show that under the condition of the same dry density, the water in loess exists in two forms: bound water and free water. With the increase in moisture content, the water porosity of loess increases, the proportion of free water increases, and the resistivity gradually decreases and then tends to be stable, showing a power function relationship with moisture content. When the moisture content is less than 20%, the P-wave velocity decreases with the increase in the moisture content. In comparison, when the moisture content is greater than 20%, the wave velocity increases with the increase in the moisture content. A modified relation between wave velocity and moisture content and saturation is put forward, and the relationship expression between wave velocity and resistivity of loess is established. Finally, the reliability is verified by experimental data. The research results have a certain guiding significance for real-time monitoring of loess moisture content and engineering stability analysis in the loess area.

1. Introduction

The loess area in China is vast, accounting for about 6.6% of the country’s land area [1]. In recent years, with the deepening of “The Belt and Road” strategy, there has been a significant intensification in infrastructure construction. Highways and railways along the Loess Plateau in China have experienced vigorous development, resulting in the establishment of numerous traffic networks that have greatly facilitated research on loess tunnels, highway foundations, slopes, and other engineering aspects [2,3,4]. Moreover, as an ancient architectural style unique to the Loess Plateau area, loess cave dwellings hold great significance within China’s traditional residential buildings. The high heat capacity of loess surpasses that of modern building materials like steel and cement; thus, utilizing it as a wall material enables effective temperature regulation for winter heating and summer cooling purposes. Whether it is cave dwellings or low-rise buildings constructed using loess as their primary material, all possess characteristics such as convenient construction methods and efficient use of resources [5,6]. The special genesis and occurrence environment show the engineering characteristics of unsaturated soil, which is very sensitive to water. The change in water will lead to a decrease in strength and easily lead to geological disasters such as landslides [7]. According to statistics, there are about 39,000 registered geological hazards in the loess area of China [8]. Therefore, it is very important to master the change in loess moisture for landslide monitoring, early warning, and landslide stability analysis.
For the determination of soil moisture content, the traditional methods include the specific gravity method, moisture sensor method, etc., which have complicated workloads, great disturbance to soil, and certain limitations. Geophysical exploration commonly utilizes wave velocity and resistivity as indicators along with the basic physical properties of soil, all of which are closely related to soil porosity and moisture content. Therefore, geophysical methods can indirectly obtain information on physical and mechanical parameters like electricity and magnetism in order to measure soil moisture content [9]. In recent years, new forms have emerged in the application of both wave velocity and resistivity in engineering, which include inferring other properties by obtaining one of the parameters to reduce the cost of geophysical exploration or jointly inverting the data of wave velocity exploration and electrical exploration to improve the accuracy and reliability of geophysical exploration results [10]. Therefore, it is of great significance to reveal the variation law of soil wave velocity and resistivity with moisture content, study the acoustic–electric response characteristics of unsaturated loess under different moisture content conditions, and build a relationship model between soil wave velocity and resistivity with moisture content as a link, which is of great significance for the determination of soil moisture content and the prevention and control of soil disasters.
Currently, the research on soil resistivity has reached an advanced stage. In 1942, Archie proposed a simplified model of soil resistivity–pore water resistivity suitable for saturated cohesionless soil [11]. Keller introduced the saturation coefficient and extended it to unsaturated soil [12], and then Waxman proposed a resistivity model suitable for viscous soil [13]. Rhodes found a parabolic relationship between electrical conductivity and moisture content of fine-grained soil through laboratory tests [14], which was confirmed by Rinaldi to be suitable for compacted soil [15]. Subsequently, various models have emerged to modify and expand the theory of resistivity, including the temperature correction model [16], multivariate resistivity model [17], and specialized soil resistivity model [18]. The resistivity of loess is closely related to its moisture content. Zhu Caihui and Li Ning obtained the resistivity model of loess under different initial saturations through a large number of laboratory tests and established the relationship between moisture content, compactness, and resistivity [19]. Sun Bin et al. used the quadrupole method to conduct resistivity tests on loess samples in the Heifangtai area under different moisture contents and established the relationship model between resistivity and moisture content [20].
The acoustic wave velocity contains a wealth of information related to the stress state of soil. In geological engineering, more and more scholars use acoustic wave velocity to perform nondestructive analysis of soil mechanics [21,22]. Wei Bingxu et al. combined Computed Tomography (CT) technology with a non-metal ultrasonic meter to test expansive soil and concluded that the microstructure of expansive soil undergoes changes during dry–wet cycles, which are closely associated with variations in average longitudinal wave velocity [23]. Huang Xing et al. investigated sound wave propagation velocities in frozen and reshaped loess and determined that these velocities decrease as temperature increases [24]. Moisture content is a crucial factor influencing soil wave velocity. M. Irfan et al. first studied the relationship between elastic wave velocity and soil moisture content and deformation by the triaxial water injection test and found that elastic wave velocity decreased with an increase in moisture content [25]. Chen Yulong et al. carried out slope model tests in two sizes, and the results showed that the elastic wave velocity decreased with an increase in moisture content, and it accelerated when it approached alandslide [26]. Wu Yuming et al. studied the relationship between wave velocity and mass moisture content of unsaturated loess and concluded that the longitudinal and transverse wave velocities of loess decreased with an increase in mass moisture content at low moisture content, while at high moisture content, the longitudinal and transverse wave velocities of loess were relatively stable [27].
To sum up, the resistivity and wave velocity of loess are closely related to the moisture content. According to the change law of soil resistivity and wave velocity with different moisture content, the relevant results can be used for reference, but there are few studies on the relationship between wave velocity and resistivity and the relationship between the microstructure and acoustic–electric response of loess. Taking Gansu loess as the object, the resistivity, acoustic wave velocity, and low-field nuclear magnetic resonance (NMR) of loess samples under different moisture content conditions were tested, and the variation laws of resistivity and wave velocity with moisture content were obtained, respectively. The modified relationship between the longitudinal wave velocity and moisture content of loess was proposed, and the micro-pore structure of loess was combined with the macro-acoustic–electric response characteristics to reveal the reasons for the change in acoustic–electric characteristics with moisture content viewed from a microscopic perspective. On this basis, the relationship model of resistivity and wave velocity was established, which can provide a relevant theoretical basis for real-time monitoring of loess moisture and monitoring, early-warning, and stability analysis of geological disasters such as landslides in the loess area.

2. Test Scheme

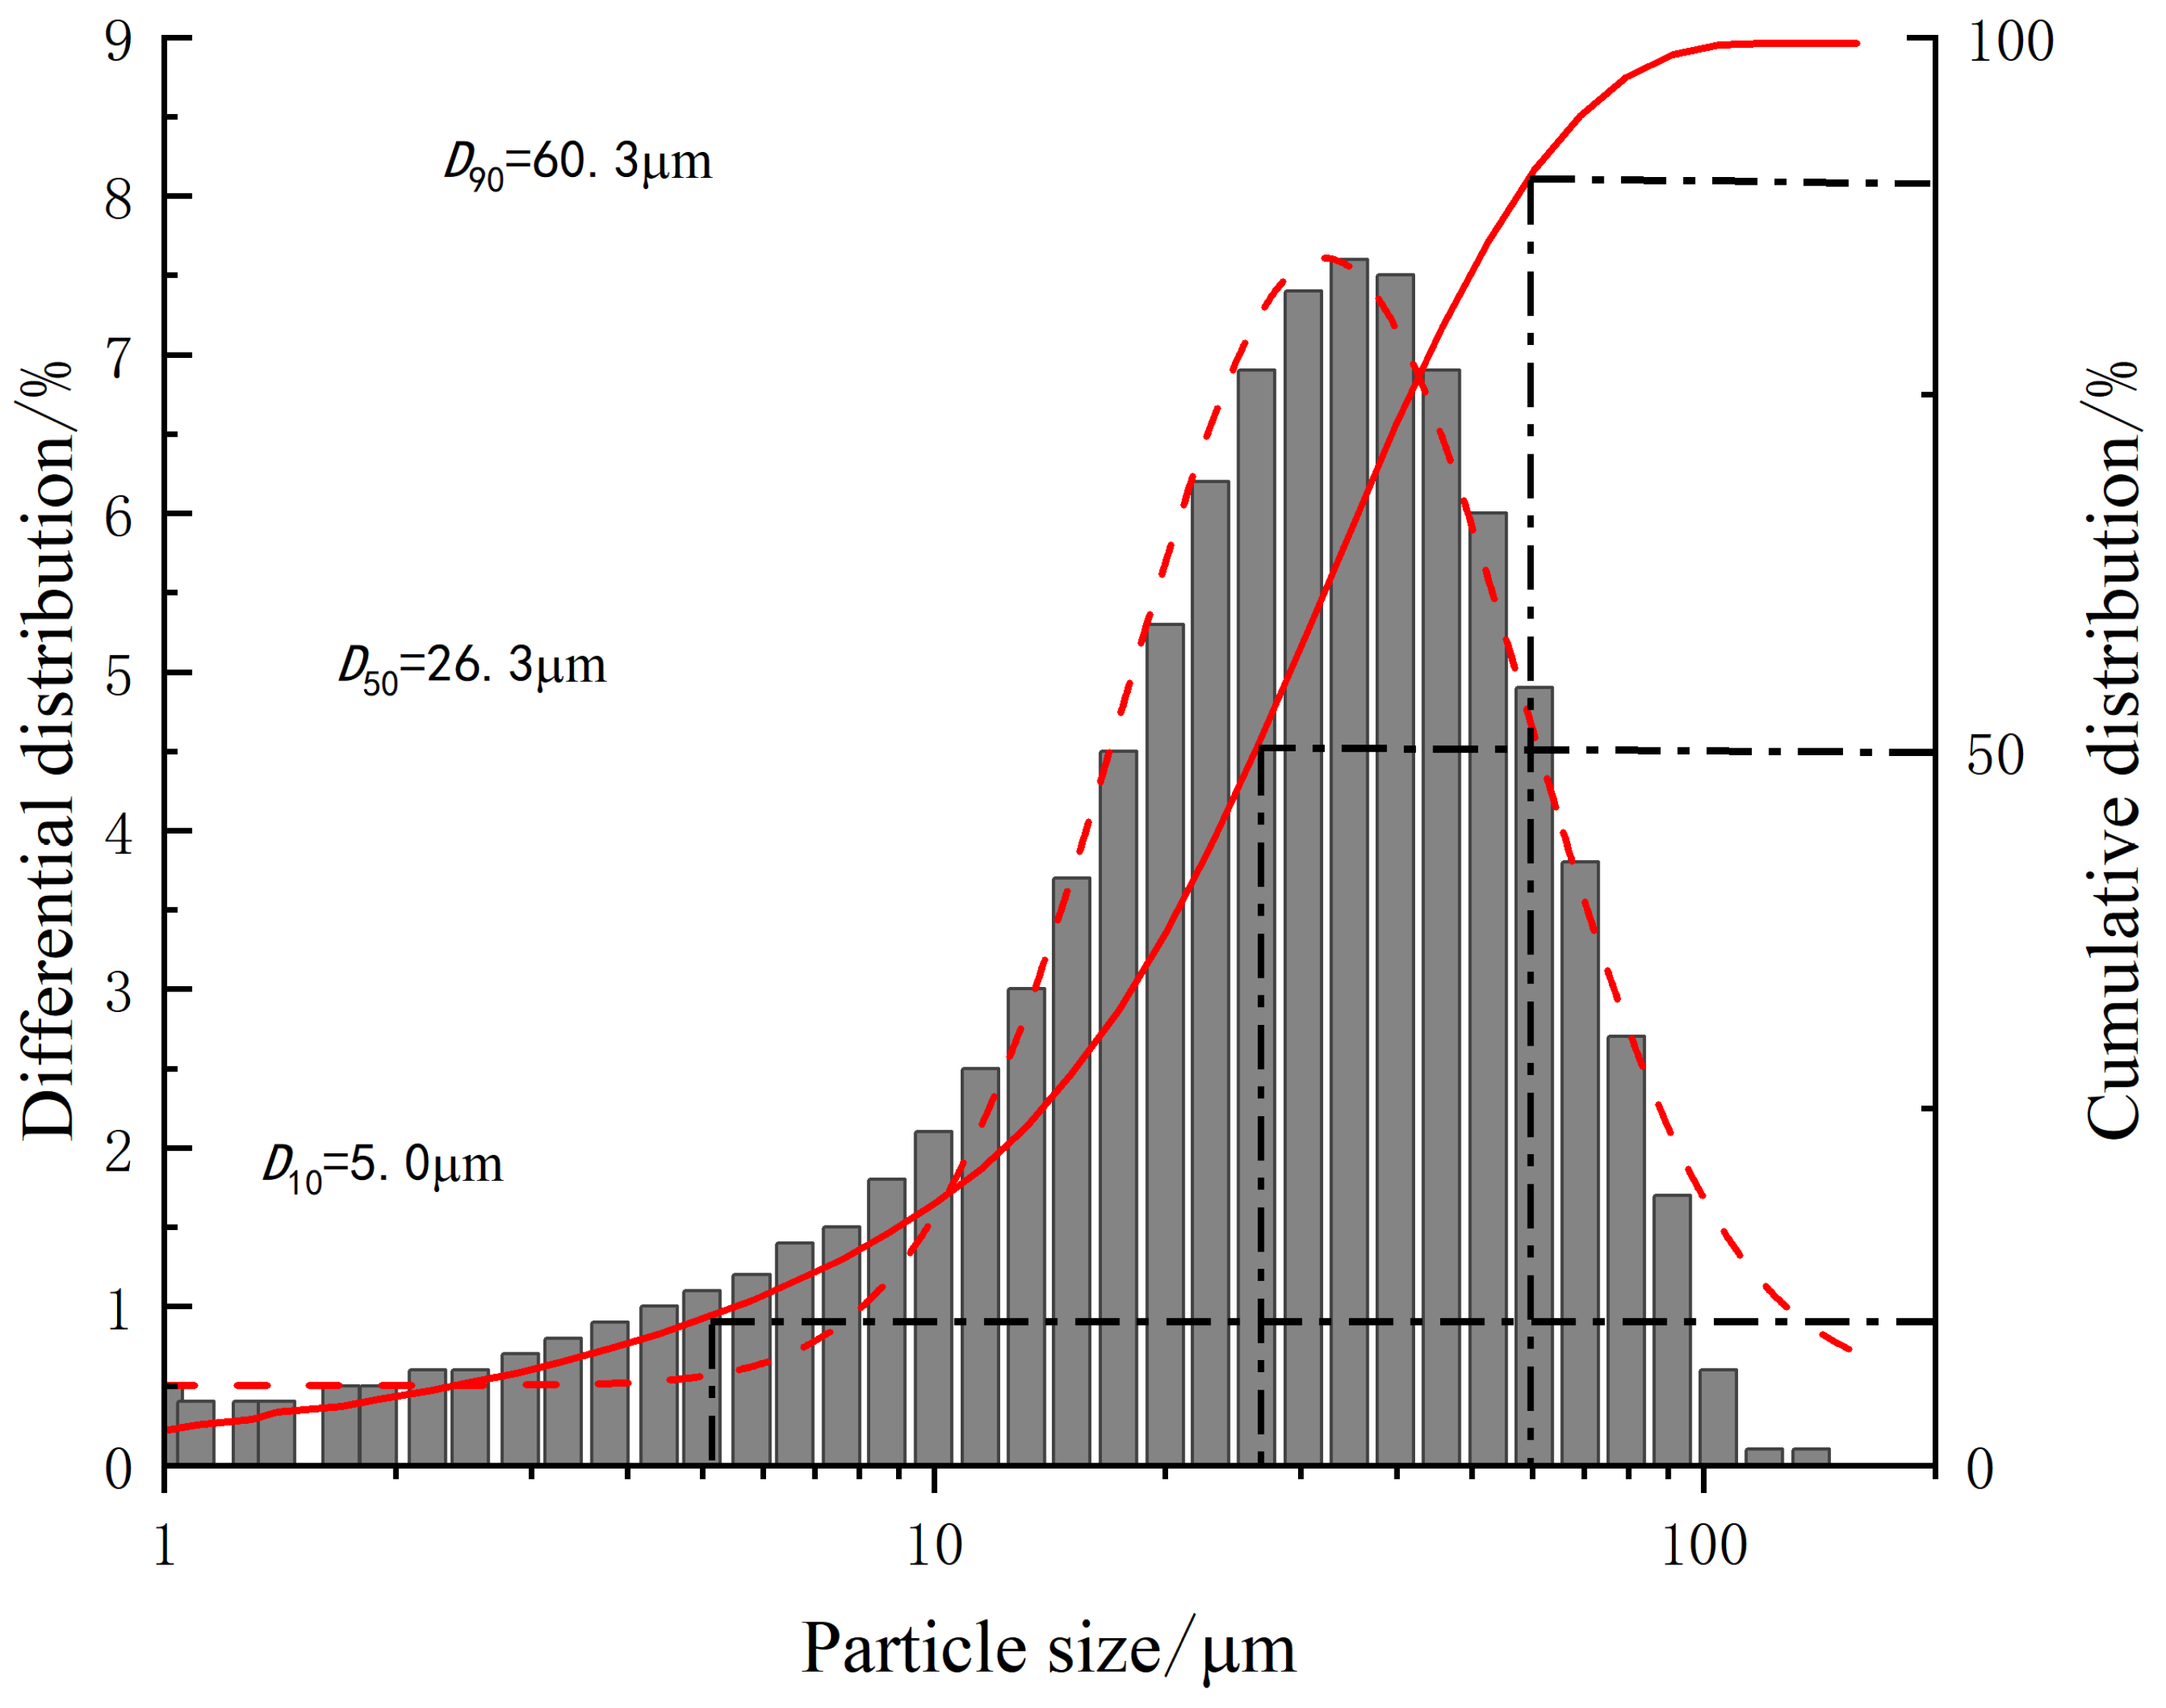
2.1. Physical Properties of Soil Samples

The soil utilized in the experiment was Qinwangchuan loess, sourced from the artesian irrigation project site in Gansu Province. The soil samples exhibited a brownish-yellow color and were primarily composed of quartz, calcite, and albite, among other constituents. According to the soil mechanics test standard of China [28], comprehensive assessments were conducted to determine the fundamental physical and mechanical properties of the soil sample. Consequently, essential physical parameters pertaining to the loess were obtained, as presented in Table 1. A laser particle size analyzer was employed for testing purposes, yielding a graphical representation of the particle size distribution within Figure 1.

2.2. Sample Preparation

According to the geotechnical test specification, the loess was reshaped into 11 groups of samples based on the design moisture content, which are 5%, 7.5%, 10%, 12.5%, 15%, 17.5%, 20%, 22.5%, 25%, 27.5%, and 30%, respectively. The sample preparation process can be divided into five steps, as illustrated in Figure 2: (1) The collected loess is placed in a constant temperature drying oven at 105 °C for 24 h to evaporate the water. (2) The dried loess is crushed and sieved using a screen with a hole size of 1.25 mm. (3) An appropriate amount of pure water is uniformly sprayed onto the dried and sieved loess to achieve the desired moisture content. (4) The moistened loess is sealed in a plastic bag and placed in a drying dish for 48 h to ensure uniform moisture distribution. (5) By controlling the dry density within the range of undisturbed soil (1.55–1.62 g/cm3), the required loess sample with a dry density of 1.55 g/cm3 is prepared. A cylindrical specimen with a diameter of 39.1 mm and a height of 80 mm is prepared using the static pressure method for NMR and acoustic wave tests. In the resistivity test, a sample with a density of 1.55 g/cm3 is prepared using the layered compaction method. Three soil samples are prepared for each moisture content group, resulting in a total of 33 soil samples. Tests are conducted successively, and the average value of test results is taken for each group of samples.

2.3. Test Methods

2.3.1. Low-Field NMR Test

NMR is employed to acquire information about the fluid containing H nuclei in the sample through interaction with an external magnetic field. NMR tests on soil samples with varying moisture content were conducted using the MesoMR23-060H NMR analyzer manufactured by Suzhou Niumai Technology Co., Ltd. (Suzhou, China) The instrumentation and testing process are illustrated in Figure 3.

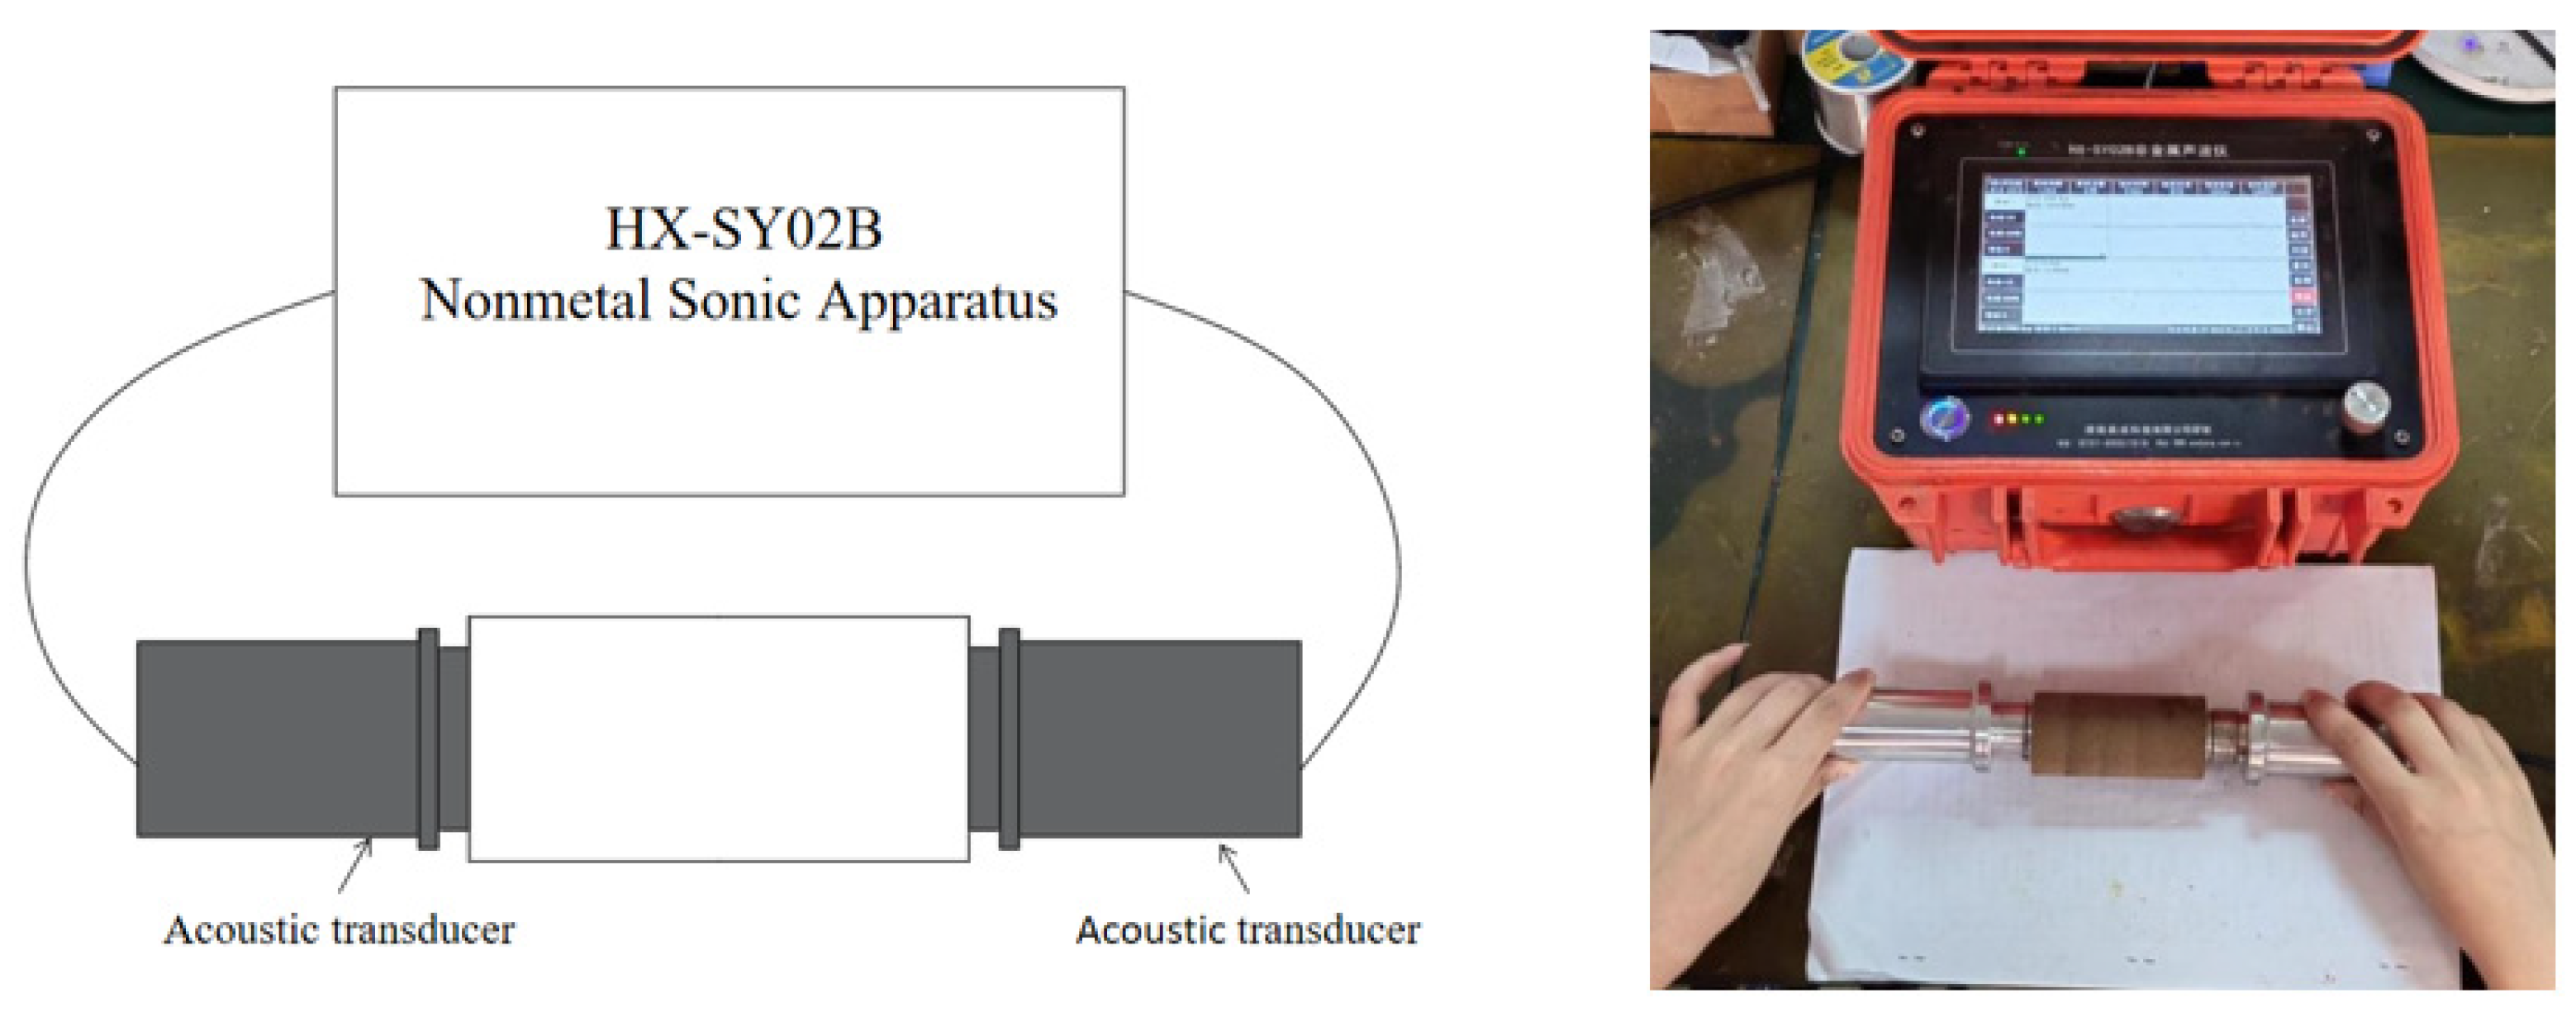
2.3.2. Wave Velocity Test

The HX-SY02B non-metallic acoustic meter, manufactured by Hunan Aocheng Technology Co., Ltd. (Changsha, China), was utilized to measure the sound velocity at three distinct positions of each specimen using the acoustic time rod test method and Vaseline as a coupling agent. During the test, two ultrasonic P-wave transducers (transmitting and receiving probes) were positioned at both ends of the circular section of the sample, as illustrated in Figure 4. The transmitting probe emitted a pulse wave that propagated through the soil sample and was subsequently received by the receiving probe at the opposite end.

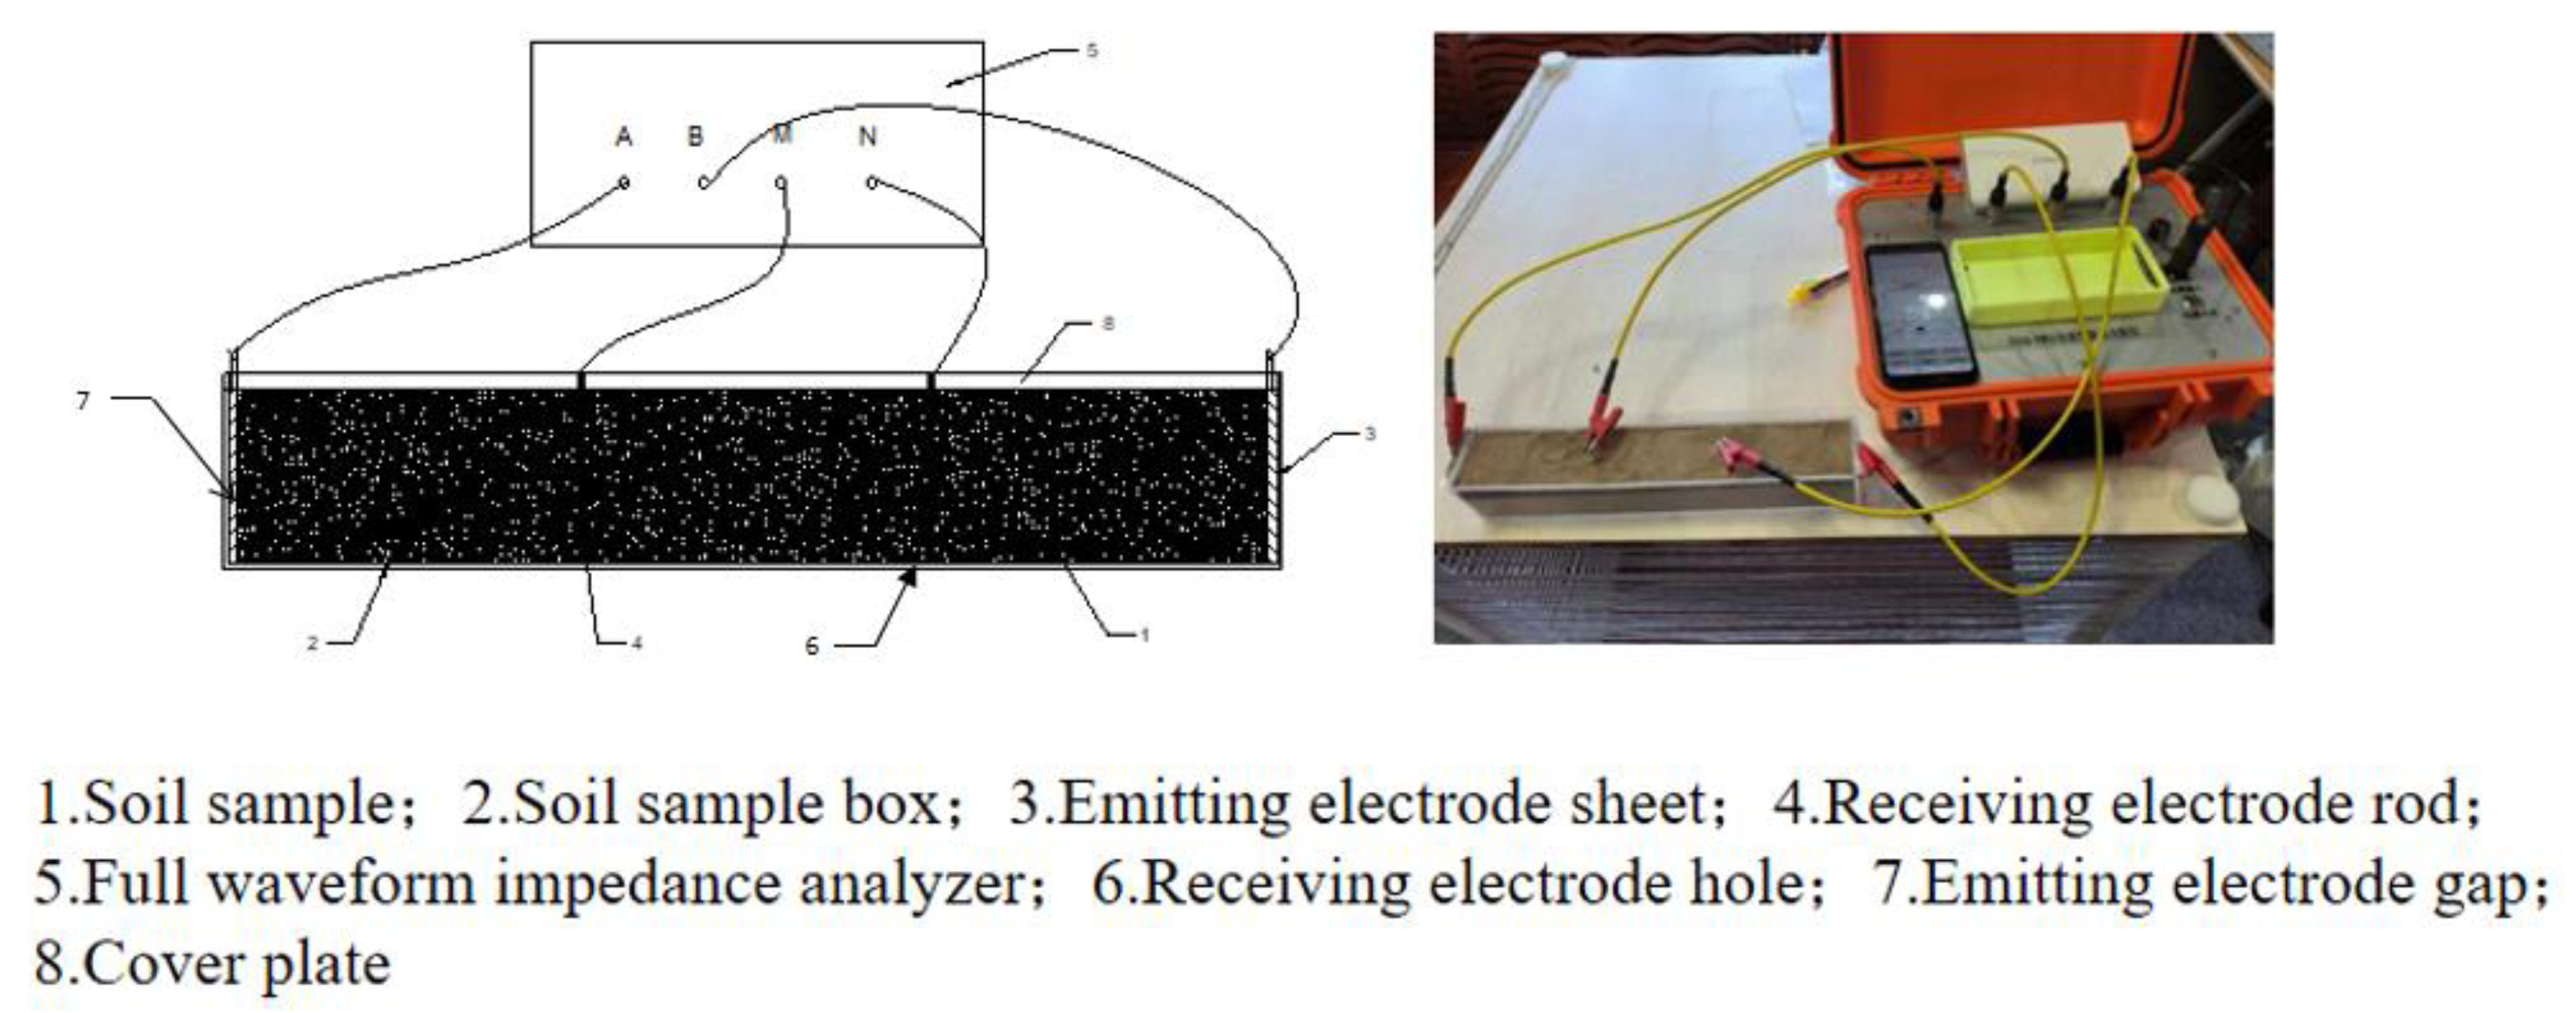
2.3.3. Resistivity Test

The resistivity was tested using the four-phase electrode method, with the full waveform impedance analyzer independently developed by Central South University. The size of the test box was 30 cm × 5 cm × 5 cm (length × width × height), constructed from a transparently insulated hard acrylic plate. The transmitting electrode plate (3) consisted of a silver sheet, while the receiving electrode rod (4) was made of silver (refer to Figure 5).

3. Results

3.1. T2 Spectrum Distribution of Soil Samples with Different Moisture Content

Low-field NMR technology can describe the movement and existing state of water in the sample and the pore distribution of soil structure [29]. Figure 6 illustrates the T2 spectrum distribution of soil samples with varying moisture content, revealing three distinct spectral peaks. These peaks correspond to different pore size intervals within the samples. The primary peak, located on the left side, represents small-sized pores ranging from 0.005 to 0.08 ms and predominantly contains bound water. Its T2 spectral area accounts for over 80% of the total spectral area, indicating that small-sized pores dominate the soil sample’s structure. The other two peaks occupy a smaller proportion and are distributed between 0.3–0.8 ms and 2–8 ms, respectively, reflecting free water present in macropores [30].
With the increase in moisture content, the signal amplitude of the three spectral peaks gradually increases, especially the main peak, which exhibits a significant enhancement. This observation suggests that as moisture content rises, it infiltrates into smaller-sized pores, leading to signal amplification and increased amplitude. Furthermore, there is a noticeable rightward shift in the second wave peak accompanied by an increase in both peak height and spectral area. These findings indicate that with increasing moisture content, water molecules penetrate deeper into the soil matrix, causing continued expansion of the pore radius and a tendency to enter medium-sized pores.
The NMR porosity changes of soil samples with varying moisture content are depicted in Figure 7. It is evident that with the increase in moisture content, the porosity of soil samples generally shows an increasing trend. When the mass moisture content is less than 20%, the water porosity demonstrates a linear increase with respect to mass moisture content. However, beyond this threshold, while pore moisture content continues to increase linearly with mass moisture content, there is a significant change in the rate of increase, indicating alterations in the internal structure of the soil. When the coherent density loess samples are prepared by the compaction method, the moisture content is different, the law of compaction energy transfer is different, and the stress path and compaction energy are different, which causes differences in the pore ratio of the samples.

3.2. The Variation in Resistivity as a Function of Moisture Content

The resistivity variation curve of the loess sample with moisture content is depicted in Figure 8. It can be observed that the change process of loess resistivity with moisture content can be categorized into two distinct stages:
Stage 1: Rapid descent stage. When the moisture content increases from 5% to 20%, the resistivity of soil samples decreases rapidly. This is because when the soil moisture content is low, the solid particles in the soil are not easily compressed and compacted, the soil saturation is low, and there is a certain amount of gas in the pores, while the current is mainly conducted through the solid particle skeleton in dry soil or low moisture content soil, which leads to high resistivity of the soil. With the increase in moisture content, water enters the gaps between solid particles in the soil, air in the soil is squeezed out, and current begins to conduct through the connected pore water. The resistivity of tap water is about 12.5–200 Ω·m [31], which is much smaller than that of solid particles, thus causing the resistivity to decrease rapidly with the increase in moisture content in the soil.
Stage 2: Slow descent stage. As the moisture content increased from 20% to 30%, the resistivity of the soil sample still showed a downward trend, but the change was small. This is because after the moisture content of the soil sample reaches 20%, the pores between the soil particles in the sample are almost all filled with water to saturation, and the connectivity of pore water between solid particles in the soil has gradually reached a good state. The continuous increase in moisture content has little effect on the connectivity of pore water, which leads to the resistivity of soil samples tending to a stable state.
According to Figure 8, there is a negative correlation between resistivity ρ and moisture content ω , which can be fitted by a power function, namely the following:
ρ = 248.28 ω 2.0273

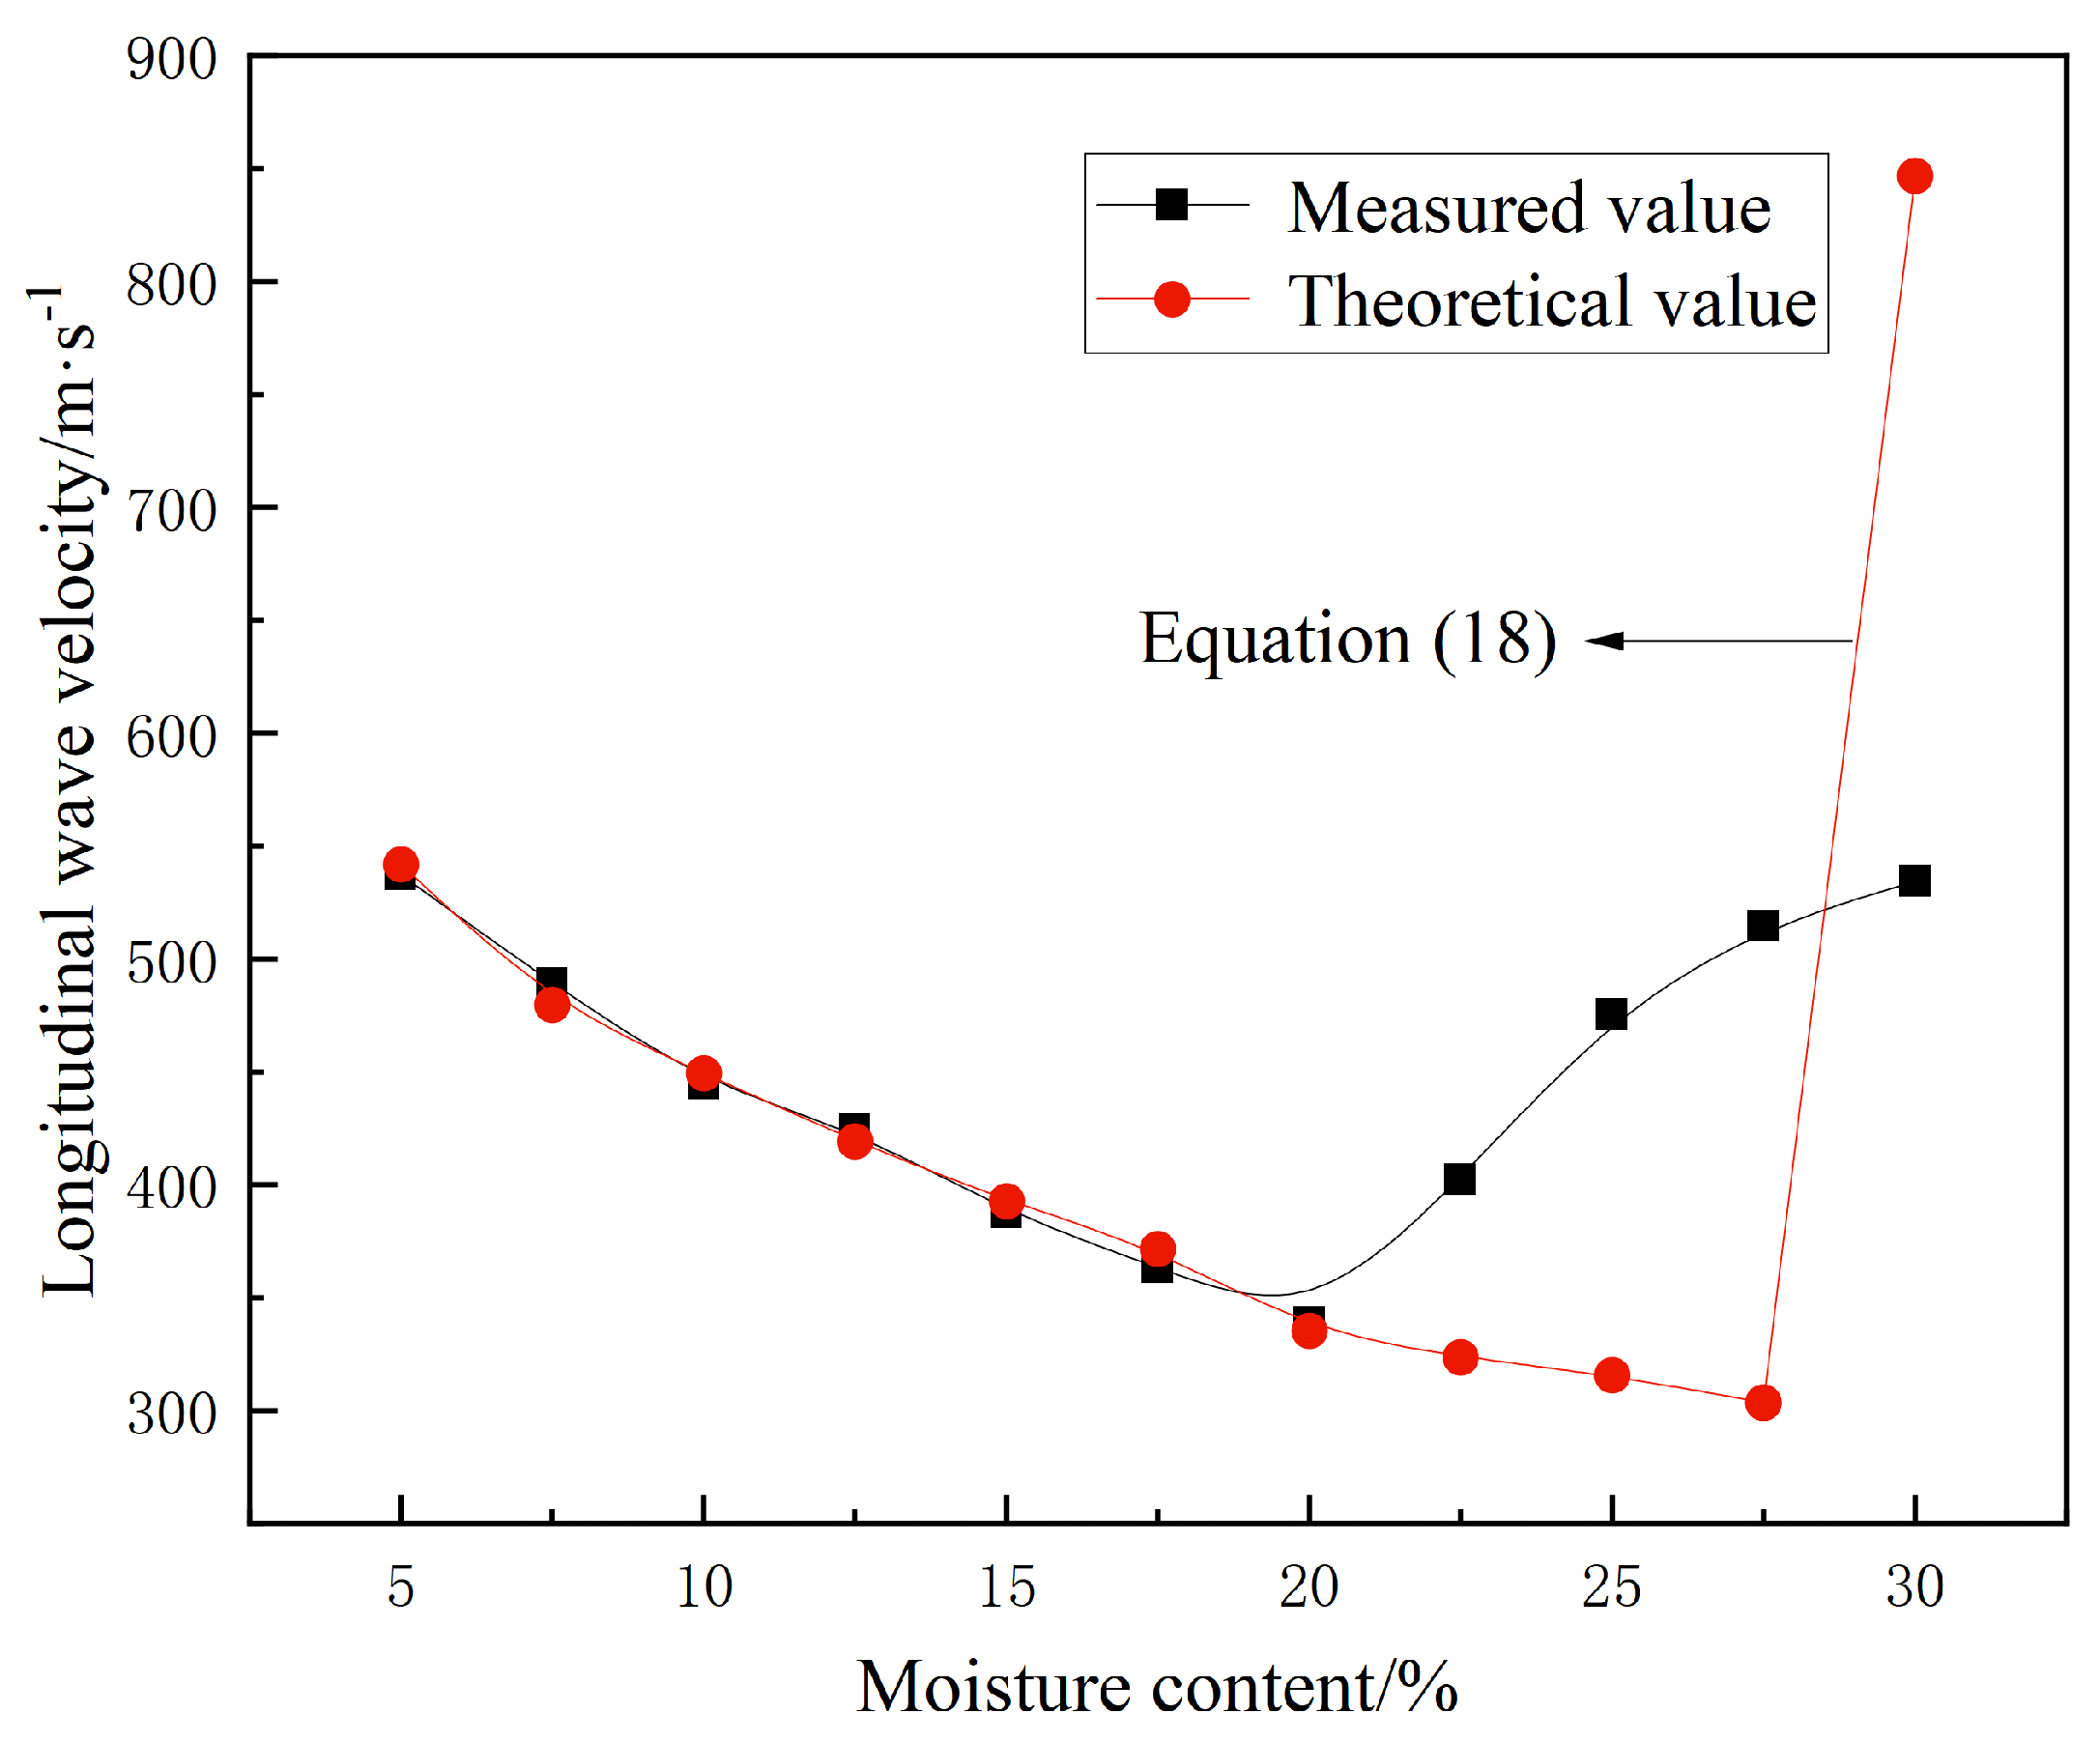
3.3. The Variation in Longitudinal Wave Velocity as a Function of Moisture Content

Figure 9 illustrates the saturation-dependent variation of wave velocity for samples with varying porosity. The process of change can be categorized into two distinct stages:
Stage 1: Rapid descent stage. As the moisture content of the sample increases from 5% to 20%, there is a significant decrease in longitudinal wave velocity accompanied by a pronounced change rate in the curve.
According to the principles of elastic continuum mechanics, the velocity of elastic waves in soil is determined by factors such as soil density, shear modulus, and compression modulus. Specifically, the longitudinal wave velocity within a soil mass can be accurately calculated based on its compression modulus and density:
v c = M 0 ρ
The P-wave velocity, as indicated by Equation (2), exhibits a direct proportionality to the square root of compression modulus and an inverse proportionality to the square root of soil density. The main reasons for the decrease in longitudinal wave velocity of soil samples are as follows: On the one hand, the increase in moisture content leads to the increase in soil sample density, which in turn leads to the decrease in the speed of rapid square root. On the other hand, with the increase in moisture content, the dissolution, dissolution, softening, and lubrication of water molecules will lead to the softening of the skeleton of solid particles in the soil, and the cementation between solid particles will weaken, thus reducing the compressive modulus. Combined with the T2 spectrum distribution characteristics of the NMR of soil samples, there are two forms of pore water in soil samples at this time. One part is adsorbed on the pore surface as bound water, and the other part exists in the pore as free water, in which free water will not vibrate synchronously with the solid skeleton of soil samples during the wave velocity test, which will cause reflection, refraction and diffraction of wave propagation, increase the wave propagation path and significantly reduce the wave velocity.
Stage 2: Rapid ascent stage. As the moisture content of the sample increases from 20% to 30%, there is a significant and rapid increase in P-wave wave speed. This is because the pores between solid particles of the soil sample are gradually filled with water, and the free space between the aqueous solution and soil sample skeleton is reduced so that the P-wave can propagate directly through the coupling body composed of solid particle skeleton and pore water, the propagation path is shortened, and the phenomena of reflection, refraction, and diffraction are weakened, which leads to the increase in P-wave velocity.
The observation in Figure 9 also reveals that when the dry density remains constant and the moisture content of the soil sample, i.e., saturation, surpasses a specific threshold value, there is a transition from a rapid decline stage to a rapid rise stage in P-wave velocity. This phenomenon aligns with previous research findings [32,33,34] on the relationship between P-wave velocity and saturation in rock materials and rock-like materials, which is referred to as the saturation threshold value. The saturation threshold is influenced by various factors, such as soil matrix and mineral composition, exhibiting significant variations. Additionally, different soil samples possess distinct particle compositions, cementation modes, and porosity. Therefore, determining the saturation threshold requires specific test data.

4. Analysis and Discussion

4.1. Theoretical Analysis of Relation between Moisture Content and Resistivity

Saturation is a crucial characteristic of unsaturated soil, denoting the extent to which the soil pores are filled with water. It can be determined by considering both the moisture content and porosity of the soil. To investigate the correlation between the resistivity of unsaturated loess and P-wave velocity, saturation is introduced for analysis purposes. The calculation formula for saturation is as follows:
S = ω G e 0
where ω is the soil moisture content, G is soil relative density, e 0 is the soil pore ratio. Based on the relationship between pore ratio e 0 , relative density G , moisture content ω , dry density ρ d , and compactness k .
e 0 = G ρ d 1
ρ d = k ρ d max
According to the aforementioned relationship, it can be derived as follows:
S = ω k 1 ρ d max k G
According to Equation (6), under constant dry density, the saturation of soil samples increases with increasing moisture content. The corresponding saturation values of loess samples at different moisture contents are presented in Table 2. Based on this relationship, when both dry density and density remain constant, changes in the moisture content of remodeled loess can be reflected by variations in saturation. The fitting relationship between resistivity and saturation of loess can be expressed by Equation (7), which aligns with the exponential correlation observed between resistivity and saturation in the unsaturated soil resistivity model established by Keller and Friscbkn [7].
ρ = 248.28 1 ρ d max k G k S 2.0273
Friscb
Table 2. Saturation of soil samples with different moisture content.
Moisture Content/%57.51012.51517.52022.52527.530
Saturation0.180.270.360.450.540.630.720.810.910.991

4.2. Theoretical Analysis of Relation between Moisture Content and Wave Velocity

Brutsaert proposed the classical theory of soil acoustic wave propagation [35], and Adamo et al. verified and converted the theory to obtain the theoretical formula of acoustic wave propagation speed in the soil as follows [36]:
υ c = ψ 0.306 p e 1 / 3 ρ t o t f Z
where, ψ is only related to the type of soil, can be expressed as ψ = a 1 / 2 b 1 / 3 , a and b are the soil acoustic constant, the value range of a is [0, 1], and the value range of b is [10-12, 10-10].
ρ tot is the bulk density of soil given by Equation (9):
ρ t o t = 1 f ρ s + f S ρ ω
where ρ s is the density of solid particles in the soil and ρ ω is the density of water in the soil, which is constant. So, ρ tot depends on soil saturation.
P e is the effective stress of soil, encompassing the influence of water and air, reflecting the soil’s capacity to withstand compression and shear forces. This can be mathematically expressed as follows:
P e = P t χ P c P a
where P t is the total soil pressure; P c is the pore water pressure; P a is the pore air pressure, which can be disregarded due to its minimal influence; and χ is a parameter closely associated with soil saturation and can be approximated by saturation.
Therefore, Formula (10) can be simplified as follows:
P e = P t S P c
P t and P c can be obtained from Equation (12):
P t = ρ t o t g H
where g is the acceleration of gravity and H is the depth of soil, according to Van Genuchten’s theoretical model [37].
Pore water pressure can be expressed by Equation (13):
P c = ρ ω G α S e 1 m 1 1 n
where α , n , and m = 1 1 / n are only related to soil type; S e is the effective saturation.
S e can be obtained from Equation (14):
S e = S S r S t o t S r
where total saturation S t o t can be expressed by porosity f; residual saturation S r is a constant only related to the type of soil, so effective saturation depends on S.
Z is affected by the distribution of water in the soil, and the expression is follows:
Z = 1 + 30.75 k e 3 / 2 b P e 1 / 2 5 / 3 1 + 46.12 k e 3 / 2 b P e 1 / 2 1
Equation (15) reveals that, apart from the constant b and effective stress P e , Z is also influenced by the effective bulk modulus k e . Let k ω and k α represent the bulk modulus of water and air respectively. Assuming an even distribution of water in the soil, we can express the bulk modulus using Equation (16):
1 k e = S k ω + 1 S k α
Conversely, in the case of uneven distribution of water in the soil, the volume modulus is expressed as follows:
k e = S k ω + k α 1 S
When the soil moisture content is uniformly distributed, Z remains unchanged with variations in saturation S and closely approximates 1. Only when saturation S reaches 1, indicating complete soil saturation, does Z exhibit a sudden increase. Consequently, the theoretical formula for acoustic wave propagation velocity in unsaturated soil with uniform moisture content distribution can be simplified as follows:
υ c = ψ 0.306 p e 1 / 3 ρ t o t f
As observed from Equation (18), the downward trend of wave velocity in unsaturated soil with increasing moisture content is consistent with the declining section of the experimental results depicted in Figure 10. These findings demonstrate a good agreement between theoretical and measured values, indicating an approximately uniform distribution of pore fluid within the soil samples.
In the rapid rising stage, the measured wave velocity increases rapidly with the increase in moisture content, while the theoretical value decreases slowly with the increase in moisture content. When the moisture content reaches 30%, that is, when the soil sample reaches saturation, the wave velocity suddenly rises, and there is a big difference between them.
The significant disparity between the theoretical and measured values of wave velocity during rapid rise can be attributed to the high moisture content in this stage, as well as the uneven distribution of fluid within the soil sample due to gravitational effects and other factors, which deviates from the assumption of uniform fluid distribution underlying the theoretical formula. This discrepancy arises because the theoretical model assumes complete homogeneity of fluid distribution within the soil sample. Upon reaching saturation (i.e., a value of 1), the fluid within the soil sample consists solely of water without any gas, leading to a sudden increase in bulk modulus, effective bulk modulus, and Z value of the soil sample, consequently resulting in a rapid surge in wave velocity. As a consequence, the measured value of wave velocity is considerably lower than its corresponding theoretical value.

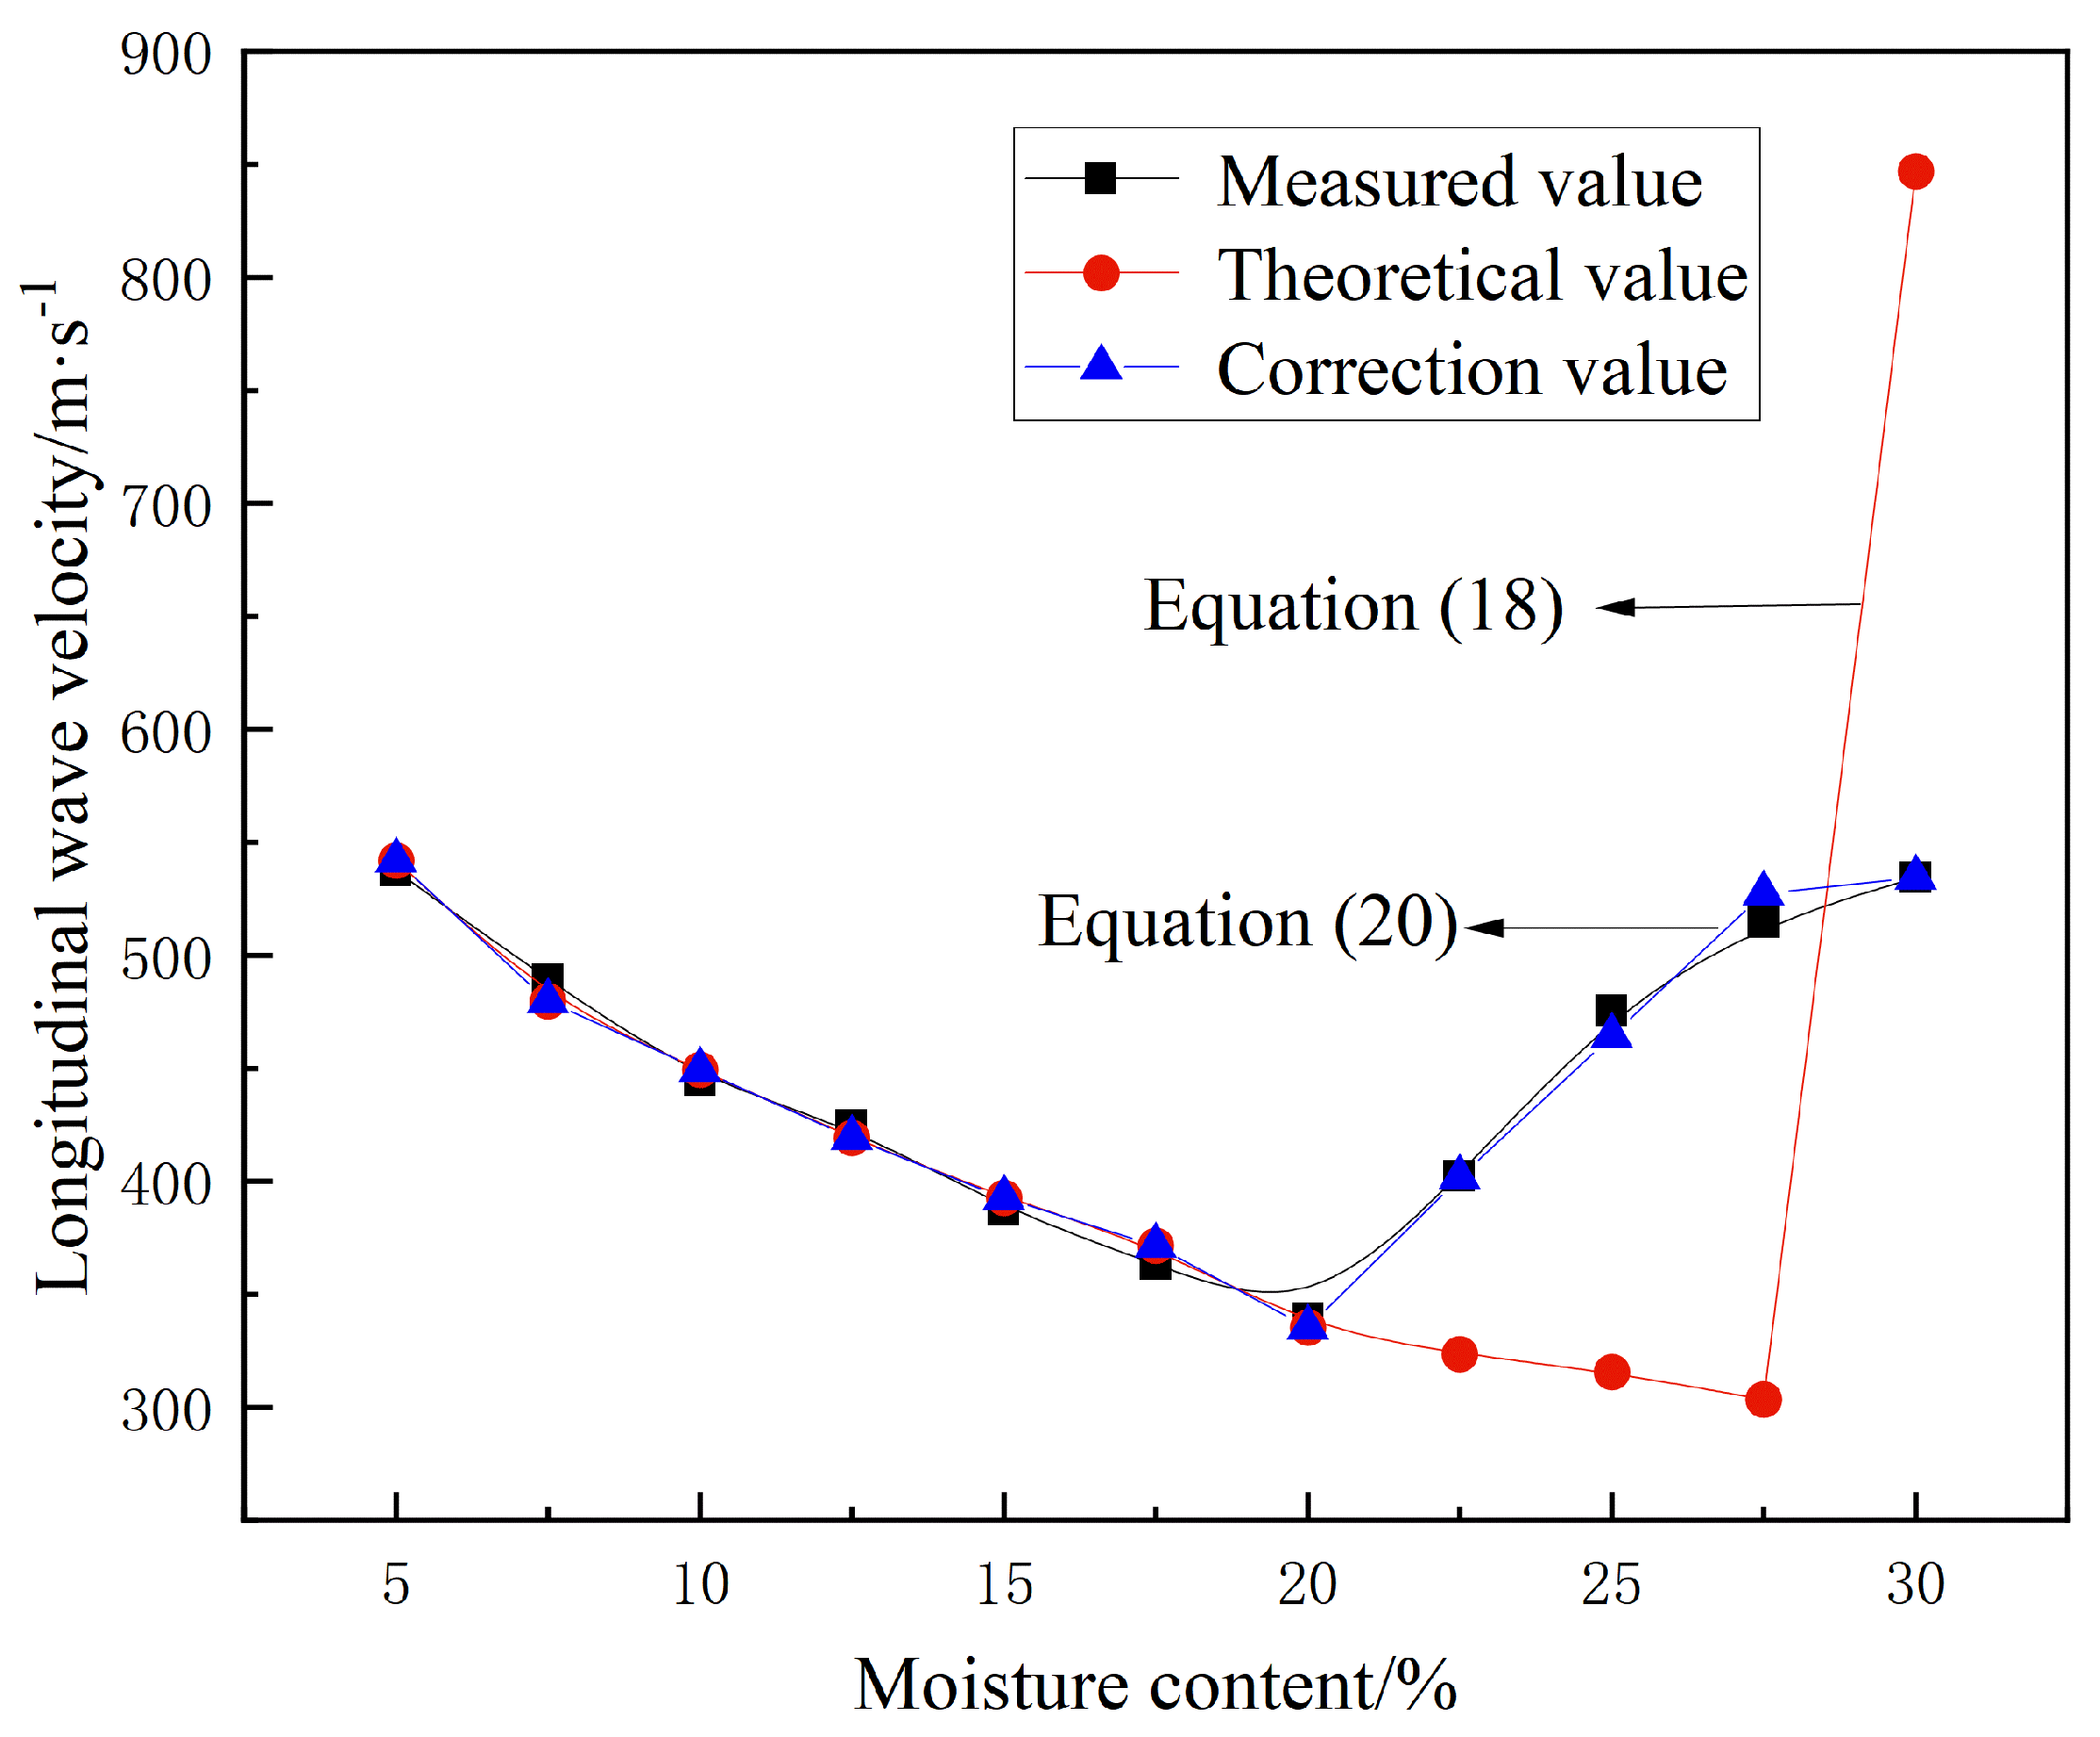
4.3. Analysis of Soil Wave Velocity Propagation Based on Modified Theoretical Model

Based on the aforementioned analysis and test results, it is evident that the conventional theoretical model cannot be applied to the section characterized by a rapid increase in wave velocity. Consequently, there is a need to modify the formula used to calculate the variation of wave velocity with moisture content in this particular section. In this study, when the moisture content of the soil sample reaches 20%, which corresponds to a saturation threshold of 0.72, it can be observed that under various influences such as gravity, etc., the pore fluid within the soil sample does not distribute uniformly. At this juncture, it becomes possible to consider the soil sample as comprising two distinct portions: one portion being fully saturated and another portion having a saturation level of 0.72. As a result, an expression for wave velocity can be formulated as follows:
v c = S S t 1 S t v c s + 1 S S t 1 S t v c t
where S t is the threshold value of water saturation, which is 0.72 in this paper; v c t is the wave velocity corresponding to the threshold value of saturation; and v c s is the wave velocity at full saturation.
Therefore, with the increase in moisture content and saturation, the correction expression of wave velocity in loess can be expressed as follows:
v c = ψ 0.306 P e 1 / 3 ρ t o t f   S < S t S S t 1 S t v c s + 1 S S t 1 S t v c t S S t
The comparison between the revised theoretical calculations and experimental results is presented in Figure 11. It is evident that the modified theoretical calculations exhibit a closer agreement with the experimental data, effectively capturing the variation pattern of wave velocity in loess samples during the second stage.

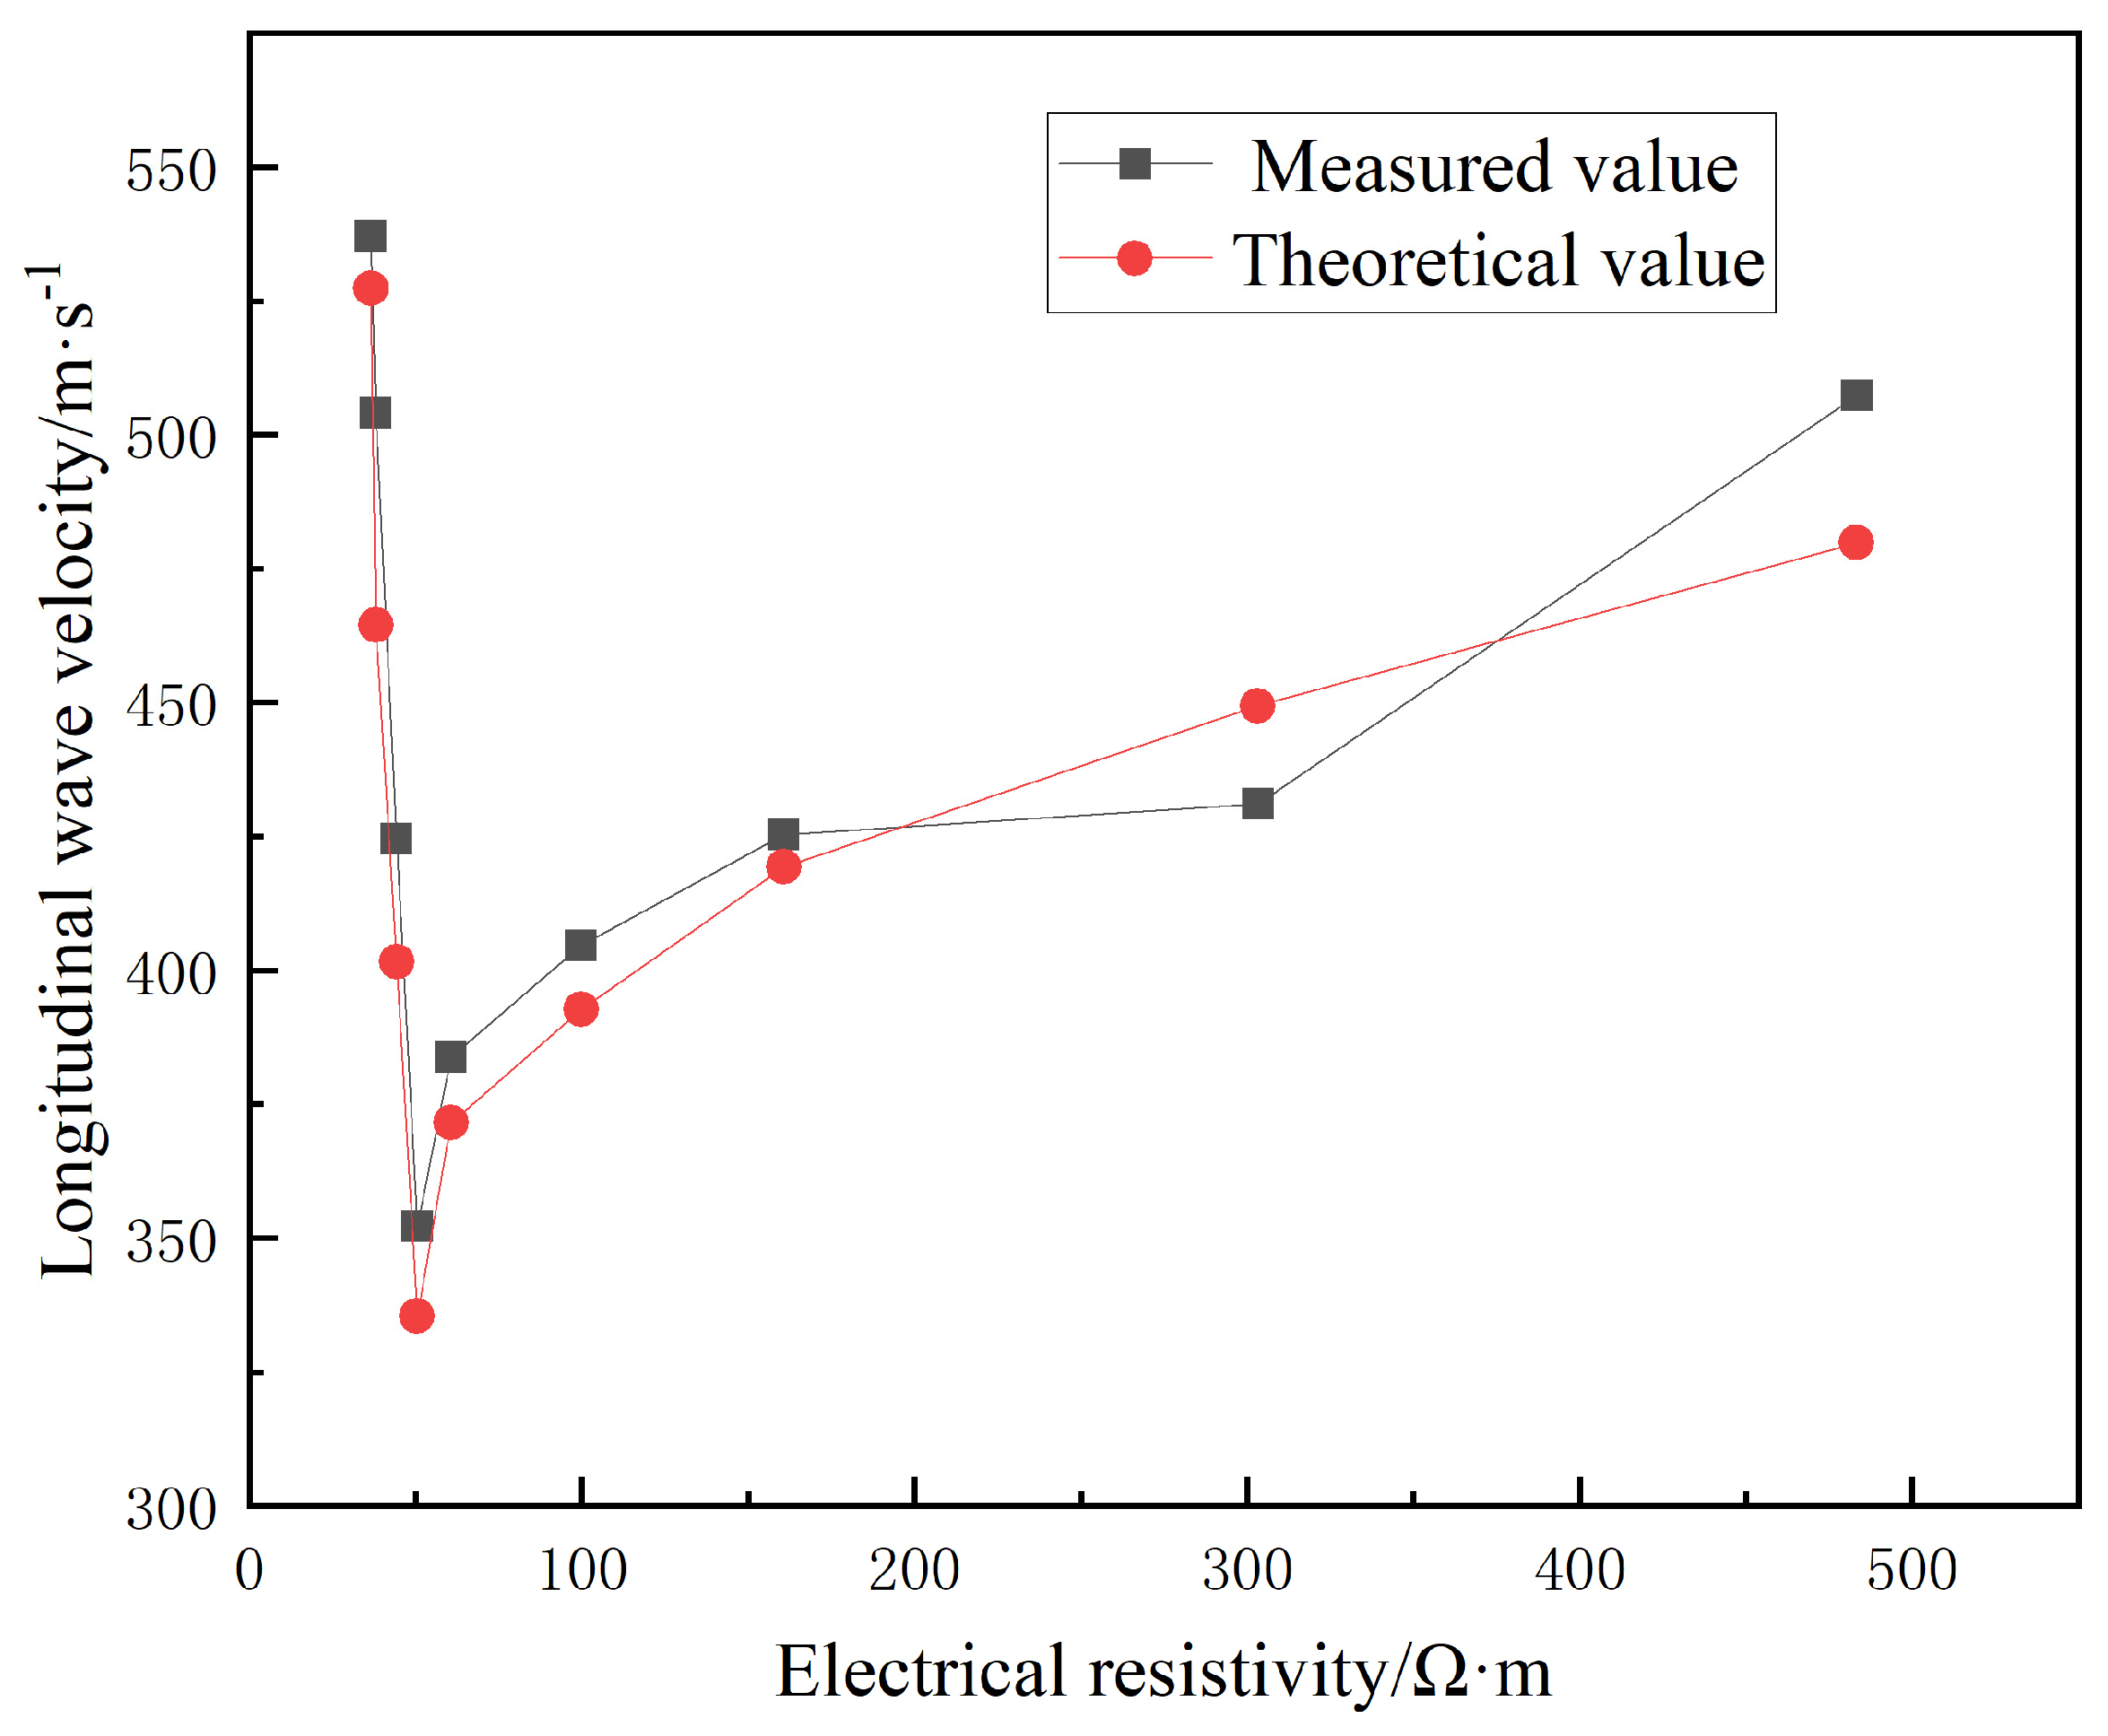
4.4. The Relationship Model between Resistivity and Wave Velocity and Verification

According to Expression (7) regarding the relation between resistivity and saturation derived in Section 3.2, the following can be obtained:
S = ρ 1 2.0273 248.28 · k 1 ρ d max k G
By replacing saturation S in Equation (20) with Equation (21), the quantitative relationship between wave velocity and resistivity can be obtained.
In order to validate the universality of the revised formula proposed in this paper, an additional set of loess samples was collected to test resistivity and wave velocity at different moisture content levels under identical dry density conditions. Simultaneously, the wave velocity values were computed using Equations (20) and (21). The comparison between the calculated results and experimental data is presented in Figure 12, demonstrating a consistent agreement between them.

5. Conclusions

1.
With the increase in moisture content, the water-bearing porosity of loess samples increases, the small pores gradually expand into large pores, and the proportion of free water increases, which affects the resistivity and longitudinal wave propagation.
2.
Under constant dry density conditions, with increasing moisture content, the resistivity gradually decreases until it stabilizes, indicating a power function type of relationship. The changes in wave velocity with respect to moisture content can be divided into two stages: rapid decline followed by rapid rise. The theoretical model of soil wave velocity is consistent with the trend of the rapid decline stage but not applicable to the rapid rise stage.
3.
Based on the assumption regarding the distribution of pore water within the loess samples, we propose a refined relationship between wave velocity, moisture content, and saturation. The accuracy of this revised formula is validated through a comparison with measured data.
4.
Taking moisture content and saturation as a bridge, the relationship expression between wave velocity and resistivity of loess is obtained, and the calculated results of this expression are basically consistent with the actual test data. It can provide a theoretical model for the mutual characterization of loess resistivity and wave velocity in practical engineering and the joint inversion of wave velocity and resistivity in integrated geophysical exploration. At present, the correctness of this model has only been verified in the laboratory, and the next focus of work is to further verify the applicability of this model in different engineering settings.

Author Contributions

Conceptualization, J.L.; data curation, Z.Z.; formal analysis, T.Z. and D.L.; funding acquisition, J.L.; investigation, Z.Z. and J.T.; methodology, T.Z., J.L., D.L. and J.T.; project administration, J.L.; resources, Z.Z. and J.T.; supervision, J.L.; validation, T.Z. and D.L.; visualization, T.Z.; writing—original draft, T.Z.; writing—review and editing, J.L. All authors have read and agreed to the published version of the manuscript.

Funding

This research was funded by the National Key Research and Development Program of China, grant number 2021YFC309401; the Fundamental Research Funds for the Central Universities of Central South University (2022ZZTS0563).

Data Availability Statement

The datasets generated during and/or analyzed during the current study are available from the corresponding author upon reasonable request. The data are not publicly available due to privacy.

Acknowledgments

This study was supported by the above-mentioned funds. We also thank the School of Civil Engineering of Central South University for providing the testing support.

Conflicts of Interest

The authors declare no conflicts of interest.

References

  1. Sun, P.; Zhang, M.; Jia, J.; Cheng, X.; Zhu, L.; Jiang, J.; Xun, Q. Geo-hazards research and invesgation in the loess regions of western China. Noethwest. Geogoly 2022, 55, 96–107. [Google Scholar]
  2. Tang, X.; Zhang, W.; Dong, C.; Tang, F.; Liu, C. Evolution of cumulative plastic strain in loess under freeze-thaw cycles. China Earthq. Eng. J. 2024, 46, 136–145. [Google Scholar]
  3. Yang, Z.; Zhang, J.; Zhang, S.; Yan, C. Research progress on foundation treatment techniques of expressway in Loess Area. J. Chang. Univ. (Nat. Sci. Ed.) 2022, 42, 16–32. [Google Scholar]
  4. Hong, Q.; Lai, H.; Liu, Y. Failure analysis and treatments of collapse accidents in loess tunnels. Eng. Fail. Anal. 2023, 145, 107037. [Google Scholar] [CrossRef]
  5. Xue, J.; Wei, Z.; Zhang, W.; Zhao, X.; Zhang, F.; Liu, X. Study on the seismic reinforcement of damaged underground loess cave dwellings by shaking table test. Eng. Mechanics. 2024, 1–14. [Google Scholar]
  6. Zhang, S.; Chen, X. Ecological design of loess building materials. Shanxi Archit. 2021, 47, 18–20. [Google Scholar]
  7. Feng, L.; Zhang, M.; Jin, Z.; Zhang, S.; Sun, P.; Gu, T.; Liu, X.; Lin, H.; An, Z.; Peng, J.; et al. The genesis, development, and evolution of original vertical joints in loess. Earth Sci. Rev. 2021, 214, 103526. [Google Scholar] [CrossRef]
  8. Zhang, M.; Sun, P.; Cheng, X.; Zhu, L.; Xun, Q. Geo-Hazards Research Report in the Loess Region of Northwest China; Xi’an Geological Survey Center, China Geological Survey: Xi’an, China, 2015. [Google Scholar]
  9. Manli, S.; Fei, F.; Yunxia, S. Review on soil moisture content measurement methods. J. Northwest Univ. (Nat. Sci. Ed.) 2019, 49, 219–229. [Google Scholar]
  10. Meju, M.A.; Gallardo, L.A.; Mohamed, A.K. Evidence for correlation of electrical resistivity and seismic velocity in heterogeneous near-surface materials. Geophys. Res. Lett. 2003, 30. [Google Scholar] [CrossRef]
  11. Archie, G.E. The electrical resistivity log as an aid in determining some reservoir characteristics. Trans. AIME 1942, 146, 54–62. [Google Scholar] [CrossRef]
  12. Keller, G.V.; Frischknecht, F.C. Electrical Methods in Geophysical Prospecting; Pergamon Press: New York, NY, USA, 1966. [Google Scholar]
  13. Waxman, M.H.; Smits, L.J.M. Electrical conductivities in oilbearing shaly sands. Soc. Pet. Eng. J. 1968, 8, 107–122. [Google Scholar] [CrossRef]
  14. Rhoades, J.D.; Raats, P.A.C.; Prather, R.J. Effects of liquid-phase electrical conductivity, moisture content, and surface conductivity on bulk soil electrical conductivity. Soil Sci. Soc. Am. J. 1976, 40, 651–655. [Google Scholar] [CrossRef]
  15. Rinaldiv, A.; Cuestasg, A. Ohmic conductivity of a compacted silty clay. J. Geotech. Geoenvironmental Eng. 2002, 128, 824–835. [Google Scholar] [CrossRef]
  16. Zhou, M.; Wang, J.; Fan, X.; Huang, S.; Dou, P.; Wang, Y. Temperature Correction Models for Soil Electrical Resistivity in Pearl River Delta. High Volt. Eng. 2012, 38, 623–631. [Google Scholar]
  17. Hadzick, Z.Z.; Guber, A.K.; Pachepsky, Y.A.; Hill, R.L. Pedotransfer functions in soil electricalresistivity estimation. Geoderma 2011, 164, 195–202. [Google Scholar] [CrossRef]
  18. Zhang, L.; Pan, B.; Li, Z.; Mo, X.; Xia, Z.; Xu, W. New three-water conduction model and its application in evaluation of low porosity and low permeability reservoir. Oil Geophys. Prospect. 2010, 44, 4011. [Google Scholar]
  19. Zhu, C.H.; Li, N. Mesoscopic deformation mechanism of loess high-fill foundation based on soil electrical resistivity. Chin. J. Rock Mech. Eng. 2013, 32, 640–648. [Google Scholar]
  20. Sun, B.; Gu, T.; Kong, J.; Zhang, F.; Sun, J. Experimental Research on Relationship between Resistivity and Moisture Content of Unsaturated Loess. Northwest. Geol. 2020, 53, 216–222. [Google Scholar]
  21. Kassab, M.A.; Weller, A. Porosity estimation from compressional wave velocity: A study based on Egyptian sandstone formations. J. Pet. Sci. Eng. 2011, 78, 310–315. [Google Scholar] [CrossRef]
  22. Donohue, S.; Forristal, D.; Donohue, L.A. Detection of soil compaction using seismic surface waves. Soil Tillage Res. 2013, 128, 54–60. [Google Scholar] [CrossRef]
  23. Wei, B.; Gong, S.; Liu, B.; Liu, X.; Ouyang, Y. Changes of Expansive Soil’s Meso-structure and Its Relation with Acoustic Velocity. J. Yangtze River Sci. Res. Inst. 2016, 33, 93–97. [Google Scholar]
  24. Huang, X.; Li, D.; Ming, F.; Zhang, Y.; Bing, H. Experimental study on acoustic wave propagation properties of frozen remolded loess during uniaxial loading process. Chin. J. Geotech. Eng. 2015, 37, 1660–1667. [Google Scholar]
  25. Irfan, M.; Uchimura, T.; Chen, Y. Effects of soil deformation and saturation on elastic wave velocities in relation to prediction of rain-induced landslides. Eng. Geol. 2017, 230, 84–94. [Google Scholar] [CrossRef]
  26. Chen, Y.; Uchimura, T. Model tests of evaluation behaviors of the elastic wave velocity during the failure process of soil slopes due to rainfall. Chin. J. Rock Mech. Eng. 2019, 38, 2138–2150. [Google Scholar]
  27. Wu, Y.; Lan, H.; Huang, W. Relationship between wave velocities and moisture content of unsaturated loess. Chin. J. Geophys. 2021, 64, 3766–3773. [Google Scholar]
  28. GB/T 50123-2019; Standard for Geotechnical Test Methods. Ministry of Housing and Urban-Rural Development: Beijing, China, 2019.
  29. Tian, H.; Wei, C. A NMR-based testing and analysis of adsorbed moisture content. Sci. Sin. 2014, 44, 295–305. [Google Scholar]
  30. Kong, C.; Wang, M.; Shi, X.; Xu, S.; Guo, N.; Yang, P. Study on Water Holding Capacity and Pore Characteristics of Soils Based on LF-NMR. Acta Pedol. Sin. 2016, 53, 1130–1137. [Google Scholar]
  31. Qin, S. Determination of the resistivity of tap water. Phys. Bull. 2012, 78–79. [Google Scholar]
  32. Shi, G.; Shen, W.; Yang, D. The relationship of wave velocities with saturation and fluid distribution in pore space. Chin. J. Geophys. 2003, 46, 138–142. [Google Scholar]
  33. Deng, H.; Yuan, X.; Li, J.; He, M.; Luo, Q.; Zhu, M. Experimental research on influence of saturation degree on sandstone longitudinal wave velocity and strength. Chin. J. Rock Mech. Eng. 2013, 32, 1625–1631. [Google Scholar]
  34. Yang, W.; Song, J.; Liu, B.; Li, S.; Xu, X.; Liu, Z.; Niu, L. Experimental research on wave velocity and electrical resistivity of rock-like material during saturation process. Chin. J. Rock Mech. Eng. 2015, 34, 703–712. [Google Scholar]
  35. Brutsaert, W. The propagation of elastic waves in unconsolidated granular mediums. J. Geophys. Res. 1964, 243–257. [Google Scholar] [CrossRef]
  36. Adamo, F.; Attivissimo, F.; Fabbiano, L.; Giaquinto, N.; Spadavecchia, M. Soil moisture assessment by means of compressional and shear wave velocities: Theoretical analysis and experimental setup. Measurement 2010, 43, 344–352. [Google Scholar] [CrossRef]
  37. van Genuchten, M.T. A closed-form equation for predicting the hydraulic conductivity of unsaturated soils. Soli Sci. Soc. Am. J. 1980, 44, 892–898. [Google Scholar] [CrossRef]
Figure 1. Sample size distribution curve.
Buildings 14 00819 g001
Figure 2. Preparation of loess samples.
Buildings 14 00819 g002
Figure 3. NMR equipment and test procedure.
Buildings 14 00819 g003
Figure 4. Instrumentation and methodology for acoustic measurements.
Buildings 14 00819 g004
Figure 5. Resistivity test method.
Buildings 14 00819 g005
Figure 6. T2 spectrum of soil under different moisture content.
Buildings 14 00819 g006
Figure 7. Water porosity of soil samples with different moisture content.
Buildings 14 00819 g007
Figure 8. Relation between resistivity and moisture content.
Buildings 14 00819 g008
Figure 9. Relation between Longitudinal wave velocity and moisture content.
Buildings 14 00819 g009
Figure 10. Comparison of theoretical calculation and experimental results of wave velocity.
Buildings 14 00819 g010
Figure 11. Comparison of theoretical calculation of modified wave velocity model and experimental results.
Buildings 14 00819 g011
Figure 12. Comparison between experimental results and calculated results of the relation between P−wave velocity and resistivity.
Buildings 14 00819 g012
Table 1. Fundamental physical properties of the experimental loess.
Liquid Limit/%Plastic Limit/%Plasticity IndexOptimal Moisture Content/%Maximum Dry Density (g/cm3)Grain Composition mm/%
>0.0750.005~0.075<0.005
27.1714.1613.0213.701.8081.715.92.4
Disclaimer/Publisher’s Note: The statements, opinions and data contained in all publications are solely those of the individual author(s) and contributor(s) and not of MDPI and/or the editor(s). MDPI and/or the editor(s) disclaim responsibility for any injury to people or property resulting from any ideas, methods, instructions or products referred to in the content.

