Abstract
The negative stiffness bistable damper (NSBD) was proposed to suppress structural dynamic responses in our previous study. The vibration mitigation performance of the NSBD is influenced by its design parameters, including negative stiffness, cubic stiffness, and damping coefficients. However, it is extremely challenging to directly acquire the ideal design parameters of the NSBD owing to its inherent nonlinearity. To address this disadvantage, the optimal design approach for the NSBD, based on the equivalent linearization method (ELM) and genetic algorithm (GA), is presented in this paper. The nonlinear NSBD system can be transformed to a linear system utilizing the ELM based on the pseudo-excitation method (PEM). The linearization model that corresponds to the nonlinear NSBD is fairly accurate in its approximation and can be indicated from the numerical results. Then, the main structure’s peak response is minimized through the optimization of the design parameters of the NSBD using the H∞ norm and GA. Moreover, the proposed approach’s effectiveness is assessed using the optimal parameters to calculate the displacement responses of a tall building equipped with the NSBD during various seismic excitations. As revealed by the numerical results, the displacement of the tall building can be effectively restrained by the optimized NSBD.
1. Introduction
Structural vibration control is well developed but is still a potentially developing field and is an effective earthquake protection method for building structures in civil engineering [1]. Based on different types of damping strategies, structural control approaches are often categorized as passive control, active control, semi-active control, and hybrid control [2]. Among these approaches, passive control, such as tuned-mass dampers (TMDs) [3,4,5,6] and energy dissipation devices [7,8], is the most widely utilized structural control technology owing to its high dependability and effectiveness in real-world applications. Practical applications in civil engineering are demonstrated by examples such as the Sydney Chifley Tower and Shanghai Center Tower [9,10].
Generally, the natural frequencies and models of civil engineering structures play a dominant role in vibration control. The frequency of the conventional tuned-mass damper (TMD) is designed based on the frequency of the main structure, greatly reducing the mitigating effect of the dampers once there is an inconsistency with the frequency of the main structure. Therefore, the detuning of the main frequency is a major disadvantage of the conventional tuned-mass damper (TMD). To address this shortcoming, numerous negative stiffness dampers (NSDs) have been proposed to upgrade the efficacy of structural control systems. Pasala et al. [11] proposed a combined NSD–structure system consisting of an adaptive negative stiffness system (ANSS), a viscous damper, and a combination of NSDs. This novel damper can significantly mitigate the acceleration, displacement, and base shear of the main structure. A further experimental and numerical simulation study demonstrated the effectiveness and superior performance in reducing the vibration responses of the main structure under earthquake excitations [12]. Li et al. [13] and Sun et al. [14] proposed an innovative negative stiffness apparatus and damper system, respectively, to reduce the seismic responses of highway bridges. The experimental results demonstrated the effectiveness of the analytical model of the NSD in retaining the displacements of the base and bridge. Sun et al. [15,16,17] invented a new passive negative-stiffness-amplifying damper (NSAD) for preserving the significant damping magnification effect and property of the negative stiffness, which can greatly reduce the responses of the structure when exposed to earthquakes. Zhou and Li [18] and Chen et al. [19] introduced negative stiffness devices (NSDs) using a self-contained highly compressed spring to mitigate stay-cable vibrations, as investigated by numerical simulation and experimental tests. Shi and Zhu [20,21] and Shi et al. [20,21,22] investigated the significant vibration-damping performances of two innovative devices of magnetic negative stiffness dampers (MNSDs) compared with different active control approaches, as successfully verified by laboratory experiments. Furthermore, numerous other innovative negative stiffness dampers [23,24,25,26,27,28] have been explored for the vibration damping of structures, showing a significant control effect.
Meanwhile, the bistable structure can provide both negative stiffness and cubic stiffness properties, presenting an excellent vibration-damping effect when installed in dampers. The bistable damper installed on the main structure has two stable equilibrium positions, which can maintain a stable motion state without the continuous input of the external energy and can achieve rapid conversion between steady-state configurations under the driving force of the main structure’s conduction. These special structural characteristics make the bistable structure extensively utilized in vibration attenuation and vibration isolation. As for the research on vibration reduction, experiments and analytical models have been carried out to investigate the dynamic response control under harmonic and earthquake excitations, and the results indicated that the vibration-reducing effects of a bistable attachment [29] and a bistable tuned-mass damper (BTMD) [30] were effective for a bistable oscillator and a bridge deck, respectively. In addition, bistable vibration isolation (BVI) [31,32] and quasi-zero stiffness (QZS) [33] isolation devices have been developed, and experiments have shown that these devices can significantly improve the vibration isolation effect through the snap-through effect of the bistable structures.
The NSBD has been proposed in our previous study [34] to reduce the structural dynamic responses, inspired by the properties of the negative stiffness and bistable structure, which benefit the passive control. Based on previous experimental research, this paper further studies and proposes a detailed optimization design method to achieve the excellent vibration control of high-rise structures. The design parameters of the NSBD, such as negative stiffness, cubic stiffness, and damping coefficients, can have a significant impact on the vibration control performance. Therefore, to maximize its vibration suppression capability when used to mitigate structural vibrations, it is important to set the optimal design parameters for the NSBD. Since the negative stiffness element installed in numerous dampers to attenuate vibration responses has been proposed by several researchers, various design approaches have been developed to reduce vibrations caused by various types of excitation sources by installing vibration-suppressing devices on various primary structures. Li and Sun [35] invented an optimization objective function for the rail-type negative stiffness control system according to the characteristics of the negative stiffness control system. Dai and Zhao [36] optimized the equal-peak design of a dynamic vibration absorber with negative stiffness and analyzed the effects of the structural parameters on the effective damping frequency’s bandwidth, achieving a reduction percentage of over 40% within the effective damping frequency’s band range. Li et al. [37] and Ullslam et al. [38] proposed an innovative dynamic vibration absorber (DVA) and a vibration isolator using negative stiffness and focused on examining the optimal frequency ratio and negative stiffness ratio using the fixed-point theory. Zhang et al. [33] invented a tuned-mass damper with a negative stiffness device (TMD_NSD) and verified its excellent vibration-suppressing effect by experimental tests. Charef et al. [39] studied a non-traditional tuned-mass damper (NTTMD) employing negative stiffness to dampen a primary system, achieving better optimal tuning parameters. Moreover, many other novel and valuable algorithms and methodologies [40,41,42,43,44] can lead to more accurate and automated mechanical systems shortly.
However, the NSBD’s inherent nonlinearity makes it impossible to directly compute its transfer function using analytical methods. Although the numerical simulation method is sufficient to compute dynamic responses of the nonlinear system, it is still challenging to optimize the parameters of the NSBD owing to the massive numerical analysis. The optimal design for an NSBD installed on a damped structure cannot be determined through analytical solutions. To address this issue, this paper recommends a strategy using the ELM and GA to optimize the design parameters of the NSBD initially. First, utilizing the ELM and PEM, the NSBD is transformed to a linear system. Second, the optimal design parameters of the NSBD are calculated using the optimal design method to decrease the peak displacement response of the primary structure. The GA is utilized to achieve an optimal solution during the optimization procedure. Furthermore, to evaluate the efficacy of the suggested approach, the NSBD-installed tall building’s dynamic responses under different seismic excitations are numerically computed using the optimal parameters.
2. Control Equations of a Single-Degree-of-Freedom (SDOF) Structure Equipped with an NSBD
2.1. Mechanism Characterization of the NSBD
A linear SDOF structure equipped with an NSBD was introduced in our previous study [34]. For the dynamic analysis of beam-like structures, the Galerkin-assumed modal approach [45,46,47,48] has been applied in practical applications [48,49,50] and has led to remarkable results. On this basis, this paper further simplifies the beam-like structure to a cosine beam structure for the mechanical performance analysis. According to a study by Qiu et al. [51], based on the assumption of a small deformation, the bending deformation of the buckling beam is considered, while because the shear deformation has a relatively small impact on the buckling beam’s direction of motion, the shear deformation is ignored. Then, the mechanical constitutive equation for the displacement of the buckling beam (as illustrated in Figure 1) under the external force is as follows:
where , , and are dimensionless normalization parameters. The geometric parameters of the buckling beam include the span () and the thickness (); , which is the intermediate deformation of the buckling beam under external force F; and the arching height ().
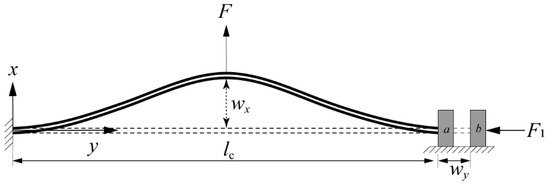
Figure 1.
The buckled beam with pre-stress.
As derived in our previous study [34], the mechanical constitutive equation for the bistable buckling beam is
As shown in Equation (3), the mechanical constitutive law of the buckling beam consisted of the negative stiffness term and the cubic stiffness term.
where the negative stiffness coefficient is , and the cubic stiffness coefficient is .
2.2. Kinematic Equations for an NSBD-Equipped Structure
For brevity, a simplified single-degree-of-freedom (SDOF) structure equipped with an NSBD is illustrated in Figure 2. Parameters , , and represent the mass, damping, and stiffness of the host structure, respectively. Earthquakes are assessed based on the base acceleration (). Furthermore, is the NSBD’s mass; is the damping of the NSBD; and represent the negative stiffness and the cubic stiffness of the NSBD, respectively; and and represent the relative displacements of the structure and the NSBD with respect to the ground, respectively.
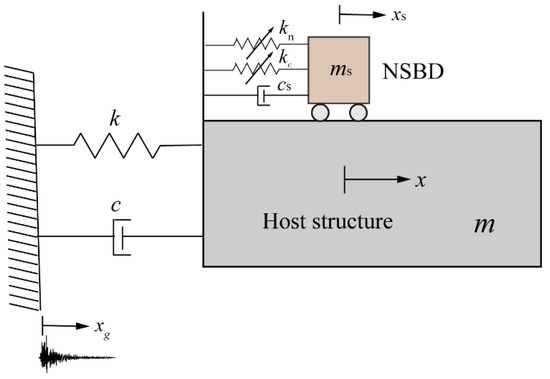
Figure 2.
Schematic of the SDOF system with an NSBD.
In structural analysis, the governing differential equations of an SDOF system equipped with an NSBD subjected to base excitation can be directly derived from Newton’s second law and expressed as
Equations (4) can be expressed in matrix form as follows:
where represents the negative stiffness coefficient, and represents the cubic stiffness coefficient.
3. Equivalent Llinearization of the NSBD
3.1. Equivalent Linearization Method (ELM)
The NSBD is a nonlinear system, as outlined in Section 2. The fundamental-frequency-based TMD parameters’ design may not be sufficient for NSBDs. To overcome this limitation, in this section, the optimization parameters of the nonlinear NSBD are determined using the ELM to linearize them to a linear system.
In the realm of nonlinear random-vibration-engineering analysis, the ELM has advanced significantly, offering an effective, straightforward approach. This method represents an approximate solution for predicting a nonlinear system’s stochastic responses, holding considerable practical application potential. The core principles of the ELM are to substitute a nonlinear NSBD system with a linear one having an exact solution and to minimize their differences statistically. The control equation of the NSBD–structure system is as follows:
where represents the nonlinear part, and denotes the position vector of the seismic excitation. Assuming that a stationary response for the system given by Equation (7) is achievable, the NSBD–structure system is approximately replaced with an equivalent linear system, as per the ELM, as expressed in Equation (8).
where represents the equivalent stiffness matrix.
To render the system given by Equation (7) as being equivalent to the linear system described in Equation (8), one must strive to minimize the mean square value of the difference () between these equations.
The necessary condition for this equivalence is
where , and E represents the expectation of the variable. Equation (11) can be obtained by solving Equation (10).
The pseudo-excitation method (PEM) was employed to iteratively compute in Equation (11). The PEM, as proposed by Lin et al. [52,53,54], is gaining acceptance as an advanced and reasonable analysis tool that adequately accounts for the statistical probability characteristics of earthquake occurrences. Owing to the PEM’s speed and efficient use of storage space, the structure’s responses, such as displacement and acceleration, can be efficiently computed on ordinary microcomputers. This advanced structural modeling approach ensures greater accuracy in engineering structural analyses.
In the case of the NSBD–structure system, a pseudo-harmonic excitation can be expressed by Equation (12).
where denotes the spectral density function. As given by Equation (13), the Kanai–Tajimi [55] model was employed in this paper.
where denotes the power spectral density of the bedrock’s acceleration, while and represent the damping ratio and rotational angular frequency, respectively, of the site’s soil. The parameters of the Kanai–Tajimi spectrum are detailed in Table 1.

Table 1.
Parameters of the Kanai–Tajimi spectrum.
Therefore, Equation (8) is expressed as follows:
As is known,
By iteratively computing Equations (7), (8), (10), (11), (14) and (15), one can derive the equivalent linearization parameters of an NSBD. The calculation details are as follows:
Step 1: Given that the equivalent mass and damping matrices are zero, computing only the equivalent stiffness matrix is required using Equations (7), (8) and (10);
Step 2: Determine the appropriate input power spectrum according to the properties of the external excitation;
Step 3: Initially set the values of the equivalent linearization parameters before employing Equation (14) to compute the pseudo-responses. Subsequently, obtain the variance and covariance by solving Equation (15), leading to the replacement of the equivalent parameter matrices with new ones using Equation (11);
Step 4: Continue with step 3 until the parameters meet the specified criteria (The relative error value of the adjacent variances for each variable is greater than 10 × 106);
Step 5: By solving Equation (11), the equivalent parameter matrices can be determined for the original nonlinear system.
3.2. Monte Carlo Method
The Monte Carlo random simulation method [56,57,58], grounded in the central limit theorem of probability theory, is a widely recognized random method. Theoretically, its accuracy is enhanced with an increment in the number of samples. Applicable to diverse problems, the Monte Carlo method facilitates modeling and solving both mathematical models and complex systems in practical contexts. Particularly for complex problems, the Monte Carlo method often yields relatively accurate estimates. This method is an effective tool widely used in mathematical modeling and practical problem-solving and is noted for its flexibility, accuracy, and interpretability.
For analyzing the dynamic responses of structures with random parameters using the Monte Carlo method, the basic steps include the following:
Step 1: Generate N samples of random parameters reflecting the statistical characteristics prescribed. The stochastic excitation sample can be simulated using Equation (16).
where , , and for . N represents the number of samples for random parameters; and specify the limits within the frequency range; denotes a random number in [0, 2π];
Step 2: Insert sampled values of structural parameters into the structure’s vibration equation;
Step 3: Employ numerical methods to solve the structure’s kinematic equation and determine its dynamic responses;
Step 4: Repeat from steps (1) to (3) to generate N samples of structural dynamic responses and subsequently calculate their statistical characteristics.
3.3. Numerical Analysis
To ascertain whether the equivalent linearization of the NSBD–structure coupled system corresponds to the dynamic responses of the original nonlinear system, the dynamic responses are compared between the two systems computed using the Monte Carlo method. As per Equation (16), 1000 seismic excitations were randomly generated, each lasting 200 s. The parameters for the stochastic excitation sample include N = 10,000, Hz, and Hz. The peak acceleration of the stochastic excitation is set at 1 m/s2.
Figure 3 depicts the root mean squares (RMSs) of the primary structural displacements, where represents the RMSs of the structural displacements for 1000 stochastic excitations. From Figure 3, it is evident that the RMSs of the dynamic responses of the structure align closely for both calculation methods. The maximum relative error () between the two systems amounts to 0.7%. The peak structural displacements are presented in Figure 4, where denotes the peak structural displacement at each time. The maximum relative error () between the two systems is as low as 1.7%. Figure 5 displays the variances in the displacements, where represents the variance in the structure’s displacement. The results of the dynamic responses calculated using the equivalent linearization model show remarkable agreement with those of the original nonlinear system, with the maximum relative errors of between the two systems being just 1.15%. In Figure 3, Figure 4 and Figure 5, the statistical calculation results of the equivalent linearization model demonstrate high accuracy.
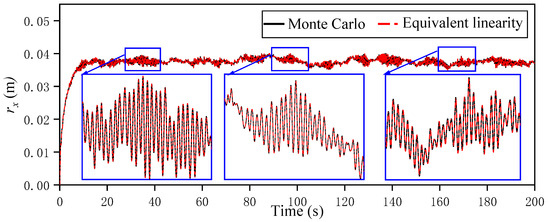
Figure 3.
Root mean squares of the structural displacements versus time.
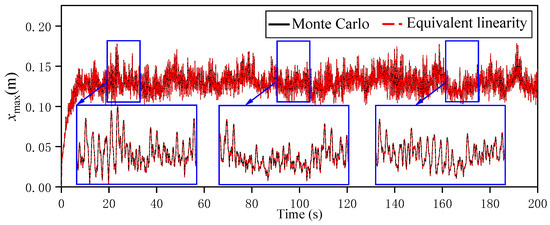
Figure 4.
Peak structural displacements versus time.
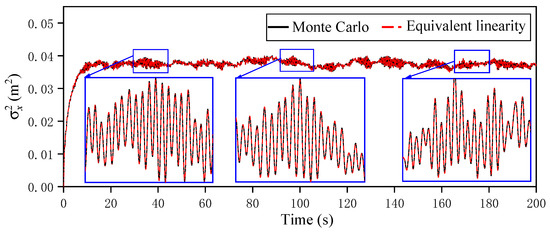
Figure 5.
Variances in the structural displacements versus time.
For further verification of the accuracy of the equivalent linearization of nonlinear systems, comparisons were made between the dynamic responses of the two systems subjected to 16 seismic excitations across four site categories. In accordance with the standards in [59], 16 seismic records were selected, with their peak ground acceleration (PGA) uniformly established at 1 m/s2, as detailed in Table 2.

Table 2.
Earthquake records.
Figure 6 displays the seismic responses of the structure equipped with an NSBD for various earthquakes. Table 3 details the peak structural displacements with an NSBD for 16 varied earthquakes. In all the calculations, a mass ratio of 0.02 is assumed for the NSBD. As demonstrated in these figures, there is a close match between the two systems. Table 3 indicates that the relative error in the seismic responses for various earthquakes remains below 4.5%. The simulation results suggest that the equivalent linearization system equipped with an NSBD exhibits high accuracy. Consequently, the consistency of the calculation results confirms the accuracy of the equivalent linearization system.
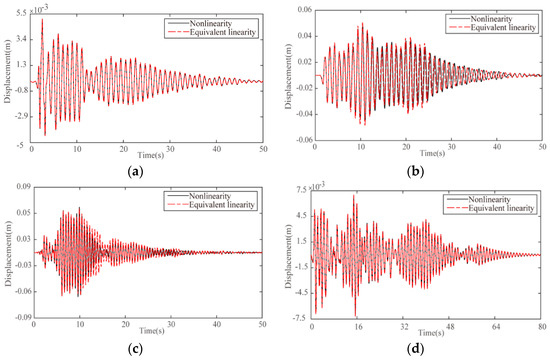
Figure 6.
Seismic responses of the structure for (a) Helena-1 earthquake, (b) Borrego Mtn. earthquake, (c) Hollister-2 earthquake, and (d) San Fernando earthquake.

Table 3.
Seismic responses of the primary structure with an NSBD for various earthquakes.
To explore the influence of the excitation amplitude on the equivalent linearization accuracy of the negative stiffness bistable damper (NSBD), the equivalent linearization results of the structure equipped with a damper for different PGA values are calculated. As shown in Figure 7, with the increase in the PGA value, the structural displacement responses of the equivalent linearization system and the original nonlinear system are less consistent, which shows that the excitation amplitude becomes an important limiting factor for the negative stiffness bistable structure.
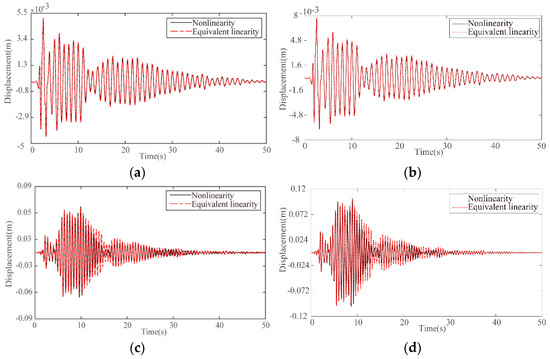
Figure 7.
Seismic responses of the structures for (a) Helena-1 earthquake, PGA = 0.1 g; (b) Helena-1 earthquake, PGA = 0.15 g; (c) Hollister-2 earthquake, PGA = 0.1 g; (d) Hollister-2 earthquake, PGA = 0.15 g.
4. Optimal Design of the NSBD
The design parameters of the NSBD, such as negative stiffness, cubic stiffness, and damping, have substantial impacts on its vibration suppression. Thus, for the effective enhancement of the NSBD’s damping effect, the optimization of the design parameters is necessary. In this study, the ELM and GA are employed to optimally design a damped tall building equipped with an NSBD, using the H∞ norm as the objective function.
4.1. Control Equations of a Tall Building Installed with an NSBD
As depicted in Figure 8, a mathematical model of a tall building controlled by an NSBD is chosen for the vibration control analysis example. The tall building has a total height of 162.15 m and a 49-story framed shear-wall structure. To simplify the numerical analysis, this building is simplified as a benchmark model [60] for the calculations. These 49 degrees of freedom represent the lateral displacement of each layer, and the structural damping is taken as 0.05. The first three natural frequencies of the tall building are 0.32 Hz, 0.84 Hz, and 1.33 Hz. In Figure 8b, , , and are the ith floor’s mass, stiffness, and damping of the tall building, respectively. As shown in Figure 8b, an NSBD is mounted on the top floor of the primary structure.
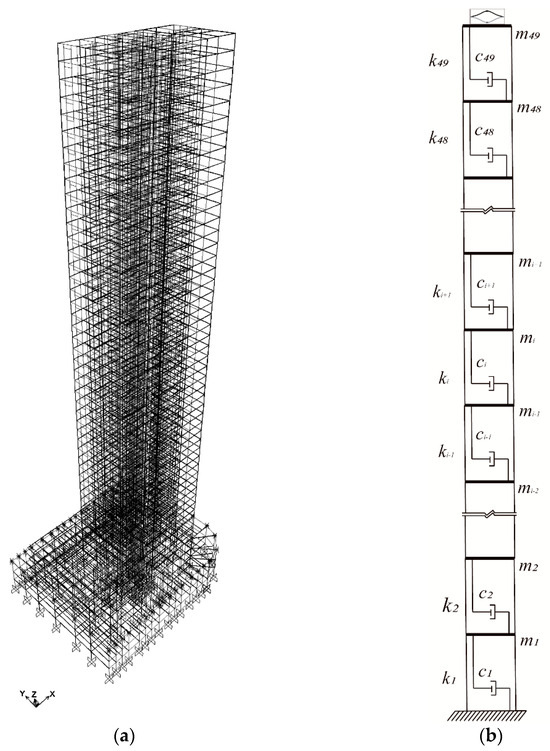
Figure 8.
Analysis models of the tall building: (a) structural model; (b) simplified calculation model.
The control equations of the primary structure with an NSBD are presented in Equation (17), following the derivation outlined in Section 3.1.
where , , and represent the mass, damping, and stiffness matrices of the primary structure, respectively. Additionally, , , and denote the acceleration, velocity, and displacement vectors of the primary structure, respectively, and symbolizes the location vector of the seismic excitation.
4.2. Equivalent Linearization of NSBD–Structure System
Optimizing the NSBD–structure system with the H∞ norm precludes the direct acquisition of the coupled structure’s transfer function owing to the damper’s unique nonlinearity. Consequently, the initial linearization of the coupled structure via the ELM is essential. The kinematic equations for the NSBD–structure system’s equivalent linearization, formulated using the ELM, are presented in Equation (19).
where
where represents the cubic stiffness coefficient.
By building Simulink models in MATLAB(R2020a), the dynamic equations of the main structures with and without the NSBD are analyzed and solved, and the top displacement responses of the main structure under the two working conditions are calculated separately. Figure 9 depicts the top displacement responses of the primary structures, while Figure 10 presents the structures’ displacement envelope diagrams. The PGA of the earthquake is adjusted to 1.5 m/s2, and the NSBD’s mass ratio is maintained at 0.02.
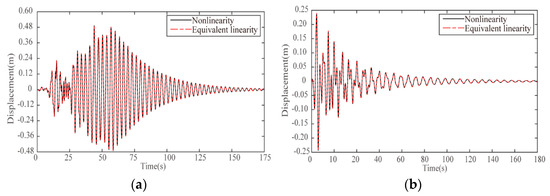
Figure 9.
Seismic responses over time: (a) Kern County3; (b) San Fernando2.
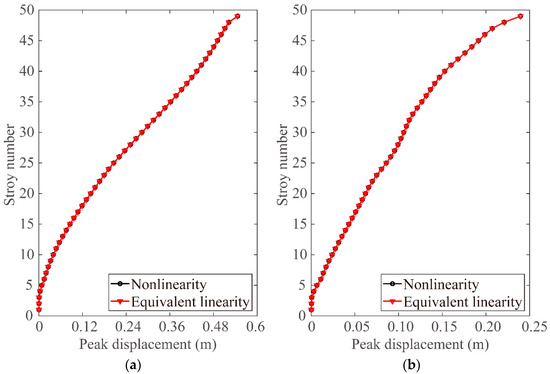
Figure 10.
Displacement envelope diagrams of the primary structures for (a) Kern County3 and (b) San Fernando2 earthquakes.
4.3. H∞ Norm of the NSBD–Tall Building System
Minimizing the peak response of the structure is important in the vibration control of tall buildings. The H∞ norm [61,62], a prevalent indicator, is extensively used in optimizing damper designs. A key advantage for applying the H∞ norm to linear systems is the achievement of the desired results independently of specific excitations. Herein, the H∞ norm is defined as the peak value of the maximum singular value within the frequency domain of the structure. Consequently, a lower H∞ norm suggests the reduced vibration response and output energy of the structure. Thus, the H∞ norm can serve as the main objective function for optimizing parameters that influence the structure’s vibration reduction.
The governing equations of the NSBD–tall building system can be replaced by Equation (21).
where , , and .
The state space of Equation (21) is expressed as
where represents the state vector of the system, is the output vector of the system, and
The transfer function of Equation (22) is
The mathematical expression of the H∞ norm is shown as Equation (25) [63].
where y represents the system’s output, w represents the seismic input, and and are defined as their L2 norms, symbolizing the system’s output energy and the earthquake’s energy, respectively. From this derivation, it becomes evident that the NSBD–structure system’s output energy diminishes as H∞ norm decreases; thus, achieving the minimum value of H∞ ensures the optimal damping effect of the NSBD. Furthermore, considering the specific spectral characteristics of the seismic excitation, this study employs the Kanai–Tajimi response spectrum to measure the input seismic excitation.
4.4. General Optimization Procedure
The genetic algorithm (GA) [64,65,66], mimicking natural selection and genetic mechanisms of evolution, serves as a method for finding optimal solutions by simulating these evolutionary processes. This technique operates directly on structural objects, unconstrained by differentiation or functional continuity; it exhibits inherent parallelism and superior global optimization capabilities. Utilizing probabilistic optimization methods, this approach allows for the automatic acquisition and guidance of the optimized search space, facilitating the adaptive adjustment of the search direction. The specific steps to optimize NSBD parameters via the GA include the following:
Step 1: Identify the variables and their optimization ranges; in this case, the key variables include negative stiffness, cubic stiffness, and damping;
Step 2: Choose the optimization model and functions;
Step 3: Establish the chromosome encoding and decoding methods;
Step 4: Set quantitative evaluation criteria for the fitness;
Step 5: Define the parameters of the GA; for this optimization, these include 200 iterations, a population size of 100, and crossover and mutation probabilities of 0.7 and 0.03, respectively;
Step 6: Compute the global optimal solution, which, in this case, involves determining the optimal parameters of the NSBD.
To prevent settling for a local optimal solution, it is crucial to establish the feasible range of optimization parameters based on linear dampers’ design principles prior to the computation.
4.5. Numerical Analysis
The primary goal of this optimization endeavor is to minimize the H∞ norm associated with the top floor’s displacement. The optimization parameters for the NSBD comprise negative stiffness, cubic stiffness, and damping.
- (1)
- The range of negative stiffness values for the NSBD is set between −9 × 10⁶ and −1 × 10⁶;
- (2)
- The cubic stiffness of the NSBD varies from 2 × 10¹⁰ to 3 × 10¹⁰;
- (3)
- The damping for the NSBD falls within the range from 0 to 1,716,100.
The convergence trajectory of the H∞ norm is depicted in Figure 11. Initially, the H∞ norm stands at 5.8, but after 100 generations, it converges to 2.4. The optimal parameters obtained through the optimization calculations are as follows: the negative stiffness value is −2.663 × 10⁶ N/s, the cubic stiffness is 6.5045 × 10¹⁰ N/m3, and the damping is 211,485.3 N∙s/m.
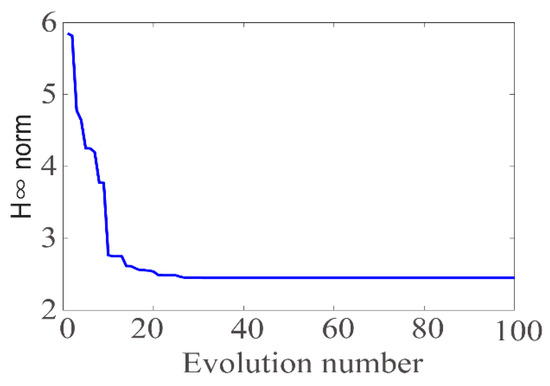
Figure 11.
Convergence history of the H∞ norm.
For assessing the accuracy of the optimized design, in this section, we calculate and compare the displacement responses of tall building structures with and without the NSBD, focusing on the top floor’s displacements. The top floor’s displacement histories for the primary structures with and without dampers are illustrated in Figure 12. It is noted from Figure 13 that the suppression of the peak displacement by the NSBD is apparent at the first-order frequency of the tall building. The peak displacement and vibration reduction ratios for the top floor for various seismic excitations are detailed in Table 4. In these calculations, the peak ground acceleration (PGA) is set at 1.5 m/s2, and the NSBD’s mass ratio remains at 0.02. Having determined all the NSBD’s parameters through the proposed optimization methods, it is evident that the top floor of the tall building equipped with the NSBD undergoes significant vibration mitigation for various seismic excitations. The NSBD exhibits its most effective damping for the Hollister-02 earthquake, achieving a displacement mitigation ratio of 52.99%. Furthermore, the vibration mitigation ratios of the NSBD exceed 22% for all the selected earthquakes. Figure 12 illustrates that when the PGA value in the simulation calculation is less than 0.15 g, the displacement response of the top floor of the structure does not exceed 1.0 m, and the same is also reflected in Table 4. The calculation results show that when the PGA value is less than 0.15 g, the negative stiffness bistable structure has a good damping effect.
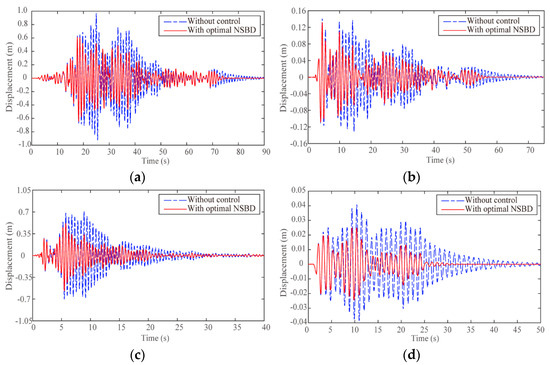
Figure 12.
Top floor’s displacements in the tall building for (a) Kern County4, (b) Kern County1, (c) Hollister-2, and (d) Borrego Mtn. earthquakes.
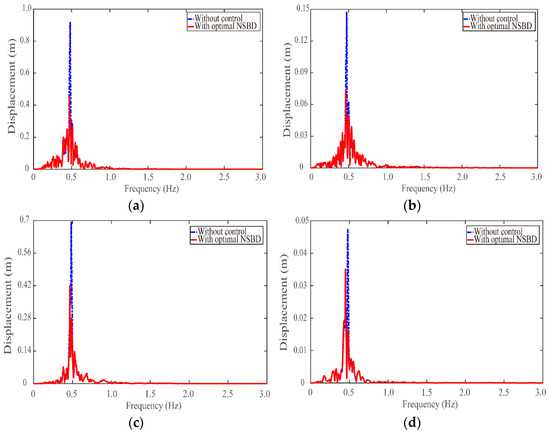
Figure 13.
Top floor’s displacements in the tall building in the frequency domain for (a) Kern County4, (b) Kern County1, (c) Hollister-02, and (d) Borrego Mtn. earthquakes.

Table 4.
Peak displacements of the primary structures for various seismic excitations.
The numerical simulation results suggest that the NSBD effectively controls the top floor’s displacement in tall building structures for diverse seismic excitations, demonstrating that the NSBD parameters, derived from the proposed optimization method, are highly effective in vibration reduction. The vibration mitigation ratio (w) is calculated using Equation (26).
where m0 and m1 denote the maximum displacements at the top of the structures with and without the NSBD, respectively.
5. Conclusions
This paper introduces a robust method employing the ELM and GA for optimizing NSBD parameters. The efficacy of this approach is evaluated by applying the optimized NSBD to a tall building and assessing the displacement of the tall building for various seismic excitations. The most important findings from the numerical simulations are summarized below:
- Utilizing the Monte Carlo simulation calculation method, the maximum root-mean-square error for applying the nonlinear NSBD and equivalent linear dampers to the structure is 0.7%, the maximum peak displacement error is 1.7%, and the maximum displacement variance error in the structure is 1.15%. The dynamic responses calculated using the equivalent linearization model show remarkable agreement with those of the original nonlinear system;
- According to the pseudo-excitation method (PEM), the simulation results suggest that the displacement response’s error in the structure will not exceed 4.5% when the building is equipped with the nonlinear NSBD and equivalent linear dampers for different earthquakes. The NSBD can be approximated by a linear system with the help of the ELM, which can be vital for the NSBD’s optimal design, as demonstrated by these simulation calculations;
- As a main objective function, the H∞ norm serves as a very precise method for optimizing parameters that influence the structure’s vibration reduction. The genetic algorithm (GA) is perfectly suitable for obtaining the design parameters of the NSBD within an appropriate range. After 100 generations, the H∞ norm converges to 2.4, indicating that the genetic algorithm can simulate and calculate optimization parameters very accurately and quickly;
- The displacement responses of the tall buildings with and without an NSBD are simulated utilizing the optimized parameters solved through the GA. The best damping for the Hollister-02 earthquake can achieve a displacement mitigation ratio of 52.99%, and the vibration mitigation ratios of the NSBD exceed 22% for all the selected earthquakes. The simulation results suggest that the effective restraint of the structural vibration for different earthquakes can be achieved using the NSBD with the optimal parameters. The proposed method is effective in implementing the optimal design of the NSBD.
There are also some limitations that warrant further investigation and research. This paper focuses solely on optimizing the design analysis for nonlinear NSBDs through numerical simulation calculations. In our future work, detailed experiments will be conducted to verify the accuracy and rationality of the obtained optimized design parameters. Furthermore, the design of the NSBD for high-rise structural vibration reduction control adopts a distributed layout, achieving multi-modal vibration reduction control, which will also be studied in future work.
Author Contributions
Conceptualization, L.F.; methodology, L.F. and C.H.; software, L.F.; validation, L.F. and C.H.; formal analysis, L.F.; investigation, L.F.; resources, L.F.; data curation, L.F.; writing—original draft preparation, L.F.; writing—review and editing, L.F., L.H., and C.H.; visualization, L.F.; supervision, L.H.; project administration, L.H.; funding acquisition, L.H. All authors have read and agreed to the published version of the manuscript.
Funding
This research received no external funding.
Institutional Review Board Statement
Not applicable.
Informed Consent Statement
Not applicable.
Data Availability Statement
The data presented in this study are available in the article.
Conflicts of Interest
The authors declare no conflicts of interest.
References
- Yao, J. Concept of structural control. ASCE J. Struct. Div. 1972, 98, 1567–1574. [Google Scholar] [CrossRef]
- Soong, T.T.; Spencer, B.F. Active structural control: Theory and practice. J. Eng. Mech. 1992, 118, 1282–1285. [Google Scholar] [CrossRef]
- Hoang, N.; Fujino, Y.; Warnitchai, P. Optimal tuned mass damper for seismic applications and practical design formulas. Eng. Struct. 2008, 30, 707–715. [Google Scholar] [CrossRef]
- Hsiao, F.H.; Chen, C.W.; Liang, Y.W.; Xu, S.D. T-S fuzzy controllers for Nonlinear interconnected systems with multiple time delays. IEEE Trans. Circuits Syst. I Regul. Pap. 2005, 52, 1883–1893. [Google Scholar] [CrossRef]
- Rana, R.; Soong, T.T. Parametric study and simplified design of tuned mass dampers. Eng. Struct. 1998, 20, 193–204. [Google Scholar] [CrossRef]
- Sadek, F.; Mohraz, B.; Taylor, A.W.; Chung, R.M. A method of estimating the parameters of tuned mass dampers for seismic applications. Earthq. Eng. Struct. Dyn. 1997, 26, 617–635. [Google Scholar] [CrossRef]
- Soong, T.T.; Spencer, B.F. Supplemental energy dissipation: State-of-the-art and state-of-the practice. Eng. Struct. 2002, 24, 243–259. [Google Scholar] [CrossRef]
- Symans, M.D.; Charney, F.A.; Whittaker, A.S.; Constantinou, M.C. Energy dissipation systems for seismic applications: Current practice and recent developments. J. Struct. Eng. 2008, 134, 3–21. [Google Scholar] [CrossRef]
- Roffel, A.J.; Narasimhan, S.; Haskett, T. Performance of pendulum tuned mass dampers in reducing the responses of flexible structures. J. Struct. Eng. 2013, 139, 04013019. [Google Scholar] [CrossRef]
- Lu, X.; Chen, J. Mitigation of wind-induced response of Shanghai Center Tower by tuned mass damper. Struct. Des. Tall Spec. Build. 2011, 20, 435–452. [Google Scholar] [CrossRef]
- Pasala, D.T.R.; Sarlis, A.A.; Nagarajaiah, S.; Reinhorn, A.M. Adaptive negative stiffness: New structural modification approach for seismic protection. J. Struct. Eng. 2013, 139, 1112–1123. [Google Scholar] [CrossRef]
- Pasala, D.T.R.; Sarlis, A.A.; Reinhorn, A.M.; Nagarajaiah, S. Simulated bilinear-elastic behavior in a SDOF elastic structure using negative stiffness device: Experimental and analytical study. J. Struct. Eng. 2014, 140, 04013049. [Google Scholar] [CrossRef]
- Li, H.N.; Sun, T.; Lai, Z.L.; Nagarajaiah, S. Effectiveness of negative stiffness system in the benchmark structural-control problem for seismically excited highway bridges. J. Bridge Eng. 2018, 23, 04018001. [Google Scholar] [CrossRef]
- Sun, T.; Lai, Z.; Nagarajaiah, S.; Li, H.N. Negative stiffness device for seismic protection of smart base isolated benchmark building. Struct. Control Health Monit. 2017, 24, e1968. [Google Scholar] [CrossRef]
- Sun, F.F.; Wang, M.; Nagarajaiah, S. Multi-objective optimal design and seismic performance of negative stiffness damped outrigger structures considering damping cost. Eng. Struct. 2021, 229, 111615. [Google Scholar] [CrossRef]
- Wang, M.; Sun, F.F.; Nagarajaiah, S. Simplified optimal design of MDOF structures with negative stiffness amplifying dampers based on effective damping. Struct. Des. Tall Spec. Build. 2019, 28, e1664. [Google Scholar] [CrossRef]
- Wang, M.; Sun, F.F.; Yang, J.Q.; Nagarajaiah, S. Seismic protection of SDOF systems with a negative stiffness amplifying damper. Eng. Struct. 2019, 190, 128–141. [Google Scholar] [CrossRef]
- Zhou, P.; Li, H. Modeling and control performance of a negative stiffness damper for suppressing stay cable vibrations. Struct. Control Health Monit. 2016, 23, 764–782. [Google Scholar] [CrossRef]
- Chen, L.; Sun, L.; Nagarajaiah, S. Cable with discrete negative stiffness device and viscous damper: Passive realization and general characteristics. Smart Struct. Syst. 2015, 15, 627–643. [Google Scholar] [CrossRef]
- Shi, X.; Zhu, S. Magnetic negative stiffness dampers. Smart Mater. Struct. 2015, 24, 072002. [Google Scholar] [CrossRef]
- Shi, X.; Zhu, S. Simulation and optimization of magnetic negative stiffness dampers. Sens. Actuators A 2017, 259, 14–33. [Google Scholar] [CrossRef]
- Shi, X.; Zhu, S.; Spencer, B.F., Jr. Experimental study on passive negative stiffness damper for cable vibration mitigation. J. Eng. Mech. 2017, 143, 04017070. [Google Scholar] [CrossRef]
- Shu, Z.; Zhang, J.; Nagarajaiah, S. Dimensional analysis of inelastic structures with negative stiffness and supplemental damping devices. J. Struct. Eng. 2017, 143, 04016184. [Google Scholar] [CrossRef]
- Hong, N.; Zhao, Z.; Du, Y.; Chen, Q. Energy spectra and performance assessment of isolated structures with a negative stiffness amplification system. Soil Dyn. Earthq. Eng. 2023, 169, 107857. [Google Scholar] [CrossRef]
- Kiran, K.K.; Al-Osta, M.A.; Ahmad, S. Optimum design and performance of a base-isolated structure with tuned mass negative stiffness inerter damper. Sci. Rep. 2023, 13, 4980. [Google Scholar] [CrossRef]
- Su, N.; Bian, J.; Peng, S.; Chen, Z. Analytical optimal design of inerter-based vibration absorbers with negative stiffness balancing static amplification and dynamic reduction effects. Mech. Syst. Signal Process. 2023, 192, 110235. [Google Scholar] [CrossRef]
- Tai, Y.J.; Wang, H.D.; Chen, Z.Q. Vibration isolation performance and optimization design of a tuned inerter negative stiffness damper. Int. J. Mech. Sci. 2023, 241, 107948. [Google Scholar] [CrossRef]
- Ul Islam, N.; Jangid, R.S. Closed form expressions for H2 optimal control of negative stiffness and inerter-based dampers for damped structures. Structures 2023, 50, 791–809. [Google Scholar] [CrossRef]
- Johnson, D.R.; Harne, R.L.; Wang, K.W. A disturbance cancellation perspective on vibration control using a bistable snap-through attachment. J. Vib. Acoust. 2014, 136, 4026673. [Google Scholar] [CrossRef]
- Farhangdoust, S.; Eghbali, P.; Younesian, D. Bistable tuned mass damper for suppressing the vortex induced vibrations in suspension bridges. Earthq. Struct. 2020, 18, 313–320. [Google Scholar]
- Yan, B.; Ma, H.; Zhang, L.; Zheng, W. A bistable vibration isolator with nonlinear electromagnetic shunt damping. Mech. Syst. Signal Process. 2020, 136, 106504. [Google Scholar] [CrossRef]
- Yan, B.; Ling, P.; Zhou, Y.; Wu, C. Shock isolation characteristics of a bistable vibration isolator with tunable magnetic controlled stiffness. J. Vib. Acoust. 2022, 144, 4051850. [Google Scholar] [CrossRef]
- Zhang, Y.; Ye, K.; Nyangi, P. Optimum design of a tuned-mass damper with negative stiffness device subjected to ground excitation. Struct. Control Health Monit. 2022, 29, e3086. [Google Scholar] [CrossRef]
- Fan, L.; Huang, C.; Huo, L. Development of a negative stiffness bistable damper for structural vibration control. Shock Vib. 2022, 2022, 6397602. [Google Scholar] [CrossRef]
- Li, H.; Sun, T. Optimal design for rail-type negative stiffness control system. Earthq. Eng. Eng. Vib. 2018, 38, 21–27. [Google Scholar]
- Dai, H.; Zhao, Y. Equal-peak optimization of dynamic vibration absorber with negative stiffness and delay feedback control. J. Theor. Appl. Mech. 2021, 53, 1720–1732. [Google Scholar]
- Li, J.; Gu, X.; Zhu, S.; Yu, C. Parameter optimization for a novel inerter-based dynamic vibration absorber with negative stiffness. J. Nonlinear Math. Phys. 2022, 29, 280–295. [Google Scholar] [CrossRef]
- Ul Islam, N.; Jangid, R.S. Optimum parameters and performance of negative stiffness and inerter based dampers for base-isolated structures. Bull. Earthq. Eng. 2023, 21, 1411–1438. [Google Scholar] [CrossRef]
- Charef, O.A.; Khalfallah, S. A variant design of tuned mass damper with negative stiffness for vibration control of a damped primary system. Struct. Control Health Monit. 2022, 29, e3068. [Google Scholar]
- Liao, B.L.; Han, L.Y.; Cao, X.W.; Li, S. Double integral-enhanced zeroing neural network with linear noise rejection for time-varying matrix inverse. CAAI Trans. Intell. Technol. 2023, 9, 197–210. [Google Scholar] [CrossRef]
- Alattar, B.; Ghommem, M.; Puzyrev, V. Deep learning for nonlinear characterization of electrostatic vibrating beam MEMS. Int. J. Bifurc. Chaos 2023, 33, 2330038. [Google Scholar] [CrossRef]
- Luo, X.D.; Wen, X.H.; Li, Y.; Li, Q.F. Pruning method for dendritic neuron model based on dendrite layer significance constraints. CAAI Trans. Intell. Technol. 2023, 8, 308–318. [Google Scholar] [CrossRef]
- He, Y.L.; Li, X.; Zhang, M.J.; Fournier-Viger, P. A novel observation points-based positive-unlabeled learning algorithm. CAAI Trans. Intell. Technol. 2023, 8, 1425–1443. [Google Scholar] [CrossRef]
- Waziri, M.Y.; Yusuf, A.; Abubakar, A.B. Improved conjugate gradient method for nonlinear system of equations. Comput. Appl. Math. 2020, 39, 321. [Google Scholar] [CrossRef]
- Xu, B.; Kiani, K. Nonlinear nonlocal-surface energy-based vibrations of a bidirectionally excited nanobeam at its supports. Phys. Scr. 2021, 96, 025004. [Google Scholar] [CrossRef]
- Kiani, K. Nanoparticle delivery via stocky single-walled carbon nanotubes: A nonlinear-nonlocal continuum-based scrutiny. Compos. Struct. 2014, 116, 254–272. [Google Scholar] [CrossRef]
- Kiani, K. Nonlinear vibrations of a single-walled carbon nanotube for delivering of nanoparticles. Nonlinear Dyn. 2014, 76, 1885–1903. [Google Scholar] [CrossRef]
- Kiani, K.; Nikkhoo, A. On the limitations of linear beams for the problems of moving mass-beam interaction using a meshfree method. Acta Mech. Sin. 2012, 28, 164–179. [Google Scholar] [CrossRef]
- Haghpanahi, M.; Nikkhoo, M.; Peirovi, H.; Ghanavi, J.E. Mathematical Modeling of the Intervertebral Disc as an Infrastructure for Studying the Mechanobiology of the Tissue Engineering Procedure. WSEAS Trans. Appl. Theor. Mech. 2007, 2, 261–273. [Google Scholar]
- Nikkhoo, A.; Sharifinejad, M. The impact of a crack existence on the inertial effects of moving forces in thin beams. Mech. Res. Commun. 2020, 107, 103562. [Google Scholar] [CrossRef]
- Qiu, J.; Lang, J.H.; Slocum, A.H. A curved-beam bistable mechanism. J. Microelectromechanical Syst. 2004, 13, 137–146. [Google Scholar] [CrossRef]
- Lin, J.; Song, G.; Sun, Y.; Williams, F.W. Non-stationary random seismic responses of non-uniform beams. Soil Dyn. Earthq. Eng. 1995, 14, 301–306. [Google Scholar] [CrossRef]
- Lin, J.H.; Guo, X.L.; Zhi, H.; Howson, W.P. Computer simulation of structural random loading identification. Comput. Struct. 2001, 79, 375–387. [Google Scholar] [CrossRef]
- Lin, J.H.; Sun, D.K.; Zhong, W.X.; Zhang, W.S. High efficiency computation of the variances of structural evolutionary random responses. Shock Vib. 2000, 98, 31–35. [Google Scholar] [CrossRef][Green Version]
- Kanai, K. An empirical formula for the spectrum of strong earthquake motions. Bull. Earthq. Res. Inst. 1961, 39, 85–95. [Google Scholar]
- Proppe, C.; Pradlwarter, H.J.; Schuller, G.I. Equivalent linearization and Monte Carlo simulation in stochastic dynamics. Probabilistic Eng. Mech. 2003, 18, 1–15. [Google Scholar] [CrossRef]
- Hammersley, J.M. Simulation and the Monte Carlo Method. Bull. Lond. Math. Soc. 2005, 14, 278–553. [Google Scholar] [CrossRef]
- Takahashi, Y.; Kiureghian, A.D.; Ang, A.H.S. Life-cycle cost analysis based on a renewal model of earthquake occurrences. Earthq. Eng. Struct. Dyn. 2010, 33, 859–880. [Google Scholar] [CrossRef]
- GB50011-2010; Code for Seismic Design of Buildings. China Architecture and Building Press: Beijing, China, 2016.
- Yang, J.N.; Agrawal, A.K.; Samali, B.; Wu, J.C. Benchmark problem for response control of wind-excited tall buildings. J. Eng. Mech. 2004, 130, 437–446. [Google Scholar] [CrossRef]
- Ao, W.K.; Reynolds, P. Analysis and numerical evaluation of H∞ and H2 optimal design schemes for an electromagnetic shunt damper. J. Vib. Acoust. 2019, 142, 021003. [Google Scholar] [CrossRef]
- Raze, G.; Kerschen, G. H∞ optimization of multiple tuned mass dampers for multimodal vibration control. Comput. Struct. 2021, 248, 106485. [Google Scholar] [CrossRef]
- Meinsma, G.; Mirkin, L. H∞ control of systems with multiple I/O delays via decomposition to Adobe problems. IEEE Trans. Autom. Control 2005, 50, 199–211. [Google Scholar] [CrossRef]
- Bozorgvar, M.; Zahrai, S.M. Semi-active seismic control of buildings using MR damper and adaptive neural-fuzzy intelligent controller optimized with genetic algorithm. J. Vib. Control 2019, 25, 273–285. [Google Scholar] [CrossRef]
- Colherinhas, G.B.; de Morais, M.V.G.; Shzu, M.A.M.; Avila, S. Optimal pendulum tuned mass damper design applied to high towers using genetic algorithms: Two-DOF modeling. Int. J. Struct. Stab. Dyn. 2019, 19, 1950125. [Google Scholar] [CrossRef]
- Li, Z.; Shu, G. Optimal placement of metallic dampers for seismic upgrading of multistory buildings based on a cost-effectiveness criterion using genetic algorithm. Struct. Des. Tall Spec. Build. 2019, 28, e1595. [Google Scholar] [CrossRef]
Disclaimer/Publisher’s Note: The statements, opinions and data contained in all publications are solely those of the individual author(s) and contributor(s) and not of MDPI and/or the editor(s). MDPI and/or the editor(s) disclaim responsibility for any injury to people or property resulting from any ideas, methods, instructions or products referred to in the content. |
© 2024 by the authors. Licensee MDPI, Basel, Switzerland. This article is an open access article distributed under the terms and conditions of the Creative Commons Attribution (CC BY) license (https://creativecommons.org/licenses/by/4.0/).